f(|Vv-£fcj UNIVERSITE DE REIMS CHAMPAGNE-ARDENNE Synthèse des activités de recherches de Nicolas Marmier, présentée le 27 Janvier 2000 àl4H, à la faculté des Sciences de Reims, salle 1720, en vue d'obtenir : L'HABILITATION A DIRIGER LES RECHERCHES. Les travaux portent sur la MODELISATION DE LA SORPTION D'IONS SUR DES MATERIAUX SOLIDES COMPLEXES, et le jury est composé de : -M. le Professeur Alain BOURG (Université de Pau), Rapporteur. -M. le Directeur Jean-Jacques EHRHARDT (Directeur de Recherches CNRS, Directeur du LCPE à Nancy), Rapporteur. -M. le Docteur Massoud FATTAHI (SUBATECH, Ecole des Mines de Nantes), Examinateur. -Mlle le Professeur Francine FROMAGE (Université de Reims), Directeur des recherches. -M. le Professeur Eric SIMONI (Université d'Orsay), Rapporteur. -M. le Professeur Pierre TOULHOAT (Université d'Evry, Directeur de l'UMR 'Analyse et Environnement', Chef du projet 'Comportement à long terme des colis' au CEA), Président du jury.

Welcome message from author
This document is posted to help you gain knowledge. Please leave a comment to let me know what you think about it! Share it to your friends and learn new things together.
Transcript
f(|Vv-£fcj
UNIVERSITE DE REIMS CHAMPAGNE-ARDENNE
Synthèse des activités de recherches de Nicolas Marmier,
présentée le 27 Janvier 2000 àl4H, à la faculté des Sciences de Reims, salle 1720,
en vue d'obtenir :
L'HABILITATION A DIRIGER LES RECHERCHES.
Les travaux portent sur la
MODELISATION DE LA SORPTION D'IONS SUR
DES MATERIAUX SOLIDES COMPLEXES,
et le jury est composé de :
-M. le Professeur Alain BOURG (Université de Pau), Rapporteur.
-M. le Directeur Jean-Jacques EHRHARDT (Directeur de Recherches CNRS,
Directeur du LCPE à Nancy), Rapporteur.
-M. le Docteur Massoud FATTAHI (SUBATECH, Ecole des Mines de Nantes),
Examinateur.
-Mlle le Professeur Francine FROMAGE (Université de Reims), Directeur des
recherches.
-M. le Professeur Eric SIMONI (Université d'Orsay), Rapporteur.
-M. le Professeur Pierre TOULHOAT (Université d'Evry, Directeur de l'UMR
'Analyse et Environnement', Chef du projet 'Comportement à long terme des colis'
au CEA), Président du jury.
Av^aa^ t/-»^/&~S y^^ ik'b^h^
çltcJz &*
.fc UPfc-
(^
W^U^
q*T |V
^ o£> 7
(p^ce-l/v-
fcb* m^Utwn—
(Z^t^-' **-~ A hi^
qr~
(tr**. JjMlr- ^ 'o^W
c~*-
K vw Ca/zx
|^< h^>?
UL^w^^A"1*
jJUl^Wi. 4,1r S«£*wC "•
^
«a.
^ Mk^h-* h-f£*Ç
£tU+*i<> *>,*~ 1
^vj-vw'ysPv*-**'"» '<\»cS•(Jm *^=*^
j/C/vJ-YW-vU Q & ^(à"
ijL:i hP-J'y**O^' u * \*~«~t r^*"^
-5
££/>^ /J ^v^~j~ >-*•<-« ^ ^•> 0- ^Uvrt~>*\
>*^ >*~ /*»/ /'-?t>A-
<f"<h* JT3
MODELISATION DE LA SORPTION D'IONS SUR
DES MATERIAUX SOLIDES COMPLEXES
Synthèse des activités de recherche
Nicolas Marmier
Remerciements
Je tiens tout d'abord à remercier le Professeur Francine Fromage de non seulementm'avoir accueilli au sein de son équipe, mais également de m'avoir fait partager sapassion de la recherche, et de m'avoir donné tous les moyens de pouvoir l'exprimer.
Je remercie également Monsieur le Professeur Pierre Toulhoat de m'avoir ouvert lavoie de la recherche et de présider le jury, Messieurs les Professeurs Alain Bourg etEric Simoni, ainsi que Monsieur le Directeur Jean-Jacques Ehrhrardt, d'avoir bienvoulu accepter d'être les rapporteurs de ce travail, et Monsieur Massoud Fattahid'avoir bien voulu faire partie du jury.
Le travail présenté ici est le travail de toute une équipe, celle de chimie des surfacesdu GRECI, et je remercie pour leur travail et leurs compétences tous les thésards(Annie Delisée et Ingmar Pointeau), stagiaires et techniciens (en particulier NathalieChoiselle) qui y ont participé.
Merci également àJoël Chupeau (le révélateur) et àEric Giffaut (le fixateur).
Enfin, des remerciements spéciaux iront à Agnès, Danaé, Nathan, Tanguy, Gérard,Annie, Sébastien et Benoit qui se reconnaîtront.
Sommaire
INTRODUCTION ?
I- La modélisation 7
1-1-Préambule 7
I-2-Les modèles thermodynamiques 9
II- Les acquis fondamentaux 12
II-1 -Ladémarche scientifique 13
II-2-La méthodologie 14
II-3-La démonstration de l'additivité 15
II-4-Les points d'intérêt particulier 17
II-4-1-Les silicates 17
II-4-2-La cohérence expérience-modèle-code de calcul 18
II-4-3-La réversibilité des réactions de surface 19
11-4-4-Le terme électrostatique 19
III-L'utilisation des acquis fondamentaux 20
ÏÏI-1-Lamontmorillonite 20
III-2-Les mélanges complexes à base de montmorillonite 24
III-3-Les bentonites brutes 28
III-4-Les phases CSH 29
III-5-Les collaborations 32
IV-Bilan et perspectives 34
IV-1 -Le bilan 34
IV-2-Les perspectives 35
IV-2-1-Les matériaux argileux 36
IV-2-2-Les ciments 39
CHRONOGRAMME DES TRAVAUX DE RECHERCHE 42
OUVRAGES, ARTICLES, COMMUNICATIONS 43
ANNEXES 51
Résumé
Au cours de ces dernières années, l'équipe chimie des surfaces du GRECI (dirigée
par le Professeur F.Fromage) a focalisé son travail sur l'étude, la qualification et laquantification des interactions eaux naturelles-solides naturels à base d'argile, et
eaux naturelles- bétons.
Les principaux résultats obtenus par cette équipe sont les suivants :-l'influence sur la sorption des silicates dissous des eaux naturelles a été démontrée.Ces derniers peuvent aussi bien augmenter que diminuer la quantité de cationsretenue par une surface solide, et doivent donc être pris en compte dans les modèles
de sorption.
-La mise au point d'un modèle de comportement pour une surface d'argile a étéeffectuée. Ce modèle a été appliqué avec succès pour rendre compte des propriétés
de sorption d'une argile naturelle (argile Green Bond du Wyoming) et pour prévoir lecomportement de mélanges de solides (argile-zéolithe, argile-calcite, argile-oxydesde fer, argile-calcite-zéolithe), et ceci dans des milieux aqueux différents de part lanature des ions fixés (césium, lithium, sodium, calcium, nickel, cadmium, ytterbium,
europium, sélénium), la force ionique, les concentrations des ions sorbes, ou la masse
de solide utilisée.
-De plus, un modèle théorique, basé sur le concept de la complexation de surface, etalliant la dissolution, la reprécipitation et la sorption, a été mis au point et a permisde décrire les propriétés acide-base des phases CSH (silicates de calcium hydratés),constituants majoritaires des ciments. Les phénomènes de sorption ont également étémis en évidence à la surface de ces mêmes phases CSH, et ceci même pour des pH
très élevés, par des techniques spectroscopiques de surface (essentiellement
Spectrofluorométrie Laser àRésolution Temporelle (SLRT)).
Ce travail a donné lieu à 3 thèses (A.Delisée, I.Pointeau et Armelle Kowal), 11
publications, 7 contrats avec l'industrie, 27 communications orales ou par posterdans des congrès régionaux, nationaux ou internationaux. Un chapitre del'Encyclopedia of Surface Science est également actuellement en préparation.
Introduction
La connaissance des mécanismes de fixation d'ions sur une surface solide, ainsi que
la quantification de cette fixation, intéressent des domaines aussi variés que lagéochimie, le traitement des pollutions, l'emballage, ou encore le stockage desdéchets radioactifs. Mon travail de recherche, qui a été initié avec le soutien du
Commissariat à l'Energie Atomique et a été poursuivi en collaboration avec
l'ANDRA au sein de l'équipe de Chimie des Surfaces de l'Université de Reims
(dirigée par le professeur Francine Fromage), a pour but de participer à l'effort dequalification et de quantification des capacités de rétention du ou des matériauxsynthétiques et artificiels permettant le confinement des déchets nucléaires en sitegéologique souterrain, par adsorption des radioéléments éventuellement passés ensolution. Ces matériaux étant pour la plupart complexes, il nous a semblé opportun
de nous aider de modèles pouvant prédire le comportement d'un mélange vis à vis de
l'adsorption à partir des propriétés connues de constituants de base, et ainsi éviter un
nombre trop important de caractérisations expérimentales.
Cette synthèse commencera donc par une présentation de la modélisation telle quenous la concevons et des modèles, avant de passer par une description de la
démarche scientifique mise en place et de la méthodologie d'acquisition de données
qui lui est associée, et de continuer par un exposé des résultats. Dans un dernierchapitre, le bilan des travaux réalisés sera fait, et un exposé des perspectives de
travail à court et moyen terme sera proposé.
I- La Modélisation
1-1- Préambule
Avant de se lancer dans la modélisation des milieux complexes, il faut avoir
conscience des restrictions que cela implique, et ne pas vouloir faire dire à cet
exercice plus qu'il ne peut. Un modèle n'est qu'une représentation simplifiée de laréalité, qui s'applique à un champ borné, qui est son domaine de validité. En dehors
de ce champ d'application, il n'a plus aucun sens ni aucune justification. Il est faitd'hypothèses, de simplifications qui peuvent avoir une base scientifique ou êtresimplement le fait de constatations expérimentales. Le modèle n'a de sens que s'ilpeut être vérifié expérimentalement, c'est à dire s'il peut rendre compte d'uneexpérience. Un ajustement de paramètres est possible àce niveau. Dans ce cas, lapertinence et surtout la crédibilité du modèle est liée au nombre et àla justificationphysique ou chimique des paramètres à ajuster au cours de l'étape de validation.Cette étape sert àborner le modèle, àtester le poids, la justification et l'opportunitédes paramètres utilisés, et éventuellement àmodifier le modèle. Le cas idéal est celuioù expériences et modélisation vont de paire, le modèle étant alors constammentamélioré avec des expériences qui peuvent être adaptées et mises en œuvre pour
tester un paramètre sensible.
Le but ultime du modèle est la prédiction. Si on peut atteindre ce que l'on cherche àsavoir par l'expérience, ce n'est pas la peine d'y avoir recours. On fait doncgénéralement appel aux modèles si on veut connaître l'avenir (les modèlesgéochimiques par exemple cherchent àsavoir ce que deviendra un site de stockagedans 10000 ans), ou pour rendre simple quelque chose de très compliqué (lecomportement des polluants dans la géosphère par exemple). La prédiction ne peutdonc pas être validée par définition, mais il est toujours possible de faire desprédictions dans un champ d'application que l'on peut atteindre par l'expérience. Cetexercice s'appelle le test à l'aveugle ou blind test. Il est le seul juge qui permet devérifier la pertinence du modèle et son domaine de validité sans faire appel àaucun apriori ni en se référant àtelle école ou àtel fondement théorique.Mise à part son incapacité àprédire, les principales raisons qui peuvent nuire à lacrédibilité d'un modèle et donc àson utilisation sont de deux sortes. Un modèle peutintégrer un maximum de données expérimentales, tenir compte de tous lesphénomènes physiques et chimiques qui régissent les interactions eau-surfacessolides, peut donc s'appliquer à un champ de validation très large, et même êtreproposé comme la solution universelle. Pour arriver àun tel résultat, il doit souventutiliser un grand nombre de paramètres de calcul, dont certains n'ont une justificationque dans un domaine très réduit du champ de validité. De plus, certains de cesparamètres, ne pouvant pas être atteints expérimentalement, n'ont pour vocation qued'être ajustés. Un tel modèle est donc le plus souvent incapable de pouvoir faire une
prédiction, ce qui pourtant devrait être sa vocation première. A l'opposé, on trouvedes modèles très simples, avec un nombre très limité de paramètres de calculs,
directement tirés de données expérimentales. Ils sont capables de faire des
prédictions, sont simples d'utilisation mais ont de par leur nature un domaine devalidité assez réduit, qui dans la plupart des cas n'est pas clairement identifié.
Pour éviter ces écueils, il nous a semblé judicieux de commencer par cerner le champ
d'application où l'on souhaite utiliser un modèle, et ensuite construire le modèle desophistication minimum permettant de rendre compte avec une marge d'erreuracceptable de ce domaine d'utilisation. C'est dans ce sens que le modèle théoriquequi aservi de base ànotre modèle de comportement a été choisi, et que la démarchescientifique et laméthodologie décrites ci-après ont été développées.
II-2- les modèles thermodynamiques.
Les modèles thermodynamiques de description de l'interface solide-solution, dont fait
partie le modèle de complexation de surface que nous avons choisi d'appliquer, sontbasés sur les deux principes de base de la chimie: dans un système isolé constituéd'une surface en contact avec une solution, la conservation de la masse et
l'électroneutralité doivent être respectées. La conservation de la masse est exprimée
par la loi d'action de masse appliquée aux réactions entre les adsorbants et les sites desurface, et l'électroneutralité correspond à l'équilibre des charges entre surface et
solution.
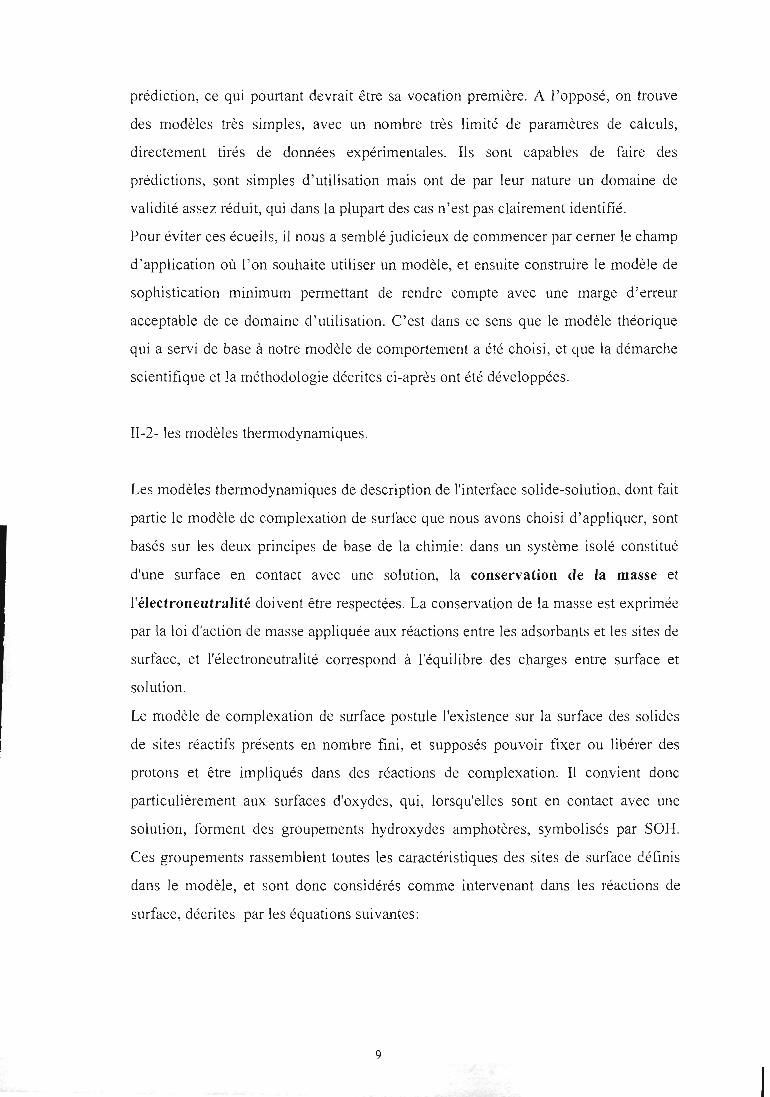
Le modèle de complexation de surface postule l'existence sur la surface des solidesde sites réactifs présents en nombre fini, et supposés pouvoir fixer ou libérer desprotons et être impliqués dans des réactions de complexation. Il convient doncparticulièrement aux surfaces d'oxydes, qui, lorsqu'elles sont en contact avec une
solution, forment des groupements hydroxydes amphotères, symbolisés par SOH.
Ces groupements rassemblent toutes les caractéristiques des sites de surface définisdans le modèle, et sont donc considérés comme intervenant dans les réactions de
surface, décrites par les équations suivantes:
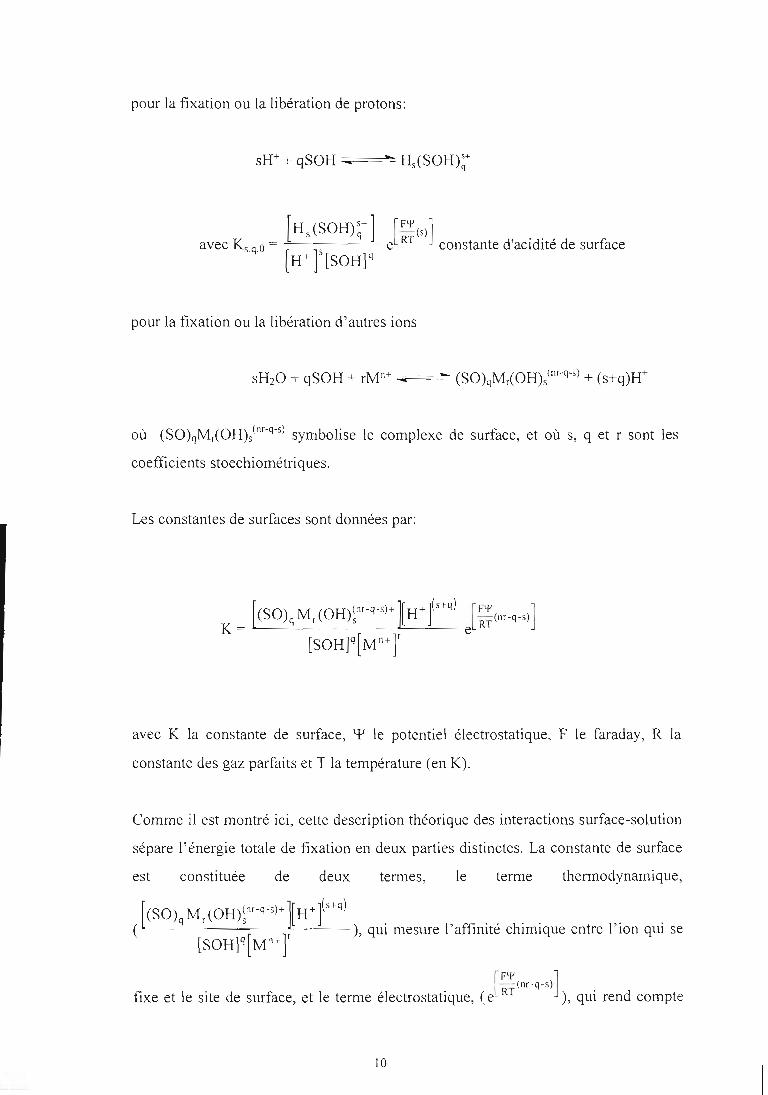
pour la fixation ou la libération de protons:
sH+ + qSOH -. Hs(SOH)^
avec Ks.q.oHs(SOH);
RT(s)
[h+]s[soh]cconstante d'acidité de surface
pour la fixation ou la libération d'autres ions
sH20 +qSOH +rM"+ ^=^ (SO)qMr(OH)s(nr-q-s) +(s+q)H+
où (SO)qMr(OH)s(nr"q"s) symbolise le complexe de surface, et où s, q et r sont les
coefficients stoechiométriques.
Les constantes de surfaces sont données par:
K
(nr-q-s)el_RTv[(SO)qMr(OH)r^+][H+](s+[SOH]q[Mn+]r
avec K la constante de surface, ¥ le potentiel électrostatique, F le faraday, R la
constante des gaz parfaits et T la température (en K).
Comme il est montré ici, cette description théorique des interactions surface-solution
sépare l'énergie totale de fixation en deux parties distinctes. La constante de surfaceest constituée de deux termes, le terme thermodynamique.
(SO)qMr(OH)rq's)+][H+](s+q)( [SOH]q[M'1+]r
fixe et le site de surface, et le terme électrostatique, (e
), qui mesure l'affinité chimique entre l'ion qui se
10
PP.
RT(nr-q-s)
- ), qui rend compte
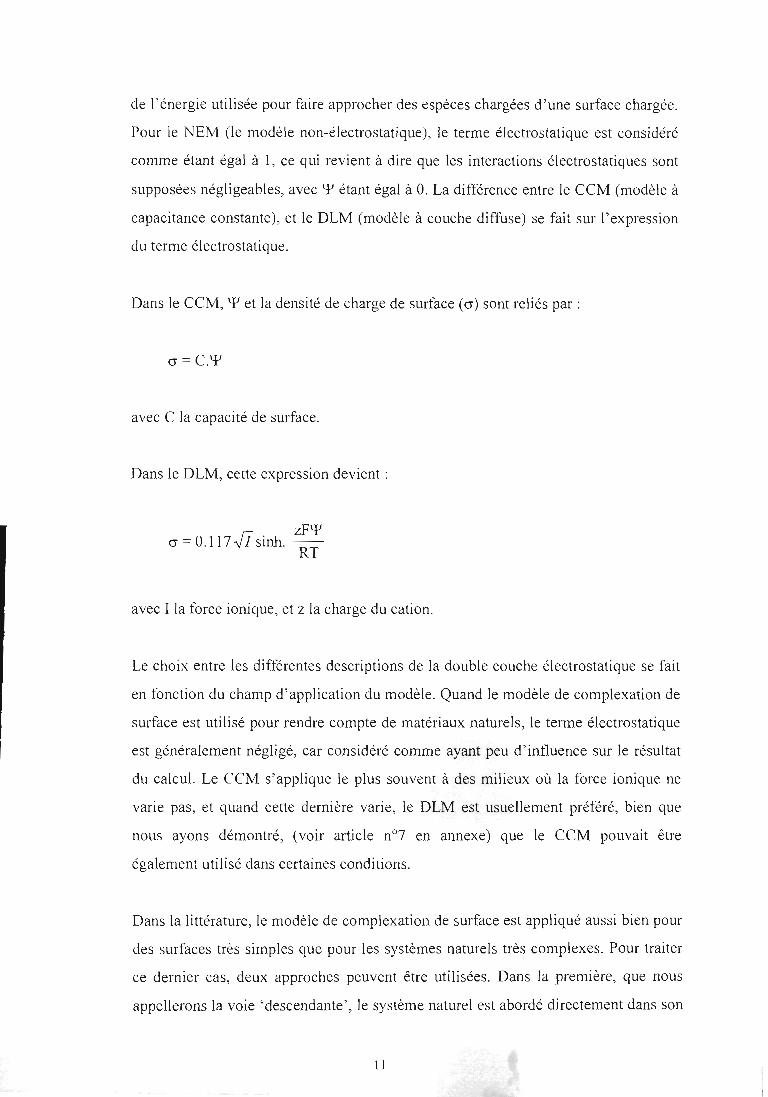
de l'énergie utilisée pour faire approcher des espèces chargées d'une surface chargée.
Pour le NEM (le modèle non-électrostatique), le terme électrostatique est considéré
comme étant égal à 1, ce qui revient à dire que les interactions électrostatiques sont
supposées négligeables, avec T étant égal à 0. La différence entre le CCM (modèle à
capacitance constante), et le DLM (modèle à couche diffuse) se fait sur l'expression
du terme électrostatique.
Dans le CCM, ¥ et la densité de charge de surface (a) sont reliés par :
a = C.x¥
avec C la capacité de surface.
Dans le DLM, cette expression devient :
zpvp
a = 0.117V7sinh. ——Ki
avec I la force ionique, et z la charge du cation.
Le choix entre les différentes descriptions de la double couche électrostatique se fait
en fonction du champ d'application du modèle. Quand le modèle de complexation de
surface est utilisé pour rendre compte de matériaux naturels, le terme électrostatique
est généralement négligé, car considéré comme ayant peu d'influence sur le résultatdu calcul. Le CCM s'applique le plus souvent à des milieux où la force ionique ne
varie pas, et quand cette dernière varie, le DLM est usuellement préféré, bien quenous ayons démontré, (voir article n°7 en annexe) que le CCM pouvait être
également utilisé dans certaines conditions.
Dans lalittérature, le modèle de complexation de surface est appliqué aussi bien pour
des surfaces très simples que pour les systèmes naturels très complexes. Pour traiterce dernier cas, deux approches peuvent être utilisées. Dans la première, que nous
appellerons la voie 'descendante', le système naturel est abordé directement dans son
il
ensemble. La sorption est interprétée en essayant d'utiliser un minimum de
paramètres, le plus souvent ajustés et ne se référant à aucun type de site particulier, si
ce n'est une répartition entre sites forts responsables du comportement observé et
sites faibles qui n'ont aucune action sur le résultat final et peuvent donc ne pas être
pris en compte. Dans la deuxième voie, la voie 'ascendante', on cherche d'abord à
quantifier la sorption sur des surfaces simples, et on en déduit les propriétés de sites
réactionnels. Les systèmes complexes sont ensuite considérés comme des
assemblages de ces sites réactionnels, et des calculs prédictifs peuvent être effectués.
C'est cette deuxième voie que nous avons choisi de suivre, qui passe par la
démonstration de l'additivité des propriétés des sites réactionnels.
II- Les acquis fondamentaux
Comme nous venons de le voir, les modèles théoriques thermodynamiques
permettant de décrire et de quantifier la fixation d'un ion sur unmatériau quelconque
postulent l'existence, sur la surface des solides, de sites réactifs présents en nombre
fini. Ces sites sont responsables de la rétention des ions. Cette rétention est quantifiée
à l'aide de constantes intrinsèques, c'est à dire qui ne doivent dépendre que de la
nature du site et de l'ion fixé. La modélisation par voie 'ascendante' ne peut être
envisagée sans se poser préalablement cette question: le caractère intrinsèque des
constantes de surface est-il vérifié quel que soit l'environnement du site de surface ?
La réponse à cette question est essentielle. Elle va conditionner le choix de
l'approche à utiliser pour appréhender l'étude des matériaux complexes. Si cette
réponse estoui, la seule connaissance de la nature des sites de surface présents sur un
matériau complexe devrait permettre de prédire son comportement, puisque ce
nouveau matériau pourra être considéré comme une 'somme' de composants de base.
Si la réponse est négative, le matériau complexe devra être considéré comme un
matériau nouveau.
Au cours de ma thèse, je me suis attaché à essayer de démontrer ce principe
d'additivité. Ce travail a été engagé après avoir identifié la démarche scientifique à
utiliser pour atteindre cet objectif, et lui avoir associée une méthodologie
12
II-2- La méthodologie
La première étape du travail a donc consisté à trouver le moyen de déterminer lesconstantes intrinsèques des sites de surface les plus répandus dans la géosphère: lessites silanol associés au silicium, les sites aluminol associés à l'aluminium et les sites
ferranol associés au fer. Cette détermination des constantes intrinsèques des sites de
surface a été effectuée sur des oxydes simples, dont la surface peut être considérée
comme composée d'un seul type de site. La connaissance du comportement de lasurface d'un oxyde simple permet donc directement de connaître les propriétés du
site associé.
L'acquisition des constantes intrinsèques des sites de surface se fait au moyen demanipulations simples, et dont les résultats peuvent facilement être contrôlés. Ellepasse par la détermination des paramètres physiques (surface spécifique,concentration en sites de surface) et cinétiques du solide étudié, qui dépendent de
l'état physique de ce dernier. Les manipulations effectuées au laboratoire sont de
trois types:
- des titrages acide-base qui permettent d'atteindre les constantes d'acidité de
surface et de vérifier la stoechiométrie de surface.
- des expériences de saturation de la surface par des protons ou d'autres cations
qui permettent d'atteindre la concentration des sites de surface.- une étude de la sorption des ions en batch qui permet d'atteindre la
stoechiométrie des complexes de surface et leurs constantes de formation.
Les courbes expérimentales obtenues sont comparées à des courbes théoriquescalculées en utilisant le modèle de complexation de surface. Une superposition des
courbes expérimentales et des courbes calculées signifie alors que le modèlethéorique utilisé est capable de donner une bonne image de la réalité, et que lesconstantes utilisées dans le calcul correspondent au système étudié. Cet ajustement
de constantes est effectué par le code de calcul FITEQL. Cette première étape de laméthodologie d'acquisition de données, ainsi que la description des expériences, ontété publiées dans les trois premiers articles que nous avons rédigés sur ce sujet (voir
14
articles n°l, 2 et 3). Il y est montré que le modèle proposé permet de bien rendrecompte de l'adsorption des protons, de l'ytterbium et du lanthane sur l'hématite, lagoethite, l'alumine et la silice. De tels résultats n'avaient jusqu'alors jamais étéobtenus pour un lanthanide.
II-3 - La démonstration de l'additivité
Dans la deuxième étape, les constantes ainsi déterminées sont utilisées pour essayer
de prédire le comportement de mélanges simples. Ces mélanges sont dans un premiertemps physiques, c'est àdire constitués de deux oxydes simples, et dans un deuxièmetemps 'chimiques'. Dans ce cas, la surface d'une argile modèle, la kaolinite, estsupposée être constituée de deux types de sites, un silanol et un aluminol, dont lespropriétés chimiques seraient celles associées aux oxydes simples. La littérature nousinforme que cette étape pose déjà des problèmes. En effet, si la modélisation permetde reproduire les propriétés de rétention de rares mélanges (exemple: binairealumine-hématite), la prédiction s'avère inexacte dans la plupart des cas. Lescapacités de rétention du mélange sont alors soit surestimées, soit sous-estimées.Le premier système complexe étudié est un mélange de deux oxydes insolubles dansles conditions d'étude, l'alumine et l'hématite. Dans le cas d'un mélange physique dedeux solides, les paramètres physiques et cinétiques déterminés sur les solides seulssont supposés rester les mêmes. Deux courbes associées au mélange sont alorsmodélisées en utilisant ces paramètres et les constantes chimiques intrinsèques dessites de surface, sans déterminer aucune grandeur supplémentaire et sans ajusteraucun paramètre. Ces courbes sont le titrage acide-base du mélange alumine-hématiteet la courbe de fixation de l'ytterbium sur ce même mélange. La confrontation avecles résultats de l'expérience s'est montrée satisfaisante, ce qui confirme les résultatsde la littérature. Ces résultats sont présentés dans l'article 11.
Le système suivant est constitué de l'alumine et d'un oxyde partiellement soluble, lasilice. La même démarche modélisatrice que celle utilisée pour le mélange précédentest appliquée. La confrontation modélisation-expérience n'est dans ce cas passatisfaisante, ce qui, là encore, est confirmé par lalittérature.
15
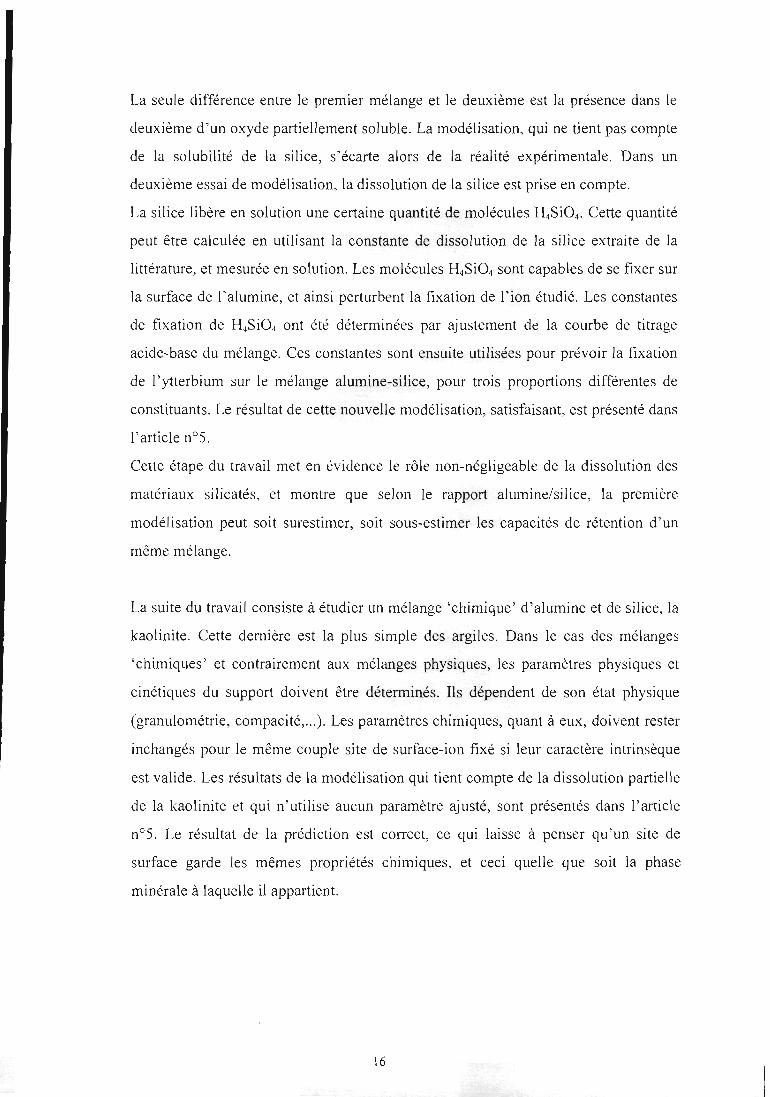
La seule différence entre le premier mélange et le deuxième est la présence dans le
deuxième d'un oxyde partiellement soluble. La modélisation, qui ne tient pas compte
de la solubilité de la silice, s'écarte alors de la réalité expérimentale. Dans un
deuxième essai de modélisation, la dissolution de la silice est prise en compte.
La silice libère en solution une certaine quantité de molécules H4Si04. Cette quantité
peut être calculée en utilisant la constante de dissolution de la silice extraite de lalittérature, et mesurée en solution. Les molécules H4Si04 sont capables de se fixer sur
la surface de l'alumine, et ainsi perturbent la fixation de l'ion étudié. Les constantes
de fixation de H4Si04 ont été déterminées par ajustement de la courbe de titrage
acide-base du mélange. Ces constantes sont ensuite utilisées pour prévoir la fixation
de l'ytterbium sur le mélange alumine-silice, pour trois proportions différentes de
constituants. Le résultat de cette nouvelle modélisation, satisfaisant, est présenté dans
l'article n°5.
Cette étape du travail met en évidence le rôle non-négligeable de la dissolution des
matériaux silicates, et montre que selon le rapport alumine/silice, la première
modélisation peut soit surestimer, soit sous-estimer les capacités de rétention d'un
même mélange.
La suite du travail consiste à étudier un mélange 'chimique' d'alumine et de silice, la
kaolinite. Cette dernière est la plus simple des argiles. Dans le cas des mélanges
'chimiques' et contrairement aux mélanges physiques, les paramètres physiques et
cinétiques du support doivent être déterminés. Ils dépendent de son état physique
(granulométrie, compacité,...). Les paramètres chimiques, quant à eux, doivent rester
inchangés pour le même couple site de surface-ion fixé si leur caractère intrinsèque
est valide. Les résultats de la modélisation qui tient compte de la dissolution partielle
de la kaolinite et qui n'utilise aucun paramètre ajusté, sont présentés dans l'article
n°5. Le résultat de la prédiction est correct, ce qui laisse à penser qu'un site de
surface garde les mêmes propriétés chimiques, et ceci quelle que soit la phase
minérale à laquelle il appartient.
16
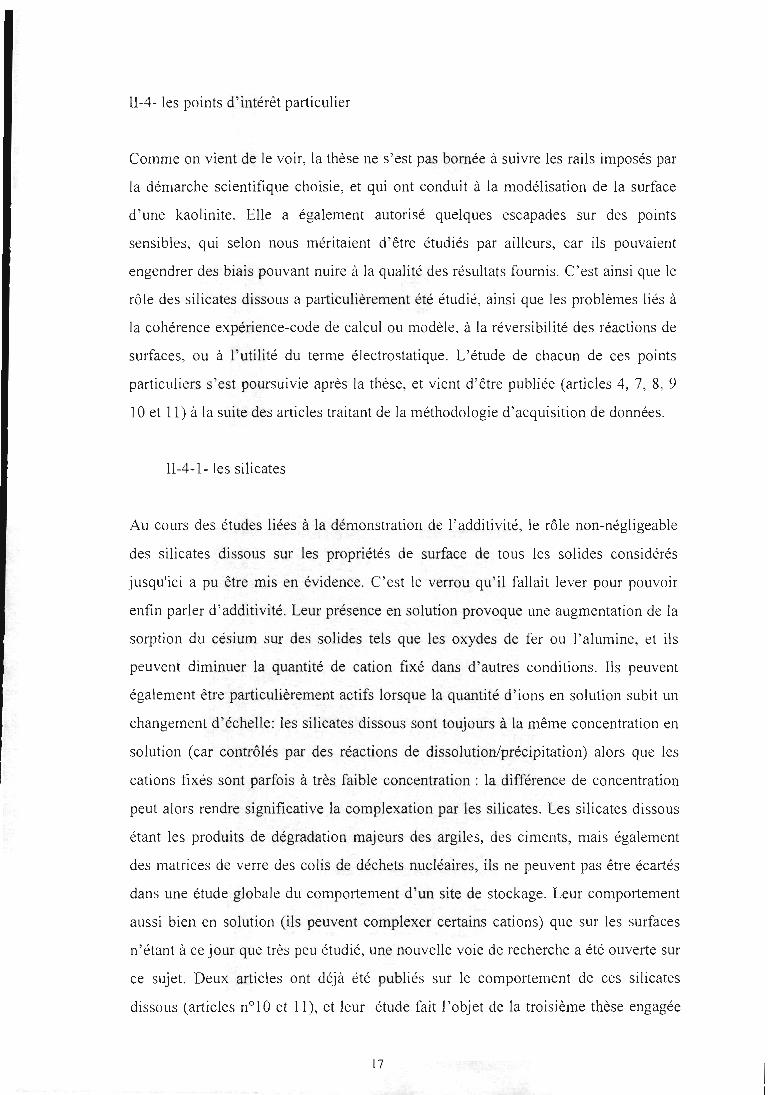
II-4- les points d'intérêt particulier
Comme on vient de le voir, la thèse ne s'est pas bornée à suivre les rails imposés par
la démarche scientifique choisie, et qui ont conduit à la modélisation de la surface
d'une kaolinite. Elle a également autorisé quelques escapades sur des points
sensibles, qui selon nous méritaient d'être étudiés par ailleurs, car ils pouvaient
engendrer des biais pouvant nuire à la qualité des résultats fournis. C'est ainsi que le
rôle des silicates dissous a particulièrement été étudié, ainsi que les problèmes liés à
la cohérence expérience-code de calcul ou modèle, à la réversibilité des réactions de
surfaces, ou à l'utilité du terme électrostatique. L'étude de chacun de ces points
particuliers s'est poursuivie après la thèse, et vient d'être publiée (articles 4, 7, 8, 9
10 et 11) à la suite des articles traitant de la méthodologie d'acquisition de données.
II-4-1- les silicates
Au cours des études liées à la démonstration de l'additivité, le rôle non-négligeable
des silicates dissous sur les propriétés de surface de tous les solides considérés
jusqu'ici a pu être mis en évidence. C'est le verrou qu'il fallait lever pour pouvoir
enfin parler d'additivité. Leur présence en solution provoque une augmentation de la
sorption du césium sur des solides tels que les oxydes de fer ou l'alumine, et ils
peuvent diminuer la quantité de cation fixé dans d'autres conditions. Ils peuvent
également être particulièrement actifs lorsque la quantité d'ions en solution subit un
changement d'échelle: les silicates dissous sont toujours à la même concentration en
solution (car contrôlés par des réactions de dissolution/précipitation) alors que les
cations fixés sont parfois à très faible concentration : la différence de concentration
peut alors rendre significative la complexation par les silicates. Les silicates dissous
étant les produits de dégradation majeurs des argiles, des ciments, mais également
des matrices de verre des colis de déchets nucléaires, ils ne peuvent pas être écartés
dans une étude globale du comportement d'un site de stockage. Leur comportement
aussi bien en solution (ils peuvent complexer certains cations) que sur les surfaces
n'étant à ce jourque très peu étudié, une nouvelle voie de recherche a été ouverte sur
ce sujet. Deux articles ont déjà été publiés sur le comportement de ces silicates
dissous (articles n°10 et 11), et leur étude fait l'objet de la troisième thèse engagée
17
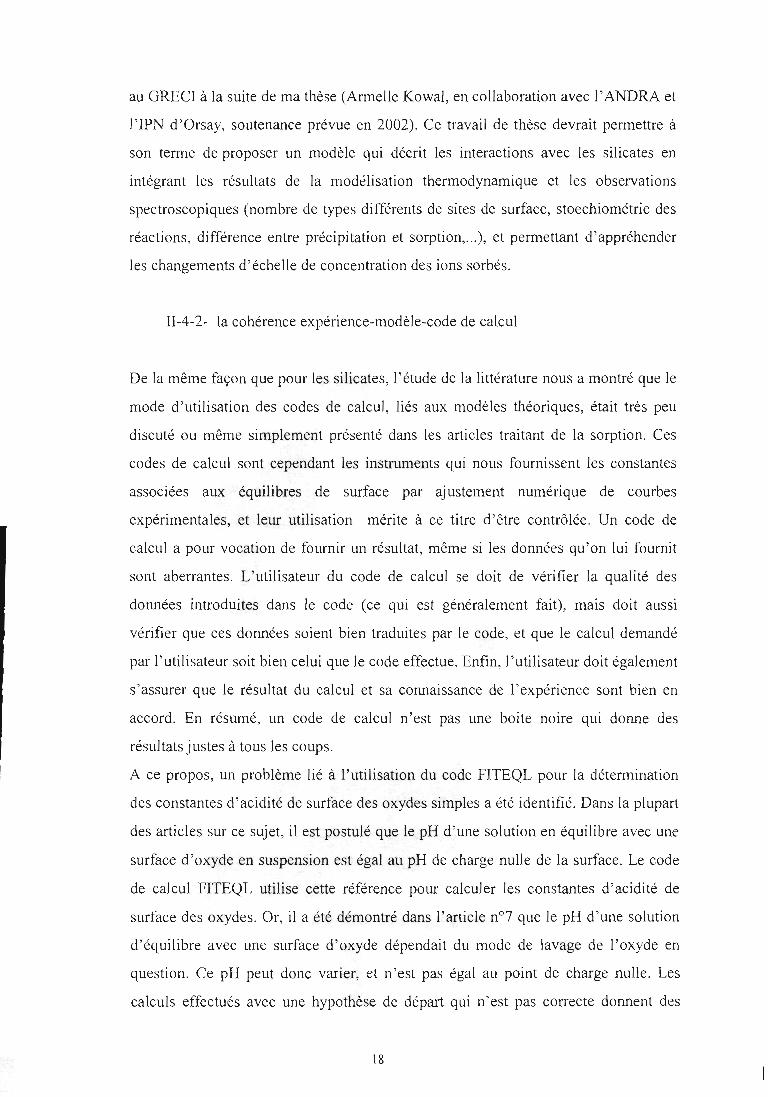
au GRECI à la suite de mathèse (Armelle Kowal, en collaboration avec l'ANDRA et
1TPN d'Orsay, soutenance prévue en 2002). Ce travail de thèse devrait permettre à
son terme de proposer un modèle qui décrit les interactions avec les silicates en
intégrant les résultats de la modélisation thermodynamique et les observationsspectroscopiques (nombre de types différents de sites de surface, stoechiométrie desréactions, différence entre précipitation et sorption,...), et permettant d'appréhender
les changements d'échelle de concentration des ions sorbes.
H-4-2- la cohérence expérience-modèle-code de calcul
De la même façon que pour les silicates, l'étude de la littérature nous a montré que le
mode d'utilisation des codes de calcul, liés aux modèles théoriques, était très peu
discuté ou même simplement présenté dans les articles traitant de la sorption. Ces
codes de calcul sont cependant les instruments qui nous fournissent les constantes
associées aux équilibres de surface par ajustement numérique de courbes
expérimentales, et leur utilisation mérite à ce titre d'être contrôlée. Un code decalcul a pour vocation de fournir un résultat, même si les données qu'on lui fournit
sont aberrantes. L'utilisateur du code de calcul se doit de vérifier la qualité des
données introduites dans le code (ce qui est généralement fait), mais doit aussi
vérifier que ces données soient bien traduites par le code, et que le calcul demandé
par l'utilisateur soit bien celui que le code effectue. Enfin, l'utilisateur doit égalements'assurer que le résultat du calcul et sa connaissance de l'expérience sont bien en
accord. En résumé, un code de calcul n'est pas une boite noire qui donne des
résultats justes à tous les coups.
Ace propos, un problème lié à l'utilisation du code FITEQL pour la déterminationdes constantes d'acidité de surface des oxydes simples a été identifié. Dans la plupart
des articles sur ce sujet, il est postulé que le pH d'une solution en équilibre avec une
surface d'oxyde en suspension est égal au pH de charge nulle de la surface. Le code
de calcul FITEQL utilise cette référence pour calculer les constantes d'acidité de
surface des oxydes. Or, il a été démontré dans l'article n°7 que le pH d'une solution
d'équilibre avec une surface d'oxyde dépendait du mode de lavage de l'oxyde enquestion. Ce pH peut donc varier, et n'est pas égal au point de charge nulle. Lescalculs effectués avec une hypothèse de départ qui n'est pas correcte donnent des
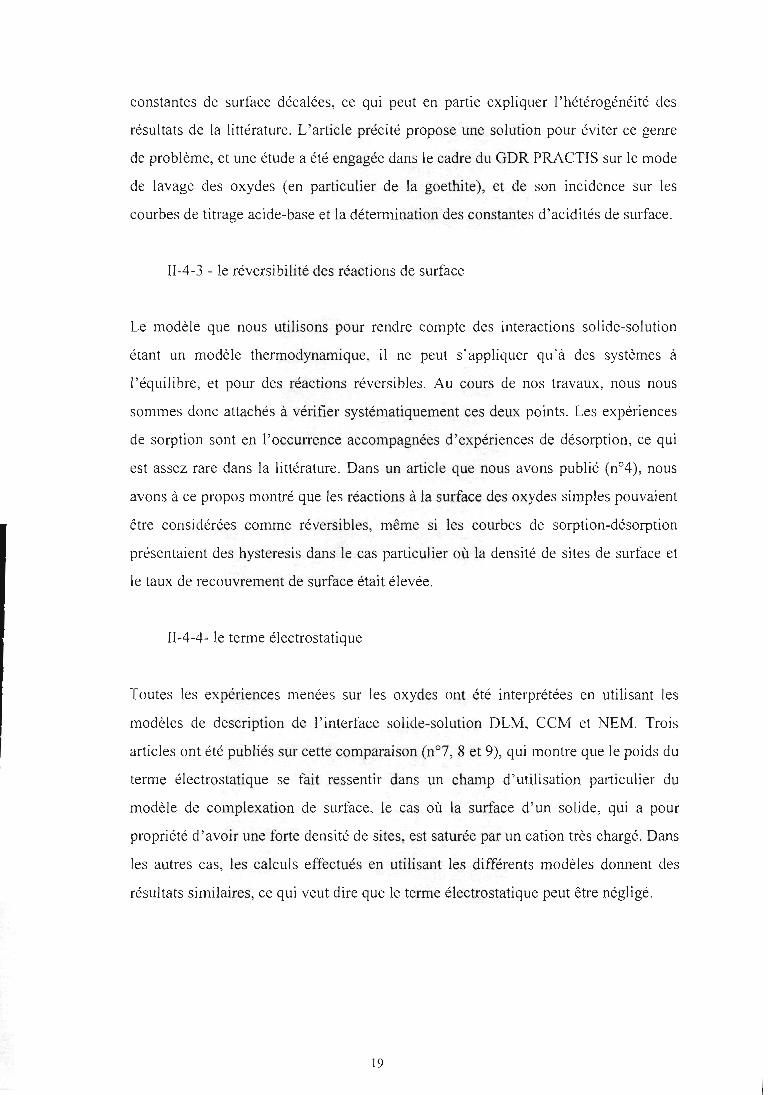
constantes de surface décalées, ce qui peut en partie expliquer l'hétérogénéité des
résultats de la littérature. L'article précité propose une solution pour éviter ce genre
de problème, et une étude aété engagée dans le cadre du GDR PRACTIS sur le modede lavage des oxydes (en particulier de la goethite), et de son incidence sur les
courbes de titrage acide-base et la détermination des constantes d'acidités de surface.
II-4-3 - le réversibilité des réactions de surface
Le modèle que nous utilisons pour rendre compte des interactions solide-solution
étant un modèle thermodynamique, il ne peut s'appliquer qu'à des systèmes à
l'équilibre, et pour des réactions réversibles. Au cours de nos travaux, nous nous
sommes donc attachés à vérifier systématiquement ces deux points. Les expériences
de sorption sont en l'occurrence accompagnées d'expériences de désorption, ce qui
est assez rare dans la littérature. Dans un article que nous avons publié (n°4), nous
avons àce propos montré que les réactions à la surface des oxydes simples pouvaientêtre considérées comme réversibles, même si les courbes de sorption-désorption
présentaient des hystérésis dans le cas particulier où la densité de sites de surface et
le taux de recouvrement de surface était élevée.
II-4-4- le terme électrostatique
Toutes les expériences menées sur les oxydes ont été interprétées en utilisant les
modèles de description de l'interface solide-solution DLM, CCM et NEM. Trois
articles ont été publiés sur cette comparaison (n°7, 8et 9), qui montre que le poids du
terme électrostatique se fait ressentir dans un champ d'utilisation particulier du
modèle de complexation de surface, le cas où la surface d'un solide, qui a pour
propriété d'avoir une forte densité de sites, est saturée par un cation très chargé. Dansles autres cas, les calculs effectués en utilisant les différents modèles donnent des
résultats similaires, ce qui veut dire que le terme électrostatique peut être négligé.
19
III- L'utilisation des acquis fondamentaux
A la suite de la thèse, les travaux ont continué sous la direction du professeur
F.Fromage, avec ma collaboration, pour des argiles de plus en plus complexes,mélangées ou non à des additifs non-argileux tels que des zéolithes, des oxydes defer, ou de la calcite, et pour un nouveau type de matériau, les ciments. Les matériauxétudiés étant de plus en plus complexes, nous avons fait appel à d'autres techniquesexpérimentales, nous permettant d'acquérir les informations nécessaires à la mise enplace du modèle. Ces nouvelles expériences, pour la plupart liées aux techniques despectroscopie de surface, sont effectuées dans le cade de collaborations avec leCNRS, (CECM Vitry Sur Seine), 1TPN d'Orsay, L'Université de Pau (LCABIE),L'école des mines de Nantes (SUBATECH), le CEA (DAMRI), l'école Centrale de
Paris ou le LURE de Saclay.
III-1- la montmorillonite
L'interprétation du comportement d'un matériau complexe comme lamontmorillonite ne peut pas se faire de la même façon que celle d'un oxyde simple.
L'utilisation des seuls sites aluminol et silanol ne suffit plus pour rendre compte des
propriétés de surface d'une argile complexe, qui de part sa structure possède unecharge de surface permanente, compensée par des cations localisés entre les feuilletsde l'argile, et qui peuvent s'échanger avec des cations de la solution. Si les sitesaluminol et silanol sont conservés pour faire le lien avec la surface de lakaolinite, un
nouveau type de sites, les sites d'échange, a donc dû être ajouté à la descriptionproposée pour la montmorillonite. Pour chacun de ces sites, il faut connaître laconcentration, deux constantes d'acidité, une ou plusieurs constantes de
complexation, ou plusieurs constantes d'échange. A ceci il faut éventuellementajouter les constantes associées à des réactions parasites (dues à la présence desilicates dissous par exemple). L'utilisation du principe d'additivité réduit de façonsensible le nombre de paramètres à ajuster dans cette liste, puisque toutes les
constantes associées aux sites silanol et aluminol sont conservées. Il reste cependant
à déterminer les concentrations de tous les sites, et les constantes associées aux sites
20
échangeurs. Il est alors bien évident qu'une expérience, ou même deux types
différents d'expériences ne suffiront plus pour s'assurer de leur validité. La
modélisation d'une argile complexe nécessite donc une adaptation du champ
expérimental se manifestant surtout par une augmentation significative du nombre de
manipulations croisées et de calculs en retour. Cette amélioration est indispensable si
on veut se prémunir du risque d'obtenir des valeurs de paramètres corrélées entre
elles ou non significatives.
Le cas idéal serait de trouver pour chaque paramètre la fenêtre expérimentale dans
laquelle seul son poids se fait ressentir, et où celui des autres paramètres est
négligeable. Sa variation serait alors significative, sa valeur seule rendrait compte du
résultat expérimental, et ne serait pas corrélée à celle des autres. Le nombres
d'expériences indépendantes à mettre en oeuvre serait alors égal au nombre de
paramètres à déterminer.
Ces conditions de travail sont parfois difficiles à réunir. Il est cependant possible, en
prenant un certain nombre de précautions, d'obtenir le même résultat dans des
conditions non-idéales. La première de ces 'règles' à respecter est d'éviter d'ajuster,
pour la même espèce de surface, à la fois la concentration et une constante, à partir
du même jeu de données expérimentales. En effet, plusieurs couples concentration-
constantes différents peuvent parfaitement rendre compte du même résultat
expérimental. Les paramètres ainsi fournis par le code de calcul ne sont donc pas
significatifs.
La deuxième règle est de ne pas ajuster deux paramètres liés à deux sites différents,
mais dont l'action se fait ressentir fortement au même endroit. Là encore, plusieurs
couples de valeurs différentes peuvent donner le même résultat.
La troisième précaution consiste à ne pas ajuster un paramètre à partir d'une
expérience lorsque son poids dans le résultat de cette expérience est négligeable.
Pour vérifier le poids d'un paramètre dans un résultat expérimental, il suffit
d'effectuer un calcul en retour, et de mesurer la variation provoquée par la
modification de ce paramètre. Si cette variation est significative pour une petite
modification du paramètre, ce dernier est significatif, et s'il n'y a aucun changement
provoqué par une modification importante, sa valeur n'a aucun sens.
21
En conclusion, il faut dire que dans le cadre des modèles thermodynamiques, il existe
une corrélation 'naturelle', engendrée par la loi d'action de masse, entre les
paramètres servant à décrire les propriétés de surface. On ne peut se soustraire à cette
loi - à moins d'utiliser un modèle purement arithmétique et donc sans aucune
signification chimique - et l'existence d'une corrélation entre plusieurs paramètres
n'est pas obligatoirement due à un biais dans le modèle ou dans le code de calcul. Il
est cependant possible de se prémunir des effets de la loi d'action de masse en
respectant les règles énoncées ci-dessus.
Pour éviter ces problèmes de corrélation et de signification de paramètres, nous
avons donc procédé de la manière suivante. Les concentrations de chacun des sites
sont déterminées par des expériences de saturation sélective des sites de surface. Les
constantes de fixation d'ions sur les sites silanol et aluminol sont celles qui ont été
déterminées par ajustement numérique de titrages potentiométriques et de courbes de
sorption de suspension de silice pure et d'alumine pure, respectivement. Les
constantes d'échanges sont déterminées par ajustement numérique des courbes de
sorption sur l'argile. Elle sont dès lors le seul paramètre ajusté pour rendre compte de
telles courbes, ce qui permet de contraindre le modèle un maximum, et d'éviter un
ajustement simultané de paramètres corrélés.
La modélisation proposée n'a pas pour but de supprimer toute corrélation entre les
paramètres. Son but est d'obtenir des grandeurs ayant un sens chimique, avec une
action significative sur les résultats d'un calcul, et dont les valeurs sont vérifiées et
validées.
La quantité de cation fixée sur un site de complexation (aluminol et silanol) varie
avec le pH et la quantité de cation fixé sur un site d'échange dépend de la force
ionique. Il est donc indispensable pour qualifier et quantifier cette fixation de faire
varier le pH (en général de 4 à 9) et la force ionique (en général de 0.01 à 0.1). Le
modèle mis au point pour décrire la surface de la montmorillonite a été capable de
rendre compte de l'ensemble de ce champ expérimental, pour le nickel, le césium, le
lithium, l'ytterbium, l'europium, le cadmium, et les séléniates.
Après cette mise au point, un retour sur le modèle a été effectué, pour tester le poids
de chacun des paramètres. Leur nombre doit en effet être nécessaire et suffisant pour
rendre compte d'un champ d'expériences, de façon à obtenir le modèle de
sophistication minimum permettant de reproduire l'ensemble des résultats
22
expérimentaux. Il a été remarqué à cet égard que la sorption du nickel pouvait être
expliquée par la seule présence des sites silanol, et celle des séléniates par les seuls
sites aluminol. Pour rendre compte de la sorption de ces cations pris
individuellement, un seul site de surface est donc suffisant. Cependant, ce site n'est
pas le même lorsque l'on passe d'un ion à l'autre, et la description simplifiée n'est
plus valide quand on change la nature de l'ion fixé. Pour avoir une description
cohérente pour l'ensemble des ions étudiés, les trois sites sont nécessaires, même si
leur poids dans le résultat final peut parfois être négligé. On remarque donc ici
l'importance du bornage du champ d'application du modèle, puisque le nombre de
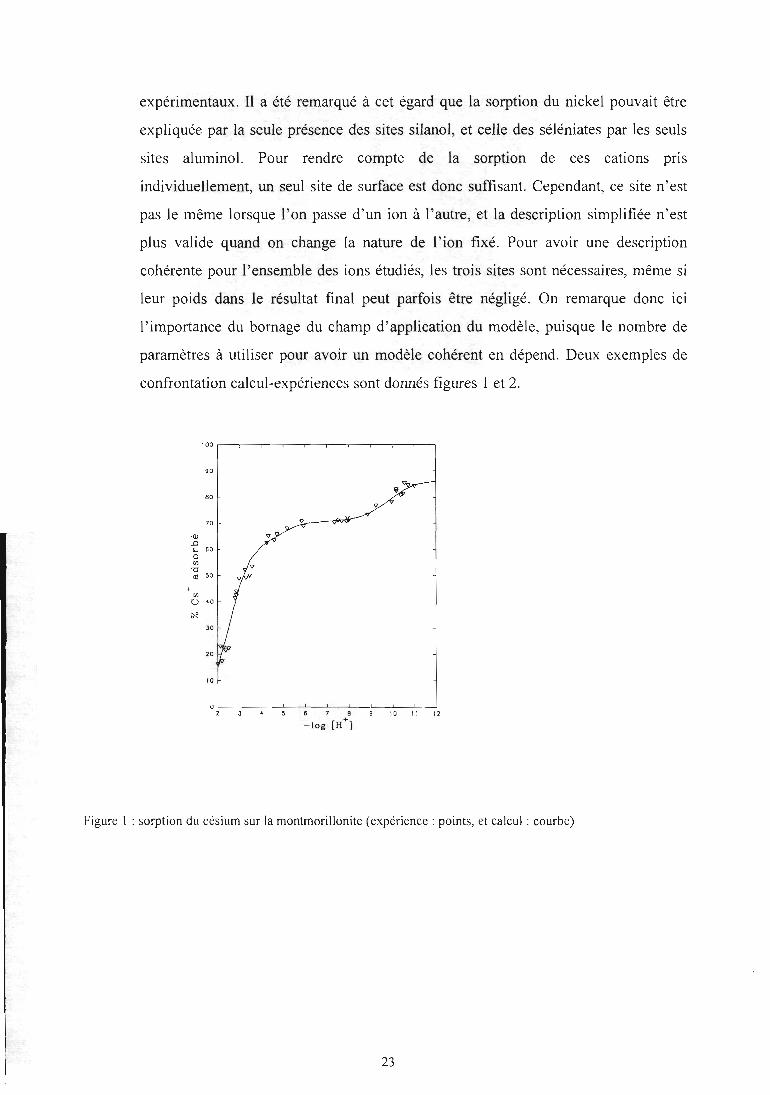
paramètres à utiliser pour avoir un modèle cohérent en dépend. Deux exemples de
confrontation calcul-expériences sont donnés figures 1 et 2.
1D 11 12
Figure 1: sorption du césium sur la montmorillonite (expérience : points, et calcul : courbe)
23
PH
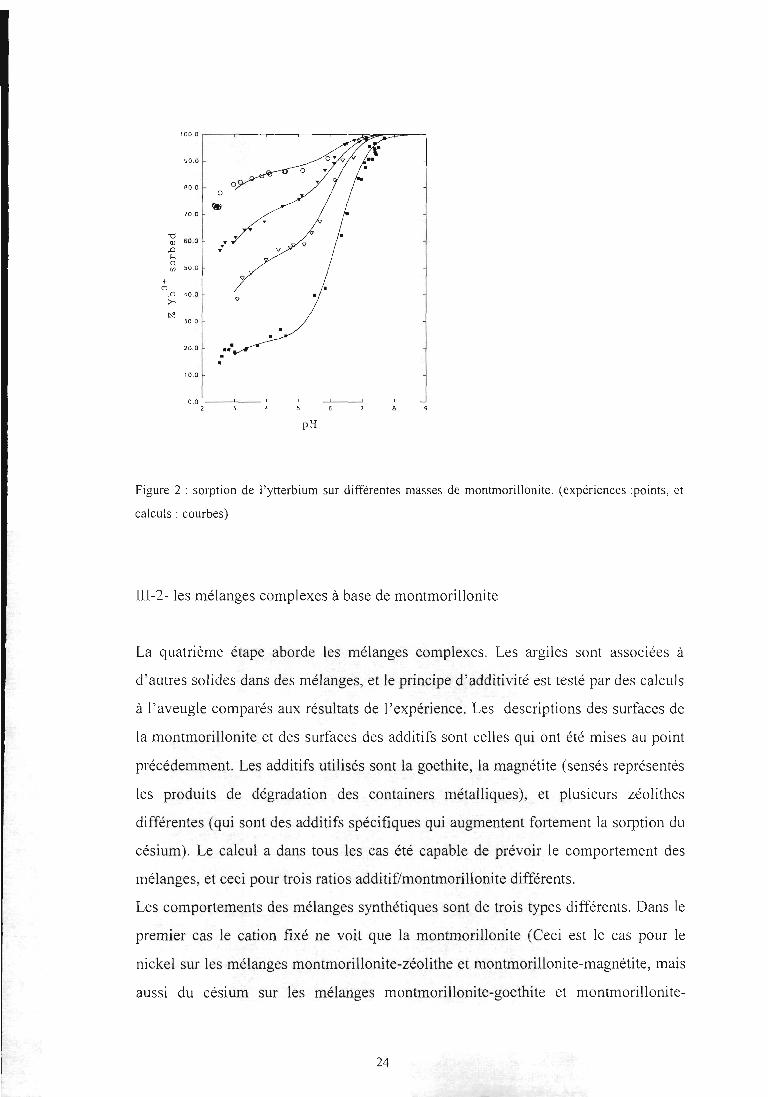
Figure 2 : sorption de l'ytterbium sur différentes masses de montmorillonite. (expériences :points, et
calculs : courbes)
III-2- les mélanges complexes à base de montmorillonite
La quatrième étape aborde les mélanges complexes. Les argiles sont associées à
d'autres solides dans des mélanges, et le principe d'additivité est testé par des calculs
à l'aveugle comparés aux résultats de l'expérience. Les descriptions des surfaces de
la montmorillonite et des surfaces des additifs sont celles qui ont été mises au point
précédemment. Les additifs utilisés sont la goethite, la magnétite (sensés représentés
les produits de dégradation des containers métalliques), et plusieurs zéolithes
différentes (qui sont des additifs spécifiques qui augmentent fortement la sorption du
césium). Le calcul a dans tous les cas été capable de prévoir le comportement des
mélanges, et ceci pour trois ratios additif/montmorillonite différents.
Les comportements des mélanges synthétiques sont de trois types différents. Dans le
premier cas le cation fixé ne voit que la montmorillonite (Ceci est le cas pour le
nickel sur les mélanges montmorillonite-zéolithe et montmorillonite-magnétite, mais
aussi du césium sur les mélanges montmorillonite-goethite et montmorillonite-
24
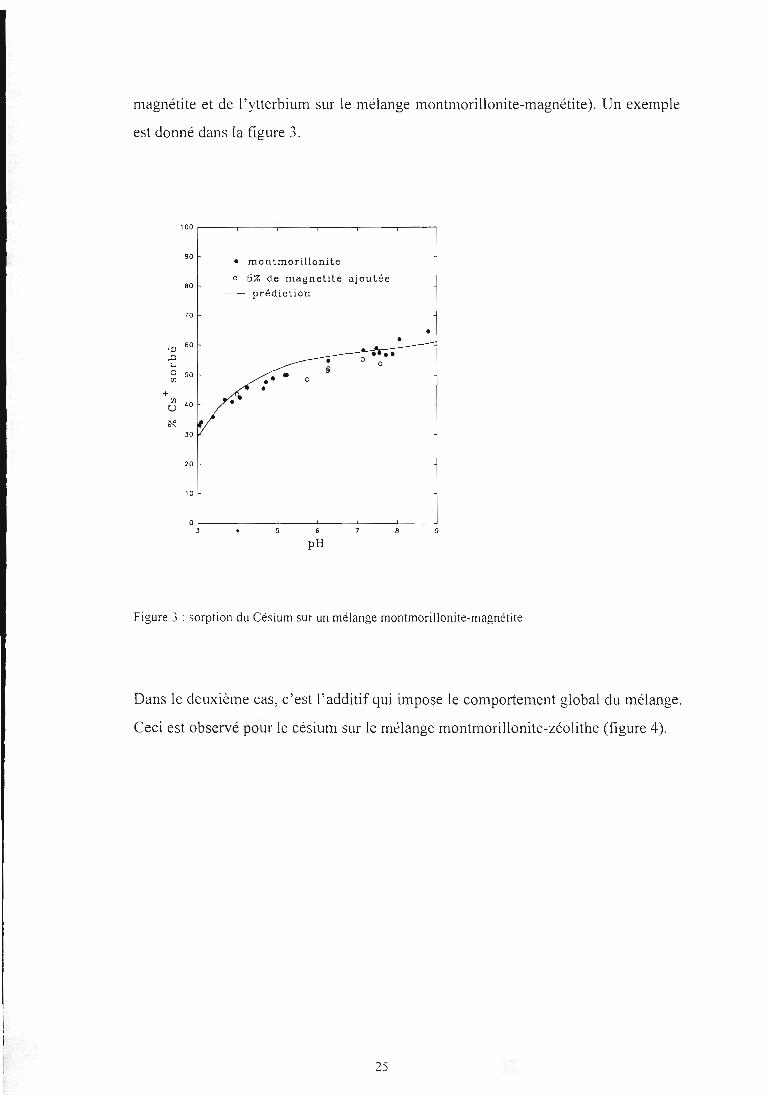
magnétite et de l'ytterbium sur le mélange montmorillonite-magnétite). Un exemple
est donné dans la figure 3.
• montmorillonite
0 5% de magnétite ajoutée
prédiction
6
PH
Figure 3 : sorption du Césium sur un mélange montmorillonite-magnétite
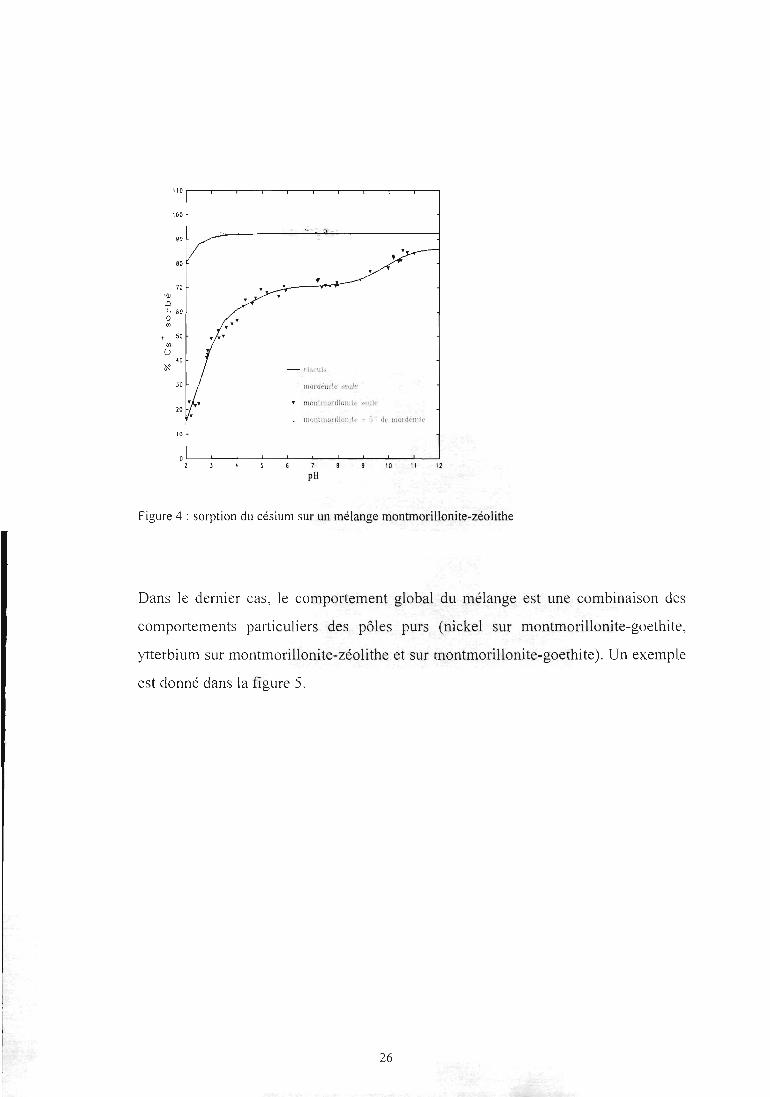
Dans le deuxième cas, c'est l'additifqui impose le comportement global du mélange.
Ceci est observé pour le césium sur le mélange montmorillonite-zéolithe (figure 4).
25
-1 1 1- -l 1 1 r-
rimul,
tnordéfitte stuie
motiiuiûnliomte seul*
iiKjiitinoiilloiiiU' • V
pH10 11 12
Figure 4 : sorption du césium sur un mélange montmorillonite-zéolithe
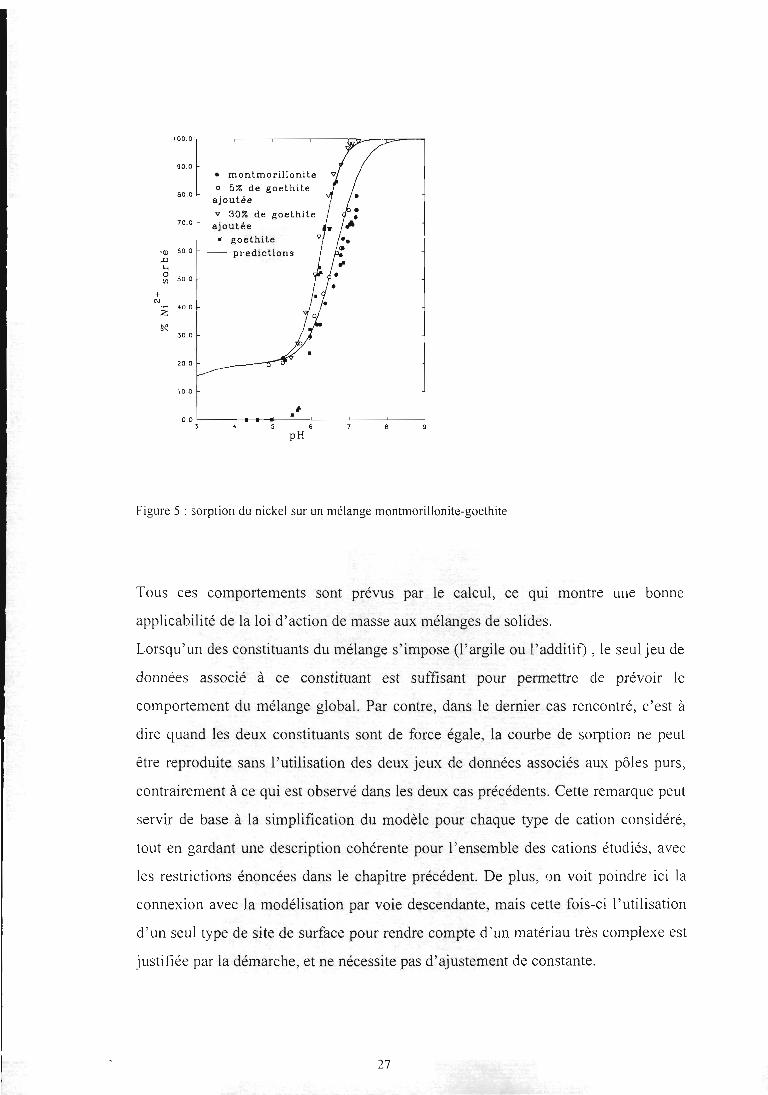
Dans le dernier cas, le comportement global du mélange est une combinaison des
comportements particuliers des pôles purs (nickel sur montmorillonite-goethite,
ytterbium sur montmorillonite-zéolithe et sur montmorillonite-goethite). Un exemple
est donné dans la figure 5.
26
XIu
o
• montmorillonite
o 5% de goethiteajoutée
v 30% de goethiteajoutée
• goethite
prédictions
pH
Figure 5 : sorption du nickel sur un mélangemontmorillonite-goethite
Tous ces comportements sont prévus par le calcul, ce qui montre une bonne
applicabilité de la loi d'action de masse aux mélanges de solides.
Lorsqu'un des constituants du mélange s'impose (l'argile ou l'additif) , le seul jeu de
données associé à ce constituant est suffisant pour permettre de prévoir le
comportement du mélange global. Par contre, dans le dernier cas rencontré, c'est à
dire quand les deux constituants sont de force égale, la courbe de sorption ne peut
être reproduite sans l'utilisation des deux jeux de données associés aux pôles purs,
contrairement à ce qui est observé dans les deux cas précédents. Cette remarque peut
servir de base à la simplification du modèle pour chaque type de cation considéré,
tout en gardant une description cohérente pour l'ensemble des cations étudiés, avec
les restrictions énoncées dans le chapitre précédent. De plus, on voit poindre ici la
connexion avec la modélisation par voie descendante, mais cette fois-ci l'utilisation
d'un seul type de site de surface pour rendre compte d'un matériau très complexe est
justifiée par la démarche, et ne nécessite pas d'ajustement de constante.
27
On a également pu remarquer au cours de cette étude que le constituant majoritaire
en masse n'est pas forcément celui qui va s'imposer. Il peut même dans certains cas
(césium sur montmorillonite-zéolithe) être négligé. Le comportement global d'un
mélange peut donc être contrôlé par des constituants très actifs et présents à l'état de
traces dans ce mélange, ce qui bien sûr peut se retrouver dans les systèmes naturels.
L'influence de la présence de calcite en tant qu'impureté de l'argile a également été
quantifiée. La sorption du nickel, de l'ytterbium et du césium a ainsi été étudiée sur
des mélanges montmorillonite-calcite avec un maximum de 5% en masse de calcite.
La présence de la calcite ne perturbe pas la sorption du nickel et de l'ytterbium mais
a pour effet de diminuer la quantité de césium fixé sur l'argile en dessous de pH=8.
Là encore, le modèle de complexation de surface utilisé, qui tient compte de la
dissolution de la calcite mais pas de sa surface, a permis de prévoir par le calcul cette
diminution de sorption.
III-3- les bentonites brutes.
Les comparaisons entre deux bentonites purifiées (élimination de la calcite et mise
sous forme homoionique) de deux façons différentes et une bentonite brute ont été
effectuées. On constate que pour les trois cations étudiés, le césium, l'ytterbium et le
nickel, le mode de purification de la bentonite est sans influence sur la courbe de
sorption. Par contre, alors qu'il n'y a pas de différence observée entre les bentonites
purifiées et la bentonite brute pour l'ytterbium et le nickel, le césium ne se comporte
pas de la même façon lorsqu'il est en contact avec une montmorillonite et lorsqu'il
est en présence de bentonite brute.
Cette différence peut s'expliquer de deux façons, soit par une modification de la
phase solide, soit par une modification de la phase aqueuse. En effet, il existe dans la
bentonite brute des phases minérales mineures partiellement solubles qui ont été
enlevées au cours de la purification. Dans la première hypothèse, l'ytterbium et le
nickel seraient insensibles à ces phases mineures, alors que le césium non. Dans la
deuxième hypothèse, la plus crédible à notre sens, les différences observées seraient
dues à la présence en solution d'un cation compétiteur avec le césium mais pas avec
le nickel, ni avec l'ytterbium. La calcite étant un des solides solubles présent dans la
28
bentonite, nous avons supposé qu'elle était responsable en partie des écarts observés
entre montmorillonite et bentonite. Le calcium émis au cours de la dissolution de la
calcite est tenu pour responsable par sa sorption sur les sites de surface de la
montmorillonite de la diminution apparente de la quantité de césium fixé. Une
modélisation effectuée dans ce sens permet de reproduire la sorption du césium sur la
bentonite brute.
III-4- les phases CSH (silicates de calcium hydratés)
Outre les argiles, les ciments sont également un matériau pouvant se retrouver dans
un site de stockage. Il est donc important de connaître son comportement vis à vis de
la sorption, et si possible de le décrire à l'aide d'un modèle compatible (reprenant les
mêmes bases théoriques) avec celui utilisé pour les argiles et les mélanges à base
d'argile. Les interactions entre ces deux matériaux complexes pourront ainsi être
étudiées et calculées de manière cohérente. C'est dans ce cadre qu'une deuxième
thèse (I. Pointeau, soutenance prévue en septembre 2000), a été engagée en
collaboration avec l'ANDRA et le CECM, laboratoire du CNRS à Vitry sur Seine.
Elle a pour but de démontrer l'applicabilité des modèles de complexation de surface
pour la sorption d'ion sur des surface de phases CSH, qui sont les constituants
essentiels des ciments, en utilisant à la fois les techniques de la chimie en solution et
la spectroscopie de surface.
Pour étudier les propriétés de rétention du ciment, il a donc été nécessaire de
simplifier le système, comme nous l'avons fait avant d'aborder les argiles brutes, en
considérant une phase qui soit la plus représentative possible du ciment dans son
ensemble. Dans cette optique, notre choix s'est porté sur les phases CSH (silicates de
calcium hydratés: xCaO.SiÛ2 .nH2Û) dont le rapport Ca/Si permet de caractériser le
ciment en fonction de son état de dégradation et de sa composition initiale. Ces
phases CSH sont quasi-amorphes (nanocristaux), constituent entre 60 et 80 % du
ciment en masse et présentent une surface réactive importante. Le rapport Ca/Si varie
entre les valeurs limites de 1,8 (ciment OPC ou ciment frais) à 0,83 (mélange de
ciments et de fumée de silice ou ciment dégradé).
Un problème concernant l'étude de la rétention des cations par les CSH est la nature
soluble du solide. En effet cela empêche d'effectuer les titrages acide-base
29
traditionnellement appliqués aux oxydes, nous privant ainsi de deux informations
majeures: la densité de sites et les constantes d'acidité des sites de surface. Or, pour
une modélisation de la sorption par complexation de surface, ces données sont
indispensables. Une nouvelle approche expérimentale, l'utilisation d'un modèle
structural bien établi de la littérature ainsi qu'une exploitation des données par le
code de calcul PHREEQC, ont donc été développés et ont permis de palier ces
problèmes, et de proposer un modèle de comportement de la surface des CSH
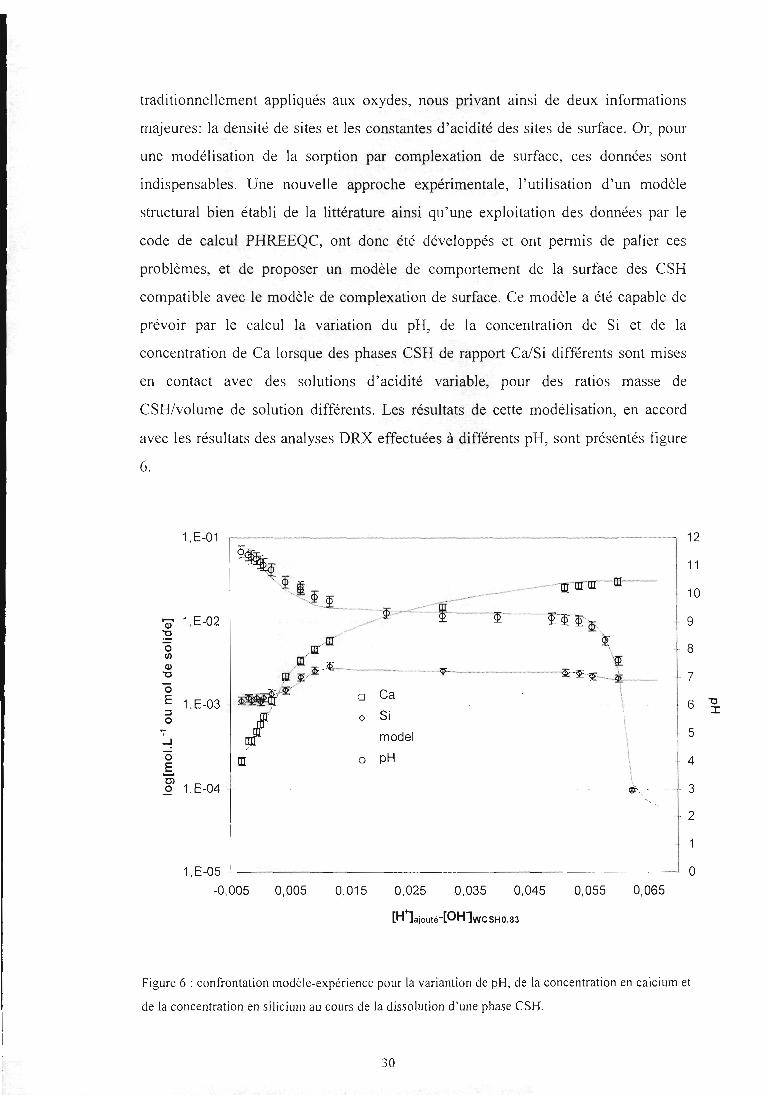
compatible avec le modèle de complexation de surface. Ce modèle a été capable de
prévoir par le calcul la variation du pH, de la concentration de Si et de la
concentration de Ca lorsque des phases CSH de rapport Ca/Si différents sont mises
en contact avec des solutions d'acidité variable, pour des ratios masse de
CSH/volume de solution différents. Les résultats de cette modélisation, en accord
avec les résultats des analyses DRX effectuées à différents pH, sont présentés figure
6.
1.E-01
1.E-05
-0,005 0,005 0,015 0,025 0,035 0,045 0,055 0,065
[H ]ajouté-[OH"]WcSH0.83
Figure 6 : confrontation modèle-expérience pour la variantion de pH, de la concentration en calcium et
de la concentration en silicium au cours de la dissolution d'une phase CSH.
30
Les conditions particulières de solubilité du solide, ainsi que la forte basicité de la
solution d'équilibre, nous ont amenés à appuyer l'étude de la sorption des cations sur
deux axes de recherches indissociables. Le premier est basé sur des analyses
spectroscopiques et microscopiques du solide, et a comme objectif d'identifier les
mécanismes de fixation afin d'orienter la modélisation. Le second concerne
l'acquisition de données expérimentales d'isothermes de sorption afin d'insérer ces
données dans le code de calcul de spéciation PHREEQC. Ce code permet la
simulation de toutes les formes de mécanismes de rétention (précipitation,
complexation de surface, échange d'ion) mais l'ajustement des courbes
expérimentales ne peut que se faire manuellement.
La principale caractéristique des milieux de ciments vis-à-vis de la majorité des
cations divalents et trivalents, est d'imposer une solubilité très basse en solution.
Bien que ceci soit un avantage pour le stockage des déchets radioactifs, c'est
analytiquement gênant (détection des éléments à l'échelle de trace et problème pour
distinguer la sorption de la précipitation). Le choix de commencement de l'étude
s'est donc porté sur la rétention du césium par les CSH, bien que celui-ci soit connu
pour être faiblement retenu par les milieux de ciment. En effet, la complexation du
césium en solution étant nulle, son étude ne relève que de la sorption seule, ce qui
simplifie le problème.
Un cation trivalent a également été choisi, l'europium, en raison de ses très bonnes
capacités d'étude en luminescence laser. Une étude du solide complète a donc été
développée sur cet élément ainsi que des expériences en mode batchs en utilisant des
traceurs (à SUBATECH) afin de descendre en deçà des limites de solubilité très
basses pour cet élément. Si les analyses DRX, la miscrocopie électronique et
l'analyse par XPS ne donnent que peu d'informations sur la nature des interactions
CSH-Europium, la SLRT a permis de montrer qu'il y avait bien existence de
phénomène de sorption de l'europium à la surface des CSH, avec pour une petite
partie diffusion du cation à l'intérieur de la structure des CSH, et l'absence de
précipitation d'hydroxyde. Les résultats sur l'Europium viennent d'être soumis à
publication .
Enfin, l'étude des divalents porte sur deux cations aux comportements résolument
différents : le Plomb, avec une limite de solubilité élevée et donc propice à une étude
de sorption, et le Nickel qui lui possède une solubilité basse.
31
III-5- Les collaborations
Les collaborations que nous avons engagées jusqu'alors sont de deux sortes. Elles
peuvent porter sur des sujets qui sont soit en amont, soit en aval de la modélisation
des surfaces complexes. On trouve en amont des collaborations qui donnent des
résultats indispensables à la mise en forme de la modélisation. Comme nous venons
de le voir, Le CNRS, (CECM Vitry Sur Seine), 1TPN d'Orsay, L'Université de Pau
(LCABIE), L'école des mines de Nantes (SUBATECH), l'école Centrale de Paris ou
le LURE de Saclay, nous ont permis de part leurs compétences sur les méthodes de
spectroscopie de surface ou sur la chimie des traces, de pouvoir construire et vérifier
nos modèles.
En aval, l'expérience que nous avons acquise sur la chimie des surfaces permet à
d'autres équipes de mettre en place des expériences, d'interpréter des résultats, ou
dans le cas de l'ANDRA de proposer unpremier calcul de comportement de barrière
ouvragée, avec ou sans additifs, basé sur le modèle de complextion de surface. C'est
ainsi qu'en utilisant la méthodologie décrite précédemment, nous avons contribué au
choix de la zéolithe naturelle, qui mélangée à une argile pour laquelle nous avons
proposé une description de la surface, sera utilisée pour des expériences de diffusion
réalisées par le CEA DAMRI. Les modélisations des surfaces d'argile et de zéolithe
seront ensuite utilisées pour essayer d'interpréter les résultats des expériences de
diffusion, confirmant ou infirmant l'existence d'un lien entre des expériences
réalisées sur des suspensions et des expériences mises en œuvre sur des matériaux
consolidés. Les autres travaux engagés dans ce sens sont les suivants:
- En collaboration avec 1TPN d'Orsay (article n°6), des résultats acquis sur des
poudres d'oxydes ont permis l'interprétation de résultats obtenus sur les colloides
correspondants.
- Dans le cadre de l'atelier 'goethite' du GDR CNRS PRACTIS, nous avons
également mis en évidence l'importance du conditionnement et du mode de lavage
sur lespropriétés de surface d'une goethite synthétique.
- Dans le cadre d'un workshop animé par l'OCDE, nous participons à la
réflexion engagée au niveau international sur la pertinence de l'utilisation des
modèles thermodynamiques appliqués aux milieux naturels.
32
- Enfin, dans le cadre du groupe 'Rétention' mis en place par l'ANDRA, un
projet commun à l'équipe chimie des surfaces du GRECI, du groupe de radiochimie
de l'IPN d'Orsay, du LCABIE de l'Université de Pau, de SUBATECH à Nantes, et
du CEA a été engagé et se poursuivra au cours des trois prochaines années. Le but de
ce projet est d'allier les compétences de ces équipes pour cerner, aussi bien du point
de vue thermodynamique que structural, les mécanismes de rétention de différents
ions sur une argile. Ceci permettra en outre d'appliquer les recommandations
méthodologiques émises par le groupe de recherche CNRS PRACTIS (qui s'intéresse
à la physico-chimie des actinides et des autres radioéléments à l'interface et en
solution) dans lequel toutes ces équipes travaillent, pour définir les mécanismes de
sorption par une approche sur la surface et en solution.
Ce travail se focalisera sur les deux points suivants, particulièrement sensibles dans
le cas d'un stockage de déchets radioactifs :
-l'identification du rôle des silicates (produits de dégradation du verre,
produits de dissolution de phases mineures et des argiles) dans les mécanismes de
sorption, aussi bien à la surface de l'argile qu'en solution, et l'intégration de leurs
équilibres dans la description des interactions eau-argile. En effet, la littérature ne
prend pas en compte les équilibres de sorption des silicates, bien que leur influence
sur les propriétés de rétention de différentes surfaces solides ait été démontrée.
-tester la linéarité du modèle proposé en travaillant sur un large spectre de
concentration en ions sorbes, de 10"3 mol.L"1 à l'échelle des traces (10"8 -10"10
mol.L" ) pour se rapprocher des conditions d'un stockage. Ce dernier point permettra
de mesurer l'influence des phases mineures des argiles non-purifiées (oxydes de fer,
calcite,.. ), des impuretés ( Al3+, Zn2+,...), ou d'une éventuelle hétérogénéité des sitesde surface de l'argile, en fonction de la concentration en ion sorbe.
IV- Bilan et perspectives
IV-1- Le bilan
Comme nous venons de le voir, une méthodologie, basée à la fois sur l'expérience et
sur le modèle de complexation de surface, a été mise au pointpourrendre compte des
33
propriétés de sorption de divers matériaux. Ce travail a permis de reproduire par le
calcul et à partir de l'observation des propriétés de surface de quelques oxydes
simples (alumine, silice et oxydes de fer), le comportement de matériaux plus
complexes de type argile (kaolinite, montmorillonite, bentonite, argiles naturelles).
D'autres solides de type sel (carbonates) ou typiquement échangeurs d'ions
(zéolithes) ont également pu être étudiés de la même façon, ainsi que des phases
CSH (constituants majoritaires des ciments) de différents ratio Ca/Si correspondant à
des ciments plus ou moins âgés. Ce travail a ainsi conduit à l'identification des
mécanismes déterminant les capacités de rétention des matériaux étudiés, et à la
quantification, sous forme de concentrations en sites de surface et de constantes de
complexation de surface, des capacités de sorption de ces matériaux. Cependant, ces
résultats n'ont jusqu'à présent été obtenus qu'en utilisant les techniques de la chimie
en solution, et il semble opportun de les confronter aux résultats d'autres types
d'expériences, comme les techniques de spectroscopie de surface, qui permettent
d'obtenir des informations directes sur la surface.
Ces techniques ont pu être mises en œuvre sur un autre type de matériau, les phases
CSH, grâce à une collaboration avec le CECM, ce qui a permis de pouvoir proposer
un modèle à la fois structural et de comportement pour ces surfaces complexes, et
d'identifier clairement l'existence de phénomènes de sorption sur ces surfaces.
IV-2- les perspectives
Ce bilan nous indique que les travaux à venir doivent s'orienter suivant deux axes,
un plus fondamental permettent d'asseoir le modèle sur des connaissances plus
complètes de la définition d'un site de surface et des interactions eau-roche (en
s'appuyant entre autre sur les techniques de spectroscopie de surface), et un plus
appliqué de développement du modèle pour son utilisation dans les calculs de
prédimensionnement de barrières ouvragées ou d'intégration dans les exercices
d'évaluation de performance d'un site de stockage.
La partie fondamentale fait déjà l'objet du travail de l'atelier 'goethite' du groupe de
recherche CNRS PRACTIS auquel nous participons, qui en menant de front
modélisation, expériences en suspensions et expériences de spectrocopie de surface
sur un matériau de référence choisi pour sa simplicité, cherche à mieux cerner la
34
notion de site réactionnel de surface, qui peut avoir une définition différente pour un
modèle et dans la réalité observée par l'expérience. Cette définition doit cependant
être cohérente pour l'ensemble des résultats expérimentaux et de modélisation.
Les deux axes de recherche, appliqué et fondamental, sont indissociables et doivent
être menés de front, plutôt dans le cadre de thèses pour la partie plus fondamentale,
et plutôt en partenariat avec les organismes en charge de la gestion des déchets
radioactifs pour la partie plus appliquée. Nos efforts se porteront sur les deux grands
types de matériaux complexes rencontrés dans un site de stockage en milieu
géologique profond, c'est à dire les matériaux argileux et les ciments.
IV-2-1-Les matériaux argileux
Dans le contexte d'un stockage de déchets vitrifiés, utilisant comme matériaux de
confinement un surcontainer métallique, les argiles et les ciments, trois perturbations
majeures vont se produire au début de la vie du stockage pour s'atténuer ou
disparaître ensuite, et peuvent modifier la composition de l'eau de site, et donc la
quantité de radioélément retenue par la surface de l'argile. Il s'agit de la dissolution
des matrices en verre qui va produire des silicates en solution, de la dégradation du
surcontainer qui va produire des oxydes de fer, et de la présence de ciment qui va
induire une forte augmentation du pH de la solution. Si l'effet de la présence des
oxydes de fer a déjà été étudié, et si la perturbation hyperalcaline commence à être
traitée, on a que très peu d'idées sur l'importance des silicates dissous dans un tel
contexte. Ce point est donc selonnous à traiteren priorité au cours des années à venir
(ainsi que les autre points apparaissant en caractères gras dans la suite du texte). En
effet, nous avons pu démontrer expérimentalement que la présence de silicates
dissous dans les eaux de contact pouvait fortement perturber les propriétés de surface
de certains solides, avec parfois des effets opposés sur la quantité d'ions retenus par
la surface. Dans le cas de la fixation des lanthanides sur l'alumine, la sorption peut
être diminuée quand la quantité de silicates en solution est importante. Dans le cas du
césium sur l'alumine, la sorption est très fortement augmentée quand des silicates
sont présents en solution. La modélisation a permis de rendre compte de ces
observations expérimentales, mais les hypothèses utilisées pour construire le modèle
intégrant les silicates dissous (compétition des silicates avec les lanthanides pour
35
l'occupation des sites de surface, ou existence d'un 'pont' silicate entre le site de
surface et le césium qui augmenterait indirectement l'affinité de ce cation pour la
surface) n'ont été vérifiées qu'indirectement, par un seul type d'expériences, ne
mettant en jeu que des mesures effectuées sur la solution. De plus, la chimie en
solution des silicates, et en particulier la quantification de leurs propriétés
complexantes, est très mal connue et n'a donc pas pu être intégrée au modèle. C'est
pour essayer de combler un maximum de ces déficits en connaissances sur la
chimie en solution et sur les surfaces des silicates dissous, que nous venons
d'engager, en partenariat avec 1TPN d'Orsay et l'ANDRA, un travail de thèse sur les
silicates (Armelle Kowal, début en octobre 1999). Les objectifs à trois ans de ce
travail sont les suivants :
- mettre en évidence et quantifier la complexation en solution de certains ions
d'intérêts (Europium, Uranyle, Nickel) avec les silicates dissous afin de pouvoir
intégrer ces données dans les modèles de spéciation.
- confirmer ou infirmer par des expériences de spectroscopie de surface (SLRT,
EXAFS) l'existence des réactions de surface proposées par la modélisation, aussi
bien sur des oxydes simples (alumine, silice) que sur des surfaces d'argiles.
- Utiliser les propriétés radioactives des ions étudiés, et donc les possibilités de la
radiochimie, pour atteindre des concentrations de travail proches de celle rencontrées
dans un site de stockage. En effet, la plupart des travaux engagés jusqu'àprésent sur
les argiles concerne des concentrations d'ions d'intérêt en solution comprises entre
10 et 10 5Mol.L' . Pour tester la linéarité des modèles sur un large spectre de
concentrations en solution, et essayer de quantifier le rôle de la complexation par
les silicates quand le rapport de la concentration en ligand sur la concentration en
cation augmente, nous allons travailler à des concentrations inférieures à 10"7
Mol.L" Jusqu'aux limites de sensibilité des techniques analytiques.
Ce travail devrait nous permettre de qualifier et de quantifier les réactions mettant en
jeu les silicates à la surface et en solution, d'intégrer ces réactions et constantes dans
les modèles de spéciation, et ainsi de pouvoir prévoir l'impact de leur présence en
solution sur le comportement global d'une barrière ouvragée à base d'argile.
Parallèlement à ce travail, un de nos objectifs à moyen terme serait de vérifier par la
seule technique de surface qui à notre connaissance puisse le faire, l'EXAFS,
36
l'existence du pont silicate entre un site aluminol et le césium, en nous donnant des
indications sur la nature des ions voisins du césium sur la surface. De premiers essais
utilisant cette technique ont déjà été effectués dans le cadre du groupe de recherche
CNRS PRACTIS en collaboration avec le LURE, mais n'ont permis que de montrer
que la technique était en limite de sensibilité pour les expériences menées sur une
surface avec du césium. En effet, la concentration du césium sur la surface doit être
assez importante pour qu'un signal soit détecté et exploitable, mais cette quantité est
limitée par le nombre de sites de surface et l'affinité du césium pour cette surface.
Cependant, la comparaison des spectres obtenus pour un système silice-césium, et
pour un système alumine-silicates-césium a montré une similitude qui nous
encourage à ne pas arrêter nos investigations ici. C'est pourquoi nous avons envisagé
avec 1TPNO le même type d'expériences en utilisant des appareillages nous
permettant de diminuer les limites de sensibilité, tels qu'il en existe à Grenoble ou à
Stanford. Ces expériences, très lourdes à mettre en œuvre, peuvent être envisagées
dans l'année à venir, et les résultats ne sont pas espérés avant un an et demi. Elles
sont cependant indispensables si l'on souhaite une vérification directe des hypothèses
du modèle.
Dans le cadre de ce travail en collaboration avec ITPNO, il nous sera également
permis de répondre à un certain nombre de questions d'intérêt concernant la
modélisation de la fixation d'éléments sur les argiles :
- Existe-il sur la surface de l'argile d'autres types de sites de surface très minoritaires,
avec des propriétés différentes, dont l'action serait masquée quand la quantité d'ions
fixés sur la surface est grande, mais qui joueraient un rôle majeur dans la cas des
faibles concentrations, créant ainsi une discontinuité dans le modèle proposé ?
- La sorption sur les phases minérales accessoires, rencontrées dans le cas d'argiles
naturelles, est-elle suffisamment importante pour être intégrée dans les modèles ?
- Les éléments traces rencontrés dans les eaux d'argiles peuvent-ils avoir un effet
compétiteur, non-négligeable et quantifiable, avec les éléments dont on étudie la
sorption?
Pour répondre à ces dernières questions, et en particulier à celle concernant la
linéarité des modèles avec la concentration qui selon nous est le deuxième point
37
auquel il faut s'intéresser en priorité, une collaboration vient d'être montée entre
l'équipe chimie des surfaces du GRECI et le LCABIE de Pau. En effet, ce laboratoire
dispose d'un parc analytique (ICPMS Haute Résolution) permettant d'atteindre en
solution des concentrations très faibles sans avoir recours à la radiochimie, ce qui
permet d'envisager des expériences sur une plus grande variété d'ions sorbes. Les
premiers résultats de cette collaboration sont la vérification de la linéarité de la
sorption du sélénium sur une surface de goethite et sur une surface d'argile (le même
modèle est utilisé pour rendre compte d'expériences menées à moyenne et faible
concentration), et seront publiés dans les six mois à venir. Cette collaboration va
continuer sur une vérification de la linéarité de la sorption du césium, du nickel, de
l'europium, du rubidium, du niobium et du plomb dans le cadre du groupe inter
laboratoires sur la rétention mis en place par l'ANDRA pour les trois ans à venir.
Ce groupe de travail a également comme but à moyen terme de confronter le modèle
que nous avons développé à ceux utilisés par d'autres équipes en testant ces capacités
de prédiction, et sa capacité à être intégré dans des codes de calcul couplant la chimie
et le transport. En effet, un des objectifs majeurs de ces travaux est de tester la
cohérence entre les expériences et la modélisation appliquées aux suspensions et
aux matériaux consolidés, ce qui passe par la mise en œuvre d'expériences de
diffusion. Dans ce contexte, nous avons engagé depuis un an, en partenariat avec
l'ANDRA, une collaboration avec le CEA DAMRI pour mettre en place le
dimensionnement d'expériences de diffusion mises en œuvre au CEA. Les
expériences sont déjà lancées et les premiers résultats sont attendus pour l'année
prochaine. Ces résultats seront ensuite confrontés aux résultats de calcul intégrant la
description chimique des interactions eau-solide mise au point par notre équipe.
A plus long terme, lorsque le modèle de représentation d'un matériaux argileux
complexe aura été assis sur des données spectroscopiques, et s'il a pu être vérifié
pour les très faibles concentrations, la suite logique des travaux serait tout d'abord de
tester les capacités de prédiction de ce modèle pour des matériaux argileux
naturels, comme par exemple l'argile du site de Bure (ce qui passerait par une
identification de toutes les phases minérales contenues dans ce matériaux, et par leur
caractérisation pour celles que nous n'avons pas encore étudiées), et de le confronter
à la modélisation par voie descendante proposée par des laboratoires (dont le
38
LCABIE de Pau) travaillant sur les matériaux naturels bruts, comme les sols ou les
sédiments. Cette confrontation permettrait ainsi de répondre à cette question : est-ce
que les équilibres identifiés, en utilisant la voie ascendante, comme gouvernant la
sorption, permettent bien de reproduire et de prévoir le comportement d'un
matériaux naturel in situ ?
IV-2-2- les ciments
La thèse d'Ingmar Pointeau sur les phases CSH, qui en est à sa troisième année, a
permis de montrer que la sorption est un phénomène non-négligeable dans les
processus d'équilibrage eau-CSH, et que cette sorption, associée à un modèle de
dissolution, pouvait être décrite par un modèle de complexation de surface pour
décrire la surface des phases CSH. Ce travail de modélisation est basé sur une
structure modèle, issue de la littérature, que nous nous proposons de vérifier dans
l'année à venir en utilisant la RMN du silicium (collaboration avec le service de
chimie analytique du CEA). Cette technique, bien plus efficace que les DRX dans le
cas des CSH, nous permettra de vérifier l'environnement du Silicium dans la
structure des CSH, et de son évolution avec le rapport Ca/Si et avec le pH. Une fois
le modèle structural et le modèle de dissolution-sorption calés, ce qui est l'objectif
principal de cette thèse, la modélisation de la sorption de quelques ions d'intérêt
(Césium, Europium, Plomb) sera engagée, ce qui permettra une quantification de
cette sorption, et par conséquence la mise en œuvre de calculs de spéciation de ces
ions en présence de CSH.
Après cette thèse, la recherche sur les ciments devrait selon nous s'orienter suivant
ces trois axes :
- tout d'abord, il semble possible et utile dès maintenant d'élargir le nombre
d'éléments dont on veut étudier la sorption sur les CSH. En effet, nous étions limités
jusqu'à présent par le fait qu'il nous était difficile de faire la part des choses entre
sorption et précipitation dans les gammes de concentrations en éléments accessibles à
Reims. Les collaborations mises en place depuis nous permettent d'espérer pouvoir
travailler en dessous des limites de solubilité (en utilisant l'ICPMS Haute Résolution
(LCABIE) ou la radiochimie (SUBATECH, IPNO)) et ainsi pouvoir n'observer que
la sorption, pour éviter les problème liés au nombre élevé de paramètres à ajuster.
39
- Pour pouvoir rendre compte du comportement global d'un ciment, il faut
également s'intéresser aux phases mineures des ciments, comme les aluminates, les
aluminoferrites ou les phases cristallines du ciment (comme par exemple les
monosulfates), quantifier leur capacités de sorption, et vérifier s'il est possible de
considérer un ciment comme un assemblage de ces différentes phases et des phases
CSH.
- A plus long terme, il semble inévitable d'avoir à mettre en présence,
expérimentalement et par le calcul, les argiles et les CSH dans un premier temps, et
les argiles et les ciments dans un deuxième temps, aussi bien en suspension qu'au
cours d'expériences de diffusion.
En conclusion, nous pouvons dire que le but des travaux à venir est d'obtenir une
description cohérente, basée sur le même modèle théorique, de tous les matériaux
d'intérêt dans le cadre d'un stockage (y compris les silicates et les oxydes de fer
provenant de la dégradation des colis de déchets) pour pouvoir appréhender au mieux
tous les phénomènes dus à la mise en présence de tout ces matériaux différents.
Ce travail, qui contribue à une meilleure compréhension des interactions eau-solide,peut cependant être appliqué à tout problème lié au transfert d'une pollution dans lagéosphère.
40
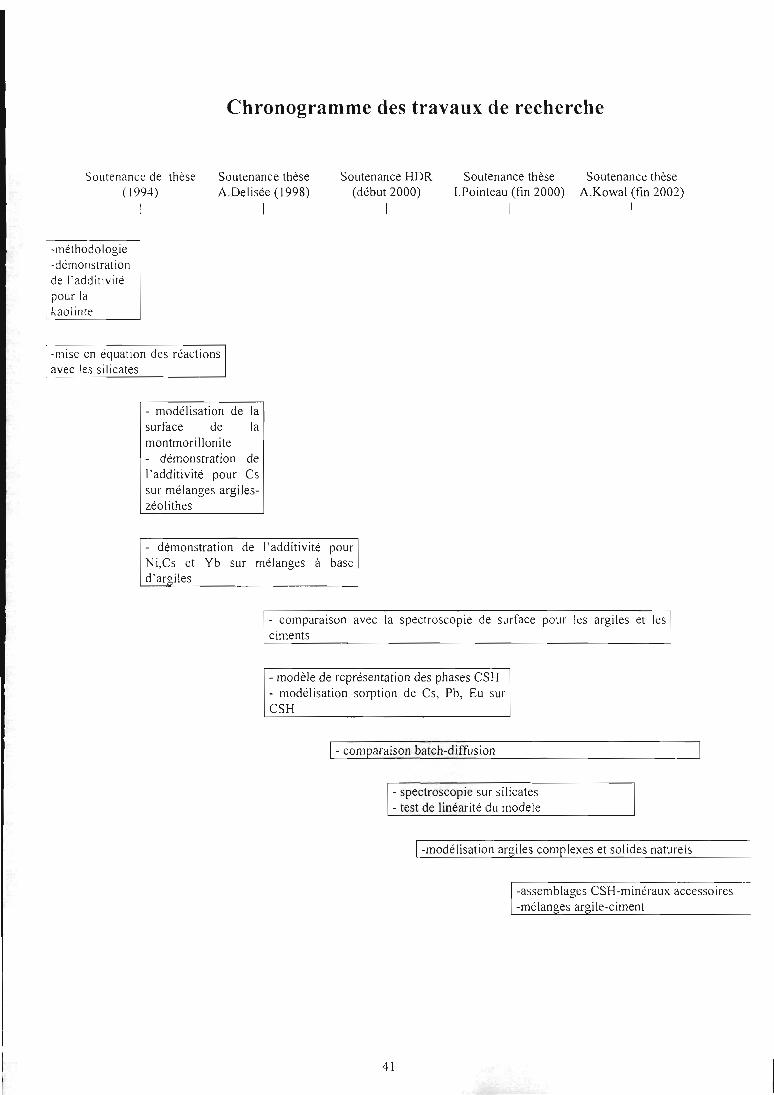
Chronogramme des travaux de recherche
Soutenance de thèse Soutenance thèse Soutenance HDR Soutenance thèse Soutenance thèse(1994) A.Delisée(1998) (début 2000) I.Pointeau (fin 2000) A.Kowal (fin 2002)
-méthodologie-démonstration
de l'additivité
pour lakaolinte
-mise en équation des réactionsavec les silicates
- modélisation de la
surface de la
montmorillonite
- démonstration de
l'additivité pour Cs
sur mélanges argi] es-
zéolithes
- démonstration de l'additivité pourNi,Cs et Yb sur mélanges à based'argiles
- comparaison avec la spectroscopie de surface pour les argiles et lesciments
- modèle de représentation des phases CSH- modélisation sorption de Cs, Pb, Eu surCSH
comparaison batch-diffusion
spectroscopie sur silicatestest de linéarité du modèle
41
-modélisation argiles complexes et solides naturels
-assemblages CSH-minéraux accessoires-mélanges argile-ciment
OUVRAGES, ARTICLES, COMMUNICATIONS.
Thèse, DEA.
Etude expérimentale en laboratoire du comportement des terres rares sur les surfaces
d'oxydes.
N.MARMIER
Mémoire de DEA de géochimie fondamentale, Université de Paris VI. (1991)
Etude expérimentale et modélisation de la fixation d'éléments en trace sur des oxydes
minéraux. Contribution à l'étude des propriétés adsorbantes des solides naturels.
N.MARMIER
Thèse de doctorat de l'Université de Reims-Champagne Ardenne, mention Chimie.
(le 15 décembre 1994).
Rapports de contrat
Etude expérimentale en laboratoire du comportement des terres rares en milieu
granitique.
J.CHUPEAU, N.MARMIER
Agence Nationale pour la gestion des Déchets RAdioactifs 1990.
Propriétés adsorbantes des oxydes simples.
N.MARMIER, J.DUMONCEAU, F.FROMAGE
Commissariat à l'Energie Atomique 1992.
Comparaison de la sorption de Cd2+ et Eu3+ sur l'alumine et la kaolinite. Evaluation
de modèles théoriques de sorption.
J.DUMONCEAU, N.MARMIER, F.FROMAGE
42
Commissariat à l'Energie Atomique 1993.
Etude des propriétés adsorbantes des matériaux solides.
I : additivité des propriétés de surfaces des oxydes simples.
F.FROMAGE, N.MARMIER, J.DUMONCEAU
Agence Nationale pour la gestion des Déchets RAdioactifs 1995.
Etude des propriétés adsorbantes des matériaux solides.
II : argiles purifiées et zéolithes.
F.FROMAGE et N.MARMIER.
Agence Nationale pour la gestion des Déchets RAdioactifs 1996.
Etude des propriétés adsorbantes des matériaux solides.
III : argiles brutes et mélanges à base d'argile.
N.MARMIER, F.FROMAGE
Agence Nationale pour la gestion des Déchets RAdioactifs 1997.
Etude expérimentale et modélisation des équilibres de sorption de Cs+, Li+, Ni
Eu , et Se03~" sur une argile brute. Evaluation prédictive des propriétés de rétention
du césium sur des mélanges argile brute/zéolithe naturelle.
N.MARMIER, F.FROMAGE
Agence Nationale pour la gestion des Déchets RAdioactifs 1998.
2 +
Communications régionales et séminaires (orales : O, et posters : P)
(O) Adsorption des lanthanides sur les surfaces d'oxyde.
N.MARMIER, J.DUMONCEAU, F.FROMAGE
Société Française de Chimie, Reims, 1990.
(O) Réactions acide-base et complexation des ions lanthanide trivalents sur les
surfaces d'hématite, de goethite et d'alumine.
N.MARMIER, J.DUMONCEAU, F.FROMAGE
Société Française de Chimie, Reims, 1992.
(O) La complexation de surface, description du mode d'acquisition des données
expérimentales.
43
N.MARMIER, J.DUMONCEAU, F.FROMAGE
CEN Fontenay aux Roses 1992.
(O) Modélisation de la sorption sur trois oxydes: l'hématite, la goethite et l'alumine.
N.MARMIER, J.DUMONCEAU, F.FROMAGE
CEN Fontenay aux Roses 1993.
(O) Etude expérimentale et modélisation de l'adsorption de l'ytterbium et du lanthane
sur la goethite et l'hématite.
N.MARMIER, J.DUMONCEAU, F.FROMAGE
Journées CEA-CNRS à 1TNSTN de Saclay 1993.
(O) Comparaison de la sorption de Cd2+ et Eu3+ sur l'alumine et la kaolinite.
Evaluation de modèles théoriques de sorption.
J.DUMONCEAU, N.MARMIER, F.FROMAGE
CEN Fontenay aux Roses 1994.
(O) Prédiction de la sorption de cations de métaux lourds sur des matériaux solides
complexes polyphasés.
E.HARDIN, N.MARMIER, J.DUMONCEAU, F.FROMAGE
Société Française de Chimie, Reims, 1994.
(O) Etude expérimentale et modélisation de la sorption du césium sur une argile :1akaolinite.
A. DELISEE, J. DUMONCEAU, F. FROMAGE et N. MARMIER
Journées annuelle de la S.F.C., Section Champagne-Ardenne, Reims, Mars 1995.
(O) Propriétés des surfaces de goethite
N. MARMIER et F. FROMAGE
Journées PRACTIS. 'Atelier Goethite', Nancy, Mai 1999.
Participations à des congrès nationaux
(O) Etude expérimentale et modélisation de l'adsorption de l'ytterbium et du lanthane
sur la goethite et l'hématite.
N.MARMIER, J.DUMONCEAU, F.FROMAGE
3ème rencontre nationale CEA-CNRS "Radiochimie et Chimie Nucléaire", Saclay,
44
1993
(O) Application des modèles de complexation de surface aux matériaux complexes.J.DUMONCEAU, N.MARMIER, F.FROMAGE
4ème rencontre nationale CEA-CNRS "Radiochimie et Chimie Nucléaire", Orléans,1994.
Etude expérimentale et modélisation de la rétention du césium sur une zéolithe.
Application à la protection de l'environnement.
N.MARMIER, A.DELISEE, F.FROMAGE, et R.C. REGIS
-(O+P) 13eme journées du groupe Français des zéolithes, Montpellier, Mars 1997-(P) Congrès de la société Française de chimie, S.F.C. 97, Bordeaux-Talence,Septembre 1997.
(P) Modélisation de la fixation d'ions sur des matériaux naturels.
N.MARMIER, A.DELISEE, R.C. REGIS, et F.FROMAGE.
2eme journées 'Simulations Numériques', Paris, Mai 1997.
(P)Additivité des propriétés de surfaces des argiles, des oxydes et des zéolithes.N.MARMIER, A.DELISEE, et F.FROMAGE.
Journées Practis 97, Villeneuve-lès-Avignon, Janvier 1998.
(P) Sorption du césium sur les phases CSH du ciment.
I.POINTEAU, N.MARMIER, F.FROMAGE, M.FEDOROFF et E.GIFFAUT.
Journées Practis 98, Villeneuve-lès-Avignon, Février 1999.
(P) Etude de la rétention du césium et de l'europium par lesphases CSH.I.POINTEAU, N.MARMIER, F.FROMAGE, M.FEDOROFF et E.GIFFAUT.
Journées scientifiques de l'ANDRA, Nancy, décembre 1999.
(P) Adsorption du Se((IV) en traces sur deux substrats solides (montmorillonite etgoethite).
F.SEBY, N.MARMIER, F.FROMAGE, A.BOURG et O.DONARD.
Journées scientifiques de l'ANDRA, Nancy, décembre 1999
Participations à des congrès internationaux et workshops .
45
(O) Sorption of ytterbium and lanthanum on goethite
J.CHUPEAU, N.MARMIER, J.DUMONCEAU, F.FROMAGE
NEA international meeting on chemical modelling of sorption in the field of
radioactive waste management, Stanford University, USA, 1993.
(P) Expérimental study and surface complexation modeling of trivalent lanthanide
ions sorption on hématite.
N.MARMIER, J.DUMONCEAU, J.CHUPEAU, F.FROMAGE
The IVth international conférence on the chemistry and migration behavior of the
actinide and fission products in the geosphere ' MIGRATION 93'. Charleston, USA
1993.
(P) Surface complexation modeling of kaolinite using single oxides parameters.
N.MARMIER, J.DUMONCEAU, J.CHUPEAU, F.FROMAGE
XVIIIth international symposium on the scientific basis for nuclear waste
managment, Kyoto, JAPON 1994.
(P) Surface complexation modelling of Yb(III) sorption and desorption on hématite
and alumina.
N.MARMIER, J.DUMONCEAU, F.FROMAGE
The Vth international conférence on the chemistry and migration behavior of the
actinide and fission products in the geosphere ' MIGRATION 95'. Saint-Malo,
Septembre 1995.
(O) Sorption of iodine and césium on some minerai oxide colloids
N.HAKEM, B.FOUREST, R.GUILLAUMONT, N.MARMIER.
The Vth international conférence on the chemistry and migration behavior of the
actinide and fission products in the geosphere ' MIGRATION 95'. Saint-Malo,
Septembre 1995.
(O) Modelling of radionuclides sorption on mixed solids using single oxides surface
complexation models.
N.MARMIER, F.FROMAGE
NEA international meeting on chemical modelling of sorption in the field of
radioactive waste management, Oxford, Grande Bretagne, Mai 1997.
46
(P) Modelling of radionuclides sorption on bentonite using single oxides surfacecomplexation models.
N.MARMIER, A.DELISEE, F.FROMAGE, E.GIFFAUT.
XXIth international symposium on the scientific basis for nuclear waste managment,Davos, Suisse, Septembre 1997.
(P) Surface complexation modelling of Cs(I), Ni(II), and Yb(III) sorption onmontmorillonite, zeolite, and their mixtures.
N.MARMIER, A.DELISEE, F.FROMAGE.
The VIth international conférence on the chemistry and migration behavior of theactinide and fission products in the geosphere ' MIGRATION 97'. Sendai, Japon,Octobre 1997.
(P) Influence of dissolved silicates on the sorptionof cations
N.MARMIER, A.DELISEE, F.FROMAGE.
The VIIth international conférence on the chemistry and migration behavior of theactinide and fission products in the geosphere ' MIGRATION 99'. Lake Tahoe,USA, Septembre 1999.
(P) Sorption of Cs(I) on bentonite and zéolithe : application to EBS design.E.GIFFAUT, N.MARMIER, F.PLAS, F.FROMAGE.
The VIIth international conférence on the chemistry and migration behavior of theactinide and fission products in the geosphere ' MIGRATION 99'. Lake Tahoe,USA, Septembre 1999.
Publications
(1) Etude expérimentale et modélisation de la sorption des ions lanthanide trivalentssur l'hématite.
N.MARMIER, J.DUMONCEAU, J.CHUPEAU, F.FROMAGE
C.R. Acad. Sci. Paris, 1993, 317, Série II, p. 311-317.
(2) Etude comparée de la sorption des ions lanthanide trivalents sur la goethite etl'hématite.
N.MARMIER, J.DUMONCEAU, J.CHUPEAU, F.FROMAGE
C.R. Acad. Sci. Paris, 1993, 317, Série II, p. 1561-1567.
47
(3) Influence des contraintes électrostatiques sur la sorption de l'ytterbium trivalentsur l'alumine.
N.MARMIER, J.DUMONCEAU, J.CHUPEAU, F.FROMAGE
C.R. Acad. Sci. Paris, 1994,318, Série II, p. 177-183.
(4) Surface complexation modeling of Yb(III) sorption and desorption on hématiteand alumina.
N.MARMIER, J.DUMONCEAU, F.FROMAGE.
Journal of Contaminant Hydrology, 26, 159-167 (1997)
(5) Modeling of Yb(III) sorption on kaolinite by using single oxide surfacecomplexation models.
N.MARMIER, J.DUMONCEAU, J.CHUPEAU, F.FROMAGE
Mat. Res. Soc. Symp. Proc. Vol. 353, p. 1085-1092. (1995).
(6) Sorption of iodine and césium on some minerai oxide colloids.
N.HAKEM, B.FOUREST, R.GUILLAUMONT, N.MARMIER.
Radiochim. Acta, 74, 225-230 (1996)
(7) Surface complexation modeling of Yb(III) and Cs(I) sorption on silica.
N.MARMIER, A.DELISEE, F.FROMAGE.
Journal of colloid and interface science, 212, 228-233 (1999)
(8) Comparing electrostatic and non-electrostatic surface complexation modeling ofthe sorption of lanthanum on hématite.
N.MARMIER, F.FROMAGE.
Journal of colloid and interface science, 212, 252-263 (1999)
(9) Surface complexation modeling of Yb(III), Ni(II), and Cs(I) sorption onmagnétite.
N.MARMIER, A.DELISEE, F.FROMAGE.
Journal of colloid and interface science, 211, 54-60 (1999)
(10) Sorption of Cs(I) on magnétite in the présence of silicates.
N.MARMIER, F.FROMAGE.
48
Journal of colloid and interface science, acceptée le 9 novembre 1999.
(11) Influence of dissolved silicates on the sorption of cations.N.MARMIER, A.DELISEE, F.FROMAGE.
Journal of Contaminant Hydrology, soumise.
Ouvrages.
Encyclopedia of Surface and Colloid Science, Marcel Dekker Eds, New York, USA.Rédaction du chapitre : 'Métal ion adsorption on silica, alumina and relatedsurfaces'. A paraître.
49
ANNEXES
50
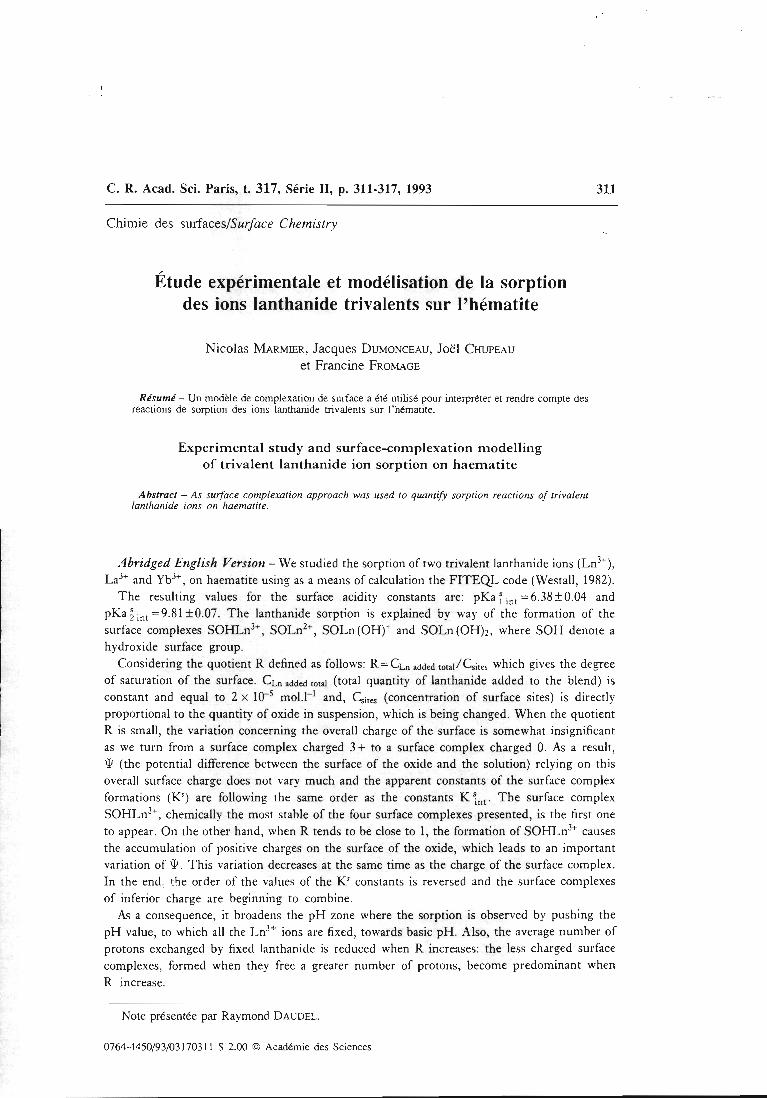
C. R. Acad. Sci. Paris, t. 317, Série II, p. 311-317, 1993 311
Chimie des surfaces/Surface Chemistry
Étude expérimentale et modélisation de la sorptiondes ions lanthanide trivalents sur l'hématite
Nicolas Marmœr, Jacques Dumonceau, Joël Chupeauet Francine Fromage
Résumé - Un modèle de complexation de surface a été utilisé pour interpréter et rendre compte desréactions de sorption des ions lanthanide trivalents sur l'hématite.
Expérimental study and surface-complexation modellingof trivalent lanthanide ion sorption on haematite
Abstract - As surface complexation approach was used to quantify sorption reactions of trivalentlanthanide ions on haematite.
Abridged English Version - We studied the sorption of two trivalent lanthanide ions (Ln3+),La3+ and Yb3+, on haematite usingas a means of calculation the FITEQL code (Westall, 1982).
The resulting values for the surface acidity constants are: pKa \ int=6.38 ±0.04 andpKajint =9.81 ±0.07. The lanthanide sorption is explained by way of the formation of thesurface complexes SOHLn3+, SOLn2+, SOLn(OH)+ and SOLn(OH)2, where SOH dénote ahydroxide surface group.
Considering the quotient R defined as follows: R = Clh added totai/Csites which gives the degreeof saturation of the surface. Cu, added total (total quantity of lanthanide added to the blend) isconstant and equal to 2 x 10~5 mol.l"1 and, Csites (concentration of surface sites) is directlyproportional to the quantity of oxide in suspension, which is being changed. When the quotient
R is small, the variation concerning the overall charge of the surface is somewhat insignificantas we turn from a surface complex charged 3+ to a surface complex charged 0. As a resuit,
ty (the potential différence between the surface of the oxide and the solution) relying on thisoverall surface charge does not vary much and the apparent constants of the surface complexformations (Ks) are following the same order as the constants Ksint. The surface complexSOHLn3+, chemically the most stable of the four surface complexes presented, is the first oneto appear. On the other hand, when R tends to be close to 1, the formation of SOHLn3+ causesthe accumulation of positive charges on the surface of the oxide, which leads to an importantvariation of Vf. This variation decreases at the same time as the charge of the surface complex.In the end, the order of the values of the KJ constants is reversed and the surface complexesof inferior charge are beginning to combine.
As a conséquence, it broadens the pH zone where the sorption is observed by pushing thepH value, to which ail the Ln3+ ions are fixed, towards basic pH. Also, the average number ofprotons exchanged by fixed lanthanide is reduced when R increases: the less charged surfacecomplexes, formed when they free a greater number of protons, become prédominant whenR increase.
Note présentée par Raymond DAUDEL.
0764-4450/93/03170311 $ 2.00 © Académie des Sciences
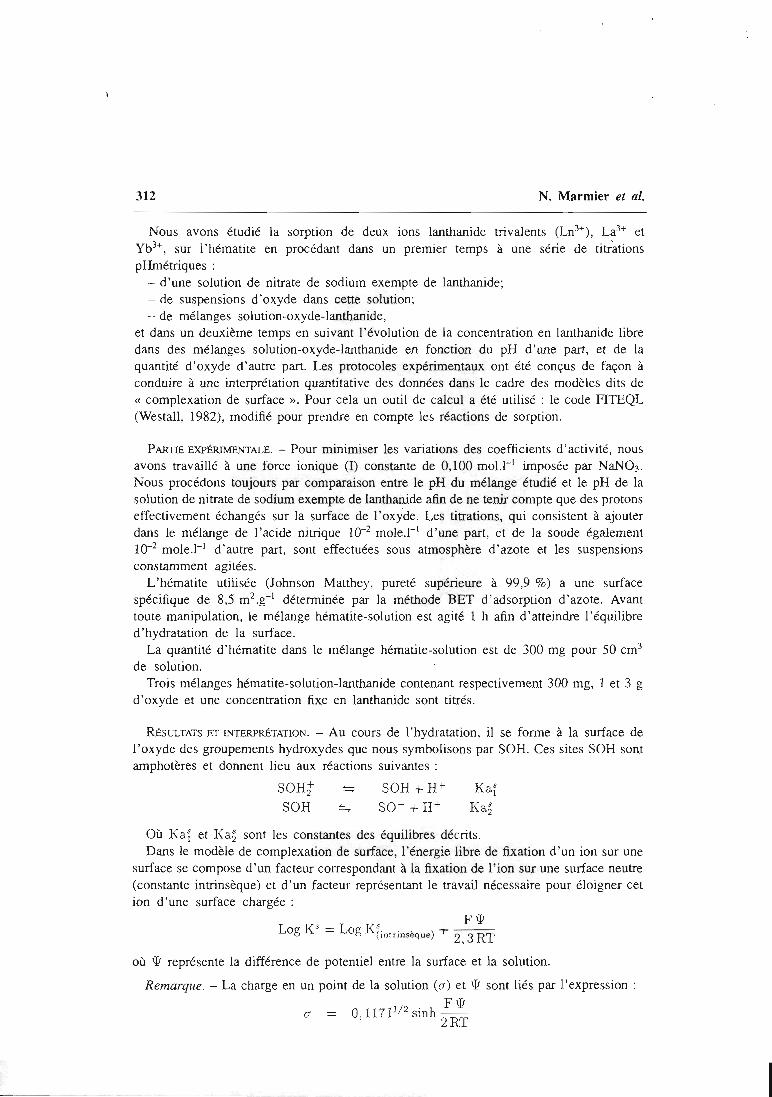
312 N. Marinier et al.
Nous avons étudié la sorption de deux ions lanthanide trivalents (Ln3+), La3+ etYb3+, sur l'hématite en procédant dans un premier temps à une série de titrationspHmétriques :
- d'une solution de nitrate de sodium exempte de lanthanide;- de suspensions d'oxyde dans cette solution;- de mélanges solution-oxyde-lanthanide,
et dans un deuxième temps en suivant l'évolution de la concentration en lanthanide libredans des mélanges solution-oxyde-lanthanide en fonction du pH d'une part, et de laquantité d'oxyde d'autre part. Les protocoles expérimentaux ont été conçus de façon àconduire à une interprétation quantitative des données dans le cadre des modèles dits de« complexation de surface ». Pour cela un outil de calcul a été utilisé : le code FITEQL(Westall, 1982), modifié pour prendre en compte les réactions de sorption.
Partie expérimentale. - Pour minimiser les variations des coefficients d'activité, nous
avons travaillé à une force ionique (I) constante de 0,100 mol.L1 imposée par NaN03.Nous procédons toujours par comparaison entre le pH du mélange étudié et le pH de lasolution de nitrate de sodium exempte de lanthanide afin de ne tenir compte que des protonseffectivement échangés sur la surface de l'oxyde. Les titrations, qui consistent à ajouterdans le mélange de l'acide nitrique 10~2 mole.r1 d'une part, et de la soude également10~2 mole.L1 d'autre part, sont effectuées sous atmosphère d'azote et les suspensionsconstamment agitées.
L'hématite utilisée (Johnson Matthey, pureté supérieure à 99,9 %) a une surfacespécifique de 8,5 m2.g-1 déterminée par la méthode BET d'adsorption d'azote. Avanttoute manipulation, le mélange hématite-solution est agité 1 h afin d'atteindre l'équilibred'hydratation de la surface.
La quantité d'hématite dans le mélange hématite-solution est de 300 mg pour 50 cm3de solution.
Trois mélanges hématite-solution-lanthanide contenant respectivement 300 mg, 1 et 3 gd'oxyde et une concentration fixe en lanthanide sont titrés.
Résultats et interprétation. - Au cours de l'hydratation, il se forme à la surface del'oxyde des groupements hydroxydes que nous symbolisons par SOH. Ces sites SOH sontamphotères et donnent lieu aux réactions suivantes :
SOH+ == SOH + H+ Ka*
SOH ±= SO- + H+ Ka^
Où KaJ et Kaj sont les constantes des équilibres décrits.Dans le modèle de complexation de surface, l'énergie libre de fixation d'un ion sur une
surface se compose d'un facteur correspondant à la fixation de l'ion sur une surface neutre(constante intrinsèque) et d'un facteur représentant le travail nécessaire pour éloigner cetion d'une surface chargée :
F\PLog Ks = Log K(e]ntrinsèque) + 2 3RT
où \P représente la différence de potentiel entre la surface et la solution.
Remarque. - La charge en un point de la solution (a) et \P sont liés par l'expression :
a = 0,117I1/2sinh2RT
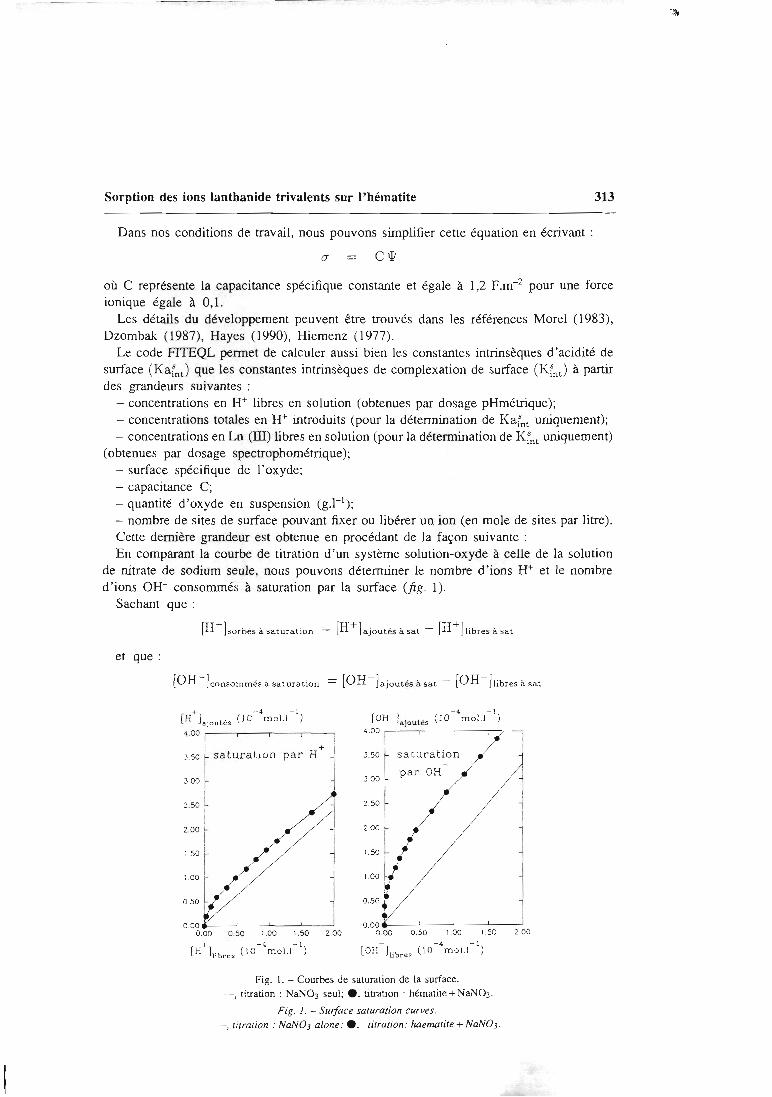
Sorption des ions lanthanide trivalents sur l'hématite 313
Dans nos conditions de travail, nous pouvons simplifier cette équation en écrivant :
a = C*
où C représente la capacitance spécifique constante et égale à 1,2 F.m"2 pour une forceionique égale à 0,1.
Les détails du développement peuvent être trouvés dans les références Morel (1983),Dzombak (1987), Hayes (1990), Hiemenz (1977).
Le code FITEQL permet de calculer aussi bien les constantes intrinsèques d'acidité desurface (Kafnt) que les constantes intrinsèques de complexation de surface (Kfnt) à partirdes grandeurs suivantes :
- concentrations en H+ libres en solution (obtenues par dosage pHmétrique);- concentrations totales en H+ introduits (pour la détermination de Kafnt uniquement);- concentrations enLn (III) libres ensolution (pour ladétermination de Kfnt uniquement)
(obtenues par dosage spectrophométrique);- surface spécifique de l'oxyde;- capacitance C;
- quantité d'oxyde en suspension (g.l-1);- nombre de sites de surface pouvant fixer ou libérer un ion (en mole de sites par litre).Cette dernière grandeur est obtenue en procédant de la façon suivante :En comparant la courbe de titration d'un système solution-oxyde à celle de la solution
de nitrate de sodium seule, nous pouvons déterminer le nombre d'ions H+ et le nombred'ions OH~ consommés à saturation par la surface (fig. 1).
Sachant que :
[ri Jsorbés à saturation = [ti Jajoutésàsat — [H Jlibresàsat
et que :
[OH" saturation — [wx! Jajout] consommes a [OH-]ubres à sat
4.00 ..00
0.00 0.50 .00 1.50 2.00 0.50 1.00 1.50 2.00
tH+W« (10"4mol.l_1) [°H~Ws (I0"4mol.l_1)
Fig. 1. - Courbes de saturation de la surface.
—, titration : NaN03 seul; •. titration : hématite+ NaN03.
Fig. J. - Surface saturation curves.--, titration : NaNÛ3 alone; 9. titration: haematite + NaNO}.
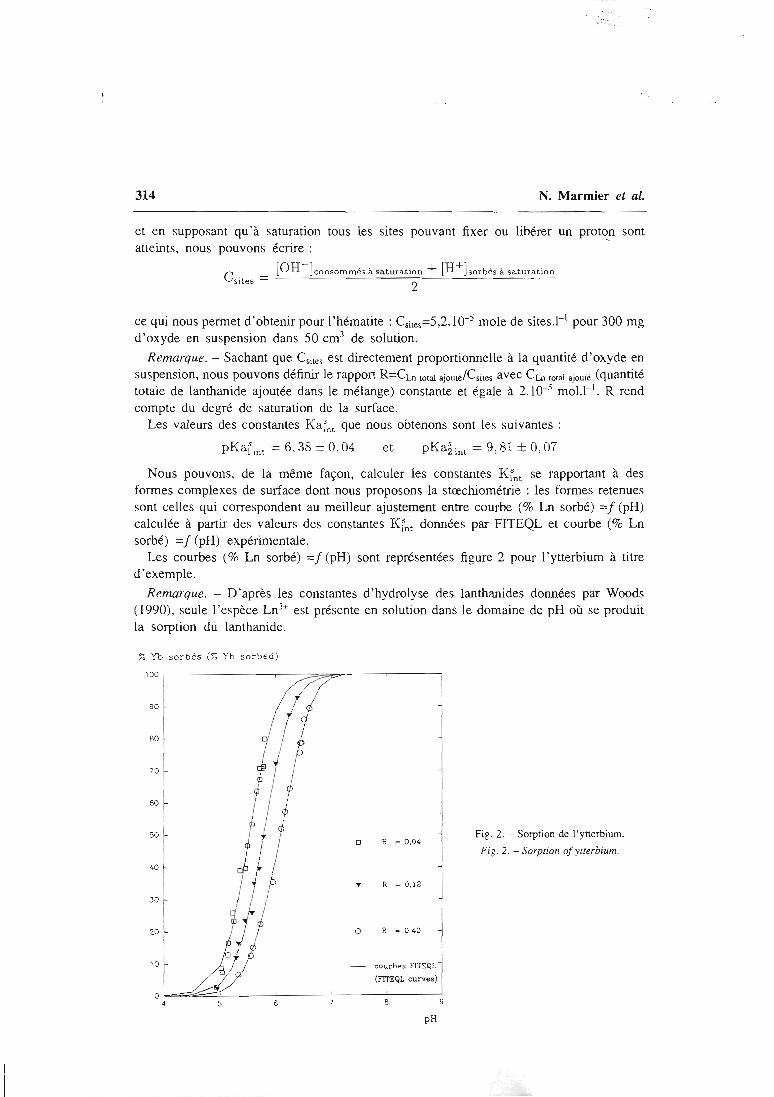
314 N. Marmier et al.
et en supposant qu'à saturation tous les sites pouvant fixer ou libérer un proton sontatteints, nous pouvons écrire :
[^rl Jconsommés à saturation T [Hc. Jsorbes à saturation
cequi nous permet d'obtenir pour l'hématite : Csites=5,2.10-5 mole de sites.L1 pour 300 mgd'oxyde en suspension dans 50 cm3 de solution.
Remarque. - Sachant que Csites est directement proportionnelle à la quantité d'oxyde ensuspension, nous pouvons définir le rapport R=CLn total ajouté/Csltes avec CLn total ajouté (quantitétotale de lanthanide ajoutée dans le mélange) constante et égale à 2.10"5 mol.L1. R rendcompte du degré de saturation de la surface.
Les valeurs des constantes Kafnt que nous obtenons sont les suivantes :
pKafint =6,38 ±0,04 et pKa|int = 9,81 ± 0,07
Nous pouvons, de la même façon, calculer les constantes Kfnt se rapportant à desformes complexes de surface dont nous proposons la stoechiométrie : les formes retenuessont celles qui correspondent au meilleur ajustement entre courbe (% Ln sorbe) =/ (pH)calculée à partir des valeurs des constantes Kfnt données par FTTEQL et courbe (% Lnsorbe) =/(pH) expérimentale.
Les courbes (% Ln sorbe) =/(pH) sont représentées figure 2 pour l'ytterbium à titred'exemple.
Remarque. - D'après les constantes d'hydrolyse des lanthanides données par Woods(1990), seule l'espèce Ln3+ est présente en solution dans le domaine de pH où se produitla sorption du lanthanide.
% Yb sorbes (% Yb sorbed)
100
O R = 0.40
courbes FITEQL'
(FITEQL curves)
pH
Fig. 2. - Sorption de l'ytterbium.
Fig. 2. - Sorption of ytterbium.
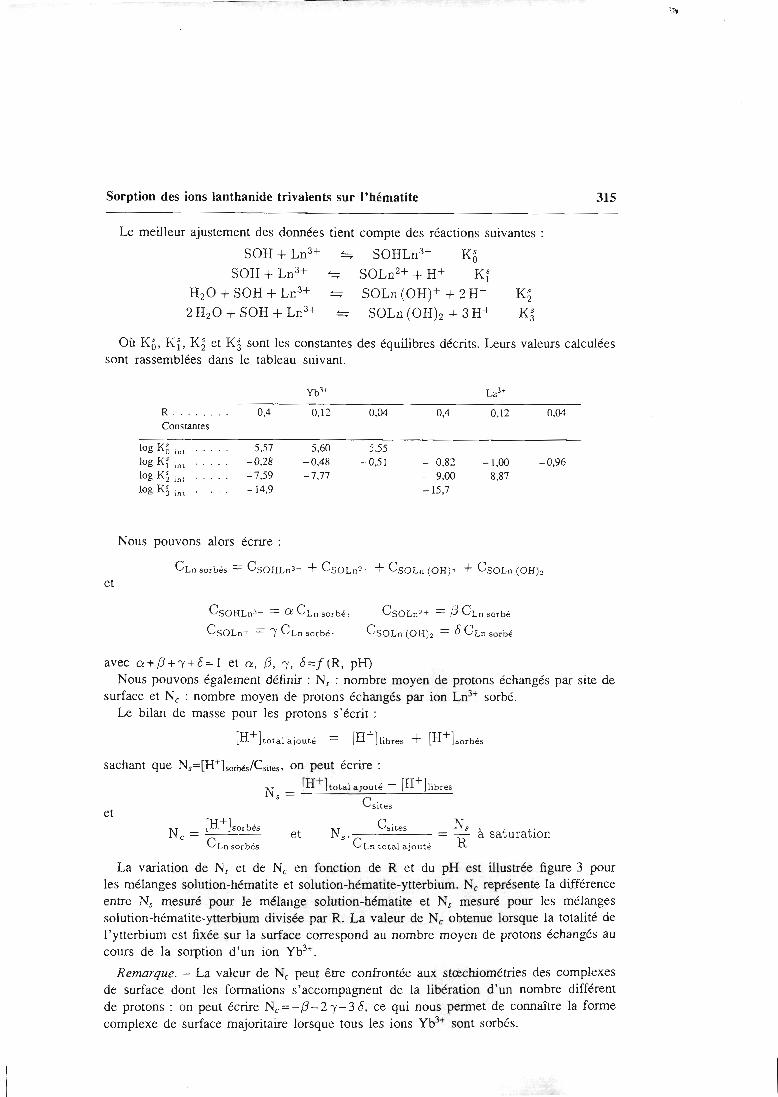
Sorption des ions lanthanide trivalents sur l'hématite 315
Le meilleur ajustement des données tient compte des réactions suivantes :SOH + Ln3+ ±= SOHLn3+ Kg
SOH + Ln3+ ts9 SOLn2+-f-H+ K|H20 + SOH + Ln3+ == SOLn (OH)++ 2H+ K|2H20 + SOH + Ln3+ == SOLn(OH)2 + 3H+ K|
Où Kg, Kf, K^ et K| sont les constantes des équilibres décrits. Leurs valeurs calculéessont rassemblées dans le tableau suivant.
Yb3+ La3+
et
R 0.4 0,12 0,04 0,4 0,12 0,04Constantes
loÊ Kg int 5,57 5,60 5.55logKï,m -0,28 -0,48 -0.51 -0,82 -1,00 -0,96logK2mt -7.59 -7,77 _ 9,00 -8 87logK^m, -14,9 -15,7
Nous pouvons alors écrire :
Cxn sorbes = CSOHLn3+ + CSOLn=- + CSOLn (OH)+ + CSOLn (OH)2
CSOHLn3- = a CLn sorbé, CSOLn2+ = 0 CLn sorbeCsOLn+ = iCLnsorbé- CSOLn (OH)2 = <5 Cr^n sorbé
avec a +P+7+S=l et a, 0, 7, <5=/(R, pH)Nous pouvons également définir : N, : nombre moyen de protons échangés par site de
surface et Nc : nombre moyen de protons échangés par ion Ln3+ sorbé.Le bilan de masse pour les protons s'écrit :
[H Jtotal ajouté = [H~]Ubres + [H+]sorbés
sachant que N,=[H+]sorbés/Csites, on peut écrire :
at __ [Il Jtotal ajouté ~ [H Jlibres5 — C •
et SItes
M - R Jsorbés M Csites NsiNc — p et JNS-— = —- a saturation
^Ln sorbes ^Ln total ajouté R
La variation de N, et de Nc en fonction de R et du pH est illustrée figure 3 pourles mélanges solution-hématite et solution-hématite-ytterbium. Nc représente la différenceentre N, mesuré pour le mélange solution-hématite et Ns mesuré pour les mélangessolution-hématite-ytterbium divisée par R. La valeur de Nc obtenue lorsque la totalité del'ytterbium est fixée sur la surface correspond au nombre moyen de protons échangés aucours de la sorption d'un ion Yb3+.
Remarque. - La valeur de Nc peut être confrontée aux stœchiométries des complexesde surface dont les formations s'accompagnent de la libération d'un nombre différentde protons : on peut écrire Nc=-f3-2j-36, ce qui nous permet de connaître la formecomplexe de surface majoritaire lorsque tous les ions Yb3+ sont sorbes.
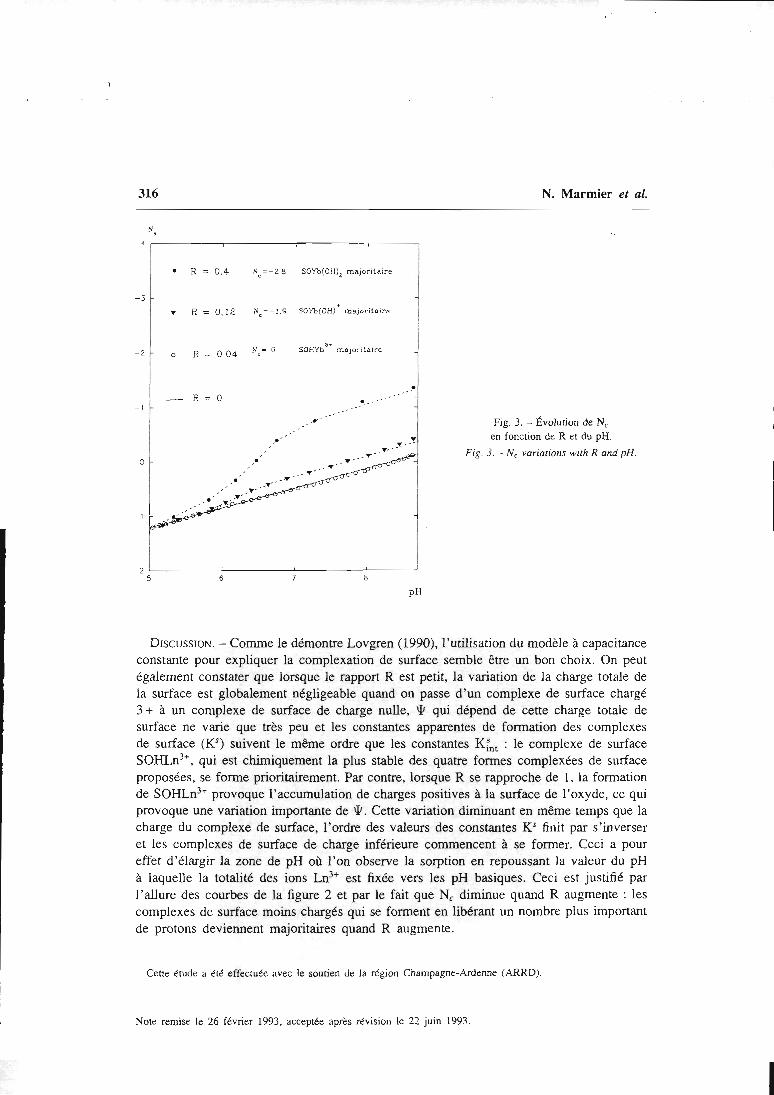
316
R = 0,4 Nc=-2.8 S0Yb(0H)2 majoritaire
R = 0,12 N =-1,9 SOYb(OH) majoritaire
o R = 0.04N = 0 SOHYb majoritaire
R = 0
PH
N. Marmier et al.
Fig. 3. - Évolution de Ncen fonction de R et du pH.
Fig. 3. -Nc variations with R and pH.
Discussion. - Comme le démontre Lovgren (1990), l'utilisation du modèle à capacitanceconstante pour expliquer la complexation de surface semble être un bon choix. On peutégalement constater que lorsque le rapport R est petit, la variation de la charge totale dela surface est globalement négligeable quand on passe d'un complexe de surface chargé3+ à un complexe de surface de charge nulle, \P qui dépend de cette charge totale desurface ne varie que très peu et les constantes apparentes de formation des complexesde surface (K1) suivent le même ordre que les constantes Kfnt : le complexe de surfaceSOHLn3+, qui est chimiquement la plus stable des quatre formes complexées de surfaceproposées, se forme prioritairement. Par contre, lorsque R se rapproche de 1, la formationde SOHLn3+ provoque l'accumulation de charges positives à la surface de l'oxyde, ce quiprovoque une variation importante de *. Cette variation diminuant en même temps que lacharge du complexe de surface, l'ordre des valeurs des constantes K* finit par s'inverseret les complexes de surface de charge inférieure commencent à se former. Ceci a poureffet d'élargir la zone de pH où l'on observe la sorption en repoussant la valeur du pHà laquelle la totalité des ions Ln3+ est fixée vers les pH basiques. Ceci est justifié parl'allure des courbes de la figure 2 et par le fait que Nf diminue quand R augmente : lescomplexes de surface moins chargés qui se forment en libérant un nombre plus importantde protons deviennent majoritaires quand R augmente.
Cette étude a été effectuée avec le soutien de la région Champagne-Ardenne (ARRD).
Note remise le 26 février 1993, acceptée après révision le 22 juin 1993.
Sorption des ions lanthanide trivalents sur l'hématite 317
RÉFÉRENCES BIBLIOGRAPHIQUES
D. A. DZOMBAK, A. M. ASCE et F. M. M. MOREL, Adsorption of inorganic polluants in aquaùcs Systems, J. of HydraulicEngineering. 19, 1987, p. 183-216.
K. F. HAYES, G. REDDEN, E. WENDELL et J. O. LECKIE, Surface Complexation Models: an évaluation of model parameterestimation using FITEQL and oxide minerai titration data, J. of Colloid and Interface Science, 142, n° 2, 1990, p. 448-469.
P. C. HTEMENZ, Principles of colloid and surface chemistry, Marcel Dekker Inc. New York. 1977.L. LOVGREN, S. SJOBERG et P. W. SCHJNDLER, Acid/base reactions and Al (IH) complexation at the surface of goethite,
Geochimica and Cosmochimica acta, 54, 1990, p. 1301-1306 F. M. M. MOREL, Principles of aquatic chemistry, John Wileyand Sons, 1983 446 p.
J. C. WESTALL, FITEQL: a programfor the détermination of chemical equilibriumconstants from expérimentaldata, User'sguide, version 1.2. Chemistry department, Oregon State University, Corvallis, Oregon, 1982.
A. WOODS, The aqueous geochemistry of the rare-earth éléments and yttrium. 1. Review of available low-temperature data forinorganic complexes and the inorganic REE spéciation of natural waters, Chemicalgeology, 82, 1990, p. 159-186.
N. M., J. D. et F. F. : Faculté des Sciences de Reims, Laboratoire de Chimie de Coordination,BP n° 347, 51062 Reims Cedex, France.
N. M. et J. C. : CEA, CEN, Fomenay-aux-Roses, DCCIDSD/SCSILCASH,Bât n° 02, BP n° 6, 92265 Fomenay-aux-Roses Cedex, France.

ARTICLE N°2
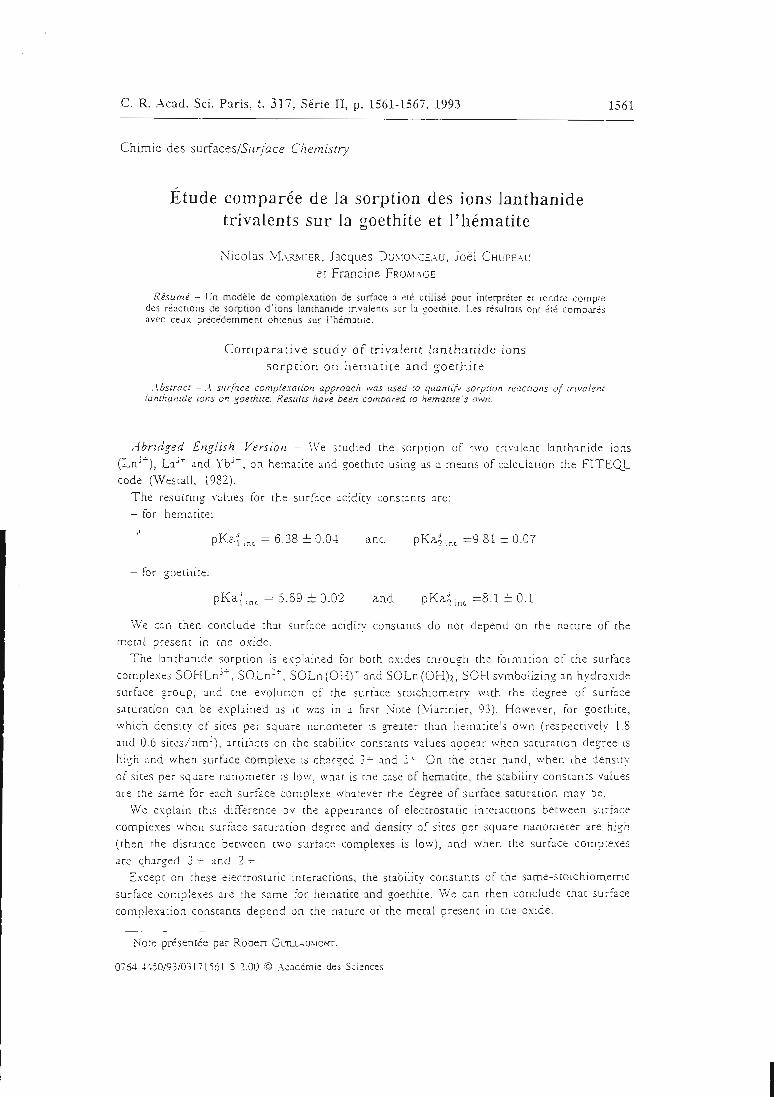
C. R. Acad. Sci. Paris, t. 317, Série II, p. 1561-1567, 1993 1561
Chimie des surfaces/Sur/ace Chemistry
Étude comparée de la sorption des ions lanthanidetrivalents sur la goethite et l'hématite
Nicolas Marmier, Jacques DuMONCEAU, Joël Chupeal'et Francine Fromage
Résumé - Un modèle de complexation de surface a été utilisé pour interpréter et rendre comptedes réactions de sorption d'ions lanthanide trivalents sur la goethite. Les résultats ont été comparésavec ceux précédemment obtenus sur l'hématite.
Comparative srudy of trivalent lanthanide ionssorption on hématite and goethite
Abstract - A surface complexation approach was used to quantify sorption reactions of trivalentlanthanide ions on goethite. Results hâve been comparée :o hématite's own.
Abridged English Version - We studied the sorption of two trivalent lanthanide ions(LnJ+), La-"' and Yb0"1", on hématite and goethite using as a means of calculation the FITEQLcode (Westall, 1982).
The resulting values for the surface acidity constants are:
- for hématite:
pKaJint = 6.38 ±0.04 and pKa|int =9.81 = 0.07
- for goethite:
pKa?iM = 5.69 ±0.02 and pKa^int =8,1 ± 0.1
We can then conclude that surface acidity constants do not dépend on the nature of the
métal présent in the oxide.
The lanthanide sorption is explained for both oxides through the formation of the surfacecomplexes SOHLn3\ SOLir*, SOLn(OH)" and SOLn(OH)2, SOH svmbolizing an hydroxidesurface group, and the évolution of the surface stoichiometry with the degree ot surfacesaturation can be explained as it was in a first Note (Marinier, 93). However, for goethite,which density of sites per square nanometer is greater than hematite's own (respectively 1.8and 0,6 sites/nnv), artifacts on the stability constants values appear when saturation degree ish;gh and when surface complexe is charged 3+ and 2+, On the other hand, when the denskyof sites per square nanometer is low, what is the case of hématite, the stability constants values
are the same for each surface complexe whatever the degree of surface saturation may be.We explain this différence by the appearance of electrostatic interactions between surface
complexes when surface saturation degree and density of sices per square nanometer are high(then the distance between two surface complexes is low), and when the surtace complexes
are charged 3+ and 2+.Except on thèse electrostatic interactions, the stability constants of the same-stoichiometnc
surface complexes are the same for hématite and goethite. We can then conclude that surtacecomplexation constants dépend on the nature of the métal présent in the oxide.
Note présentée par Robert Gutllaumont.
0764-4450/93/03171561 S 2.00 © Académie des Sciences
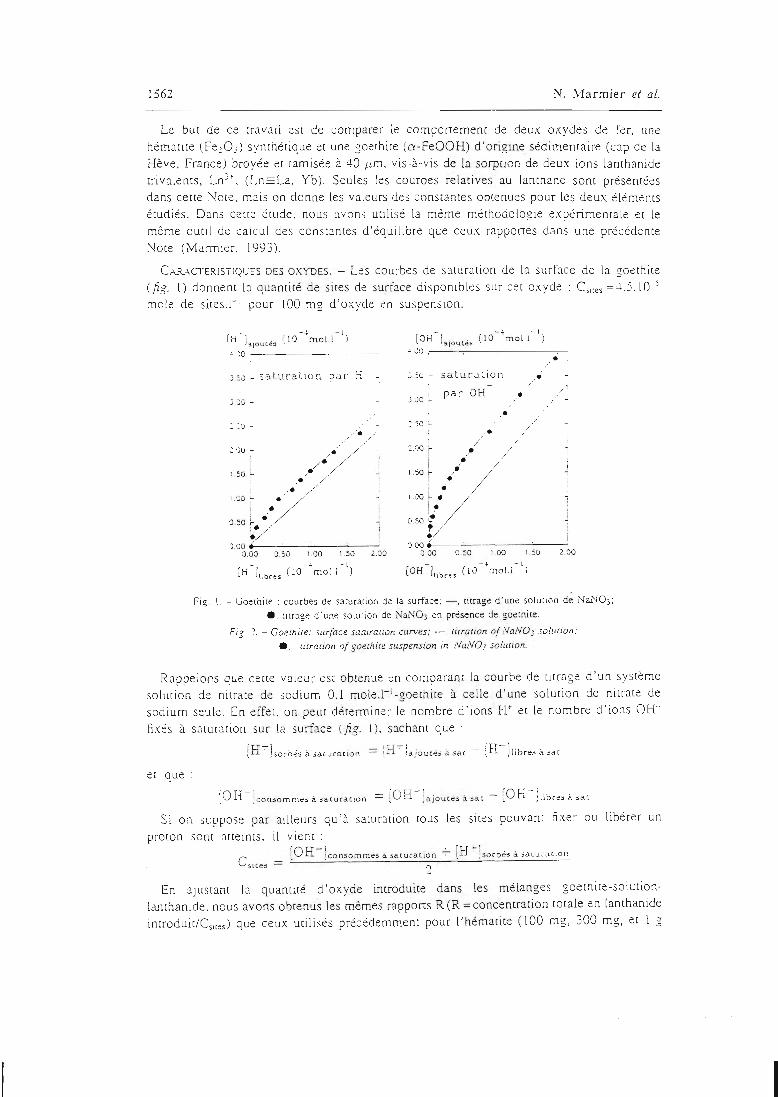
1562 N. Marmier et al.
Le but de ce travail est de comparer le comportement de deux oxydes de fer, unehématite (Fe^Oj) synthétique et une goethite (a-FeOOH) d'origine sédimentaire (cap de laHève, France) broyée et tamisée à 40 /.im. vis-à-vis de la sorption de deux ions lanthanidetrivalents, Ln'+, (Ln=La. Yb). Seules les courbes relatives au lanthane sont présentéesdans cette Note, mais on donne les valeurs des constantes obtenues pour les deux éléments
étudiés. Dans cette étude, nous avons utilisé la même méthodologie expérimentale et lemême outil de calcul des constantes d'équilibre que ceux rapportés dans une précédenteNoce (Marmier. 1993).
Caractéristiques des oxydes. - Les courbes de saturation de la surface de la goethite(fig. 1) donnent la quantité de sues de surface disponibles sur cet oxyde : Q^s -4.5.10"3mole de sites.!-1 pour 100 mg d'oxyde en suspension.
. .» - 00 , :
s.«û - saturatio-n par H - 3.50- saturation
par OH~3 00 -
: so -
2.00 Y
I1.50 H
m
«
1.00 I- •
0.50 g" /
V0 00 1
p
1.50 2.00 0 00 0,50 '00 l 50
libres(I0"4mol.l l) i°H"],ibres (t0"4nwU~ )
Fig. I. - Goethite : courbes de saturation de la surface; —, titrage d'une solution de NaNOj;• . titrage d'une solution de NaNOj en présence de goethite.
Fig. 2. - Goethite: surface saturation curves: —, titration of NaNO; solution:• . titration of goethite suspension m NaNO? solution.
Rappelons que cette valeur est obtenue en comparant la courbe de titrage d'un systèmesolution de nitrate de sodium 0.1 mole.L1-goethite à celle d'une solution de nitrate desodium seule. En effet, on peut déterminer le nombre d'ions H+ et le nombre d'ions OH-fixés à saturation sur la surface (fig. 1), sachant que :
[*•* jsornés Àsacuraaon — {** .'ajoutés à 5ae t^i ^librejàsat
et que :
Ufl ^consommes à saturation = ^Utl ;ajoutésàsac ~ <\Jl1 jlibresàiat
Si on suppose par ailleurs qu'à saturation tous les sues pouvant fixer ou libérer unproton sont atteints, il vient :
~, _ [Ufl ^consommes a maturation ~ l.^a ' jsorbés à saturation^sites — ' ~~g
En ajustant la quantité d'oxyde introduite dans les mélanges goethite-solution-lanthanide. nous avons obtenus les mêmes rapports R(R =concentration totale en lanthanideintroduit/C5l[es) que ceux utilisés précédemment pour l'hématite (100 mg, 300 mg, et l g
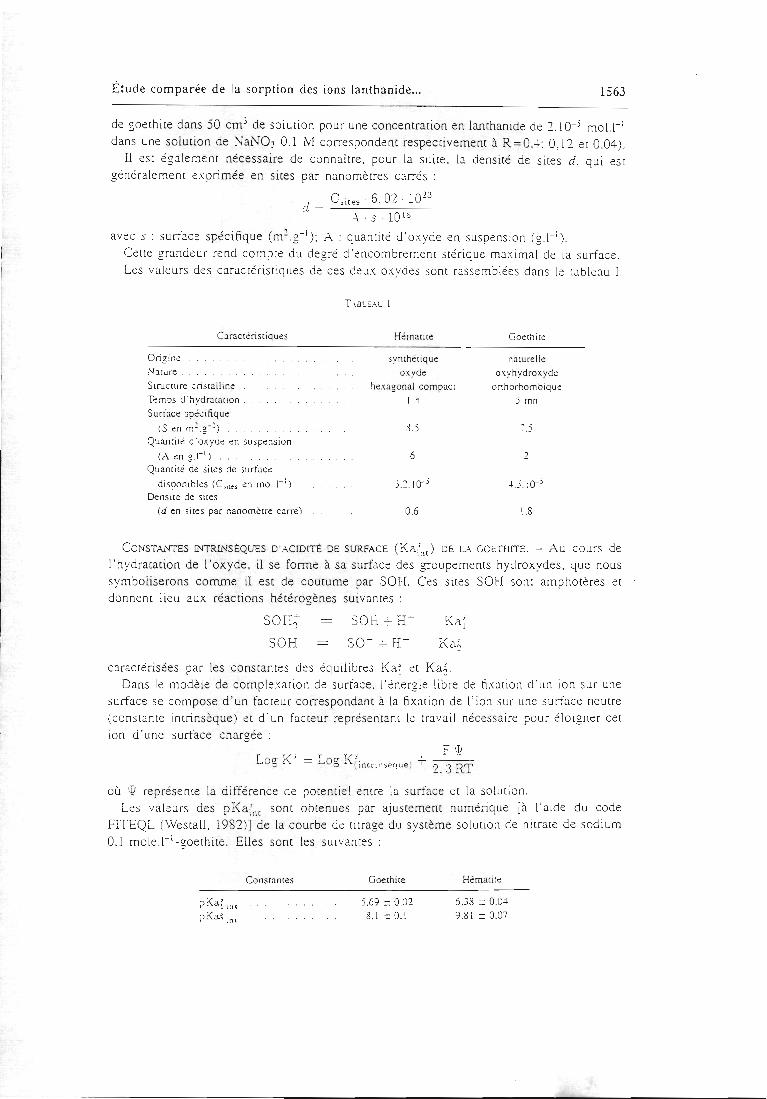
Étude comparée de la sorption des ions lanthanide... 1563
de goethite dans 50 cnr' de solution pour une concentration en lanthanide de 2.10"3 mol.L1dans une solution de NaNOi 0,1 M correspondent respectivement à R = 0,4: 0,12 et 0,04).
Il est également nécessaire de connaître, pour la suite, la densité de sites d. qui estgénéralement exprimée en sites par nanomètres carrés :
. Csl[es-6.02-1023a = n
A • s • 10lâ
avec s : surface spécifique (m2.g-'); A : quantité d'oxyde en suspension (g.L1).Cette grandeur rend compte du degré d'encombrement stérique maximal de la surface.Les valeurs des caractéristiques de ces deux oxydes sont rassemblées dans le tableau I.
Tableau I
Caractéristiques Hématite Goethite
Ongine synthétique naturelle.Mature oxyde oxyhydroxyde
Structure cristalline hexagonal compact orthorhombique
Temps d'hydratation I h 5 mnSurtace 'Spécifique
(S en m:.g-:) S.5 7.5Quantité d'oxyde en suspension
(A en g.r') 6 2Quantité de sites de surface
disponibles (Cim* «l tnolJ"1) 5.2. 10'5 4.5.10-5Densité de sites
(d en sites par nanomètre carrél 0.6 1,8
Constantes intrinsèques d'acidité de surface (Kafnt) de la goethite. - Au cours del'hydratation de l'oxyde, il se forme à sa surface des groupements hydroxydes, que noussymboliserons comme il est de coutume par SOH. Ces sites SOH sont amphoteres etdonnent lieu aux réactions hétérogènes suivantes :
SOH7 = SOH-H" Kaj
SOH = 50" - H- Kaj
caractérisées par les constantes des équilibres Ka{ et Ka4.Dans le modèle de complexation de surface, l'énergie libre de fixation d'un ion sur une
surface se compose d'un facteur correspondant à la fixation de l'ion sur une surface neutre(constante intnnsèque) et d'un facteur représentant le travail nécessaire pour éloigner cetion d'une surface chargée :
L-O-, ^ ^^o ""(intrinsèque) q 0 pn-1
où {i représence la différence de potentiel entre la surface et la solution.Les valeurs des pKafnc sont obtenues par ajustement numérique [à l'aide du code
FITEQL (Westall, 1982)] de la courbe de titrage du système solution de nitrate de sodium0.1 mole.L'-aoethite. Elles sont les suivantes :
Constances Goethite Hématite
5,69 - 0.02 6,38 - 0.04
PKa-2:nc 3,1 - 0.1 9.81 = 0,07
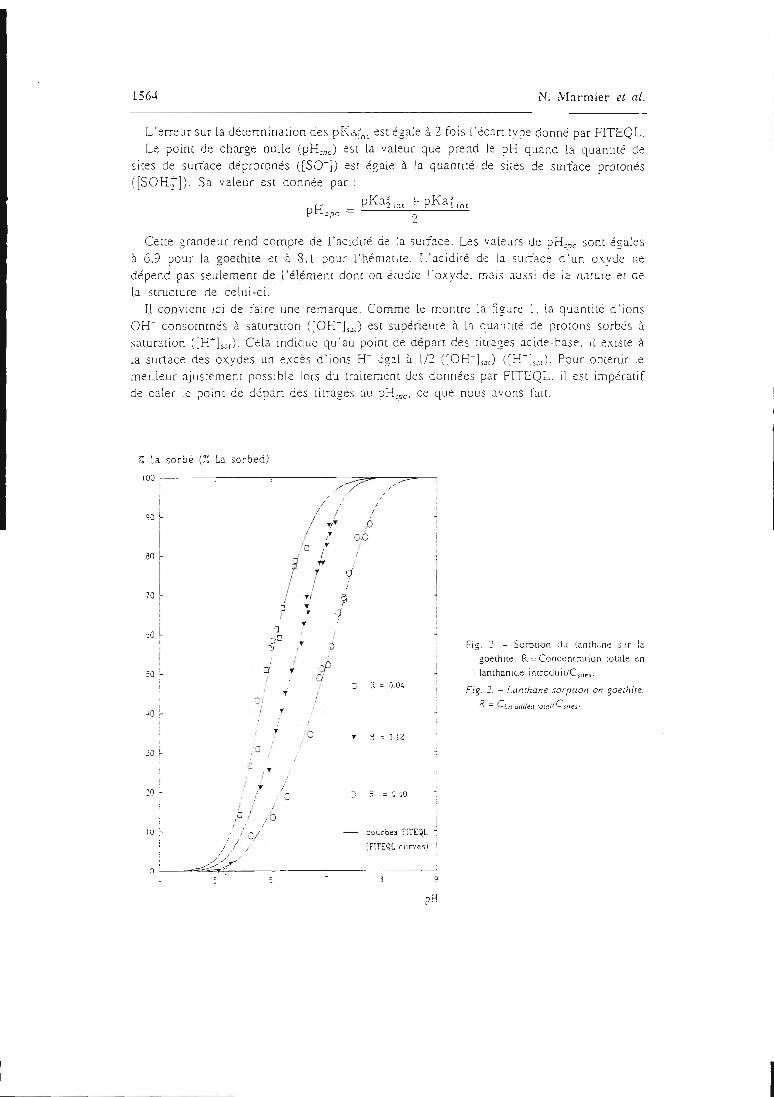
1564 N. Marmier et ai.
L'erreur sur la déterminationdes pKafnt est égale à 2 fois l'écart type donné par FITEQL.Le point de charge nulle (pH_-0C) est la valeur que prend le pH quand la quantité de
sites de surface déprotonés ([SO~]) est égale à la quantité de sites de surface protonés([SOHT]). Sa valeur est donnée par :
oW PKa2mc -PKâJm.PH-pc = 2
Cette grandeur rend compte de l'acidité de la surface. Les valeurs de pHrp<: sont égalesà 6,9 pour la goethite et à 8.1 pour l'hématite. L'acidité de la surface d'un oxyde nedépend pas seulement de l'élément dont on étudie l'oxyde, mais aussi de la nature et dela structure de celui-ci.
Il convient ici de faire une remarque. Comme le montre la figure 1, la quantité d'ionsOH" consommés à saturation ([OH~]sa() est supérieure à la quantité de protons sorbes àsaturation ([H+]sat). Cela indique qu'au point de départ des titrages acide-base, il existe àla surface des oxydes un excès d'ions H* égal à 1/2 ([OH~]sa[)-([H"]s;u). Pour obtenir lemeilleur ajustement possible lors du traitement des données par FITEQL. il est impératifde caler le point de départ des titrages au pH-0C, ce que nous avons fait.
La sorbé (% La sorbed)
' s"*/^ /^/ / /
/
in f L (/ r/" .0/ <T oca y
m J 1 13 rI J o
70 1 f lf } 4
V) î r /'f r é
50-J r CP
Cl3 S = 0.04
iO
J0
/ T
Y
/
/ /o
y
S = 040
courbes FfTEQL **
(HTEQL cur/esj I
pH
Fig. 2. - Sorption du lanthane sur la
goethite. R = Concentration totale en
lanthanide introduit/Cs,[CS.
Fig. 2. - Lanthane sorption on goethite.
rt — l~ln uaded '.omitCi[les.
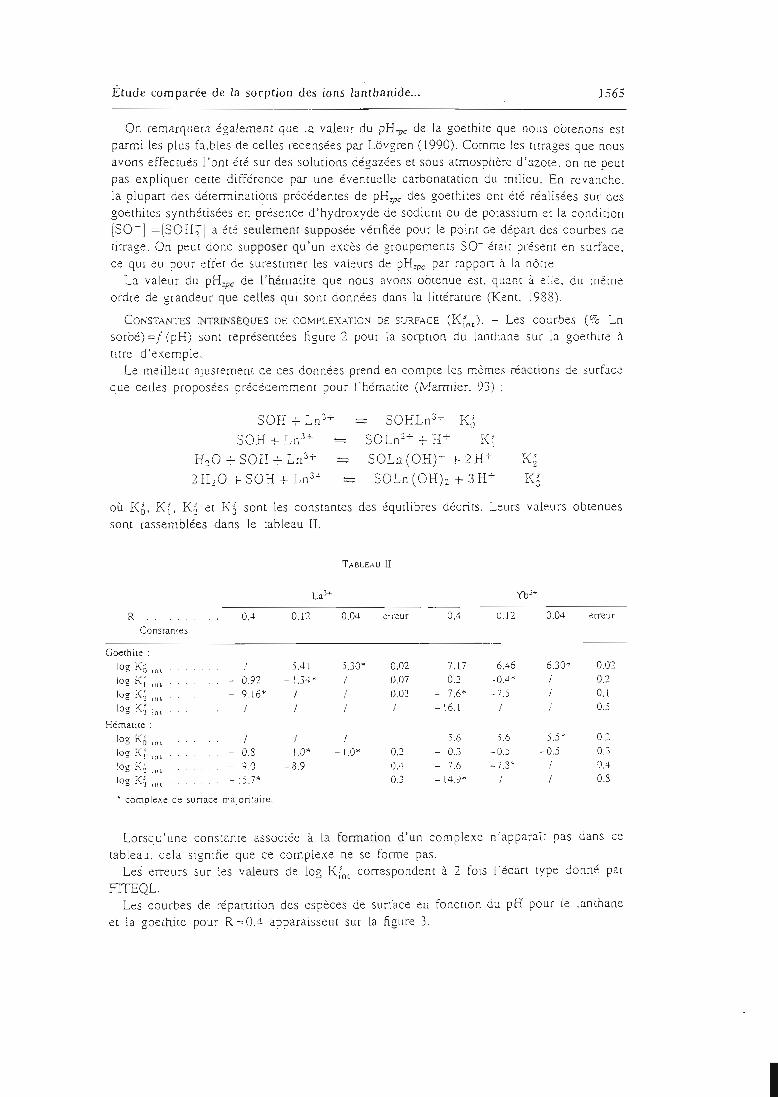
Étude comparée de la sorption des ions lanthanide... Ï565
On remarquera également que la valeur du pH^c de la goethite que nous obtenons estparmi les plus faibles de celles recensées par Lôvgren (1990). Comme les titrages que nousavons effectués l'ont été sur des solutions dégazées et sous atmosphère d'azote, on ne peutpas expliquer cette différence par une éventuelle carbonatation du milieu. En revanche,la plupart des déterminations précédentes de pH;;,c des goethites ont été réalisées sur desgoethites synthétisées en présence d'hydroxyde de sodium ou de potassium et la condition[SO~] = [SOH7] a été seulement supposée vérifiée pour le point de départ des courbes detitrage. On peut donc supposer qu'un excès de groupements SO~ était présent en surface,ce qui eu pour effet de surestimer les valeurs de pH.pc par rapport à la nôtre.
La valeur du pH:pc de l'hématite que nous avons obtenue est. quant à elle, du mêmeordre de grandeur que celles qui sont données dans la littérature (Kent. 1988).
Constantes intrinsèques de complexation de surface (Kfnt). - Les courbes (% Lnsorbé) =/(pH) sont représentées figure 2 pour la sorption du lanthane sur la goethite àtitre d'exemple.
Le meilleur ajustement de ces données prend en compte les mêmes réactions de surfaceque celles proposées précédemment pour l'hématite (Marmier. 93) :
SOH t- Ln3
SOH + Ln3+
H20 + SOH + Ln3+2H,0 + S0H4-Ln3^
- SOHLn3 K;
SOLn2--f-H- KJ
SOLu(OH)+ + 2H+S0Ln(0H),4-3H+
K|
où Kg, Kf, Ko et K3 sont les constantes des équilibres décnts. Leurs valeurs obtenuessont rassemblées dans le tableau II.
R 0,4
Constantes
Goethite :
'«g KJ ;„, ''«g k; ;„, - 0.92log K:', int - 9.16*log KJ iBI /
Hématite :
log KJ llM /io« K; in[ - o.s
^g K4 ;„ - 9.0logKS,., -15.7'
* complexe de surface majoritaire.
Tableau II
LaJ Yb3*
0.12 0.04 0,4 0,12 0,04
5.41 5.30* 0.02 7,17 6.46 6.30' 0.02
- 1.34* / 0.07 0,2 -0.4* / 0,2
/ / 0.03 - 7,6* -7,5 / 0.1
/ / / -16,1 / / 0.5
/ / 5,6 5,6 5.5* 0,2
- 1.0* -1,0* 0.2 - 0,3 -0,5 -0.5 0,3
-8.9 0.4 - 7.6 -7,8* / 0,4
0.3 - 14,9* / / 0,8
Lorsqu'une constante associée à la formation d'un complexe n'apparaît pas dans cetableau, cela signifie que ce complexe ne se forme pas.
Les erreurs sur les valeurs de log Kfn, correspondent à 2 fois l'écart type donné parFITEQL.
Les courbes de répartition des espèces de surface en fonction du pH pour le lanthaneet la goethite pour R = 0,4 apparaissent sur la figure 3.
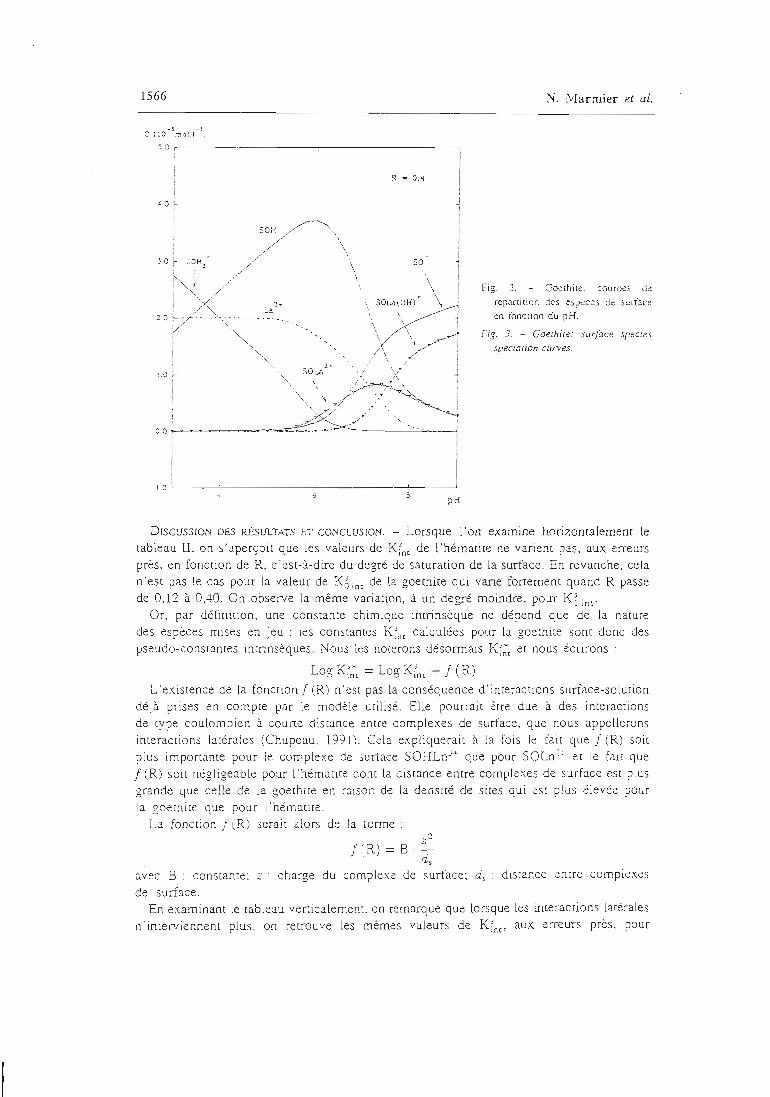
1566
jR
!
• 0.4
1*.Q i-
! soh y^ \
\
3.0 j- SOH, - /\
\
\ * |N '
/
/
\ \ 1
pH
N. Marmier et al.
Fig. 3. - Goethite. courbes de
reparution des espèces de surtaceen fonction du pH.
Fig. 3. - Goethite: surface speciesspéciation curves.
Discussion des résultats et conclusion. - Lorsque l'on examine horizontalement letableau IL on s'aperçoit que les valeurs de Kfnt de l'hématite ne varient pas, aux erreursprès, en fonction de R, c'est-à-dire du degré de saturation de la surface. En revanche, celan'est pas le cas pour la valeur de Kqii1c de la goethite qui varie fortement quand R passede 0,12 à 0,40. On observe la même variation, à un degré moindre, pour K*Lnt.
Or, par définition, une constante chimique intrinsèque ne dépend que de la naturedes espèces mises en jeu : les constantes K(llt calculées pour la goethite sont donc despseudo-constantes intnnsèques. Nous les noterons désormais Kfà, et nous écrirons :
LogK?;c = LogK=nt-/(R)
L'existence de la fonction / (R) n'est pas la conséquence d'interactions surface-solutiondéjà prises en compte par le modèle utilisé. Elle pourrait être due à des interactionsde type coulombien à courte distance entre complexes de surface, que nous appelleronsinteractions latérales (Chupeau. 1991). Cela expliquerait à la fois le fait que /(R) souplus importante pour le complexe de surface SOHLn3" que pour SOLn:" et le fait que/(R) soit négligeable pour l'hématite dont la distance entre complexes de surface est plusgrande que celle de la goethite en raison de la densité de sites qui est plus élevée pour
la goethite que pour l'hématite.La fonction / (R) serait alors de la forme :
(R) = Bds
avec B : constante; z : charge du complexe de surface; ds : distance entre complexesde surface.
En examinant le tableau verticalement, on remarque que lorsque les interactions latéralesn'interviennent plus, on retrouve les mêmes valeurs de Kfm, aux erreurs près, pour
Etude comparée de la sorption des ions lanthanide... 1567
l'hématite et pour la goethite. L'élément Fe impose donc les valeurs des constantesintrinsèques vraies de complexation de surface.
Les résultats de ce travail sur la sorption des ions lanthanide trivalents sur l'hématite etla goethite mettent en évidence l'existence d'interactions latérales importantes non prisesen compte dans la modélisation actuelle. L'introduction dans notre modèle du facteurreprésentatif de ces interactions latérales sera abordée ultérieurement à partir des résultatsobtenus sur un plus grand nombre de matériaux dont l'étude est en cours d'achèvement.
Cette étude a été effectuée avec le soutien de la région Champagne-Ardertne (ARRD).
Note remise le 7 juin 1993, acceptée après révision le 12 novembre 1993.
RÉFÉRENCES 3tBUOGRAPKIQ(JES
J. CHUPEAU. Contribution à l'étude théorique et expénmentale du transfert des solutés en aquifëre : application autraçage chimique d'un réservoir géothermique, apports de la modélisation couplée transpon-géochirnie. Thèse, UniversuéPierre-et-Mane-Cune, 1991.
D. B. KENT. V. S. TRJPATHi. N. B. BALL et J. 0. LECKIE, Surface complexation modelling ofradlonuclide adsorption insubsurface environments. Report NUREG/CR-4807, SAND86-7175, 1988, 108 p.
L. LOVGREN. S. SJOBERG et P. W. SCHINDLER. Acid/base réactions and Al (OT) complexation at the surface of goethite,Geochimica and Cosmochimica acta. 54, 1990. p. 1301-1306.
M. MARMIER. J. DUMONCEAU. I. CHUPEAU et F. FROMAGE. Étude expérimentale et modélisation de la sorption desions lanthanide trivalents sur l'hématite, C. R. Acad. Sci. Paris, 317. série Q. 1990, p. 311-317.
J. C. WESTALL, FITEQL: a program for the détermination ofchemical equilibnum constants from expérimental data, User'sguide, version 1.2. Chemistry Department. Oregon state Umversity, Corvallis, Oregon, 1982.
N. M.. 1. D. et F. F. : Faculté des Sciences de Reims, Laboratoire de Chimie de Coordination,BP n' 347. 51062 Reims Cedex, France.
H. M. et J. C. : CEA, CEN. Fontenay-aux-Roses. DCC'DSD/SCS/LCASH,Bât n° 02. BP n' 6. °22co Fomenay-aux-Roses Cedex, France.
C. R., 1993, 2° Semestre (T. 3! 7) Série II - 116

ARTICLE N°3
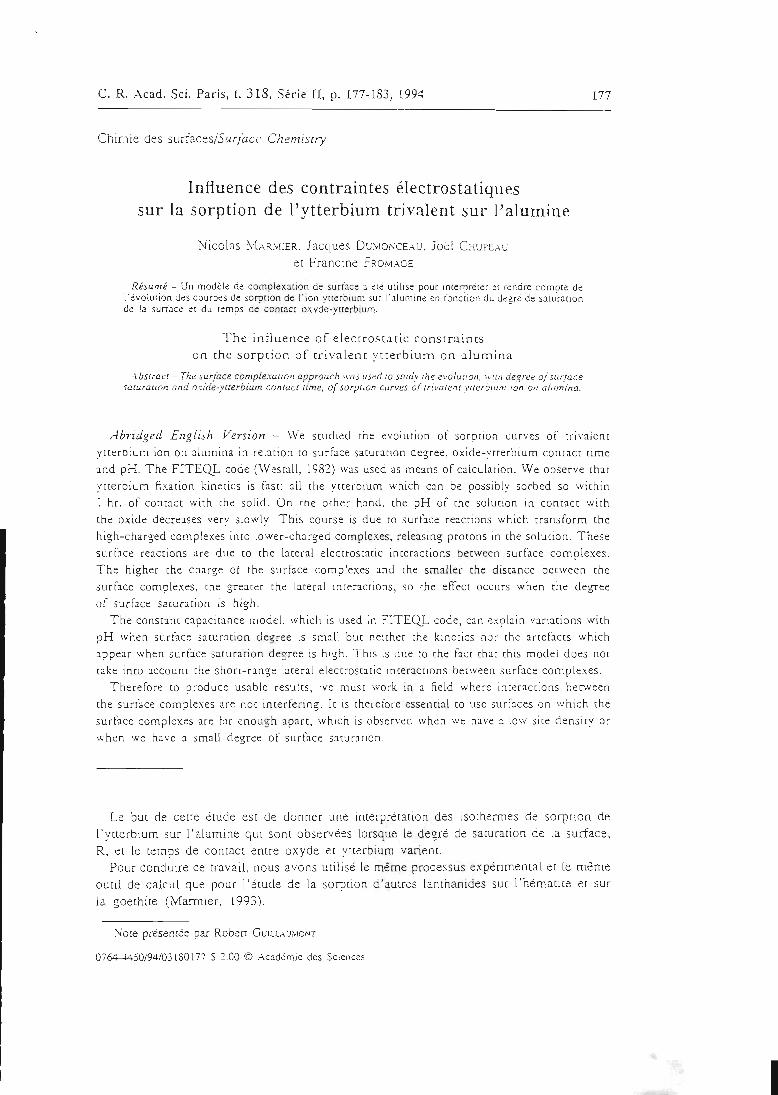
C. R. Acad. Sci. Paris, t. 318, Série II, p. 177-183, 1994 177
Chimie des surfaces/Surface Chemistry
Influence des contraintes électrostatiquessur la sorption de l'ytterbium trivalent sur l'alumine
Nicolas Marmier. Jacques Dumonceau. Joël Chupeauet Francine Fromage
Résumé - Un modèle de complexation de surtace i été utilisé pour interpréter et rendre compte del'évolution des coutbes de sorption de l'ion ytterbium sur l'alumine en fonction du degré de saturationde !a surface et du temps de contact oxyde-ytterbium.
The influence of electrostatic constraints
on the sorption of trivalent ytterbium on alumina
Abstract - Thesurface complexation approach was used to satdy the évolution, wuh degree of surfacesaturation and oxide-ytterbium contact time, of sorption curves of trivalent ytterbium ion on alumina.
Abridged English Version - We studied the évolution of sorption curves of trivalentytterbium ion on alumina in relation to surface saturation degree, oxide-ytterbium contact tune
and pH. The FITEQL code (Westall, 1982) was used as means of calculation. We observe that
ytterbium fixation kinetics is fast: ail the ytterbium which can be possibly sorbed so within
l hr. of contact with the solid. On the other hand, the pH of the solution in contact with
the oxide decreases very slowly. This course is due to surface reactions which transform the
high-charged complexes into lower-charged complexes, releastng protons in the solution. Thèse
surface reactions are due to the latéral electrostatic interactions between surface complexes.The higher the charge of the surface complexes and the smaller the distance between the
surface complexes, the greater the latéral interactions, so the effect occurs when the degreeot' surface saturation is high.
The constant capacitance model. which is used in FITEQL code, can explain variations with
pH when surface saturation degree is small but neither the kinetics nor the artefacts whichappear when surface saturation degree is high. This is due to the fact that this model does nottake into account the short-range latéral electrostatic interactions between surface complexes.
Therefore to produce usable results, we must work in a field where interactions between
the surface complexes are not interfering. It is therefore essential to use surfaces on which thesurface complexes are far enough apart, which is observed when we hâve a low site density orwhen we hâve a small degree of surtace saturation,
Le but de cette étude est de donner une interprétation des isothermes de sorption del'ytterbium sur l'alumine qui sont observées lorsque le degré de saturation de la surface,R, et le temps de contact entre oxyde et ytterbium varient.
Pour conduire ce travail, nous avons utilisé le même processus expérimental et le mêmeoutil de calcul que pour l'étude de la sorption d'autres lanthanides sur l'hématite et surla goethite (Marmier. 1993).
Note présentée par Robert Guillaumont.
0764-4450/94/03180177 S 2.00 © Académie des Sciences
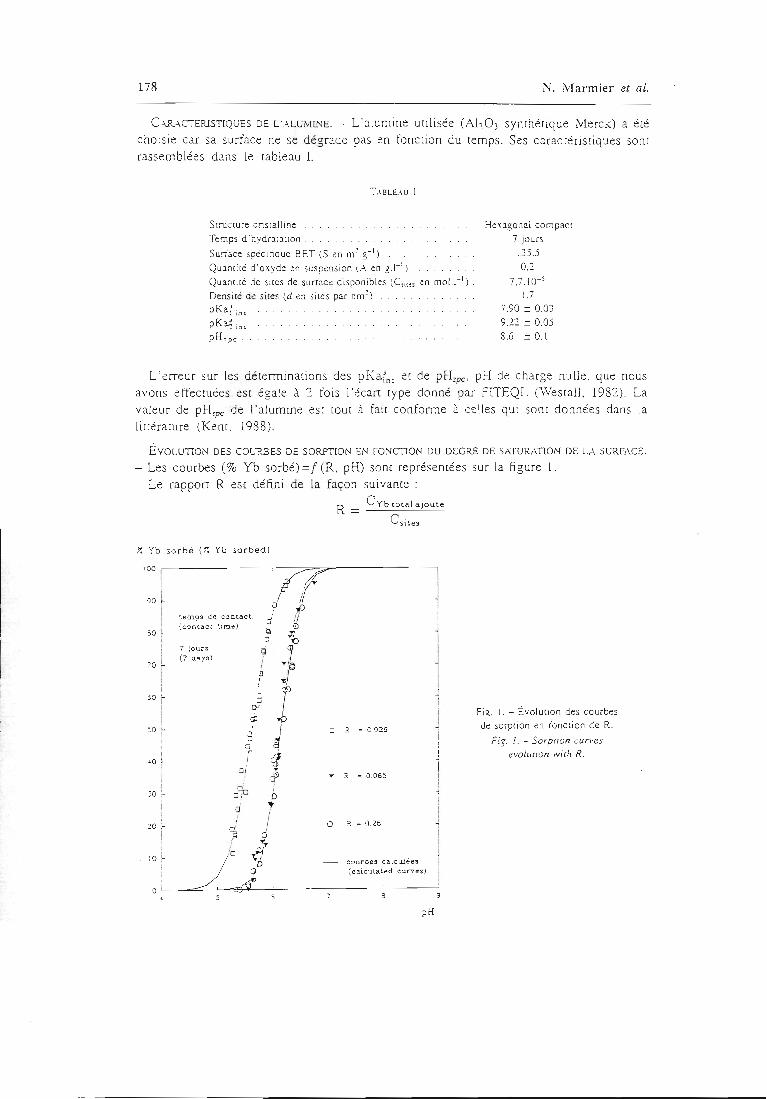
178 N. Marmier et ai.
Caractéristiques de l'alumine. - L'alumine utilisée (ALO3 synthétique Merck) a étéchoisie car sa surface ne se dégrade pas en fonction du temps. Ses caractéristiques sontrassemblées dans le tableau I.
Tableau I
Structure cnstalline Hexagonal compact
Temps d'hydratation 7 joursSurface spécifique BET (S en m:.g"') 135.5Quantité d'oxyde en suspension (A en g.l"1) 0,2Quantité de sites de surface disponibles lC„lcs en mol.1-1) . 7,7.10"-1Densité de sites (d en sites par nm_) 1.7oKa;nt 7.90 = 0.03PKa4,nt 9,22 = 0,05pH:pc S.6 ±0.1
L'erreur sur les déterminations des pKafnc et de pHrpc, pH de charge nulle, que nousavons effectuées est égale à 2 fois l'écan type donné par FITEQL (Westall, 1982). Lavaleur de pH-,,c de l'alumine est tout à fait conforme à celles qui sont données dans lalittérature (Kent, 1988).
ÉVOLUTION DES COURBES DE SORPTION EN FONCTION DU DEGRÉ DE SATURATION DE LA SURFACE.
Les courbes (% Yb sorbé) =/(R, pH) sont représentées sur la figure 1.Le rapport R est défini de la façon suivante :
^Yb cocal ajouté
7. Yb sorbé (X Yb sorbedl
100
temps de contact: /(contact tirae) _ 0
7 jours
(7 days)a
i
D
1 «'35
f•O
<9
-rh
f
D
. 10 r
—e»
R =C,
G R » C.02S
O ?. = 0.28
couroes calculées
(calculat-ed curves)
?H
Fia. 1. - Évolution des courbesde sorption en fonction de R.
Fig. I. - Sorption curvesévolution with R.
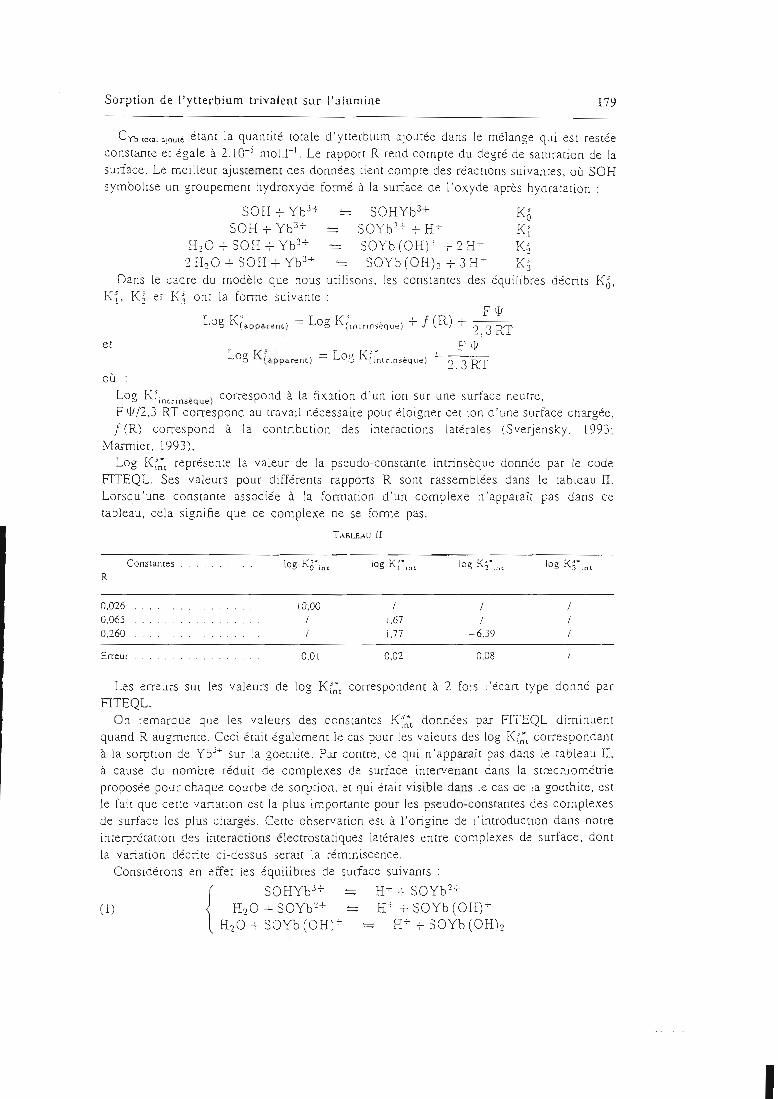
Sorption de l'ytterbium trivalent sur l'alumine 179
Cyt, ro(ai ajouté étant la quantité totale d'ytterbium ajoutée dans le mélange qui est restéeconstante et égale à 2.10"3 mol.L1. Le rapport R rend compte du degré de saturation de lasurface. Le meilleur ajustement des données tient compte des réactions suivantes, où SOHsymbolise un groupement hydroxyde formé à la surface de l'oxyde après hydratation :
SOH^Yb3- - SOHYb3+ Ks050H + Yb3+ - SOYb2+ + H+ Kf
PLO^SOH^Yb3" - SOYb(OH)+ + 2H+ Kî2H2O^SOH + Yb3+ - SOYb(OH)a + 3H+ K^
Dans le cadre du modèle que nous utilisons, les constantes des équilibres décnts Kg,Kf, Ko et Ki ont la forme suivante :
F*Log Kfapparem) = Log K(incnnsèque) -f / (R) -f 2YKË
et _ F#LOg tVapparenc) —LOg "•(intrinsèque) ' 9 0 rv-p
où :
Log Kf; • . ue) correspond à la fixation d'un ion sur une surface neutre,F^/2.3 RT correspond au travail nécessaire pour éloigner cet ion d'une surface chargée,/(R) correspond à la contribution des interactions latérales (Sverjensky, 1993;
Marmier, 1993),Log Kf* représente la valeur de la pseudo-constante intrinsèque donnée par le code
FTTEQL. Ses valeurs pour différents rapports R sont rassemblées dans le tableau ILLorsqu'une constante associée à la formation d'un complexe n'apparaît pas dans cetableau, cela signifie que ce complexe ne se forme pas.
Tableau II
Constantes log K£"inl log Kfioe log Kî*iw loS K3*imR
0,026 10,00 / / /0,065 / 1.67 / /0.260 / K77 -639 /Erreur 0,01 0,02 0,08 /
Les erreurs sur les valeurs de log K-n"c correspondent à 2 fois l'écart type donné parFITEQL.
On remarque que les valeurs des constantes Kfn*c données par FITEQL diminuentquand Raugmente. Ceci était également le cas pour les valeurs des log Kf", correspondantà la sorption de Yb3+ sur la goethite. Par contre, ce qui n'apparaît pas dans le tableau II,à cause du nombre réduit de complexes de surface intervenant dans la stoechiométrieproposée pour chaque courbe de sorption. et qui était visible dans le cas de la goethite, estle fait que cette variation est la plus importante pour les pseudo-constantes des complexesde surface les plus chargés. Cette observation est à l'ongine de l'introduction dans notreinterprétation des interactions électrostatiques latérales entre complexes de surface, dontla vanation décrite ci-dessus serait la réminiscence.
Considérons en effet les équilibres de surface suivants :
SOHYb3- a* H^SOYb2-(1) { H,0-*-SOYb2+ ±* H+^SOYb(OHr
H,0 + SOYb(OH)- - H-+SOYb(OH)2
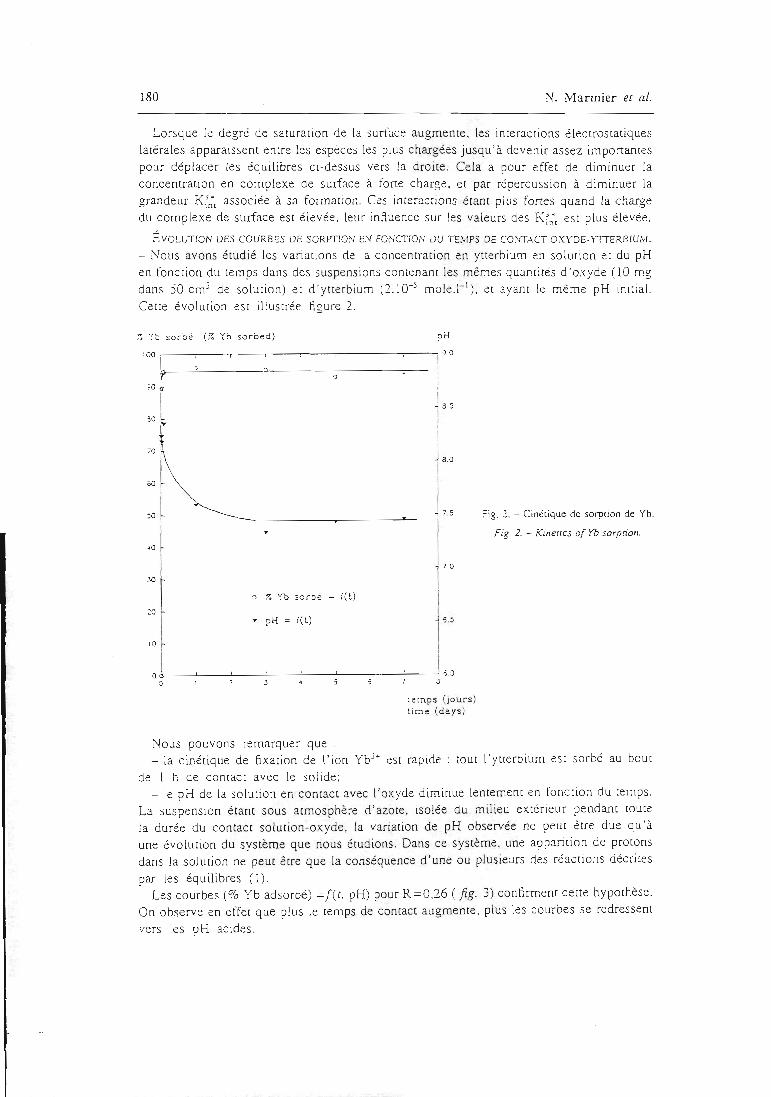
180 N. Marmier et al.
Lorsque le degré de saturation de la surface augmente, les interactions électrostatiqueslatérales apparaissent entre les espèces les plus chargées jusqu'à devenir assez importantespour déplacer les équilibres ci-dessus vers la droite. Cela a pour effet de diminuer laconcentration en complexe de surface à forte charge, et par répercussion à diminuer lagrandeur Kfn"t associée à sa formation. Ces interactions étant plus fortes quand la chargedu complexe de surface est élevée, leur influence sur les valeurs des Kf"t est plus élevée.
Evolution des courbes de sorption en fonction du temps de contact oxyde-yttbrbium.- Nous avons étudié les vanations de la concentration en ytterbium en solution et du pHen fonction du temps dans des suspensions contenant les mêmes quantités d'oxyde (10 mgdans 50 cm3 de solution) et d'ytterbium (2.10-5 mole.L1), et ayant le même pH initial.Cette évolution est illustrée figure 2.
Yb sorbé (% Yb sorbed)
JO !
o Z Y~b sorbé = f(t)
- pH = f(t)
oH
•j 85i
- 5.5
Fig. 2. - Cinétique de sorption de Yb.
Fig. 2. - Kinetics of Yb sorption.
temps (jours)Urne (days)
Nous pouvons remarquer que :- la cinétique de fixation de l'ion YbJ"" est rapide : tout l'ytterbium est sorbé au bout
de 1 h de contact avec le solide;
- le pH de la solution en contact avec l'oxyde diminue lentement en fonction du temps.La suspension étant sous atmosphère d'azote, isolée du milieu exténeur pendant toutela durée du contact solution-oxyde, la variation de pH observée ne peut être due qu'àune évolution du système que nous étudions. Dans ce système, une apparition de protonsdans la solution ne peut être que la conséquence d'une ou plusieurs des réactions décritespar les équilibres (1).
Les courbes (% Yb adsorbé) =f(t. pH) pour R = 0,26 ( fig. 3) confirment cette hypothèse.On observe en effet que plus le temps de contact augmente, plus les courbes se redressentvers les pH acides.
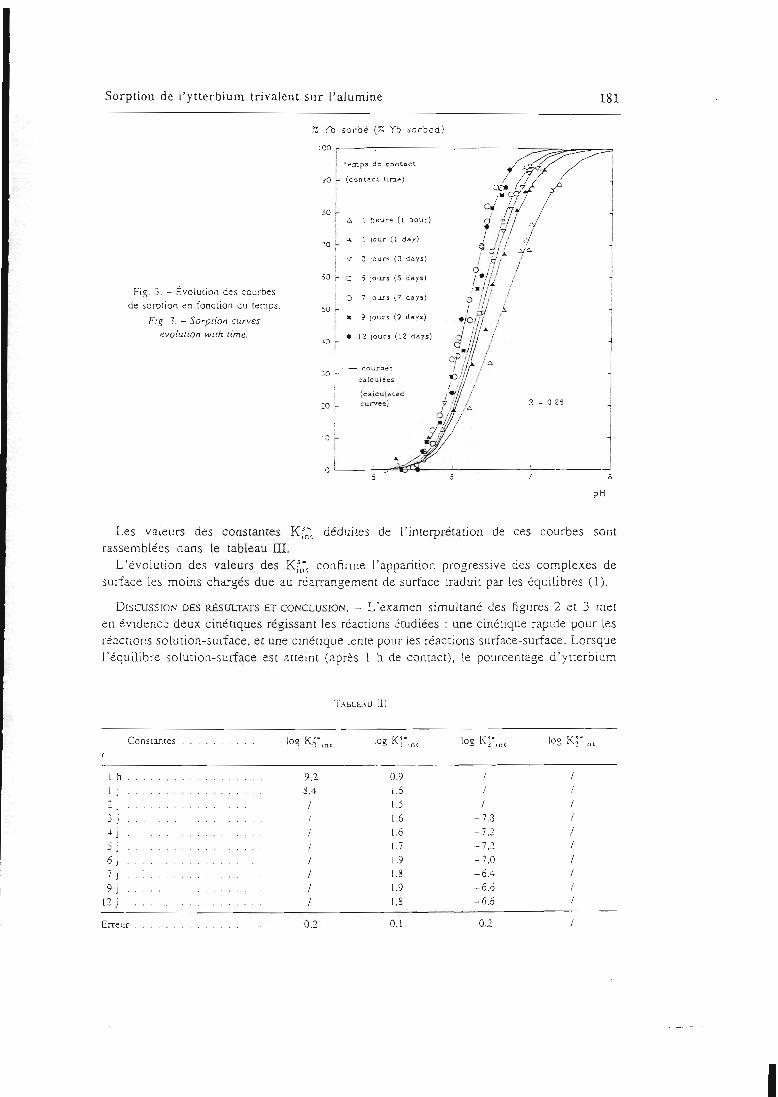
Sorption de l'ytterbium trivalent sur l'alumine
Fig. 3. - Évolution des courbesde sorption en fonction du temps.
Fig. 3. - Sorption curvesévolution with urne.
Yb sorbé (" Yo sorbed)
;co ' 1
temps de contact
(contact time)
181
pH
Les valeurs des constantes Kf",. déduites de l'interprétation de ces courbes sontrassemblées dans le tableau III.
L'évolution des valeurs des Kfn*c confirme l'apparition progressive des complexes desurface les moins chargés due au réarrangement de surface traduit par les équilibres (1).
Discussion des résultats et conclusion. - L'examen simultané des figures 2 et 3 meten évidence deux cinétiques régissant les réactions étudiées : une cinétique rapide pour lesréactions solution-surface, et une cinétique lente pour les réactions surface-surface. Lorsquel'équilibre solution-surface est atteint (après 1 h de contact), le pourcentage d'ytterbium
Tableau III
Constantes
1 h .
t J .
2j •3 j •-H .
5 j •
6j •7j .9j .
12 j •
Erreur
9,2
S,4
0,2
log k:
0,9
1.6
1.5
1.6
1.6
1,7
1.9
1,8
1.9
1,8
0.1
log Ko
/
/
/
-7.8
-7,2
-7,2
-7.0
-6,4
-6,6
-6.6
0.2
l0S K3"u.c
182N. Marmier et al.
libre en solution n'évolue plus contrairement au pH; le redressement de la courbe (% Ybads) =/(pH) en fonction du temps (fig. 3) est évidemment dû à une cinétique lente.
Les aspects thermodynamiques et la cinétique du système étudié peuvent donc êtrecompris à l'aide de l'ensemble des réactions :
(2)
INTERFACE
SOH-Yb3"
SOH^Yb3- ±9
H20^50H-f-Yb3- - 2H+-f-
** 3H+- +{ 2H20 + S0H + Yb3+ s
les réactions de surface imposant en fait la cinétiqueformation du complexe de surface le moins chargé. Elles sont dues à l'apparition àcourte distance d'interactions de type coulombien entre complexes de surface, que nousappelons interactions latérales. Les pseudo-constantes intnnsèques données par FITEQLsont donc des constantes conditionnelles dépendantes de la distance entre complexes desurface. Lorsque l'équilibre de réarrangement de surface est atteint, nous pouvons écnre :
[nff!/, . v. F* KZ2L°S ^(apparent) = ">g *Wi,*»èqu,) + J^KT ^
SURFACE
SOHYb3+
jrSOYb2+
IfSOYb(OH)+
JfSOYb(QH)s
Elles pnvilégient toujours la
6,/(D)avec D: distance entre les complexes de surface; K: Cte; Z : charge du complexede surface; es : constante diélectnque du solide et / (D) =fonction permettant de rendrecompte de la variation de la distance entre complexes de surface en fonction des paramètrescnstallographiques de la surface de l'oxyde et du degré de remplissage de la surface.
Cette relation s'apparente à celle donnée par Sverjenski (1993).Elle en diffère par le fait que dans le modèle que nous proposons nous conservons une
constante intnnsèque qui dépend à la fois des propnétés de l'oxyde et des propriétés ducation, et non des seules propnétés du cation. De plus, nous faisons intervenu dans letroisième terme une fonction représentative du degré de remplissage de la surface, ce quinous permet d'expliquer l'évolution des Kf*( pour différentes valeurs de R.
Pour que le système soit à l'équilibre, il faut soit travailler dans un domaine où lesinteractions^latérales n'interviennent pas (degré de saturation de la surface faible), soitattendre la fin de la transformation des complexes de surface. Dans le cas de l'alumine cetéquilibre est. atteint au bout de 7jours et les espèces alors présentes à la surface de l'oxydesont SOYb2+ et SOYb(OH)L Apartir de ce temps, les courbes (% Y'b ads) =/(pH) sesuperposent et les valeurs de Krjnt et K2*nt n'évoluent plus. Les constantes de formationintnnsèques ne peuvent être atteintes que lorsque les réarrangements de surface ne seproduisent pas. L'évolution des K£t visible dans le tableau III s'explique par l'existencedes réactions déentes en (2) :
- l'espèce SOHYb3+ se déprotonne pour donner SOYb2+, de ce fait la valeur de K^sdiminue en fonction du temps;
- l'espèce SOYb:+ fixe un OH" pour donner SOYb(OH)*, de ce fait la valeur de K'2Saugmente en fonction du temps;
- la valeur de K"3 associée à l'espèce SOYb2+ évolue faiblement. Cela est dû à ceque la disparition de ce complexe est pratiquement compensée par son apparition, saconcentration reste donc pratiquement constante.
Sorption de l'ytterbium trivalent sur l'alumine 183
L'évolution des isothermes de sorption est due à un ou plusieurs des facteurs suivants :- cinétique d'hydratation de la surface;-cinétique de fixation de l'ion Yb3+ sur la surface;- cinétique de réarrangement de surface.Pour n'importe quel système oxyde-solution, il faut, pour obtenir l'équilibre de sorption
d'un cation, trouver le bon compromis entre équilibre d'hydratation de la surface, équilibrede réarrangement de surface, équilibre de fixation du cation sur la surface, et éventuellementmodification des propnétés de la surface.
La connaissance de l'expression de la fonction/ (D) permettrait de calculer les constantesapparentes de complexation de surface dans n'impone quelles conditions de saturation(R élevé) à panu des valeurs des Kfnt obtenues à l'équilibre.
Note remise le 23 novembre 1993, acceptée après révision le 9 décembre 1993.
RÉFÉRENCES BIBLIOGRAPHIQUES
J. CHUPEAU. Concnbution a l'étude théorique et expérimentale du transfert des solutés en aquttére : application au traçagechimique d'un réservoir séothermique. apports de la modélisation couplée transport-géochtmie. Thèse. nJ 91-09. UniversitéPierre-et-Mane-Cune. Pans-Vl. 1991.
D. B. iCENT. V. S. TRIPATHI. N. 3. BALL et J. O. LECKIE. Surface complexation modelling of radionuclide adsorption insubsurface environmems. Report NUREG/CR-4807, SAND86-7175. Stanford Uruverstty, [988.
N. MARMIER. J. DUMONCEAU. J. CHUPEAU et F. FROMAGE. Étude expérimentale et modélisation de [a sorption desions lanthanide trivalents sur l'hématite, C. R. Acad. Sci. Pans, j 17, séné II, 1993. p. 311-317.
N. MARMIER. 1. DUMONCEAU, 1. CHUPEAU et F. FROMAGE. Étude comparée de la zsorption des ions lanthanidetnvalencs sur la goethite et l'hématite. C. R. Acad Sci. Parts, 317. séné II. 1993, p. 1561-1567.
A. S. SVREJËNSKY, Physical surface-complexation models for sorption at the mineral-water interface. Sature. 364, 1993,p. 776-780.
1. C. WESTALL. FITEQL: a program for the détermination of chemical equilibrium constants from expérimental data. Usersguide, version 1,2. Chemistry Départaient, Oregon state University, Corvallis. Oregon. 1982.
N. M.. J. D. et F. F. : Faculté des Sciences de Reims, Laboratoirede Chimie de Coordination,BP n3 347. 51062 Reims Cedex. France.
N. M. ei L C. : CE\, CEN, Fomenay-aux-Roses, DCCIDSDISCSILCASH,Bât n° 02, BP n" 6. 92265 Fomenay-aux-Roses Cedex, France.

ARTICLE N°4
ELSEVIER Journal of Contaminant Hydrology 26 (1997) 159-167
ContaminantHydrology
Surface complexation modeling of Yb( III) sorptionand desorption on hématite and alumina
N. Marmier *, J. Dumonceau, F. FromageFaculté desSciences deReims. Laboratoire de Chimie de Coordination, BP1089, 51687Reims Cedex 2,
France
Received 15 March 1996; accepted 15 August 1996
Abstract
Sorption and desorption of Yb(III) were studied on hématite and on alumina using a surfacecomplexation model. The expérimental methodology was conceived to allow an analysis of thedata using a constant capacitance model. The FITEQL code was used for the calculions.
The expérimental results tend to show reversibility of sorption when the surface loading issmall, and irreversibility when the surface loading is high. Surface complexation modeling gives agood interprétation of thèse two phenomena, taking into account hydroxylation of the surfacecomplexes. In thèse two cases, it is possible to describe sorption and desorption curves with thesame surface stoichiometries and the same surface complexation constants. The existence of thèsesurface complexes dépends on the pH of the solution, surface loading, and reaction direction.© 1997 Elsevier Science B.V.
Keywords: Surface complexation model: Sorption: Desorption: Hématite; Alumina; Ytterbium: FITEQL
1. Introduction
While surface complexation modeling of sorption with différent ions and différentsurfaces is frequently présent in literature, there are only a few papers that associatestudy of sorption with study of desorption (Dzombak and Morel, 1986; Lovgren et al.,1990). Nevertheless, desorption has to be taken into account in a lot of cases, such astransport processes. When desorption is considered, the most fréquent interprétation isgiven by surface précipitation models (Benjamin, 1983; Fariey et al., 1985). In this
Corresponding author. Address: Faculté des Sciences, Greci, BP 1039, 51687 Reims CedexFax: +33 326 053330.
0169-7722/97/S17.00 © 1997 Elsevier Science B.V. AU rights reserved.PII S0169-7722(96)00065-4
France.
160 N. Marmier et al./ Journal of Contaminant Hydrology 26 <1997) 159-167
tï'ij&ï vrv'-'i work, both sorption and desorption are studied with a surface complexation model,involving the same surface reactions with the same constants.
; | The ion chosen for sorption is Yb(III), first because rare earth éléments' sorption ispoorly known, and second because trivalent ions could be most affected by electrostatic
: effects involved in sorption-desorption phenomena.Sorption of Yb(III) is studied on two synthetic oxides: hématite (Fe203) and alumina
(Al-,03). We used for calculations and to help interprétation the FITEQL 1.2 code-•V*. •'. (Westall, 1982), and the constant capacitance model.
2. Expérimental
The acid, base and sodium nitrate solutions are made from HN03, NaOH and NaN03Merck, respectively. The Yb(N03)3 initial solution is made from a 99.99% pureJohnson Matthey oxide and titrated by EDTA complexometry with orange xylenol.
The alumina and hématite used are commercial products, and their characteristics andproperties, determined in a previous work (Marmier et al., 1993, 1994), are given inTable I.
The sorption data are the results of batch experiments. Each curve implies about 10batches, each one containing 50 cm3 of suspension made of oxide powder, NaN03 0.1moir',Yb3+ 2.10-5 mol P1, and différent amounts of HN03 or NaOH 10"2 molT1to make pH varying in a range from 4 to 8. Two différent amounts of hématite andalumina in suspension are used, in order to obtain on the one hand small surface loadingand on the other hand high surface loading. Small loading is obtained by using 100 mgsolid for alumina and 3 g for hématite. Loading ratios, defined as [Yb3+]/[SOH], arethen equal to 0.026 and 0.04 for alumina and hématite respectively. For high loading,the quantity of solid in suspension is divided by 10. Loading ratios are then equal to0.26 for alumina and 0.40 for hématite. After surface hydradon, the pH of thesuspensions is measured, then the solution is filtered through a millepore cell (0.45 |xm)and total concentration of non-sorbed Yb3+ is spectrophotometrically determined(Yb3 +-arsenazo I complex).
For desorption experiments, batch suspensions are the same as for sorption experiments, but ail of them hâve been maintained at high pH for 7 d with alumina, and 1 h
Table 1
Characteristics and properties of alumina and hématite
Alumina Hématite
Origin Merck alumina 90 Johnson Matthey
Surface site concentration 3.85 10"4 mol g-1 8.67 10~6 molg"'Surface site density 1.7 sites nm~2 0.6 sites irai""
Spécifie area 135.5 m2 g"1 8.5 m2 g"1
P^al intrinsic 7.90 6.38
pKa: inmnsic 9.22 9.81
PH2PC 8.6 8.1
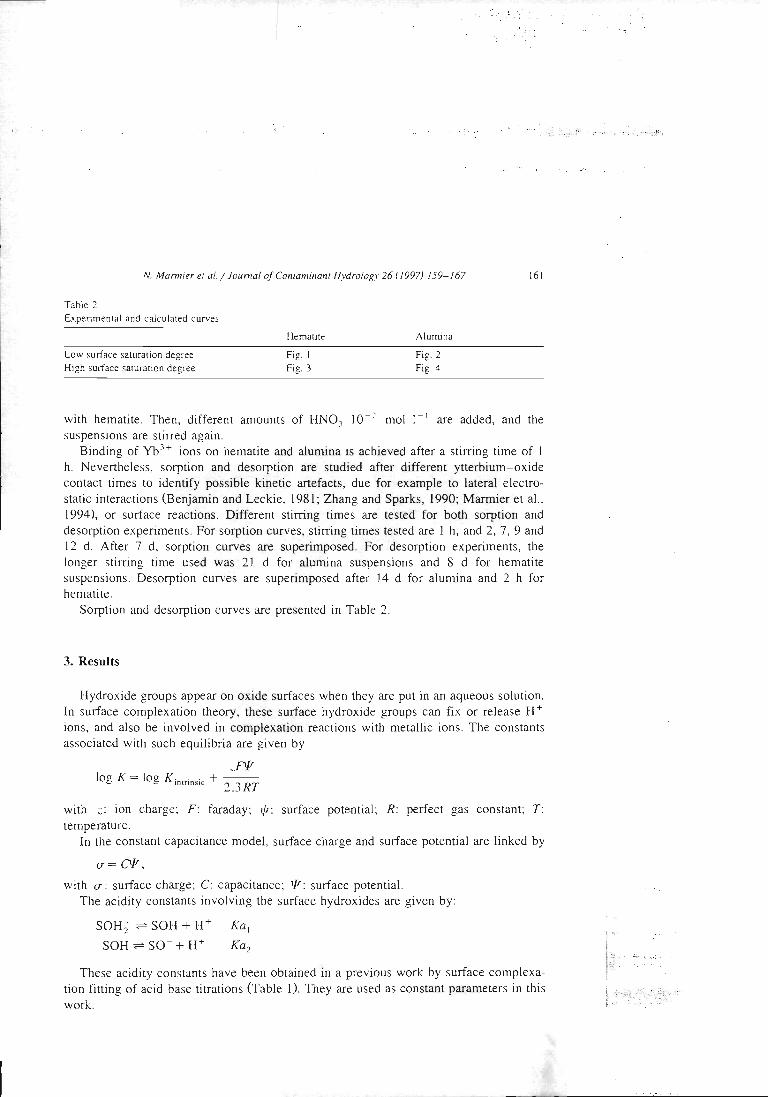
N. Marmier et al. / Journal of Contaminant Hydrology 26 (1997) 159-167 161
Table 2
Expérimental and calculated curves
Hématite Alumina
Low surface saturation degreeHigh surface saturation degree
Fig. 1
Fig. 3
Fig. 2Fig. 4
with hématite. Then, différent amounts of HN03 10~: mol 1_1 are added, and thesuspensions are stirred again.
Binding of Yb3+ ions on hématite and alumina is achieved after a stirring time of 1h. Nevertheless, sorption and desorption are studied after différent ytterbium-oxidecontact times to identify possible kinetic artefacts, due for example to latéral electrostatic interactions (Benjamin and Leckie, 1981; Zhang and Sparks, 1990; Marmier et al.,1994), or surface reactions. Différent stirring times are tested for both sorption anddesorption experiments. For sorption curves, stirring times tested are 1 h, and 2, 7, 9 and12 d. After 7 d, sorption curves are superimposed. For desorption experiments, thelonger stirring time used was 21 d for alumina suspensions and 8 d for hématitesuspensions. Desorption curves are superimposed after 14 d for alumina and 2 h forhématite.
Sorption and desorption curves are presented in Table 2.
3. Résulte
Hydroxide groups appear on oxide surfaces when they are put in an aqueous solution.In surface complexation theory, thèse surface hydroxide groups can fix or release H+ions, and also be involved in complexation reactions with metallic ions. The constantsassociated with such equilibria are given by
zFPlog K=log A-,mnns,c + jjz^.
with z. ion charge; F: faraday; t//: surface potential; R: perfect gas constant; T:température.
In the constant capacitance model, surface charge and surface potential are linked by
a=Ciy,
with a: surface charge; C: capacitance; ^: surface potential.The acidity constants involving the surface hydroxides are given by:
SOLU ** SOH+ H+ Xa,SOH^SO" + H+ Ka2
Thèse acidity constants hâve been obtained in a previous work by surface complexation fitting of acid-base titrations (Table 1). They are used as constant parameters in thiswork.
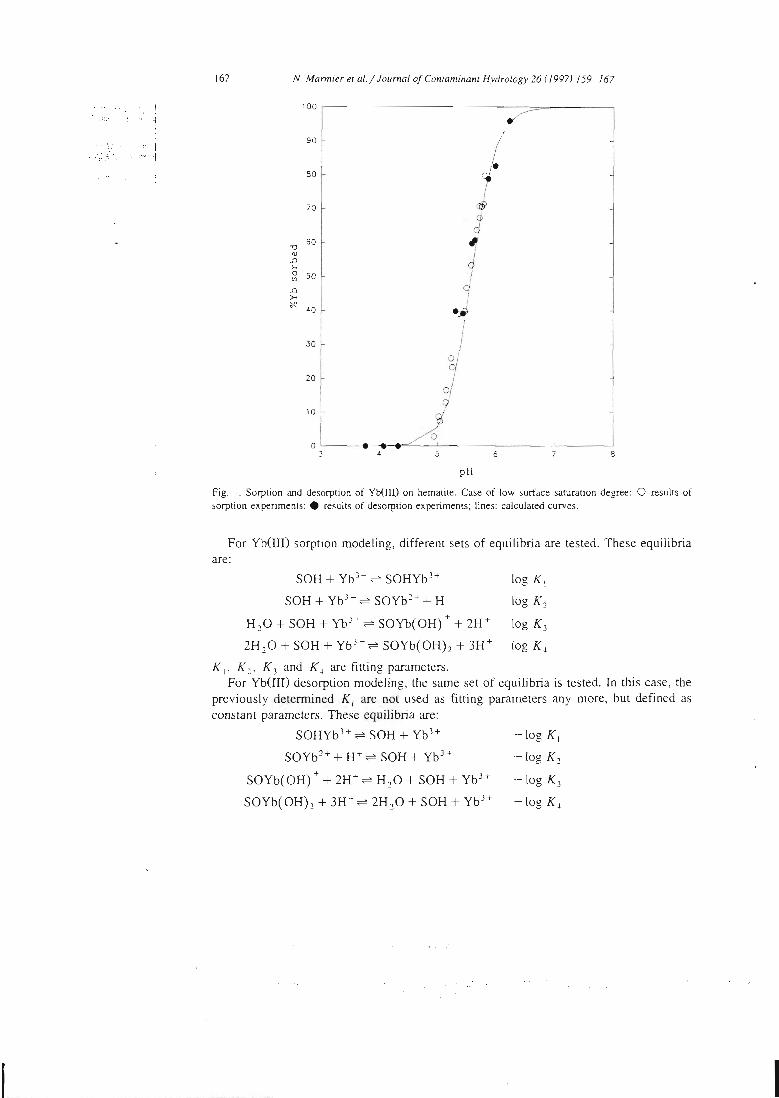
•. . • ; j
••'•"• \
162 N. Marmier et al. / Journalof Contaminant Hydrology 26 (1997) 159-167
XI
>-
pH
Fig. 1. Sorption and desorption of Yb(III) on hématite. Case of low surface saturation degree: O results ofsorption experiments; # results of desorption experiments; Unes: calculated curves.
For Yb(III) sorption modeling, différent sets of equilibria are tested. Thèse equilibriaare:
SOH +Yb3+^SOHYb3 +
SOH + Yb3"^ SOYb: + + H +
H,0 + SOH + Yb3" ^ SOYb(OH)+ + 2H +2H20 -f- SOH + YbJ +^ SOYb(OH)2 + 3H+
Kt, K2, K3 and Kx are fitting parameters.For Yb(III) desorption modeling, the same set of equilibria is tested. In this case, the
previously determined KI are not used as fitting parameters any more, but defined asconstant parameters. Thèse equilibria are:
SOHYb3+^SOH +Yb3 +
SOYb:++ H*^ SOH + Yb3 +
SOYb(OH)+ + 2H~^ H:0 + SOH + Yb3 +SOYb(OH), + 3H" ^ 2H20 + SOH + Yb3^
log K,
log K2
log K3
logK4
-log Kf
-log K2
-logK3
-iog/r4
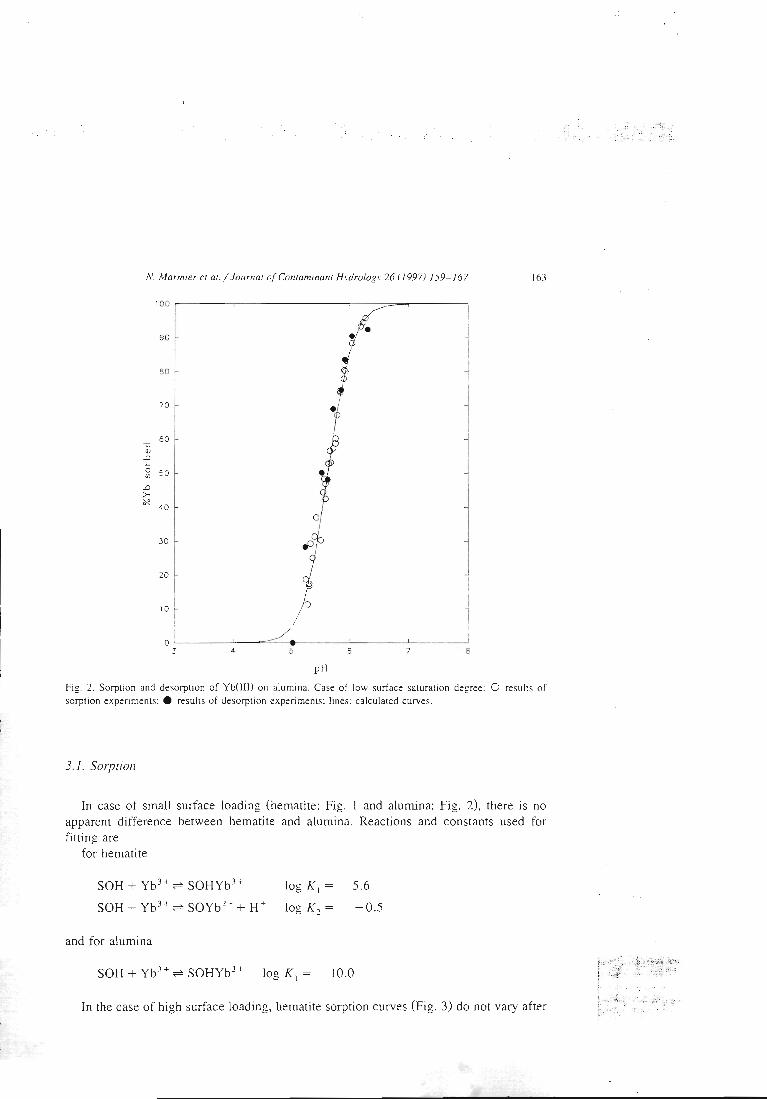
N. Marmier et al. /Journal of Contaminant Hydrology 26 (1997) 159-167
100
163
pH
Fig. 2. Sorption and desorption of Yb(IlI) on alumina. Case of low surface saturation degree: O results ofsorption experiments; • results of desorption experiments: Unes: calculated curves.
3.1. Sorption
In case of small surface loading (hématite: Fig. 1 and alumina: Fig. 2), there is noapparent différence between hématite and alumina. Reactions and constants used forfitting are
for hématite
SOH +Yb3+^SOHYb3" log AT, = 5.6
SOH +Yb3 +^SOYb2++H+ log K-, = -0.5
and for alumina
SOH +Yb3+^SOHYb3+ log A, = 10.0
In the case of high surface loading, hématite sorption curves (Fig. 3) do not vary after
\---"Vf '*;tfî:*i v't 4 '- '•-"'
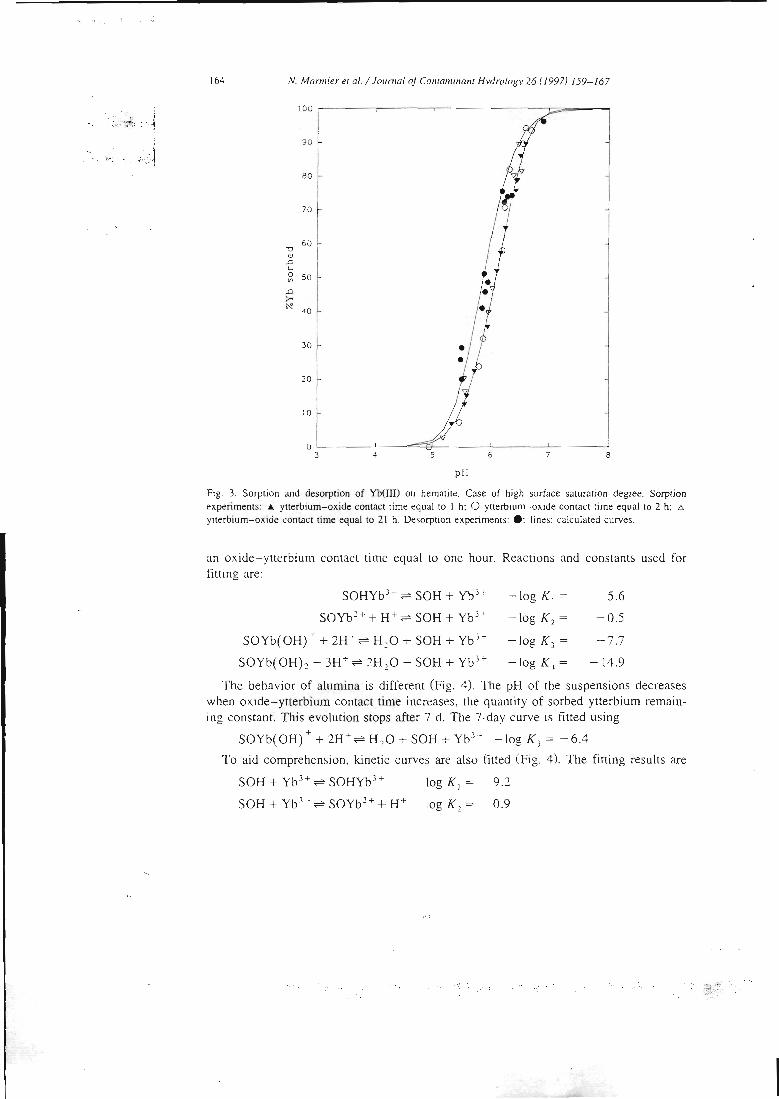
:-_],•»$.. ; ."j
164 N. Marmier etal./Journal of Contaminant Hydrology 26(1997) 159-167
100
pH
Fig. 3. Sorption and desorption of Yb(ffl) on hématite. Case of high surface saturation degree. Sorptionexperiments: A ytterbium-oxide contact time equal to 1h; O ytterbium-oxide contact time equal to 2 h; aytterbium-oxide contact time equal to 21 h. Desorption experiments: •; Unes: calculated curves.
an oxide-ytterbium contact time equal to one hour. Reactions and constants used forfitting are:
SOHYb3+^SOH + Yb3+ -log K, = 5.6SOYb: ++H+^SOH + Yb3+ -\ogK2 = -0.5
SOYb(OH)~ + 2H*^H20 + SOH4-Yb3 + -\ogK^ = -7.7SOYb(OH)2 + 3H"^2H20 + SOH + Yb3 + -logA:4 = -14.9
The behavior of alumina is différent (Fig. 4). The pH of the suspensions decreaseswhen oxide-ytterbium contact time increases, the quantity of sorbed ytterbium remain-ing constant. This évolution stops after 7 d. The 7-day curve is fitted using
SOYb(OH) ++2H+^H20 +SOH + Yb3+ -log/t~3= -6.4To aid compréhension, kinetic curves are also fitted (Fig. 4). The fitting results are
SOH +Yb3+^SOHYb3+ log AT, = 9.2
SOH + Yb3 +^SOYb2++H+ log K2 = 0.9
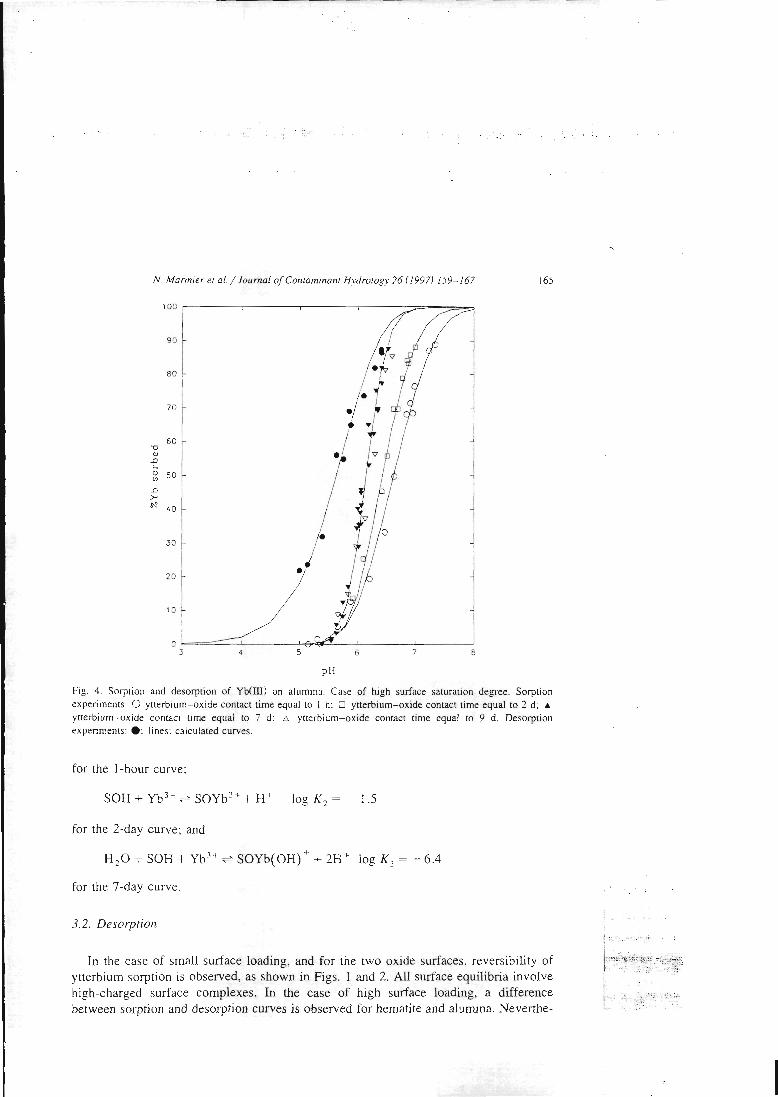
N. Marmier et al./Journal of Contaminant Hydrology 26 (1997) 159-167
100
>•
165
pH
Fig. 4. Sorption and desorption of Yb(III) on alumina. Case of high surface saturation degree. Sorptionexperiments: O ytterbium-oxide contact time equal to 1 h: D ytterbium-oxide contact time equal to 2 d; Aytterbium-oxide contact time equa! to 7 d; a ytterbium-oxide contact time equal to 9 d. Desorptionexperiments: •: Imes: calculated curves.
for the 1-hour curve;
SOH + Yb3"^SOYb2+ + H+ log K2 = 1.5
for the 2-day curve; and
H20 + SOH + Yb3+ ** SOYb(OH) ++ 2H" log K3
for the 7-day curve.
•6.4
3.2. Desorption
In the case of small surface loading, and for the two oxide surfaces, reversibility ofytterbium sorption is observed, as shown in Figs. I and 2. AU surface equilibria involvehigh-charged surface complexes. In the case of high surface loading, a différencebetween sorption and desorption curves is observed for hématite and alumina. Neverthe-
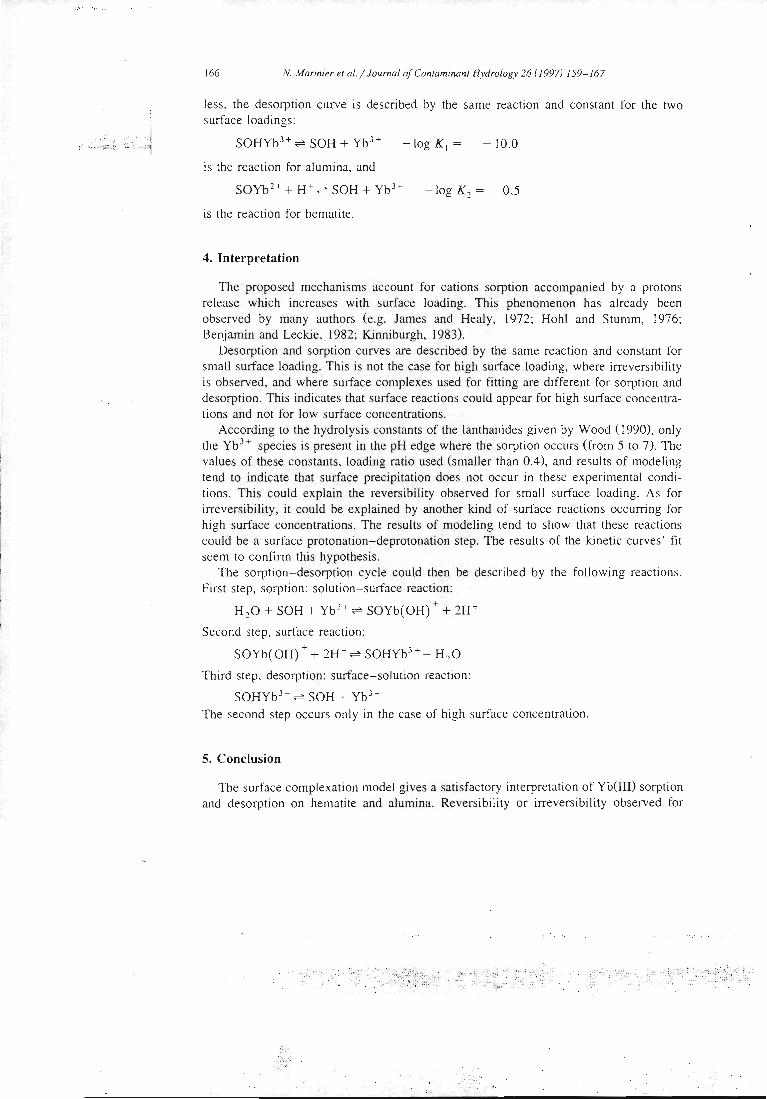
166 N. Marmier et al. / Journalof Contaminant Hydrology 26 (1997) 159-167
less, the desorption curve is described by the same reaction and constant for the twosurface loadings:
SOHYb3+^SOH +Yb3+ -log AT, = -10.0
is the reaction for alumina, and
SOYb2++H+^SOH +Yb3 + -logAT, = 0.5
is the reaction for hématite.
4. Interprétation
The proposed mechanisms account for cations sorption accompanied by a protonsrelease which increases with surface loading. This phenomenon has already beenobserved by many authors (e.g. James and Healy. 1972; Hohl and Stumm, 1976;Benjamin and Leckie, 1982; Kinniburgh, 1983).
Desorption and sorption curves are described by the same reaction and constant forsmall surface loading. This is not the case for high surface loading, where irreversibilityis observed, and where surface complexes used for fitting are différent for sorption anddesorption. This indicates that surface reactions could appear for high surface concentrations and not for low surface concentrations.
According to the hydrolysis constants of the lanthanides given by Wood (1990), onlythe Yb3+ species is présent in the pH edge where the sorption occurs (from 5 to 7). Thevalues of thèse constants, loading ratio used (smaller than 0.4), and results of modelingtend to indicate that surface précipitation does not occur in thèse expérimental conditions. This could explain the reversibility observed for small surface loading. As forirreversibility, it could be explained by another kind of surface reactions occurring forhigh surface concentrations. The results of modeling tend to show that thèse reactionscould be a surface protonation-deprotonation step. The results of the kinetic curves' fitseem to confirm this hypothesis.
The sorption-desorption cycle could then be described by the following reactions.First step, sorption: solution-surface reaction:
H20 + SOH + Yb3' ^ SOYb(OH) ++ 2HTSecond step, surface reaction:
SOYb(OH)+ + 2HT ** SOHYb3 ++ H20Third step, desorption: surface-solution reaction:
SOHYb3+^SOH +Yb3 +
The second step occurs only in the case of high surface concentration.
5. Conclusion
The surface complexation model gives a satisfactory interprétation of Yb(III) sorptionand desorption on hématite and alumina. Reversibility or irreversibility observed for
N. Marmier et al. / Journal of Contaminant Hydrology 26 (1997) 159-167 167
différent surface loadings can be explained by using a simple constant capacitancemodel. Reversibility occurs in the case of small surface loading. For high surfaceloading, irreversibility is observed. This phenomenon could be due to surface reactionsappearing only when surface concentrations are high. In the expérimental conditionsused in this work, thèse surface reactions could be protonation-deprotonation reactionsrather than surface précipitation reactions.
Using this modeling. only four surface complexation equilibria and constants areuseful for the interprétation of ail the sorption-desorption experiments in the case ofhématite, and two in the case of alumina. Thus the number of fitted parameters is
minimum.
Références
Benjamin, M.M.. 1983. Adsorption and surface précipitation of metals on amorphous iron oxyhydroxide.Environ. Sci. Technol., 17: 686-692.
Benjamin, M.M. and Leckie. J.O.. 1981. Multiple-site adsorption of Cd. Cu, Zn and Pb on amorphous ironoxyhydroxide. J. Colloid Interf. Sci.. 79: 209-222.
Benjamin. M.M. and Leckie. J.O.. 1982. Effects of complexation by Cl". S042" and S:03 on adsorptionbehavior of Cd2* on oxide surfaces. Environ. Sci. Technol.. 16: 162-170.
Dzombak. D.A. and Morel, F.M.M., 1986. Sorption of cadmium on hydrous ferrie oxide at high sorbate/sorbentratios: Equilibrium. kinetics and modelling. J. Colloid Interf. Sci.. 112: 588-598.
Fariey. R.J., Dzombak. D.A. and Morel. F.M.M.. 1985. A surface précipitation model for the sorption ofcations on métal oxides. J. Colloid Interf. Sci., 106: 226-246.
Hohl. H. and Stumm. W.. 1976. Interaction of Pb2' with hydrous a-AUOj. J. Colloid Interf. Sci.. 55:281-288.
James, R.O. and Healy, T.W., 1972. Adsorption of hydrolysable métal ions at the oxide-water interface, I:Co(II) adsorption on SiO: and TiO, as model Systems. J. Colloid Interf. Sci., 40: 42-52.
Kinniburgh, D.G., 1983. The H*/M2+ exchange stoichiometry of calcium and zinc adsorption by ferrihy-drite. J. Soil Sci.. 34: 759-768.
Lovgren, L., Sjoberg. S. and Schindler. P.W., 1990. Acid/base reactions and Al(III) complexation at thesurface of goethite. Geochim. Cosmochim. Acta, 54: 1301-1306.
Marmier. N.. Dumonceau, J„ Chupeau. J. and Fromage, F.. 1993. Expérimental study and surface complexation modeling of trivalent lanthanide ion sorption on hématite. C.R. Acad. Sci. Paris. 317. Série II:1561-1567.
Marmier, N.. Dumonceau.J.. Chupeau, J. and Fromage. F.. 1994.The influenceof electrostaticconstraintsonthe sorption of trivalent ytterbium on alumina. C.R. Acad. Sci. Paris. 318. Série II: 177-183.
Westall, J.C.. 1982. FITEQL: A program for the détermination of chemical equilibrium constants fromexpérimental data. User's Guide, Version 1.2. Chemistry Department, Oregon State University, Corvallts.Oregon.
Wood. A., 1990. The aqueous geochemistry of the rare-earth éléments and yttrium, 1: Review of availablelow-temperature data for inorganic complexes and the inorganic REE spéciation of natural waters. Chem.Geol.. 82: 159-186.
Zhang, P. and Sparks. D.L., 1990. Kinetics of selenate and selenite adsorption/desorption at the goethite/waterinterface. Environ. Sci. Technol., 24: 1848-1856.
•'•; ••••-
m

ARTICLE N°5

1085
MODELING OF Yb(III) SORPTION ON KAOLINITE BY USING SINGLE OXIDESURFACE COMPLEXATION MODELS.
Nicolas MARMIER* , ,Jacques DUMONCEAU*. Joël CHUPEAU*** ,Francine FROMAGE*
* Faculté des Sciences de Reims, Laboratoire de chimie de coordination BP 347 51062 Reims cedex** C.E.A. CEN. Fontenay aux rosesDCC/DSD/SCS/LCASH Bat 02 BP6 92265Fontenayaux roses CEDEX*•* ANDRA-DEEC, roule du panorama Robert SCHUMAN B.P.38 92266 Fontenay aux roses CEDEX
ABSTRACT
Surface complexation model was used to describeytterbium sorption on kaolinite using surfaceacidity constants and surface complexation constants determined on alumina and silica.
INTRODUCTION
The rare earth éléments présent strong chemical analogies with trivalent actinides, and may beused to develop méthodologies and to quantify relevant processes Nevertheless, their sorptionbehavior is poorly known In this work, we study the sorption of ytterbium on kaolinite usingsurface complexation models Thèse are now widely acknowleged as valuable tools allowingboth an understanding and quantification of the chemical reactions responsible for the sorbingproperties of solids. Our aim is, in a first step, to détermine surface parameters of two singleoxides, alumina and silica, by means of an expérimental method tested on iron oxides [1,2], andin a second step to use thèse parameters to describe surface reactions on kaolinite surface. Thisapplication of single oxide surface parameters to aluminosilicates has been already tested [3,4],and we withextend this approach to study the ytterbium sorption. So we hâve to make thefollowing hypothesis:
- the surface of kaolinite is composed of two différents sites, aluminol sites and silanolsites.
- thèse two sites keep their chemical properties whatever their environment may be.Using this approach, it is possible to calculate theorical titration curves for kaolinite andtheorical Yb(III) sorption curves using a surface complexation model without surfaceconstants fitting. The comparison of thèse curves with expérimental ones will allow thevalidation of the hypothesis, which are consistent with the theorical model we use.
REAGENTS AND APPARATUS
Solid Phases.
The spécifie area, measured by the B.E.T. nitrogen adsorption method, is equal to135.5 m2.g"1 for alumina, 384 m2.g"1 for silica and 13.7 m2.g"1 for kaolinite. We suppose thatthe hydratation equlibrium is achieved when both surface titration curves and sorptionisotherms do not vary any more: this is observed after a stirring time equal to seven days foralumina, silica, and kaolinite.
Solutions.
The acid, base and sodium nitrate solutions are made from HNO3, NaOH and NaN03 Merck.The Yb(N03)3 master solution is made from a 99.99 % pur Johnson Mattey oxide and titratedby ED.T.A. complexometry with orange xylenol.
Mat. Res. Soc. Symp. Proc. Vol. 353 • 1995 Materials Research Society
^h-i"r~~~'
.£s:
-•::''"-:;'*^:': ...
"• ••::""£*. :^.f..ïL:;i&.d,û:
1086
Apparatus.
- Orion pHmeter 920- Orion pH triode électrode 9157BN- Beckman UV-VIS Spectrometer 5240Ali the measurements are carried out in a thermostated vessel at 298K under nitrogenatmosphère.
EXPERIMENTS.
Titrations.
In order to minimize the activity coefficients variations, we use a background electrolyteNaN03 0.100 mol.l"' solution. The experiment consists in 2 double potentiometric titrations(one by adding HNO3 I0"2 mol.l"1, the other by adding NaOH I0"2 mol.l"1) on:a- the background electrolyteb- a solid suspension in the electrolyte solutionWe always compare the pH of the solid suspensionwith the pH of the electrolyte solution. Thetitrations are carriedout undernitrogen atmosphère andthe suspensions are constantly stirred.Beforedosing, the mixture solide-solution is being stirred in order to reachsurface hydratationequilibrium. The surface sites are symbolized by SOH. The quantity of solid in the solutionamounts to 2 g.l"' for alumina and kaolinite andto 6 g.l"1 for silica.
Sorption of Yb3+ions.
Each curve is the resuit of some 20 batch experiments with a mixture of solid-lanthanide-solution within a pH range from 4 to 8 and for 2 différent solid to solution ratio. After thesurface hydratation, we measure the pHof the suspension, the solution is then filtered througha millipore cell (0.45m) and the total concentration of non-sorbed Yb3* is determinedspectrophotometrically ( Yb3+ -arsenazo I complex).The reproducibility of the ytterbium sorption is tested by measuring the quantity of Yb3+ ionssorbedin 22 batchexperiments at a pH corresponding to about 50% of sorbed Yb3+ wherethegreatest uncertainty is expected.The maximal standard déviation on the pH values and on thepercentage ofsorbed Yb3+ ions are the following:
o = 0.06 pH unitso = 3% sorbed Yb3+
RESULTS and DISCUSSION.
The description of the solid-solution interface we use for our modeling is the constantcapacitance model. We chose this model because for a System like ours (constant and highionic strengh) it is possible to make the simplifications involved in this model and therefore toreduce the number of adjustable parameters.The surface sites can either fix or release H+ ions, and also be involved in complexationreactions with différent species, represented by L"*. In the studied Systems, L"+ can be Yb3+ ordissolved H4Si04 for kaolinite, and only Yb3+ for silica and alumina. The binding of dissolvedAl3+ is not taken into account for kaolinite because its concentration is negligible in the pHrange of the experiments [5]. The total concentration of H4Si04 in solution is experimentallydetermined. It isequal to. [H4Si04] = 8.0 I0"4 mole.l"1.The equilibrium conceming H+, L"* and SOH can be symbolized by the following gênerai
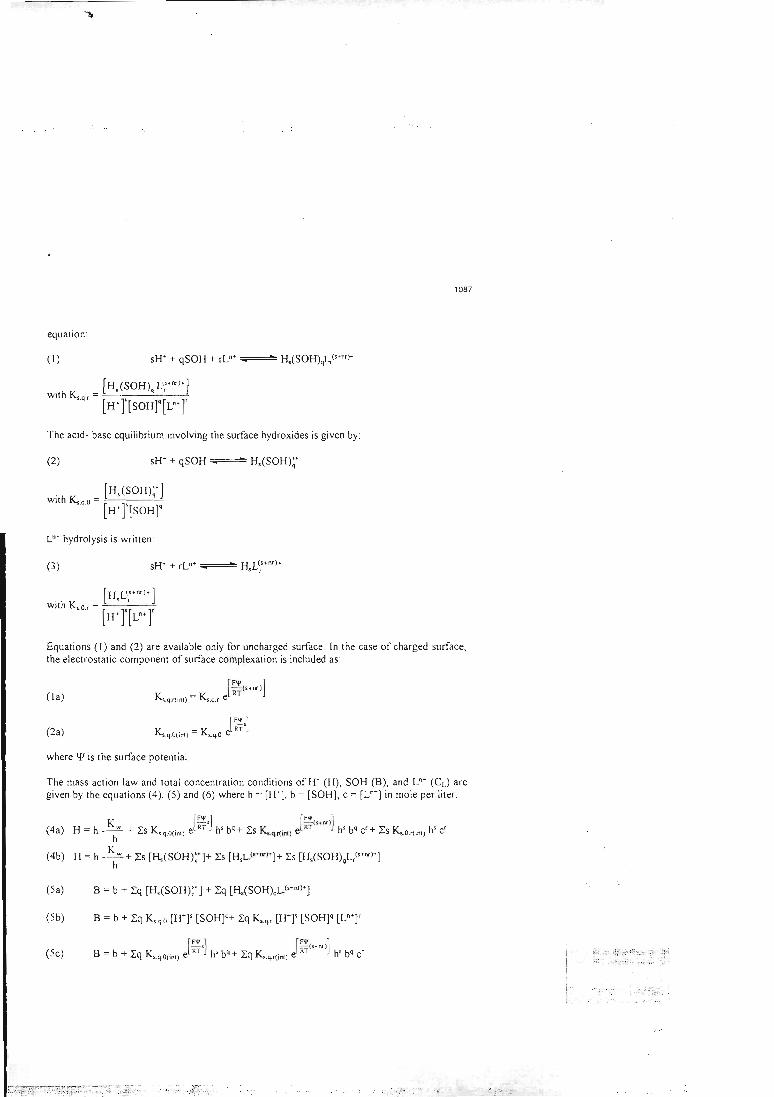
équation:
(1) sH+ + qSOH + rLn+ - H^SÛH)^"^
fH.(SOH) L1'""'*]with K,,, =L^ i2-î 1
[H'J[SOHr[L-]'
Theacid- base equilibrium involving thesurface hydroxides isgiven by:
(2) sH* +qSOH - H^SOH);*
[h,(soh);*1with lC.q0 = i— 3J
[H*][SOH]q
Ln* hydrolysis is written:
(3) sH* + rLn* - H,!?**'*
[hsl<—Hwith Ks0.r :
[H^[L-r
1087
Equations (I) and (2) are available only for uncharged surface. In the case of charged surface,the electrostatic component of surface complexation is included as:
(la) K,q4inl) =K,qre^T J
(2a) I^S.q O(ml) " K.s.q.0 e1
where "4/ is the surface potential.
The mass action lawand total concentration conditions of H" (H), SOH (B), and L"* (CJ aregiven by the équations (4), (5) and (6) where h= [H*], b = [SOH], c = [Ln*] inmole per liter.
(4a) H=h--^ +Zs K,q„(inl) «M h* b<+ Zs K,q4,nl) J^H h' b< c<+Is K,M,m) hs C(4b) H=h--£-+ 2s[H,(SOH);*]+ 2s[HsLr(s*"r>+]+ 2s [^(SOH),^™»*]
(5a) B= b+Iq [Hs(SOH);*] + Zq [^(SOH)^""*]
(5b) B= b+ Zq Ksq0 [H4]s [SOH]i+ Zq IC,.q.r [H+]s [SOH]i [Ln+]r
f—«1 Ptwn,)1(5c) B=b+Zq K^oe».) e1 RT Jhs b" +Zq K,q4ta, e^RT Jhs b" C
•"-'; ."V,-';'-".".' - *•**'?. '•;• •• •• ,' ."• -. • ;. •;• ..'•'« . •>'.
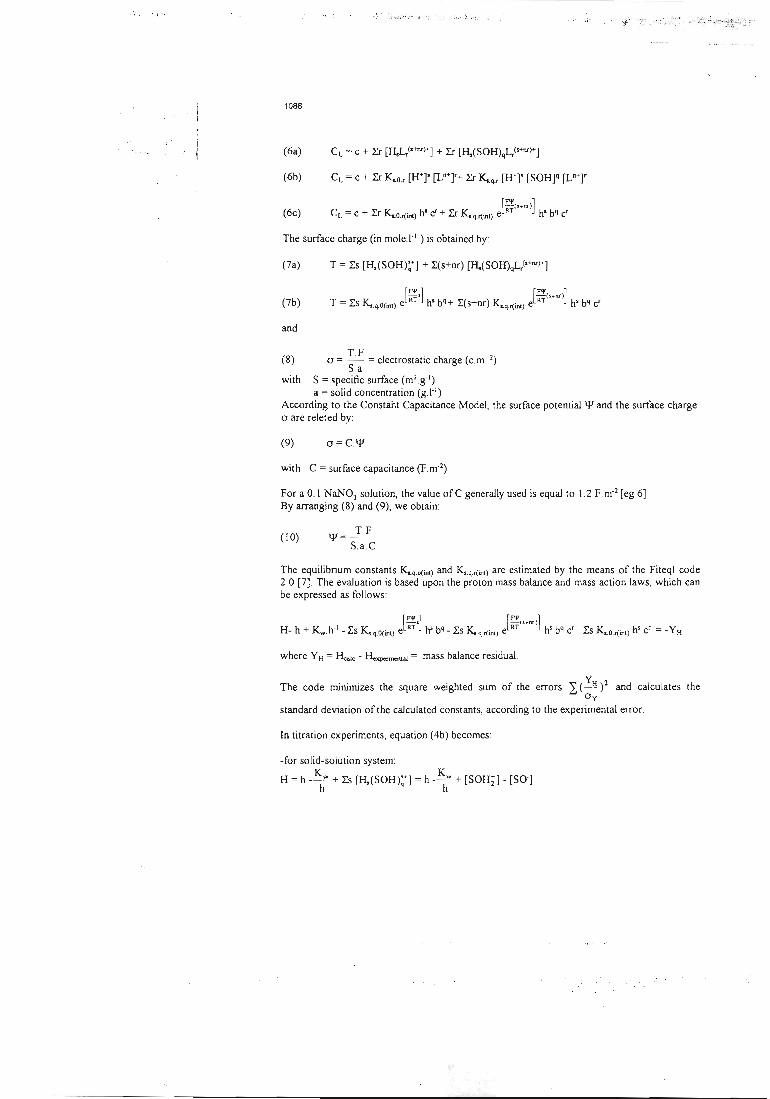
•f "V •-•"' . ..•'•<i:,"-<'-''fci*1;ii1': :••
1088
(6a) CL = c + Zr [ELL/™^]+ Zr [H,(SOH)qLrC+">+]
(6b) CL = c + Zr ICo, [HT [L"+]'+ Zr K,.q, [H+]' [SOH]" [L"+]'
(6c) CL =c+Zr 10.04ml) hs c'+ Zr K,.q4mt) eUT Jh'b" cr
The surfacecharge(in mole.l"1 ) is obtained by:
(7a) T = Zs [H.(SOH),*] + Z(s+nr) [H.(SOH)<1Lr<'+~>+]
(7b) T=Zs K,.q.0(ira) eLRT Jh! b" +Z(s+nr) K,,,^,, eL"T JVb" <?
and
T F(8) a = — = electrostatic charge (cm '2)
Sa
with S = spécifie surface (m2.g"1)a = solid concentration (g.l"1)
According to theConstant Capacitance Model, the surface potential V and thesurface chargea are releted by:
(9) a = CM>
with C = surface capacitance (F.m'2)
For a 0.1 NaN03 solution, the value ofCgenerally used is equal to 1.2 F.m"2 [eg 6]By arranging (8) and (9), we obtain:
T F(10) »P=v ' S.a.C
The equilibrium constants JC,,,.,^,, and K,,q4int) are estimated by the means of the Fiteql code2.0 [7]. The évaluation isbased upon the proton mass balance and mass action laws, which canbe expressed as follows:
[™.l [BW)1H- h+K„.h-' -Zs IC^jiw eLRT Jh* b< -Zs f^n^y e[RT ' h» b" c' -Zs Ku^ hs c' =-YH
where YH = IU - H!XfmacMi = mass balance residual.
The code minimizes the square weighted sum of the errors "£ (—H-)2 and calculâtes the°Y
standard déviation of the calculated constants, according to the expérimental error.
In titration experiments, équation(4b) becomes:
-for solid-solution System:
H=h-£«•+ Zs [H,(SOH),*] =h~*-+ [SOHJ] -[SO"]h h
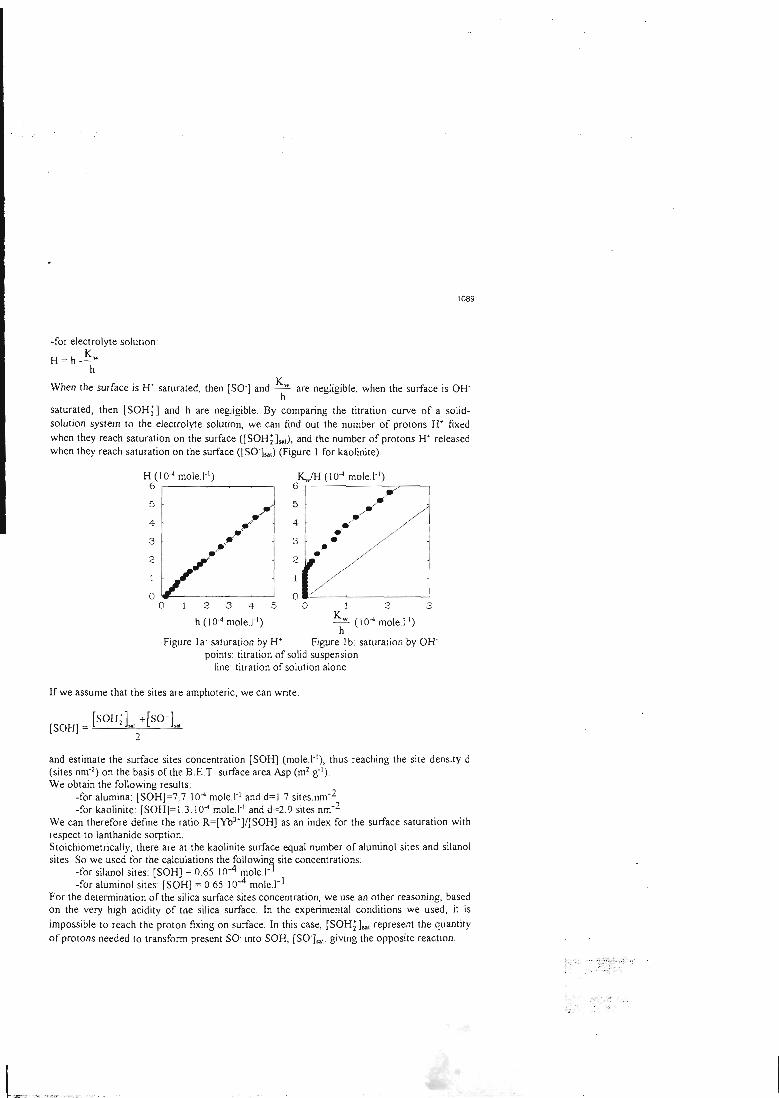
-for electrolyte solution:
h
When the surface is H* saturated, then [SO] and î* are negligible, when the surface is OH"h
saturated, then [SOH2*] and h are negligible. By comparing the titration curve of a solid-solution system to the electrolyte solution, we can find out the number ofprotons H* fixedwhen they reach saturation on the surface ([SOH*],,,), and the number ofprotons H* releasedwhen they reach saturation on the surface ([SO"]M) (Figure 1for kaolinite)
K„
HOO^mole.l'1)6
Kw/H(l(r4mole.r1)
2 3 4 5
h (10"4 mole.l-')
Figure la. saturation by H* Figure 1b saturation by OH'points: titration of solidsuspension
Une: titration of solution alone
If weassume that the sitesare amphoteric, wecanwrite:
fsOHj] +fsO"|[SOH] = t ll*t-l k.
2
and estimate the surface sites concentration [SOH] (mole.l-1), thus reaching the site density d(sites.nnv2) on the basis ofthe B.E.T. surface area Asp (m2.g-').We obtain the following results:
-for alumina: [SOH]=7.7.10-4 mole.l-' and d=1.7 sites.nm"2-for kaolinite: [SOH]=1.3.10-* mole 1"' andd=2.9sites.nm"2
We can therefore define the ratio R=[Yb3i]/[SOH] as an index for the surface saturation withrespect to lanthanide sorption.Stoichiometrically, there are at the kaolinite surface equal number of aluminol sites and silanolsites. Soweused for the calculions the following site concentrations.
-forsilanol sites: [SOH] = 0.65 10"4 mole.l"'-foraluminol sites: [SOH] = 0 65 10"4 mole.!"1
For the détermination ofthe silica surface sites concentration, we use an other reasoning, basedon the very high acidity of the silica surface. In the expérimental conditions we used, it isimpossible to reach the proton fixing on surface. In this case, [SOH*]^ represent the quantityofprotons needed to transform présent SO- into SOH, [SO%,. giving the opposite reaction.
—s- (lO^molet1)h
1089
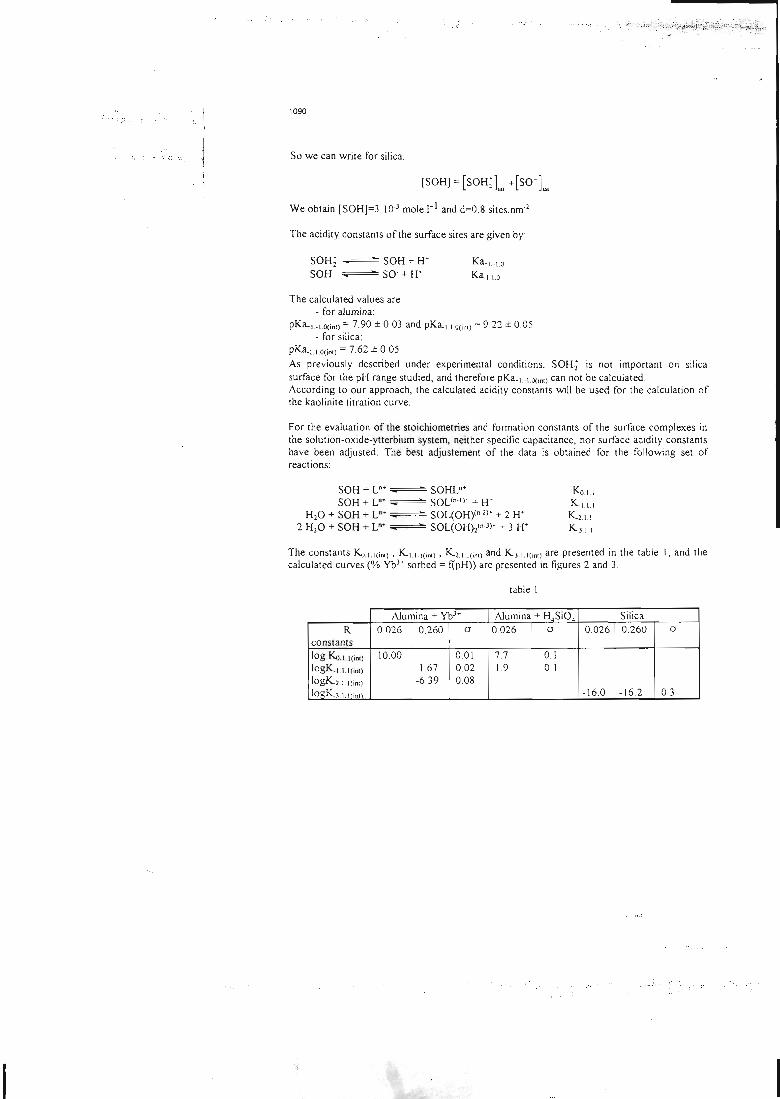
•.. : -• ï •:: •.; So we can write for silica:
[soh] =[soh:]u+[S0"]
We obtain [SOH]=3.10'3 mole.l"1 and d=0.8 sites.nm2
Theacidity constants of thesurface sites aregiven by:
SOH* =?=
SOH =s=
: SOH + H*
SO' + H*
Ka.i .1o
Ka.i i.o
The calculated values are:
- for alumina:
pKa.,.., 0(lnI) = 7.90± 0.03 and pK.a.,.i.o(m,) = 9,22± 0.05- for silica:
pKa.u.o(im) = 7.62 ±0.05As previously described under expérimental conditions, SOH* is not important on silicasurface for thepH range studied, and therefore pKa.,.., 0(i„,) can notbecalculated.According to our approach, the calculated acidity constants will be used for the calculation ofthe kaolinite titration curve.
For the évaluation of the stoichiometries and formation constants of the surface complexes inthe solution-oxide-ytterbium System, neither spécifie capacitance, nor surface acidity constantshâve been adjusted. The best adjustement of the data is obtained for the following set ofreactions:
SOH + Ln* =a"
SOH + Ln* ==
H20 + SOH + L"* ss«2 H20 + SOH + L"* ==
SOHLn*
SOL(n-"* H*
— SOL(OH)<"-2>* + 2 H*=*= S0L(0H)2("-3>* + 3 H*
Ko.i.iK-i.i.i
K-2.I.1
K-3.J.1
The constants Ko.i.1(ml) , K., ,.1(inl) , K_2, 1(inl) and K.j,i.i(in,) arepresented in the table 1, and thecalculated curves(% Yb3* sorbed = fl^pH)) are presented in figures 2 and 3.
table 1
Alumina + Yb3* Alumina + H4Si04 Silica
R 0.026 0.260 o 0 026 o 0.026 0.260 a
constants
lOg Ko.l.i(ini) 10.00 0.01 7.7 0.1
logK.i ,.,(,„,) 1.67 0.02 1.9 0.1
l0gK.2.1.l(irt) -6.39 0.08
logK.3., ](inn -16.0 -16.2 0.3
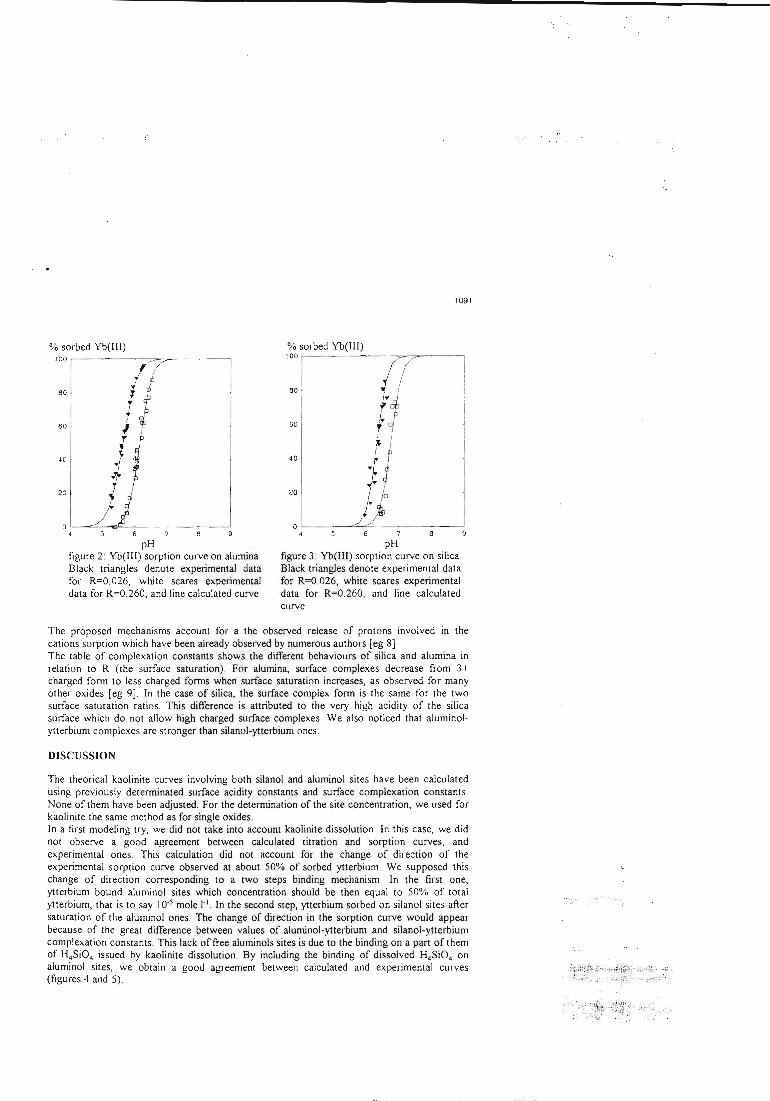
% sorbed Yb(III)100
figure 2: Yb(III) sorption curve on aluminaBlack triangles dénote expérimental datafor R=0.026, white scares expérimentaldata for R=0.260, and line calculated curve
% sorbed Yb(III)100 r
figure 3: Yb(III) sorption curve on silicaBlack triangles dénoteexpérimental datafor R=0.026, white scares expérimentaldata for R=0.260, and line calculated
The proposed mechanisms account for a the observed release of protons involved in thecations sorption which hâve been already observed by numerous authors [eg 8].The table ofcomplexation constants shows the différent behaviours ofsilica and alumina inrelation to R (the surface saturation) For alumina, surface complexes decrease from 3+charged form to less charged forms when surface saturation increases, as observed for manyother oxides [eg 9]. ln the case ofsilica, the surface complex form is the same for the twosurface saturation ratios This différence is attributed to the very high acidity of the silicasurface which do not allow high charged surface complexes We also noticed that aluminol-ytterbium complexes are stronger than silanol-ytterbium ones.
DISCUSSION
The theorical kaolinite curves involving both silanol and aluminol sites hâve been calculatedusing previously determinated surface acidity constants and surface complexation constants.None ofthem hâve been adjusted. For the détermination ofthe site concentration, we used forkaolinite the same method as for single oxides.In a first modeling try, we did not take into account kaolinite dissolution. In this case, we didnot observe a good agreement between calculated titration and sorption curves, andexpérimental ones. This calculation did not account for the change of direction of theexpérimental sorption curve observed at about 50% of sorbed ytterbium. We supposed thischange of direction corresponding to a two steps binding mechanism. In the first one,ytterbium bound aluminol sites which concentration should be then equal to 50% of totalytterbium, that is to say 10"5 molet'. In the second step, ytterbium sorbed on silanol sites aftersaturation of the aluminol ones. The change of direction in the sorption curve would appearbecause of the great différence between values of aluminol-ytterbium and silanol-ytterbiumcomplexation constants. This lack offree aluminols sites is due to the binding on apart ofthemofH4Si04 issued by kaolinite dissolution By including the binding of dissolved H4Si04 onaluminol sites, we obtain a good agreement between calculated and expérimental curves(figures 4 and 5).
•*i .':."•
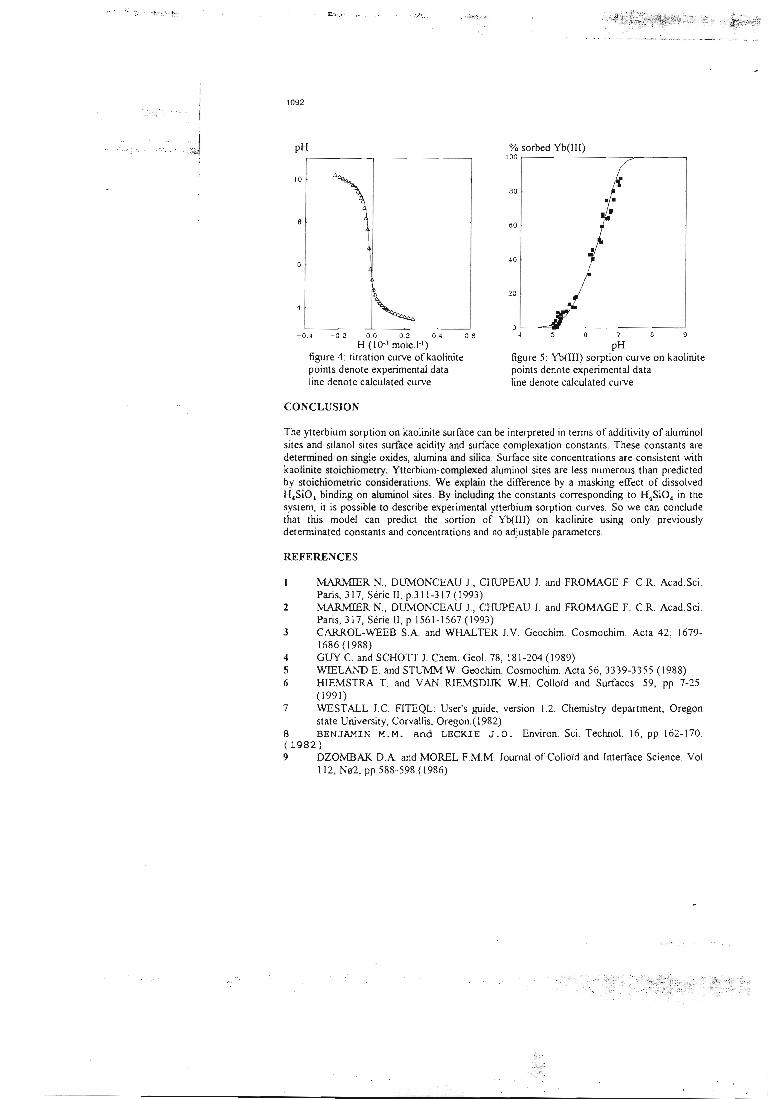
** ig -1 *•*?- •• '•• - .*tt=~»r";'
1092
) 4 -0 2 0.0 0.2 0.4 0
H (10-3 mole.l-1)figure4: titration curveof kaolinitepoints dénote expérimental dataiine dénote calculated curve
% sorbed Yb(III)100
figure 5: Yb(III) sorptioncurveon kaolinitepointsdénote expérimental dataUne dénote calculated curve
CONCLUSION
The ytterbium sorption on kaolinite surface can be interpreted in ternis ofadditivity ofaluminolsites and silanol sites surface acidity and surface complexation constants. Thèseconstants aredetermined onsingle oxides, alumina and silica. Surface site concentrations are consistent withkaolinite stoichiometry. Ytterbium-complexed aluminol sites are less numerous than predictedby stoichiometric considérations We explain the différence by a masking effect of dissolvedH4Si04 binding on aluminol sites. By including the constants corresponding to H4Si04 in theSystem, it is possible to describe expérimental ytterbium sorption curves. So we can concludethat this model can predict the sortion of Yb(III) on kaolinite using only previouslydeterminated constants and concentrations and no adjustable parameters
REFERENCES
8
MARMIER N., DUMONCEAU J., CHUPEAU J. and FROMAGE F. C.R. Acad.Sci.Paris, 317, Série II, p.311-317 (1993)MARMIER N., DUMONCEAU J., CHUPEAU J. and FROMAGE F. C.R. Acad.Sci.Paris, 317, Série II, p.1561-1567 (1993)CARROL-WEEB S.A. and WHALTER J.V Geochim. Cosmochim. Acta 42, 1679-1686(1988)GUY C. and SCHOTT J. Chem. Geol. 78, 181-204 (1989)WIELAND E. and STUMM W. Geochim. Cosmochim. Acta 56; 3339-3355 (1988)HIEMSTRA T. and VAN RIEMSDIJK W.H. Colloid and Surfaces. 59, pp 7-25.(1991)WESTALL J.C. FITEQL: User's guide, version 1.2. Chemistry department, Oregonstate University,Corvallis, Oregon.(1982)BENJAMIN M.M. and LECKIE J.O. Environ. Sci. Technol. 16; pp 162-170.
(1982)9 DZOMBAK D.A. and MOREL F.M.M. Journal of Colloid and Interface Science. Vol
112, N02, pp 588-598.(1986)

ARTICLE N°6
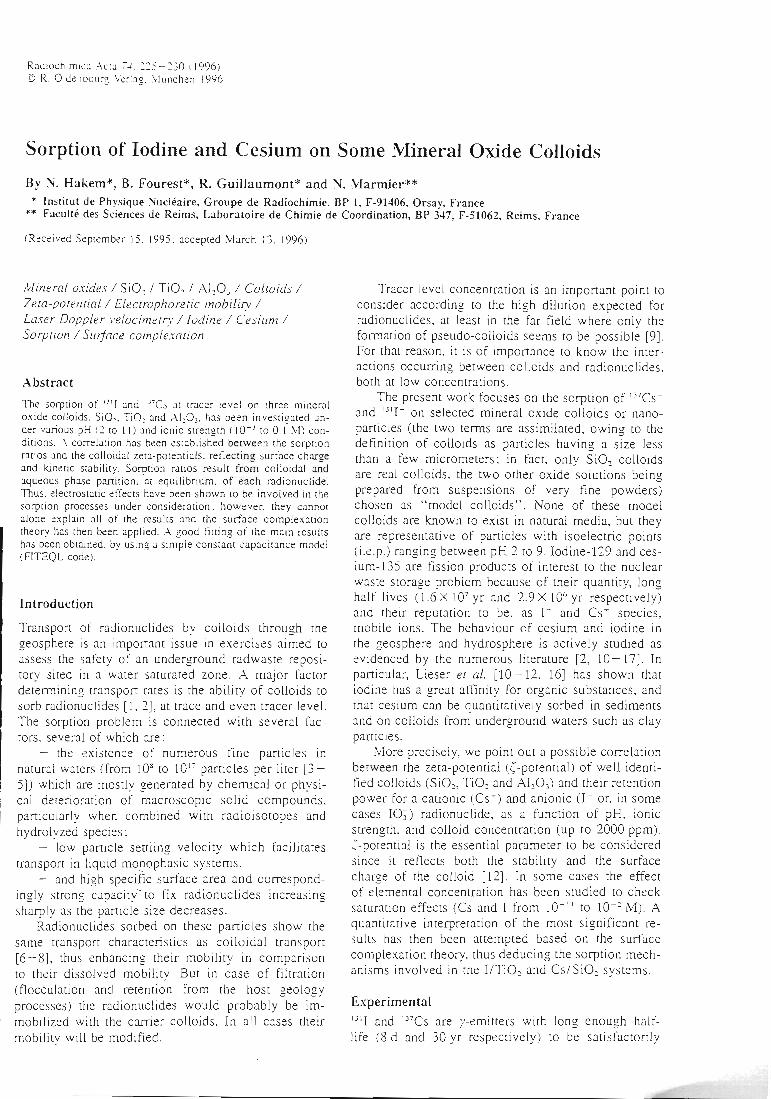
Radiochimica Acta 74. 225-230 11996)S R. Olde.ibourc Verlaa. Munchen 1996
Sorption of lodine and Césium on Some Minerai Oxide Colloids
By N. Hakem*, B. Fourest*, R. Guillaumont* and N. Marmier*** Institut de Physique Nucléaire, Groupe de Radiochimie. BP 1, F-91406, Orsay, France
** Faculté des Sciences de Reims, Laboratoire de Chimie de Coordination, BP 347, F-51062, Reims, France
(Received September 15. 1995; accepted March 13. 1996)
Minerai oxides / SiO: / TiO: / A1203 / Colloids /Zeta-potential / Electrophoretic mobility /Laser Doppler velocimetry / lodine / Césium /Sorption / Surface complexation
Abstract
The sorption of '-"I and ,J7Cs at tracer level on three mineraioxide colloids. SiO-, TiO: and A1:0,, has been investigated under various pH (2 to 11) and ionic strength (10"3 to 0.1 VI) conditions. A corrélation has been established between the sorptionratios and the colloidal zeta-potentials, reflecting surface chargeand kinetic stability. Sorption ratios resuit from colloidal andaqueous phase partition, at equilibrium. of each radionuclide.Thus. electrostatic effects hâve been shown to be involved in thesorption processes under considération: however. they cannotalone explain ail of the results and the surface complexationtheory has then been applied. A good fitting of the main resultshas been obtained. by using a simple constant capacitance model(FITEQL code).
Introduction
Transport of radionuclides by colloids through thegeosphere is an imponant issue in exercises aimed toassess the safety of an underground radwaste reposi-torv sited in a water saturated zone. A major factordetermining transport rates is the ability of colloids tosorb radionuclides [1,2], at trace and even tracer level.The sorption problem is connected with several fac-tors. several of which are :
- the existence of numerous fine particles innatural waters (from 103 to 10'7 particles per liter [3-5]) which are mostly generated by chemical or physi-cal détérioration of macroscopic solid compounds.particularly when combmed with radioisotopes andhydrolyzed species;
- low particle settling velocity which facilitâtestransport in liquid monophasic Systems.
- and high spécifie surface area and correspond-inaly strong capacity" to fix radionuclides increasingsharply as the particle size decreases.
Radionuclides sorbed on thèse particles show thesame transport characteristics as colloidal transport[6-8], thus enhancing their mobility in comparisonto their dissolved mobility. But in case of filtration(flocculation and rétention from the host geologyprocesses) the radionuclides would probably be im-mobilized with the carrier colloids. In ail cases theirmobilitv will be modified.
Tracer level concentration is an important point toconsider according to the high dilution expected forradionuclides. at least in the far field where only theformation of pseudo-colloids seems to be possible [9].For that reason. it is of importance to know the interactions occurring between colloids and radionuclides.both at low concentrations.
The présent work focuses on the sorption of ,37Cs"and l3'I" on selected minerai oxide colloids or nano-
particles (the two terms are assimilated, owing to thedéfinition of colloids as particles having a size lessthan a few micrometers; in fact. only Si02 colloidsare real colloids. the two other oxide solutions beingprepared from suspensions of very fine powders)chosen as "model colloids". None of thèse modelcolloids are known to exist in natural média, but theyare représentative of particles with isoelectric points(i.e.p.) ranging between pH 2 to 9. Iodine-129 and césium-135 are fission products of interest to the nuclearwaste storage problem because of their quantity, longhalf lives (1.6xi07yr and 2.9X10°yr respectively)and their réputation to be. as I" and Cs" species,mobile ions. The behaviour of césium and iodine inthe geosphere and hydrosphère is actively studied asevidenced by the numerous literature [2, 10-17]. Inpamcular, Lieser et ai. [10-12, 16] has shown thatiodine has a great affiniry for organic substances, andthat césium can be quantitatively sorbed in sédimentsand on colloids from underground waters such as clayparticles.
More precisely, we point out a possible corrélationbetween the zeta-potential (ç-potential) of well identi-fied colloids (Si02, Ti02 and AJU03) and their rétentionpower for a cationic (Cs") and anionic (I" or. in somecases 10;:) radionuclide, as a function of pH, ionicstrength. and colloid concentration (up to 2000 ppm).^-potential is the essential parameter to be consideredsince it reflects both the stability and the surfacecharge of the colloid [12], In some cases the effectof elemental concentration has been studied to checksaturation effects (Cs and I from 10"" to 10": M). Aquantitative interprétation of the most significant results has then been attempted based on the surfacecomplexation theory, thus deducing the sorption mech-anisms involved in the I/Ti02 and Cs/SiO: Systems.
Expérimental
13II and ,37Cs are y-emitters with long enough half-life (8 d and 30 yr respectively) to be satisfactorily
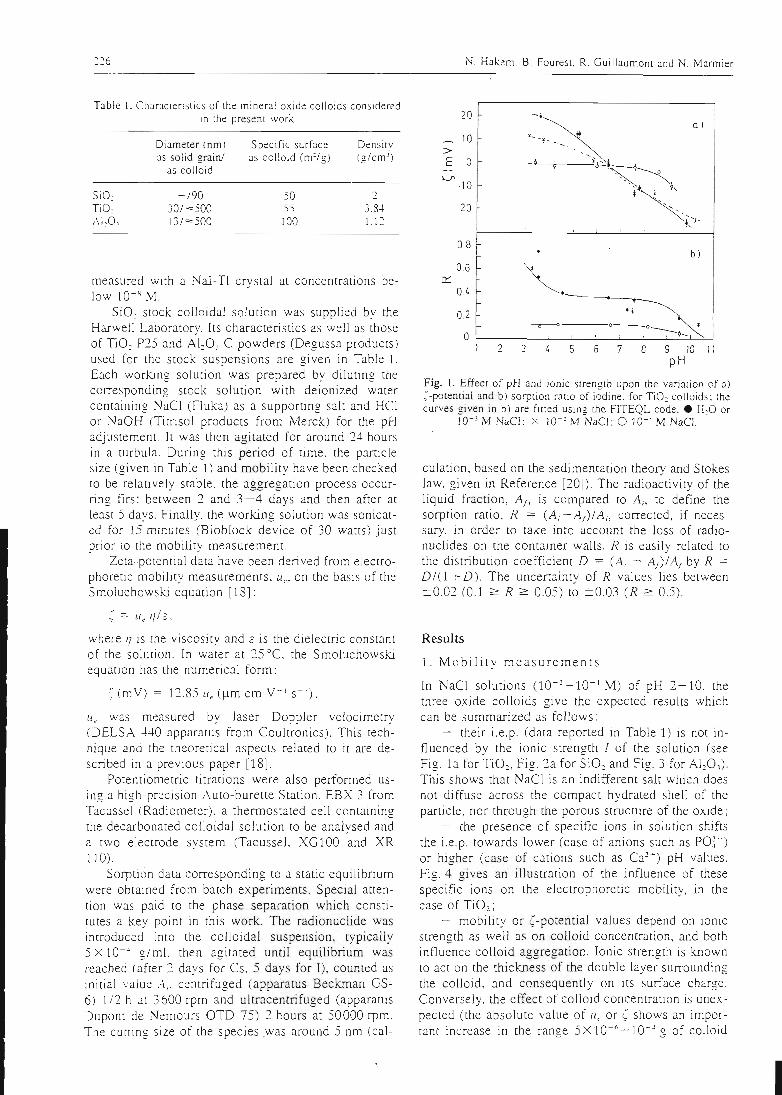
226
Table 1. Characteristics of the minerai oxide colloids considered
in the présent work
SiO-
TiO-
AfÔ,
Diameter (nm)
as solid grain/as colloid
-/90
30/=500
13/ = 500
Spécifie surfaceas colloid (mVs)
50
55
100
Density(s/ern1)
2
3.S4
1.12
measured with a Nal-Tl crystal at concentrations be-low 1er8 m.
SiO: stock colloidal solution was supplied by theHarwell Laboratory. Its characteristics as well as thoseof Ti02 P25 and AfO., C powders (Degussa products)used for the stock suspensions are given in Table 1.Each working solution was prepared by diluting thecorresponding stock solution with deionized watercontaining NaCl (Fluka) as a supporting sait and HC1or NaOH (Titrisol products from Merck) for the pHadjustement. It was then agitated for around 24 hoursin a turbula. Dunng this period of time. the particlesize (given in Table 1) and mobility hâve been checkedto be relatively stable, the aggregation process occur-ring first between 2 and 3—4 days and then after atleast 5 days. Finally. the working solution was sonicat-ed for 15 minutes (Bioblock device of 30 watts) justprior to the mobility measurement.
Zeta-potential data hâve been derived from electro-phoretic mobility measurements. u„ on the basis of theSmoluchowski équation [18]:
l = ti, ij/a.
where >j is the viscosity and s is the dielectric constantof the solution. In water at 25 °C. the Smoluchowski
équation has the numerical form:
CimV) = 12.85 ««.(umern V"' s"').
u, was measured by laser Doppler velocimetry(DELSA 440 apparatus from Coultronics). This technique and the theoretical aspects related to it are described in a previous paper [18].
Potentiometric titrations were also performed using a high-precision Auto-burette Station. EBX 3 fromTacussel (Radiometer). a thermostated cell containingthe decarbonated colloidal solution to be analysed anda two électrode System (Tacussel. XG100 and XR110).
Sorption data corresponding to a static equilibriumwere obtained from batch experiments. Spécial attention was paid to the phase séparation which consti-tutes a key point in this work. The radionuclide wasintroduced into the colloidal suspension, typically5xl0~a g/ml, then agitated until equilibrium wasreached (after 2 days for Cs. 5 days for I), counted asinitial value .4,, centrifuged (apparatus Beckman GS-6) 1/2 h at 3600rpm and ultracentrifuged (apparatusDupont de Nemours OTD 75) 2 hours at 50000 rpm.The cutting size of the species was around 5 nm (cal-
N. Hakem. B. Fourest. R. Guillaumont and N. Marinier
Fig. 1. Effect of pH and ionic strength upon the variation of a)^'-potential and b) sorption ratio of iodine. for TiO; colloids; thecurves given in b) are fitted using the FITEQL code. • H;0 or
1Q-'M NaCl: x IO^M NaCl; O 10"' M NaCl.
culation. based on the sédimentation theory and Stokeslaw. given in Référence [20]). The radioactivity of theIiquid fraction, Af, is compared to A„ to define thesorption ratio, R = (A,~Af)IA„ corrected, if neces-sary, in order to take into account the loss of radionuclides on the container walls. R is easily related tothe distribution coefficient D = (A, - Af)IAf by R =Dl(\ +£>). The uncertainty of R values lies between±0.02 (0.1 > R > 0.05) to ±0.03 (R > 0.5).
Results
1. Mobility measurements
In NaCl solutions (10"3-10"'M) of pH 2-10. thethree oxide colloids give the expected results whichcan be summarized as follows:
- their i.e.p. (data reported in Table 1) is not in-fluenced by the ionic strength / of the solution (seeFig. la for Ti02, Fig. 2a for Si02 and Fig. 3 for A120,).This shows that NaCl is an indiffèrent sait which does
not diffuse across the compact hydrated shell of theparticle, nor through the porous structure of the oxide;
- the présence of spécifie ions in solution shiftsthe i.e.p. towards lower (case of anions such as POi")or higher (case of cations such as Ca2") pH values.Fig. 4 gives an illustration of the influence of thèsespécifie ions on the electrophoretic mobility, in thecase of Ti02;
- mobility or T-potential values dépend on ionicstrength as well as on colloid concentration, and bothinfluence colloid aggregation. Ionic strength is knownto act on the thickness of the double laver surroundingthe colloid. and consequently on its surface charge.Conversely, the effect of colloid concentration is unex-pected (the absolute value of «,, or ç shows an important increase in the ranse 5X10"*—10~J 2 of colloid
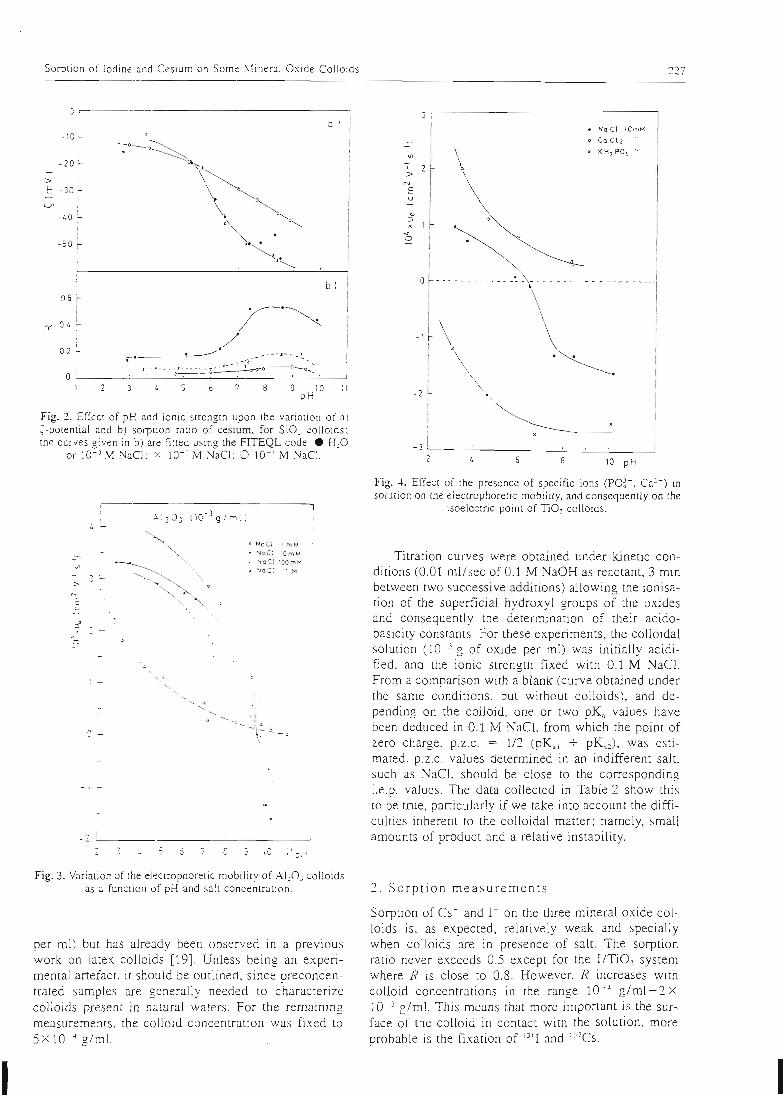
Sorption of lodine and Césium on Some Minerai O.xide Colloids 227
-10
-20 '
E -30 '
a !
1
-50 (-
i
V5\
j
b) 1
0.6 -
\ • j* •—^
o.. L/
^\
02
0
0 -
• I -
3 4 5 6 7 9 10 ilPH
Fig. 2. Effect of pH and ionic strength upon the variation of a)T-potential and b) sorption ratio of césium, for SiO; colloids;the curves given in b) are fitted using the FITEQL code. • H-0
or 10r' M NaCl; X 10~:.M NaCl: O 10"' M NaCl.
A1203 (1C"J g / ml)
NaCi i m
"JaC: '0 m
NaCl '00n
Fig. 3. Variation of the electrophoretic mobility of A1:03 colloidsas a function of pH and sait concentration.
per ml) but has already been observed in a previouswork on latex colloids [19]. Unless being an expérimental artefact, it should be outlined, since preconcen-trated samples are generally needed to characterizecolloids présent in natural waters. For the remainingmeasurements. the colloid concentration was fixed to
5X10"-1 s/ml.
NaCl lOmM
Cadz "
KH,PO, "
Fig. 4. Effect of the présence of spécifie ions (PO1-, Ca:~) insolution on the electrophoretic mobility, and consequently on the
isoelectric point of Ti02 colloids.
Titration curves were obtained under kinetic conditions (0.01 ml/sec of 0.1 M NaOH as reactant, 3 mmbetween two successive additions) allowing the ionisation of the superficial hydroxyl groups of the oxidesand consequently the détermination of their acido-basicity constants. For thèse experiments, the colloidalsolution (10"3g of oxide per ml) was initially acidi-fied, and the ionic strength fixed with 0.1 M NaCl.From a comparison with a blank (curve obtained underthe same conditions, but without colloids), and de-pending on the colloid, one or two pKa values hâvebeen deduced in 0.1 M NaCl. from which the point ofzéro charge, p.z.c. = 1/2 (pKal + pKa2), was estimated. p.z.c. values determined in an indiffèrent sait,such as NaCl. should be close to the correspondingi.e.p, values. The data collected in Table 2 show thisto be true, particularly if we take into account the diffi-culties inhérent to the colloidal matter; namely, smallamounts of product and a relative instability.
2. Sorption measurements
Sorption of Cs* and I" on the three minerai oxide colloids is. as expected, relatively weak and speciallywhen colloids are in présence of sait. The sorptionratio never exceeds 0.5 except for the I/Ti02 Systemwhere R is close to 0.8. However, R increases with
colloid concentrations in the range 10~4 g/ml—2X10~3 g/ml. This means that more important is the surface of the colloid in contact with the solution, more
probable is the fixation of l3'I and ,37Cs.
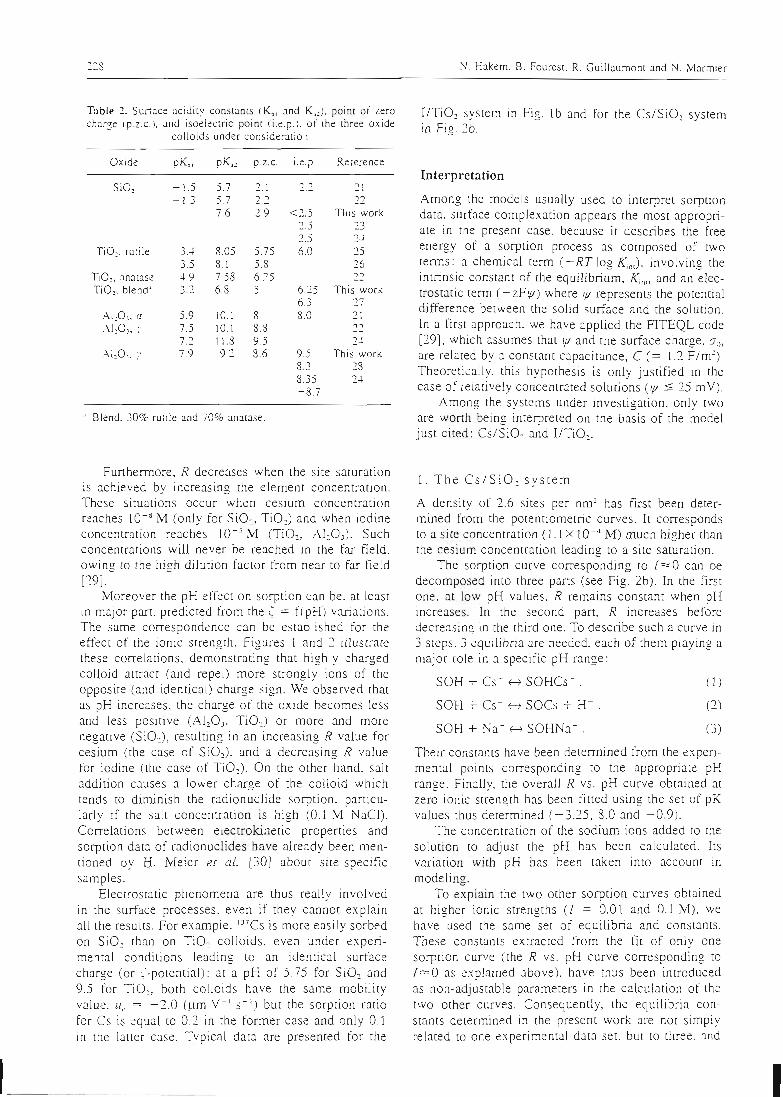
22S
Table 2. Surface acidity constants (K,,, and K,.). point of zérocharge ip.z.c), and isoelectnc point (i.e.p.). of the three oxide
colloids under considération
Oxide
SiO,
TiO:, rutile
TiO:, anataseTiO:, blendJ
AljO», aA130„ y
A1,0,. ;•
pKal piC,. p.z.i
-1.5
-1.3
3.4
3.5
4.9
3.2
5.9
7.5
7.2
7.9
5.7
5.7
7.6
8.05
8.1
7.58
6.8
10.1
10.1
11.8
9.2
2.1
2.2
2.9
5.75
5.8
6.25
5
8
8.8
9.5
8.6
J Blend. 30% rutile and 70% anatase.
i.e.p.
<2.5
2.5
2.5
6.0
6.25
6.3
8.0
9.5
8.3
8.35
-8.7
Référence
21
22
This work
23
24
25
26->2
This worki~j
21
24
This work
28
24
Furthermore, R decreases when the site saturationis achieved by increasing the élément concentration.Thèse situations occur when césium concentration
reaches I0"a M (only for Si02, Ti02) and when iodineconcentration reaches 10"5 M (Ti02, A120:,). Suchconcentrations will never be reached in the far field.owins to the hish dilution factor from near to far field
[29].Moreover the pH effect on sorption can be. at least
in major part, predicted from the Ç= f(pH) variations.The same correspondence can be established for theeffect of the ionic strength. Figures 1 and 2 iilustratethèse corrélations, demonstrating that highly chargedcolloid attract (and repel) more strongly ions of theopposite (and identical) charge sign. We observed thatas pH increases, the charge of the oxide becomes lessand less positive (A1203, Ti02) or more and morenégative (Si02), resulting in an increasing R value forcésium (the case of Si02), and a decreasing R valuefor iodine (the case of Ti02). On the other hand. saitaddition causes a lower charge of the colloid whichtends to diminish the radionuclide sorption. particu-larly if the sait concentration is high (0.1 M NaCl).Corrélations between electrokinetic properties andsorption data of radionuclides hâve already been men-tioned by H. Meier et ai [30] about site-specificsamples.
Electrostatic phenomena are thus really involvedin the surface processes, even if they cannot explainail the results. For example. l37Cs is more easily sorbedon Si02 than on Ti02 colloids, even under expérimental conditions leading to an identical surfacecharge (or u-potential): at a pH of 5.75 for Si02 and9.5 for TiO:. both colloids hâve the same mobilityvalue. //, = -2.0 (um V"1 s"') but the sorption ratiofor Cs is equal to 0.2 in the former case and only 0.1in the latter case. Typical data are presented for the
N. Hakem. B. Fourest. R. Guillaumont and N. Marmier
I/Ti02 system in Fig. lb and for the Cs/SiO: Systemin Fis. 2b.
Interprétation
Among the models usually used to interpret sorptiondata, surface complexation appears the most appropri-ate in the présent case, because it describes the freeenergy of a sorption process as composed of twoterms: a chemical term (-/?Tlog K,m), involving theintrinsic constant of the equilibrium, Kmi, and an electrostatic term (—zFi//) where >// represents the potentialdifférence between the solid surface and the solution.
In a first approach. we hâve applied the FITEQL code[29], which assumes that i// and the surface charge. a„,are related by a constant capacitance, C (= 1.2 F/m-).Theoretically, this hypothesis is only justified in thecase of relatively concentrated solutions (f S 25 mV).
Among the Systems under investigation, only twoare worth being interpreted on the basis of the modeljust cited: Cs/Si02 and I/Ti02.
1. The Cs/Si02 System
A density of 2.6 sites per nm2 has first been determined from the potentiometric curves. It correspondsto a site concentration (1.1X10"4M) much higher thanthe césium concentration leading to a site saturation.
The sorption curve corresponding to /«0 can bedecomposed into three parts (see Fig. 2b). In the firstone. at low pH values, R remains constant when pHincreases. In the second part, R increases beforedecreasing in the third one. To describe such a curve in3 steps, 3 equilibria are needed. each of them playing amajor rôle in a spécifie pH range:
SOH + Cs' <r-> SOHCs- ,
SOH + Cs" <h>SOCs + H'
SOH + Na" *-» SOHNa" .
(1)
(2)
(3)
Their constants hâve been determined from the expérimental points corresponding to the appropnate pHrange. Finally. the overall R vs. pH curve obtained atzéro ionic strength has been fitted using the set of pKvalues thus determined (-3.25, 8.0 and -0.9).
The concentration of the sodium ions added to thesolution to adjust the pH has been calculated. Itsvariation with pH has been taken into account inmodeling.
To explain the two other sorption curves obtainedat higher ionic strengths (/ = 0.01 and 0.1 M), wehâve used the same set of equilibria and constants.Thèse constants extracted from the fit of only onesorption curve (the R vs. pH curve corresponding to1—0 as explained above), hâve thus been introducedas non-adjustable parameters in the calculation of thetwo other curves. Consequently, the equilibria constants determined in the présent work are not simplyrelated to one expérimental data set. but to three, and
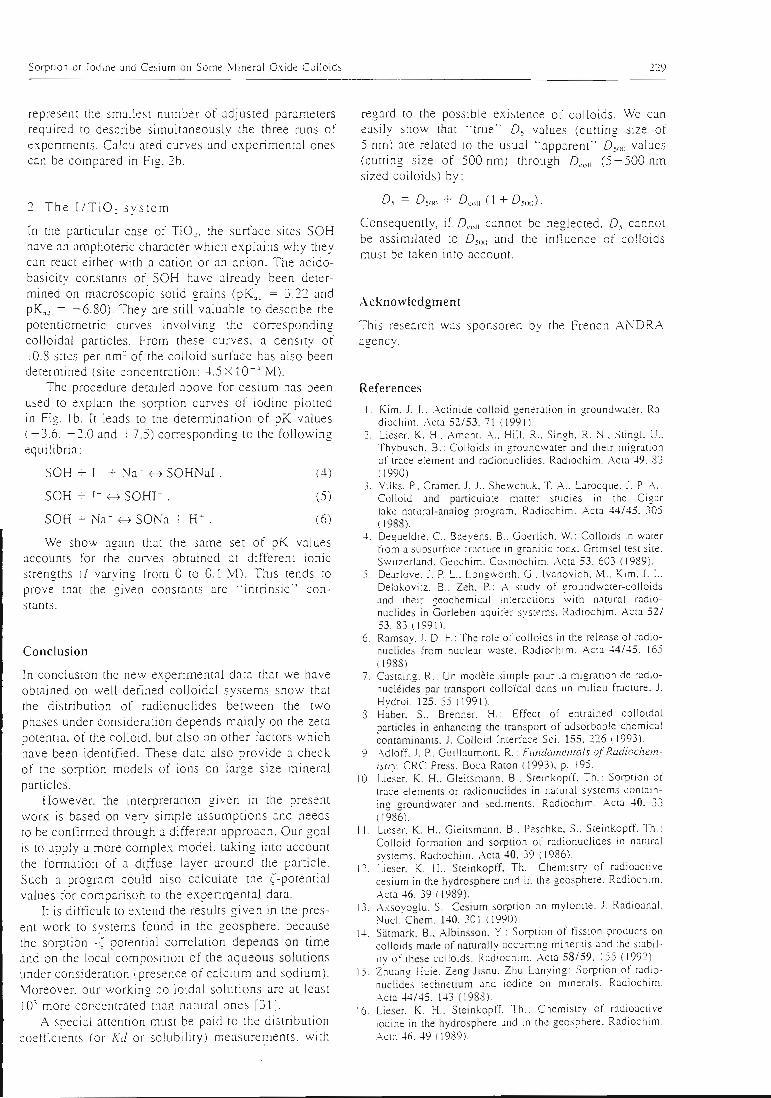
Sorption ot Iodine and Césium on Some Minerai O.xide Colloids
represent the smallest number of adjusted parametersrequired to describe simultaneously the three runs ofexperiments. Calculated curves and expérimental onescan be compared in Fig. 2b.
2. The I/TiO: System
In the particular case of Ti02, the surface sites SOHhâve an amphoteric character which explains why theycan react either with a cation or an anion. The acido-
basicity constants of SOH hâve already been determined on macroscopic solid grains (pK3l = 3.22 andpKa2 = -6.80). They are still valuable to describe thepotentiometric curves involving the correspondingcolloidal particles. From thèse curves. a density of10.8 sites per nirf of the colloid surface has also beendetermined (site concentration: 4.5 X10"4 M).
The procédure detailed above for césium has beenused to explain the sorption curves of iodine plottedin Fig. lb. It leads to the détermination of pK values( -3.6. -2.0 and +7.5) corresponding to the followingequilibria:
SOH + r Na" <-> SOHNal,
soh - r«-»soHr.
SOH - Ma" ^>SONa 4- H" .
(4)
(5)
(6)
We show again that the same set of pK valuesaccounts for the curves obtained at différent ionic
strengths (/ varying from 0 to 0.1 VI). This tends toprove that the given constants are "intrinsic" constants.
Conclusion
In conclusion the new expérimental data that we hâveobtained on well defined colloidal Systems show thatthe distribution of radionuclides between the two
phases under considération dépends mainly on the zêtapotential of the colloid. but also on other factors whichhâve been identified. Thèse data also provide a checkof the sorption models of ions on large size mineraiparticles.
However. the interprétation given in the présentwork is based on very simple assumptions and needsto be confirmed through a différent approach. Our goalis to apply a more complex model. taking into accountthe formation of a diffuse laver around the particle.Such a program could also calculate the ç-potentialvalues for comparisoh to the expérimental data.
It is difficult to extend the results given in the présent work to Systems found in the geosphere. becausethe sorption -" potential corrélation dépends on timeand on the local composition of the aqueous solutionsunder considération (présence of calcium and sodium).Moreover. our working colloidal solutions are at least103 more concentrated than natural ones [31].
A spécial attention must be paid to the distributioncoefficients (or Kd or solubilitv) measurements. with
229
regard to the possible existence of colloids. We caneasily show that '"true" D5 values (cutting size of5 nm) are related to the usual '-apparent" D5()0 values(cutting size of 500 nm) through Dcoll (5-500 nmsized colloids) by:
D5 = D5m + Dcl,„(l+D500).
Consequently, if DaM cannot be neglected, D5 cannotbe assimilated to DinH and the influence of colloidsmust be taken into account.
Acknowledgment
This research was sponsored by the French ANDRAasencv.
Références
1. Kim. J. t.: Actinide colloid génération in groundwaier. Ra-diochim. Acta 52/53. 71 (1991).
2. Lieser, K. H.. Ament. A.. Hill. R.. Singh. R. N.. Stingl. ILThybusch. B.: Colloids in groundwater and their migrationof trace élément and radionuclides. Radiochim. Acta 49. 83
(1990).3. Vilks. P.. Cramer. J. J.. Shewchuk. T. A.. Larocque. J. P. A.:
Colloid and particulate matter studies in the Cigarlake natural-analog program. Radiochim. Acta 44/45. 305(1988).
4. Degueldre. C. Baeyens. B.. Goerlich. W.: Colloids in waterfrom a subsurface fracture in granitic rock. Grimsel test site.Switzerland. Geochim. Cosmochim. Acta 53, 603 (1989).
5. Dearlove, J. P. L.. Longworth, G.. Ivanovich. M.. Kim. J. !..Delakovitz. B.. Zeh. P.: A study of groundwater-colloidsand their geochemical inieractions with natural radionuclides in Gorleben aquifer Systems. Radiochim. Acta 52/53. 83 (1991).
6. Ramsay. J. D. F. : The rôle of colloids in the release of radionuclides from nuclear waste, Radiochim. Acta 44/45. 165
(1988).
7. Castaing, R.: Un modèle simple pour la migration de radio-nucléides par transport colloïdal dans un milieu fracture, J.Hydrol. 125. 55 (1991).
8. Haber. S.. Brenner. H.: Effect of entrained colloïdalparticles in enhancing the transport of adsorbable chemicalcontaminants. J. Colloid Interface Sci. 155. 226 ( 1993).
9. Adloff. J. ?.. Guillaumont. R.: Fitndamentats of Radiochem-istry. CRC Press. Boca Raton (1993). p. 195.
10. Lieser. K. H.. Gleitsmann. B.. Steinkopff. Th.: Sorption oftrace éléments or radionuclides in natural Systems contamina aroundwater and sédiments. Radiochim. Acta 40. 33(1986).
11. Lieser. K. H.. Gleitsmann, B.. Peschke. S., Steinkopff. Th.:Colloid formation and sorption ot radionuclides in naturalSystems. Radiochim. Acta 40. 39 (1986).
12. Lieser. K. H.. Steinkopff. Th.: Chemistry of radioactivecésium in the hydrosphère and in the geosphere. Radiochim.Acta 46, 39 (1989).
13. Aksovoalu. S.: Césium sorption on mylonite. J. Radioanal.Nucl.'Cnem. 140, 301 (1990).
14. Siitmark. B.. Albinsson. Y.: Sorption of fission products oncolloids made of naturaily occurring minerais and the stability of thèse colloids. Radiochim. Acta 58/59. 155 (1992).
15. Zhuang Huie. Zeng Jishu. Zhu Lanying: Sorption of radionuclides technetium and iodine on minerais. Radiochim.Acta 44/45. 143 (1988).
16. Lieser, K. H.. Steinkopff. Th.: Chemistry of radioactiveiodine in the hydrosphère and in the geosphere, Radiochim.Acta 46. 49 (1989).
17. Puis. R, W.. Powell. R. M,: Transport of inorganic colloidsthrough natural aquifer matenal: Implication for contaminant transport. Environ. Sci. Technol. 26. 614 (1992).
18. Hiemenz. P. C: Pri'nciples of colloid andsurface chemistry,2M Edition. Marcel DekJcer. New York (1986). p. 751.
19. Fourest. B.. Hakem, N.. Guillaumont R.: Charactenzationof colloids bv measurement of their mobilities. Radiochim.
Acta 66/67. 173 (1994).20. Hakem, N.: Caractérisation des colloïdes de SiO-, TiO: et
AJ3O3, et leur rôle dans la sorption du césium et de l'iode,thesis n" 3631. Orsay-Paris XI (1995).
21. Bousse. L.. Meindel. J. D.: Surface potential pH characteristics in the theory of ihe oxide electrolyte interface. In:Ceochemical processes at minerai surfaces, chap. 5. Ain.Chem. Soc. (1986), p. 79.
22. Sigg, L.. Stumm. W.. Behra. P.: Chimie des milieux aquatiques, Masson. Paris (1992), p. 314.
23. Axelos. M.. M'Pandou. A.. Mazilier. C: Dissertations.24. Schindler. P. W.. Stumm. W. ; Chemistry of the solid water
interface, Wiley. New York (1992). p. 83.
N. Hakem. B. Fourest, R. Guillaumont and N. Marmier
25. Dzombak. D. A.. Morel. M. M.: Adsorption of inorganicpollutants m aquatic Systems, Wiley ( 1990). p. 430.
26. Simon. C: Coagulation andflocculation. chap. Il, Dobias(éd.), M. Dekker, New York (1993). p. 504.
27. Mazilier. C; Etude des propriétés physico-chimiques del'interface développée entre le dioxyde de tantane et diverses solutions aqueuses, thesis n" 3631, Pans VI (1988).
28. Somasundaran. P.. Ramachandran, R.: Coagulation andFlocculation, chap. 13, Dobias (éd.), M. Dekker. New York(1993), p. 645.
29. Guillaumont. R.: Radiochemical Approach to the Migrationof Eléments from the Radwaste Repository, Radiochim.Acta 66/67, 231 (1994).
30. Meier. H.. Zimmerhackl. E.. Zeitler, G.. Menge, P.: Corrélations of Elecirokinetic Properties of Sorption Data ofRadionuclides in Site-Specific Samples. Radiochim. Acta52/53. 195 (1991).
31. Degueldre. C. A.: Colloid Properties in Groundwaters fromCrystalline Formations, PSI and NAGRA NTB 92-05 report.

ARTICLE N°7
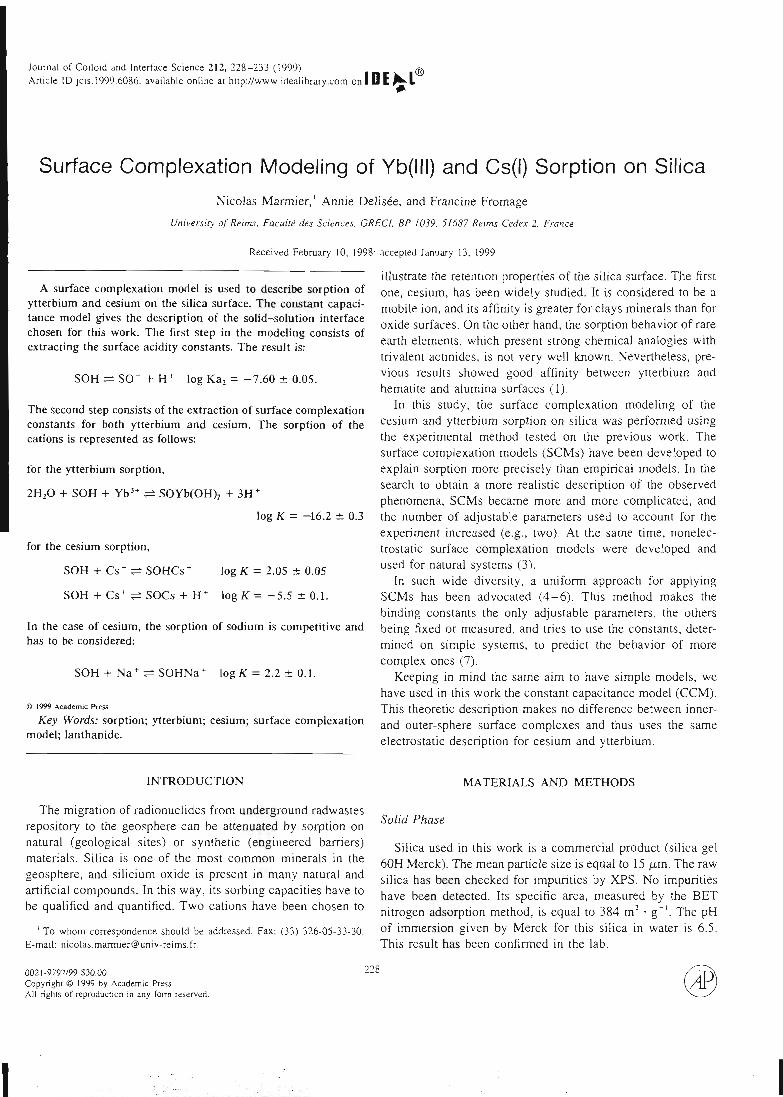
Journal of Colloid and Interface Science 212, 228-233 (1999) ([Article ID jcis. 1999.6086. available online at http://www.idealibrary.com on I DEJ^-L
Surface Complexation Modeling of Yb(lll) and Cs(l) Sorption on SilicaNicolas Marmier, ' Annie Delisée, and Francine Fromage
University of Reims, Faculté des Sciences. GRECI. BP 1039, 51687 Reims Cedex 2, France
Received February 10, 1998; accepted January 13, 1999
A surface complexation model is used to describe sorption ofytterbium and césium on the silica surface. The constant capacitance model gives the description of the solid-solution interfacechosen for this work. The first step in the modeling consists ofextracting the surface acidity constants. The resuit is:
SOH^SO+H + log Ka2 = -7.60 ± 0.05.
The secondstep consistsof the extraction of surface complexationconstants for both ytterbium and césium. The sorption of thecations is represented as follows:
for the ytterbium sorption,
2H20 4- SOH + Yb3+ ;± SOYb(OH)2 + 3H +
log K - -16.2 ± 0.3
for the césium sorption,
SOH -I- Cs + ?± SOHCs + log K = 2.05 ± 0.05
SOH 4-Cs+^SOCs+ H+ log AT = -5.5 ± 0.1.
In the case of césium, the sorption of sodium is compétitive andhas to be considered;
SOH + Na+ ^SOHNa+ log K = 2.2 ± 0.1.
© 1999 Académie Press
Key Words: sorption; ytterbium; césium; surface complexationmodel; lanthanide.
INTRODUCTION
The migration of radionuclides from underground radwastesrepository to the geosphere can be attenuated by sorption onnatural (geological sites) or synthetic (engineered barriers)materials. Silica is one of the most common minerais in the
geosphere, and silicium oxide is présent in many natural andartificialcompounds. In this way, its sorbing capacities hâve tobe qualified and quantified. Two cations hâve been chosen to
1To whom correspondance should be addressed. Fax: (33) 326-05-33-30.E-mail: [email protected].
0021-9797/99 S30.00 228Copyright © 1999 by Académie PressAil rights of reproduction in any form reserved.
illustrate the rétention properties of the silica surface. The firstone, césium, has been widely studied. It is considered to be amobile ion, and its affinity is greater for clays minerais than foroxide surfaces. On the other hand, the sorption behavior of rareearth éléments, which présent strong chemical analogies withtrivalent actinides, is not very well known. Nevertheless, pre-vious results showed good affinity between ytterbium andhématite and alumina surfaces (1).
In this study, the surface complexation modeling of thecésium and ytterbium sorption on silica was performed usingthe expérimental method tested on the previous work. Thesurface complexation models (SCMs) hâve been developed toexplain sorption more precisely than empirical models. In thesearch to obtain a more realistic description of the observedphenomena, SCMs became more and more complicated, andthe number of adjustable parameters used to account for theexperiment increased (e.g„ two). At the same time, nonelec-trostatic surface complexation models were developed andused for natural Systems (3).
In such wide diversity, a uniform approach for applyingSCMs has been advocated (4-6). This method makes thebinding constants the only adjustable parameters, the othersbeing fixed or measured, and tries to use the constants, determined on simple Systems, to predict the behavior of morecomplex ones (7).
Keeping in mind the same aim to hâve simple models, wehâve used in this work the constant capacitance model (CCM).This theoretic description makes no différence between inner-and outer-sphere surface complexes and thus uses the sameelectrostatic description for césium and ytterbium.
MATERIALS AND METHODS
Solid Phase
Silica used in this work is a commercial product (silica gel60H Merck). The mean particle size is equal to 15 yxm. The rawsilica has been checked for impurities by XPS. No impuritieshâve been detected. Its spécifie area, measured by the BETnitrogen adsorption method, is equal to 384 m2 • g"1. The pHof immersion given by Merck for this silica in water is 6.5.This resuit has been confirmed in the lab.
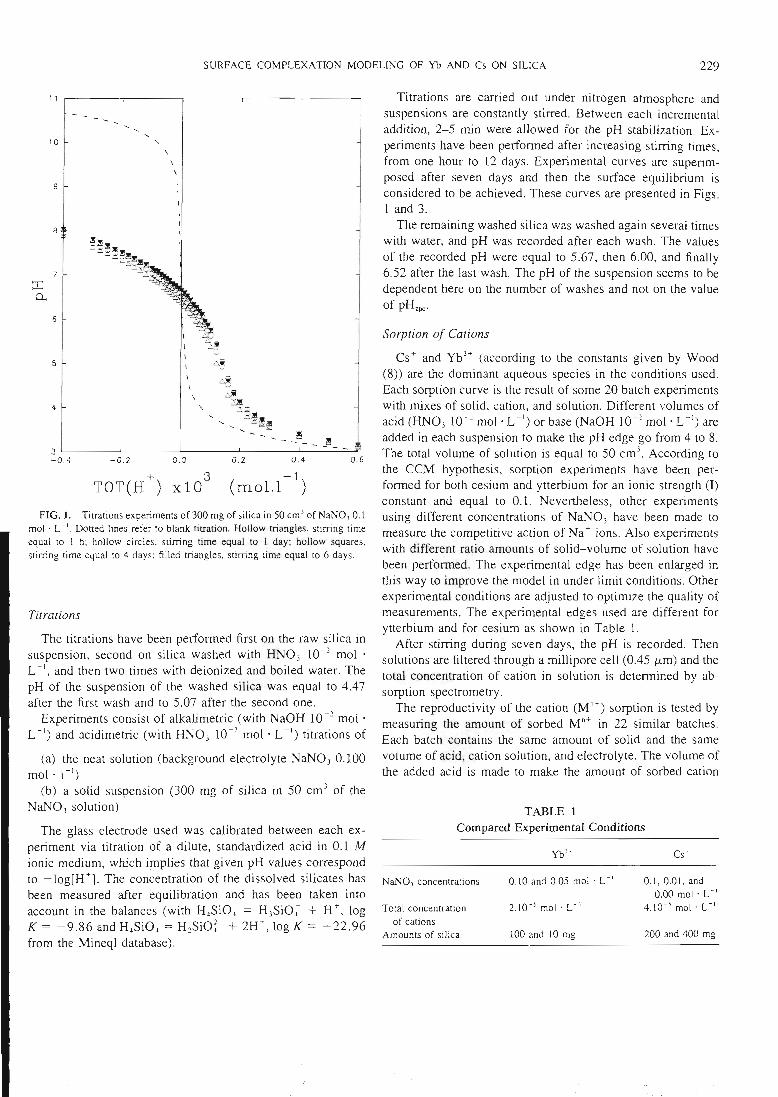
SURFACE COMPLEXATION MODELING OF Yb AND Cs ON SILICA 229
-0.2 0.0 0.2 OA 0.6
T0T(H+) xlO3 (mol.l l)FIG. 1. Titrationsexperiments of 300 mg of silica in 50 cm3 of NaNOj 0.1
mol • L"1. Dotted Unes refer to blank titration. Hollow triangles, stirring timeequal to 1 h; hollow circles, stirring time equal to 1 day; hollow squares,stirring time equal to 4 days; filled triangles, stirring time equal to 6 days.
Titrations
The titrations hâve been performed first on the raw silica insuspension, second on silica washed with HN03 10": mol •L"', and then two times with deionized and boiled water. ThepH of the suspension of the washed silica was equal to 4.47after the first wash and to 5.07 after the second one.
Experiments consist of alkalimetric (with NaOH 10"2 mol •L"') and acidimétrie (with HN03 10"2 mol • L"1) titrations of
(a) the neat solution (background electrolyte NaN03 0.100mol • l"1)
(b) a solid suspension (300 mg of silica in 50 cm3 of theNaN03 solution)
The glass électrode used was calibrated between each ex-periment via titration of a dilute, standardized acid in 0.1 Mionic médium, which implies that given pH values correspondto —log[H +]. The concentration of the dissolved silicates hasbeen measured after équilibration and has been taken intoaccount in the balances (with H4Si04 = H3Si07 + H+, logK = -9.86 and H4Si04 = H2Si042" + 2H+, log K = -22.96from the Mineql database).
Titrations are carried out under nitrogen atmosphère andsuspensions are constantly stirred. Between each incrémentaladdition, 2-5 min were allowed for the pH stabilization. Experiments hâve been performed after increasing stirring times,from one hour to 12 days. Expérimental curves are superimposed after seven days and then the surface equilibrium isconsidered to be achieved. Thèse curves are presented in Figs.1 and 3.
The remaining washed silica was washed again several timeswith water, and pH was recorded after each wash. The valuesof the recorded pH were equal to 5.67, then 6.00, and finally6.52 after the last wash. The pH of the suspension seems to bedépendent hère on the number of washes and not on the valueof pHzpc.
Sorption of Cations
Cs+ and Yb3+ (according to the constants given by Wood(8)) are the dominant aqueous species in the conditions used.Each sorption curve is the resuit of some 20 batch experimentswith mixes of solid, cation, and solution. Différent volumes of
acid (HN03 10": mol •L"') or base (NaOH 10"2 mol •L"1) areadded in each suspension to make the pH edge go from 4 to 8.The total volume of solution is equal to 50 cm3. According tothe CCM hypothesis, sorption experiments hâve been performed for both césium and ytterbium for an ionic strength (I)constant and equal to 0.1. Nevertheless, other experimentsusing différent concentrations of NaN03 hâve been made tomeasure the compétitive action of Na+ ions. Also experimentswith différent ratio amounts of solid-volume of solution hâve
been performed. The expérimental edge has been enlarged inthis way to improve the model in under limit conditions. Otherexpérimental conditions are adjusted to optimize the quality ofmeasurements. The expérimental edges used are différent forytterbium and for césium as shown in Table 1.
After stirring during seven days, the pH is recorded. Thensolutions are filtered through a millipore cell (0.45 u.m) and thetotal concentration of cation in solution is determined by absorption spectrometry.
The reproductivity of the cation (M°+) sorption is tested bymeasuring the amount of sorbed M"T in 22 similar batches.Each batch contains the same amount of solid and the same
volume of acid, cation solution, and electrolyte. The volume ofthe added acid is made to make the amount of sorbed cation
TABLE 1
Compared Expérimental Conditions
NaNO) concentrations
Total concentration
of cations
Amounts of silica
YbJ
0.10 and 0.05 mol • L~
2.10"5 mol • L"'
100 and 10 mg
CV
0.1, 0.01, and
0.00 mol • L''
4.10"5 mol • L"1
200 and 400 mg
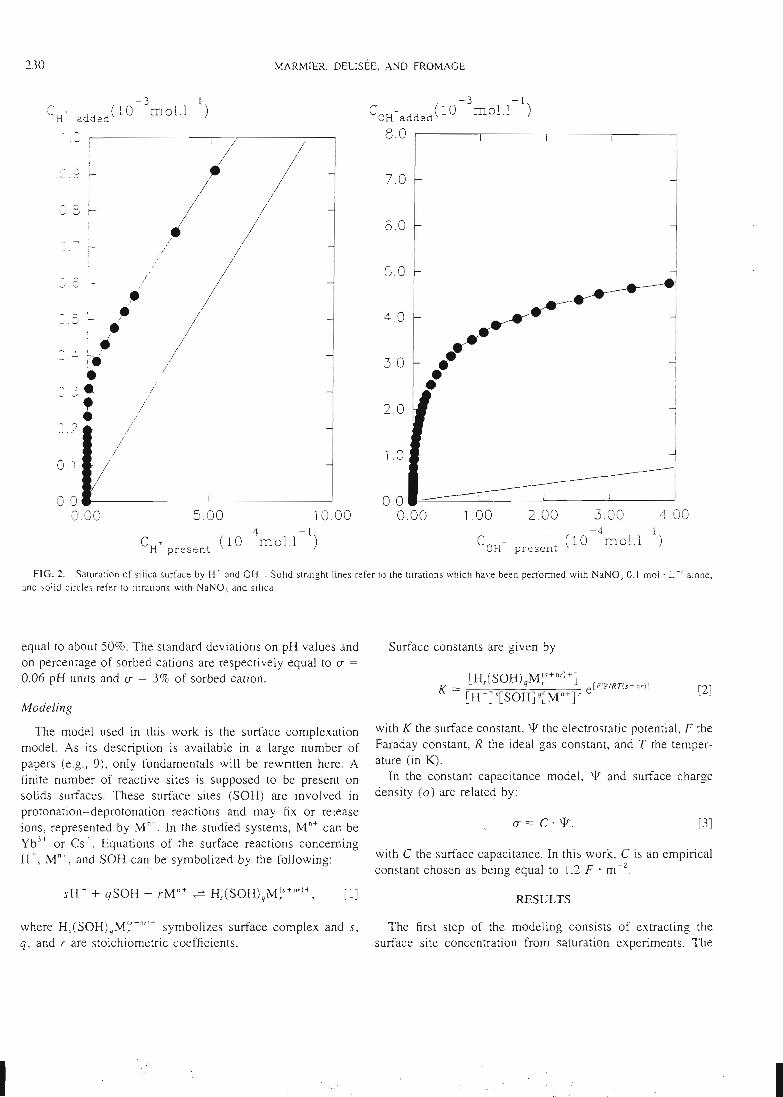
230 MARMIER. DELISEE. AND FROMAGE
(10 3mol.l )'H added
c.„- A. iio 3moi.i l;OH addedv '
10.00
C - . (10 4mol.l *)H présent
0.00 1.00 2.00 3.00 4.00-i.
'OH prese. (10 mol.l )
nt v
FIG. 2. Saturation of silicasurface by H" and OH . Solid straight Unes refer to the titrations which hâve beenperformed with NaNO, 0.1 mol • L ' alone,and solid circles refer to titrations with NaNO, and silica.
equal to about 50%. The standard déviations on pH values andon percentage of sorbed cations are respectively equal to cr =0.06 pH units and cr = 3% of sorbed cation.
Modeling
The model used in this work is the surface complexationmodel. As its description is available in a large number ofpapers (e.g., 9), only fundamentals will be rewritten hère. Afinite number of reactive sites is supposed to be présent onsolids surfaces. Thèse surface sites (SOH) are involved in
protonation-deprotonation reactions and may fix or releaseions, represented by Mn". In the studied Systems, Mn+ can beYb3+ or Cs". Equations of the surface reactions concemingH+, M"T, and SOH can be symbolized by the following:
.y H" + qSOH + rM"' H,(SOH)?Mrnr,+, [1]
Surface constants are given by
K =[Hs(SOH),M<s+nr) +][H4-]![S0H]«[Mn+]r
^[FVIRTls + ar)] [2]
with K the surface constant. "9 the electrostatic potential, F theFaraday constant, R the idéal gas constant, and T the température (in K).
In the constant capacitance model, W and surface chargedensity (cr) are related by:
<T= C-*, [3]
with C the surface capacitance. In this work, C is an empiricalconstant chosen as being equal to 1.2 F • m"2.
RESULTS
where H,(SOH),M|.i""r'" symbolizes surface complex and s, The first step of the modeling consists of extracting theq, and r are stoichiometric coefficients. surface site concentration from saturation experiments. The
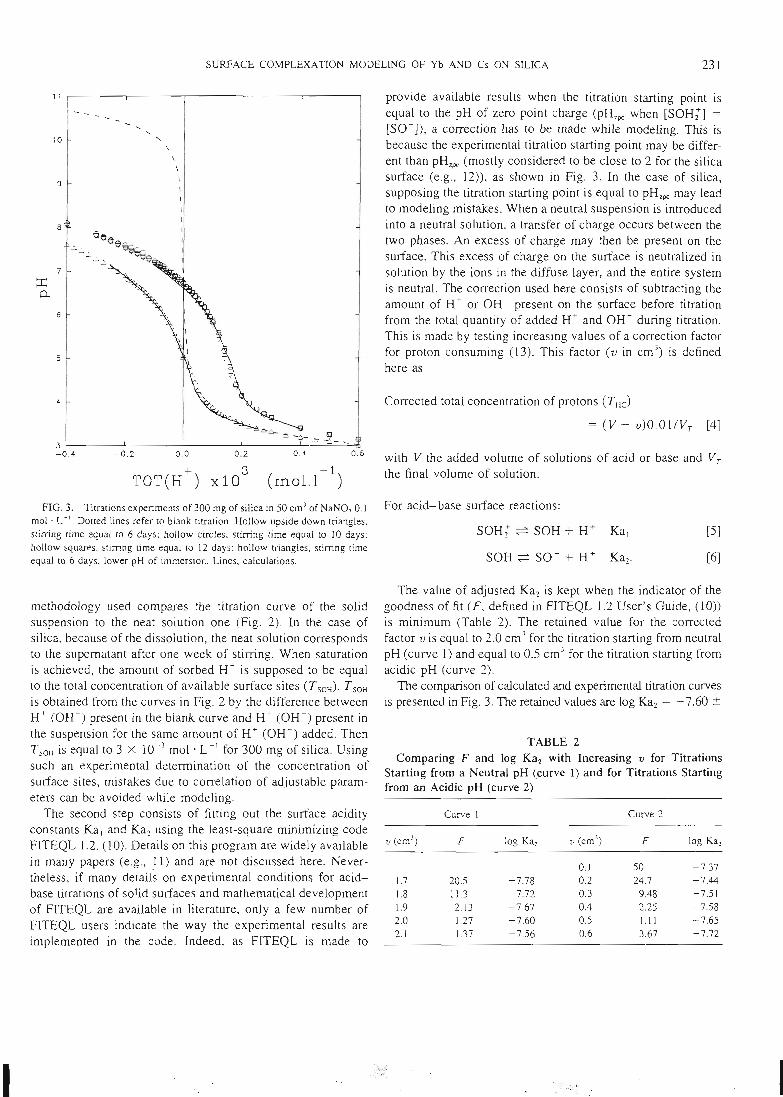
SURFACE COMPLEXATION MODELING OF Yb AND Cs ON SILICA 231
TOT H xlO3 (mol.l *)FIG. 3. Titrations expenments of 300 mgof silicain 50 cm3 of NaNO,0.1
mol •L"'. Dotted Unes refer to blank titration. Hollow upside down triangles,stirnng time equal to 6 days; hollow circles, stirring time equal to 10 days;hollow squares, stirring time equal to 12 days; hollow triangles, stirring timeequal to 6 days, lower pH of immersion. Lines, calculations.
methodology used compares the titration curve of the solidsuspension to the neat solution one (Fig. 2). In the case ofsilica. because of the dissolution, the neat solution correspondsto the supematant after one week of stirring. When saturationis achieved, the amount of sorbed H" is supposed to be equalto the total concentration of available surface sites (TS0H). TS0His obtained from the curves in Fig. 2 by the différence betweenH+ (OH") présent in the blank curve and H+ (OH") présent inthe suspension for the same amount of H+ (OH") added. ThenTSOH is equal to 3 X 10"3 mol •L"1 for 300 mg ofsilica. Usingsuch an expérimental détermination of the concentration ofsurface sites, mistakes due to corrélation of adjustable parameters can be avoided while modeling.
The second step consists of fitting out the surface acidityconstants Ka, and Ka2 using the least-square minimizing codeFITEQL 1.2. (10). Détails on this program are widely availablein many papers (e.g., 11) and are not discussed hère. Never-theless, if many détails on expérimental conditions for acid-base titrations of solid surfaces and mathematical developmentof FITEQL are available in literature, only a few number ofFITEQL users indicate the way the expérimental results areimplemented in the code. Indeed, as FITEQL is made to
provide available results when the titration starting point isequal to the pH of zéro point charge (pHzpc when [SOH2+] =[SO"]), a correction has to be made while modeling. This isbecause the expérimental titration starting point may be différent than pHzpc (mostly considered to be close to 2 for the silicasurface (e.g., 12)), as shown in Fig. 3. In the case of silica,supposing the titration starting point is equal to pHzpc may leadto modeling mistakes. When a neutral suspension is introducedinto a neutral solution, a transfer of charge occurs between thetwo phases. An excess of charge may then be présent on thesurface. This excess of charge on the surface is neutralized insolution by the ions in the diffuse layer, and the entire Systemis neutral. The correction used hère consists of subtracting theamount of H+ or OH " présent on the surface before titrationfrom the total quantity of added H+ and OH" during titration.This is made by testing increasing values of a correction factorfor proton consuming (13). This factor (v in cm3) is definedhère as
Corrected total concentration of protons (THC)
= (V- v)0.0l/VT [4]
with V the added volume of solutions of acid or base and VTthe final volume of solution.
For acid-base surface reactions:
SOH,+ ^± SOH + H+ Ka,
SOH^SO" + H+ Ka,.
[5]
[6]
The value of adjusted Ka2 is kept when the indicator of thegoodness of fit (F. defined in FITEQL 1.2 User's Guide, (10))is minimum (Table 2). The retained value for the correctedfactor v is equal to 2.0cm3 for thetitration starting from neutralpH(curve 1)andequal to 0.5 cm3 for the titration starting fromacidic pH (curve 2).
The comparison of calculated and expérimental titrationcurvesis presented in Fig. 3. The retained values are log Ka2 = -7.60 ±
TABLE 2
Comparing F and log Ka2 with Increasing v for TitrationsStarting from a Neutral pH (curve 1) and for Titrations Startingfrom an Acidic pH (curve 2)
Curve 1 Curve 2
v (cm1) F log Ka, v (cm5) F log Ka,
0.1 50 -7.37
1.7 20.5 -7.78 0.2 24.7 -7.44
1.8 11.3 -7.72 0.3 9.48 -7.51
1.9 2.13 -7.67 0.4 2.25 -7.58
2.0 1.27 -7.60 0.5 1.11 -7.65
2.1 1.37 -7.56 0.6 3.67 -7.72
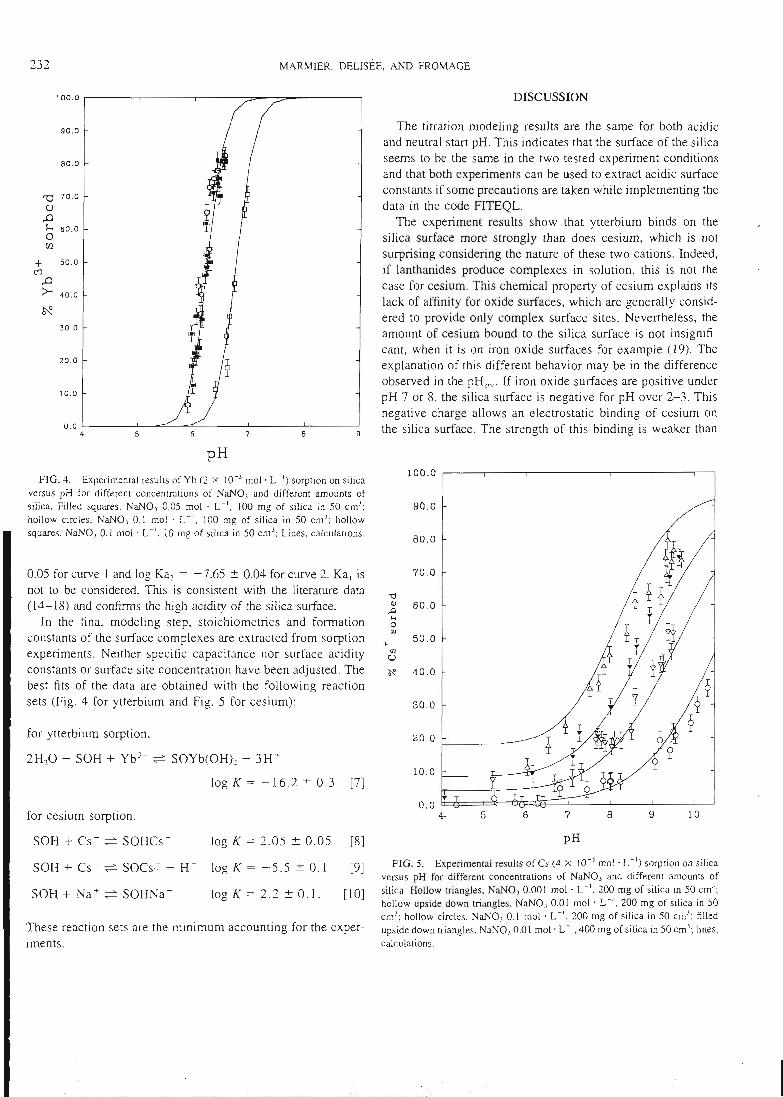
232 MARMIER. DELISEE, AND FROMAGE
pH
FIG.4. Expenmental results of Yb (2 X 10"5 mol• L"1) sorption on silicaversus pH for différent concentrations of NaNO, and différent amounts ofsilica. Filled squares, NaNO, 0.05 mol • L"', 100 mg of silica in 50 cm1;hollow circles, NaNO, 0.1 mol • L^1, 100 mg of silica in 50 cm'; hollowsquares, NaNO, 0.1 mol • L~'. 10 mg of silica in 50 cm3; Lines, calculations.
0.05 for curve 1 and log Ka, = -7.65 ± 0.04 for curve 2. Ka, isnot to be considered. This is consistent with the literature data
(14-18) and confirms the high acidity of the silica surface.In the final modeling step, stoichiometries and formation
constants of the surface complexes are extracted from sorptionexperiments. Neither spécifie capacitance nor surface acidityconstants or surface site concentration hâve been adjusted. Thebest fits of the data are obtained with the following reactionsets (Fig. 4 for ytterbium and Fig. 5 for césium):
for ytterbium sorption,
2H20 + SOH + Yb3" :
for césium sorption,
SOH + Cs" ï± SOHCs^
SOH 4- Cs" ^ SOCs" -
SOH 4- Na+ ^ SOHNa"
SOYb(OH)2+ 3H"
log K = -16.2 ± 0.3 [7]
log K = 2.05 ± 0.05 [8]
H" log K = -5.5 ± 0.1 [9]
log K = 2.2 ± 0.1. [10]
Thèse reaction sets are the minimum accounting for the experiments.
DISCUSSION
The titration modeling results are the same for both acidicand neutral start pH. This indicates that the surface of the silicaseems to be the same in the two tested experiment conditionsand that both experiments can be used to extract acidic surfaceconstants if some précautions are taken while implementing thedata in the code FITEQL.
The experiment results show that ytterbium binds on thesilica surface more strongly than does césium, which is notsurprising considering the nature of thèse two cations. Indeed,if lanthanides produce complexes in solution, this is not thecase for césium. This chemical property of césium explains itslack of affinity for oxide surfaces, which are generally considered to provide only complex surface sites. Nevertheless, theamount of césium bound to the silica surface is not insignifi-cant, when it is on iron oxide surfaces for example (19). Theexplanation of this différent behavior may be in the différenceobserved in the pHzpc. If iron oxide surfaces are positive underpH 7 or 8, the silica surface is négative for pH over 2-3. Thisnégative charge allows an electrostatic binding of césium onthe silica surface. The strength of this binding is weaker than
•ad
J3
100
20,0
FIG. 5. Expérimental results of Cs (4 X 10~5 mol •L"1) sorption on silicaversus pH for différent concentrations of NaNO, and différent amounts ofsilica. Hollow triangles, NaNO, 0.001 mol • L"1, 200 mg of silica in 50 cm1;hollow upside down triangles, NaNO, 0.01 mol • L~', 200 mg of silica in 50cm1; hollow circles. NaNO, 0.1 mol • L"1, 200 mg of silica in 50 cm'1; filledupside down triangles, NaNO,0.01mol•L^', 400 mgof silicain 50cm1; Unes,calculations.

SURFACE COMPLEXATION MODELING OF Yb AND Cs ON SILICA 233
TABLE 3
Comparing F and Stoichiometries Used to Account for theSorption of Césium on 200 mg of Silica for / = 0.1
Stoichiometries log K
8 2.5 26
9 -5.7 1.88 + 9 1.8 and -5.8 1.0
9+10 NC" NC"
8 + 9 + 10 2.05, -5.5, and 2.2 0.8
' NC. no convergence in numeric scheme.
that of a complexation's, and so Na", the electrolyte cation,may compete. As shown in Table 3, the sorption of césium onsilica for 7 = 0.1 can be reproduced without Eq. [10]. Nev-ertheless, the model which does not take into account thesorption of sodium is not able to account for ail the sorptioncurves in Fig. 5.
In the case of ytterbium, the compétitive action of sodiumisinsignificant. This observation has been already made for thesorption of other trivalent cations on silica (20). This may beexplained by the large différence in the binding strength, andso the sorption of sodium does not need to be considered inmodeling. The ionic strength has no effect on the observedsorption curve in the expérimental conditions used hère.
Using such a chemical description, it is not necessary toinvolve inner- or outer-sphere complexes to explain the différences observed between sorption of ytterbium and césium, andso CCM may be used to reproduce the expérimental results.According to Figs. 4 and 5, CCM can be used to account forsorption of césium and ytterbium in various conditions of Naconcentrations and for différent amounts of silica in the samevolume of solution. The same data set and the same constantsare used for ail calculations. This seems to indicate that thesorption of ytterbium andcésium is not affected by thechangeof the surface charge with ionic strength in the expérimentalconditions tested hère. Such a description of the solid-solutioninterface, involving thecomparison of bindingstrengths and noinner- or outer-sphere complexes partition, has been advocatedby Charlet and Manceau (21) in conclusion of a spectroscopystudy.
CONCLUSION
Césium can bind on the silica surface because of the verylow pHipc of this oxide. This sorption decreases when theconcentration of sodium increases in solution. The sorption of
ytterbium is not affected by the présence of sodium in solutionbecause of its greater binding strength.
CCM is able to account for the sorbing behavior of bothytterbium and césium, with a relatively low number of adjustable parameters used to account for the experiment results,constituted by almost 60 independent batch experiments inchanging NaN03 concentrations conditions and for différentamounts of silica.
The validity of the chemical descriptions of the sorption ofcésium and ytterbium on silica will be tested in tries of prédictions of oxide mixtures behaviors in a forthcoming paper.
ACKNOWLEDGMENT
Financial support by the French Nuclear Waste Management NationalAgency (ANDRA) is gratefully acknowledged.
REFERENCES
1. Marmier. N., Dumonceau. J., and Fromage, F., J. Contam. Hydrol. 26, 159(1997).
2. Hayes, K. F„ Redden, G.. Ela, W.,and Leckie, J. 0„ J. Colloid InterfaceSci. 142, 448 (1991).
3. Westall, J. C, Mater. Res. Soc. Symp. Proc. 353, 937 (1995).4. Tumer, D. R., Pabalan. R. T., Muller. P., and Bertelli, F. P., in "6* Annual
International High Level Radioactive Waste Management Proceedings,Las Vegas, 1995." p. 234.
5. Davis, J. A., and Kent, D. B., in "Minerai Water Interface Geochemistry"(M. F. Hochella Jr. and A. F. White, Eds.), p. 177. Mineralogical Societyof America, Washington DC, 1990.
6. Dzombak, D,A., andMorel, F. M. M.. "Surface Complexation Modelling.Hydrous Ferrie Oxide." Wiley, New York. 1990.
7. Marmier, N., Dumonceau, J., Chupeau, J., and Fromage, F., Mater. Res.Soc. Symp. Proc. 353, 1085 (1995).
8. Wood, A., Chem. Geology 82, 159 (1990).9. Morel. F. M. M., Westall, J. C. and Yeasted, L., in "Adsorption of
Inorganic at Solid-Liquid Interfaces" (AnnArborEds.), p. 263. New York,1980.
10. Westall, J. C. "FITEQL: User's Guide, Version 1.2." Chemistry Department, Oregon State University, Corvallis, Oregon. 1982.
11. Lovgren, L., Sjoberg, S., and Schindler, P. W., Geochim. Cosmochim.Acta 54, 1301 (1990).
12. lames, R. O, and Healy, T. W., J. Colloid Interface Sci. 40, 42 (1971).13. Wanner, H., Albinsson, Y., Kamland, O., Wieland, E., Wersin, P., and
Charlet, L., Radiochim. Acta 66/67, 157 (1994).14. Schindler, P. W„ and Kamber, H. R„ Helv. Chim. Acta 51, 1781 (1968).15. Armistead, C. G, Tyler, A. J.. Hambleton, F. H., Mitchell, S. A., and
Hockey, I. A., J. Phys. Chem. 73, 3947 (1969).16. Abendroth, J., Colloid Sci. 34, 591 (1970).17. Benjamin, M. M. Ph.D. Thesis, Stanford University, Stanford CA, 1978.18. Hiemstra, T., and Van Riemsdijk. W. H„ Colloid Surf. 59, 7 (1991).19. Cromières, L., Thesis, University of Paris XI, Paris, 1997.20. Kosmulski, M., J. Colloid Interface Sci. 195, 395 (1997).21. Charlet,L., and Manceau, A. A.,J. Colloid Interface Sci. 148,443 (1992).

ARTICLE N°8
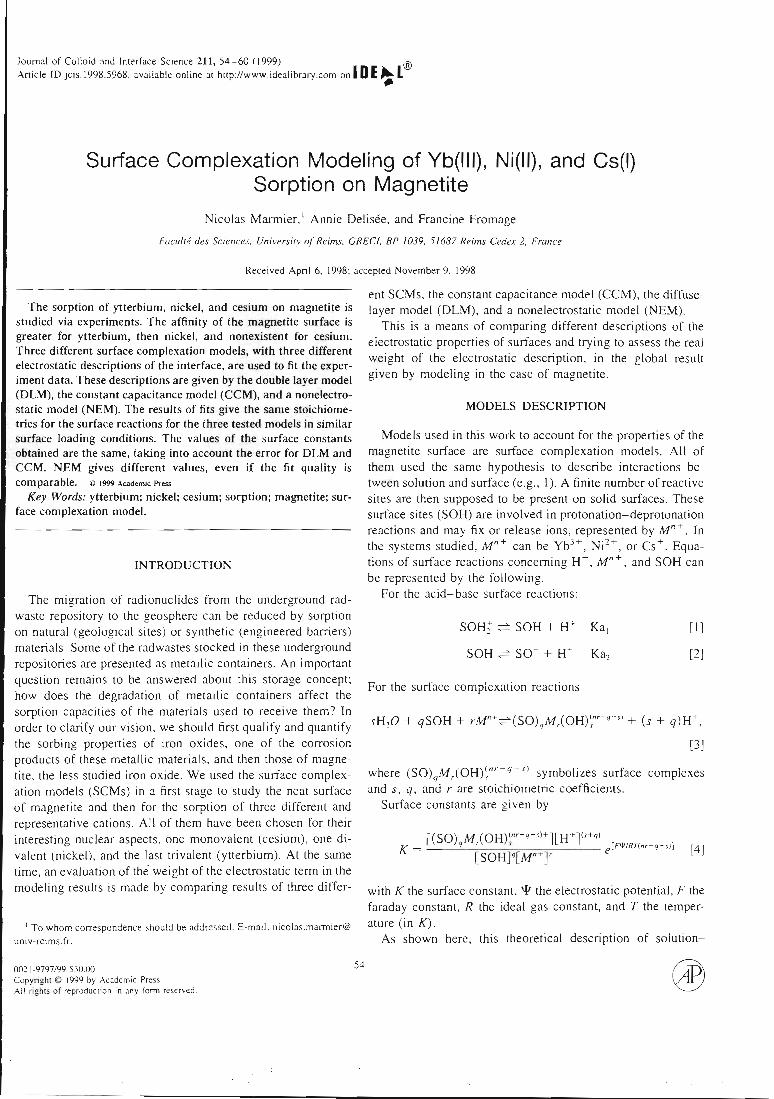
Journal of Colloid and Interface Science 211, 54-60 (1999)Article ID jcis.1998.5968. available online at http://www.idealibrary.com onIDEM
Surface Complexation Modeling of Yb(lll), Ni(ll), and Cs(l)Sorption on Magnétite
Nicolas Marmier,1 Annie Delisée, and Francine Fromage
Faculté des Sciences. University of Reims, GRECI, BP 1039, 51687 Reims Cedex 2, France
Received April 6. 1998; accepted November 9, 1998
The sorption of ytterbium, nickel, and césium on magnétite isstudied via experiments. The affinity of the magnétite surface isgreater for ytterbium, then nickel, and nonexistent for césium.Three différent surface complexation models, with three différentelectrostatic descriptions of the interface, are used to fit the experiment data. Thèsedescriptions are givenby the double layer model(DLM), the constant capacitance model (CCM), and a nonelectrostatic model (NEM). The results of fits give the same stoichiometries for the surface reactions for the three tested models in similarsurface loading conditions. The values of the surface constantsobtained are the same, taking into account the error for DLM andCCM. NEM gives différent values, even if the fit quality isComparable. ©1999 Académie Press
Key Words: ytterbium; nickel; césium; sorption; magnétite; surface complexation model.
INTRODUCTION
The migration of radionuclides from the underground rad-waste repository to the geosphere can be reduced by sorptionon natural (geological sites) or synthetic (engineered barriers)materials. Some of the radwastes stocked in thèse undergroundrepositories are presented as metallic containers. An importantquestion remains to be answered about this storage concept;how does the dégradation of metallic containers affect thesorption capacities of the materials used to receive them? Inorder toclarify our vision, we should first qualify and quantifythe sorbing properties of iron oxides, one of the corrosionproducts of thèse metallic materials. and then those ofmagnétite. the less studied iron oxide. We used the surface complexation models (SCMs) in a first stage to study the neat surfaceof magnétite and then for the sorption of three différent andreprésentative cations. Ail ofthem hâve been chosen for theirinteresting nuclear aspects, one monovalent (césium), one di-valent (nickel), and the last trivalent (ytterbium). At the sametime, anévaluation of the weight of theelectrostatic term in themodeling results is made by comparing results of three differ-
1To whom correspondence should be addressed. E-mail: nicolas.marmiertiuniv-reims.fr.
ent SCMs, the constant capacitance model (CCM), the diffuse-layer model (DLM), and a nonelectrostatic model (NEM).
This is a means of comparing différent descriptions of theelectrostatic properties of surfaces and trying to assess the realweight of the electrostatic description, in the global resuitgiven by modeling in the case of magnétite.
MODELS DESCRIPTION
Models used in this work to account for the properties of themagnétite surface are surface complexation models. Ail ofthem used the same hypothesis to describe interactions between solution and surface (e.g., 1). A finite number of reactivesites are then supposed to be présent on solid surfaces. Thèsesurface sites (SOH) are involved in protonation-deprotonationreactions and may fix or release ions, represented by M" +. Inthe Systems studied, Mn+ can be Yb3 +, Ni2+, or Cs+. Equations of surface reactions conceming H+, M" +, and SOH canbe represented by the following.
For the acid-base surface reactions:
SOH:+ ?± SOH + HT Ka,
SOH ^ SO" + H* Ka2
For the surface complexation reactions
[1]
[2]
sH20 + qSOH + rM"+-(SO)qMr(OHYr^] + (s + q)H+,
[3]
where (SO)qMr(OH){"r~q~s> symbolizes surface complexesand s, q, and r are stoichiometric coefficients.
Surface constants are given by
K =
{nr-q-s) +-ir<u+~\U +q)[(SO),A/r(QH)r?-5)+][H+][SOHjliWT
JFVIRTlnr-q-s)} [4]
with K the surface constant, XY the electrostatic potential, F thefaraday constant, R the idéal gas constant, and T the température (in K).
As shown hère, this theoretical description of solution-
0021-9797/99 S30.00Copyright© 1999by Académie PressAil righls of reproduction in any form reserved.
54
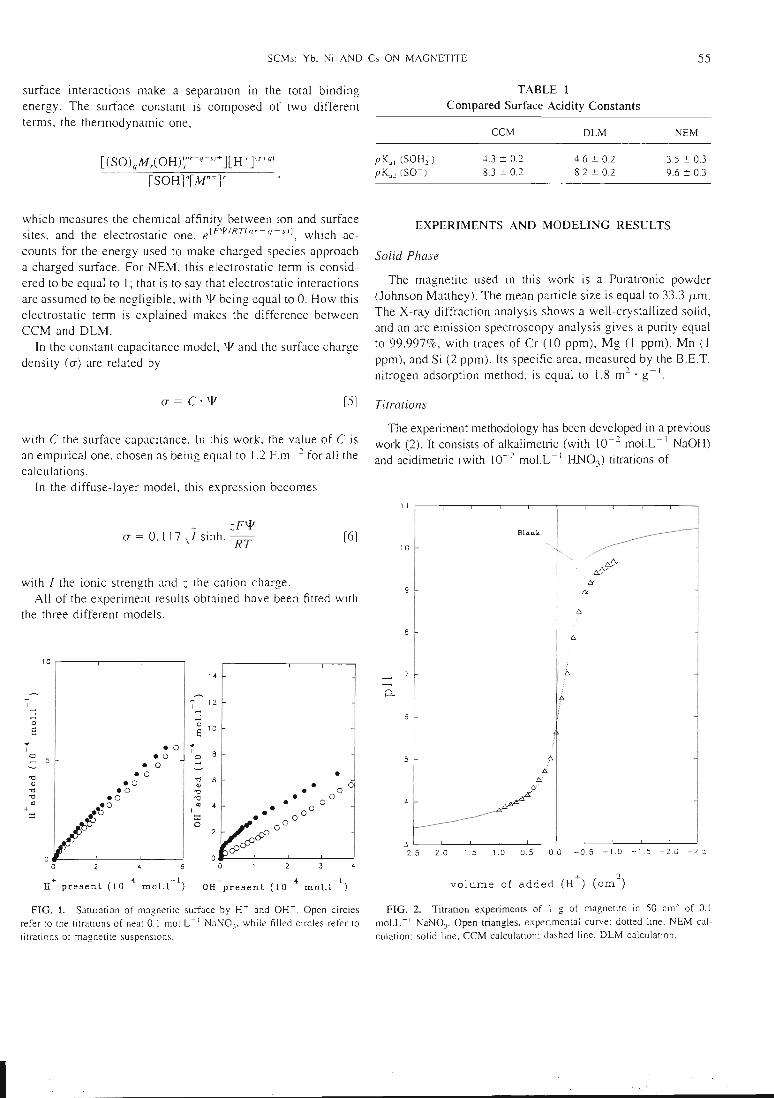
SCMs: Yb. Ni AND Cs ON MAGNETITE 55
surface interactions make a séparation in the total bindingenergy. The surface constant is composed of two différentterms. the thermodynamic one,
[(SO)„Af,(OH)r"*",,*3[H+],,+*1[SOH]«[M^Y
which measures the chemical affinity between ion and surfacesites, and the electrostatic one, e^F^'RTinr-'i-s^^ which ac-counts for the energy used to make charged species approacha charged surface. For NEM, this electrostatic term is considered to be equal to 1; that is to say that electrostatic interactionsare assumed to be negligible, with *f being equal to 0. How thiselectrostatic term is explained makes the différence betweenCCM and DLM.
In the constant capacitance model, ^ and the surface chargedensity (cr) are related by
pKa, (SOH,+ )pKa, (SO")
TABLE 1
Compared Surface Acidity Constants
CCM
4.3
8.3
0.2
0.2
DLM
4.6 0.2
0.2
NEM
3.5 ± 0.3
9.6 ± 0.3
EXPERIMENTS AND MODELING RESULTS
Solid Phase
The magnétite used in this work is a Puratronic powder(Johnson Matthey). The mean particle size is equal to 33.3 /nm.The X-ray diffraction analysis shows a well-crystallized solid,and an arc émission spectroscopy analysis gives a purity equalto 99.997%, with traces of Cr (10 ppm), Mg (1 ppm), Mn (1ppm), and Si (2 ppm). Its spécifie area, measured by the B.E.T.nitrogen adsorption method. is equal to 1.8 nr • g~ .
cr C-¥ 1*1 Titrations
with C the surface capacitance. In this work. the value of C isan empirical one. chosen as beingequal to 1.2 F.m"2 for ail thecalculations.
In the diffuse-layer model, this expression becomes
zFV0.117 x/ sinh. -==-
Kl[61
with / the ionic strength and ; the cation charge.Ail of the experiment results obtained hâve been fitted with
the three différent models.
!
O
e
2 5 • O
• o
T3• 0
• o
a• o
-•C
.•^
n,/H présent (10 mol.l ) 0H présent (10 mol.l )
FIG. 1. Saturation of magnétite surface by HT and OH". Open circlesrefer to the titrations of neat 0.1 mol.L"' NaNO,. while filled circles refer totitrations of magnétite suspensions.
The experiment methodology has been developed in a previouswork (2). It consists of alkalimetric (with 10-2 mol.L-1 NaOH)and acidimétrie (with 10~2 mol.L-' HN03) titrations of
1 1 1
Blank
0
9 a'
A
a-
A-
7- -
6
f5 à.
dei
a-'
"
•V
1 1
volume of added (H ) (cm )
FIG. 2. Titration experiments of 1 g of magnétite in 50 cm3 of 0.1mol.L"1 NaN03. Open triangles, expérimental curve: dotted line. NEM calculation; solid line, CCM calculation: dashed line, DLM calculation.
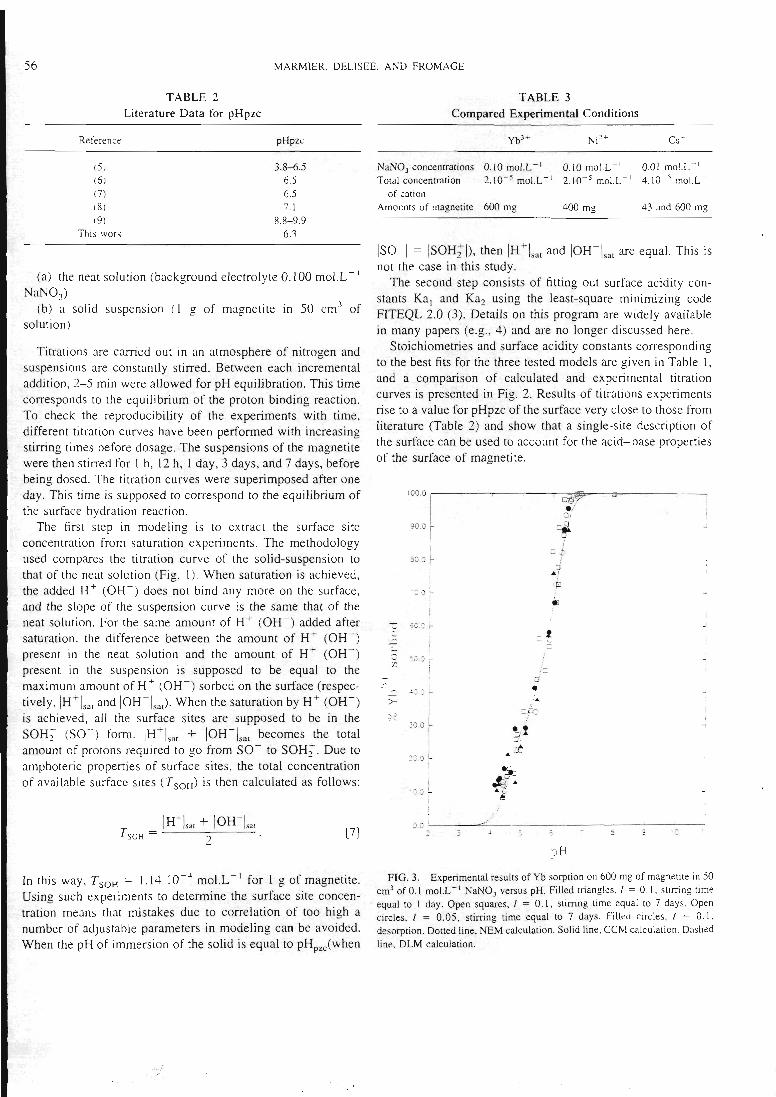
56 MARMIER. DELISEE. AND FROMAGE
TABLE 2
Literature Data for pHpzc
Référence pHpzc
(5) 3.8-6.5
(6) 6.5
(7) 6.5
(8) 7.1
(9) 8.8-9.9
This work 6.3
(a) the neat solution (backgroundelectrolyte 0.100 mol.L 'NaN03)
(b) a solid suspension (1 g of magnétite in 50 cm3 ofsolution)
Titrations are carried out in an atmosphère of nitrogen andsuspensions are constantly stirred. Between each incrémentaladdition. 2-5 min were allowed forpH équilibration. This timecorresponds to the equilibrium of the proton binding reaction.To check the reproducibility of the experiments with time,différent titration curves hâve been performed with increasingstirring times before dosage. The suspensions of the magnétitewere then stirred for 1 h, 12 h, 1 day, 3 days, and 7 days, beforebeing dosed. The titration curves were superimposed after oneday. This time is supposed to correspond to the equilibrium ofthe surface hydradon reaction.
The first step in modeling is to extract the surface siteconcentration from saturation experiments. The methodologyused compares the titration curve of the solid-suspension tothat of the neat solution (Fig. 1). When saturation is achieved,the added H+ (OH") does not bind any more on the surface,and the slope of the suspension curve is the same that of theneat solution. For the same amount of H^ (OH-) added after
saturation, the différence between the amount of H+ (OH~)présent in the neat solution and the amount of H* (OH-)présent in the suspension is supposed to be equal to themaximum amount of H+ (OH-) sorbed on the surface (respectively, |H"|sat and jOH"]sat). When the saturation by H+ (OH")is achieved, ail the surface sites are supposed to be in theSOH2+ (SO~) form. |H+|sat + |OH~|sat becomes the totalamount of protons required to go from SO" to SOH^. Due toamphoteric properties of surface sites, the total concentrationof available surface sites iTSOH) is then calculated as follows:
H~ OH"
SOH [7]
In this way, rSOH = 114 10~4 mol.L-1 for 1 g of magnétite.Using such experiments to détermine the surface site concentration means that mistakes due to corrélation of too high anumber of adjustable parameters in modeling can be avoided.When the pHof immersion of the solid is equal to pHpzc(when
TABLE 3
Compared Expérimental Conditions
Yb34 Ni2+ Cs"
NaN03 concentrations 0.10 mol.L"1 0.10 mol.L"1 0.01 mol.L"1Total concentration 2.10"5 mol.L"1 2.10"5 mol.L"' 4.10"5 mol.L"'
of cation
Amounts of magnétite 600 mg 400 mg 43 and 600 mg
|SO | = |SOH2+|), then |H+|sa[ and |OH"|sat are equal. This isnot the case in this study.
The second step consists of fitting out surface acidity constants Ka, and Ka2 using the least-square minimizing codeFITEQL 2.0 (3). Détails on this program are widely availablein many papers (e.g., 4) and are no longer discussed hère.
Stoichiometries and surface acidity constants correspondingto the best fits for the three tested models are given in Table 1,and a comparison of calculated and expérimental titrationcurves is presented in Fig. 2. Results of titrations experimentsrise to a value for pHpzc of the surface very close to those fromliterature (Table 2) and show that a single-site description ofthe surface can be used to account for the acid-base propertiesof the surface of ma2netite.
30 j \-
s*
•at
•/'Oi
--L!
da:
t
•o
*c
pH
FIG. 3. Expérimental results of Yb sorption on 600 mg of magnétite in 50cm3 of 0.1 mol.L"' NaN03 versus pH. Filled triangles, / = 0.1, stirring timeequal to 1 day. Open squares, / = 0.1, stirring time equal to 7 days. Opencircles, / = 0.05, stirring time equal to 7 days. Filled circles, / = 0.1.desorption. Dotted line, NEM calculation. Solid line, CCM calculation. Dashedline. DLM calculation.
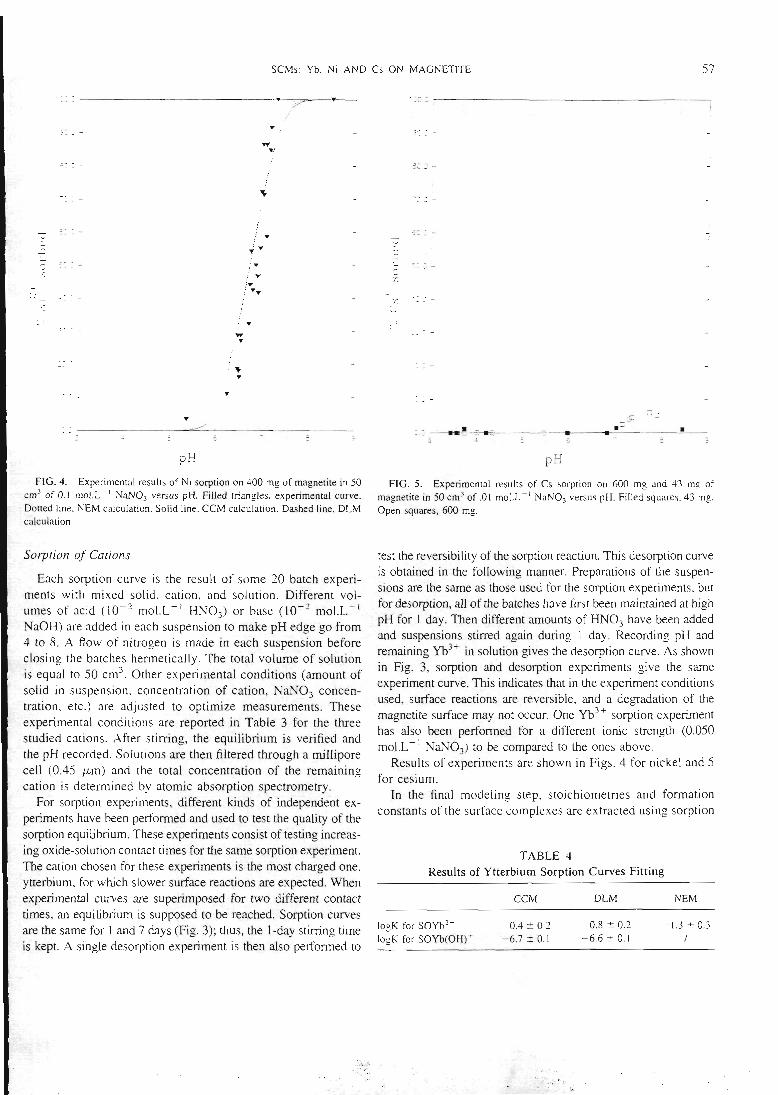
SCMs: Yb. Ni AND Cs ON MAGNETITE 57
pH
FIG. 4. Expérimental results ofNi sorption on400 mg of magnétite in50cm' of 0.1 mol.L"1 NaN03 versus pH. Filled triangles, expérimental curve.Dotted line. NEM calculation. Solid line. CCM calculation. Dashed line. DLMcalculation.
Sorption of Cations
Each sorption curve is the resuit of some 20 batch experiments with mixed solid, cation, and solution. Différent volumes of acid (10-2 mol.L-1 HN03) or base (10~2 mol.L"1NaOH) are added in each suspension to make pHedge go from4 to 8. A flow of nitrogen is made in each suspension beforeclosing the batches hermetically. The total volume of solutionis equal to 50 cm3. Other expérimental conditions (amount ofsolid in suspension, concentration of cation, NaN03 concentration, etc.) are adjusted to optimize measurements. Thèseexpérimental conditions are reported in Table 3 for the threestudied cations. After stirring, the equilibrium is verified andthe pHrecorded. Solutions are then filtered through a milliporecell (0.45 /xm) and the total concentration of the remainingcation is determined by atomic absorption spectrometry.
For sorption experiments, différent kinds of independent experiments hâve been performed and used to test thequality of thesorption equilibrium. Thèse experiments consist of testing increasing oxide-solution contact times for the same sorption experiment.The cation chosen for thèse experiments is the mostcharged one.ytterbium, for which slower surface reactions areexpected. Whenexpérimental curves are superimposed for two différent contacttimes, an equilibrium is supposed to be reached. Sorption curvesare the same for 1and 7 days (Fig. 3); thus, the 1-day stirring timeis kept. A single desorption experiment is then also performed to
pH
FIG. 5. Expérimental results of Cs sorption on 600 mg and 43 mg ofmagnétite in50cm3 of .01 mol.L"' NaNO, versus pH. Filled squares. 43 mg.Open squares. 600 mg.
test thereversibility of thesorption reaction. Thisdesorption curveis obtained in the following manner. Préparations of the suspensions are the same as those used for the sorption experiments. butfor desorption. ail of the batches hâve first been maintained athighpH for 1 day. Then différent amounts of HN03 hâve been addedand suspensions stirred again during 1 day. Recording pH andremaining Yb3 + in solution gives the desorption curve. As shownin Fig. 3, sorption and desorption experiments give the sameexperiment curve. This indicates that in theexperiment conditionsused, surface reactions are réversible, and a dégradation of themagnétite surface may not occur. One Yb3+ sorption experimenthas also been performed for a différent ionic strength (0.050mol.L"' NaN03) to be compared to the ones above.
Results of experiments are shown in Figs. 4 for nickel and 5for césium.
In the final modeling step. stoichiometries and formationconstants of the surface complexes are extracted using sorption
TABLE 4
Results of Ytterbium Sorption Curves Fitting
logK for SOYb2+logK for SOYb(OH)"
CCM
0.4 ± 0.2
-6.7 ± 0.1
DLM
0.8 :
-6.6:
0.2
0.1
NEM
•1.3 ±0.3
/
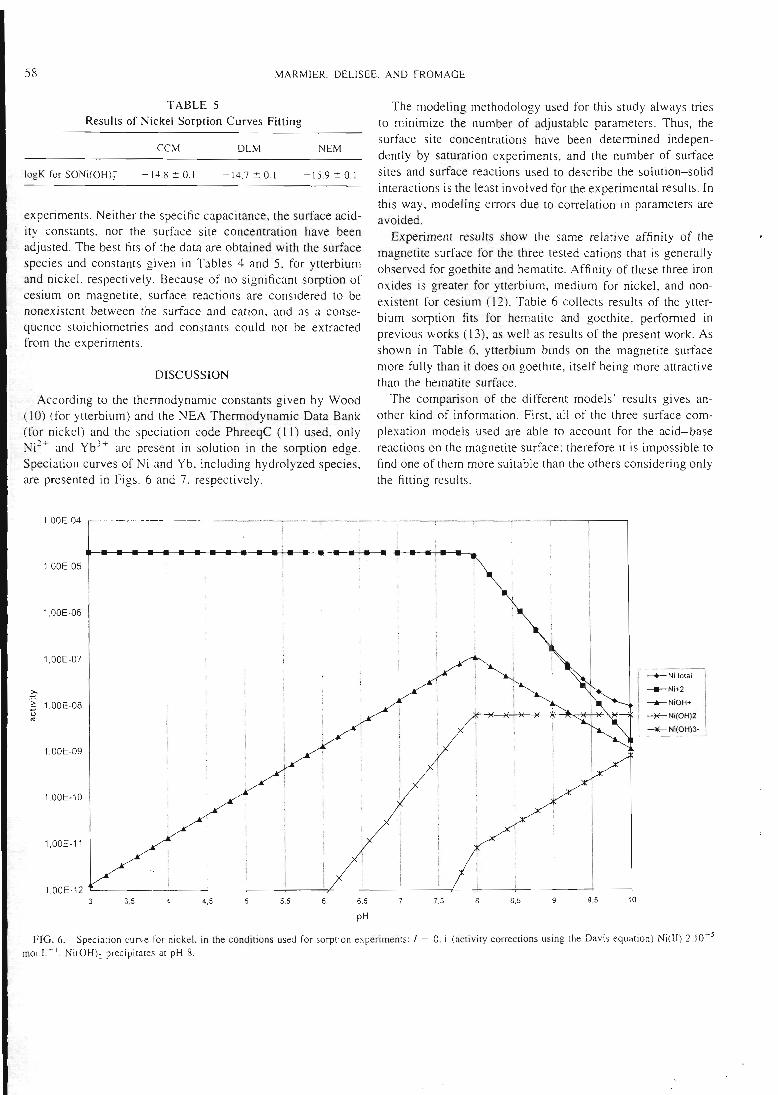
58 MARMIER. DELISEE. AND FROMAGE
TABLE 5
Results of Nickel Sorption Curves Fitting
CCM DLM
logK for SONi(OH); •14.8 r 0.1 -14.7 ± 0.1
NEM
15.9 ±0.1
experiments. Neither the spécifie capacitance, the surface acidity constants, nor the surface site concentration hâve beenadjusted. The best fits of the data are obtained with the surfacespecies and constants given in Tables 4 and 5. for ytterbiumand nickel, respectively. Because of no significant sorption ofcésium on magnétite, surface reactions are considered to benonexistent between the surface and cation, and as a conséquence stoichiometries and constants could not be extractedfrom the experiments.
DISCUSSION
According to the thermodynamic constants given by Wood(10) (for ytterbium) and the NEA Thermodynamic Data Bank(for nickel) and the spéciation code PhreeqC (11) used. onlyNi" and Yb are présent in solution in the sorption edge.Spéciation curves of Ni and Yb, including hydrolyzed species,are presented in Figs. 6 and 7, respectively.
1.00E-04 - -
1.00E-05
1.00E-06
1.00E-07
1.00E-08
1.00E-09
1.00E-10
1.00E-11
1.00E-12
The modeling methodology used for this study always triesto minimize the number of adjustable parameters. Thus, thesurface site concentrations hâve been determined indepen-dently by saturation experiments, and the number of surfacesites and surface reactions used to describe the solution-solid
interactions is the least involved for the expérimental results. Inthis way, modeling errors due to corrélation in parameters areavoided.
Experiment results show the same relative affinity of themagnétite surface for the three tested cations that is generallyobserved for goethite and hématite. Affinity of thèse three ironoxides is greater for ytterbium, médium for nickel, and nonexistent for césium (12). Table 6 collects results of the ytterbium sorption fits for hématite and goethite, performed inprevious works (13), as well as results of the présent work. Asshown in Table 6, ytterbium binds on the magnétite surfacemore fully than it does on goethite, itself being more attractivethan the hématite surface.
The comparison of the différent models' results gives an-other kind of information. First, ail of the three surface com
plexation models used are able to account for the acid-basereactions on the magnétite surface; therefore it is impossible tofind one of them more suitable than the others considering onlythe fitting results.
FIG. 6. Spéciation curve for nickel, in the conditions used for sorption experiments: / = 0.1 (activity corrections using the Davis équation) Ni(II) 2.10 5mol.L"1. Ni(OH)2 précipitâtes at pH 8.
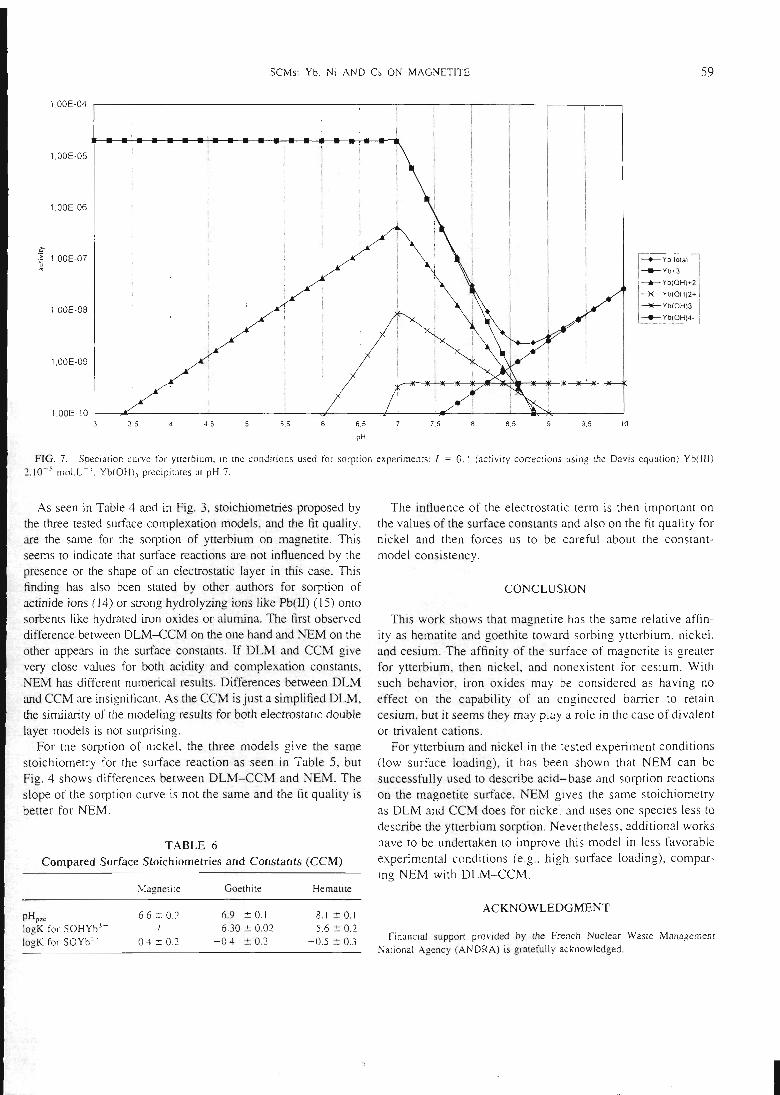
SCMs: Yb. Ni AND Cs ON MAGNETITE 59
1.00E-04
1.00E-05
1.00E-09
1.00E-10
-Yb total ]-Yb+3
-Yb(OH)+2
-Yb(OH)2+
-Yb(OH)3
-Yb(OH)4-
FIG. 7. Spéciation curve for ytterbium. in the conditions used for sorption experiments: / = 0.1 (activity corrections using the Davis équation) Yb(III)2.10"5 mol.L"1. Yb(OH), précipitâtes at pH 7.
As seen in Table 4 and in Fig. 3, stoichiometries proposed bythe three tested surface complexation models, and the fit quality,are the same for the sorption of ytterbium on magnétite. Thisseems to indicate that surface reactions are not influenced by theprésence or the shape of an electrostatic layer in this case. Thisfinding has also been stated by other authors for sorption ofactinide ions (14) or strong hydrolyzing ions like Pb(II) (15) ontosorbents like hydrated iron oxides or alumina. The first observeddifférence between DLM-CCM on the one hand and NEM on the
other appears in the surface constants. If DLM and CCM givevery close values for both acidity and complexation constants,NEM has différent numerical results. Différences between DLM
and CCM are insignificant. As the CCM is just a simplified DLM.the similarity of the modeling results for both electrostatic doublelayer models is not surprising.
For the sorption of nickel, the three models give the samestoichiometry for the surface reaction as seen in Table 5, butFig. 4 shows différences between DLM-CCM and NEM. Theslope of the sorption curve is not the same and the fit quality isbetter for NEM.
TABLE 6
Compared Surface Stoichiometries and Constants (CCM)
PHpzclogK for SOHYb3"logK for SOYb2*
Magnétite
6.6 ± 0.2
/
0.4 ± 0.2
Goethite
6.9 ±0.1
6.30 ± 0.02
-0.4 ± 0.2
Hématite
8.1 ± 0.1
5.6 ± 0.2
-0.5 - 0.3
The influence of the electrostatic term is then important onthe values of the surface constants and also on the fit quality fornickel and then forces us to be careful about the constant-
model consistency.
CONCLUSION
This work shows that magnétite has the same relative affinity as hématite and goethite toward sorbing ytterbium, nickel,and césium. The affinity of the surface of magnétite is greaterfor ytterbium, then nickel, and nonexistent for césium. Withsuch behavior, iron oxides may be considered as having noeffect on the capability of an engineered barrier to retaincésium, but it seems they may play a rôle in the case of divalentor trivalent cations.
For ytterbium and nickel in the tested experiment conditions(low surface loading), it has been shown that NEM can besuccessfuUy used to describe acid-base and sorption reactionson the magnétite surface. NEM gives the same stoichiometryas DLM and CCM does for nickel and uses one species less todescribe the ytterbium sorption. Nevertheless, additional workshâve to be undertaken to improve this model in less favorableexpérimental conditions (e.g.. high surface loading), comparing NEM with DLM-CCM.
ACKNOWLEDGMENT
Financial support provided by the French Nuclear Waste ManagementNational Agency (ANDRA) is gratefully acknowledged.
60 MARMIER. DELISEE, AND FROMAGE
REFERENCES
L Morel. F. M. M.. Westall. J. C. and Yeasted. L., in "Adsorption ofInorganic at Solid-Liquid Interfaces" (M. A. Anderson and A. J. Rubin,Eds.). p. 263. Ann Arbor Science. Michigan. 1980,
2. Marmier. N.. Dumonceau. }., and Fromage. F., / Contam. Hvdrol. 26, 159(1997).
3. Westall. J. C. "FITEQL: User's Guide. Version 2.0." Chemistry Department. Oregon State University, Corvallis. Oregon. 1985.
4. Lovgren. L., Sjôberg, S., and Schindler, P. W.. Geochim. Cosmochim.Acta 54, 1301 (1990).
5. Milonjic, S. K.. Kopecni. M. M., and Ilic. Z. E.. J. Radioanai. Chem. 78,15 (1983).
6. Stumm. W.. "Chemistry of the Solid-Water Interface." Wiley-Inter-science. New York. 1992.
7. Tewan, P. H., and McLean. A. W.. J. Colloid Interface Sci. 40,67(1972).8. Fujigaki, S.. Ikehata. A.. Kumaaai. Y., and Nakaeava. K., Kogvo Yosni
108 (1967).
9. Miloojic, S. K.. Ruvarac, A., and Susic. M. V., Bull. Soc. Chim. Beograd.43,207 (1978).
10. Parkhurst, D. L.. "PhreeqC- a Computer Program for Spéciation, Reac-tion-path. Advective-Transport. and Inverse Geochemical Calculations,"U.S. Geological Survey, Water-Resources Investigations Report 95-4227,Lakewood, Colorado. 1995.
11. Wood, A., Chem. Geol. 82, 159 (1990).12. Crosmières. L.. Sorption d'éléments lourds (V(VI), Np(V), Th(IV)
Am(III), Co(II), Cs(I), K-1)) sur des colloïdes d'hématite, proposition demécanismes réactionnels. Thesis. University of Paris XI, 1996.Marmier. N., Dumonceau. J., Chupeau. J.. and Fromage, F.. C. R. Acad.Sci. Paris. Ser. Il 317, 1561 (1993).
Del Nero. M.. Made. B„ Bontems. G., and Clément, A.. Geochim. Cosmochim. Acta 76, 219 (1997).
Lutzenkirchen. J.. in "Transport and Reactive Processes in Aquifers"(Th Dracos and F. Stauffer, Eds), p. 391. Balkema, Rotterdam1994.
13
14
15

ARTICLE N°9
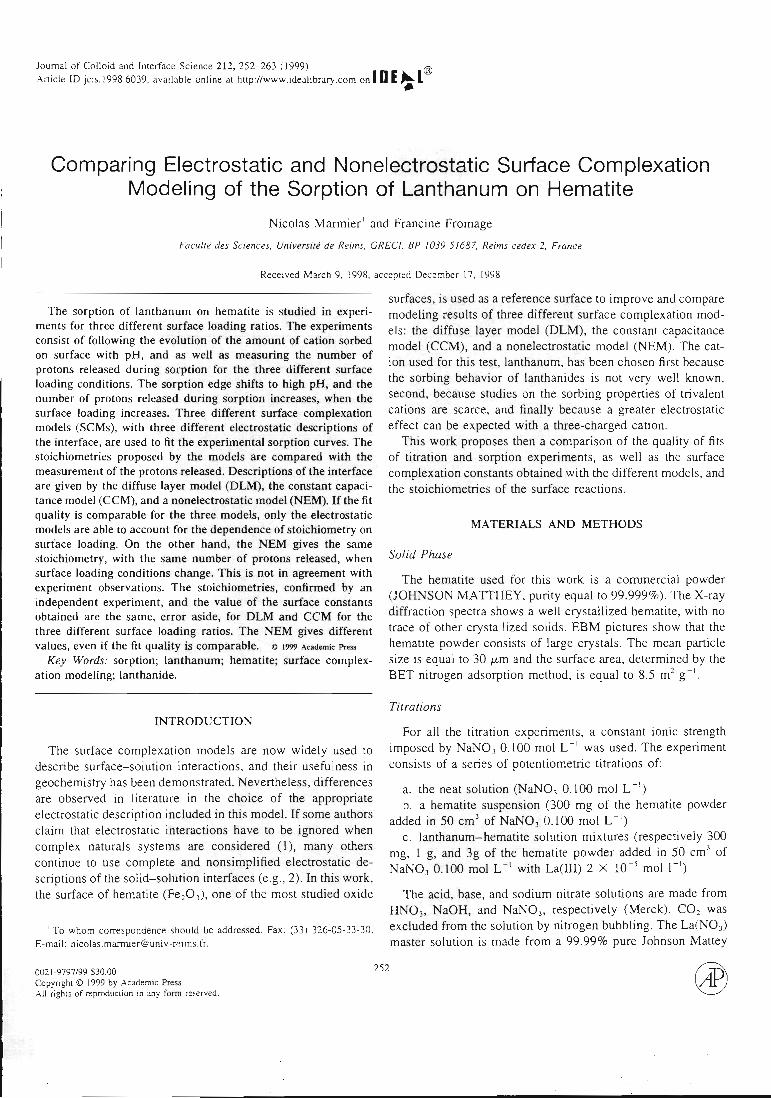
tournai of Colloid and Interface Science 212, 252-263 (1999) <jArticle ID jcis. 1998.6039, available online at http://www.idealibrary.com onlUt j^-L
Comparing Electrostatic and Nonelectrostatic Surface ComplexationModeling of the Sorption of Lanthanum on Hématite
Nicolas Marmier1 and Francine Fromage
Faculté des Sciences, Université de Reims. GRECI. BP 1039 51687, Reims cedex 2, France
Received March 9, 1998, accepted December 17, 1998
The sorption of lanthanum on hématite is studied in experiments for three différent surface loading ratios. The experimentsconsist of following the évolution of the amount of cation sorbedon surface with pH, and as well as measuring the number ofprotons released during sorption for the three différent surfaceloading conditions. The sorption edge shifts to high pH, and thenumber of protons released during sorption increases, when thesurface loading increases. Three différent surface complexationmodels (SCMs), with three différent electrostatic descriptions ofthe interface, are used to fit the expérimental sorption curves. Thestoichiometries proposed by the models are compared with themeasurement of the protons released. Descriptions of the interfaceare given by the diffuse layer model (DLM), the constant capacitance model (CCM), and a nonelectrostatic model (NEM). If the fitquality is comparable for the three models, only the electrostaticmodels are able to account for the dependence of stoichiometry onsurface loading. On the other hand, the NEM gives the samestoichiometry, with the same number of protons released, whensurface loading conditions change. This is not in agreement withexperiment observations. The stoichiometries, confirmed by anindependent experiment, and the value of the surface constantsobtained are the same, error aside, for DLM and CCM for the
three différent surface loading ratios. The NEM gives différentvalues, even if the fit quality is comparable. © 1999 Académie Press
Key Words: sorption; lanthanum; hématite; surface complexation modeling; lanthanide.
INTRODUCTION
The surface complexation models are now widely used todescribe surface-solution interactions, and their usefulness in
geochemistry has been demonstrated. Nevertheless, différencesare observed in literature in the choice of the appropriateelectrostatic description included in this model. If some authorsclaim that electrostatic interactions hâve to be ignored whencomplex naturals Systems are considered (1), many otherscontinue to use complète and nonsimplified electrostatic descriptions of the solid-solution interfaces (e.g., 2). In this work,the surface of hématite (Fe203), one of the most studied oxide
1To whom correspondence should be addressed. Fax: (33) 326-05-33-30.E-mail: [email protected].
surfaces, is used as a référence surface to improve and comparemodeling results of three différent surface complexation models: the diffuse layer model (DLM), the constant capacitancemodel (CCM), and a nonelectrostatic model (NEM). The cation used for this test, lanthanum, has been chosen first because
the sorbing behavior of lanthanides is not very well kxiown,second, because studies on the sorbing properties of trivalentcations are scarce, and finally because a greater electrostaticeffect can be expected with a three-charged cation.
This work proposes then a comparison of the quality of fitsof titration and sorption experiments, as well as the surfacecomplexation constants obtained with the différent models, andthe stoichiometries of the surface reactions.
MATERIALS AND METHODS
Solid Phase
The hématite used for this work is a commercial powder(JOHNSON MATTHEY, purity equal to 99.999%). The X-raydiffraction spectra shows a well crystallized hématite, with notrace of other crystallized solids. EBM pictures show that thehématite powder consists of large crystals. The mean particlesize is equal to 30 jumand the surface area, determined by theBET nitrogen adsorption method, is equal to 8.5 m2 g-'.
Titrations
For ail the titration experiments, a constant ionic strengthimposed by NaN03 0.100 mol L"1 was used. The experimentconsists of a séries of potentiometric titrations of:
a. the neat solution (NaN03 0.100 mol L"1)b. a hématite suspension (300 mg of the hématite powder
added in 50 cm3 of NaN03 0.100 mol L"1)c. lanthanum-hématite solution mixtures (respectively 300
mg, 1 g, and 3g of the hématite powder added in 50 cm3 ofNaN03 0.100 mol L"1 with La(III) 2 X 10"5 mol 1"')
The acid, base, and sodium nitrate solutions are made fromHN03, NaOH, and NaN03, respectively (Merck). C02 wasexcluded from the solution by nitrogen bubbling. The La(N03)master solution is made from a 99.99% pure Johnson Mattey
0021-9797/99 $30.00
Copyright © 1999 by Académie PressAil rights of reproduction in any form reserved.
252
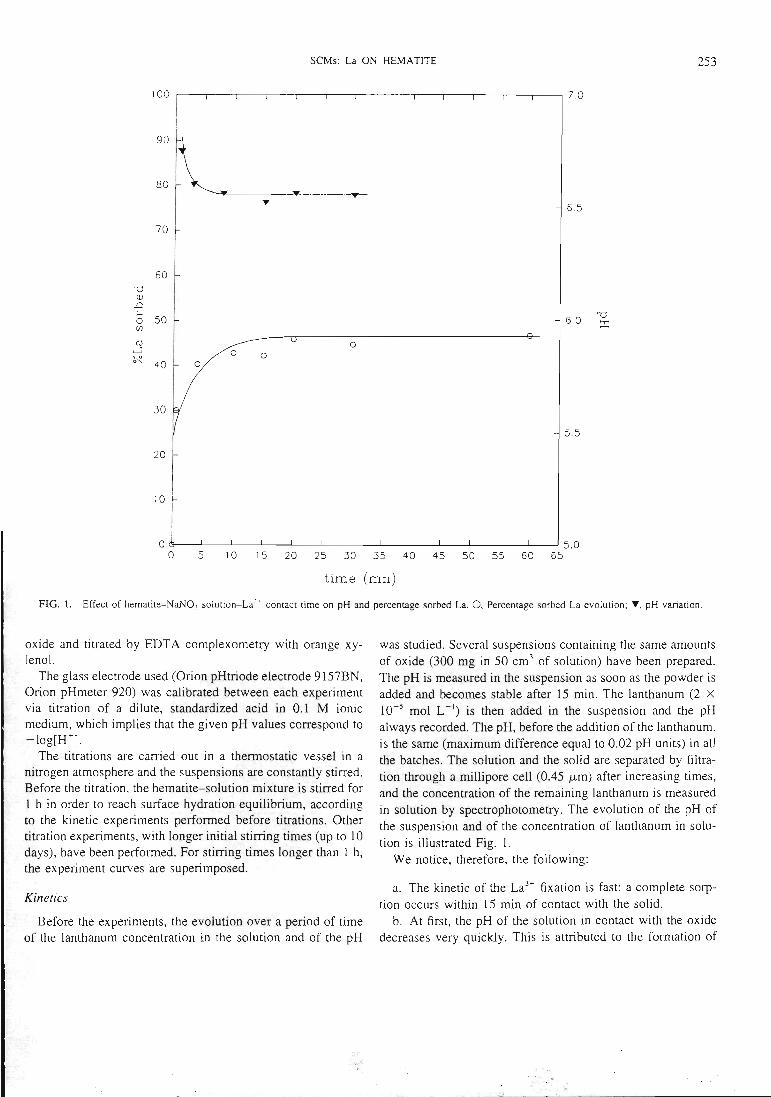
SCMs: La ON HEMATITE 253
100
Xi
o •x
(53
25 30 35 40
time (mn)
FIG. 1. Effect of hematite-NaNO, solution-La3* contact time on pH and percentage sorbed La. O, Percentage sorbed La évolution; T, pH variation.
45 50 60 65
oxide and titrated by EDTA complexometry with orange xy-lenol.
The glass électrode used (Orion pHtriode électrode 9157BN,Orion pHmeter 920) was calibrated between each experimentvia titration of a dilute, standardized acid in 0.1 M ionic
médium, which implies that the given pH values correspond to-log[H+].
The titrations are carried out in a thermostatic vessel in a
nitrogen atmosphère and the suspensions are constantly stirred.Before the titration. the hématite-solution mixture is stirred for
1 h in order to reach surface hydradon equilibrium, accordingto the kinetic experiments performed before titrations. Othertitration experiments, with longer initial stirring times (up to 10days), hâve been performed. For stirring times longer than 1 h,the experiment curves are superimposed.
Kinetics
Before the experiments, the évolution over a period of timeof the lanthanum concentration in the solution and of the pH
was studied. Several suspensions containing the same amounts
of oxide (300 mg in 50 cm3 of solution) hâve been prepared.The pH is measured in the suspension as soon as the powder isadded and becomes stable after 15 min. The lanthanum (2 X
10~5 mol L"1) is then added in the suspension and the pHalways recorded. The pH, before the addition of the lanthanum,is the same (maximum différence equal to 0.02 pH units) in ailthe batches. The solution and the solid are separated by filtra-tion through a millipore cell (0.45 /u,m) after increasing times,and the concentration of the remaining lanthanum is measuredin solution by spectrophotometry. The évolution of the pH ofthe suspension and of the concentration of lanthanum in solution is illustrated Fig. 1.
We notice, therefore, the following:
a. The kinetic of the La3+ fixation is fast: a complète sorption occurs within 15 min of contact with the solid.
b. At first, the pH of the solution in contact with the oxidedecreases very quickly. This is attributed to the formation of
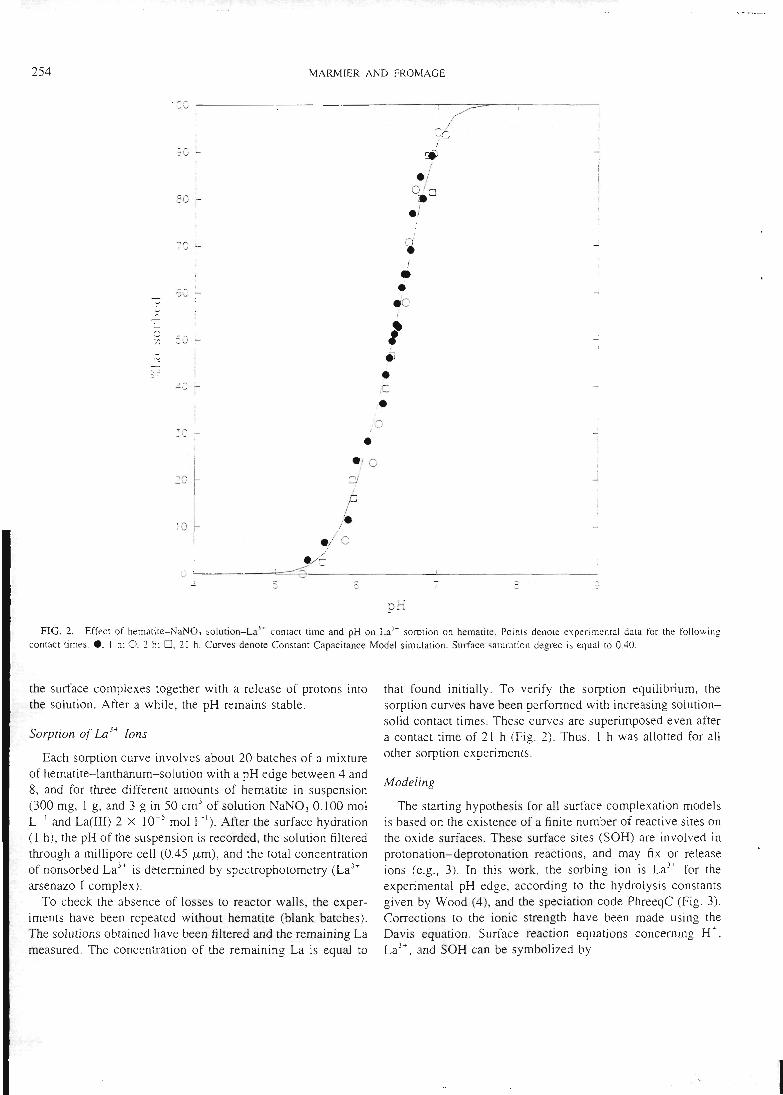
254 MARMIER AND FROMAGE
SO
96
ii
•C'
c
•/
pH
FIG. 2. Effect of hematite-NaNO, solution-La'* contact time and pH on La'" sorption on hématite. Points dénote expérimental data for the followingcontact times: •. I h; O. 2 h; D, 21 h. Curves dénote Constant Capacitance Model simulation. Surface saturation degree is equal to 0.40.
the surface complexes together with a release of protons intothe solution. After a while, the pH remains stable.
Sorption of La3+ Ions
Each sorption curve involves about 20 batches of a mixtureof hematite-lanthanum-solution with a pH edge between 4 and8, and for three différent amounts of hématite in suspension(300 mg, 1 g, and 3 g in 50 cm3 of solution NaN03 0.100 molL"1 and La(III) 2 X 10"5 mol F1). After the surface hydration(1 h), the pH of the suspension is recorded, the solution filteredthrough a millipore cell (0.45 /xm), and the total concentrationof nonsorbed La3+ is determined by spectrophotometry (La3*-arsenazo I complex).
To check the absence of losses to reactor walls, the experiments hâve been repeated without hématite (blank batches).The solutions obtained hâve been filtered and the remaining Lameasured. The concentration of the remaining La is equal to
that found initially. To verify the sorption equilibrium, thesorption curves hâve been performed with increasing solution-solid contact times. Thèse curves are superimposed even aftera contact time of 21 h (Fig. 2). Thus, 1 h was allotted for ailother sorption experiments.
Modeling
The starting hypothesis for ail surface complexation modelsis based on the existence of a finite number of reactive sites on
the oxide surfaces. Thèse surface sites (SOH) are involved in
protonation-deprotonation reactions, and may fix or releaseions (e.g., 3). In this work, the sorbing ion is La3* for theexpérimental pH edge, according to the hydrolysis constantsgiven by Wood (4), and the spéciation code PhreeqC (Fig. 3).Corrections to the ionic strength hâve been made using theDavis équation. Surface reaction équations conceming H*.La3+, and SOH can be symbolized by
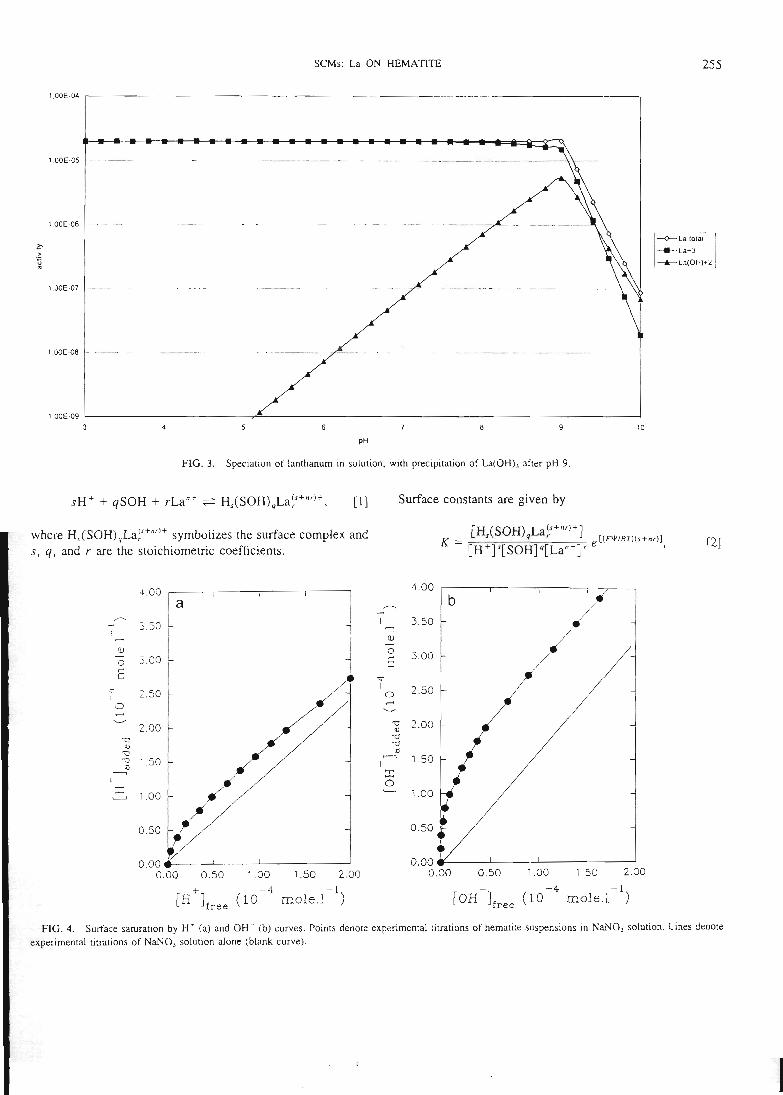
SCMs: La ON HEMATITE
FIG. 3. Spéciation of lanthanum in solution, with précipitation of La(OH), after pH 9.
sH+ + qSOH + /-La"+ ?£ Hî(SOH),La<*+"r,+, [1] Surface constants are given by
where H,(SOH)qLals+"',+ symbolizes the surface complex and v _ [H;(SOH),La<I+"r)+]K =
s, q, and r are the stoichiometric coefficients.
^5r-C
iO
4.00
0.50
0.00 •
4.00
t 2.00
a
XO
0.50
0.00
[H +]J[SOH]«[La"+]r,[{FVIRT)(s + nr)]
0.00 0.50 1.00 1.50 2.00
[H+]f (10-4 mole.r1)L Jfree v '
0.00 0.50 1.00 1.50 2.00
[OH"]free (10-4 mole.l"1)
255
-La local
-Lai-3
-La(OH)+2
[2]
FIG. 4. Surface saturation by H* (a) and OH" (b) curves. Points dénote expérimental titrations of hématite suspensions in NaN03 solution. Lines dénoteexpérimental titrations of NaNO, solution alone (blank curve).
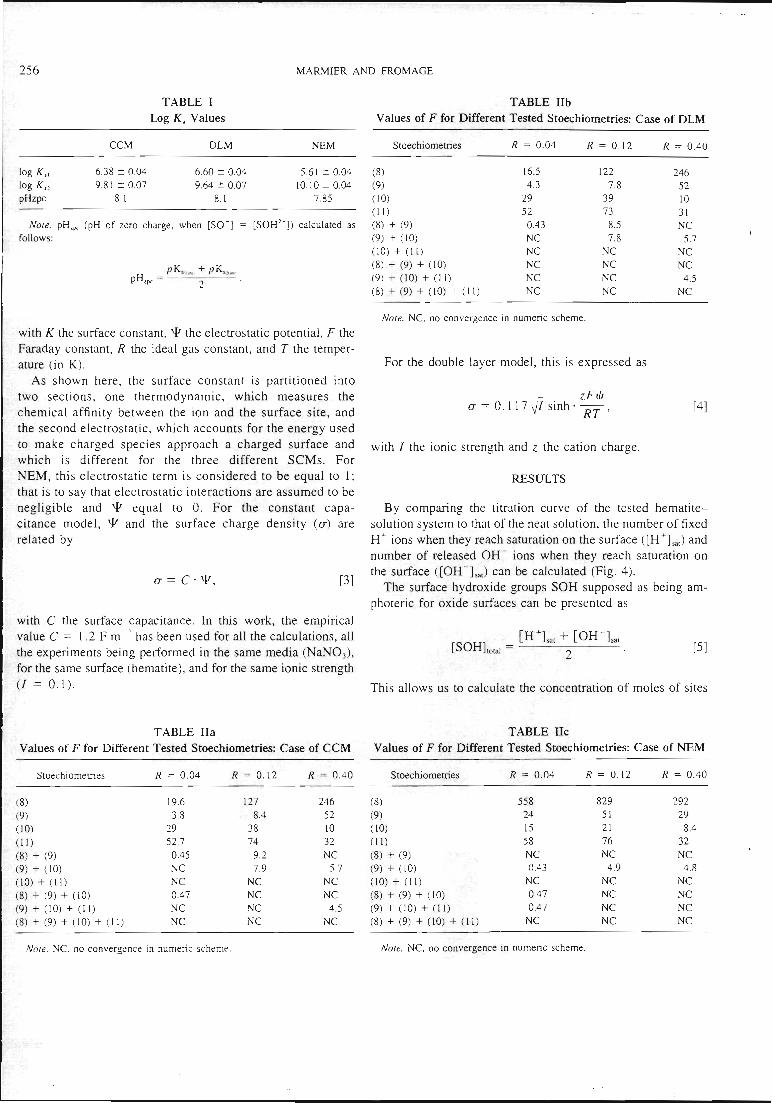
256 MARMIER AND FROMAGE
log K»log K,:pHzpc
TABLE I
Log K, Values
CCM
6.38 - 0.04
9.81 ± 0.07
8.1
DLM
6.60 ± 0.04
9.64 ± 0.07
8.1
NEM
5.61 ± 0.04
10.10 ±0.04
7.85
Note. pHlpc (pH of zéro charge, when [SOfollows:
[SOH2*]) calculated as
PH2[pK.,,,,,,, + pK,,„n
with K the surface constant, ^ the electrostatic potential, F theFaraday constant, R the idéal gas constant, and T the température (in K).
As shown hère, the surface constant is partitioned intotwo sections, one thermodynamic, which measures thechemical affinity between the ion and the surface site, andthe second electrostatic, which accounts for the energy usedto make charged species approach a charged surface andwhich is différent for the three différent SCMs. For
NEM, this electrostatic term is considered to be equal to 1;that is to say that electrostatic interactions are assumed to benegligible and ^ equal to 0. For the constant capacitance model, W and the surface charge density (cr) arerelated by
= C-^, [3]
with C the surface capacitance. In this work, the empiricalvalue C = 1.2 F m": has been used for ail the calculations, ailthe experiments being performed in the same média (NaN03),for the same surface (hématite), and for the same ionic strength
(/ = 0.1).
TABLE Ha
Values of F for Différent Tested Stoechiometries: Case of CCM
TABLE Ilb
Values of F for Différent Tested Stoechiometries: Case of DLM
Stoechiometries R = 0.04 0.12 R = 0.40
(8) 16.5 122 246
(9) 4.3 7.8 52
(10) 29 39 10
(11) 52 73 31
(8) + (9) 0.43 8.5 NC
(9) + (10) NC 7.8 5.7
(10) + (11) NC NC NC
(8) + (9) + (10) NC NC NC
(9) + (10) + (11) NC NC 4.5
(8) + (9) + (10) + (11) NC NC NC
Note. NC, no convergence in numeric scheme.
For the double layer model, this is expressed as
zFécr = 0.117 v7sinh- —, [4]
with / the ionic strength and z the cation charge.
RESULTS
By comparing the titration curve of the tested hématite-solution System to that of the neat solution, the number of fixedH+ ions whenthey reachsaturation on the surface ([H+]sa[) andnumber of released OH~ ions when they reach saturation onthe surface ([OH"]sa,) can be calculated (Fig. 4).
The surface hydroxide groups SOH supposed as being am-photeric for oxide surfaces can be presented as
[SOH]t([H- [OH-
[5]
This allows us to calculate the concentration of moles of sites
TABLE Ile
Values of F for Différent Tested Stoechiometries: Case of NEM
Stoechiometries R = 0.04 R = 0.12 R = 0.40 Stoechiometries R = 0.04 R = 0.12 R = 0.40
(8) 19.6 127 246 (8) 558 829 292
(9) 3.8 8.4 52 (9) 24 51 29
(10) 29 38 10 (10) 15 21 8.4
(11) 52.7 74 32 (11) 58 76 32
(8) + (9) 0.45 9.2 NC (8) + (9) NC NC NC
(9) + (10) NC 7.9 5.7 (9) + (10) 0.43 4.9 4.8
(10) + (11) NC NC NC (10) + (11) NC NC NC
(8) + (9) + (10) 0.47 NC NC (8) + (9) + (10) 0.47 NC NC
(9) + (10) + (11) NC NC 4.5 (9) + (10) + (11) 0.47 NC NC
(8) + (9) + (10) + (11) NC NC NC (8) + (9) + (10) + (11) NC NC NC
Note. NC, no convergence in numeric scheme. Note. NC, no convergence in numeric scheme.
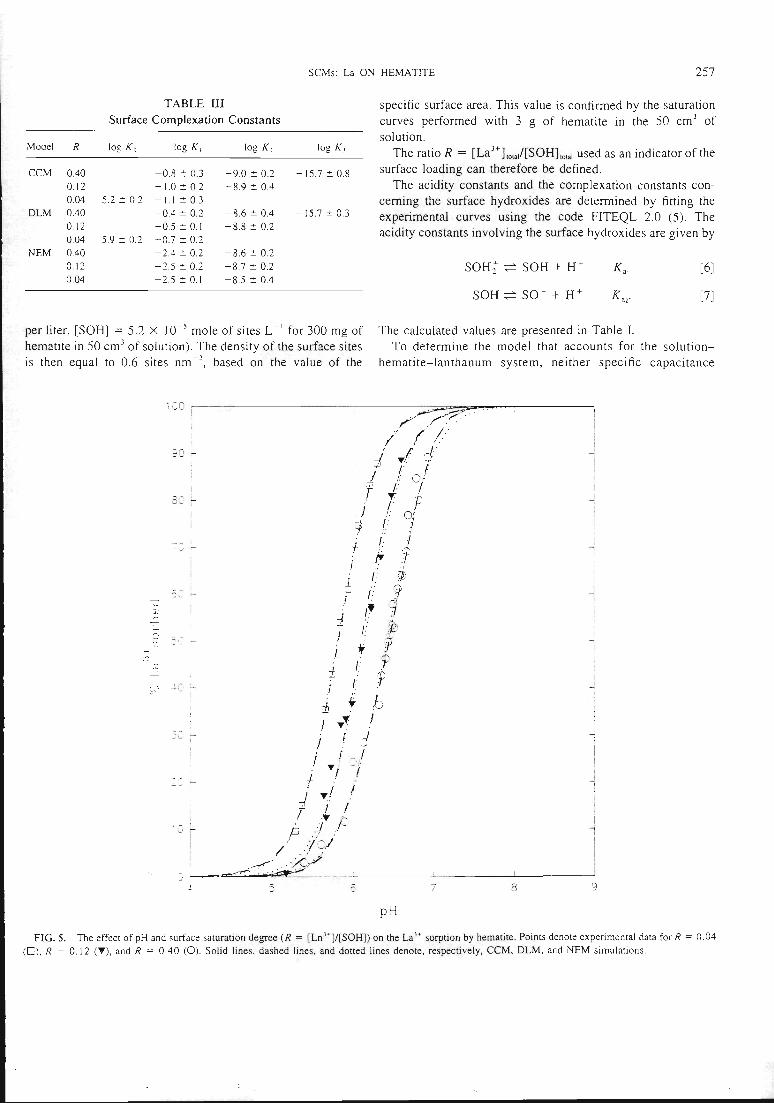
SCMs: La ON HEMATITE 257
TABLE III
Surface Complexation Constants
Model R log K, log K, log/C, log K,
CCM 0.40 -0.8 * 0.3 -9.0 ± 0.2 -15.7 ± 0.8
0.12 -1.0 ±0.2 -8.9 ± 0.4
0.04 5.2 t 0.2 -1.1 ±0.3
DLM 0.40 -0.4 ± 0.2 -8.6 ± 0.4 -15.7 ± 0.3
0.12 -0.5 ±0.1 -8.8 ± 0.2
0.04 5.9 i 0.2 -0.7 ±0.2
NEM 0.40 -2.4 ± 0.2 -8.6 ±0.2
0.12 -2.5 ± 0.2 -8.7 ±0.2
0.04 -2.5 ±0.1 -8.5 ± 0.4
per liter, [SOH] = 5.2 X 10~5 mole of sites L'1 for 300 mg ofhématite in 50 cm3 of solution).The density of the surface sitesis then equal to 0.6 sites nm"2, based on the value of the
spécifie surface area. This value is confirmed by the saturationcurves performed with 3 g of hématite in the 50 cm3 ofsolution.
The ratio R = [La3+]tolal/[SOH],ola| used as an indicator of thesurface loading can therefore be defined.
The acidity constants and the complexation constants conceming the surface hydroxides are determined by fitting theexpérimental curves using the code FITEQL 2.0 (5). Theacidity constants involving the surface hydroxides are given by
soh: -=-; SOH + H+ Ka
SOH^±SO" + H+ K„
[6]
[7]
The calculated values are presented in Table I.To détermine the model that accounts for the solution-
hematite-lanthanum System, neither spécifie capacitance
pH
FIG. 5. The effectof pH and surface saturation degree (R = [Ln'*]/[SOH]) on the La'* sorption by hématite. Pointsdénote expérimental data for R(D), R = 0.12 (•), and R = 0.40 (O). Solid Unes, dashed Unes, and dotted Unes dénote, respectively, CCM, DLM, and NEM simulations.
0.04
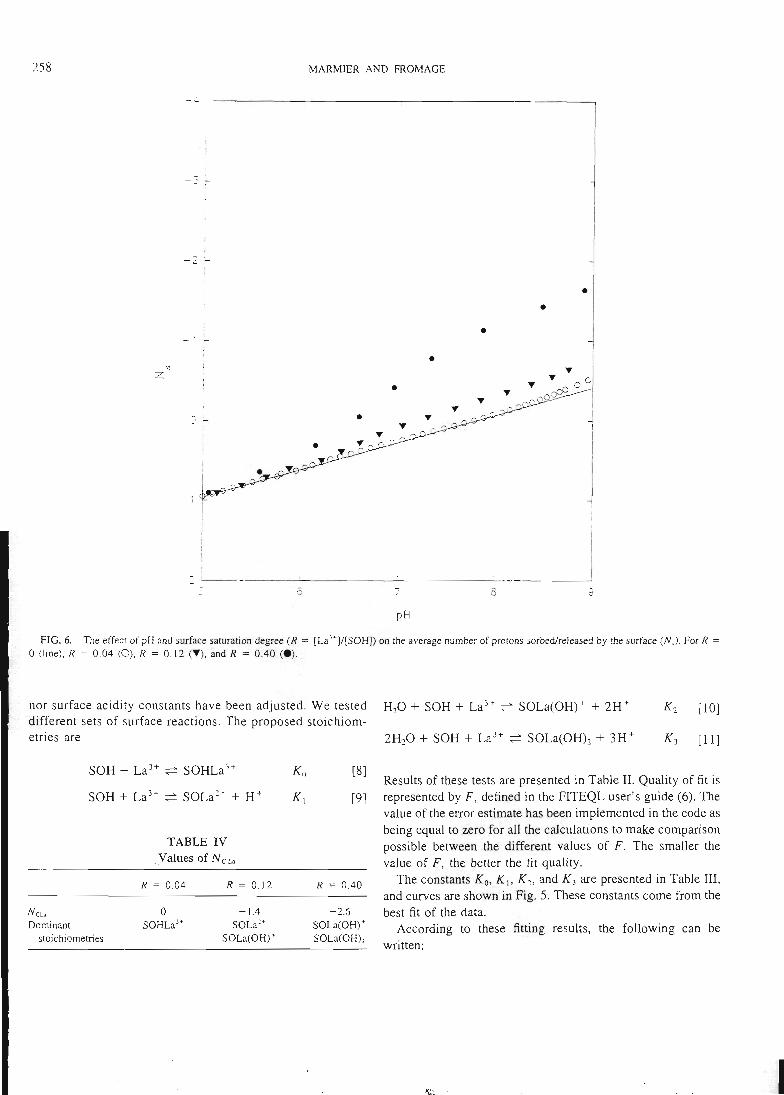
258 MARMIER AND FROMAGE
. :,)«3r5^'
pH
FIG. 6. Theeffect of pHandsurface saturation degree (/? = [La'*]/[SOH]) on theaverage number of protons sorbed/released by thesurtace (A'J. ForR0 (line), R = 0.04 (O), R = 0.12 (•), and R = 0.40 (•).
nor surface acidity constants hâve been adjusted. We tested H20 + SOH + La3+ ^s SOLa(OH)+ + 2H+ K2différent sets of surface reactions. The proposed stoichiom
[10]
etries are
SOH + La3+ ?s SOHLa3+ K0 [8]
SOH + La3+ ;± SOLa- + H + *i [9]
TABLE IV
Values of Nc u
R = 0.04 R = 0.12 R = 0.40
NCL> 0 -1.4 -2.6
Dominant SOHLa3* SOLa:* SOLa(OH)*stoichiometries SOLa(OH) * SOLa(OH),
2H20 + SOH + La3+ ^± SOLa(OH), + 3H + Ki [11]
Results of thèse tests are presented in Table IL Quality of fit isrepresented by F, defined in the FITEQL user's guide (6). Thevalue of the error estimate has been implemented in the code asbeing equal to zéro for ail the calculations to make comparisonpossible between the différent values of F. The smaller thevalue of F, the better the fit quality.
The constants K0, Kt, K-., and K3 are presented in Table III,and curves are shown in Fig. 5. Thèse constants corne from thebest fit of the data.
According to thèse fitting results, the following can bewritten:
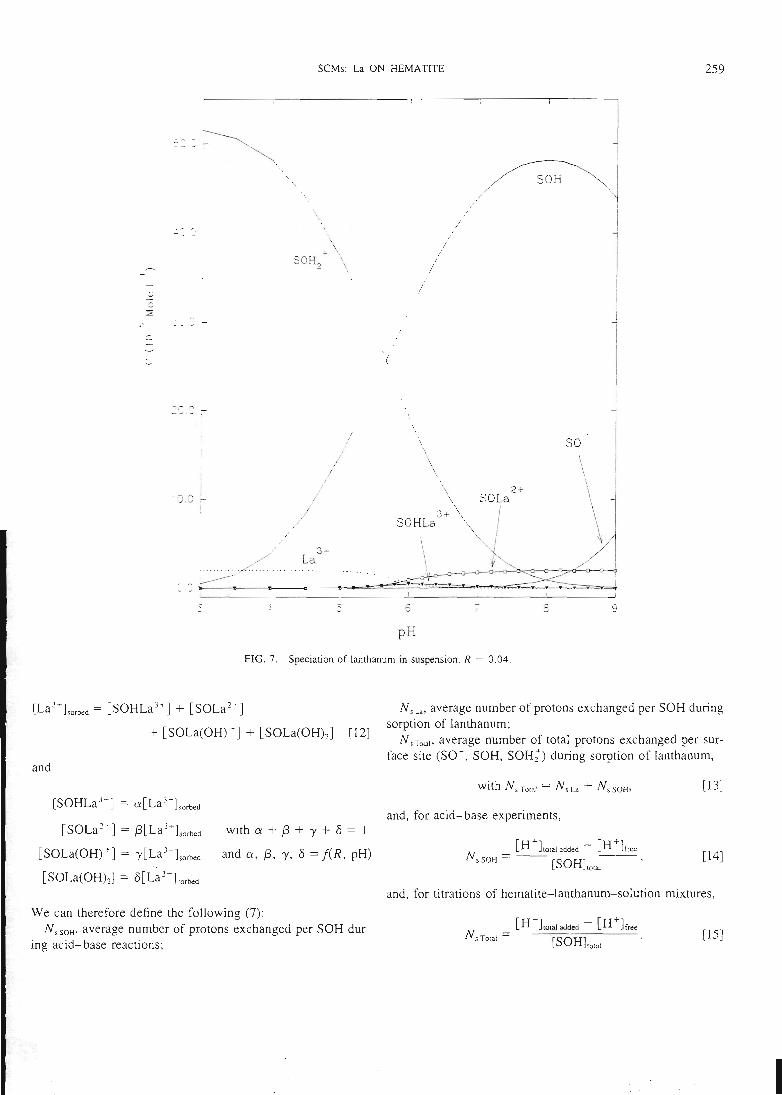
SCMs: La ON HEMATITE
-
\
SOH,* \
X
//
//
/
/SOH ~~\
0.0 r
La
pH
FIG. 7. Spéciation of lanthanum in suspension. R = 0.04.
259
[La3i]sorbed = [SOHLa3+] + [SOLa2+]
+ [SOLa(OH)+] + [SOLa(OH)2] [12]
and
N, La, average number of protons exchanged per SOH duringsorption of lanthanum;
NsToiai. average number of total protons exchanged per surface site (SO", SOH, SOH2+) during sorption of lanthanum,
[SOHLa3'] = a[La3*]s,
[SOLa-~] = j3[La3-]s,
[SOLatOHH = y[La3+]s,
[SOLa(OH)2] = 5[La3"l..c
with a + /3 + 7+6=l
and a, J3, y, S =/(/?, pH)
We can therefore define the following (7):/VsSOH, average number of protons exchanged per SOH dur
ing acid-base reactions;
with/VsTotal
and, for acid-base experiments,
LH ]total added "~ L" ]free"s son — renin ' L14]
and, for titrations of hematite-lanthanum-solution mixtures,
LH Jtotal added ~ LH ]freeN.
^L, + NsS0H, [13]
[SOH],, [15]
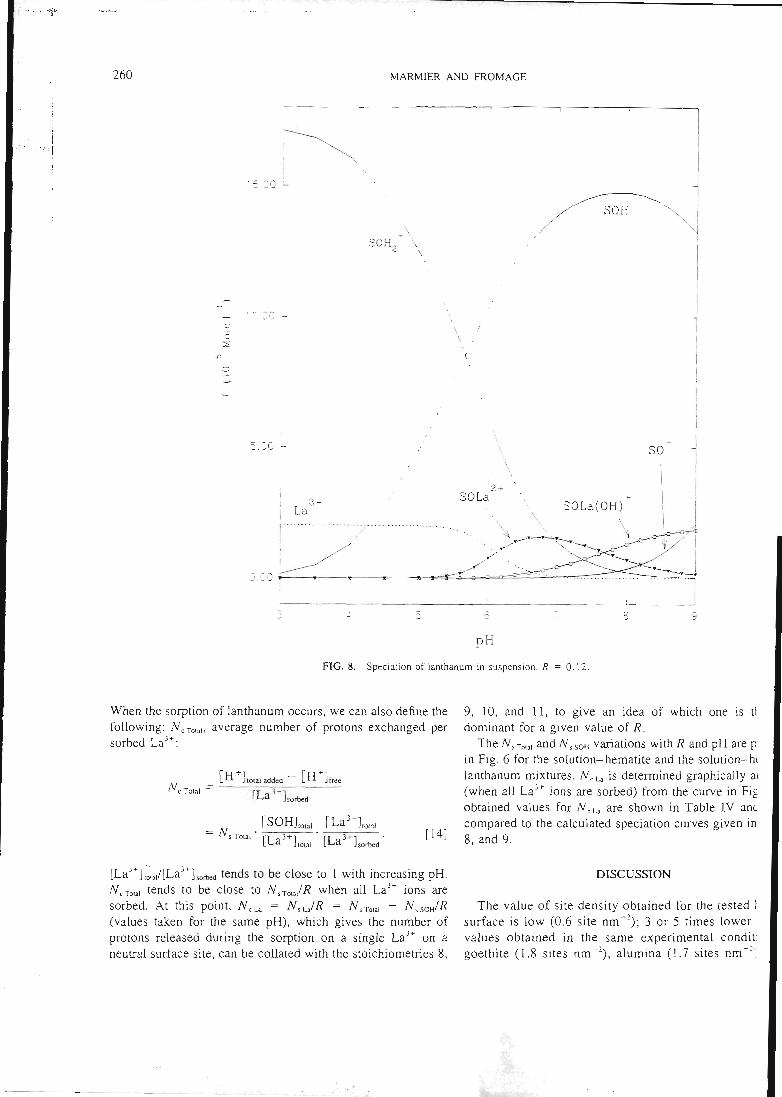
260 MARMIER AND FROMAGE
.00
SOH, \
La
pH
FIG. 8. Spéciation of lanthanum in suspension. R = 0.12.
When thesorption of lanthanum occurs, we canalso define thefollowing: Ncjouh average number of protons exchanged persorbed La+:
Nc[H-
= N.
-[H+]
[La ]sorbed
[S0H]t0Ia|
[La ]totai
[La3[La3
[14]
[La3+]lo,a,/[La3+]sorbea tends to be close to 1 with increasing pH./VcTola, tends to be close to NiToJR when ail La3+ ions aresorbed. At this point, /VcLa = NSJR = NiToal - NsS0H/R(values taken for the same pH), which gives the number ofprotons released during the sorption on a single La3" on aneutral surface site, can be collated with the stoichiometries 8,
9, 10, and 11, to give an idea of which one is tldominant for a given value of R.
The yVSTo,ai and NsSCM variations withR and pH are pin Fig. 6 for the solution-hématite and the solution-h<lanthanum mixtures. NcU is determined graphically ai(when ail La3+ ions are sorbed) from the curve in Figobtained values for NcU are shown in Table IV anccompared to the calculated spéciation curves given in8, and 9.
DISCUSSION
The value of site density obtained for the tested 1surface is low (0.6 site nm"2); 3 or 5 times lowervalues obtained in the same expérimental conditgoethite (1.8 sites nm-2), alumina (1.7 sites nm"*;
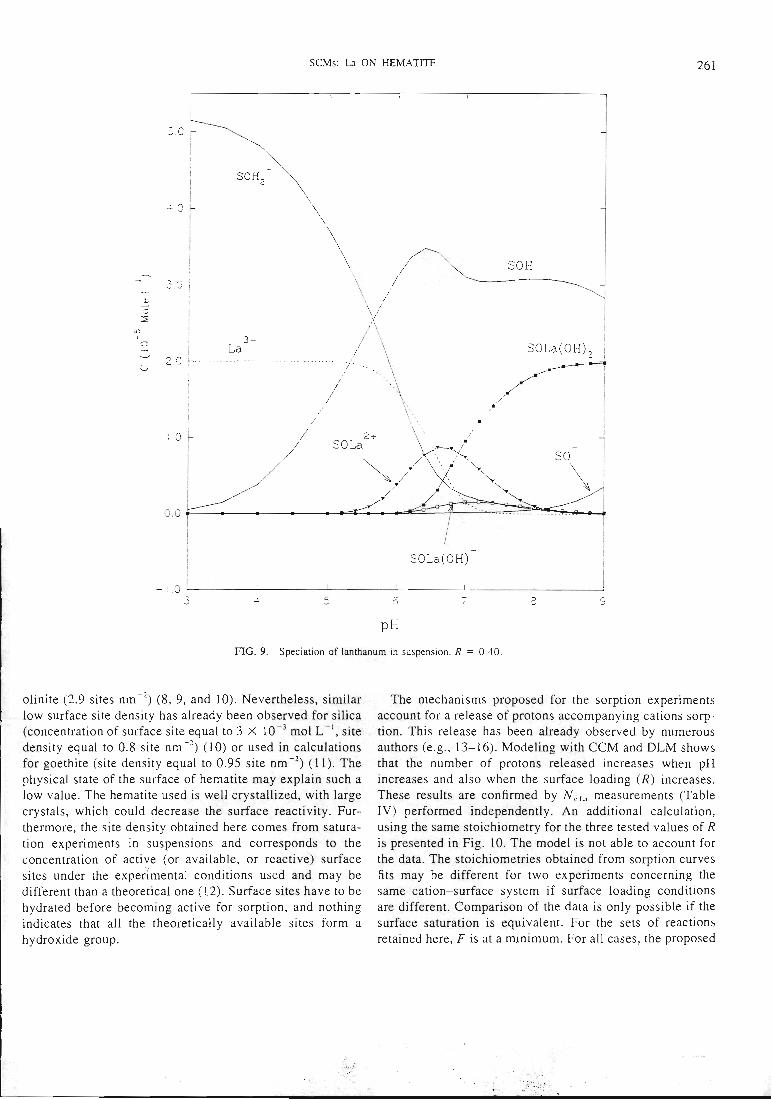
SCMs: La ON HEMATITE
11
i
^ n _
ii
lSOH2* \^
1 1 !
4.C 1-!
i
\ -
i
\
//
/
v_SOH
3.0 r ~^"^'V
/
n .
/\, i
2.0
-'.0
SOLa(OH)
pH
FIG. 9. Spéciation of lanthanum in suspension, R = 0.40.
261
olinite (2.9 sites nm"2) (8, 9, and 10). Nevertheless, similarlow surface site density has already been observed for silica(concentration of surface site equal to 3 X 10" mol L"', sitedensity equal to 0.8 site nm"2) (10) or used in calculationsfor goethite (site density equal to 0.95 site nm"2) (11). Thephysical state of the surface of hématite may explain such alow value. The hématite used is well crystallized, with largecrystals, which could decrease the surface reactivity. Fur-thermore, the site density obtained hère comes from saturation experiments in suspensions and corresponds to theconcentration of active (or available, or reactive) surfacesites under the expérimental conditions used and may bedifférent than a theoretical one (12). Surface sites hâve to behydrated before becoming active for sorption, and nothingindicates that ail the theoretically available sites form ahydroxide group.
The mechanisms proposed for the sorption experimentsaccount for a release of protons accompanying cations sorption. This release has been already observed by numerousauthors (e.g., 13-16). Modeling with CCM and DLM showsthat the number of protons released increases when pHincreases and also when the surface loading (R) increases.Thèse results are confirmed by NcU measurements (TableIV) performed independently. An additional calculation,using the same stoichiometry for the three tested values of Ris presented in Fig. 10. The model is not able to account forthe data. The stoichiometries obtained from sorption curvesfits may be différent for two experiments conceming thesame cation-surface System if surface loading conditionsare différent. Comparison of the data is only possible if thesurface saturation is équivalent. For the sets of reactionsretained hère, F is at a minimum. For ail cases, the proposed
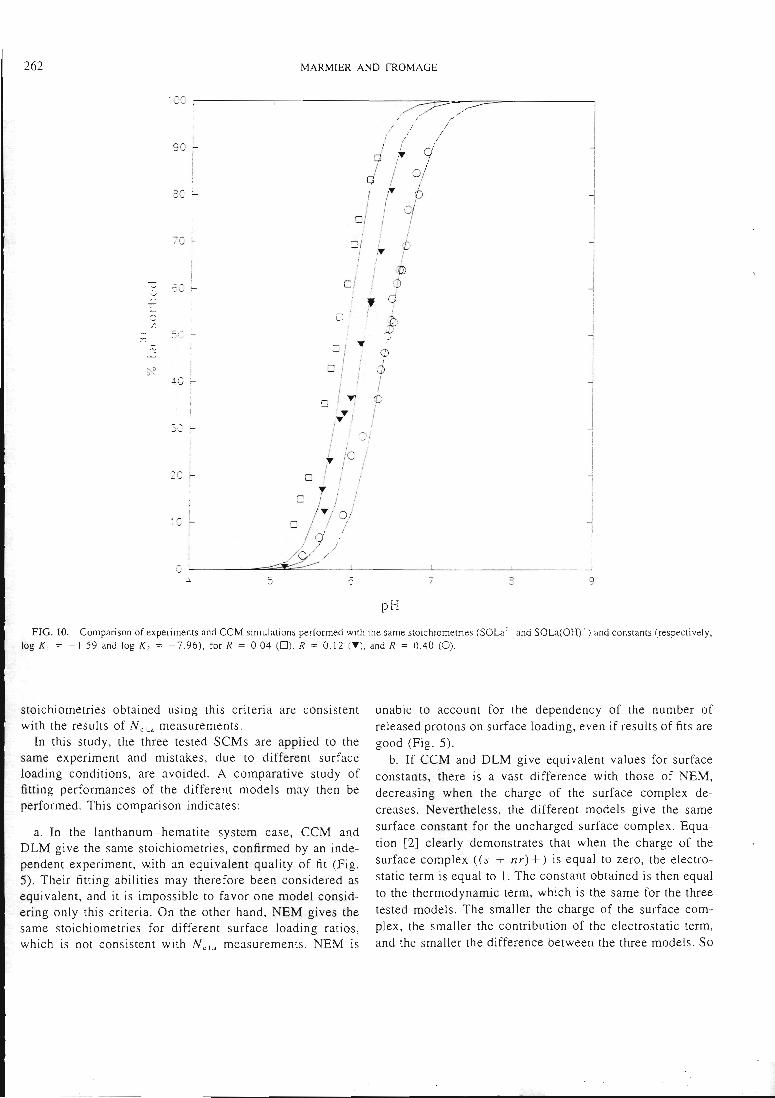
262 MARMIER AND FROMAGE
100
3C
70 -
./ ;
f <jf
d40
! • O
JO :-
/ /'
10 r
/ex/Y/
pH
FIG. 10. Comparison ofexperiments andCCM simulations performed with the same stoichiometries (SOLa:* andSOLa(OH)*) andconstants (respectively,log K, = -1.59 and log K, = -7.96), for R = 0.04 (D), R = 0.12 (T), and R = 0.40 (O).
stoichiometries obtained using this criteria are consistentwith the results of/VcLa measurements.
In this study, the three tested SCMs are applied to thesame experiment and mistakes, due to différent surfaceloading conditions, are avoided. A comparative study offitting performances of the différent models may then beperformed. This comparison indicates:
a. In the lanthanum-hématite system case, CCM andDLM give the same stoichiometries, confirmed by an inde-pendent experiment, with an équivalent quality of fit (Fig.5). Their fitting abilities may therefore been considered aséquivalent, and it is impossible to favor one model considering only this criteria. On the other hand, NEM gives thesame stoichiometries for différent surface loading ratios,which is not consistent with /VcLa measurements. NEM is
unable to account for the dependency of the number ofreleased protons on surface loading, even if results of fits aregood (Fig. 5).
b. If CCM and DLM give équivalent values for surfaceconstants, there is a vast différence with those of NEM,decreasing when the charge of the surface complex decreases. Nevertheless, the différent models give the samesurface constant for the uncharged surface complex. Equation [2] clearly demonstrates that when the charge of thesurface complex ((s + nr) + ) is equal to zéro, the electrostatic term is equal to 1. The constant obtained is then equalto the thermodynamic term, which is the same for the threetested models. The smaller the charge of the surface complex, the smaller the contribution of the electrostatic term,and the smaller the différence between the three models. So
SCMs: La ON HEMATITE 263
if it seems to be possible to interchange constants obtainedwith DLM and CCM, thèse are not compatible with thoseobtained with NEM.
In changing surface loading conditions, the same surfaceconstant is obtained, excepting error, for the same stoichiometry. This is observed for DLM, CCM, and NEM. This is a wayto test the consistency of the results obtained.
CONCLUSION
If electrostatic models give more information about simpleSystems and high loaded surfaces, the nonelectrostatic modelmay be préférable for more complex and/or unsaturated Systems. Nevertheless, fitting ability does not seem to be a con-vincing argument for preferring one model over another and isnot a criteria for testing the consistence of experiment andmodel. In the lanthanum-hématite case, the electrostatic model
seems to be much more appropnate considering the high surface charge, but NEM give good fit results too. Hère again, thechoice between the différent modeling propositions is notclear. A more convincing argument émerges when we considerthe évolution of the surface loading ratio R of the surfaceconstants given by the three models. The weakness of NEM inaccounting for the tested case is highlighted. Nevertheless,distinguishing between CCM and DLM is impossible in this
case as stoichiometries, quality of fit, and surface constants arequasi-equivalent.
REFERENCES
1. Westall, J. C. Mater. Res. Soc. Symp. Proc. 353, 937 (1995).2. Wanner. H.. Albinsson. Y.. Karnland, O., Wieland. E., Wersin, P., and
Charlet, L„ Radiochim. Acta 66/67, 157 (1994).
3. Morel. F. M. M., Westall, J. C. and Yeasted, L., in "Adsorption of Inorganicat Solid-Liquid Interfaces" (Ann Arbor. Ed.). p. 263. New York. 1980.
4. Wood, A.. Chem. Geol. 82, 159 (1990).
5. Westall. 1. C. "FITEQL: User's Guide. Version 2.0." Chemistry Department. Oregon State University, Corvallis, OR. 1985.
6. Westall. J. C. "FITEQL: User's Guide. Version 1.2." Chemistry Department, Oregon State University, Corvallis, OR. 1982.
7. Lovgren. L.. Sjoberg. S., and Schindler, P. W„ Geochim. Cosmochim.Acta 54, 1301 (1990).
8. Marmier, N.. Dumonceau. J.. Chupeau. J.. and Fromage. F.. C R. Acad.Sci. Paris 317, (II) 1561 (1993).
9. Marmier, N., Dumonceau. J.. and Fromage. F.. /. Contam. Hydrol. 26, 159(1997).
10. Marmier, N., Dumonceau, J., Chupeau, J.. and Fromage, F., Mater. Res.Soc. Symp. Proc. 353, 1085 (1995).
11. Venema. P.. Hiemstra. T.. and van Riemsdijk, W. H., J. Colloid InterfaceSci. 181,45 (1996).
12. Pivovarov, S., J. Colloid Interface Sci. 196, 321 (1997).13. Benjamin, M. M., and Leckie, 1. O.. Environ. Sci. Technol. 16, 162(1982).14. Hohl. H., and Stumm. W.. J. Colloid Interface Sci. 55, 281 (1976).
15. James. R. O.. and Parks. G. A.. Surf. Colloid Sci. 12, 119 (1982).
16. Kinniburgh. D. G., J. Soil Sci. 34, 759 (1983).
*i

ARTICLE N°10
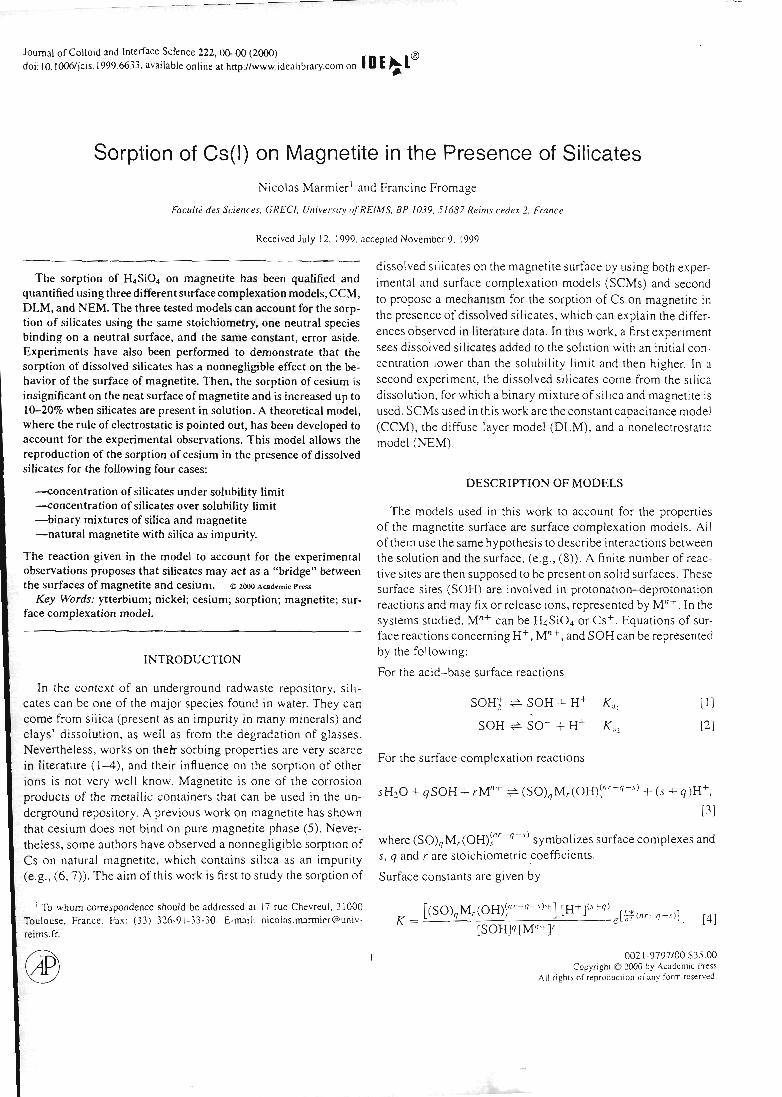
Journal of Colloid and Interface Scfence 222, 00-00 (2000)doi:10.I006/jcis. 1999.6633. available online'̂ hmw/ a ,uUlc °niine at http://www.idealibrary.com on IDE^l
Sorption of Cs(l) on Magnétite in the Présence of SilicatesNicolas Marmier1 and Francine Fromage
Faculté des Sciences. GRECI. University of REIMS, BP ,039, 5,687 Reims cedex 2, France
ReceivedJuly 12, 1999: accepted November 9, 1999
Jl fiT t H4S1°4 °n magnetite has beea 1«a«fied andDLM and NEM. The three tested models can account for the sorp-horof s.hcates using the same stoichiometry, one neutral speciesbindmg on aneutral surface, and the same constant, errer asideExpenments haye also been performed to demonstrate that theh2 M SS°iVed SiHCateS h3S 3nonnegligible effect on the be-hav,or of the surface of magnetite. Then, the sorption of césium issthnton ;he neat surface °f magnetite and *s incre-ed "p °10-20% when s.kcates are présent in solution. Atheoretical modelwhere the rule of electrostatic is pointed out, has been developed oaccount for the expérimental observations. This mode, allow the
—concentration ofsilicates under solubility limit—concentration ofsilicates over solubility limit—binary mixtures of silica and magnetite—natural magnetite with silica as impurity.
!h^Cti0n giVe" ln thC m0dd t0 aCC0Unt for *•expérimentalobservatlons proposes that silicates may act as a"bridge" betweenthe surfaces 0f magnetite and césium, e2TOo Aa>d,mic Z.fjfr i ytterbium; nickel; césium; sorption; magnetite; surface complexation model.
dissolved silicates on the magnet.te surface by using both expérimental and surface complexation models (SCMs) and secondto propose amechanism for the sorption of Cs on magnetite inthe présence of dissolved silicates, which can explain the differences observed in literature data. In this work, afirst experimentsees dissolyed silicates added to the solution with an initial concentration lower than the solubility limit and then higher In asecond experiment, the dissolved silicates corne from the silicadissolution, for which abinary mixture of silica and magnetite isïrrdTTJmthlS W°rk arC the COnStant balance modelS)l\l5USe-'ayer model (°LM)> and anonelectrostaticmodel (NEM).
DESCRIPTION OF MODELS
The models used in this work to account for the propertiesof the magnetite surface are surface complexation models Ailof them use the same hypothesis to describe interactions betweenthe solution and the surface, (e.g., (8)), Afinite number of réactive sites are then supposed to be présent on solid surfaces Thèsesurface sites (SOH) are involved in protonation-deprotonationreactions and may fix or release ions, represented by M"+ In theSystems studied, M«+ can be H4S104 or Cs+. Equations of surface réactions conceming H+, M»+, and SOH can be representedby the following:
Forthe acid-base surface reactions
INTRODUCTION
In the context of an underground radwaste repository silicates can be one of the major species found in water. They cancorne from silica (présent as an impurity in many minerais) anddays dissolution as well as from the dégradation of glasses.Nevertheless, works on the* sorbing properties are very scarcemliterature (1-4), and their influence on the sorption of otherions is not very well know. Magnetite is one of the corrosionproducts of the metallic containers that can be used in the underground repository. Aprevious work on magnetite has shownthat césium does not bind on pure magnetite phase (5) Nevertheless, some authors hâve observed anonnegligible sorption ofCs on natural magnetite, which contains silica as an impurity(e.g., (6,7)). The aim of this work is first to study the sorption of
' To whom correspondent should be addressed at 17 rue Chevreul 31000Toulouse, France. Fax: (33) 326-91-33-30. E-ma,l: [email protected].
SOHJ-SOH + H+ KaiSOH ^ SO" + H+ KJ2
For the surface complexation reactions
sH20 + qSOH + rMn+
[1]
[2]
(SO)„Mr(OH)f-<'-*> + (, + «?)H+1[3]
where (SO^fOHtf"-'^ symbolizes surface complexes ands, q and r are stoichiometric coefficients.
Surface constants are given by
[(SO),Mr(OH)f'-"-'>+! [H+]<y+?> rr„îïoHw+r e^-<-»], [4]
0021-9797/00 S35.00Copyright © 2000 by Académie Press
Ail rights of reproduction in'any form reserved.
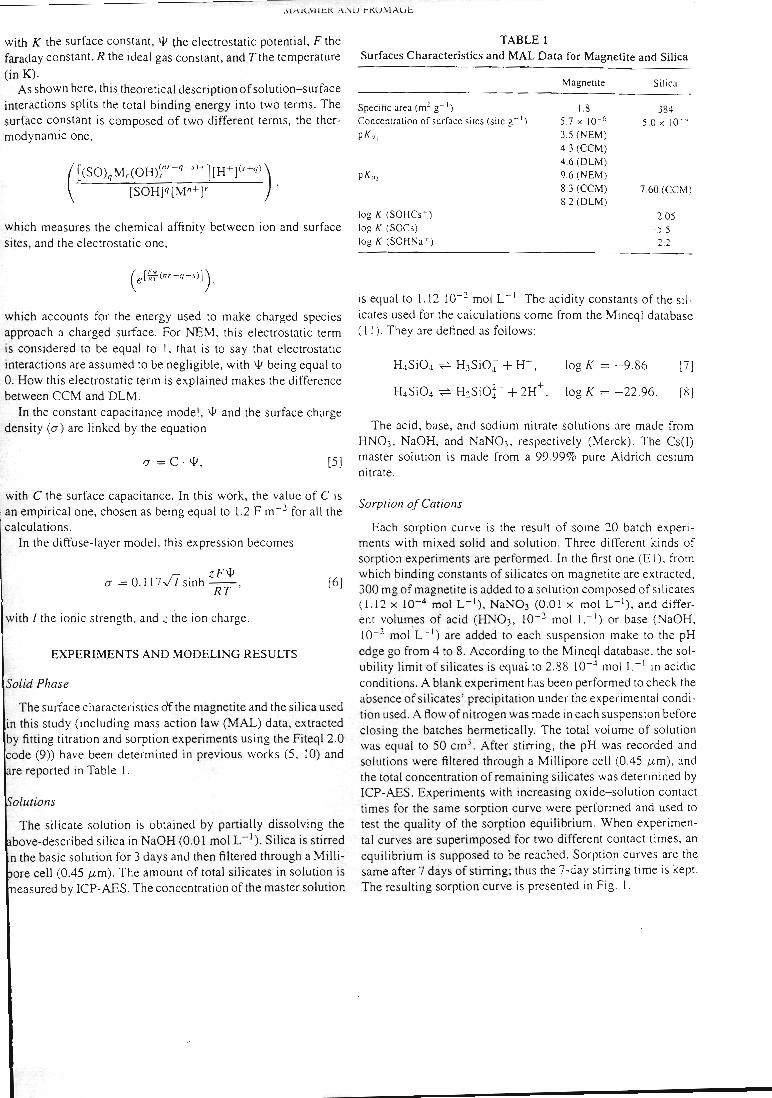
MrtK.VlItlK A,SU r-KU.MAOh
with K the surface constant, u*/ the electrostatic potential, F the TABLE 1faraday constant, Rthe idéal gas constant, and 7" the température Surfaces Characteristics and MAL Data for Magnetite and Silica(in K).
As shown hère, this theoretical description ofsolution-surface Magnetiteinteractions splits the total binding energy into two terms. The Z~I ,„.,,m2 „.,, 'surface constant is composed of two différent terms, the ther- Concentration of surface sites (si* .-«)modynamic one, pKc/
' [(SO),Mr(OH)fr-'?-j)+][H+]('+'7' '[soH]nM"+r
P^u,
Silica
384
5.0 x I0-4
which measures the chemical affinity between ion and surface log k(SOCs/sites, and the electrostatic one, log k (SOHNa+)
5.7 x 10~6
3.5 (NEM)4.3 (CCM)4.6 (DLM)9.6 (NEM)8.3 (CCM)8.2 (DLM)
7.60 (CCM)
2.05
-5.5
2.2
Lffii»'-<i-*)}\
which accounts for the energy used to make charged speciesapproach a charged surface. For NEM, this electrostatic termis considered to be equal to 1, that is to say that electrostaticinteractions are assumed to be negligible, with Vbeing equal to0.How this electrostatic term is explained makes the différencebetween CCM and DLM.
In the constant capacitance model, * and the surface chargedensity (a) are linked by the équation
o- = C • *, [5]
with C the surface capacitance. In this work, the value of C isanempirical one, chosen as being equal to 1.2 F m-2 for ail thecalculations.
In the diffuse-layer model, this expression becomes
r- zFtya =0.117v/7sinh^—,RT
with / the ionic strength, and ; the ion charge.
[6]
EXPERIMENTS AND MODELING RESULTS
Solid Phase
The surface characteristics àf the magnetite and the silica usedin this study (including mass action law (MAL) data, extractedby fitting titration and sorption experiments using the Fiteql 2.0code (9)) hâve been determined in previous works (5, 10) andare reported in Table 1.
Solutions
The silicate solution is obtained by partially dissolving theibove-described silicain NaOH (0.01 mol L-1). Silicais stirrednthe basic solution for 3days and then filtered through a Milli-Dore cell (0.45 /im). The amount of total silicates in solution isneasured by ICP-AES. The concentration of the master solution
is equal to 1.12 ÎO"2 mol L"1. The acidity constants ofthe silicates used for the calculations come from the Mineql database(11). They are defined as follows:
H4Si04 ^H3Si07 + H+, log K= -9.86 [7]
H4Si04 ,* H2Si02" + 2H+, log K= -22.96. [8]
The acid, base, and sodium nitrate solutions are made fromHN03, NaOH, and NaN03, respectively (Merck). The Cs(I)master solution is made from a 99.99% pure Aldrich césiumnitrate.
Sorption of Cations
Each sorption curve is the resuit of some 20 batch experiments with mixed solid and solution. Three différent kinds ofsorption experiments are performed. In the first one (El), fromwhich binding constants ofsilicates on magnetite are extracted,300 mg ofmagnetite is added to asolution composed ofsilicates(1.12 x 10⁻⁴ mol L"1), NaNOj (0.01 x mol L"1), and différent volumes of acid (HN03, 10~2 mol L"1) or base (NaOH,10"- mol L"1) are added to each suspension make to the pHedge go from 4 to 8. According to the Mineql database, the solubility limit of silicates is equal. to 2.88 10-4 mol L"1 in acidicconditions. Ablank experiment has been performed tocheck theabsence ofsilicates' précipitation under the expérimental condition used. Aflow ofnitrogen was made ineach suspension beforeclosing the batches hermetically. The total volume of solutionwas equal to 50 cm3. After stirring, the pH was recorded andsolutions were filtered through a Millipore cell (0.45 /zm), andthe total concentration ofremaining silicates was determined byICP-AES. Experiments with increasing oxide-solution contacttimes for the same sorption curve were performed and used totest the quality of the sorption equilibrium. When expérimental curves are superimposed for two différent contact times, anequilibrium is supposed to be reached. Sorption curves are thesame after 7days ofstirring; thus the 7-day stirring time iskept.The resulting sorption curve is presented in Fig. 1.
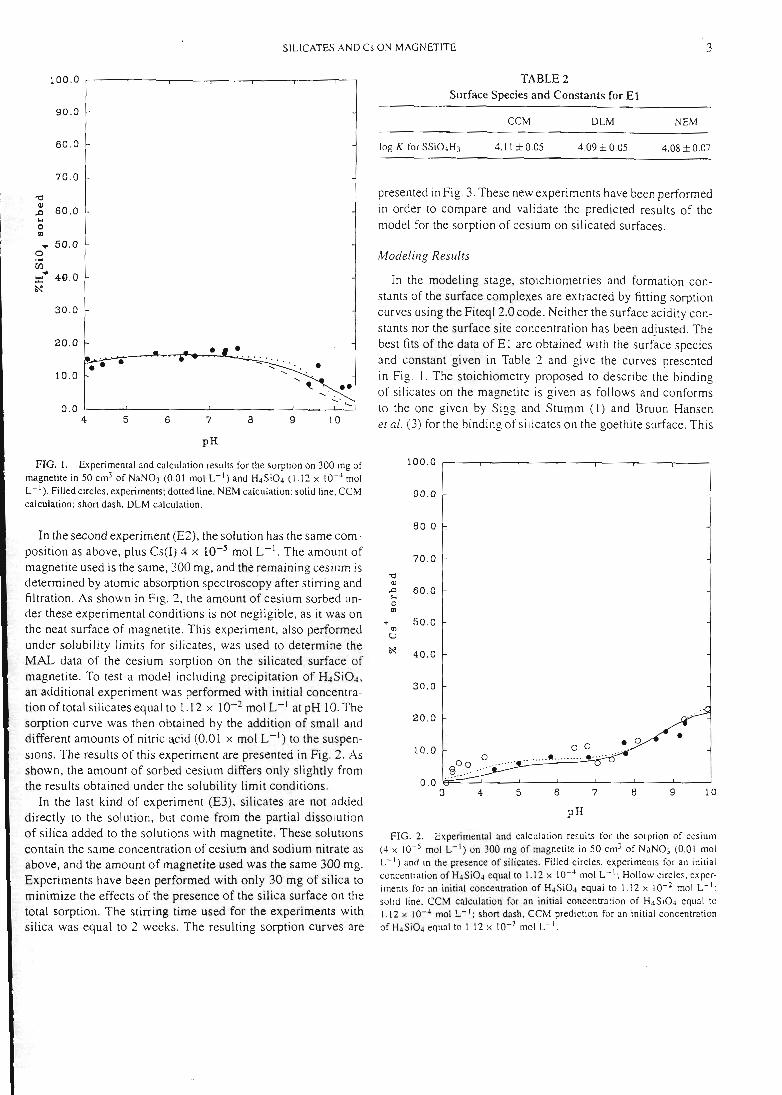
SILICATES AND Cs ON MAGNETITE
100.0
90.0
FIG. I. Expérimental and calculation results for the sorption on 300 mg ofmagnetite in 50 cm3 of NaN03 (0.01 mol L"1) and H4Si04 (1.12 x 10"4 molL ). Filled circles, experiments; dotted line, NEM calculation; solid line CCMcalculation;shortdash, DLMcalculation.
In the second experiment (E2), the solution has the same composition as above, plus Cs(I) 4 x 10""5 mol L""1. The amount ofmagnetite used is the same, 300 mg, and the remaining césium isdetermined by atomic absorption spectroscopy after stirring andfiltration. As shown in Fig. 2, the amount ofcésium sorbed under thèse expérimental conditions is not negligible, as itwas onthe neat surface of magnetite. This experiment, also performedunder solubility limits for silicates, was used to détermine theMAL data of the césium sorption on the silicated surface ofmagnetite. To test a model including précipitation ofH4Si04,an additional experiment was performed with initial concentration of total silicates equal to 1.12 x 10⁻²molL-' atpH 10. Thesorption curve was then obtained by the addition of small anddifférent amounts of nitric a.cid (0.01 x mol L"1) to the suspensions. The results ofthis experiment are presented in Fig. 2. Asshown, the amount of sorbed césium differs only slightly fromthe results obtained under the solubility limit conditions.
In the last kind of experiment (E3), silicates are not addeddirectly to the solution, but come from the partial dissolutionof silica added to the solutions with magnetite. Thèse solutionscontain thesame concentration ofcésium and sodium nitrate asabove, and the amount ofmagnetite used was the same 300 mg.Experiments hâve been performed with only 30 mg ofsilica tominimize the effects of the présence of the silica surface on thetotal sorption. The stirring time used for the experiments withsilica was equal to 2 weeks. The resulting sorption curves are
TABLE 2
Surface Species and Constants for El
CCM DLM
log K forSSi04H3 4.11 ±0.05 4.09 ± 0.05
NEM
4.08 ± 0.07
presented in Fig. 3. Thèse new experiments hâve been performedin order to compare and validate the predicted results of themodel for the sorption ofcésium on silicated surfaces.
Modeling Results
In the modeling stage, stoichiometries and formation constants of the surface complexes are extracted by fitting sorptioncurves using the Fiteql 2.0 code. Neither the surface acidity constants nor the surface site concentration has been adjusted Thebest fits of the data of El are obtained with the surface speciesand constant given in Table 2 and give the curves presentedin Fig. 1. The stoichiometry proposed to describe the bindingofsilicates on the magnetite is given as follows and conformsto the one given by Sigg and Stumm (1) and Bruun Hansenet al. (3) for the binding ofsilicates on the goethite surface. This
100.0 i—
90.0
ao.o -
70 0
•aQJ
Xi fin nU
Om
50 nm
U
6^40 0
30.0
20.0
10.0
0.0
PH
FIG. 2. Expérimental and calculation results for the sorption of césium(4 x ÎO"3 mol L"1) on 300 mg of magnetite in 50 cm3 of NaN03 (0.01 molL ) and in the présence ofsilicates. Filled circles, experiments for an initialconcentration of H4Si04 equal to 1.12 x ÎO"4 mol L"1; Hollow circles, experiments for an initial concentration ofH4Si04 equal to 1.12 x 10⁻² mol L"';solid line, CCM calculation for an initial concentration of H4Si04 equal to1.12 x 10-* mol L"1; short dash, CCM prédiction for an initial concentrationof H4Si04 equal to 1.12 x 10⁻² mol L" '.
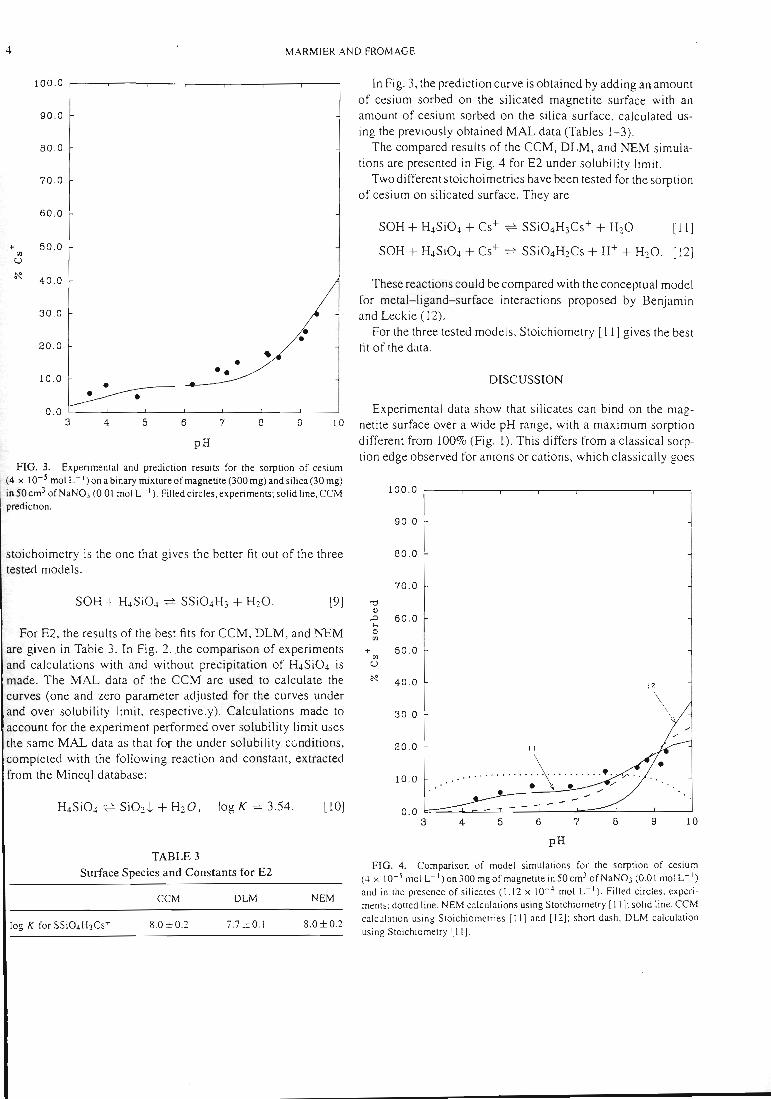
MARMIER AND FROMAGE
PH
FIG. 3. Expérimental and prédiction results for the sorption of césium(4 x 10⁻⁵ mol L-')on abinary mixture ofmagnetite (300 mg) and silica (30 mg)in 50 cm3 ofNaN03 (0.01 mol L"' ). Filled circles, experiments; solid line, CCMprédiction.
stoichoimetry is the one that gives the better fit out of the threetested models.
SOH + H4Si04 ^ SSi04H3 + H20. [91
For E2, the results of the best fits for CCM, DLM, and NEMare given in Table 3. In Fig. 2, the comparison of experimentsand calculations with and without précipitation of H4Si04 ismade. The MAL data of the CCM are used to calculate thecurves (one and zéro parameter adjusted for the curves underand over solubility limit, respectively). Calculations made toaccount for the experiment performed over solubility limit usesthe same MAL data as that for the under solubility conditions,completed with the following reaction and constant, extractedfrom the Mineql database;
H4Si04 ^SiO;| + H2C>, log K = 3.54. [10]
TABLE 3
Surface Species and Constants for E2
CCM DLM
log K for SSi04H3Cs* 8.0±0.2 7.7±0.1
NEM
8.0±0.2
In Fig. 3,the prédiction curve isobtained by adding an amountof césium sorbed on the silicated magnetite surface with anamount of césium sorbed on the silica surface, calculated using the previously obtained MAL data (Tables 1-3).
The compared results of the CCM, DLM, and NEM simulations arepresented inFig. 4 for E2 under solubility limit.
Two différent stoichoimetries hâve been tested for the sorptionof césium on silicated surface. They are
SOH + H4Si04 + Cs+
SOH -f- H4Si04 + Cs+
SSi04H3Cs++ H,0 [11]
SS104H2Cs + H+ + H,0. [121
Thèse reactions could becompared with theconceptual modelfor metal-ligand-surface interactions proposed by Benjaminand Leckie (12).
For the three tested models, Stoichiometry [11] gives thebestfit of the data.
DISCUSSION
Expérimental data show that silicates can bind on the magnetite surface over a wide pH range, with a maximum sorptiondifférent from 100% (Fig. 1). This differs from aclassical sorption edge observed foranions or cations, which classically goes
CJ
^5
100
PH
FIG. 4. Comparison of model simulations for the sorption of césium(4 x 10⁻⁵ mol L~')on 300 mgofmagnetite in50cm3 ofNaN03(0.01 molL"1)and in the présence of silicates (1.12 x 10~4 mol L"'). Filled circles, experiments; dotted line. NEM calculations using Stoichiometry [11]; solid line, CCMcalculation using Stoichiometries [11] and [12]; short dash, DLM calculationusing Stoichiometry [11].
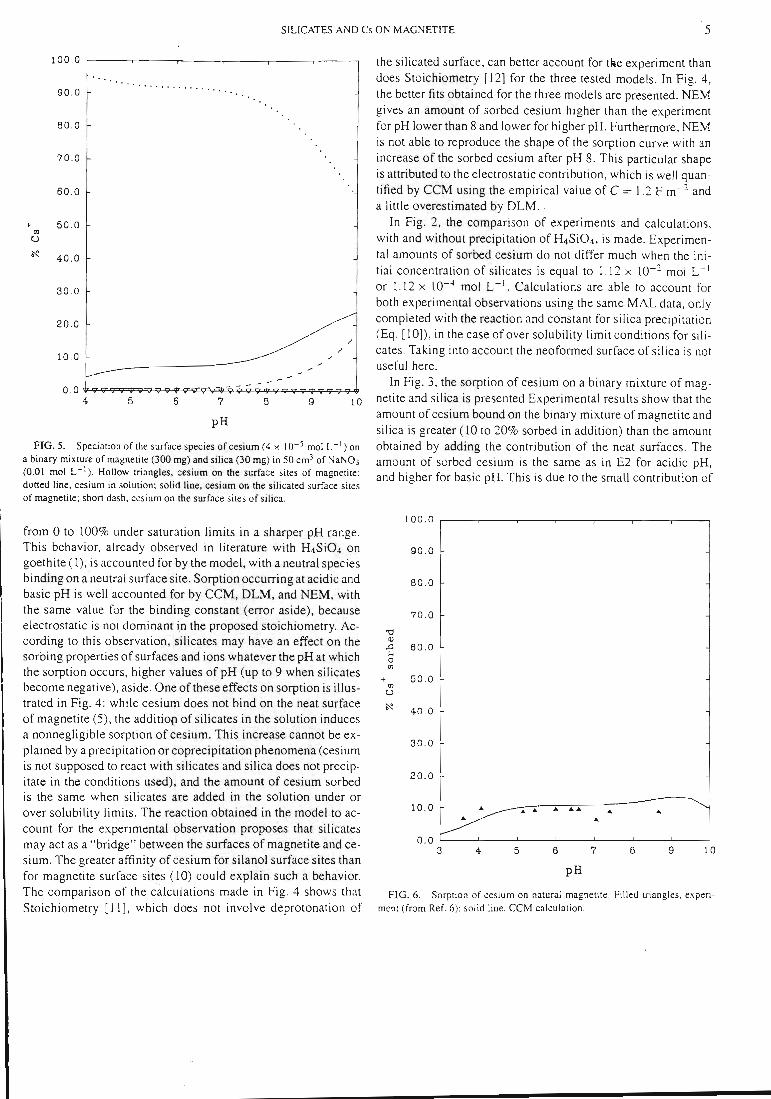
SILICATES AND Cs ON MAGNETITE
100.0
c_>
FIG. 5. Spéciation ofthe surface species ofcésium (4 x 10"5 mol L-1) onabinary mixture ofmagnetite (300 mg) and silica (30 mg) in 50 cm3 ofNaN03(0.01 mol L"'). Hollow triangles, césium on the surface sites ofmagnetite;dotted Une, césium in solution; solid line, césium on thesilicated surface sitesof magnetite; short dash, césium on the surface sites of silica.
from 0 to 100% under saturation limits in a sharper pH range.This behavior, already observed in literature with H4Si04 ongoethite (1), isaccounted for by the model, with a neutral speciesbinding onaneutral surface site. Sorption occurring atacidic andbasic pH is well accounted for by CCM, DLM, and NEM, withthe same value for the binding constant (error aside), becauseelectrostatic isnot dominant in the proposed stoichiometry. According to this observation, silicates may hâve an effecton thesorbing properties ofsurfaces and ions whatever the pHatwhichthe sorption occurs, higher values of pH (up to 9 when silicatesbecome négative), aside. One ofthèse effects onsorption isillus-trated in Fig. 4: while césium does not bind on the neat surfaceof magnetite (5), the addition of silicates in the solution inducesa nonnegligible sorption of césium. This increase cannot be explained byaprécipitation orcoprecipitation phenomena (césiumis not supposed to react with silicates and silica does not precip-itate in the conditions used), and the amount of césium sorbedis the same when silicates are added in the solution under orover solubility limits. The reaction obtained in the model to account for the expérimental observation proposes that silicatesmay act as a "bridge" between the surfaces of magnetite and césium. The greater affinity of césium for silanol surface sites thanfor magnetite surface sites (10) could explain such a behavior.The comparison of the calculations made in Fig. 4 shows thatStoichiometry [11], which does not involve deprotonation of
the silicated surface, can better account for the experiment thandoes Stoichiometry [12] for the three tested models. In Fig. 4,the better fits obtained for the three models are presented. NEMgives an amount ofsorbed césium higher than the experimentfor pH lower than 8and lower for higher pH. Furthermore, NEMis not able to reproduce the shape of the sorption curve with anincrease ofthe sorbed césium after pH 8. This particular shapeis attributed to the electrostatic contribution, which is well quan-tified by CCM using the empirical value of C = 1.2F m-2 anda littleoverestimated by DLM.
In Fig. 2, the comparison of experiments and calculations,with and without précipitation ofH4Si04, is made. Expérimental amounts of sorbedcésiumdo not differ much when the initial concentration of silicates is equal to 1.12 x 10"2 mol L"'or 1.12 x 10~4 mol L-1. Calculations are able to account forboth expérimental observations using the same MAL data, onlycompleted with the reaction and constant for silica précipitation(Eq. [10]), in thecaseofoversolubility limit conditions for silicates. Taking into account the neoformedsurfaceof silica is notuseful hère.
In Fig. 3, the sorption ofcésium on a binary mixture ofmagnetiteand silica is presented Expérimental results show that theamount ofcésium bound on the binary mixture ofmagnetite andsilica is greater (10to 20% sorbed in addition) than theamountobtained by adding the contribution of the neat surfaces. Theamount of sorbed césium is the same as in E2 for acidic pH,and higher for basic pH. This is due to the small contribution of
Xiuo
o
^
100
90.0
PH
FIG. 6. Sorption of césium on natural magnetite. Filled triangles, experiment (from Réf. 6); solid line, CCM calculation.
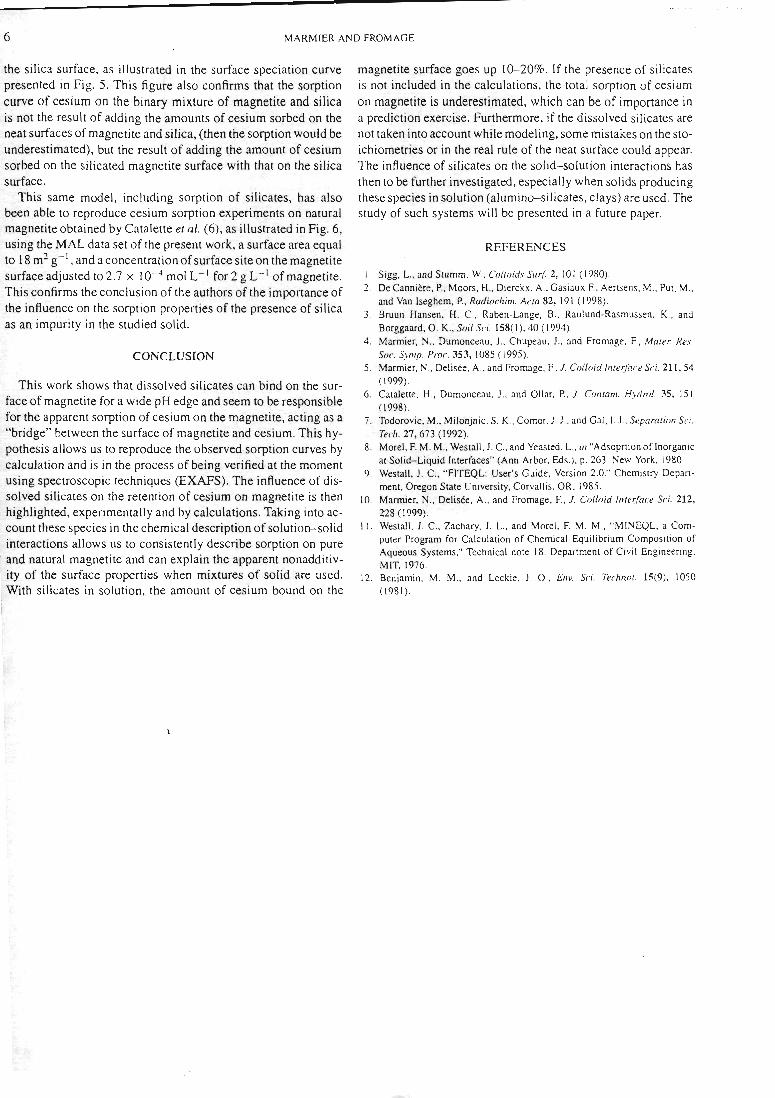
MARMIER AND FROMAGE
the s.l.ca surface, as illustrated in the surface spéciation curvepresented in Fig. 5. This figure also confions that the sorptioncurve of césium on the binary mixture of magnetite and silica.s not the resuit ofadding the amounts ofcésium sorbed on theneat surfaces of magnetite and silica, (then the sorption would beunderestimated), but the resuit ofadding the amount ofcésiumsorbed on the silicated magnetite surface with that on the silicasurface.
This same model, including sorption of silicates, has alsobeen able to reproduce césium sorption experiments on naturalmagnetite obtained by Catalette et al. (6), as illustrated in Fig 6using the MAL data set of the présent work, asurface area equalto 18 m- g ,and aconcentration ofsurface site on the magnetitesurface adjusted to 2.7 x 10⁻⁴molL-' for2gL-' of magnetite.This confions the conclusion of the authors of the importance ofthe influence on the sorption properties of the présence of silicaas an impurity in the studied solid.
CONCLUSION
This work shows that dissolved silicates can bind on the surface of magnetite for awide pH edge and seem to be responsiblefor the apparent sorption of césium on the magnetite, acting as a"bridge" between the surface of magnetite and césium. This hypothesis allows us to reproduce the observed sorption curves bycalculation and is in the process ofbeing verified at the momentusing spectroscopie techniques (EXAFS). The influence of dissolved silicates on the rétention of césium on magnetite is thenhighlighted, experimentally and by calculations. Taking into account thèse species in the chemical description ofsolution-solidinteractions allows us to consistently describe sorption on pureand natural magnetite and can explain the apparent nonadditiv-îty of the surface properties when mixtures of solid are usedWith silicates in solution, the amount ofcésium bound on the
magnetite surface goes up 10-20%. If the présence ofsilicatesis not mcluded in the calculations, the total sorption ofcésiumon magnetite is underestimated, which can be of importance ina prédiction exercise. Furthermore, if the dissolved silicates arenot taken into account while modeling, some mistakes on the stoichiometries or in the real rule of the neat surface could appear.The influence ofsilicates on the solid-solution interactions hasthen to be further investigated, especially when solids producingthèse species in solution (alumino-silicates, clays) are used Thestudy of such Systems will be presented in afuture paper.
REFERENCES
I Sigg, L., and Stumm, W., Colloids Surf 2, 101 (1980).2. De Cannière, P., Moors, H., Dierckx, A., Gasiaux F, Aertsens, M., Put M
and Van Iseghem, P., Radiochim. Acta 82, 191 (1998).3. Bruun Hansen, H. C, Raben-Lange, B„ Raulund-Rasmussen, K and
Borggaard, O. K., Soil Sci. 158(1), 40 (1994).4. Marmier, N., Dumonceau, J., Chupeau, J., and Fromage, F, Mater. Res
Soc. Symp. Proc. 353, 1085 (1995).5. Marmier, N., Delisée, A., and Fromage, F, J. Colloid Interface Sci 211 54
(1999). '
6. Catalette, H., Dumonceau, 1., and Ollar, R, J. Contam. Hvdrol 35 151(1998). " '
7. Todorovic, M., Milonjnic, S. K., Comor, J. J., and Gai, 1. J., Séparation SciTech. 27,673(1992).
8. Morel, FM. M., Westall, j. C, and Yeasted. L„ m"Adsoprtion of Inorganicat Solid-Liquid Interfaces" (Ann Arbor, Eds.), p. 263 New York 1980
9. Westall, j. C, "FITEQL: User's Guide, Version 2.0." Chemistry Department, Oregon State University, Corvallis, OR, 1985.Marmier, N., Delisée, A., and Fromage, F,/ Colloid Interface Sci 212228 (1999),
Westall, J. C, Zachary, J. L.. and Morel, F. M. M., "MINEQL a Computer Program for Calculation ofChemical Equilibrium Composition ofAqueous Systems," Technical note 18. Department ofCivil EngineeringMIT, 1976.
Benjamin, M. M., and Leckie, 1. O., Env. Sci. Technol. 15(9) 1050(1981).
10
M
12

ARTICLE N°ll
Migration' 99 Journal of Contaminant Hydrology.
INFLUENCE OF DISSOLVED SILICATES ON THE SORPTION OF CATIONS.
Nicolas Marmier* , Annie Delisée and Francine Fromage
University of REIMS, Faculté des Sciences, GRECI, BP 1039, 51687 REIMS CEDEX 2, France.
*corresponding author, tel and fax: (33) 326-91-33-30, E-mail: nicolas.marmier@univ-
reims.fr
Keywords : dissolved silicates, ytterbium, césium, sorption, alumina, silica
ABSTRACT
Dissolved silicates are one of the common and major species found in natural waters, coming
from the dissolution of silicated solid phases. As silicates can be sorbed by surfaces, their
présence in solution could influence the sorbing properties ofthèse surfaces.
In this work, the sorption ofsilicates on two single oxide surfaces, magnetite and alumina, and
its influence on the sorbing properties of the surfaces, is pointed out and quantified.
One mechanistic interprétation and one complexation modeling are proposed to account for
the experiment observations, which show that sorption of cations can decrease either than
increase when dissolved silicates are présents in solution, coming from the partial dissolution
of silica.
INTRODUCTION
The surface complexation models are now widely used to describe the sorbing
properties of natural complex Systems. Two différent approaches can be used to perform such
a modeling. In the first one, called the gênerai composite approach, the complex minerai
assemblages are considered as new materials, with their own surface properties. The second
one, the multi-components additivity approach, tries to identify the major components
responsible of the observed sorption. The surface properties of thèse major components are
known, and the observed total sorption is considered as being equal to the sum of the
respective contributions of the major components.
The aim of this work is first to test the component additivity for the more simple of the
complex Systems, asingle oxides binary mixture, with only one sorbing cation. Four différent
oxide surfaces are used for the experiments. Thèse oxides are hématite, magnetite, alumina
and silica. They are ail synthetic, and characterized in previous works. The three first are
considered as being insoluble in the pH range ofthe experiments (4 to 8). The last one, silica,
provides dissolved silicates in solution. According to the solubility of silica, the amount of
dissolved silicates is constant in the studied pH range. As a conséquence, mixtures involving
silica are a little more complex than those without silica, because of the présence in the
suspensions of this additional specie. The second aim of this work is to quantify and qualify
the influence of the dissolved silicates (one of the major species found in the natural waters,
coming from the dissolution of silicated solid phases), on the sorbing properties of oxide
surfaces. As silicates can be sorbed by surfaces, their présence in solution could influence the
sorbing properties ofthèse surfaces ( De Cannière et al 1998, Bruum Hansen et al 1994).
Two différent cations hâve been chosen for this study, césium and ytterbium. The first
of them isconsidered as a mobile ion, and if affinity for the oxide surfaces is low. The second
one is a trivalent cation, and previous studies hâve shown that it well sorbes one oxides
surfaces. Both of them are not supposed to provide silicated complexes in solution.
EXPERIMENTS and MODEL
Solid Phase.
The surface characteristics ofthe magnetite, hématite, alumina and the silica used in this
study, (including Mass Action Law, (MAL), data, extracted by fitting titration and sorption
experiments using the Fiteql 2.0 code (Westall 1985)), hâve been determined in previous
works (Marmier et al 1999a and 1999b), and are reported in table 1.
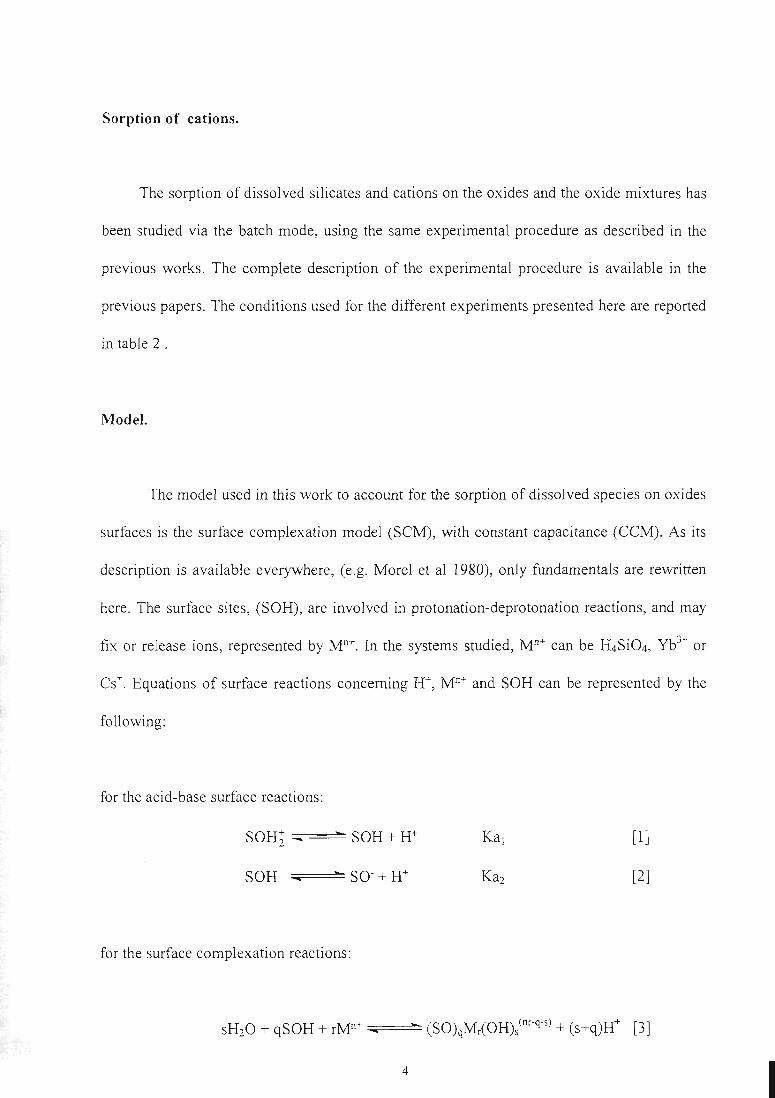
Sorption of cations.
The sorption of dissolved silicates and cations on the oxides and the oxide mixtures has
been studied via the batch mode, using the same expérimental procédure as described in the
previous works. The complète description of the expérimental procédure is available in the
previous papers. The conditions used for the différent experiments presented hère are reported
in table 2 .
Model.
The model used in this work to account for the sorption of dissolved species on oxides
surfaces is the surface complexation model (SCM), with constant capacitance (CCM). As its
description is available everywhere, (e.g. Morel et al 1980), only fundamentals are rewritten
hère. The surface sites, (SOH), are involved in protonation-deprotonation reactions, and may
fix or release ions, represented by Mn+. In the Systems studied, Mn+ can be H4Si04, YbJ~ or
Cs+. Equations of surface reactions conceming H+, Mn+ and SOH can be represented by the
following:
for the acid-base surface reactions:
SOH2 ^f=^ SOH + H+ Ka, [1]
SOH - SO" + H+ Ka2 [2]
for the surface complexation reactions:
sH20 + qSOH + rMn+ ^ (SO)qMr(OH)s(nr-q"s) +(s+q)H+ [3]
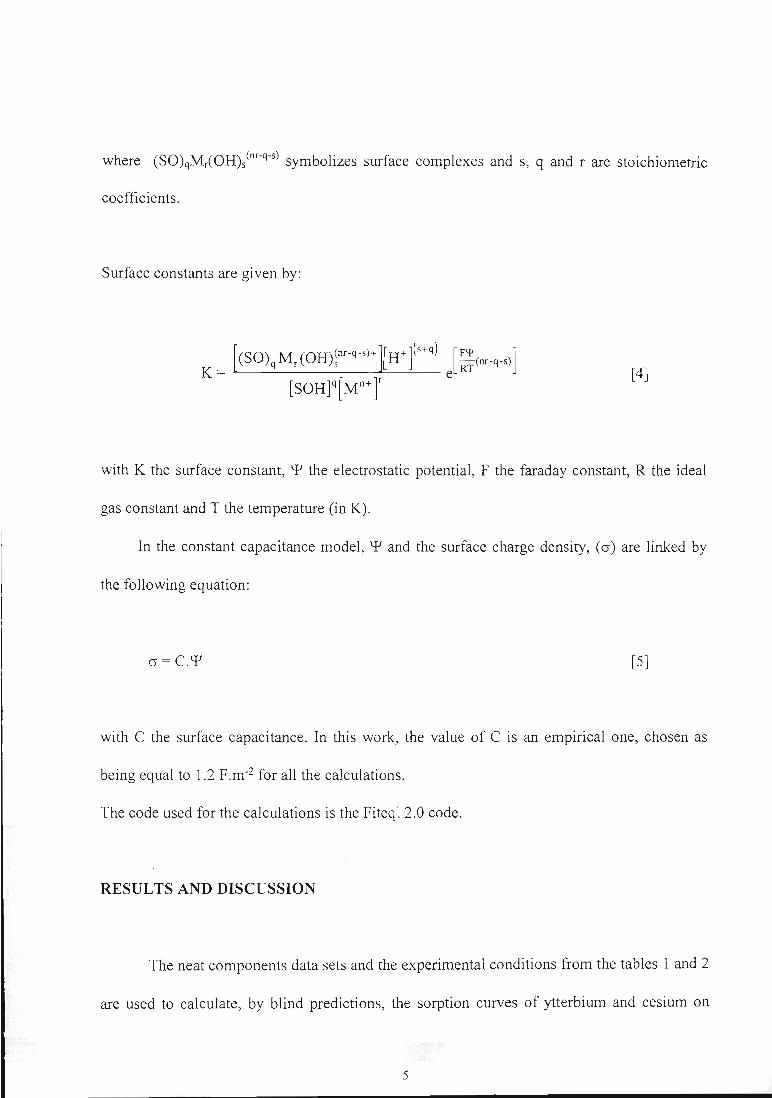
where (SO)qMr(OH)s(nr"q_s) symbolizes surface complexes and s, q and r are stoichiometric
coefficients.
Surface constants are given by:
K(SO)<,Mr(OH)fr-q-s)+][H+](s+q
[SOH]q[Mn+]r
F4".
RT(nr-q-s)
e- [4]
with K the surface constant, HP the electrostatic potential, F the faraday constant, R the idéal
gas constant and T the température (in K).
In the constant capacitance model, HP and the surface charge density, (a) are linked by
the following équation:
g = CHP [5]
with C the surface capacitance. In this work, the value of C is an empirical one, chosen as
being equal to 1.2 F.m*2 for ail the calculations.
The code used for the calculations is the Fiteql 2.0 code.
RESULTS AND DISCUSSION
The neat components data sets and the expérimental conditions from the tables 1 and 2
are used to calculate, by blind prédictions, the sorption curves of ytterbium and césium on
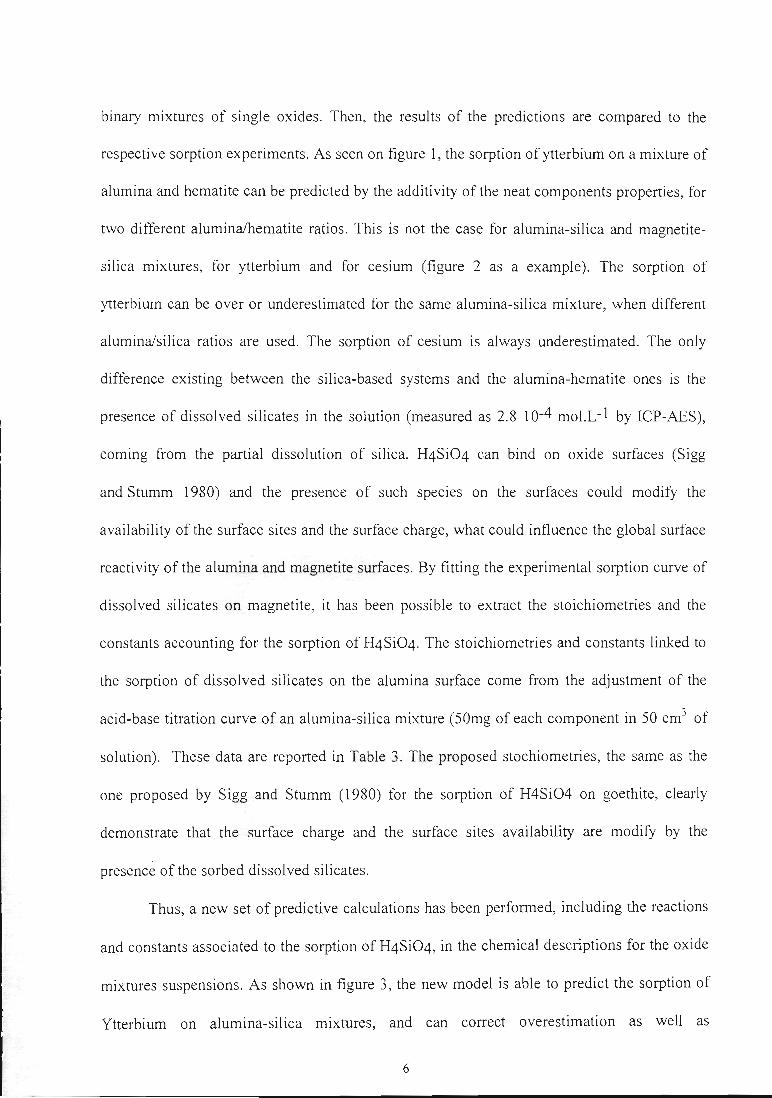
binary mixtures of single oxides. Then, the results of the prédictions are compared to the
respective sorption experiments. As seen on figure 1, the sorption of ytterbium on a mixture of
alumina and hématite can be predicted by the additivity of the neat components properties, for
two différent alumina/hematite ratios. This is not the case for alumina-silica and magnetite-
silica mixtures, for ytterbium and for césium (figure 2 as a example). The sorption of
ytterbium can be over or underestimated for the same alumina-silica mixture, when différent
alumina/silica ratios are used. The sorption of césium is always underestimated. The only
différence existing between the silica-based Systems and the alumina-hematite ones is the
présence of dissolved silicates in the solution (measured as 2.8 10~4 mol.L-1 by ICP-AES),
coming from the partial dissolution of silica. H4Si04 can bind on oxide surfaces (Sigg
and Stumm 1980) and the présence of such species on the surfaces could modify the
availability of the surface sites and the surface charge, what could influence the global surface
reactivity of the alumina and magnetite surfaces. By fitting the expérimental sorption curve of
dissolved silicates on magnetite, it has been possible to extract the stoichiometries and the
constants accounting for the sorption of H4Si04. The stoichiometries and constants linked to
the sorption of dissolved silicates on the alumina surface come from the adjustment of the
acid-base titration curve of an alumina-silica mixture (50mg of each component in 50 cmJ of
solution). Thèse data are reported in Table 3. The proposed stochiometries, the same as the
one proposed by Sigg and Stumm (1980) for the sorption of H4Si04 on goethite, clearly
demonstrate that the surface charge and the surface sites availability are modify by the
présence of the sorbed dissolved silicates.
Thus, a new set of prédictive calculations has been performed, including the reactions
and constants associated to the sorption ofH4Si04, in the chemical descriptions for the oxide
mixtures suspensions. As shown in figure 3, the new model is able to predict the sorption of
Ytterbium on alumina-silica mixtures, and can correct overestimation as well as
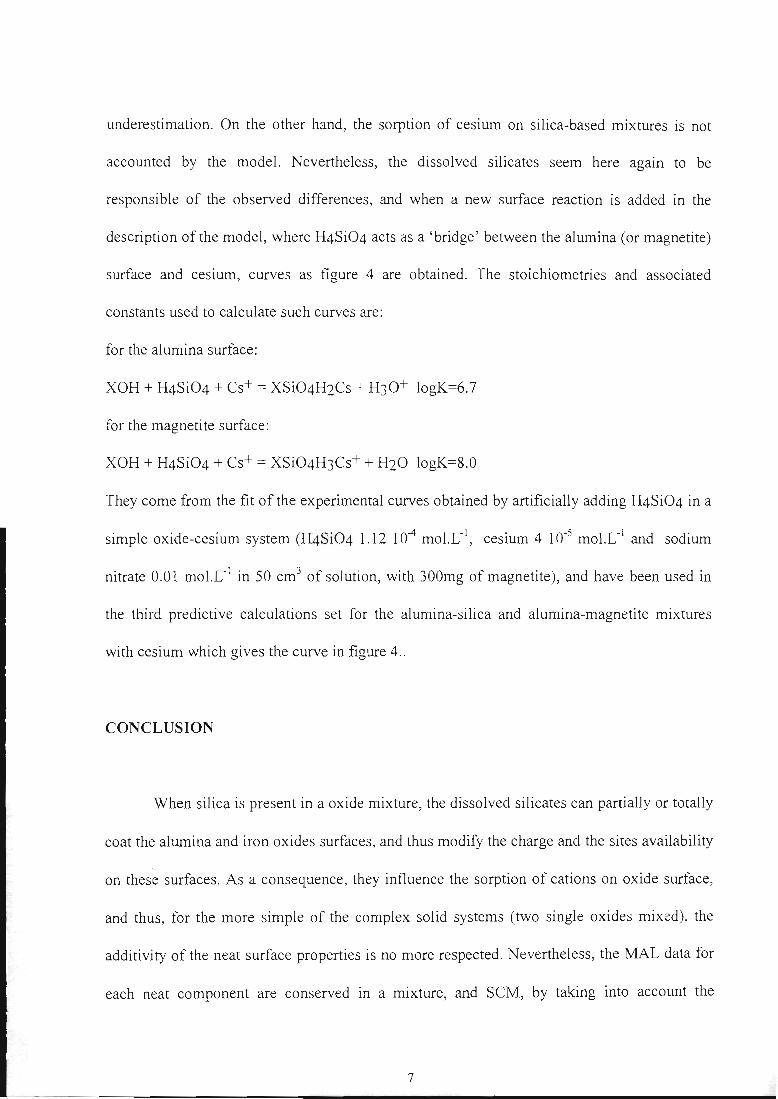
underestimation. On the other hand, the sorption of césium on silica-based mixtures is not
accounted by the model. Nevertheless, the dissolved silicates seem hère again to be
responsible of the observed différences, and when a new surface reaction is added in the
description of the model, where H4Si04 acts as a 'bridge' between the alumina (or magnetite)
surface and césium, curves as figure 4 are obtained. The stoichiometries and associated
constants used to calculate such curves are:
for the alumina surface:
XOH + H4Si04 + Cs+ = XSi04H2Cs + H3O4" logK=6.7
for the magnetite surface:
XOH + H4Si04 + Cs+ » XSi04H3Cs+ + H2O logK=8.0
They come from the fit of the expérimental curves obtained by artificially adding H4Si04 in a
simple oxide-cesium system (H4Si04 1.12 10"4 mol.L"1, césium 4 10° mol.L"1 and sodium
nitrate 0.01 mol.L"1 in 50 cm3 of solution, with 300mg of magnetite), and hâve been used in
the third prédictive calculations set for the alumina-silica and alumina-magnetite mixtures
with césium which gives the curve in figure 4..
CONCLUSION
When silica is présent in a oxide mixture, the dissolved silicates can partially or totally
coat the alumina and iron oxides surfaces, and thus modify the charge and the sites availability
on thèse surfaces. As a conséquence, they influence the sorption of cations on oxide surface,
and thus, for the more simple of the complex solid Systems (two single oxides mixed), the
additivity ofthe neat surface properties is no more respected. Nevertheless, the MAL data for
each neat component are conserved in a mixture, and SCM, by taking into account the
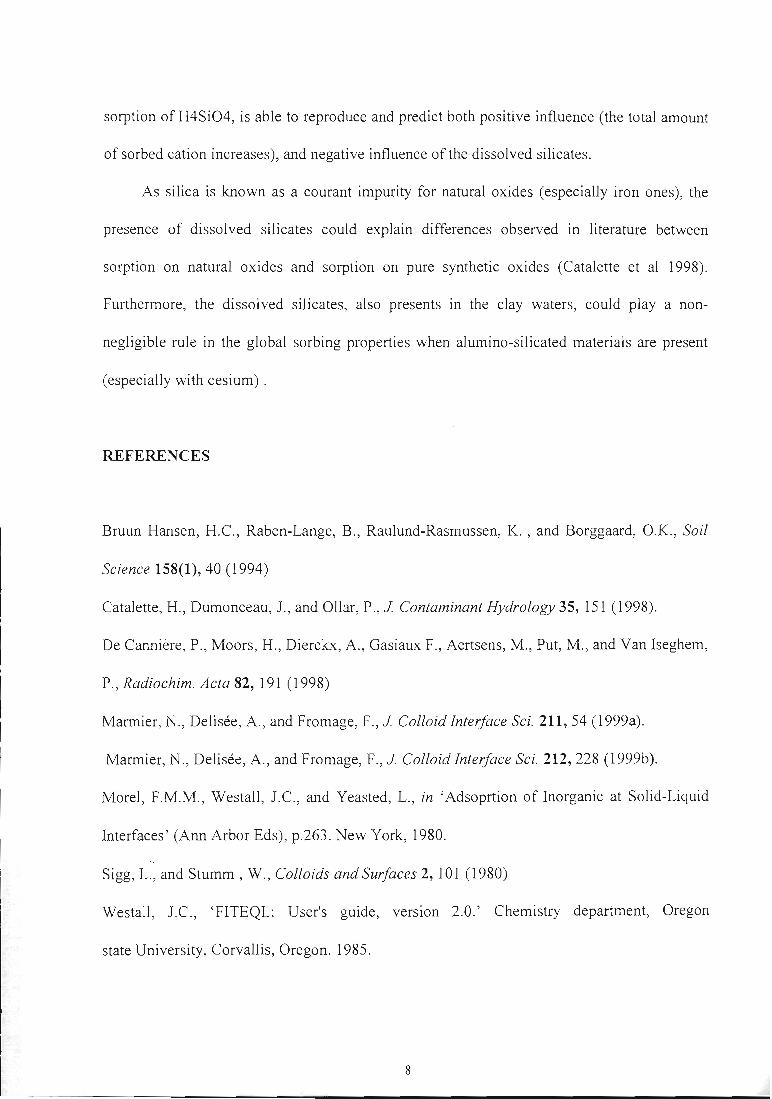
sorption of H4Si04, is able to reproduce and predict both positive influence (the total amount
of sorbed cation increases), and négative influence of the dissolved silicates.
As silica is known as a courant impurity for natural oxides (especially iron ones), the
présence of dissolved silicates could explain différences observed in literature between
sorption on natural oxides and sorption on pure synthetic oxides (Catalette et al 1998).
Furthermore, the dissolved silicates, also présents in the clay waters, could play a non
negligible rule in the global sorbing properties when alumino-silicated materials are présent
(especially with césium).
REFERENCES
Bruun Hansen, H.C., Raben-Lange, B., Raulund-Rasmussen, K. , and Borggaard, O.K., Soil
Science 158(1), 40 (1994)
Catalette, H., Dumonceau, J., and Ollar, P., J. Contaminant Hydrology 35, 151 (1998).
De Cannière, P., Moors, H., Dierckx, A., Gasiaux F., Aertsens, M., Put, M., and Van Iseghem,
P., Radiochim. Acta 82, 191 (1998)
Marmier, N., Delisée, A., and Fromage, F.,J. Colloid Interface Sci. 211, 54 (1999a).
Marmier, N., Delisée, A., and Fromage, F., J. Colloid Interface Sci. 212, 228 (1999b).
Morel, F.M.M., Westall, J.C, and Yeasted, L., in 'Adsoprtion of Inorganic at Solid-Liquid
Interfaces' (Ann Arbor Eds), p.263. New York, 1980.
Sigg, L., and Stumm , W., Colloids and Surfaces 2, 101 (1980)
Westall, J.C, 'FITEQL: User's guide, version 2.O.' Chemistry department, Oregon
state University, Corvallis, Oregon. 1985.
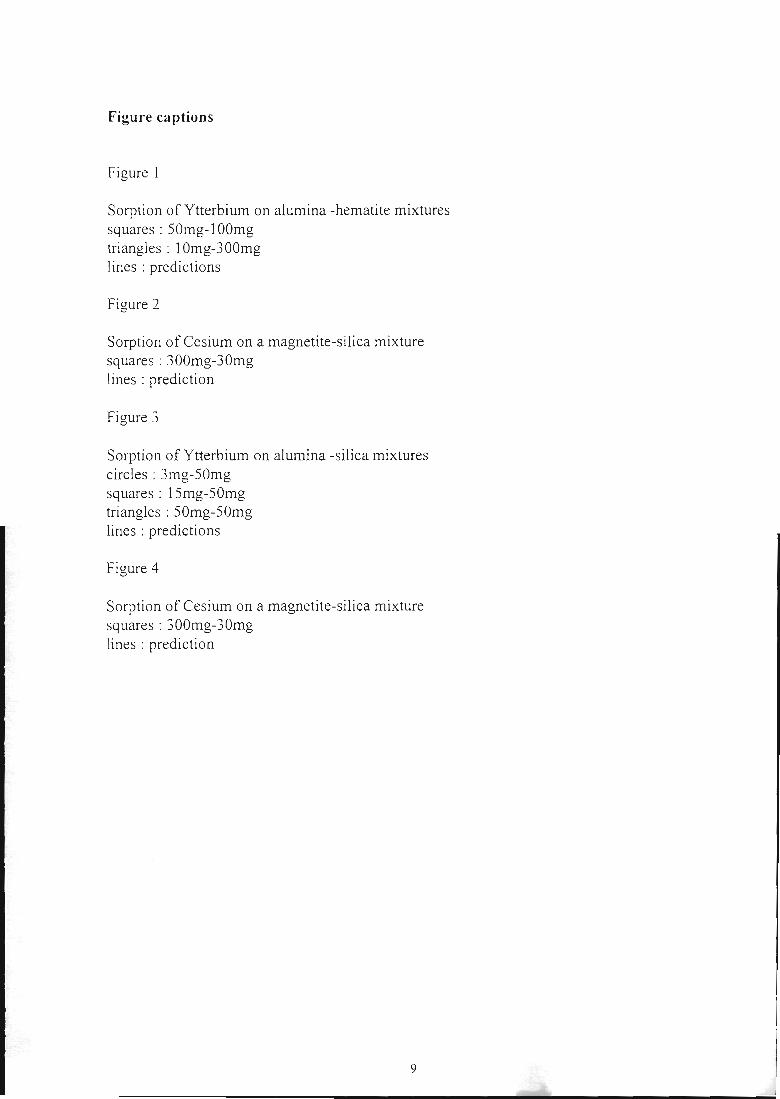
Figure captions
Figure 1
Sorption of Ytterbium on alumina -hématite mixturessquares : 50mg-100mgtriangles : 10mg-300mgUnes : prédictions
Figure 2
Sorption of Césium on a magnetite-silica mixturesquares : 300mg-30mglines : prédiction
Figure 3
Sorption of Ytterbium on alumina -silica mixturescircles : 3mg-50mgsquares : 15mg-50mgtriangles : 50mg-50mglines : prédictions
Figure 4
Sorption of Césium on a magnetite-silica mixturesquares : 300mg-30mglines : prédiction
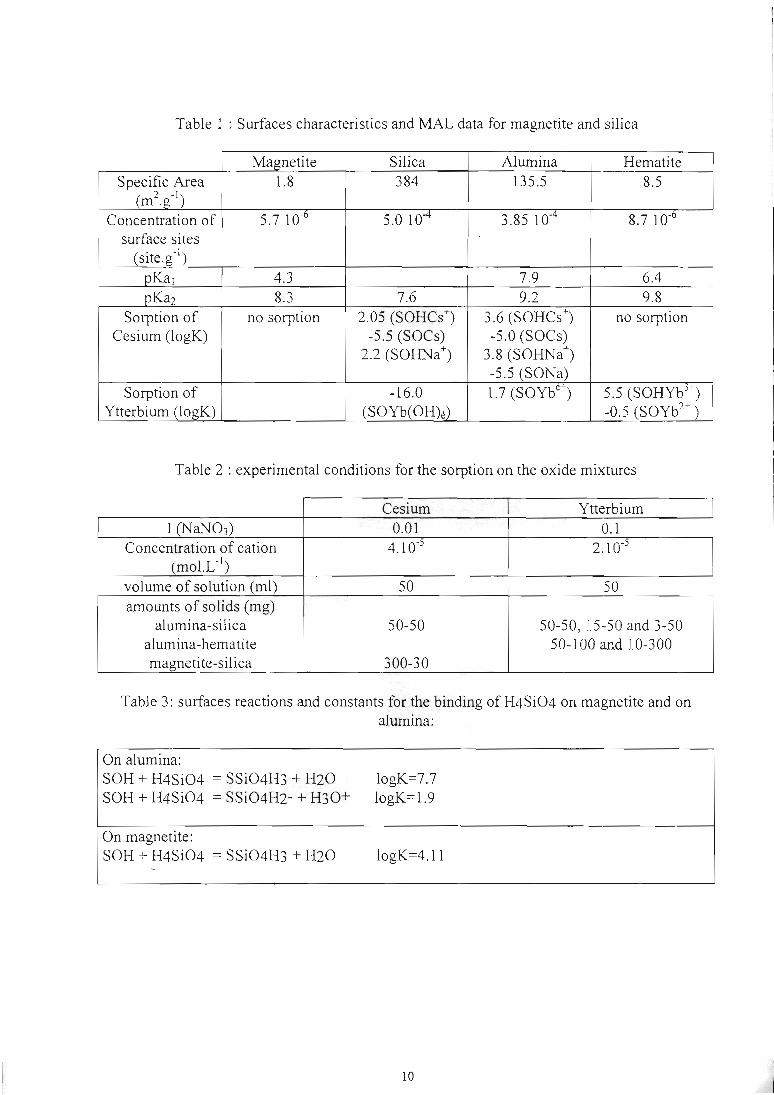
Table 1 : Surfaces characteristics and MAL data for magnetite and silica
Magnetite Silica Alumina Hématite
Spécifie Area(mV)
1.8 384 135.5 8.5
Concentration of
surface sites
(site.g"1)
5.7 10"6 5.0 10"4 3.85 10"4 8.7 10"6
pKai 4.3 7.9 6.4
pKa2 8.3 7.6 9.2 9.8
Sorption ofCésium (logK)
no sorption 2.05 (SOHCs+)-5.5 (SOCs)
2.2 (SOHNa+)
3.6 (SOHCs+)-5.0 (SOCs)
3.8 (SOHNa+)-5.5 (SONa)
no sorption
Sorption ofYtterbium (logK)
-16.0
(SOYb(OH)é)1.7(SOYbé+) 5.5 (SOHYb3+)
-0.5 (SOYb2" )
Table 2 : expérimental conditions for the sorption on the oxide mixtures
Césium Ytterbium
I (NaN03) 0.01 0.1
Concentration of cation
(mol.L"1)4.10° 2.10°
volume of solution (ml) 50 50
amounts of solids (mg)alumina-silica
alumina-hematite
magnetite-silica
50-50
300-30
50-50, 15-50 and 3-50
50-100 and 10-300
Table 3: surfaces reactions and constants for the binding of H4Si04 on magnetite and onalumina:
On alumina:
SOH + H4Si04 = SSi04H3 + H20 logK=7.7SOH + H4Si04 = SSi04H2- + H30+ logK=1.9
On magnetite:
SOH + H4Si04 = SSi04H3 + H20 logK=4.11
10
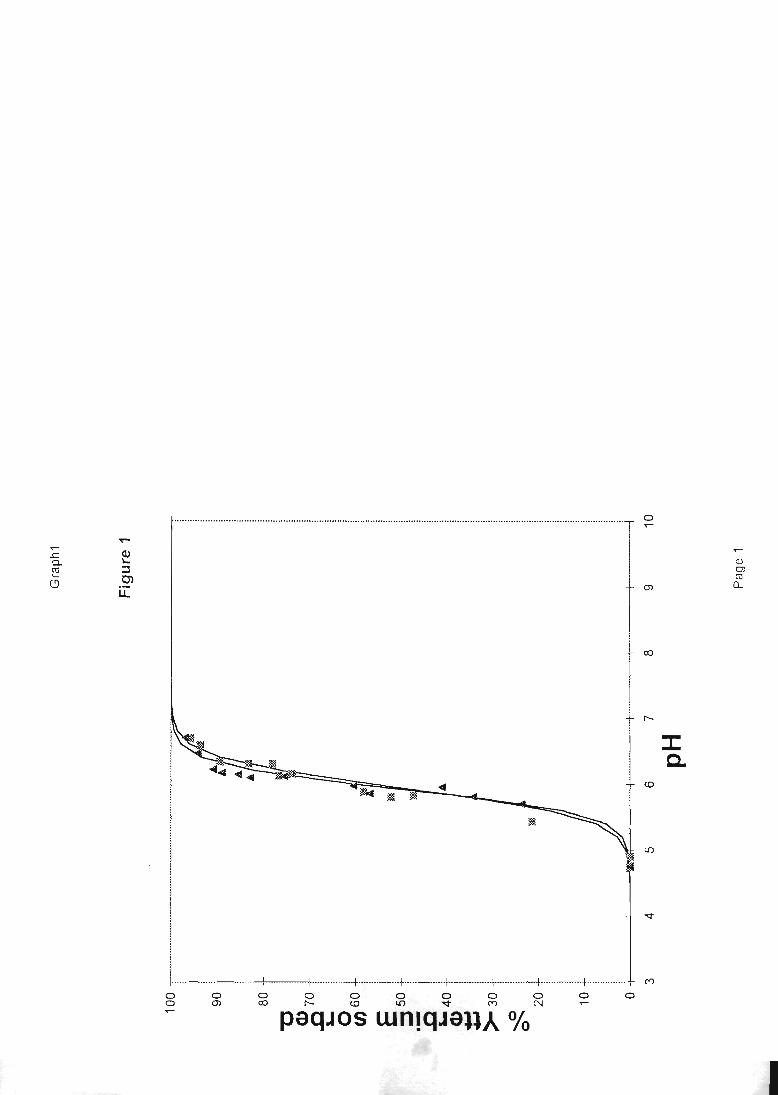
TJ03taCD
en
% Ytterbium sorbedto to -&. tn CT> -si oo CD Oo o o o o o o O O
(QC
CD 3"
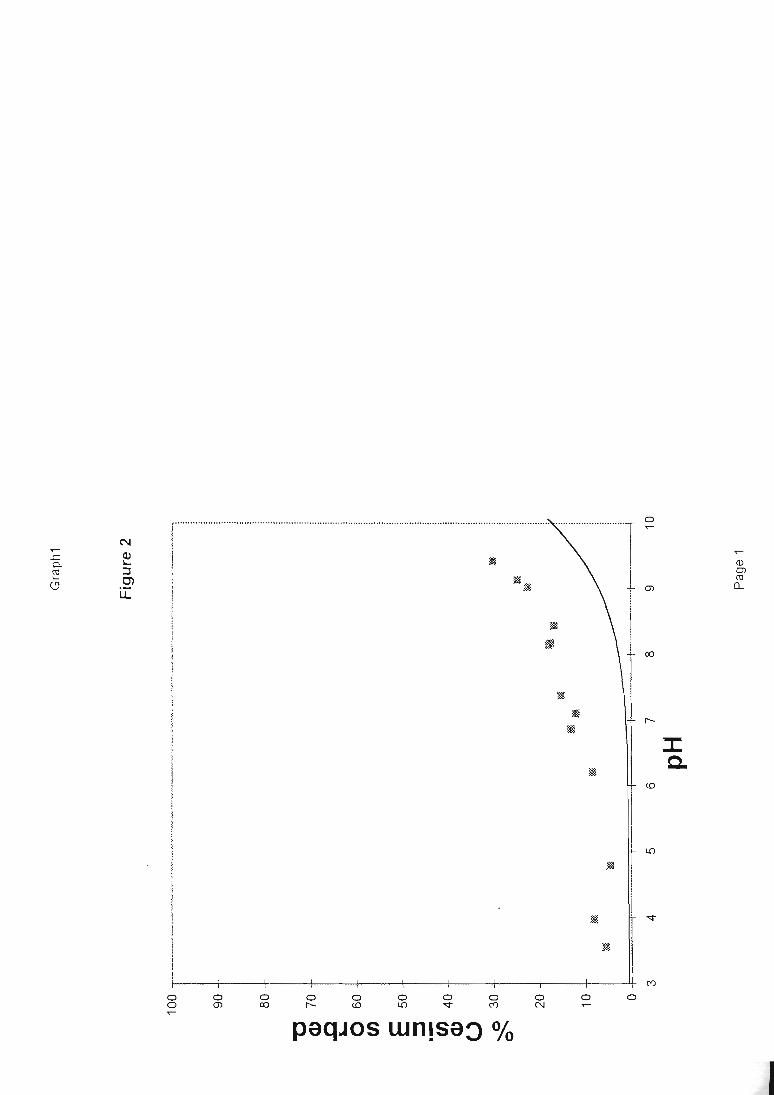
sz.Q.
CD
3ai
Ll
o o o o o o o o oo en 00 t- to lO -* co CM
peqjos uiniseo %
euenca
Q.
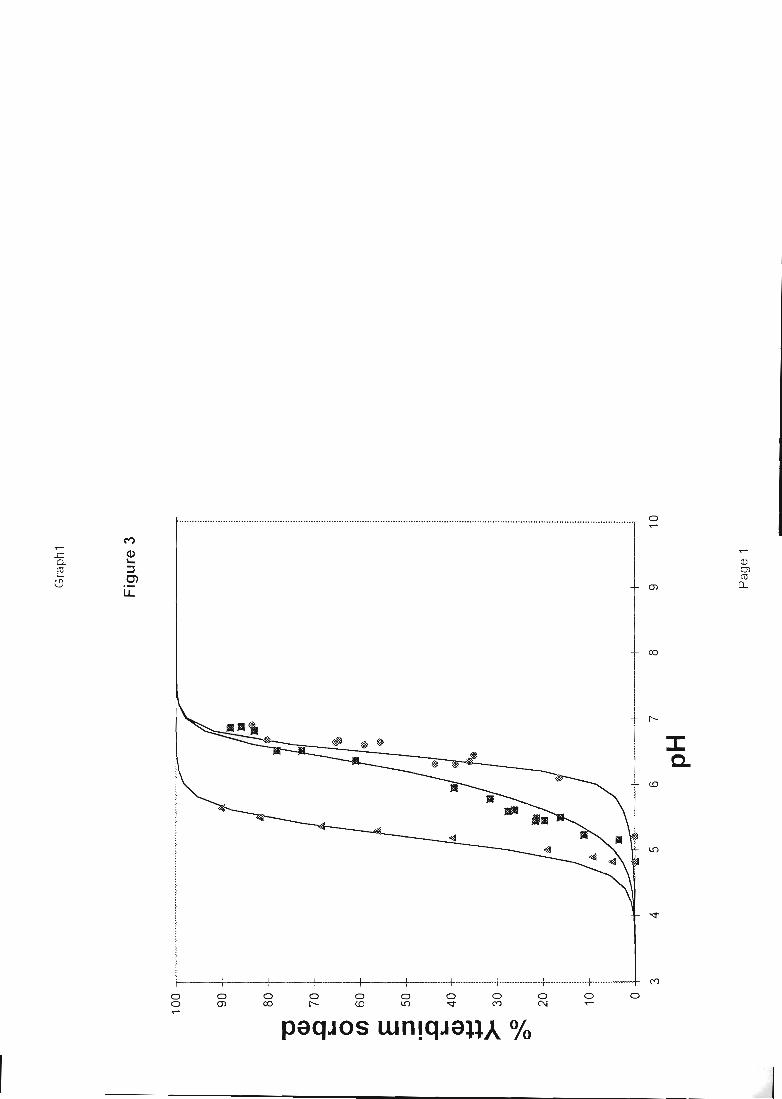
01
CQCD
% Ytterbium sorbed
(QC
w
O)
•o
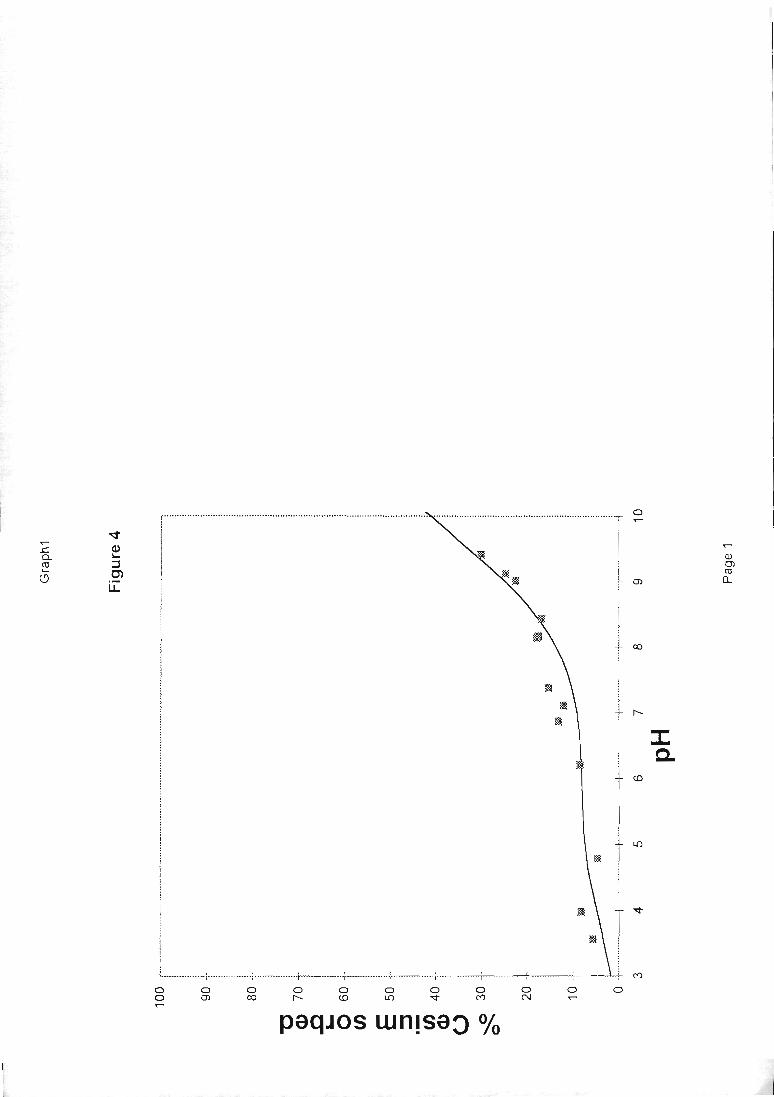
a.CD
Ô3O)
il
o o o o o o o o oo O) oo h» CD en -* co CN
peqjos uamseo %
O)
oo
-- i^
Ia.
CD
— m
CDaien
a.
Related Documents