Climatic Change (2010) 100:703–715 DOI 10.1007/s10584-009-9688-x Modeling to evaluate the response of savanna-derived cropland to warming–drying stress and nitrogen fertilizers Zhengxi Tan · Larry L. Tieszen · Shuguang Liu · Emmanuel Tachie-Obeng Received: 16 June 2008 / Accepted: 27 July 2009 / Published online: 10 October 2009 © Springer Science + Business Media B.V. 2009 Abstract Many savannas in West Africa have been converted to croplands and are among the world’s regions most vulnerable to climate change due to deteriorating soil quality. We focused on the savanna-derived cropland in northern Ghana to sim- ulate its sensitivity to projected climate change and nitrogen fertilization scenarios. Here we show that progressive warming–drying stress over the twenty-first century will enhance soil carbon emissions from all kinds of lands of which the natural ecosys- tems will be more vulnerable to variation in climate variables, particularly in annual precipitation. The carbon emissions from all croplands, however, could be mitigated by applying nitrogen fertilizer at 30–60 kg N ha −1 year −1 . The uncertainties of soil organic carbon budgets and crop yields depend mainly on the nitrogen fertilization rate during the first 40 years and then are dominated by climate drying stress. The replenishment of soil nutrients, especially of nitrogen through fertilization, could be one of the priority options for policy makers and farm managers as they evaluate mitigation and adaptation strategies of cropping systems and management practices to sustain agriculture and ensure food security under a changing climate. Z. Tan (B ) ARTS, contractor to U.S. Geological Survey (USGS) Earth Resources Observation and Science (EROS) Center, Sioux Falls, SD 57198, USA e-mail: [email protected] L. L. Tieszen · S. Liu U.S. Geological Survey (USGS) Earth Resources Observation and Science (EROS) Center, Sioux Falls, SD 57198, USA L. L. Tieszen e-mail: [email protected] S. Liu e-mail: [email protected] E. Tachie-Obeng Ghana Environmental Protection Agency, Accra, Ghana

Welcome message from author
This document is posted to help you gain knowledge. Please leave a comment to let me know what you think about it! Share it to your friends and learn new things together.
Transcript
Climatic Change (2010) 100:703–715DOI 10.1007/s10584-009-9688-x
Modeling to evaluate the response of savanna-derivedcropland to warming–drying stressand nitrogen fertilizers
Zhengxi Tan · Larry L. Tieszen · Shuguang Liu ·Emmanuel Tachie-Obeng
Received: 16 June 2008 / Accepted: 27 July 2009 / Published online: 10 October 2009© Springer Science + Business Media B.V. 2009
Abstract Many savannas in West Africa have been converted to croplands and areamong the world’s regions most vulnerable to climate change due to deterioratingsoil quality. We focused on the savanna-derived cropland in northern Ghana to sim-ulate its sensitivity to projected climate change and nitrogen fertilization scenarios.Here we show that progressive warming–drying stress over the twenty-first centurywill enhance soil carbon emissions from all kinds of lands of which the natural ecosys-tems will be more vulnerable to variation in climate variables, particularly in annualprecipitation. The carbon emissions from all croplands, however, could be mitigatedby applying nitrogen fertilizer at 30–60 kg N ha−1 year−1. The uncertainties of soilorganic carbon budgets and crop yields depend mainly on the nitrogen fertilizationrate during the first 40 years and then are dominated by climate drying stress. Thereplenishment of soil nutrients, especially of nitrogen through fertilization, could beone of the priority options for policy makers and farm managers as they evaluatemitigation and adaptation strategies of cropping systems and management practicesto sustain agriculture and ensure food security under a changing climate.
Z. Tan (B)ARTS, contractor to U.S. Geological Survey (USGS)Earth Resources Observation and Science (EROS) Center,Sioux Falls, SD 57198, USAe-mail: [email protected]
L. L. Tieszen · S. LiuU.S. Geological Survey (USGS)Earth Resources Observation and Science (EROS) Center,Sioux Falls, SD 57198, USA
L. L. Tieszene-mail: [email protected]
S. Liue-mail: [email protected]
E. Tachie-ObengGhana Environmental Protection Agency, Accra, Ghana
704 Climatic Change (2010) 100:703–715
1 Introduction
Savannas are globally important ecosystems vital to human economies (Sankaranet al. 2005). They cover one-fifth of the earth’s land surface and support a largeproportion of the world’s population and most of the livestock and wild herbivorebiomass (Scholes and Archer 1997). Savannas in Africa are usually characterized bythe co-dominance of trees and grasses. Over time, many of these ecosystems havebeen converted to croplands. Both natural savanna and savanna-derived croplandhave become sensitive to land surface disturbances (such as mining and agriculturalexpansion from natural savanna, and intensification of cropping and managementpractices) and are among the world’s regions most vulnerable to climate change(Sala et al. 2000; Bond et al. 2003; Weltzin and McPherson 2003). Deterioration ofsoil fertility and decrease in crop yields on this kind of cropland due to populationpressure-induced cropping intensification is threatening food security and humanlivelihoods (Sankaran et al. 2005). For example, the annual population growthrate from 2000 to 2008 in Ghana was about 2.81% (http://www.statsghana.gov.gh/),while the annual food increase rate was only about 1.26% (http://faostat.fao.org/).In our study area presented here, Bawku district, the population density (capitalper square kilometer) increased from 111 in 1970 and 160 in 1984 to 300 in 2000(http://www.statsghana.gov.gh/).
The availability of water and nutrients and the regime of land disturbances aregenerally thought to be critical in regulating savanna ecosystem performance. Fornatural savannas, water availability determines the coexistence of woody cover andgrass (Sankaran et al. 2005). Most African savannas receive an annual precipitationof about 650 ± 134 mm, and if the annual precipitation is greater than the upper limit650 + 134 mm, there is sufficient water available for natural savanna systems to buildup woody canopy (Sankaran et al. 2005). However, many natural savannas in sub-Saharan Africa have been cultivated for food production and most natural trees andgrass have been replaced with crops. We need to understand the responses of suchmanaged ecosystems to changes in climate and crop management so that adaptivemanagement policies can be established to ensure sustainability of the savanna-derived croplands under varying climates.
Ghana is a very diverse country physically and culturally and usually characterizedby its unique ecological regions, or ecoregions (Allotey and Tachie-Obeng 2006).There are remarkable gradients of climatic variables. With a decrease in precipitationand increase in temperature from the south to the north across Ghana territory,accordingly, ecoregions have been characterized with the moist forest-dominatedecosystem in the south to those with savanna in the north, and the transitional zoneis in central Ghana.
In response to climate change, the changes in the distribution and dominanceof different species and constraints from soil nutrient availability (Hungate et al.2003; Luo et al. 2006; Reich et al. 2006b) could make the savanna-derived croppingecosystem different from natural savannas. Particularly, the soil nitrogen (N) deple-tion from croplands in sub-Saharan Africa has been documented ranging from 11 to22 kg N ha−1 year−1 (and 1.3–2.5 kg K ha−1 year−1 and 7.5–15 kg P ha−1 year−1) sincethe 1950s (Lal 2007). The average N fertilizer application rate for crops across Ghanafrom 1970 to 2000 was about 4 kg N ha−1 year−1 (EarthTrends 2003). The continuingnutrient depletion has been perpetuated with an attendant decline in soil productivity
Climatic Change (2010) 100:703–715 705
(Lal 2007). If limitations to land productivity resulting from the insufficient supplyof N nutrient are widespread in both natural and managed ecosystems, soil N supplylikely becomes a critical constraint on global terrestrial responses to climate warming(Oren et al. 2001; Hungate et al. 2003; Luo et al. 2006; Reich et al. 2006a, b). In thisstudy, the land use change data, historical climate records, and soil inventory are usedto drive a biogeochemical model for simulating the dynamics of ecosystem C budgetsin the Bawku savanna zone of Ghana during the twentieth century, and then from thebaselines we evaluate the sensitivity of soil organic C (SOC) stocks and crop yieldsto the projected progressive warming–drying and N fertilization scenarios over thetwenty-first century.
2 Materials and methods
2.1 Study area
The Bawku savanna zone is in the northeastern corner of Ghana, West Africa,and covers an area of 2,130 km2. We assumed the whole area in 1900 was coveredwith the open forest. According to remotely sensed imagery in 2000, most of theopen forest was deforested to become the savanna, one of eastern Sudan savannaecosystems as defined by Allotey and Tachie-Obeng (2006). As a result, the openforest was only 0.4%, grass/herb lands accounted for 16.7%, while the croplands (orcultivated savanna) amounted up to 79%. The mean annual minimum and maximumtemperatures between 1971 and 2000 across the study area were 22.6 ± 0.4◦C and31.9 ± 1.6◦C, respectively. The mean annual precipitation was 1,008 ± 143 mm,about 90% of which was in the period from April through October. According to thefield observations, major crop species are groundnut (Arachis hypogaea), sorghum(Sorghum bicolor S.), millet (Pennisetum glaucum P.), rice (Oryza glaberrima), andmaize (Zea mays L.). Unpublished local government’s statistics showed that thesecropping systems accounted for 29%, 36%, 20%, 13%, and 2% of all the plantedarea in 2000, respectively.
2.2 Modeling system and simulations
GEMS (refer to Tan et al. 2008 and Liu 2009 for details), a biogeochemical modelingsystem, was used in this study to simulate C and N dynamics within each ecosystem.GEMS has the capability of modeling the impacts of land surface disturbancesand management practices, including land use and land cover change, fertilization,cultivation, and natural disturbances (Liu et al. 2004). In order to reduce the potentialbiases resulted from the direct injection of information contained in spatial databasesthat are aggregated to map unit level from inputs (Reiners et al. 2002), GEMS usesdata assimilation mechanisms to incorporate field scale spatial heterogeneities ofstate and driving variables into simulations in two steps: searching and retrievingrelevant information from various databases according to the keys provided by ajoint frequency distribution (JFD) table, and then downscaling the aggregated infor-mation at the map unit level to the field scale using a Monte Carlo approach. Onceall input data are assimilated, they are incorporated into the modeling processesby means of the input/output processor (IOP) and updated with assimilated data.
706 Climatic Change (2010) 100:703–715
Values of selected output variables are written by the IOP to a set of output filesafter each model execution. The geospatial GIS layers and other attribute data usedin modeling are briefly summarized in Section 2.3.
The architecture of GEMS in this study was designed for three scenarios: initialC status around 1900 when all land was assumed to cover with open forest (Alloteyand Tachie-Obeng 2006), impacts of human disturbances on C dynamics from 1900to 2000, and C trends under a changing climate from 2000 to 2100. For initial Cstatus, ecosystem C fluxes and SOC stocks in 1900 were assumed to be in equilibriumand quantified by running GEMS for 1,500 years under natural vegetation. The fieldobservation data of SOC stocks and crop yields of 20 sampling sites across the studyarea were used for model parameterization and validation of model outputs. Theresults for 2000 were set as the baselines for simulating SOC dynamics and crop yieldvariations for the twenty-first century under the climate change and N fertilizationscenarios described below.
2.3 Input data for model simulations
The geospatial datasets used in GEMS include land use and land cover images for1972, 1986, and 2000 provided by Ghana Environmental Protection Agency andCenter for Remote Sensing and Geographical Information System, soil inventorytaken from the FAO soil database, and historical climate records from 1971 to2000 (including mean monthly precipitation, mean monthly minimum- and maxi-mum temperatures). Overlaying these geographic information system (GIS) layersgenerates a combined GIS coverage (i.e. JFD layer) and a JFD table. The JFD layerdefines the spatial association or covariance of these variables and represents thespatial heterogeneities of biophysical variables across the study area (Liu 2009).Each JFD case (i.e. a grid) will be the spatial simulation unit of GEMS. A JFDtable lists all of the realized unique combinations of the values of the variables andtheir associated frequencies (or areas), thereby providing the spatial framework tovisualize and analyze simulation results, such as the spatial and temporal patterns ofbiogeochemical properties (Liu 2009).
The information about land use and land cover, climate variables, and carbonstocks in vegetation and soils as of 2000 were used as the baselines for simulationsfor the twenty-first century.
The dataset of management practices for model simulations consisted of cropcomposition, crop rotation, fallow, and harvesting options (or residue management).These kinds of information and their parameters used in GEMS are listed in Tables 1,
Table 1 Percentage of each crop in all planted area (crop composition) across Bawku district
Period Open cultivated savannaa Widely open cultivate savannab
Maize Sorghum Millet Rice Groundnut Maize Sorghum Millet Rice Groundnut
1900–1975 1 13 13 1 22 1 17 8 5 191976–1982 1 14 12 1 22 1 17 9 4 191983–1986 1 15 10 3 21 1 16 8 5 201987–1994 1 15 9 5 20 1 16 9 4 201994–2000 1 15 9 6 19 1 15 9 6 19aWith ten to 20 trees per hectarebWith less than ten trees per hectare
Climatic Change (2010) 100:703–715 707
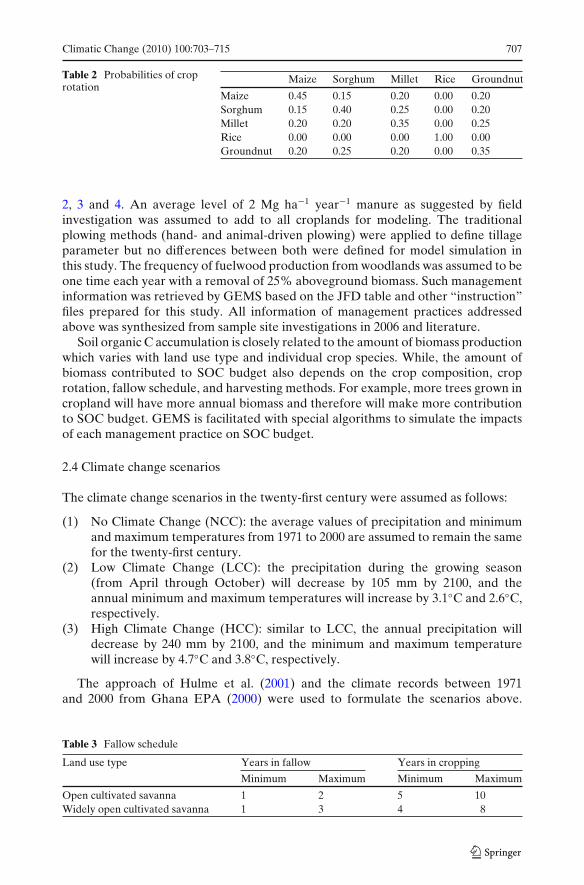
Table 2 Probabilities of croprotation
Maize Sorghum Millet Rice Groundnut
Maize 0.45 0.15 0.20 0.00 0.20Sorghum 0.15 0.40 0.25 0.00 0.20Millet 0.20 0.20 0.35 0.00 0.25Rice 0.00 0.00 0.00 1.00 0.00Groundnut 0.20 0.25 0.20 0.00 0.35
2, 3 and 4. An average level of 2 Mg ha−1 year−1 manure as suggested by fieldinvestigation was assumed to add to all croplands for modeling. The traditionalplowing methods (hand- and animal-driven plowing) were applied to define tillageparameter but no differences between both were defined for model simulation inthis study. The frequency of fuelwood production from woodlands was assumed to beone time each year with a removal of 25% aboveground biomass. Such managementinformation was retrieved by GEMS based on the JFD table and other “instruction”files prepared for this study. All information of management practices addressedabove was synthesized from sample site investigations in 2006 and literature.
Soil organic C accumulation is closely related to the amount of biomass productionwhich varies with land use type and individual crop species. While, the amount ofbiomass contributed to SOC budget also depends on the crop composition, croprotation, fallow schedule, and harvesting methods. For example, more trees grown incropland will have more annual biomass and therefore will make more contributionto SOC budget. GEMS is facilitated with special algorithms to simulate the impactsof each management practice on SOC budget.
2.4 Climate change scenarios
The climate change scenarios in the twenty-first century were assumed as follows:
(1) No Climate Change (NCC): the average values of precipitation and minimumand maximum temperatures from 1971 to 2000 are assumed to remain the samefor the twenty-first century.
(2) Low Climate Change (LCC): the precipitation during the growing season(from April through October) will decrease by 105 mm by 2100, and theannual minimum and maximum temperatures will increase by 3.1◦C and 2.6◦C,respectively.
(3) High Climate Change (HCC): similar to LCC, the annual precipitation willdecrease by 240 mm by 2100, and the minimum and maximum temperaturewill increase by 4.7◦C and 3.8◦C, respectively.
The approach of Hulme et al. (2001) and the climate records between 1971and 2000 from Ghana EPA (2000) were used to formulate the scenarios above.
Table 3 Fallow schedule
Land use type Years in fallow Years in cropping
Minimum Maximum Minimum Maximum
Open cultivated savanna 1 2 5 10Widely open cultivated savanna 1 3 4 8
708 Climatic Change (2010) 100:703–715
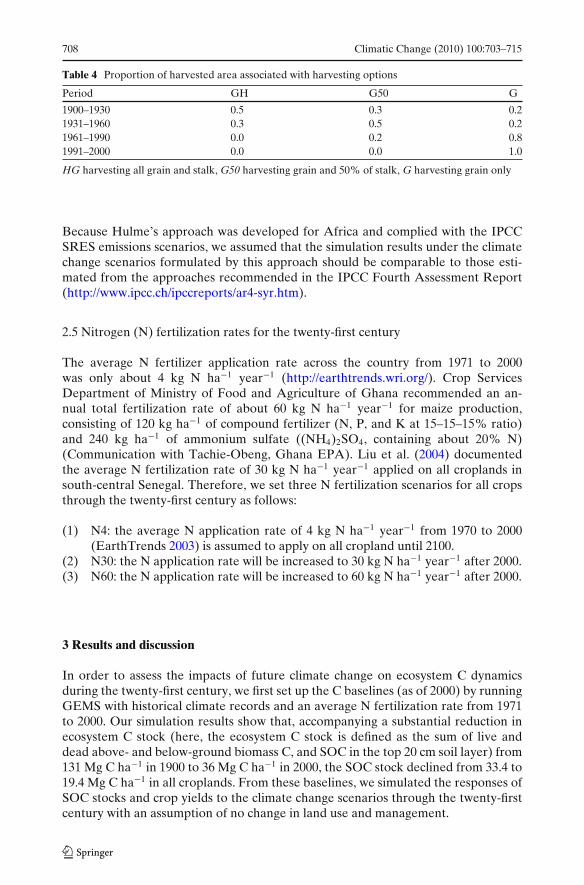
Table 4 Proportion of harvested area associated with harvesting options
Period GH G50 G
1900–1930 0.5 0.3 0.21931–1960 0.3 0.5 0.21961–1990 0.0 0.2 0.81991–2000 0.0 0.0 1.0
HG harvesting all grain and stalk, G50 harvesting grain and 50% of stalk, G harvesting grain only
Because Hulme’s approach was developed for Africa and complied with the IPCCSRES emissions scenarios, we assumed that the simulation results under the climatechange scenarios formulated by this approach should be comparable to those esti-mated from the approaches recommended in the IPCC Fourth Assessment Report(http://www.ipcc.ch/ipccreports/ar4-syr.htm).
2.5 Nitrogen (N) fertilization rates for the twenty-first century
The average N fertilizer application rate across the country from 1971 to 2000was only about 4 kg N ha−1 year−1 (http://earthtrends.wri.org/). Crop ServicesDepartment of Ministry of Food and Agriculture of Ghana recommended an an-nual total fertilization rate of about 60 kg N ha−1 year−1 for maize production,consisting of 120 kg ha−1 of compound fertilizer (N, P, and K at 15–15–15% ratio)and 240 kg ha−1 of ammonium sulfate ((NH4)2SO4, containing about 20% N)(Communication with Tachie-Obeng, Ghana EPA). Liu et al. (2004) documentedthe average N fertilization rate of 30 kg N ha−1 year−1 applied on all croplands insouth-central Senegal. Therefore, we set three N fertilization scenarios for all cropsthrough the twenty-first century as follows:
(1) N4: the average N application rate of 4 kg N ha−1 year−1 from 1970 to 2000(EarthTrends 2003) is assumed to apply on all cropland until 2100.
(2) N30: the N application rate will be increased to 30 kg N ha−1 year−1 after 2000.(3) N60: the N application rate will be increased to 60 kg N ha−1 year−1 after 2000.
3 Results and discussion
In order to assess the impacts of future climate change on ecosystem C dynamicsduring the twenty-first century, we first set up the C baselines (as of 2000) by runningGEMS with historical climate records and an average N fertilization rate from 1971to 2000. Our simulation results show that, accompanying a substantial reduction inecosystem C stock (here, the ecosystem C stock is defined as the sum of live anddead above- and below-ground biomass C, and SOC in the top 20 cm soil layer) from131 Mg C ha−1 in 1900 to 36 Mg C ha−1 in 2000, the SOC stock declined from 33.4 to19.4 Mg C ha−1 in all croplands. From these baselines, we simulated the responses ofSOC stocks and crop yields to the climate change scenarios through the twenty-firstcentury with an assumption of no change in land use and management.
Climatic Change (2010) 100:703–715 709
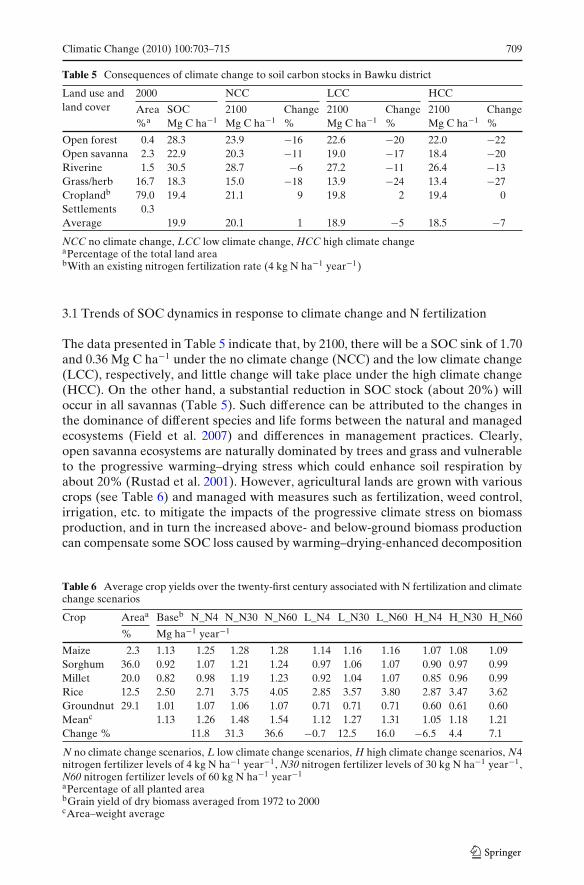
Table 5 Consequences of climate change to soil carbon stocks in Bawku district
Land use and 2000 NCC LCC HCCland cover Area SOC 2100 Change 2100 Change 2100 Change
%a Mg C ha−1 Mg C ha−1 % Mg C ha−1 % Mg C ha−1 %
Open forest 0.4 28.3 23.9 −16 22.6 −20 22.0 −22Open savanna 2.3 22.9 20.3 −11 19.0 −17 18.4 −20Riverine 1.5 30.5 28.7 −6 27.2 −11 26.4 −13Grass/herb 16.7 18.3 15.0 −18 13.9 −24 13.4 −27Croplandb 79.0 19.4 21.1 9 19.8 2 19.4 0Settlements 0.3Average 19.9 20.1 1 18.9 −5 18.5 −7
NCC no climate change, LCC low climate change, HCC high climate changeaPercentage of the total land areabWith an existing nitrogen fertilization rate (4 kg N ha−1 year−1)
3.1 Trends of SOC dynamics in response to climate change and N fertilization
The data presented in Table 5 indicate that, by 2100, there will be a SOC sink of 1.70and 0.36 Mg C ha−1 under the no climate change (NCC) and the low climate change(LCC), respectively, and little change will take place under the high climate change(HCC). On the other hand, a substantial reduction in SOC stock (about 20%) willoccur in all savannas (Table 5). Such difference can be attributed to the changes inthe dominance of different species and life forms between the natural and managedecosystems (Field et al. 2007) and differences in management practices. Clearly,open savanna ecosystems are naturally dominated by trees and grass and vulnerableto the progressive warming–drying stress which could enhance soil respiration byabout 20% (Rustad et al. 2001). However, agricultural lands are grown with variouscrops (see Table 6) and managed with measures such as fertilization, weed control,irrigation, etc. to mitigate the impacts of the progressive climate stress on biomassproduction, and in turn the increased above- and below-ground biomass productioncan compensate some SOC loss caused by warming–drying-enhanced decomposition
Table 6 Average crop yields over the twenty-first century associated with N fertilization and climatechange scenarios
Crop Areaa Baseb N_N4 N_N30 N_N60 L_N4 L_N30 L_N60 H_N4 H_N30 H_N60
% Mg ha−1 year−1
Maize 2.3 1.13 1.25 1.28 1.28 1.14 1.16 1.16 1.07 1.08 1.09Sorghum 36.0 0.92 1.07 1.21 1.24 0.97 1.06 1.07 0.90 0.97 0.99Millet 20.0 0.82 0.98 1.19 1.23 0.92 1.04 1.07 0.85 0.96 0.99Rice 12.5 2.50 2.71 3.75 4.05 2.85 3.57 3.80 2.87 3.47 3.62Groundnut 29.1 1.01 1.07 1.06 1.07 0.71 0.71 0.71 0.60 0.61 0.60Meanc 1.13 1.26 1.48 1.54 1.12 1.27 1.31 1.05 1.18 1.21Change % 11.8 31.3 36.6 −0.7 12.5 16.0 −6.5 4.4 7.1
N no climate change scenarios, L low climate change scenarios, H high climate change scenarios, N4nitrogen fertilizer levels of 4 kg N ha−1 year−1, N30 nitrogen fertilizer levels of 30 kg N ha−1 year−1,N60 nitrogen fertilizer levels of 60 kg N ha−1 year−1
aPercentage of all planted areabGrain yield of dry biomass averaged from 1972 to 2000cArea–weight average
710 Climatic Change (2010) 100:703–715
of soil organic matter. That may be the major reason why open savanna ecosystemsare more sensitive to climate change and show a trend of SOC loss over time underwarming–drying conditions.
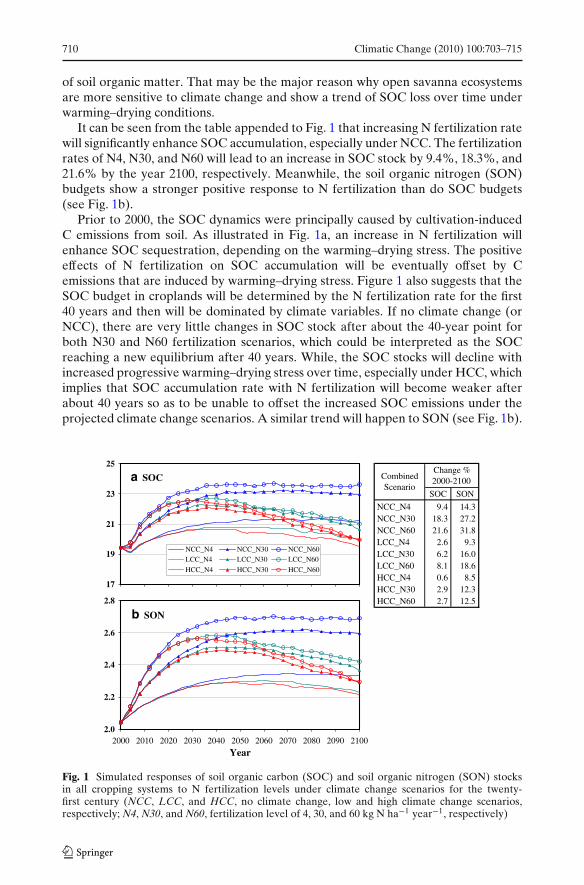
It can be seen from the table appended to Fig. 1 that increasing N fertilization ratewill significantly enhance SOC accumulation, especially under NCC. The fertilizationrates of N4, N30, and N60 will lead to an increase in SOC stock by 9.4%, 18.3%, and21.6% by the year 2100, respectively. Meanwhile, the soil organic nitrogen (SON)budgets show a stronger positive response to N fertilization than do SOC budgets(see Fig. 1b).
Prior to 2000, the SOC dynamics were principally caused by cultivation-inducedC emissions from soil. As illustrated in Fig. 1a, an increase in N fertilization willenhance SOC sequestration, depending on the warming–drying stress. The positiveeffects of N fertilization on SOC accumulation will be eventually offset by Cemissions that are induced by warming–drying stress. Figure 1 also suggests that theSOC budget in croplands will be determined by the N fertilization rate for the first40 years and then will be dominated by climate variables. If no climate change (orNCC), there are very little changes in SOC stock after about the 40-year point forboth N30 and N60 fertilization scenarios, which could be interpreted as the SOCreaching a new equilibrium after 40 years. While, the SOC stocks will decline withincreased progressive warming–drying stress over time, especially under HCC, whichimplies that SOC accumulation rate with N fertilization will become weaker afterabout 40 years so as to be unable to offset the increased SOC emissions under theprojected climate change scenarios. A similar trend will happen to SON (see Fig. 1b).
SOC SON
NCC_N4 9.4 14.3NCC_N30 18.3 27.2NCC_N60 21.6 31.8LCC_N4 2.6 9.3LCC_N30 6.2 16.0LCC_N60 8.1 18.6HCC_N4 0.6 8.5HCC_N30 2.9 12.3HCC_N60 2.7 12.5
CombinedScenario
Change %2000-2100a SOC
17
19
21
23
25
NCC_N4 NCC_N30 NCC_N60LCC_N4 LCC_N30 LCC_N60
HCC_N4 HCC_N30 HCC_N60
b SON
2.0
2.2
2.4
2.6
2.8
2000 2010 2020 2030 2040 2050 2060 2070 2080 2090 2100
Year
Fig. 1 Simulated responses of soil organic carbon (SOC) and soil organic nitrogen (SON) stocksin all cropping systems to N fertilization levels under climate change scenarios for the twenty-first century (NCC, LCC, and HCC, no climate change, low and high climate change scenarios,respectively; N4, N30, and N60, fertilization level of 4, 30, and 60 kg N ha−1 year−1, respectively)
Climatic Change (2010) 100:703–715 711
Note that even with business-as-usual fertilization level (N4), the SOC and SONstocks still show an increasing trend over time under all climate change scenarios(Fig. 1). There are probably two reasons: (1) N deposition, and (2) crop rotationsexcept rice as shown in Table 2. It was assumed that there will be precipitation-dependent N deposition at an average rate of about 1.3 kg N ha−1 year−1 (ifannual precipitation is 1,000 mm) which was set for model simulations. Meanwhile,groundnut is a kind of N-fixation crop and can increase soil N content, and anyrotation of other cropping systems with groundnut planted area will increase soil Navailability to next crop growth. Besides N fertilization, both external N sources willenhance SOC sequestration and SON accumulation, especially under a combinationof NCC and N4 scenarios.
3.2 Responses of crop yields to changes in climate and N fertilization
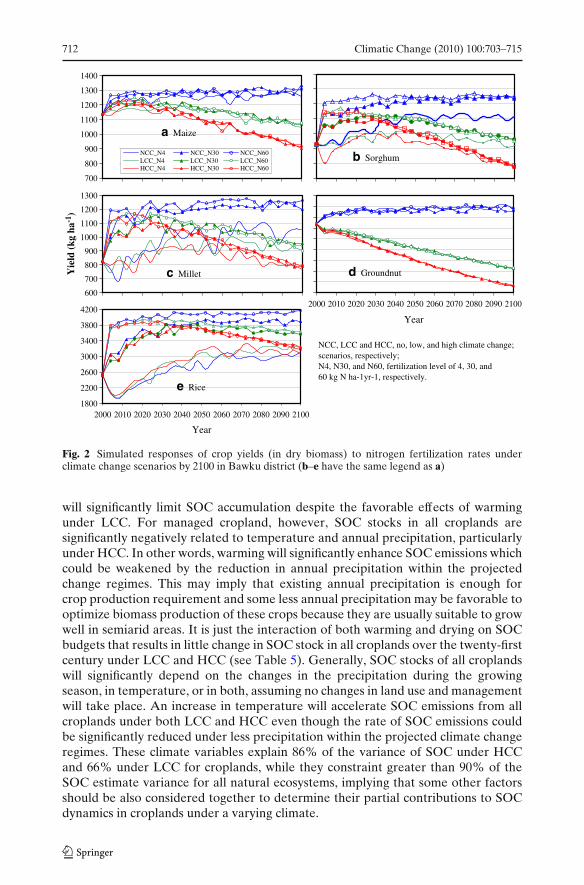
Compared with the average from 1972 to 2000 (Table 6), grain yield averagedthrough the twenty-first century will increase by 11.8% with the existing fertilizationrate (4 kg N ha−1 year−1, or N4) under NCC, but decrease by 0.7% and 6.5% underLCC and HCC, respectively. Such adverse impacts can be significantly mitigated byincreasing the N fertilization rate, especially under LCC. For example, to raise the Nfertilization rate from 4 to 30 kg N ha−1 year−1 under LCC will lead to a grain yieldincrease of 90 kg ha−1 for sorghum, 120 kg ha−1 for millet, 720 kg ha−1 for rice, butlittle change for maize and a decline over time for groundnut. The sensitivity of cropgrain yields to N fertilizers also depends on the extent of warming–drying stress asillustrated in Fig. 2. An increment in the N fertilization rate from 4 kg N ha−1 year−1
to either 30 or 60 kg N ha−1 year−1 will significantly increase grain yields of all crops(except groundnut) until about 2040, then the efficiency of N fertilizer will decline,especially under HCC. The declining efficiency of N fertilizers over time may be alsorelated to deficiencies of other nutrients such as phosphorus (Buresh et al. 1997) andpotassium (Alber et al. 1997).
Interestingly, Fig. 2 demonstrates an increase in crop yields over time with N4fertilization level. As addressed in the previous section, the N addition to soilsfrom atmospheric deposition and N-fixation by crops such as groundnut and inpaddy field (Shrestha and Maskey 2005) is supposed to be an important extra Nfertilizer source in our modeling. This input, even small, will be particularly helpfulto maintain and increase crop yields when N fertilizers’ supply is limited or lack inthe study area. Normally, both soil N availability and crop yield can mutually benefit.Because differences in demand of crop species for N nutrient, each crop will responddifferently to the same level of N supply. For instance, groundnut does not requireexternal N supply because of its N-fixation ability (Murata et al. 2002); reversely,external N application will inhibit the N-fixation and therefore lead to a reduction inyield (see Fig. 2d).
3.3 Variations of SOC stock and crop yields as related to climate stresses
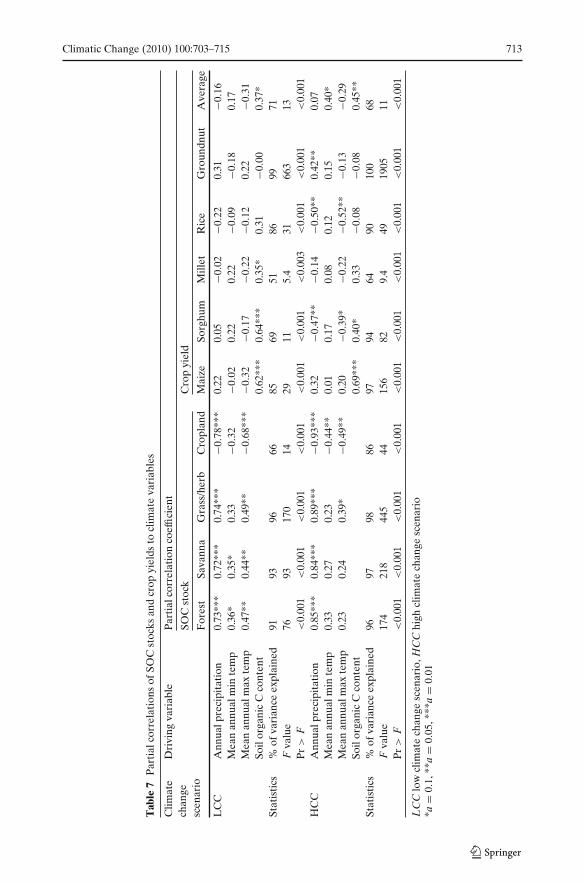
The statistics presented in Table 7 indicate that the impacts of climate variables onSOC budgets vary with the nature of ecosystem and on crop yields vary with cropspecies. For the natural ecosystems (including open forest, savanna, and grass/herb inthis study), any reduction in annual precipitation within the projected change regimes
712 Climatic Change (2010) 100:703–715
NCC, LCC and HCC, no, low, and high climate change; scenarios, respectively; N4, N30, and N60, fertilization level of 4, 30, and 60 kg N ha-1yr-1, respectively.
e Rice
1800
2200
2600
3000
3400
3800
4200
2000 2010 2020 2030 2040 2050 2060 2070 2080 2090 2100
Year
a Maize
700
800
900
1000
1100
1200
1300
1400
NCC_N4 NCC_N30 NCC_N60LCC_N4 LCC_N30 LCC_N60HCC_N4 HCC_N30 HCC_N60
c Millet
600
700
800
900
1000
1100
1200
1300
Yie
ld (
kg h
a-1)
b Sorghum
d Groundnut
2000 2010 2020 2030 2040 2050 2060 2070 2080 2090 2100
Year
Fig. 2 Simulated responses of crop yields (in dry biomass) to nitrogen fertilization rates underclimate change scenarios by 2100 in Bawku district (b–e have the same legend as a)
will significantly limit SOC accumulation despite the favorable effects of warmingunder LCC. For managed cropland, however, SOC stocks in all croplands aresignificantly negatively related to temperature and annual precipitation, particularlyunder HCC. In other words, warming will significantly enhance SOC emissions whichcould be weakened by the reduction in annual precipitation within the projectedchange regimes. This may imply that existing annual precipitation is enough forcrop production requirement and some less annual precipitation may be favorable tooptimize biomass production of these crops because they are usually suitable to growwell in semiarid areas. It is just the interaction of both warming and drying on SOCbudgets that results in little change in SOC stock in all croplands over the twenty-firstcentury under LCC and HCC (see Table 5). Generally, SOC stocks of all croplandswill significantly depend on the changes in the precipitation during the growingseason, in temperature, or in both, assuming no changes in land use and managementwill take place. An increase in temperature will accelerate SOC emissions from allcroplands under both LCC and HCC even though the rate of SOC emissions couldbe significantly reduced under less precipitation within the projected climate changeregimes. These climate variables explain 86% of the variance of SOC under HCCand 66% under LCC for croplands, while they constraint greater than 90% of theSOC estimate variance for all natural ecosystems, implying that some other factorsshould be also considered together to determine their partial contributions to SOCdynamics in croplands under a varying climate.
Climatic Change (2010) 100:703–715 713
Tab
le7
Par
tial
corr
elat
ions
ofSO
Cst
ocks
and
crop
yiel
dsto
clim
ate
vari
able
s
Clim
ate
Dri
ving
vari
able
Par
tial
corr
elat
ion
coef
fici
ent
chan
geSO
Cst
ock
Cro
pyi
eld
scen
ario
For
est
Sava
nna
Gra
ss/h
erb
Cro
plan
dM
aize
Sorg
hum
Mill
etR
ice
Gro
undn
utA
vera
ge
LC
CA
nnua
lpre
cipi
tati
on0.
73**
*0.
72**
*0.
74**
*−0
.78*
**0.
220.
05−0
.02
−0.2
20.
31−0
.16
Mea
nan
nual
min
tem
p0.
36*
0.35
*0.
33−0
.32
−0.0
20.
220.
22−0
.09
−0.1
80.
17M
ean
annu
alm
axte
mp
0.47
**0.
44**
0.49
**−0
.68*
**−0
.32
−0.1
7−0
.22
−0.1
20.
22−0
.31
Soil
orga
nic
Cco
nten
t0.
62**
*0.
64**
*0.
35*
0.31
−0.0
00.
37*
Stat
isti
cs%
ofva
rian
ceex
plai
ned
9193
9666
8569
5186
9971
Fva
lue
7693
170
1429
115.
431
663
13P
r>
F<
0.00
1<
0.00
1<
0.00
1<
0.00
1<
0.00
1<
0.00
1<
0.00
3<
0.00
1<
0.00
1<
0.00
1H
CC
Ann
ualp
reci
pita
tion
0.85
***
0.84
***
0.89
***
−0.9
3***
0.32
−0.4
7**
−0.1
4−0
.50*
*0.
42**
0.07
Mea
nan
nual
min
tem
p0.
330.
270.
23−0
.44*
*0.
010.
170.
080.
120.
150.
40*
Mea
nan
nual
max
tem
p0.
230.
240.
39*
−0.4
9**
0.20
−0.3
9*−0
.22
−0.5
2**
−0.1
3−0
.29
Soil
orga
nic
Cco
nten
t0.
69**
*0.
40*
0.33
−0.0
8−0
.08
0.45
**St
atis
tics
%of
vari
ance
expl
aine
d96
9798
8697
9464
9010
068
Fva
lue
174
218
445
4415
682
9.4
4919
0511
Pr>
F<
0.00
1<
0.00
1<
0.00
1<
0.00
1<
0.00
1<
0.00
1<
0.00
1<
0.00
1<
0.00
1<
0.00
1
LC
Clo
wcl
imat
ech
ange
scen
ario
,HC
Chi
ghcl
imat
ech
ange
scen
ario
*a=
0.1,
**a
=0.
05,*
**a
=0.
01
714 Climatic Change (2010) 100:703–715
Unlike SOC stock, crop yield appears to be less sensitive to the warming–dryingstress, but it depends more on the soil fertility (in terms of SOC stock in the top20-cm soil layer) (see Table 7). In other words, crops grown on soils with higher soilfertility are less impacted by climate change within the projected weather variableregimes. The grain yields of maize, sorghum, and millet significantly depend onsoil fertility and much less on climate variables. Note that the response of rice toprecipitation could be wrong because it was assumed to have enough water fromirrigation in our model simulations. In fact more rainfall can help reduce irrigationloading. Compared to other crops, rice production has the greatest potential increasein grain yield with an increase in N fertilization and is least influenced by thewarming–drying stress (see Table 7 and Fig. 2). In contrast, a significant reductionin groundnut yield may result from an increment in both N fertilization rate andprogressive warming–drying stress. Note that groundnut growth can be independentof N fertilizers because groundnut has an N-fixation capacity through symbioticrelations with rhizobia and does not need an extra N supply during its growing period(Murata et al. 2002).
4 Conclusions
(1) Soil organic carbon dynamics in the study area over the twenty-first centuryin response to climate change are more sensitive in natural ecosystems than incropping systems.
(2) In view of crop yields, soil fertility (usually SOC content is considered one ofmost important indicators) will be more critical than are climate variables.
(3) The responses of crop yields to precipitation are much less sensitive thanto temperature and N fertilization rates in the study area because the meanannual precipitation in the study area is high enough for existing crop species’production and the projected annual precipitation is still as high as 750 mm evenunder HCC.
(4) A modest rate of fertilizer application (e.g., 30 kg N ha−1 year−1) could lead tosustainable and productive cropping systems. A limited source of N fertilizerscan be first allocated for rice (assuming irrigation is possible), then for milletand sorghum.
(5) Food security and agricultural sustainability in the savanna zone under poten-tially warming–drying climate will greatly rely on N fertilization rates.
Acknowledgements This is a contribution of SEMSOC (AEGP00030001300), funded by the USAgency for International Development (USAID)/Climate Change program, Bureaus for EconomicGrowth, Agriculture, and Trade (EGAT) and Africa Bureau. Research was integrated with theGeographic Analysis and Monitoring (GAM) and the Earth Surface Dynamics programs of theUSGS. Work of Z. Tan was performed under USGS contract 08HQCN0007.
References
Alber JD, Ollinger SV, Driscoll CT (1997) Modeling nitrogen saturation in forest ecosystems inresponse to land use and atmospheric deposition. Ecol Model 101:61–78
Allotey AN, Tachie-Obeng E (2006) Agro-ecological and land-cover trends in Ghana. UnpublishedProject Report, AGRHYMET Regional Centre, Niamey Niger
Climatic Change (2010) 100:703–715 715
Bond WJ, Midgley GF, Woodward WI (2003) The importance of low atmospheric CO2 and fire inpromoting the spread of grasslands and savannas. Glob Chang Biol 9:973–982
Buresh RJ, Sanchez PA, Calhoun FG (eds) (1997) Replenishing soil fertility in Africa. Spec. Publ.No. 51, Soil Science Society of America, Madison, WI
EarthTrends (2003) Agriculture and food-Ghana, EarthTrends Country Profile. Available at http://earthstrends.wri.org/
Field CB, Lobell DB, Peters HA, Chiariello NR (2007) Feedbacks of terrestrial ecosystems to climatechange. Annu Rev Environ Resour 32:1–29
Ghana Environmental Protection Agency (EPA) (2000) Ghana’s Initial National Communicationunder the United Nations Framework Convention on Climate Change. Ghana EPA, Ghana
Hulme M, Doherty R, Ngara T, New M, Lister D (2001) African climate change: 1900–2100. ClimRes 17:145–168
Hungate BA, Dukes JS, Shaw MR, Luo YQ, Field CB (2003) Nitrogen and climate change. Science302:1512–1513
Lal R (2007) Tragedy of the global commons: soil, water & air. CSA News 52:10–11Liu S (2009) Quantifying the spatial details of carbon sequestration potential and performance. In:
McPherson B, Sundquist E (eds) Science and technology of carbon sequestration. AmericanGeophysical Union (in press)
Liu S, Kairé M, Wood E, Dialloc O, Tieszen LL (2004) Impacts of land use and climate change oncarbon dynamics in south-central Senegal. J Arid Environ 59:583–604
Luo YQ, Field CB, Jackson RB (2006) Does nitrogen constrain carbon cycling, or does carbon inputstimulate nitrogen cycling? Ecology 87:3–4
Murata MR, Hammes PS, Zharare GE (2002) Soil amelioration effects on nutrient availability andproductivity of groundnut on acid sandy soils of Zimbabwe. Exp Agric 38:317–331
Oren R, Ellsworth DS, Johnsen KH et al (2001) Soil fertility limits carbon sequestration by forestecosystems in a CO2-enriched atmosphere. Nature 411:469–472
Reich PB, Hobbie SE, Lee T, Ellsworth DS, West JB, Tilman D, Knops JMH, Naeem S, TrostJ (2006a) Nitrogen limitation constrains sustainability of ecosystem response to CO2. Nature440:922–925
Reich PB, Hungate BA, Luo Y (2006b) Carbon–nitrogen interactions in terrestrial ecosystems inresponse to rising atmospheric carbon dioxide. Annu Rev Ecol Evol Systemat 37:611–636
Reiners WA, Liu S, Gerow KG, Keller M, Schimel DS (2002) Historical and future land use effectson trace gas emissions using an ensemble modeling approach: Costa Rica’s Caribbean Lowlandsas an example. Global Biogeochem Cycles 16:1068
Rustad LE, Campbell JL, Marion GM et al (2001) A metaanalysis of the response of soil respiration,net nitrogen mineralization, and aboveground plant growth to experimental ecosystem warming.Oecologia 126:543–562
Sala OE, Chapin FS III, Amesto JJ et al (2000) Biodiversity–global biodiversity scenarios for theyear 2100. Science 287:1770–1774
Sankaran M, Hanan NP, Scholes RJ et al (2005) Determinants of woody cover in African savannas.Nature 438:846–849
Scholes RJ, Archer SR (1997) Tree–grass interactions in savannas. Ann Rev Ecolog Syst 28:517–544Shrestha RK, Maskey SL (2005) Review paper: associative nitrogen fixation in lowland rice. Nepal
Agric Res J 6:112–121Tan Z, Tieszen LL, Tachie-Obeng E, Liu S, Dieye AM (2008) Historical and simulated ecosystem
carbon dynamics in Ghana: land use, management, and climate. Biogeoscience 6:45–58. Avail-able at http://www.biogeosciences.net/6/45/2009/
Weltzin JF, McPherson GR (2003) Changing precipitation regimes and terrestrial ecosystems: aNorth American perspective. University of Arizona Press, Tucson
Related Documents