MODELING THE SOCIOECONOMIC AND ENVIRONMENTAL IMPACTS OF NATURE-BASED TOURISM TO THE HOST COMMUNITIES AND THEIR SUPPORT FOR TOURISM PERCEPTIONS OF LOCAL POPULATION: MAZANDARAN, NORTH OF IRAN Roozbeh Mirzaei A thesis submitted in partial fulfillment of the requirements of University of Giessen for the degree of Dr. rer.nat. September 2013 Justus Liebig University Giessen

Welcome message from author
This document is posted to help you gain knowledge. Please leave a comment to let me know what you think about it! Share it to your friends and learn new things together.
Transcript

MODELING THE SOCIOECONOMIC AND ENVIRONMENTAL
IMPACTS OF NATURE-BASED TOURISM TO THE HOST
COMMUNITIES AND THEIR SUPPORT FOR TOURISM
PERCEPTIONS OF LOCAL POPULATION: MAZANDARAN, NORTH OF IRAN
Roozbeh Mirzaei
A thesis submitted in partial fulfillment of the requirements of
University of Giessen for the degree of Dr. rer.nat.
September 2013
Justus Liebig University Giessen

II
MODELING THE SOCIOECONOMIC AND ENVIRONMENTAL
IMPACTS OF NATURE-BASED TOURISM TO THE HOST
COMMUNITIES AND THEIR SUPPORT FOR TOURISM
PERCEPTIONS OF LOCAL POPULATION: MAZANDARAN, NORTH OF IRAN
By: Roozbeh Mirzaei
A thesis submitted in partial fulfillment of the requirements of
University of Giessen for the degree of Dr. rer.nat.
FB07- Mathematik Und Informatik, Physik, Geographie
1. Gutachter: Prof. Dr. Andreas Dittmann
2. Gutachter: Prof. Dr. Eckart Ehlers
September 2013
Justus Liebig University Giessen

III
ACKNOWLEDGEMENTS
I would like to express my deepest appreciation to all those who provided me the
possibility to complete this thesis.
Foremost, I would like to express my sincere gratitude to my supervisor Prof. Dr. Andreas
Dittmann for the continuous support of my Ph.D study and research, for his patience,
motivation, enthusiasm, and immense knowledge. Without his guidance and persistent help,
this dissertation would not have been possible.
I also would like to thank my advisor Prof. Dr. Eckart Ehlers for his useful comments,
remarks, and constructive criticism of my thesis.
I wish to acknowledge my thesis committee members for their guidance, time, inputs, and
patient during the final stage of my thesis.
Furthermore, I wish to thank Prof. Dr. Taghi Rahnemai and Prof. Dr. Mahmoud Ziaee for
their advice, remarks, and support.
In addition, I would like to express my appreciation to the all colleagues and administrators
from the Department of Geography at the Justus Liebig University Giessen.
Finally, I would like to acknowledge Mrs. Lisett Diehl from Department of Geography;
section cartography for providing maps of my thesis.

IV
I dedicate this thesis to my wife and my children who stand by me all
through with patience and tolerance

V
Abbreviations
CA= Community Attachment
CC= Community Concern
DANEA: Department of Ancient Near Eastern Art
DOE: Department of Environment
ECRC=Economic Benefits Remain in the Community
FRWO: Forest, Range & Watershed Organization
ICHTO: Iran Cultural Heritage & Tourism Organization
ITTO: Iran Travel & Tourism Organization
IUCN: International Union for the Conservation of Nature.
NEI: Negative Environmental Impacts
NSEI: Negative Socioeconomic Impacts
PBO: The plan and budget organization of Iran
PEI: Positive Environmental Impacts
PSEI: Positive Socioeconomic Impacts
SCI: Statistics Centre of Iran
ST= Support for Tourism Development
TIES: The International Ecotourism Society
UNEP: United Nations Environment Programme
UNESCO: United Nations Educational, Scientific, and Cultural Organization
UT: Utilization of Tourism Resources
WCED: World Commission on Environment and Development
WTO: World Tourism Organization
WTTC: World Travel & Tourism Council

VI
Abstract
Mazandaran province became one of the first tourism-oriented provinces in Iran in the last
decades. In these years, Mazandaran has continued to attract people’s attention to its tourism
opportunities and especially towards its nature-based tourism potentials. Given the importance
of understanding local community attitudes, this thesis provide a model to assess local
population’s perceptions of socioeconomic and environmental impacts of nature-based
tourism and its relationship with support for tourism development in Mazandaran.
In order to examine local community perceptions of nature-based tourism impacts in
Mazandaran and their support for tourism development, local residents who have lived at least
for one consecutive year in Babolsar or Kelardasht were sampled. The thesis findings suggest
that residents appreciated tourism for increasing job opportunities, development of
recreational facilities and spaces, creating a positive feeling about area among tourists, and
enhancing social relationships between tourists and residents.
However, unbridled, unplanned, and unmanaged development of tourism in Mazandaran in
past years has led to widespread environmental degradation and the destruction of tourism
resources and has intensified increasing the cost of living of local people. Because of the
uncontrolled construction, there have been major changes in coastal areas. In other words,
public and private villas, shops, restaurants, airport, and hotels cover around 95% of coastal
areas in touristic regions that are not accessible to tourists and seashore has become the
“exclusive courtyard” for tourist villas.
The occupation of beaches, water pollution and impose severe restrictions for tourists in
coastal zones, has led to the “counter-beach” phenomenon in Mazandaran. The change in the
flow of coastal tourists affects the neighboring regions particularly Caspian plain, forests and
mountainous areas and resulted in major environmental and social degradations.
Environmental degradation, deforestation, and destruction of coastal areas are increasing
and the nature-based tourism resources of mazandaran are declining. Therefore, implications
and recommendations derived from the results and based on proposed model are suggested.

VII
Table of contents
CHAPTER ONE: INTRODUCTION ....................................................................................... 1
1.0 Introduction ............................................................................................................................. 1
1.1 Statement of purpose and objectives ....................................................................................... 3
1.2 Research questions .................................................................................................................. 5
1.3 Scope of the study ................................................................................................................... 7
1.4 Significance of the study ......................................................................................................... 7
1.5 Outline of the study ................................................................................................................. 9
1.6 Definitions of terms ................................................................................................................. 9
CHAPTER TWO: LITERATURE REVIEW ........................................................................ 10
2.1 Tourism and its significance ............................................................................................... 10
2.1.1 Tourism history ............................................................................................................ 10
2.1.2 Tourism significance .................................................................................................. 11
2.2 The nature of development .................................................................................................... 13
2.3 Evolution of development paradigms: the path to sustainability .......................................... 14
2.3.1 Modernization ............................................................................................................ 14
2.3.1.1 Modernization and tourism ................................................................................... 16
2.3.2 Dependency ............................................................................................................... 18
2.3.2.1 Dependency and tourism ....................................................................................... 19
2.3.3 Neo-liberalism ............................................................................................................ 22
2.3.3.1 Neo-liberalism and tourism .................................................................................. 22
2.3.4 Alternative and Sustainable Development ................................................................. 23
2.3.4.1 Sustainable Tourism .............................................................................................. 24
2.4 Natural areas .......................................................................................................................... 26

VIII
2.4.1 Nature-based tourism ................................................................................................... 28
2.4.2 Nature-based tourism typology ................................................................................... 29
2.5 Ecotourism ............................................................................................................................ 30
2.6 Nature-based tourism impacts ............................................................................................... 33
2.6.1 Environmental impacts of nature-based tourism ......................................................... 35
2.6.2 Socioeconomic impacts of nature-based tourism ..................................................... 38
2.7 Factors affecting perceived impacts of NBT ......................................................................... 43
2.7.1 Socio-demographic characteristics .............................................................................. 43
2.7.2 Community concern ..................................................................................................... 45
2.7.3 Community attachment ................................................................................................ 45
2.7.4 Utilization of tourism facilities and services ................................................................ 46
2.7.5 General understanding of economic benefits of tourism ............................................. 47
2.8 Community support for tourism development ..................................................................... 47
2.9 Modeling local community attitudes toward tourism development ...................................... 48
2.10 Social exchange theory (SET) ............................................................................................. 51
2.10.1 Social exchange theory in tourism context ................................................................. 52
CHAPTER THREE: METHODOLOGY ............................................................................... 55
3.0 Introduction ........................................................................................................................... 55
3.1 Research planning ................................................................................................................ 55
3.1.1 Formulation of research problem ................................................................................ 56
3.1.2 Review of related research ........................................................................................... 57
3.1.2.1 Conceptual framework .......................................................................................... 57
3.1.3Formulation of main variables, aim, objectives and hypothesizes ............................... 61
3.1.3.1 Dependent and independent variables .................................................................. 61
3.1.3.2 Independent and exogenous variables .................................................................. 62

IX
3.1.3.2.1 Community concern ........................................................................................... 62
3.1.3.2.2 Community attachment ...................................................................................... 62
3.1.3.2.3 Utilization of tourism facilities and services by residents ................................. 63
3.1.3.2.4 Remaining economic benefits in society ............................................................ 63
3.1.3.3 Intervening variable .............................................................................................. 63
3.1.3.4 Aim, objectives and hypothesizes ......................................................................... 63
3.1.3.4.1 Aim and objectives ............................................................................................. 64
3.1.3.5 Research questions ................................................................................................ 66
3.1.3.6 Research hypothesizes .......................................................................................... 67
3.1.4 Research design ........................................................................................................... 69
3.1.4.1 Exploratory designs .............................................................................................. 69
3.1.4.2 Descriptive designs .............................................................................................. 70
3.1.4.3 Casual designs ..................................................................................................... 71
3.1.5 Data collection methods ............................................................................................... 71
3.1.5.1 Questionnaire design ............................................................................................ 72
3.1.5.2 Pilot study ............................................................................................................. 73
3.1.6 Sample .......................................................................................................................... 73
3.1.7 Collecting data ............................................................................................................. 74
3.2 Data analysis ......................................................................................................................... 75
3.2.1 Descriptive statistics ................................................................................................... 75
3.2.2. Correlation ................................................................................................................. 75
3.2.3 Sampling adequacy ...................................................................................................... 77
3.2.4 Bartlett's test of sphericity ............................................................................................ 77
3.2.5 Reliability analysis ....................................................................................................... 77

X
CHAPTER FOUR: RESULTS ................................................................................................ 79
4.0 Introduction ........................................................................................................................... 79
4.1 Socio-demographic characteristics of sample ....................................................................... 79
4.1.1 Gender .......................................................................................................................... 79
4.1.2 Age ............................................................................................................................... 80
4.1.3 Level of Education ....................................................................................................... 81
4.1.4 Income .......................................................................................................................... 81
4.1.5 Marital Status ............................................................................................................... 82
4.1.6 Length of residence in Mazandaran ............................................................................. 82
4.1.7 Employment Status ....................................................................................................... 83
4.1.8 Employment in tourism sectors .................................................................................... 83
4.2 Local community perceptions of nature-based tourism impacts ..................................... 84
4.3 Normality test ....................................................................................................................... 85
4.4 Assessing research questions and hypothesizes .................................................................... 87
4.4.1 Research question 1: perceptions of socioeconomic impacts ...................................... 87
4.4.2 Research question 2: perceptions of environmental impacts ....................................... 90
4.4.3 Research question three & four ................................................................................... 92
4.4.4 Research question five & six ........................................................................................ 94
4.4.5 Research question 7 & 8 .............................................................................................. 95
4.4.6 Research question 9 & 10 ............................................................................................ 96
4.4.7 Research question 11 .................................................................................................. 98
4.4.8 Research question 12 ................................................................................................... 99
4.4.8.1 Relationship between gender and overall impacts ................................................ 99
4.4.8.2 Relationship between level of education and overall impacts ............................ 100
4.4.8.3 Relationship between marital status and overall impacts ................................... 101
4.4.8.4 Research question 13 .......................................................................................... 102

XI
4.4.8.5 Relationship between age and overall impacts ................................................... 103
4.4.8.6 Relationship between length of residence and overall impacts .......................... 104
4.4.8.7 Relationship between level of income and overall impacts ................................ 105
4.4.8.8 Relationship between place of residence and overall impacts ............................ 106
4.4.9 Modeling support for nature based tourism development ......................................... 108
4.4.10 Research questions 14 to 21: path analysis to predict support for tourism ............. 112
4.4.11 Decomposition of the correlation between variables ............................................... 115
4.4.12 Path analysis to predict support for tourism development in reduced model .......... 117
Chapter Five: Tourism development in Mazandaran ......................................................... 120
5.1 Iran at a glance .................................................................................................................... 120
5.1.1 Iran’s climate ............................................................................................................. 122
5.1.2 Flora and Fauna of Iran ............................................................................................ 122
5.1.3 Iran’s economy ........................................................................................................... 122
5.1.4 The History of Iran ..................................................................................................... 123
5.1.5 Tourism resources in Iran .......................................................................................... 124
5.1.5.1 Cultural resources of Iran................................................................................... 124
5.1.5.2 Natural resources of Iran .................................................................................... 126
5.1.5.2.1 National Parks ................................................................................................. 129
5.1.5.2.2 National Natural Monuments........................................................................... 129
5.1.5.2.3 Protected Areas ................................................................................................ 129
5.1.5.2.4 Wildlife Refuges ............................................................................................... 129
5.1.5.2.5 Wetlands in Iran ............................................................................................... 130
5.1.6 Tourism facilities and services in Iran ....................................................................... 130
5.1.6.1 Transportation network....................................................................................... 131
5.1.6.2 Accommodation establishments in Iran .............................................................. 132

XII
5.2 Tourism development in Iran .............................................................................................. 133
5.2.1 Stage I (1930-1962): Exploration and involvement ................................................... 134
5.2.2 Stage II (1962-1978): Development ........................................................................... 134
5.2.3 Stage III (1978-1988): Depression and decline ......................................................... 135
5.2.4 Stage IV (1988-2011) Unsteady rejuvenation ............................................................ 137
5.3 Tourism in Mazandaran ...................................................................................................... 143
5.3.1 General characteristics .............................................................................................. 143
5.3.2 Demographic structure in Mazandaran ..................................................................... 144
5.3.3 Location and natural environment ............................................................................. 145
5.3.4 Climate of Mazandaran ............................................................................................. 147
5.3.5 Topography of Mazandaran ....................................................................................... 148
5.3.6 Tourism facilities and services ................................................................................... 148
5.3.6.1 Accommodation establishments in Mazandaran ................................................. 149
5.3.6.2 Coastal establishments in Mazandaran .............................................................. 152
5.3.7 Transformation of coastal strip and Caspian plain ................................................... 152
5.3.8 Form of nature-based tourism in Mazandaran .......................................................... 155
5.3.8.1 Rural tourism in Mazandaran ............................................................................. 155
5.3.8.2 Beach tourism in Mazandaran ............................................................................ 158
5.3.8.3 Second-home tourism in Mazandaran ................................................................ 161
CHAPTER SIX: DISCUSSIONS AND RECOMMENDATIONS ..................................... 162
6.0 Introduction ......................................................................................................................... 162
6.1 Summary of the results ........................................................................................................ 162
6.2 Implications ......................................................................................................................... 172
6.3 Recommendations ............................................................................................................... 174
6.3.1 Organizing coastal areas ........................................................................................... 174

XIII
6.3.2 Develop strategies to help spread the benefits of tourism to the wider community ... 174
6.3.3 Development recreational facilities throughout the coastal strip .............................. 175
6.3.4 Involving local community in development process ................................................... 175
6.3.5 Developing education programs ................................................................................ 176
6.3.6 Commitment to practical use of impact assessment techniques ................................. 176
6.4 Future research .................................................................................................................... 177
References ................................................................................................................................. 178
Appendix I: Questionnaires ....................................................................................................... 202
Appendix II: Reliability Analysis ............................................................................................. 211
Appendix III: Factor analysis .................................................................................................... 213
Appendix IV: Regressions ........................................................................................................ 217

XIV
List of Tables
Table 2.1 World economic impact estimates and forecasts............................................. 13
Table 2.2 The evolution of development theories ........................................................... 15
Table 2.3 IUCN management categories of protected areas ........................................... 27
Table 2.4 Scope of nature-based tourism ........................................................................ 29
Table 2.5 Nature-based tourism activities ....................................................................... 30
Table 2.6 some fundamental truths about tourism .......................................................... 34
Table 2.7 Environmental impacts of nature-based tourism ............................................. 37
Table 2.8 Items used for assessing socioeconomic impacts of tourism .......................... 40
Table 3.1 sample size and response rate .......................................................................... 74
Table 3.2 KMO and Bartlett's Test .................................................................................. 77
Table 3.3 Reliability analysis for variables ..................................................................... 78
Table 4.1: Age of respondents ......................................................................................... 80
Table 4.2 Level of education of respondents ................................................................... 81
Table 4.3 Level of income of respondents ...................................................................... 81
Table 4.4 Marital status of respondents ........................................................................... 82
Table 4.5 Length of Residence in Mazandaran ............................................................... 82
Table 4.6 Employment status of respondents .................................................................. 83
Table 4.7 Employment in tourism sectors ....................................................................... 83
Table 4.8 Distribution of residents’ responses to statements .......................................... 84
Table 4.9 Tests of normality ............................................................................................ 86
Table 4.10 Overall perceptions of socioeconomic impacts of tourism .......................... 89
Table 4.11 Overall perceptions of environmental impacts of tourism ........................... 91
Table 4.12 Correlation between community concern and overall impacts ..................... 93

XV
Table 4.13 Correlation between community attachments and overall impacts ............... 94
Table 4.14 Correlation between utilization of tourism facilities overall impacts ........... 95
Table 4.15 Correlation between general understandings of economic benefits and overall
impacts ............................................................................................................................. 96
Table 4.16 Correlation between overall socioeconomic and environmental impacts ..... 98
Table 4.17 Relationship between gender and main variables ......................................... 99
Table 4.18 Relationship between level of education and main variables ...................... 100
Table 4.19 Relationship between marital status and main variables ............................. 101
Table 4.20 Relationship between employment in tourism sectors and main variables . 102
Table 4.21 Relationship between age and main variables ............................................. 103
Table 4.22 Relationship between length of residence and main variables .................... 104
Table 4.23 Relationship between level of income and main variables ......................... 105
Table 4.24 Relationship between place of residence and main variables ..................... 106
Table 4.25 Multiple regression results of predictors for PSEI ...................................... 108
Table 4.26 Multiple regression results of predictors for NSEI...................................... 109
Table 4.27 Multiple regression results of predictors for PEI ........................................ 110
Table 4.28 Multiple regression results of predictors for NEI ...................................... 111
Table 4.29 Multiple regression results of predictors for support for tourism .............. 112
Table 4.30 Decomposition of the correlation between community concern and support for
tourism development ..................................................................................................... 115
Table 4.31 Decomposition of the correlation between community attachment and support for
tourism development ..................................................................................................... 116
Table 4.32 Decomposition of the correlation between utilization of tourism facilities and
tourism development ..................................................................................................... 116

XVI
Table 4.33 Decomposition of the correlation between general understanding of economic
benefits of tourism and support for tourism development ............................................. 117
Table 4.34 multiple regression results of predictors for support for tourism in reduced model
....................................................................................................................................... 118
Table 5.1 Length of Iran’s borderlines (Kilometer) ...................................................... 121
Table 5.2 Iran’s Properties inscribed on the World Heritage List ................................ 125
Table 5.3 Iran’s under protected areas........................................................................... 130
Table 5.4 Inbound tourism by mode of transport % (2007-2009) ................................. 131
Table 5.5 Accommodation establishments in Iran ........................................................ 133
Table 5.6 number of tourist arrivals based on type of visa............................................ 139
Table 5.7 Executive strategy performance of the third development plan .................... 141
Table 5.8 Employment by sector in Mazandaran (census 1986 to 2011)...................... 144
Table 5.9 Population and average annual growth rate in Mazandaran .......................... 144
Table 5.10 urban and rural population in Mazandaran ................................................. 145
Table 5.11 Accommodation establishments based on grade ......................................... 149
Table 5.12 Number of hotel rooms based on grade ....................................................... 149
Table 5.13 Tourism establishments’ capacities ............................................................. 150
Table 5.14 Number of rooms in tourism establishment ................................................ 150
Table 5.15 General land use in Caspian Sea coastal strip 2012 .................................... 158

XVII
List of figures
Figure 2.1 Miossec’s model of tourist development ....................................................... 17
Figure 2.2: The enclave model of tourism development in developing countries .......... 20
Figure 2.3 Overview of nature-base tourism and ecotourism ......................................... 32
Figure 2.4 Components of environment .......................................................................... 36
Figure 2.5 Impacts of tourism ......................................................................................... 42
Figure 3.1: Research process ........................................................................................... 55
Figure 3.2 Model of support for tourism development ................................................... 60
Figure 4.1 Gender of respondents.................................................................................... 80
Figure 4.2 Fit model of support for tourism development ............................................ 114
Figure 4.3 Reduced model of support for tourism development ................................... 118
Figure 5.1 Number of tourist arrivals in Iran (1969-1978) ........................................... 135
Figure 5.2 Number of tourist arrivals in Iran (1978-1988) ........................................... 136
Figure 5.3 Tourist arrivals by country (1978, 1988) .................................................... 136
Figure 5.4 Number of tourist arrivals in Iran (1988-2011) ........................................... 139
Figure 5.5 tourists accommodate on the street sideline ................................................ 151
Figure 5.6 Caspian Sea littoral near Chalous ................................................................ 154
Figure 5.7 Morphological zoning in Caspian Sea lowland , North of Iran ................... 156
Figure 6.1 Seashore as “exclusive courtyard “in Sisangan ........................................... 166
Figure 6.2 Restrictions on swimming an walking on the beach .................................. 167
Figure 6.3 Model of villas and second-home expansion in Caspian Sea lowland ........ 170

XVIII
List of Maps
Map 5.1 Iran .................................................................................................................. 120
Map 5.2 Topography of Iran ......................................................................................... 121
Map5.3 Iran’s properties inscribed on the world heritage site ...................................... 126
Map 5.4 Iran’s protected areas ...................................................................................... 128
Map 5.5 Tourism regions .............................................................................................. 138
Map 5.6 Mazandaran ..................................................................................................... 145
Map 5.7 boundaries of the townships of Mazandaran ................................................... 146
Map 5.8 Coastal densification with touristic infrastructure 1966-2012 ........................ 153
Map 5.9 Land cover change in Mazandaran (1988, 2000, 2006, 2011 ......................... 157
Map 5.10 coastal densification in Mazandaran 2012 .................................................... 160

1 R.Mirzaei Chapter one: Introduction
Chapter 1: Introduction
1.0 Introduction
While tourism development requires resources (well developed attractions and tourism
superstructures) and developed infrastructure, hospitality of the local residents is very
important and essential. Lack of residents’ support of tourism development or apathy and
annoyance of local community can lead to negative reactions to tourists and in turn result in
their avoidance of visiting the destinations where they feel uncomfortable (Fridgen, 1991).
Identifying residents' perceptions of tourism, and the factors affecting the formation of
these perceptions are important for gaining public support for tourism development. Over the
last half century, the growth and development of tourism as both a social and economic
activity has been remarkable (Sharpley, 2009). Tourism is now a global industry involving
hundreds of millions of people in international as well as domestic travel each year (Mason,
2003, p.3).
Tourism development is generally viewed as an important set of economic activities for
improving local economies (Wan Ko & Stewart, 2002), and many nations promote nature-
based tourism to promote and sustain both environment and economics (Hearne & Salinas,
2002). Over recent decades, travel and tourism have been large contributors to the world
economy. International tourism has been growing at a slightly faster pace than the world
economy and this seems likely to continue in the long-term despite the current recession
(OECD, 2010, p.7).
“The evolution of research on tourism has paralleled the evolution of development studies
as a whole, with an early emphasis on economic aspects now increasingly being
complemented with a more balanced perspective incorporating environmental and
sociocultural matters” (Wall, 2005, p.31).
Recently, in tourism literature increasing attention has been focused on ‘tourism impacts’.
A number of studies have examined host residents’ perception of the impact of tourism
development on their community, and it continues to be an important issue (Wan Ko &

2 R.Mirzaei Chapter one: Introduction
Stewart, 2002). The main reason for growing interest has been the increasing evidences that
tourism development leads not only to positive, but also to negative outcomes at the local level
(Lankford & Howard, 1994). Liu, Sheldon and Var (1987, p.18) noted that tourism
development is usually justified on the basis of economic benefits and challenged on the
grounds of social, cultural, or environmental destruction.
Additionally, the economic benefits traditionally associated with tourism development are
now being measured against its potential for social disruption (Cooke, 1982, p.22). Huang and
Stewart (1996) argued that tourism development changes relationships among community
members and transforms their interactions between each other and to their community. Since
tourism relies heavily upon the goodwill of the local residents; consideration of their support,
perceptions and attitudes toward tourism impacts is essential for its development, successful
operation, and sustainability (Ap, 1992; Gursoy, Jurowski & Uysal, 2002).
An extensive array of research has been conducted on resident attitudes and reactions
toward tourism (McGehee & Andereck, 2004). The results of such studies suggest that a host
is influenced by the perceived impact of tourism in three basic categories of benefits and costs:
economic, environmental, and social (Medlik, 2003; Goeldner & Ritchie, 2009; Gursoy et al.,
2002).
Furthermore, many studies have focused on host communities’ perception and attitudes
towards tourism (Allen, Hafer, Long & Perdue, 1994; Avcikurt & Soybali, 2001; Berno, 1999;
Brayley, 2000; Caneday & Zeiger, 1991; Carmichael, 2000; Fredline & Faulkner, 2000;
Gursoy et al., 2002; Infield & Namara, 2001; Iroegbu & Chen, 2001; Kang, Long, & Perdue,
1996; Kayat, 2002; Keough, 1989; Kuvan & Akanb, 2005; Lankford, 1994; Lankford &
Howard, 1994; Lindberg, Andersson, & Dellaert, 2001; Mason & Cheyne, 2000; Mcgehee &
Andereck, 2004; McKercher, 2001; Mill & Morrison, 1985; Snaith & Haley, 1999; Snepenger,
O’Connell, & Snepenger, 2001; Teye, Sonmez, & Sirakaya, 2002; Walpole & Goodwin 2001).
Despite these numerous studies which focus on residents’ attitudes toward tourism
development, there is still only a limited understanding of residents’ responses to the impacts
of tourism (Carmichael, 2000), and the examination of local population’s attitiudes and
perceptions of tourism impacts is still lacking.

3 R.Mirzaei Chapter one: Introduction
In Iran’s oil oriented economy, most of its provinces have relied on establishing
manufacturing plants and agriculture for their economic development; however, Mazandaran
has set a different tone. It promoted tourism as one of its primary economic activities. In fact,
Mazandaran province became one of the first tourism-oriented provinces in Iran in the last
decades. In these years, Mazandaran has continued to attract people’s attention to its tourism
opportunities and especially towards its nature-based tourism potentials.
However, what has really happened in Mazandaran in these years? Since tourism
development in Mazandaran is seventy-five years old, it is an appropriate time to evaluate the
impacts tourism has on the local population. For this purpose, this study aims to examine
socioeconomic and environmental impacts of nature-based tourism in Mazandaran and factors
predicting residents’ support for tourism development according to notion of social exchange
theory.
According to Ap (1992), social exchange theory is “a general sociological theory
concerned with understanding the exchange of resources between individuals and groups in an
interaction situation” (p. 668). This study will be the first study which assesses factors
influencing residents’ perceptions of nature-based tourism (NBT) impacts and support for
tourism development in Mazandaran.
1.1 Statement of purpose and objectives
The main purpose of this study is to understand local population perceptions of
socioeconomic and environmental impacts of nature-based tourism and the factor predicting
residents’ support for tourism development in Mazandaran, Iran. The investigation of local
community perceptions of tourism impacts enables researchers, planners, and public bodies to
better understand the attitudes, perceptions, and values of local communities who host tourists
in the destination.
The overall goals of this study include:
• To understand residents’ perceptions and attitudes regarding socioeconomic and
environmental impacts of nature-based tourism in Mazandaran, and

4 R.Mirzaei Chapter one: Introduction
• To recognize factors predicting local communities support for nature-based tourism
development in Mazandaran.
In order to achieve the research goals the objectives of research are:
• To study the relationship between residents’ perceptions of nature-based tourism impacts
and their support for tourism development in Mazandaran,
• To examine the relationship between community concern and perception of nature-based
tourism impacts and support for tourism development,
• To examine the relationship between attachment to the community and perception of
nature-based tourism impacts and support for tourism development,
• To study the relationship between utilization of tourism facilities by residents and their
perception of nature-based tourism impacts and support for tourism development,
• To examine the relationship between residents’ understandings of economic benefits of
tourism remainaining in the society and their perception of nature-based tourism impacts and
support for tourism development,
• Examine the relationship among residents’ socio-demographic characteristics, type and
level of involvement in tourism and their relation to perception of NBT’s impacts.

5 R.Mirzaei Chapter one: Introduction
1.2 Research questions
Based on research aim and objectives this study will answer the following questions:
1) What are the residents’ perceptions of the socioeconomic impacts of NBT in
Mazandaran?
2) What are the residents’ perceptions of the environmental impacts of NBT in
Mazandaran?
3) How does community concern affect perceived socioeconomic impacts of NBT in
Mazandaran?
4) How does community concern affect perceived environmental impacts of NBT in
Mazandaran?
5) How does attachment to the community affect perceived socioeconomic impacts of
NBT in Mazandaran?
6) How does attachment to the community affect perceived environmental impacts of
NBT in Mazandaran?
7) How does utilization of tourism facilities by residents affect perceived socioeconomic
impacts of NBT in Mazandaran?
8) How does utilization of tourism facilities by residents affect perceived environmental
impacts of NBT in Mazandaran?
9) How do residents’ understandings of the amount of economic benefits remaining in
their society affect the perceived socioeconomic impacts of NBT in Mazandaran?
10) How do residents’ understandings of the amount of economic benefits remaining in
their society affect the perceived environmental impacts of NBT in Mazandaran?
11) How are the overall socioeconomic and environmental impacts of NBT related to each
other?
12) How do residents’ socio-demographic (e.g., gender, age, level of education, location of
residence, length of residence) profiles relate to their perception of impacts?
13) How does residents’ involvement in nature-based tourism relate to their perceptions of
impacts?
14) How do perceived positive socioeconomic impacts of NBT affect support for tourism?
15) How do perceived negative socioeconomic impacts of NBT affect support for tourism?

6 R.Mirzaei Chapter one: Introduction
16) How do perceived positive environmental impacts of NBT affect support for tourism
development?
17) How do perceived negative environmental impacts of NBT affect support for tourism
development?
18) How is community concern related to support for NBT development in Mazandaran?
19) How is community attachment related to support for NBT development in
Mazandaran?
20) How does utilization of tourism facilities by residents affect support for NBT
development in Mazandaran?
21) How do residents’ understandings of the amount of economic benefits remaining in
society affect support for NBT development in Mazandaran?

7 R.Mirzaei Chapter one: Introduction
1.3 Scope of the study
Based on Cochran equation (1977) a sample of respondents in Babolsar and Kelardasht
were chosen to take part in this research. Based on literature review and local characteristics,
community concern (CC), community attachment (CA), utilization of tourism facilities (UT),
and general understanding of tourism’s economic benefits remaining in the society (ECRC)
were selected as the factors by which residents perceptions of tourism impacts and their
support for tourism development were measured. These factors were assessed based on the
conceptual model of support for tourism development (Figure 1).
Figure 1.1 conceptual model of support for tourism development
Source: own compilation based on literature review
PSEI: Positive Socioeconomic Impacts, NSEI: Negative Socioeconomic Impacts
PEI: Positive Environmental Impacts, NEI: Negative Environmental Impacts
Socio-demographic characteristics were examined as intervening variables in predicting
support for tourism development and local communities’ perception of nature-based tourism
impacts. To complement the findings the interviews, qualitative data from observation and
field trips were used.
Support for tourism
PSEI
NSEI
PEI
NEI
UT
ECRC
CC
CA

8 R.Mirzaei Chapter one: Introduction
1.4 Significance of the study
The fast growth of international tourism after World War II has resulted in raising of
concerns over how the cultural and natural environments of destinations are affected by
tourism (Holden, 2000, p.64). As a result, Similar to the trends in development theory of
dissatisfaction with development philosophies (Telfer, 2002), many tourism analysts turned
away from past methods of tourism development in favor of ‘alternative tourism’ (Brohman,
1996a).
After the Earth Summit held in Rio de Janeiro in 1992, pressure has grown for the tourism
industry to lift its environmental performance on par with other economic sectors, and to work
towards ecologically sustainable forms of tourism development (Pigram & Wahab, 2005, p.
14).
In recent years, arising from changing attitudes toward the nature of the tourist experience
together with the growing realization that tourism takes place in fragile areas, arose the notion
that tourism consumes environmental resources (Mason, 2003). Increasingly, groups of
tourists became more concerned and felt more responsibility for the impacts that their
activities were having on the environment; this led to the growth of what some consider as
more environment-friendly forms of tourism, such as ecotourism (Wearing & Neil, 1999 cited
in Mason, 2003).
On the other hand, one of the main principles of sustainable tourism development involves
placing emphasis on the local community and the environmental, social, and economic
impacts of tourism and their management. Sustainable tourism as an emerging paradigm
seems to enhance the existing conceptual frameworks on tourism planning and development
by making the residents its focal point. Indeed, both direct and indirect support of community
residents’ participation is the foundation of the sustainability paradigm (Butcher 1997; Hunter
1997; Jamieson & Jamal, 1997).
Unbridled, unplanned, and unmanaged development of tourism in Mazandaran in past
years has led to widespread environmental degradation and to the destruction of tourism
resources. Thus, in order to manage tourism impacts and to sustain tourism activities it is
necessary to understand the local communities’ perception of tourism impacts and the factors
that predict their support for tourism development in Mazandaran.

9 R.Mirzaei Chapter one: Introduction
1.5 Outline of the study
This research is presented in six chapters. Following this current introductory chapter,
Chapter Two provides a literature review of the impacts of tourism on communities, and of
different tourism development paradigms. In Chapter Three, the research plan and related
methods and techniques used for analyzing data are discussed in detail. Chapter Four, presents
the results and findings of the research. In Chapter Five, the tourism development stages in
Iran and their characteristics, the main types of tourism, resources and challenges in
Mazandaran are presented. Finally, Chapter Six provides a discussion on the implications for
tourism planning and development and on directions for feature research.
1.6 Definitions of terms
• Nature-based tourism (NBT): Nature-based tourism is defined as any non-consumptive
or consumptive tourist activity (shafer & choi, 2003) that takes place in natural settings. NBT
includes tourism that based on the specific aspects and elements of the natural environment
and tourism that is developed in order to conserve and sustain natural areas (Hall & Boyd,
2005).
• Sustainable tourism: Sustainable tourism development guidelines and management
practices are applicable to all forms of tourism in all types of destinations, including mass
tourism and the various niche tourism segments. Sustainability principles refer to the
environmental, economic and socio-cultural aspects of tourism development. A suitable
balance must be established between these three dimensions to guarantee its long-term
sustainability (UNWTO, 2005).
• Tourism impact: tourism development brings with it inevitable positive and negative
impacts (McKercher, 1993) which arise from the interrelationship between host communities,
visitors and the natural environment (Lindberg, Andersson & Dellaert, 2001; Mathieson &
Wall, 1982). Tourism impacts usually are measured by social, economic, and environmental
aspects (Mathieson & Wall, 1982).
• Local community: A member of local community in this study is a person who has lived
in a Mazandaran for more than one consecutive year.

10 R.Mirzaei Chapter two: Literature review
CHAPTER 2: LITERATURE REVIEW
2.0 Tourism and its significance
Tourism is an important economic, sociocultural, and environmental phenomenon in
today’s world (Inskeep, 1991). International tourist arrivals grow by an overall rate of 7.3%
per annum (Wanhill, 1997), despite occasional shocks, experienced continued expansion over
the last six decades from 25 million in 1950, to 1,035 million in 2012 ( UNWTO, 2013).
Over the last half century, the growth and development of tourism as both a social and
economic activity has been remarkable (Sharpley, 2009, p.1). In 1950, the international tourist
arrivals were around 25 million; in 2000, the number raised to more than 687 million and
during the past decades the international tourism has continued its steady growth. In 2009,
over 880 million international arrivals were recorded (UNWTO, 2010).
Tourism is now a global industry involving hundreds of millions of people in international
as well as domestic travel each year (Mason, 2003, p.3). Millions of people all over the world
involved directly in tourism industry and many more are employed in industry related
activities. A large number of world populations in form of ‘host communities’ involved in
producing final tourism products, as they live in destination areas. Governments and tourism
companies spend Millions of dollars every year to increase their income and promote holidays
and tourism products (Weeks & Hetherington, 2006).
According to the Organization for Economic Co-operation and Development (OECD) over
the past years, travel and tourism have been an important economic sector in the world
economy. The economic growth rate of international tourism has been faster than the world
economy and this trend seems likely to continue in next decades (OECD, 2010).
The World Travel and Tourism Council (WTTC) for more than 20 years has been assessing
the travel and tourism contribution to world economy. According to WTTC report, travel and
tourism is one of the world’s largest industries and a main provider of job opportunities
(WTTC, 2012).
11 R.Mirzaei Chapter two: Literature review
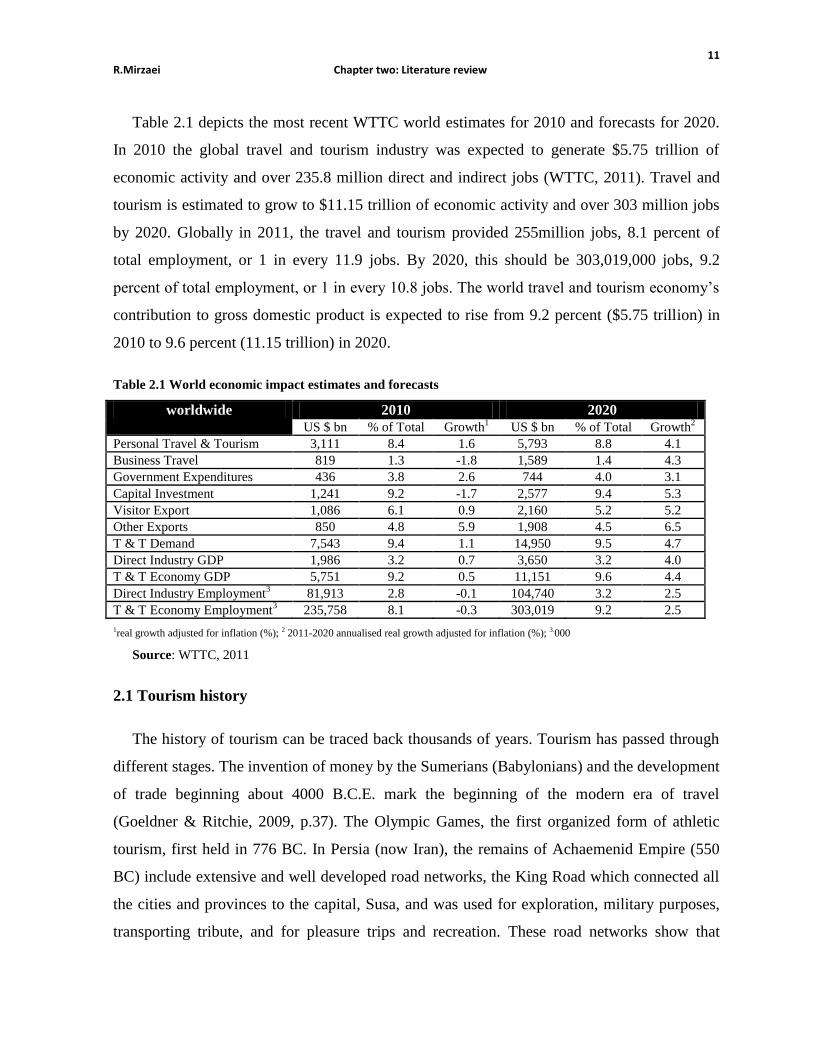
Table 2.1 depicts the most recent WTTC world estimates for 2010 and forecasts for 2020.
In 2010 the global travel and tourism industry was expected to generate $5.75 trillion of
economic activity and over 235.8 million direct and indirect jobs (WTTC, 2011). Travel and
tourism is estimated to grow to $11.15 trillion of economic activity and over 303 million jobs
by 2020. Globally in 2011, the travel and tourism provided 255million jobs, 8.1 percent of
total employment, or 1 in every 11.9 jobs. By 2020, this should be 303,019,000 jobs, 9.2
percent of total employment, or 1 in every 10.8 jobs. The world travel and tourism economy’s
contribution to gross domestic product is expected to rise from 9.2 percent ($5.75 trillion) in
2010 to 9.6 percent (11.15 trillion) in 2020.
Table 2.1 World economic impact estimates and forecasts
worldwide 2010 2020
US $ bn % of Total Growth1 US $ bn % of Total Growth
2
Personal Travel & Tourism 3,111 8.4 1.6 5,793 8.8 4.1
Business Travel 819 1.3 -1.8 1,589 1.4 4.3
Government Expenditures 436 3.8 2.6 744 4.0 3.1
Capital Investment 1,241 9.2 -1.7 2,577 9.4 5.3
Visitor Export 1,086 6.1 0.9 2,160 5.2 5.2
Other Exports 850 4.8 5.9 1,908 4.5 6.5
T & T Demand 7,543 9.4 1.1 14,950 9.5 4.7
Direct Industry GDP 1,986 3.2 0.7 3,650 3.2 4.0
T & T Economy GDP 5,751 9.2 0.5 11,151 9.6 4.4
Direct Industry Employment3
81,913 2.8 -0.1 104,740 3.2 2.5
T & T Economy Employment3
235,758 8.1 -0.3 303,019 9.2 2.5
1real growth adjusted for inflation (%); 2 2011-2020 annualised real growth adjusted for inflation (%); 3.000
Source: WTTC, 2011
2.1 Tourism history
The history of tourism can be traced back thousands of years. Tourism has passed through
different stages. The invention of money by the Sumerians (Babylonians) and the development
of trade beginning about 4000 B.C.E. mark the beginning of the modern era of travel
(Goeldner & Ritchie, 2009, p.37). The Olympic Games, the first organized form of athletic
tourism, first held in 776 BC. In Persia (now Iran), the remains of Achaemenid Empire (550
BC) include extensive and well developed road networks, the King Road which connected all
the cities and provinces to the capital, Susa, and was used for exploration, military purposes,
transporting tribute, and for pleasure trips and recreation. These road networks show that

12 R.Mirzaei Chapter two: Literature review
travel has long flourished in Iran. According to Herodotus stations and guesthouses were
located about every four Farsang1 (18 km) along this road system (cited in Briant, 1998).
With the fall of the Roman Empire in the fifth century A.D the middle class population
mostly disappeared, the transportation network disintegrated and trips were dangerous all
resulting in much diminish travel within Europe and the Mediterranean region (Inskeep, 1991,
p.5).
After the European Renaissance, tourism has experienced a rapid growth. The “Grand
Tour” by the eighteenth century was well developed (Kershaw & Lickorish, 1958, p. 22).
After the industrial revolution, the railway, steam trains and steamships transformed travel
opportunities. Rapid growth of population and wealth created an enormous new market in a
short period of time and mass travel was invented. Due to the development of recreational
facilities and services, accommodation sectors, transportation systems and car ownership
expansion, a substantial growth in foreign travel occurred (Goeldner & Ritchie, 2009). Once
again expansion and experimentation was hindered by the great depression of 1930 and finally
brought to a halt by the Second World War in 1939–45 (Lickorish & Jenkins, 1997).
The period from 1945, through the postwar years up to the present time has been an era of
revolution in technology, massive industrial development and change, which resulted in
related acceleration in wealth creation and escalation of disposable incomes (Lickorish &
Jenkins, 1997, p.12). Tourism in the 1960s and 1970s was in the form of mass tourism by fast
social and economic changes as the main driving forces (Lonides & Debbage, 1997). The new
paradigm (sustainable tourism) from the early 1990s onwards emerged by focusing on people
making the process of the development more diverse, complex and dynamic (Chambers,
1997).
1 A Persian scale equal to 4.5 km

13 R.Mirzaei Chapter two: Literature review
2.2 The nature of development
Development is a term with various aspects which has different meanings in different
societies. The term is complicated integrating a mix of material and moral ideas encompassing
both present and future states; the current situation and how it came to be and the future
perspective (Wall, 2005). At the early stages of its development the economic aspects were
considered. However, according to Binns todays in addition to economic issues, it
encompasses social, environmental and ethical considerations and its measurement may
incorporate indicators of poverty, unemployment, inequality and self-reliance (cited in Wall,
2005, p.30).
Along with the changing in notion of development the measurement tools have changed
also and encompassed environmental, socio-cultural and ethical aspects. According to Wall
(2005, p.31) “the evolution of research on tourism has paralleled the evolution of development
studies as a whole, with an early emphasis on economic aspects now increasingly being
complemented with a more balanced perspective incorporating environmental and socio-
cultural matters”.
Andriotis (2000, p.13) argued that the concept of development has been discussed for many
years and referred to the Friedmann (1980, p.4):
“ Development is always of something, a human being, a society, a notion, an economy, a
skill ... It is often associated with words, such as under or over or balanced: too little, too
much, or just right ... which suggests that development has a structure, and that the speaker has
some idea about how this structure ought to be developed. We also tend to think of
development as a process of change or as a complex of such processes which is in some
degree lawful or at least sufficiently regular so that we can make intelligent statements about
it”.
According to Goldsworthy (1988) the term “development” can be considered in three
aspects: a process, the result of that process, and the activities that support the process, each of
which surrounded by social, economic, political and environmental ideological perspectives.
This study focused primarily on the outcomes of nature-based tourism development.

14 R.Mirzaei Chapter two: Literature review
Rostow (1967) identified five stages which all societies have to pass them if they want to
be developed: the traditional society, the precondition for take-off, the take-off, the drive to
maturity and high mass production. As development theory and tourism have evolved along
similar time lines (Telfer, 2002) it is a useful tool to explain different stages in tourism
development.
According to Andriotis (2000, p.14) “tourism can offer to a destination a natural path to
economic growth through various stages, ranging from traditional non-tourism where no
tourists visit the destination, to the precondition to take off where explorers and drifters make
their appearance, to maturity where the destination is visited by mass individual tourists, to the
final stage of mass consumption where the destination is visited by mass organized tourists”.
2.3 Evolution of development paradigms: the path to sustainability
Development theory is described in chronological sequence. In other words, the approaches
to development over the time displaying a shift and evolution from traditional models with
top-down economic growth-based approach through to more broad based approaches focusing
on bottom-up and people-centered strategies within environmental (Sharpley, 2009, p.38),
social and economic limits.
Although there is a range of different approaches to development theories in this study the
main broad approaches to development have been identified according to Sharpley (2009),
which constitute a very rough evolution in the sequence of ideas concerning development.
They are: modernization, dependency, neo-liberalism and alternative /sustainable
development. Table 2.2 outlines development theories and their component.
2.3.1 Modernization
Modernization has been defined as a socioeconomic evolutionary transition from a
traditional to a modern society (Telfer, 2002). Modernization includes spread of growth
impulses from developed areas to a number of other regions (Andriotis, 2000; Auty, 1995;
Rostow, 1990; Sharpley, 2009). During the modernization new industries expanding rapidly,
the new classes of entrepreneurs expand; the economy exploits natural resources (Rostow,
1967) and means of livelihood shifts from rural to urban (Telfer, 2002). Modernization

15 R.Mirzaei Chapter two: Literature review
theorists have tended to view societies as passing through a series of development stages
similar to those experienced by many western countries (Wahab & Pigram, 2005). According
to the opinion that all societies follow an evolutionary path from traditional to modern
structures, modernization is consider as the ‘take-off stage’ (Rostow, 1967). “Development
has often been equated with growth arising from relatively developed areas, and concepts such
as stages of economic growth, growth poles, spread and backwash effects, and circular and
cumulative causation” (Wahab & Pigram, 2005, p.31).
Table 2.2 The evolution of development theories
Time guide Development paradigms Theoretical perspectives and concepts
1950s-
1960s Modernization Stages of growth: pass through western
development stages
Diffusion: growth impulse from developed areas;
growth poles; trickledown effect, state involvement
1950s-
1960s Dependency Neocolonialism: underdevelopment caused by
exploitation by developed countries; western
cultural influence
Dualism: Poverty is functional to global economic
growth; rich and poor between countries and within
countries; regional inequalities
Structuralism: Domestic markets, state
involvement, import substitution, social reforms,
protectionism
Mid 1970s-
1980s Economic neoliberalism Free market: free competitive markets;
privatization; supply side macroeconomics
Structural adjustment: focus on market sources
and competitive exports
One world: new world financials systems;
deregulation internationalization of production
1970s-early
1980 Alternative/sustainable
development
Basic needs: focus on food, housing, water, health
and education
Grassroots: people-centered development; local
control of decision making, empowerment, NGOs
Gender: woman in development, gender relations;
Sustainable development: environmental
management; meet the needs of present generation
without compromising future needs
Sources: Tefler (2002, p.39) and Sharpley (2009)

16 R.Mirzaei Chapter two: Literature review
In tourism context, dramatic rise of mass tourism in the 1960s and 1970s represents mass
production and consumption (Shaw & Williams, 2004). The key benefits of mass tourism
were income and employment generation (Vanhove, 1997). During the 1960s, tourism was
basically equated with development which was part of modernization framework and tourism
productions under modernity take the form of consumption (Telfer, 2002, p.50). The final
product was experience and pleasure. Tourism has been developed as a strategy which creates
more jobs, increases income and tax revenues, generates foreign exchange, increases rate of
investment, generates a large multiplier effect that stimulated the local economy (Davis, 1968;
Peppelenbosch & Templeman, 1973; Graburn and Jafari, 1991; Telfer, 2002) and promotes a
modern way of life with western values (Harrison, 1992).
Miossec developed a model of tourism regional development (Figure 2.1), represents the
structural evolution of a tourism destination through time and space (cited in D. Pearce, 1989,
P.17). Miossec focused on changes in the provision of facilities in forms of resorts and
transportation networks (D. Pearce, 1989) and in the tourist behavior pattern and attitudes of
local population and host governments (Howie, 2003). Miossec explained that the
development process takes place in five phases. In the early phases (phase 0 and 1) the region
is unknown to tourists and there is little or no infrastructure, so a limited number of visitors
visit the area, tourists have an unclear imagine of the destination while the host community
and planners have no specific attitude toward tourism and its consequences (D. Pearce, 1989).
When the area was discovered a ‘pioneer resort’ will established (Howie, 2003).
Established the pioneer resorts will provide the groundwork for further development.
Multiplication of resorts together with more transport links between them and better
understanding tourists’ behavior are the main characteristics of second phase (D. Pearce,
2003). A hierarchy or specialisms of services arise in resorts and the new character of the
place is attractive for most of the visitors (Howie, 2003). Attitudes toward tourism
development vary and may lead to the complete acceptance of tourism, the adoption of
planning controls or even the rejection of tourism (D. Pearce, 2003). The final would be the
saturation of resorts with maximum routes between different them.

17 R.Mirzaei Chapter two: Literature review
What is clear is that through these phases host communities attitudes toward tourism
development change that may lead to support of tourism or to oppose to tourism development
(Andriotis, 2000).
Figure 2.1 Miossec’s model of tourist development
Source: Pearce (1989, p. 17)

18 R.Mirzaei Chapter two: Literature review
Allong with tourism expansion, the process of difussion from hub centers to pripheral areas
takes place while the development of tourism implies greater interaction of the ‘trickle-down
effects’ and the possibility of regional disparity adjustment. (Andriotis, 2000, p.17). Since
tourism is a multidimensional phenomenon with high multiplier impact, likely improve local
community welfare in most of the destinations. However, in some areas the development of
tourism has not only improved the economic situation, but also intensified the social and
economic inequalities among local population (Andriotis, 2000). Consequently, the benefits of
tourism development does not appear over the entire country and there are areas where
diffusion emerges first, in others later, and in some never (Andriotis, 2000).
2.3.2 Dependency
The dependency paradigm emerged in the 1960s as modernization paradigm was criticized
because it could not be adopted in the structural conditions which exist in under developed
areas (Andriotis, 2000; Auty, 1995; Briton, 1989; Browett, 1980; Erisman, 1983; Lea, 1988;
Milne, 1997; Oppermann & Chon, 1997; Wilkinson, 1997) and is one of the best-known neo-
Marxist development theories (Schuurman, 1993). Whilst modernization theory attempts to
explain how development may occur as the result of capitalist economic growth, dependency
theory suggests why such development or modernization fails to occur (Sharpley, 2009, p.41).
Dependency theorists believe that lack of development is a result of external forces more
than internal causations (Wall, 2005; Wilkinson, 1987). According to the dependence model,
countries of the periphery have socioeconomic and political structures that keep them in a
dependent position relative to developed countries that distinguished it from the capitalist
development in the core (Andriotis, 2000; Hunt, 1989; Potter, Binns, Eliott & smith, 1999;
Telfer, 2002). “In other words, global political-economic relations are such that wealthy,
industrialized nations (the metropolitan ‘center’) are able to exploit weaker, peripheral nations,
hence restricting developmental opportunities in the latter” (Sharpley, 2009, p. 41).
Because of the above-mentioned relationship between core and periphery, the periphery
trapped in a vicious circle of poverty (Andriotis, 2000; Mydral, 1957; Potter et al., 1999). “The
dependency thesis emphasizes dualism between the rich and poor, the powerful and the
powerless, both between and within developed and developing countries, and believe that

19 R.Mirzaei Chapter two: Literature review
development process should be implemented by the favoring of domestic markets, import
substitution, protectionism and social reforms “(Wall, 2005, p.32).
Tourism development structure in a number of developing countries matches to
dependency model. Generally, such countries had to borrow money from international
organizations or invite global companies to invest in large-scale tourism projects (Telfer,
2002). As a result, western global companies rule the tourism industry of developing countries
and exploit their resources in the form of tourist enclaves (Andriotis, 2000). Foreign
ownership and investment in important destinations shapes a kind of structural dependency in
developing countries (Britton, 1989) which in turn, transfer tourism benefits from destinations
to core countries.
Center- periphery relationships in tourism have been studied by number of researchers
(Andriotis, 2000; Britton, 1982, 1987a, 1987b, 1989; Christaller, 1963; Hills & Lundgren,
1977; Hoivik & Heiberg, 1980; Husbands, 1981; Keller, 1984; Mathews & Richter, 1991;
Mathieson & Wall, 1982; Murphy, 1985; Smith, 1989; Telfer, 2002; Turner, 1976; Wellings &
Crush, 1983; Wu, 1982;).
As large tourism companies are mainly located within the principal tourist markets they
could contact with tourists directly (Andriotis, 2000; Britton, 1982; IUOTO, 1976). They rule
major component of tourism such as marketing and promotion, package design, airlines and
accommodation establishments and control the tourists flow. Control over tourism
components allows global tourism companies to influence the volume of tourist flows to
different destination where they may have more interest. These companies are able to design,
integrate, implement and market the travel packages and provide tourism products (Britton,
1982; Telfer, 2002).
Britton (1982) developed enclave model to explain the dependency structure for tourism
development in developing countries (Figure 2.2). According to his model, the structure of
international tourism consists of a three-tiered hierarchy namely headquarter of metropolitan
market, branch offices in developing countries and small tourism enterprises of destination
(Britton, 1982).

20 R.Mirzaei Chapter two: Literature review
He argued that tourism destinations rely on global tourism companies for developing
tourism infrastructures and tourists and have little or no control over their tourism system
(Telfer, 2002).
Figure 2.2: The enclave model of tourism development in developing countries
Source: Britton, 1982

21 R.Mirzaei Chapter two: Literature review
The global tourism companies in major tourism generating areas design and sell the tour
packages. Consequently, According to Briton, there is a “capacity of the dominant tourism
sectors to control tourist expenditures through the control of tourist movements, to the relative
exclusion of the petty producer sectors” (cited in Andriotis, 2000). The large global companies
in the hierarchy are able to control the lower firms and penetrate their markets (Britton, 1982;
Telfer, 2002).
On the other hand, Weaknesses of existing infrastructure in the sectors of manufacturing,
agriculture, and services in many developing countries lead to the lack of the quality products
and permanent supply of inputs to the different sectors of tourism system that in turn results in
the reliance on imported supplies for tourist facilities (Telfer, 2002). “The apparent market
competence of these metropolitan companies renders them natural recipients of destination
government aid, cooperation and subsidization” (Hiller, 1977, p.116).
Therefore, many of the developing countries obliged to accept a high degree of foreign
ownership, retention of tourist receipts in the metropolitan countries and leakage of foreign
incomes (Britton, 1982; Hills & Lundgren, 1977; Hoivik & Heiberg, 1980; IUOTO, 1976). It
is metropolitan tourism capital which is the most important element determining the structure
and characteristics of tourism in developing countries (Britton, 1982).
consequently, the control over the tourism system and local resources shifts from the local
population and host community, that are most affected by environmental, socio-cultural and
economic impacts of tourism development, to the developed countries which are the owners of
large tourism companies (Andriotis, 2000; Hall, 1994, 1996). According to Brohman, “Local
community find themselves “enmeshed in a globally integrated system of resource use over
which they cannot exercise control” and they become “the targets of top-down decision-
making by elitist bodies exogenous to the community” (cited in Andriotis, 2000). In effect,
dependency paradigm has been one of the main development theories used in context of
tourism studies particularly in scope of negative impacts of tourism (Telfer, 2002).
22 R.Mirzaei Chapter two: Literature review
2.3.3 Neo-liberalism
During the1970s, some economists suggested that economic growth and development was
being restricted by excessive state intervention in economic affairs (Sharpley, 2009, p. 42).
They argued and stressed the role of privatization and the free competitive market (Willis,
2005). Consequently, a shift occurred in development thinking, rejecting the Keynesian fiscal
approach underpinning modernization and economic growth policies and moving towards a
liberal, free market approach (Sharpley, 2009) referred to neo-liberalism.
The development of economic neo-liberalism was a response to state intervention policies
including principles of structural dependency theory (Telfer, 2000). According to Brohman,
neo-liberalism employs neoclassical economic theory which ‘treats people as atomistic
individuals who are bound together only through market forces’ (cited in Telfer, 2002). It also
has some common basis with Adam Smith’s opinions and his principle of laissez-faire and
David Ricardo’s theory of comparative advantage, which both focused on minimum state
involvement in economic transactions (Telfer, 2002).
Some scholars emphasis on the role of irrational government interventions in the problems
faced by developing countries (Brohman, 1996b; Lal, 1985; Telfer, 2002). As a result,
according to Brohman emphasis shifts on “supply-side factors, private investment, market-led
growth and outward development while turning away from older developmentalist policies
based in demand stimulation, import substitution, state intervention and centralized
development planning” ( sited in Telfer, 2002, p.45).
Neo-liberalism paradigm considered less by tourism scholars compare to the other three
paradigms. Important aspects of this development paradigm include an emphasis on
competitive exports and the use of Structural Adjustment Lending Programmes (SALPs)
(Telfer, 2002).

23 R.Mirzaei Chapter two: Literature review
2.3.4 Alternative and Sustainable Development
The alternative development model emerged in response to the obvious failure of
abovementioned economic-growth based models to consider the needs of the local population
and the importance of environmental and cultural conservation in development process
(Telfer, 2002). In other words, alternative development paradigm represents an alternative to
top-down economic growth models of development, which see development as the
modernization of the world, adopting instead a bottom-up approach to development that
focuses primarily on human and environmental concerns (Sharpley, 2009).
The main principal of alternative development is that development should protect natural
environment and fulfill needs of local community, therefore, it should be indigenous (Telfer,
2002). As well, in alternative development model, the promotion of human well-being does
not have to depend upon the destruction of nature (Baker, 2006). Supporters of alternative
development place emphasis on the satisfaction of basic needs: food, housing, water, health,
and education (Wall, 2005). Therefore, alternative development is a people oriented paradigm
that concentrates not only on the basic needs of local population but also on the incorporate
local conditions and knowledge systems to strengthen the developmental process (Chipeta,
1981; Schafer, 1989; Sharpley, 2009; Telfer, 2002).
In other words, this approach supports decentralization and in turn local community
involvement in decision-making processes (Murphy, 1983; 1985). This, in turn, is seen to
contribute to the empowerment of local communities (Sharpley, 2009). With development
being increasingly linked with environmental sustainability, from the late 1980s alternative
development effectively became synonymous with sustainable development (Sharpley, 2009,
p.43).
The word ‘sustainable development’ has been important in discussions about
environmental issues since the mid-1980s. The main focus of sustainable development is on
society, and its aim is to include environmental considerations in the steering of societal
change, especially through changes to the economic activities.

24 R.Mirzaei Chapter two: Literature review
According to Sharpley (2009, p.45) the three key principles underpinning sustainable
development are that
“ (a) an holistic perspective is required, both development and environmental sustainability
are global challenges; (b) the emphasis should be on the long-term future; and (c),
although the focus of development should be people-centered, the challenge is to achieve
both intra and inter-generational equity; development should be fair and equitable for all
people both within and between generations”.
Baker argued that “ adopting sustainable development principles is about steering societal
change at the interface between:
● The society perspectives: this relates to human mores and values, relationships and
institutions.
● The economic perspectives: this concerns the allocation and distribution of scarce
resources.
● The environmental perspectives: this includes the contribution of both the economic and
the social perspectives and their effect on the environment and its resources” (2006, p.7).
These are known as the three aspects of sustainable development (Ekins, 2000), that meets
the needs of the present without compromising the ability of future generations to meet their
own needs (World Commission on Environment and Development, 1987, p.43). Sustainable
development insures that next generations all over the world will have enough resources to
adequately sustain themselves and maintain a reasonable quality of life (Harris, Griffin &
Williams, 2002; Keyser, 2002).
The term ‘sustainable development’, initially offered in the International Union for
Conservation of Nature (IUCN) World Conservation Strategy (IUCN, 1980) and later on
generalized by the Brundtland Report (WCED, 1987). Many tourism scholars and
organizations have outlined sustainable tourism principles and frameworks (Eber, 1992; Gunn,
1988; Inskeep, 1991; Swarbrooke, 1999; Pigram, 1990; Wall, 2005; Wheeler, 2006; WCED,
1987; WTO, 1993).

25 R.Mirzaei Chapter two: Literature review
The fast growth of international tourism after the World War II has resulted in the raising
of concerns over how the cultural and natural environments of destinations are affected by
tourism (Holden, 2000, p.64). As a result, Similar to the trends in development theory of
dissatisfaction with development philosophies (Telfer, 2002), many tourism analysts turn
away from past methods of tourism development in favor of ‘alternative tourism’ (Brohman,
1996a).
Sustainable development defined by the World Commission on Environment and
Development, Brundtland Commission, in 1987 as ‘development that meets the needs of the
present without compromising the ability of future generations to meet their own needs’
(WCED, 1987, p.4). After the Earth Summit held in Rio de Janeiro in 1992, pressure has
grown for the tourism industry to lift its environmental performance in common with other
economic sectors, and to work towards ecologically sustainable forms of tourism development
(Pigram & Wahab, 2005, p. 14).
The core notion of sustainability is to consider the capacity of environment and support it
(Jacobs, 1995). UNWTO (2005) suggested sustainable tourism development as:
“Sustainable tourism development guidelines and management practices are applicable to
all forms of tourism in all types of destinations, including mass tourism and the various niche
tourism segments. Sustainability principles refer to the environmental, economic and socio-
cultural aspects of tourism development, and a suitable balance must be established between
these three dimensions to guarantee its long-term sustainability”.
Thus, according to UNEP & UNWTO sustainable tourism should:
- “Make optimal use of environmental resources that constitute a key element in tourism
development, maintaining essential ecological processes and helping to conserve natural
heritage and biodiversity.
- Respect the socio-cultural authenticity of host communities, conserve their built and
living cultural heritage and traditional values, and contribute to inter-cultural understanding
and tolerance.

26 R.Mirzaei Chapter two: Literature review
- Ensure viable, long-term economic operations, providing socioeconomic benefits to all
stakeholders that are fairly distributed, including stable employment and income-earning
opportunities and social services to host communities, and contributing to poverty alleviation.
Achieving sustainable tourism is a continuous process and it requires the constant
monitoring of impacts, introducing the necessary preventive and/or corrective measures
whenever necessary. Sustainable tourism should also maintain a high level of tourist
satisfaction and ensure a meaningful experience to the tourists, raising their awareness about
sustainability issues and promoting sustainable tourism practices amongst them.” (2005, p.11).
The above-mentioned definition is much emphasis on local community and environmental,
social and economic impacts of tourism and their management. Sustainable tourism as an
emerging paradigm seems to enhance the existing conceptual frameworks on tourism planning
and development by making the residents its focal point. Indeed, both direct and indirect
support of community residents’ participation is the foundation of the sustainability paradigm
(Butcher 1997; Hunter 1997; Jamieson & Jamal, 1997).
In recent years, changing attitudes toward the nature of the tourist experience together with
the growing realization that tourism takes place in fragile areas was the notion that it
consumes environmental resources (Mason, 2003). Increasingly, groups of tourists became
more concerned and feel more responsibility about the impacts of their activities were having
on the environment, this led to the growth of what some consider as more environment-
friendly forms of tourism, such as ecotourism (Wearing & Neil, 1999 cited in Mason, 2003).
2.4 Natural areas
The earth includes both land and water environments. Different environments distributed
on the earth according to precipitation and temperature. Each climatic region has different
natural areas including desserts, Steppes, tropical forests, Tundra and Taiga, the Arctic and the
Antarctic. In addition, there are many valuable natural areas which have been designed in form
of under protected areas.

27 R.Mirzaei Chapter two: Literature review
Protected areas defined by IUCN as: “An area of land and/or sea especially dedicated to
the protection and maintenance of biological diversity, and of natural and associated cultural
resources, and managed through legal or other effective means” (IUCN, 1994).
IUCN nominates a six category system of protected areas (IUCN, 1994). Table 2.3 shows
that some kinds of tourism activities are eligible in every category of protected areas. It also
shows that although biodiversity protection is a critically important function of many protected
areas, it is not the only purpose and is often not the primary purpose of a protected area
(Eagles, McCool & Haynes, 2002, p.11). Protected areas are to conserve nature and at the
same time prepare humans opportunities for recreation, inspiration, education and
understanding (Newsome, Moor & Dowling, 2002).
Table 2.3 IUCN management categories of protected areas
Category Description
I Strict Nature Reserve/Wilderness Area: Protected area managed mainly for science or
wilderness protection
Ia Strict Nature Reserve: Protected area managed mainly for science.
Ib Wilderness Area: Protected area managed mainly for wilderness protection.
II National Park: Protected area managed mainly for ecosystem protection and recreation.
III Natural Monument: Protected area managed mainly for conservation of specific natural features.
IV Habitat/Species Management Area: Protected area managed mainly for conservation through
V Protected Landscape/Seascape: Protected area managed mainly for landscape/seascape
conservation and recreation.
VI Managed Resource Protected Area: Protected area managed mainly for the sustainable use of
natural ecosystems.
Source: IUCN, 1994
After the industrial revolution, the livelihood pattern shifted from rural to urban and man
was more distanced from the nature. The process of urbanization lead to removing people
from nature and one strategy for being close to nature is tourism (Holden, 2000). That is why
natural destinations and activities associated with natural environment has been increasingly
popular (Tourism Canada, 1995).

28 R.Mirzaei Chapter two: Literature review
2.4.1 Nature-based tourism
Nature-based tourism growing by an estimated 10 to 30 percent per annum is one of the
fastest growing sectors in the tourism industry (Mckercher, 1998). It takes place in natural
areas. Many visitors including those who are environmentally sensitive and a wide range of
other type of tourists visit these areas (Arnegger, Woltering & Job, 2010; Ryan, Hughes &
Chirgwin, 2000; Wheeller, 2006).
Nature-based tourism is defined as any non-consumptive or consumptive tourist activity
(Shafer & Choi, 2003) that takes place in natural settings, tourism that based on the specific
aspects and elements of the natural environment and tourism that is developed in order to
conserve and sustain natural areas (Hall & Boyd, 2005). In its broadest sense, nature-based
tourism involves experiencing natural places, typically through outdoor activities (Tourism
New South Wales, 2006, p. 1).
According to Goodwin “Nature, or nature-based, tourism encompasses all forms of tourism
- mass tourism, adventure tourism, low-impact tourism, ecotourism - which use natural
resources in a wild or undeveloped form- including species, habitat, landscape, scenery and
salt and fresh-water features” (1996, p.287). Hall and Weiler (1992, p.143) defined nature-
based tourism as “a broad spectrum of touristic activities, often commercialized and involving
an interaction with the natural environment away from the participant’s home range.”
Nature-based tourism encompasses a broad scope including adventure tourism, ecotourism,
alternative tourism, educational tourism, sustainable tourism, responsible tourism and many
other forms of non-mass tourism (McKercher, 1998, p. 1). Therefore, Nature-based tourists
cannot be sorted in one group because their activities and characteristics may overlap with
other forms of tourism (Weaver, Faulkner, & Lawton, 1998). Table 2.4 shows different forms
of nature-based tourism.
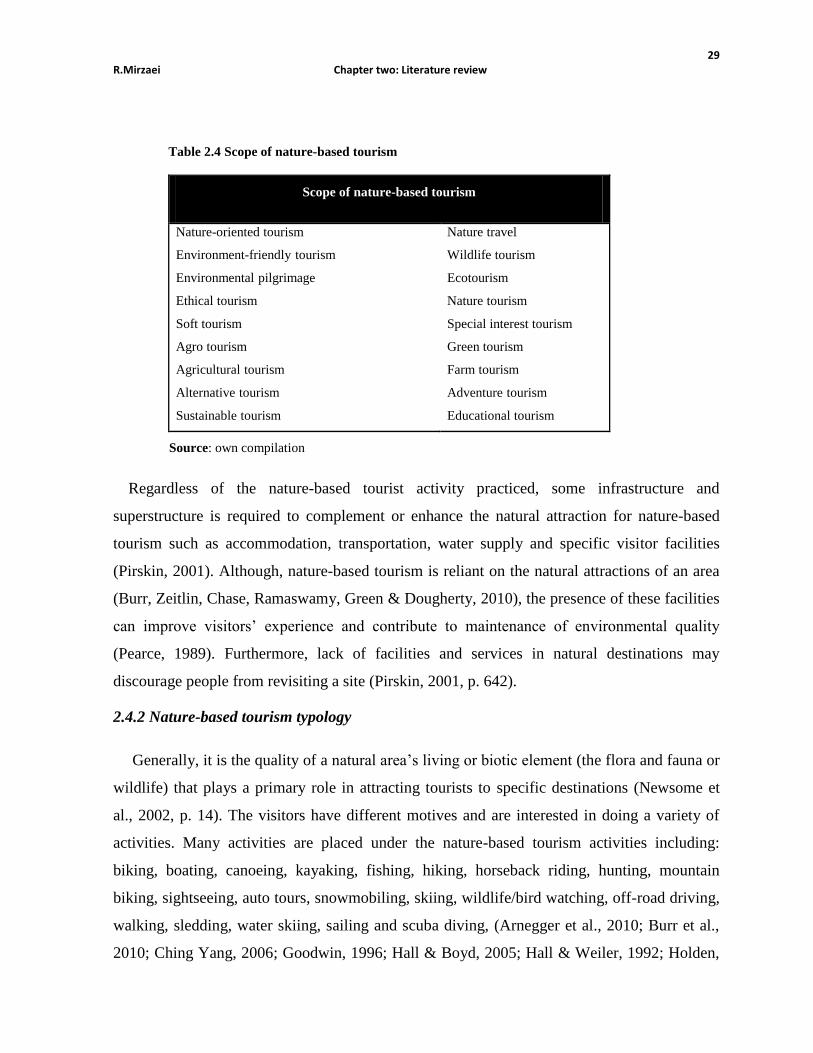
29 R.Mirzaei Chapter two: Literature review
Table 2.4 Scope of nature-based tourism
Scope of nature-based tourism
Nature-oriented tourism
Environment-friendly tourism
Environmental pilgrimage
Ethical tourism
Soft tourism
Agro tourism
Agricultural tourism
Alternative tourism
Sustainable tourism
Nature travel
Wildlife tourism
Ecotourism
Nature tourism
Special interest tourism
Green tourism
Farm tourism
Adventure tourism
Educational tourism
Source: own compilation
Regardless of the nature-based tourist activity practiced, some infrastructure and
superstructure is required to complement or enhance the natural attraction for nature-based
tourism such as accommodation, transportation, water supply and specific visitor facilities
(Pirskin, 2001). Although, nature-based tourism is reliant on the natural attractions of an area
(Burr, Zeitlin, Chase, Ramaswamy, Green & Dougherty, 2010), the presence of these facilities
can improve visitors’ experience and contribute to maintenance of environmental quality
(Pearce, 1989). Furthermore, lack of facilities and services in natural destinations may
discourage people from revisiting a site (Pirskin, 2001, p. 642).
2.4.2 Nature-based tourism typology
Generally, it is the quality of a natural area’s living or biotic element (the flora and fauna or
wildlife) that plays a primary role in attracting tourists to specific destinations (Newsome et
al., 2002, p. 14). The visitors have different motives and are interested in doing a variety of
activities. Many activities are placed under the nature-based tourism activities including:
biking, boating, canoeing, kayaking, fishing, hiking, horseback riding, hunting, mountain
biking, sightseeing, auto tours, snowmobiling, skiing, wildlife/bird watching, off-road driving,
walking, sledding, water skiing, sailing and scuba diving, (Arnegger et al., 2010; Burr et al.,
2010; Ching Yang, 2006; Goodwin, 1996; Hall & Boyd, 2005; Hall & Weiler, 1992; Holden,

30 R.Mirzaei Chapter two: Literature review
2000; McKercher, 1998; Ryan et al., 2000; Weaver et al., 1998). Table 2.5 illustrates the
categorization of nature-based tourism activities.
According to Wearing and Neil (2009), nature-based tourism includes activities for which
the natural setting is the basis, those that are reliant on nature and those that are enhanced by
nature. Although, nature-based tourism tends towards small-scale tourism, embraces the
sustainable approach and fosters ‘responsible tourism’, but it can become mass tourism in
many natural areas (Newsome et al., 2002, p.13).
Table 2.5 Nature-based tourism activities
Activities examples
Adventure Hiking, orienteering, backpacking, mountain climbing, rock climbing,
caving, horseback riding, off-road driving, rafting
Water based Rafting, Boating, Sailing, Canoeing, Kayaking, Rowing, Floating, Sail
board, Wind surfing, Water skiing, Snorkeling, Scuba diving, Swimming,
Hard and consumptive Hunting (big and small game, birds), Fishing
Fitness Biking, Walking, jogging
Viewing Wildlife viewing, Bird watching, Fish viewing, Sightseeing
Snow and ice related Skiing, Snowboarding, Snowmobiling,
Outdoor Camping, Picnicking
Source: own compilation
2.5 Ecotourism
Ecotourism is one of the most popular forms of nature-based tourism (Buckley, 2009). It
tries to limit the negative impacts of large scale tourism on host communities and ecosystems
(Stronza & Durham, 2008). Increasingly ecotourism has been described as a form of nature-
based tourism (Dittmann, 2013), that represents or at least promotes, sustainable forms of
tourism (Simmons & Becken, 2004). According to this point of view, ecotourism has been
defined by Ceballos-Lascurain (1996, p.14) as:
“environmentally responsible travel and visitation to relatively undisturbed natural areas, in
order to enjoy and appreciate nature (and any accompanying cultural features – both past and
present) that promotes conservation, has low visitor impact, and provides for beneficially
active socioeconomic involvement of local populations”.

31 R.Mirzaei Chapter two: Literature review
The international ecotourism society (1991a, b) defined ecotourism as responsible travel to
natural areas which conserves the environment and improves the well-being of local people.
Ross and Wall (1999) and Pedersen (1991) proposed five functions for ecotourism; (I)
protection of natural areas (II) education (III) generation of money (IV) quality tourism and
(V) local participation. These functions are basic elements in almost all different definitions of
ecotourism.
While conservation may be important to nature-based tourism in the long run, it is not as
critical to the tourist activity as it is in ecotourism (Burr et al., 2010). Ecotourism can be
described as a sustainable form of nature-based tourism (Arnegger et al., 2010). The terms
nature-based tourism and ecotourism are often used interchangeably (Mehmetoglu, 2007;
Arnegger et al., 2010) despite ecotourism is one form, a sustainable form, of nature-based
tourism.
Fennel (2008) suggests that ecotourism involves those form of tourism which is more
dependent upon nature and natural areas as the main attraction or motivator for travel than
cultural resources. A number of scholars have criticized ecotourism. Wheeler (1993, cited in
Mason, 2008, p.117) argued about ecotourism “it is more likely to make the ecotourist feel
better about their involvement than actually bring benefits to the environment and local
communities.” According to Butler (1991), all forms of tourism in the long term to go
unsustainable and towards mass tourism. Figure 2.3 depicts an overview of nature-based
tourism and ecotourism.

32 R.Mirzaei Chapter two: Literature review
Figure 2.3 Overview of nature-base tourism and ecotourism
Source: own compilation
Despite much debate over the concept of ecotourism, conflicting viewpoints about the term
and its applications have obstructed the development of the concept and its practical
realization in many destinations (Bottrill & Pearce, 1995; Malloy & Fennell, 1998; Lindberg
et al., 1997; Nelson, 1994; Ross & wall, 1999 a; Scace, 1992).
Limited evidence is available concerning whether a site is meeting the multiple goals
associated with ecotourism or not (Ross & Wall, 1999b). Therefore, terms such as responsible
tourism and ecotourism may be little more than marketing brands which appeal to consumers
Nature-based tourism:
Wildlife T
Marine/Water T
Adventure T
Tourism in natural
setting
Agri, Rural, Farm T
Tourism
Alternative Tourism Mass Tourism
Nature-based tourism:
Wildlife T
Marine/Water T
Adventure T
Tourism in natural
setting
Agri, Rural, Farm T
Ecotourism

33 R.Mirzaei Chapter two: Literature review
and this in turn may help sell more holidays (Fennell, 1999; Mason, 2008; Mason &
Mowforth, 1996; Ross & Wall, 1999 a).
2.6 Nature-based tourism impacts
Tourism as a human activity takes place in the space and environment. Human activities,
including tourism, have environmental, socio-cultural and economic impacts. The significance
of tourism industry to local economies is likely to increase and most importantly effects local
community (Lankford, Williams & Knowles-Lankford, 1997).
The rapid growth in the number of visitors after World War II has resulted in the rising of
concerns over the impacts of tourism on cultural and physical environment (Holden, 2000). In
fact, tourism development bring with it inevitable positive and negative impacts (McKercher,
1993) which arise from interrelationship between host communities, visitors and natural
environment (Lindberg, Andersson & Dellaert, 2001; Mathieson & Wall, 1982). These
impacts sometimes are very noticeable and evident in destination areas where visitors have
interaction with local society in forms of economic, socio-cultural or environmental activities.
The nature of tourism impacts is depend on different factors, including type of tourism, the
place where it is happening, when it is happening, as well as infrastructures of the area
(Mason, 2008) and tourism superstructures. Therefore, it is important to consider different
characteristics of tourism industry, tourists and local population. McKercher (1993) supposed
some “fundamental truths” about tourism as major influences on tourism impacts (table 2.6).
He discussed that these structural realities explain why many of socio-cultural, economic, and
environmental impacts of tourism are inevitable.

34 R.Mirzaei Chapter two: Literature review
Table 2.6 some fundamental truths about tourism
Statement
- As an industrial activity, tourism consumes resources, creates waste and has specific
infrastructure needs.
- As a consumer of resources, it has the ability to over consume resources.
- Tourism, as a resource dependent industry must compete for scarce resources to ensure its
survival.
- Tourism is a private sector dominated industry, with investment decisions being based
predominantly on profit maximization.
- Tourism is a multi-faceted industry, and as such, it is almost impossible to control.
- Tourists are consumers, not anthropologists.
- Unlike other industrial activities, tourism generates income by importing clients rather
than exporting its product.
- Tourism is entertainment
Source: McKercher (1993, p.7)
In a sustainable tourism development, attention should be given to the impact of tourism on
the community as a whole and the individuals who form that community (Fredline, Deery &
Jago, 2006). Local communities in tourism destinations are affected by tourism. These include
an increased number of people, increased use of roads, and various economic and
employment-based effects (Gursoy, Jurowski & uysal., 2002).
In recent years more studies have focused on host communities’ perception and attitudes
towards tourism impacts and development (Allen, Hafer, Long, & Perdue, 1994; Allen, Long,
Perdue & Kieselbach, 1988; AP & Crompton, 1993, 1998; Avcikurt & Soybali, 2001; Belisle
& Hoy, 1980; Brant & Courtney, 1999; Brayley, 2000; Carmichael, 2000; Doxey, 1975;
Fredline & Faulkner, 2000; Gursoy et al., 2002; Gursoy, Chen & Yoon, 2000; Hudman &
Hawkins, 1989; Huh & Vogt, 2008; Iroegbu & Chen, 2001; Johnson, Snepenger & Akis,
1994; Jurowski, Uysal, &Williams, 1997; Kang, Long, & Perdue, 1996; Kaul, 1985; Kayat,
2002; Lankford, 1994; Lankford & Howard, 1994; Lankford et al., 1997; Lindberg et al.,
2001; Liu, Sheldon & Var, 1987; Maddox, 1985; Mason & Cheyne, 2000; McCool & Martin,
1994; McKercher, 2001; Mill & Morrison, 1985; Murphy, 1981, 1983; Pizam, Milman &
King, 1994; Ross, 1992; Snaith & Haley 1995, 1999; Ryan & Montgomery, 1994; Walpole &
Goodwin, 2001; Yoon, Chen & Gursoy, 1999).

35 R.Mirzaei Chapter two: Literature review
According to studies in the field of tourism impacts, host communities are influenced by
the perceived impacts of tourism in three main categories of benefits and costs: economic,
environmental and sociocultural (Ching Yang, 2006; Gee, Mackens & Choy, 1989; Jafari,
1973; Kang et al., 1996; Liu, Var & Timur, 1987; Long, Perdue & Allen, 1990; Medlik, 2003;
Pizam, 1978; Stokowski, 1996; Young, 1973). It is usually difficult and undesirable to try to
separate socioeconomic and physical components of environment (Inskeep, 1991, p. 339). In
almost all studies on tourism impacts separate examination of these components is made. On
the other hand, there are close interrelationships between sociocultural and economic impacts
(Inskeep, 1991) therefore, in this study impacts of tourism have been examined in the form of
environmental and socioeconomic.
2.6.1 Environmental impacts of nature-based tourism
Environment is a fundamental component of tourism (Holden, 2000) and acting as a major
attraction for tourists. According to Inskeep the “tourism-environment relationship has three
aspects:
- Many features of physical environment are attractions for tourists.
- Tourist facilities and infrastructure constitute one aspect of built environment.
- Tourism development and use of tourist use of an area generate environmental
impacts.” (1991, p. 339).
After World War II and beginning of mass tourism in 1950s, the relationship between
tourism and environment has been unstable and tourism has become one of the main causes of
environmental damage (Mason, 2003). Since tourism usually developed in vulnerable
environment such as mountain and marine areas, islands and historical sites visitors’ activities
potentially can led to huge damages to environment (Andriotis, 2000).
Environment has different aspects which according to Swarbrooke (1999) (figure 2.4) these
aspects are: the natural resources, farmed environment, built environment, natural
environment and wildlife. It should be noticed that the five aspects are related to each other
and working as a system. It means that when actions taken in one part of the system have
consequences for its other component parts (Holden, 2000), as a result the overall impact on

36 R.Mirzaei Chapter two: Literature review
environment can be much more intense. Since tourists use all different aspects of environment,
tourism impacts on the environment can be very widespread.
Figure 2.4 Components of environment
Source: Swarbrooke, 1999
Depends on where, when and how tourism activities take place (Mason, 2003) and type
and intensity of tourism development, the type and extent of tourism impacts will be different
(Inskeep, 1991). Tourism has positive, negative and even no environmental impacts depending
on its type of planning and management (Inskeep, 1991). Tourism in developed destinations,
which are managed according to sustainable development principles, can generate positive
environmental impacts.
Positive impacts are stimulate activities, which can protect environment, landscape, and
wildlife; support conservation of natural and cultural monuments, promote establishment of
protected areas and national parks; generate income for maintain under protected areas.

37 R.Mirzaei Chapter two: Literature review
Negative environmental impacts of NBT have been mentioned as traffic congestion; air,
water and environment pollution; footpath erosion; drop litter; environment and habitat
degradation; disturb natural landscapes and land use problems. Table 2.7 shows the items used
for assessing residents’ perception of environmental impacts of tourism
Table 2.7 Environmental impacts of nature-based tourism
NO. Environmental impacts of tourism References
1 Traffic congestion 1,2,3,5,6,7,8,9,10,11,12,13,16,17,18,21,22,23
,26,27,28,29
2 Tourism has not contributed to a decline in the
ecological environment (or damage to natural areas)
1,2,6,11,12,13,26,28
3 Tourism provides an incentive for conservation of
natural resources
3,13,14,18
4 Construction of hotels and other tourist facilities has
destroyed the natural environment
3,13,14,29
5 Tourist increases litter in area (environmental
contamination)
4,5,9,11,12,13,16,17,18,21,26,27,28,29, 30
6 Tourist increases noise 4,5,10,12,13,16,17,21,26,28,29,30
7 Preserves environment and improves the appearance (
image) of an area
12,18,20,24
8 Improves living utilities infrastructure (supply of water,
electric and telephone)
12,13,15
9 Improves public facilities (pavement, traffic network
and civic center)
12,13,15
10 Tourism helps to increase local awareness and
appreciation of the environment
13,15
11 Quality of garbage disposal 17, 19
1: Sheldon & Var (1984); 2: Liu & Var (1986); 3: Akis et al. (1996); 4: Lankford et al. (1997); 5: Duffield
(1982); 6: Chris choi & Sirakaya (2005); 7: Pizam & Pokela (1985); 8: Tosun (2002); 9: McGehe & Andereck
(2004); 10: Ap & Crompton (1998); 11: Gilbert & Clark (1997); 12: Wanko & Stewart (2002); 13: Sanchez,
Meji & Bueno, (2009); 14: Andriotis & Vaughan (2003); 15: Sirakaya, Teye & Somez, (2002); 16: Pizam
(1978); 17: Caneday & Zeiger (1991); 18: Andereck & Vogt (2000); 19: Belisle & Hoy(1980); 20: Allen et al.
(1988); 21: Kavallinis & Pizam (1994); 22: Milman & Pizam (1988); 23: King, Pizam & Milman, (1993);
24: Perdue, Long & Allen, (1987); 25: Ross (1992); 26: Williams & Lawson (2001); 27: Ritchie & Inkari (2006);
28: Tovar & Lockwood (2008); 29: Chen (2001); 30: Lankford & Howard (1994).
38 R.Mirzaei Chapter two: Literature review
2.6.2 Socioeconomic impacts of nature-based tourism
Like environmental impacts, the type and extent of socioeconomic impacts depends on the
type and scale of tourism development, on the socio-demographic and economic
characteristics of host communities and how tourism is planned, developed, and managed
(Inskeep, 1991, p. 366). However, it should be noted that tourism development, as is the case
with other forms of development, brings inevitable changes for the societies. These changes
are not essentially negative but can help to establish sustainability in societies (Mason, 2003).
Socioeconomic impacts have been more researched than environmental impacts (Mason,
2008). In past years many researchers concentrate on socioeconomic impacts of tourism
(Andriotis, 2000; Archer, 1977, 1982, 1988, 1995; Archer & Fletcher 1988, 1990, 1996;
Baretje, 1982; Buckley & Geyikdagi, 1993; Edgell, 1990; Gould, 1994; Hughes, 1983;
Inskeep, 1991; Jackson, 1986; Jenkins, 1997; Mathieson & Wall, 1982; Oosterhaven & van
Der Knijff, 1988; Pizam & Milman, 1986; Richards, 1983; Ruiz, 1985; Seward & Spinard,
1982; Sinclair, 1991, 1998; Singh, 1984; Smith, 1995; Smith & Jenner, 1992; Telfer & Wall,
1996; Teye, 1987; Wanhill, 1988; WTTC, 1995).
Early studies on socioeconomic impacts were concentrated on positive economic impacts
of tourism (Ap, 1992; Jafari, 1987; Mathieson & Wall, 1982; Pizam, 1978). This period
coincided with the optimistic viewpoints to tourism development in 1960s. However, after the
occurrence of negative impacts of tourism in many destinations in 1970s, the consequences of
tourism were examined more critically by anthropologists and sociologists (Ap, 1992).
Tourism impacts often results from host-tourist interactions. According to Inskeep, specific
types of impacts results from host community-tourists interactions can be categorized as
following:
- ‘Some types of socioeconomic impacts are the normal changes resulting from tourism
development even in domestic tourism that tourists and local community are of the same
culture.
- Other impacts results from socioeconomic differences between tourists and host
communities of either the same or different cultural background.

39 R.Mirzaei Chapter two: Literature review
- The impacts result from considerable cultural differences between host communities and
tourists’ (1991, p. 366-368).
Another factor that intensifies the host community-tourist interaction is that there are
several tourist cultures and there may be different host cultures, all of which may interact with
one another (Inskeep, 1991).
Tourism can generate both positive and negative socioeconomic impacts. Positive types of
socioeconomic impacts include economic benefits, conservation of cultural heritage, renewal
of cultural pride, cross-cultural exchange (Inskeep, 1991). Lack of system approach in tourism
planning can result in generating negative impacts including loss of potential economic
benefits, economic and employment distortions, overcrowding and loss of amenities for
residents, cultural impacts and social problems (Inskeep, 1991).
The degree to which impacts of tourism influence local communities depend on a number
of factors including the area which tourism taking place, the number and type of tourists,
activities of tourists, infrastructure exists for tourism development, since when tourism has
been established and the pace of development. Mathieson and Wall argued that ‘the social and
cultural impacts of tourism are the ways in which tourism is contributing to changes in value
systems, individual behavior, family relationships, collective lifestyles, safety levels, moral
conduct, creative expressions, traditional ceremonies and community organizations’ (1982,
p.133).
As Mason (2003) suggest positive socioeconomic impacts of tourism on society are job
creation, the recovery of poor regions, the revival of local arts, handicrafts and traditional
cultural activities, social and cultural life of the local population, the renewal of local
architectural traditions, and the encouragement of the need to conserve areas of exceptional
beauty which have aesthetic and cultural value. Tourism has some negative socio-cultural
impacts including demonstration effect and acculturation (Mason, 2008).
Table 2.8 shows the items used for assessing residents’ perception of socioeconomic
impacts of tourism in previous studies.

40 R.Mirzaei Chapter two: Literature review
Table 2.8 Items used for assessing socioeconomic impacts of tourism
NO. Socioeconomic impacts of tourism References
1 Tourist spoils natural and historic sites (or improve it) 1,6,13,15,18,19,27
2 Tourism causes changes in traditional cultures 1,3,9,13,16,17,18,26,29
3 Tourism increases drug addiction 1,2,7,8,16,17,19,22,23,27
4 Opportunity to learn from tourists (language,…) 1,2,19
5 Tourism provides more job opportunities 1,2,4,5,7,8,9,10,11,12,13,15,16,17,19,
20,22,23,26,27,28,29,30
6 Presence of recreational facilities and spaces 1,2,3,4,5,7,9,12,13,16,17,18,20,25,26,
27,28,30
7 Public facilities are kept in good condition because of tourism
(roads,
1,2,3,4,7,9,13,17,19,26,28,30
8 Tourists disrupt the peace and tranquility of public parks 1,2,10,15,28,30
9 Tourism has resulted in unpleasantly overcrowded beaches,
footpaths, parks and outdoor places
1,2,3,6,9,10,11,13,15,17,19,24,28,29,3
0
10 Tourism encourages a variety of cultural activities by the local
population (crafts, arts, music)
1,2,9,12,13,14,18,26,27,29
11 Tourists’ keen interest in natural and cultural sites result in
these sites are cared for than they otherwise would be.
1,9,11
12 Tourism led to more vandalism in area 1,2,5,9,12,13,16,17,18,29
13 Tourism prevents local language from being use as much as it
otherwise would
1
14 Tourism results in more cultural exchange between local
community and tourists, which give residents a better
understanding about world
1,2,9,11,15,16,18,26,29
15 Standard of living increases considerably because of the
money that tourists spend in area (quality of life)
2,3,4,5,7,8,9,11,12,13,14,17,18,19,22,
23,24,27,29,30
16 Prices of many goods and services in area have increased
because of increases in tourism
2,3,4,5,7,9,11,12,13,14,15,16,17,18,19
,20,25,26,27,28
17 Tourism could create a positive feeling about area among
tourists
2,8,9,15,18,28
18 Opportunity for local community to learn about other cultures 1,2,5,10,12,16,26,29
19 Meeting tourists from all over the world is definitely a
valuable educational experience
1,2,3,29
20 Local businesses are the ones which benefit most from tourists 2
21 Tourists have a positive impact on the area’s cultural identity 2,9,10,13,26,27,29
22 The state of area’s (Mazandaran) residents are courteous and
friendly to tourists
2,8,11
23 Tourism has led to more prostitution 2,7,12,13,15,16,17,19,22,23
24 The local residents are the people who really suffer from living
in a tourist area (have lower quality of life)
1,2,3,6,13,15,27,29
25 The different types of culture that tourists bring to the area are
more important than the social costs created by tourism
2
26 Because of tourists the crime rate in area (Mazandaran) has
increased
2,4,7,8,9,11,12,18,19,22,23,24,25,26,2
7,30
27 During the peak tourist season it is harder to get tickets for the 2,6,10,15

41 R.Mirzaei Chapter two: Literature review
1: Sheldon & Var (1984); 2: Liu & Var (1986); 3: Akis et al. (1996); 4: Lankford et al. (1997); 5: Duffield
(1982); 6: Chris choi & Sirakaya (2005); 7: Pizam & Pokela (1985); 8: Tosun (2002); 9: McGehe & Andereck
(2004); 10: Ap & Crompton (1998); 11: Gilbert & Clark (1997); 12: Wanko & Stewart (2002); 13: Sanchez,
Meji & Bueno, (2009); 14: Andriotis & Vaughan (2003); 15: Sirakaya, Teye & Somez, (2002); 16: Pizam
(1978); 17: Caneday & Zeiger (1991); 18: Andereck & Vogt (2000); 19: Belisle & Hoy(1980); 20: Allen et al.
(1988); 21: Kavallinis & Pizam (1994); 22: Milman & Pizam (1988); 23: King, Pizam & Milman, (1993);
24: Perdue, Long & Allen, (1987); 25: Ross (1992); 26: Williams & Lawson (2001); 27: Ritchie & Inkari (2006);
28: Tovar & Lockwood (2008); 29: Chen (2001); 30: Lankford & Howard (1994).
theater, movies, concerts and athletic events
28 Local community are being exploited by tourism 2,9,28,13,18
29 Tourism creates more jobs for foreigners than local
community
3,13,14
30 Tourism gives benefits to a small group of people in the region
3,13,14,15,18,26,28
31 High-spending tourists have an undesirable effect on our way of life
3,29
32 As a result of tourism I have more money to spend(more income)
4,5,8,10,12,17,26,29,30
33 Police protection is better 4,12,13,16,17,18
34 Increases cost of land and housing 7,11,12,13,16,17,19,24,27,28
35 Cost of public services 7,13
36 Tourists negatively affect a community’s way of life (or positively)
9,18,19
37 Tourism development improves the appearance of an area 9,28
38 Tourism has led to an increase of infrastructure for local people
14
39 It is associated with some people behaving inappropriately, perhaps in a rowdy or illegal way
28
40 Tourism makes local residents feel more proud of their town and makes them feel good about themselves and their community
28

42 R.Mirzaei Chapter two: Literature review
Based on literature review, in this study tourism impacts were categorized into
environmental and sociocultural. Figure 2.5 depicts positive and negative tourism impacts.
Figure 2.5 Impacts of tourism
Source: our compilation
Tourism Impacts
Environmental Socioeconomic
- Contribute environmental
awareness
- Provide financial resources for
conservation
-Increase traffic problems
- Increase pollution
- Increase noise
- Environment deterioration
-
- Increase job opportunities
- Increase recreational facilities
- Encourage cultural activities
- Environment deterioration
- Rebirth of local arts
- Provide financial resources for
conservation
- Increase cost of living
- Increase crime rate

43 R.Mirzaei Chapter two: Literature review
2.7 Factors affecting perceived impacts of NBT
Perceived impacts of NBT have been studied by many researchers. During the last decades,
examining the factors that are likely to influence perceived impacts of tourism also have been
a growing area of research (Gursoy & Rutherford, 2004).The factors that influence the
perception of local population toward tourism development and its impacts can be classified
under the following headlines.
2.7.1 Socio-demographic characteristics
The relationship between socio-demographic characteristics and attitudes towards tourism
impacts and development were assessed by a number of scholars (Andriotis, 2004; Andriotis
& Vaughan, 2003; Brougham & Butler, 1981; Chen, 2000, 2001; Ching Yang, 2006; Davis,
Allen & Cosenza, 1988; Haralambopoulos & Pizam, 1996; Harrill, 2004; HSU, 1998;
Inbakaran & Jackson, 2003, 2004; Jackson & Inbakaran, 2006; Johnson et al., 1994 ;
Lankford, 1991; Liu & Var, 1986; Madrigal, 1993,1995; Mason & Cheyne, 2000; Milman &
Pizam, 1988; Perdue, Long & Allen, 1990 ; Pizam, 1978; Ritchie, 1988; Sirakaya et al., 2002;
Tomljenovic & Faulkner, 1999; Williams & Lawson, 2001).
Findings of these studies vary and no clear trend can be identified, but the main
independent variables for analyzing demographic and socioeconomic factors are age, gender,
level of education, occupational situation, length of residence in the area and level of income.
Tomljenovic and Faulkner’s (1999) examined residents’ attitudes in Gold Coast in
Australia found that older residents were less concerned about tourism’s negative
environmental impacts and generally had more positive attitudes toward tourism development
than young residents had.
The Andriotis (2004) study on Cretan residents showed that the two most important
discriminators of residents’ attitudes toward tourism were education and reliance on tourism
employment. Highly educated residents were more negative about the impacts of tourism on
the environment. Those who were relying on tourism employment believed that tourism brings
benefit to the whole community.
44 R.Mirzaei Chapter two: Literature review
Chen (2001) supposed that demographic characteristics influence residents’ perceptions of
tourism impacts. He argued that wealthier residents tended to view tourism more positive. On
the other hand, findings of Johnson et al., (1994) and Perdue et al., (1990), revealed that rural
communities apart from socio-demographic characteristics have a tendency to perceived
impacts of tourism development in similar way.
In another study, Andriotis and Vaughan (2003) discussed that among the socio-
demographic variables education and employment in tourism sectors affecting the attitudes of
residents towards tourism development. According to their findings, highly educated residents
are less favorable towards tourism impacts and more likely to be concerned about negative
social and environmental impacts of tourism and medium educated residents are probably to
be more supportive of tourism development. Furthermore, residents reliant to tourism jobs had
more favorable attitudes toward tourism development. In their study, no important relation
between other variables including age, gender, income, place of residence, length of residence
and perceived tourism impacts were found.
Jackson and Inbakaran (2006) who evaluated residents’ attitudes toward tourism
development in Regional Victoria, Australia, noted that there were no relationships between
socio-demographic variables and negative perceived impacts but they founded significant
relationships between demographic indicators and support for tourism development. They
argued that male, single, older, educated and long term residents are likely to be more
supportive for tourism development and those who are not directly involve in tourism sector
are more likely to be involved in tourism promotion than the residents with some tourism jobs
connection. In addition, those who are female, mid-30s years old, married and without strong
business connection to tourism are act positively or negatively in response to tourism
development.
Mason and Cheyne (2000) found that, while women appreciated positive impacts,
including the provision of a community facility and benefits by tourism, to a greater extent
than men, they were more opposed to tourism development because of the perceived negative
impacts.
Williams and Lawson (2001) examined residents’ perceptions of the effects of tourism on
their community. They segmented the sample into four different opinion groups by using

45 R.Mirzaei Chapter two: Literature review
cluster analysis. According to their findings those residents least in favor of tourism consider
great importance for the community related issues than the other residents. They found no
relationship between socio-demographic characteristics and perceived tourism impacts.
Ritchie and Inkari (2006) conducted a study in the Lewes District of southern England.
They examined attitudes of the host community towards tourism development. According to
the results of their study, levels of income and proximity to the tourist center were major
influencing factors. The Haralambopoulos and Pizam (1996) study in Greek island of Samos
showed that younger residents have more positive perceptions towards the tourism
development.
2.7.2 Community concern
Previous research suggests that the level of concern about the community is likely to
affects the perception of tourism impacts and support for tourism development (Allen et al.,
1988; Gursoy & Rutherford, 2004; Gursoy et al, 2002; Perdue et al., 1990). Concerns about
local issues such as the environment, educational and health status, security and recreational
opportunities may affect the perceived overall positive and negative impacts of tourism
(Gursoy et al., 2002).
According to Gursoy and Rutherfod (2004, p. 511), residents with a higher level of
concerns about their community and community issues are more likely to perceive tourism as
creating economic and cultural benefits for their community. Gusoy et al. (2002) suggested the
greater the concern the residents feel for their community, the more they support tourism
development.
2.7.3 Community attachment
The community attachment measures level of social bonds such as social participation,
friendships (Gursoy et al., 2002) and host community’s sentiments toward their community
(Jurowski et al., 1997).
A number of scholars have suggested that attachment to the community is one of the
factors that affects people’s perception of tourism impacts and in turn their support for tourism

46 R.Mirzaei Chapter two: Literature review
development (Gursoy & Rutherford, 2004; Gursoy et al., 2002; Jurowski et al., 1997; Mason
& Cheyne, 2000; McCool & Martin, 1994; Um & Crompton, 1987; Williams et al., 1995).
The results of the study conducted by Jurowski et al. (1997) showed a direct relationship
between community attachment ant perceive economic, social and environmental impacts of
tourism.
Gursoy and Rutherford (2004, p. 510) found that people who are more attached to their
community are more likely to view tourism as having positive economic and social impacts.
Their Findings also suggested residents who are highly attached to their community are more
likely to view the state of the local economy favorably than residents who are not highly
attached.
Mason and Cheyne (2000) studied residents’ attitudes in a rural area in New Zealand,
reported relation between levels of community attachment and perceived positive and negative
impacts of tourism. In a study of New Braunfels, Texas, Um and Crompton (1987) found
there were significant negative correlations between residents’ perceptions of overall tourism
impacts and their attachment level. The more attached residents were to the community the
less positively they perceived impacts of tourism. Findings of the studies conducted by
Williams et al. (1995) and McCool and Martin (1994) were proposed similar results.
McCool and Martin (1994, p. 33), suggested people highly attached to communities viewed
the costs and impacts of tourism with more concern than those relatively unattached.
2.7.4 Utilization of tourism facilities and services
Having the advantage of using tourism facilities and services by residents may affect their
perceptions of tourism impacts and support for tourism development. The may perceived more
positive impacts and support more tourism development if they find tourism as a phenomenon
provides more recreational opportunities for the community (Allen et al., 1994; Gursoy &
Rutherford, 2004; Jurowski et al., 1997). Jurowski et al. (1997) supposed that the resource
user believes that tourism development will bring economic and social benefits to the
community and more importantly, will improve the natural environment.

47 R.Mirzaei Chapter two: Literature review
Gursoy et al. (2002) did not find any relation between utilization of tourism facilities and
the perceived benefits of tourism. Similar to this study, the findings of Gursoy and Rutherford
(2004) also showed that use of tourism facilities and services by residents did not have any
significant relationship with the economic benefits, social costs, social benefits, or cultural
benefits, but is likely to influence the cultural costs of tourism.
Lankford and Howard (1994) argued that perceptions of how tourism affects their own
personal welfare and lifestyle are the main discriminator of the extent to which local residents
accept or reject tourism impacts.
O’Leary suggested that residents who participated in outdoor recreation would have
perceived the negative impacts of tourism higher and the positive impacts lower (cited in
Gursoy & Rutherford, 2004).
2.7.5 General understanding of economic benefits of tourism remaining in the society
Social representation theory is based on the concept that “residents have representations of
tourism which underpin their perception of impacts, formed by direct experiences, social
interaction and other sources of information, such as the media” (Ritchie & Inkri, 2006, p.30).
One of the most important representations for local community is economic benefits of
tourism. This factor is about the residents’ perception of tourism benefits, such as increasing
household income, job opportunities for residents, and those who received these benefits.
General understanding of economic benefits of tourism was examined in few similar
studies as an exogenous variable that affects perceived tourism impacts or support for tourism
development. Jurowski et al. (1997) found a direct positive relationship between economic
gain and support for tourism development. According to their study, potential for economic
gain also positively influences the perceived tourism impacts.
Andriotis (2004) suggested that highly educated Cretan agreed that tourism benefits a small
group of people in the region.
2.8 Community support for tourism development
For successful tourism development, host communities support is critical and tourism must
have the support of local community (Allen et al., 1988; Andereck & Vogt, 2000; Andriotis,

48 R.Mirzaei Chapter two: Literature review
2002; Ap, 1992; Cooke, 1982; Davis & Morais, 2004; Huh & Vogt, 2008; Inskeep, 1991; Ko
& Stewart 2002; Lankford, 1994; McGehee & Andereck, 2004; Murphy, 1985; Ritchie, 1993;
Sirakaya et al., 2002; Williams & Lawson, 2001).
According to what Allen et al. suggest, “for a tourism-based economy to sustain itself in
local communities, the residents must be willing partners in the process. Their willingness to
serve as gracious hosts is critical to the success of tourism. Therefore, residents must be
involved in the planning and they must be informed and consulted about the scope of
development” (1988, p.16).
Study of factors affecting local community’s support for tourism development in past three
decades has been one of the areas of interest for researchers (Huh & Vogt, 2008). These
factors include environmental impacts of tourism (see 2.6.1); socioeconomic impacts of
tourism (see 2.6.2); socio-demographic factors (see 2.7.1); community concern (2.7.2);
community attachment (see 2.7.3); utilization of tourism facilities and services by residents
(see 2.7.4) and general understanding of economic benefits of tourism (see 2.7.5). Figure 3.2,
in chapter three, depicts the proposed model of support for tourism development.
2.9 Modeling local community attitudes toward tourism development
Local community perceptions toward tourism are very important because these perceptions
give shape to the behavior of host communities in relation to tourists and can affect their
satisfaction. “Perceptions rather than reality are what motivate residents to act or not to act in a
certain way” (Andriotis & Vaughan, 2003, p.173). On the other hand, local population
participation and cooperation is a vital factor of successful nature-based tourism development
(Yu, Chancellor, & Cole, 2011). Since local populations’ perception of tourism impacts is one
of the important determinants of successful tourism development, various authors have
discussed about it.
For instance, Chen (2001) assessed tourism impacts from urban residents’ perspective in
southeastern Virginia and revealed four impact factors: economic benefits, social costs,
cultural enrichment, and environmental deterioration and argued that cultural impacts did not
have a direct effect on residents’ support for tourism, but economic and social concerns tended
to have more influences in perceived total tourism impacts.
49 R.Mirzaei Chapter two: Literature review
Lankford (1994) studied attitudes and perceptions of residents in six counties within the
Columbia River Gorge region of Oregon and Washington and stated that the key actors in the
community development process differ significantly with regard to their support for tourism
development and promotion and tourism play a major economic role in the community by
providing jobs.
Lawson, Williams, Young and Cossens (1998) studied residents’ attitude toward tourism in
10 New Zealand destinations. They summarized main influencing factor as follow: guest-host
ratio, perceived cultural or psychic distance between the host and the guest, economic
dependence on tourism, host's control over decision-making, stage of life cycle, degree of
seasonality, type of tourism encountered within the community. They argued that in all studied
areas there is a general belief that tourism is a good thing for New Zealand, especially in the
context of the economy and employment but rather paradoxically, people are less inclined to
admit that tourism has been of real benefit to them.
McCool and Martin (1994) studied community attachment and attitudes toward tourism
development in Montana. They found a significant relationship between length of residency
and attachment and argued that people living in communities with higher levels of tourism
development have the strongest sense of community attachment. People highly attached to
communities viewed the costs and impacts of tourism as well as the equitable sharing of those
costs with tourists with more concern than those relatively unattached (1994, p.33).
Andriotis (2005) conducted a study to measure the perceptions of three Cretan community
groups (reliant to tourism employment, non-reliant residents and tourism business people) by
using social exchange theory as framework and concluded that the three groups expressed a
high degree of positivity toward tourism and tourism development.
McGehee and Andereck (2004) examined the factors predicting rural residents’ attitudes
toward tourism in Arizona using social exchange theory as foundation. They argued that most
of the personal characteristics except age and having lived in the community as child, did not
predict attitudes toward tourism but dependence on tourism was a predictor and the existence
of personal benefit from tourism was not a significant predictor of support for tourism
planning.

50 R.Mirzaei Chapter two: Literature review
Jurowski et al., (1997, p.5) conducted a study in Mt. Rogers National Recreation Area,
southwest Virginia, and developed a model of residents’ support of tourism. Using path
analysis, the primary cause variable were resident perceptions of tourism’s impact, and four
other variables (economic gain, resource use, community attachment and ecocentric attitude)
that the model suggests affect resident perception of the three types of impacts namely
economic, social and environmental impacts and directly and indirectly affect support for
nature-based tourism.
They found that the more potential for economic gain, the more support for tourism
development and more perceived positive tourism impacts. According to their results, the
resource user believes that tourism development will bring economic and social benefits to the
community and more importantly, will improve the natural environment.
Gursoy, Jurowski and Uysal (2002) proposed a model for host community attitudes toward
tourism development according to social exchange theory. Their findings revealed that the
host community perceptions are affected by the level of concern, community attachment, the
degree to which they are environmentally sensitive and the extent they use the same resource
base that tourists use. Their model proposed that support for tourism development is
influenced by the perceptions of its costs and benefits and the state of the local economy. This
model also argued that the state of the local economy influences the perception of the benefits
and costs of tourism development.
Gursoy and Rutherford studied host attitudes toward tourism in Washington and Idaho and
improved the model provided by Gursoy et al. (2002). They proposed that the host community
supporting for tourism development is affected by nine variables: the level of community
concern, ecocentric values, utilization of tourism resource base, community attachment, the
state of the local economy, economic benefits, social benefits, social costs, and cultural
benefits (2004, p.495). Their findings also confirm the usefulness of social exchange theory as
a framework for explaining the host community’s attitudes toward tourism. They segregated
positive and negative impacts into five cost and benefit factors: economic benefits, social
benefits, social costs, cultural benefits, and cultural costs.

51 R.Mirzaei Chapter two: Literature review
Gursoy, Chi and Dyer (2010) studied local residents’ attitudes toward mass and alternative
tourism in Sunshine Coast, Australia. They recognized level of community concern,
community attachment, the degree to which they are environmentally sensitive, use of the
tourism resource base, state of the local economy, and the perceived impacts of tourism
development as the important factors that affect local community support for tourism
development.
They proposed a model according to Gursoy and Rutherford (2004) which stated that the
perceptions of economic benefits, social benefits, social costs, socioeconomic costs, cultural
benefits, and the state of the local economy are the important factors for local residents’
support for tourism development. They also recognized community concern, community
attachment, sensitivity to environment and the extent of using tourism resources as the
important variables that have influence on local perceptions of tourism
In the tourism research, two frameworks have dominated in community attitudinal
research: social exchange theory and social representations theory (Andriotis & Vaughan,
2003). The social exchange theory frequently guides empirical research on tourism impacts,
other important theories and conceptual frameworks e.g., the hierarchy of needs and the
irritation index (Chen, 2001). This study use social exchange theory as framework.
2.10 Social exchange theory (SET)
SET has emerged in 1920s (Cropanzano & Mitchell, 2005). This theory has roots in
sociology (Blau, 1964), social psychology (Homans, 1958; Gouldner, 1960), anthropology
(Firth, 1967) and microeconomics. Social exchange “refers to voluntary actions of individuals
that are motivated by the returns they are expected to bring and typically do in fact bring from
others” (Blau, 1964, p.91). These actions involve a series of interactions and transactions
among people (Emerson, 1976) that have the potential to generate high quality relationships
(Cropanzano & Mitchell, 2005).
Ritzer (2006) supposed that the key assumptions of exchange theory, summarized recently
by Molm and Cook (1995, p.210), include the following:

52 R.Mirzaei Chapter two: Literature review
“(1) Behavior is motivated by the desire to increase gain and to avoid loss (or to increase
outcomes that are positively valued and to decrease outcomes that are negatively valued).
(2) Exchange relations develop in structures of mutual dependence (both parties have some
reason to engage in exchange to obtain resources of value and there would be no need to form
an exchange relation).
(3) Actors engage in recurrent, mutually contingent exchanges with specific partners over
time (i.e., they are not engaged in simple one-shot transactions).
(4) Valued outcomes obey the economic law of diminishing marginal utility (or the
psychological principle of satiation)”.
SET is a general sociological theory concerned with understanding the exchange of
resources between individuals and groups in an interaction situation (AP, 1992, p.668). Many
forms of social interaction in addition to economic transactions can be a kind of exchange of
benefit.
Foa and Foa (1974, 1980) suggested six types of resources in exchange: love, status,
information, money, goods and services. People engage in an exchange process, after cost-
benefit analysis and assessing opportunity costs for different alternatives. When the people
believe the benefits of an exchange exceed the costs and the opportunity cost is low, then the
SET predict they will take part in interaction. Skidmore argued that SET suggests individuals
will engage in exchanges if (1) the resulting rewards are valued, (2) they believe the exchange
is likely to produce valued rewards, and (3) perceived costs do not exceed perceived rewards
(cited in Jennings & Nickerson, 2006, p. 195).
Bystrazanowski (1989) referred to ‘play theory’, ‘compensation theory’ and ‘conflict
theory’ as number of theories which have been used to explain the nature of local populations’
perceptions of tourism impacts, but concluded that none of them were able to provide a
theoretical framework for explain residents’ perceptions toward tourism impacts (Ap, 1992,
p.667).

53 R.Mirzaei Chapter two: Literature review
Attribution theory (Pearce, 1989), dependency theory (Preister, 1989) and social
representation theory (Pearce, Moscardo & Ross, 1996) also have been suggested to explain
residents’ perception toward tourism impacts. Ap (1990, 1992), Nash (1989), Perdue et al.
(1990), Andriotis and Vaughan (2003) suggested SET is an appropriate framework for
examining residents’ perceptions toward tourism impacts.
In tourism context, SET assumes that resident’ attitudes and perceptions toward tourism
and later support or opposition to its development will be influenced by their understanding of
impacts in society. It is postulated that residents support tourism for their community in order
to fulfill their economic, social, psychological (Ap, 1992) and environmental needs.
Therefore, a person that perceives benefits from an exchange with tourists is likely to
evaluate it positively and supports tourism development, one that perceives costs is likely to
evaluate it negatively and oppose to its development (Andereck, Valentine, Knopf & Vogt,
2005; McGehee & Andereck, 2004).
As Ap (1992) suggested, the advantages of SET are that it can explain positive and
negative perceptions and can examine interactions at the individual or community level. SET
specifies that local populations expect to get tourism benefits in exchange for resources they
provided to tourism industry.
According to SET “Residents may have more positive perceptions of tourism if they perceive
that their tourism exchanges bring them benefits, but will have negative perceptions of tourism
if they perceive these benefits to be outweighed by costs” (Ritchie & Inkari, 2006, p.30). In
this study social exchange theory was used as the theoretical framework.

54 R.Mirzaei Chapter three: Methodology
CHAPTER 3:
RESEARCH METHODOLOGY
3.0 Introduction
Success and quality of the studies depend on the accuracy of the research plan, set
appropriate variables and selection of correct methods and tools for collecting relevant
data. This chapter includes the methodological aspects of study including research design,
variables, research questions, data collection techniques and analysis and description of
study areas.
3.1 Research planning
Scientific research is a process that starts from research design. Many investigators
proposed different steps for research design (e.g. Pizam, 1994; Oppenheim, 1992;
Creswell, 2007; Ryan, 1995; Veal, 1997; Bordens & Abbott, 2002; Punch, 1998).
Although, the number of stages is different the sequence of steps is similar. This research
used the model proposed by Pizam (1994). Pizam (1994, p.91) divided the tourism
research investigation into seven sequential steps:
A- Formulation of research problem,
B- Review of related research,
C- Definition of concepts, variables and hypotheses,
D- Selection of research design,
E- Selection of data collection methods,
F- Selection of subjects,
G- Planning of data processing and analysis.
According to this model, the steps of research have been formulated in figure 3.1.

55 R.Mirzaei Chapter three: Methodology
Figure 3.1: Research process
Source: Based on Pizam, 1994 after Andriotis, 2002
A. Formulation of research problem
B. Review of Related Research
D. Selection of research design
Exploratory
Descriptive
Casual
G. Data processing and information analysis
- Quantitative analysis - Qualitative analysis
C. Formulation of:
Variables:
Independent
Dependent
Intervening
Aim
objectives
Hypotheses
Concepts
F. Selection of subjects
Census Samples
E. Selection of data collection method
Personal
observation
Questionnaire
- Interviews
Secondary
data
Theoretical background
of problem
Study of similar
researches

56 R.Mirzaei Chapter three: Methodology
3.1.1 Formulation of research problem
All scientific examination begins with the formulation of research topic. Pizam (1994)
proposed that the general topic of study suggested by practical concern and scientific or
intellectual curiosity. Pizam (1994, p. 91-93) proposed three categories for topics that arise
from practical concerns as below:
1. Provision of information on the need for some new or enlarged facilities or services.
Feasibility studies, physical and land use studies tourism impact assessments are included
in this category.
2. Provision of information concerning the probable consequences of various courses of
action for deciding among proposed alternatives; for example, it would be important for
decision makers to know if nature-based tourism development in a certain destination
would be popular and profitable.
3. Prediction of some future course of events in order to plan appropriate actions, for
example the impact of economic recession on global tourism trend in coming years.
According to Pizam (1994, p. 93) scientific or intellectual interests present a variety
range of topics for research that arise:
1. From a concern with some social problem (demonstration effect or cultural lag).
2. From an interest in some general theme or area of behavior (destination images
change or tourist motivation).
3. From some body of theory (economic theory, social theory).
In this study research topic was chose based on practical and scientific concerns along
with personal interest. From the scientific standpoint, host communities’ perception and
attitudes towards tourism impacts and development has been a growing area research. The
identification of nature-based tourism impacts in Mazandaran from the host community
point of view and the factors that predict local community attitudes towards tourism
development were an almost untouched subject in this touristic area. From the practical
aspect this study is the first one that investigates both the environmental and
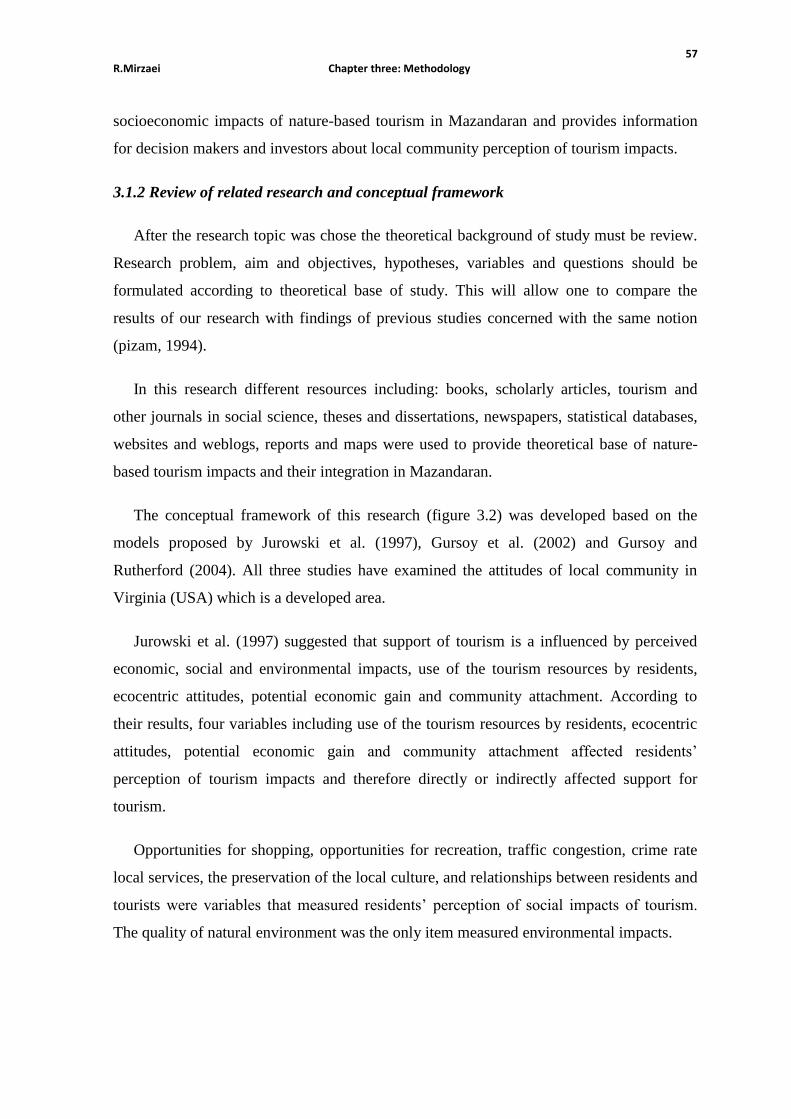
57 R.Mirzaei Chapter three: Methodology
socioeconomic impacts of nature-based tourism in Mazandaran and provides information
for decision makers and investors about local community perception of tourism impacts.
3.1.2 Review of related research and conceptual framework
After the research topic was chose the theoretical background of study must be review.
Research problem, aim and objectives, hypotheses, variables and questions should be
formulated according to theoretical base of study. This will allow one to compare the
results of our research with findings of previous studies concerned with the same notion
(pizam, 1994).
In this research different resources including: books, scholarly articles, tourism and
other journals in social science, theses and dissertations, newspapers, statistical databases,
websites and weblogs, reports and maps were used to provide theoretical base of nature-
based tourism impacts and their integration in Mazandaran.
The conceptual framework of this research (figure 3.2) was developed based on the
models proposed by Jurowski et al. (1997), Gursoy et al. (2002) and Gursoy and
Rutherford (2004). All three studies have examined the attitudes of local community in
Virginia (USA) which is a developed area.
Jurowski et al. (1997) suggested that support of tourism is a influenced by perceived
economic, social and environmental impacts, use of the tourism resources by residents,
ecocentric attitudes, potential economic gain and community attachment. According to
their results, four variables including use of the tourism resources by residents, ecocentric
attitudes, potential economic gain and community attachment affected residents’
perception of tourism impacts and therefore directly or indirectly affected support for
tourism.
Opportunities for shopping, opportunities for recreation, traffic congestion, crime rate
local services, the preservation of the local culture, and relationships between residents and
tourists were variables that measured residents’ perception of social impacts of tourism.
The quality of natural environment was the only item measured environmental impacts.

58 R.Mirzaei Chapter three: Methodology
Gursoy et al. proposed a tourism support model based on the host community attitudes
towards tourism development in Virginia (USA). The findings of this study revealed that
the host community support is affected by the level of concern, ecocentric values,
utilization of resource base and perceived costs and benefits of the tourism development.
According to their findings, support for tourism development is influenced by the
perceptions of its costs and benefits and the state of the local economy. It proposed that
these perceptions are affected by the concern residents have for their community, their
emotional attachment to it, the degree to which they are environmentally sensitive, and the
extent to which they use the same resource base that tourists use (2002, p.79).
They measured perceived benefits by factors including employment prospects,
opportunities for shopping, availability of recreation and tourism revenues for government.
Perceived costs were measured by assessing respondents’ opinions towards two items:
crime rate and traffic congestion.
In another study Gursoy and Rutherford (2004) classified the perceived impact into five
groups: economic benefits; social benefits; social costs; cultural benefits; and cultural
costs. According to them, the perceptions of these five impact factors and the state of the
local economy are the determinants of community support for tourism. These perceptions
were influenced by residents’ concern for their community, their emotional attachment to
it, the degree to which they are environmentally sensitive, and the extent to which they use
the same resource base that tourists use.
Figure 3.2 shows the proposed model of this research. According to this model, the
local community support for tourism development is a function of their perception of
tourism impacts. The perception of local community of these impacts influences their
assessment of general tourism’s costs and benefits and in turn local community’s support
for tourism. According to social exchange theory, if they perceived the positive impacts
more than negative impacts then the overall result of cost-benefit analysis will be positive
and they will support tourism development otherwise they would oppose it.
It also proposes that the local community perceptions of tourism impacts are a function
of their attachment to the community, the level of concern they have for it, the extent to
which they use the tourism resources or tourism superstructures and the extent to which
they believe tourism’s economic benefits remain in their community.

59 R.Mirzaei Chapter three: Methodology
Almost all studies on relationship between residents’ perception of economic impacts
of tourism and their attitudes towards it indicate a positive relationship (Andriotis, 2004;
Keogh, 1990; Jurowski et al, 1997) but studies on environmental and socioeconomic
impacts show different and sometimes contradictory results. Based on literature the
tourism impacts segregate into positive socioeconomic, negative socioeconomic, positive
environmental and negative environmental.
The model can be displayed as follows:
ST= F(PSEI, NSEI, PEI, NEI)
And
PSEI=F(CC, CA, UT, ECRC)
NSEI=F(CC, CA, UT, ECRC)
PEI=F(CC, CA, UT, ECRC)
NEI=F(CC, CA, UT, ECRC)
In which:
ST= Support for Tourism Development
PSEI= Positive Socioeconomic Impacts
NSEI= Negative Socioeconomic Impacts
PEI= Positive Environmental Impacts
NEI= Negative Environmental Impacts
CC= Community Concern
CA= Community Attachment
UT= Utilization of Tourism Resources
ECRC=Economic Benefits Remaining in the Community

60 R.Mirzaei Chapter three: Methodology
Figure 3.2 Model of support for tourism development
Source: own compilation
X7=Concern about natural resources; X8=Concern about crime rate; X9=Concern about culture and traditions; X10=Knowing what goes in the community; X11= to be pleased or sorry if you move away; X12=to be happy living here; X13= Availability of favorite recreational places; X14=Being satisfied with using tourism services; X15=keep infrastructure at a high standard; X16=More businesses for local people; X17=jobs are more available for foreigner; X18=tourism interest goes to few people; X19=increase recreational facilities; X20=increase job opportunity; X21=Encourage cultural activities; X22=increase residents’ proud; X23=shape a good feeling about area among tourists; X24=has a positive impact on area’s cultural identity; X25=increase local people acquaintance with other culture; X26=Increase crime rate; X27=Changes way of life; X28=overcrowded beaches; X29=Increase cost of living; X30=changes the traditional dress; X31=local people use fewer local dialect; X32=increase local awareness and appreciation of the environment; X33=improves the appearance of area; X34=provides incentive for conservation of natural resources; X35=keep attraction with more care;X36=increase noise; X37=increase traffic;X38=increase litter problems; X39=increase pollution in beaches; X40=deteriorate natural environment; X41= To support more tourism development.
PSEI
NSEI
PEI
NEI
X7, X8, X9
X10, X11, X12
X13, X14, X15
X16, X17, X18
X32,X33, X34, X35
CC
CA
UT
ECRC
Support for tourism
X19, X20, X21, X22,
X23, X24, X25
X26, X27, X28,
X29, X30, X31
X36, X37, X38
X39, X40
X41

61 R.Mirzaei Chapter three: Methodology
3.1.3Formulation of main variables, aim, objectives and hypothesizes
The main variables of research were categorized into dependent, independent, and
intervening variables.
3.1.3.1 Dependent and independent variables
The variables used to measure local community support for tourism development and their
perceptions of tourism impacts. These variables were defined in previous studies. The ultimate
dependent variable is support or oppose for NBT. Local community’s support for nature-based
tourism in Mazandaran was assessed by their answers to a five levels Likert-type scale in
which, 1=strongly oppose, 2= oppose, 3= neither support nor oppose, 4= support, 5= strongly
support.
Seven items measured the local community’s perceptions of positive socioeconomic
impacts of nature-based tourism in Mazandaran. These were increasing employment
opportunities, increasing recreational facilities, Encouraging cultural activities, increasing
local community proud, shaping a good feeling about area among tourists, improving area’s
cultural identity and increasing local people acquaintance with other culture.
Respondents expressed their attitudes towards socioeconomic statements by choosing one
option on a 5 level Likert scale with 1= strongly disagree, 2= disagree, 3= neither agree nor
disagree, 4= agree, 5= strongly agree to show their disagreement or agreement with six
statements.
Higher scores of statements mean more positively attitudes towards socioeconomic impacts
of nature-based tourism in Mazandaran.
For measuring local community perception of negative socioeconomic impacts of tourism,
six items were used. These items were increasing crime rate, changing way of life,
overcrowding beaches and mountain areas, increasing cost of living, changing the traditional
dresses and fewer use of local dialect. Residents were asked to indicate their agreement or
disagreement on a 5 level Likert scale with 1= strongly disagree, 2= disagree, 3= neither agree

62 R.Mirzaei Chapter three: Methodology
nor disagree, 4= agree, 5= strongly agree to show their disagreement or agreement with six
statements.
Four items were used to measure residents’ perception of positive environmental impacts
of nature-based tourism. These items were increasing local awareness and appreciation of the
environment, improving the appearance and landscape of area, providing incentive for
conservation of natural resources and keeping natural attractions with more care. Respondents
were asked to rate the positive environmental impacts on a 5 level Likert scale with 1=
strongly disagree, 2= disagree, 3= neither agree nor disagree, 4= agree, 5= strongly agree to
indicate their perceptions.
Based on literature five items were used to measure negative environmental impacts of
nature-based tourism in Mazandaran. These were increasing noise, increasing traffic problem,
increasing litter problems, increasing pollution in beaches, forests, mountains and
deteriorating the natural environment. Residents expressed their perceptions towards negative
environmental impacts of nature-based tourism with indicating their agreement or
disagreement to the five statements on a 5 level Likert scale with 1= strongly disagree, 2=
disagree, 3= neither agree nor disagree, 4= agree and 5= strongly.
3.1.3.2 Independent and exogenous variables
Based on literature and pretest of questionnaires four variables including community
concern, community attachment, utilization of tourism resources and superstructures and the
extent to which the economic benefits of tourism remain in community were used as the
independent and exogenous variables in this research.
3.1.3.2.1 Community concern
Community concern measured the level of concern that local communities have about
issues related to their society. Three items were used to measure local community concern.
They have indicated how concern they were about condition and quality of natural resources,
crime rate and preserving local culture and traditions. A five level scale ranging from 1= not at
all to 5= very much was used.

63 R.Mirzaei Chapter three: Methodology
3.1.3.2.2 Community attachment
This variable examined how do residents feel attached to their society. Three items were
used for measuring this variable. These were the extent to which what is happening in the
society is important for residents; extent to which the local communities are happy to live in
their community, and how pleased or sorry would residents be if they move away from their
society. For the first two items answers ranged from 1= not at all to 5= very much and for the
last item from 1= very pleased to 5= very sorry.
3.1.3.2.3 Utilization of tourism facilities and services by residents
Three items were used to measure how important are the use of tourism facilities and
services for local community. A five level Likert scale where 1= completely disagree on one
end and 5= completely agree on the other end was used to measure respondent’s attitudes
towards statements related to use of tourism facilities and services in their community. The
availability of favorite places to go during leisure time, using local tourism services is most
satisfying and keeping infrastructure at a high standard were three items for measuring this
variable.
3.1.3.2.4 Remaining economic benefits in society
The last independent variable is the residents’ perceptions of the amount of economic
benefits remain in their community and so does not leak. Three items were used to measure
general understanding of residents over the extent to which economic benefits of tourism
remain in their community. They were asked if local people own more businesses, jobs are
more available for foreigner and tourism interest goes to few people in society. A five level
Likert scale where 1 represented completely disagree and 5 represented completely agree were
used to measure respondents’ views.
3.1.3.3 Intervening variable
Socio-demographic characteristics of respondents were regarded as intervening variable in
proposed model. Derived from literature, age, gender, level of education, length of residence
in the area, level of income, marital status, place of residence, job status and being employed

64 R.Mirzaei Chapter three: Methodology
in tourism sectors are items being used for measuring the correlation between socio-
demographic variable and other dependent and independent variables.
3.1.3.4 Aim, objectives and hypothesizes
Once the literature review is completed, the next step is to formulate and define concepts,
aim and objectives, questions and hypotheses of research. The literature review showed the
lack of understanding of resident responses to the impacts of tourism on local community in
destinations with limited number of international visitors and unplanned and unstructured
tourism industry. A large number of past studies conducted in countries like United States,
Greece, Turkey, and some other destination, which are among developed and well-known
destinations in field of tourism.
The above mentioned deficiencies along with the lack of studies on nature-based
tourism impacts in Iran led to choose Mazandaran, as a famous touristic area, in north of
Iran and the adoption of this aim:
The aim of this study is to understand local population perceptions of
socioeconomic and environmental impacts of nature-based tourism in
Mazandaran, Iran and factors influencing their support for tourism in order to
enable researchers, planners and public bodies to better understand the
attitudes, perceptions, and values of host communities who directly and
indirectly involved in the tourism industry and host tourists in the destinations to
ensure the sustainability of tourism development in area and improve and
eliminate problems which arise from unplanned tourism development.

65 R.Mirzaei Chapter three: Methodology
In order to achieve the above-mentioned aim, the following research objectives were
developed:
- To identify the factors affecting local community support for tourism development.
- To identify the factors that predicts local community attitudes towards nature-based tourism
impacts in Mazandaran.
- Understand residents’ perceptions and attitudes regarding socioeconomic and environmental
impacts of nature-based tourism in Mazandaran.
- Examine the relationship between community concern and perception of nature-based
tourism impacts.
- Investigate the relationship between community attachment and perception of nature-based
tourism impacts.
- Study the relationship between utilization of tourism facilities by residents and their
perception of nature-based tourism impacts.
- Examine the relationship between residents’ opinion about the amount of economic benefits
remain in their society and their perception of nature-based tourism impacts.
- Examine the relationship among residents’ socio-demographic characteristics, type and level
of involvement in tourism and their relation to perception of nature-based tourism impacts
and,
- According to the results of study, propose appropriate strategies and policies to develop more
sustainable form of tourism in Mazandaran.
In order to investigate the aim and objectives of research, various variables were
identified. Variables according to their relationships with each other can be classified under
four categories: independent, dependent, intervening and control (Pizam, 1994).
- Independent variable is the variable that typically being changed and influences the results of
study. Independent variables in this thesis can be represented as community concern,
community attachment, utilization of tourism facilities by residents and general understanding
of the amount of economic benefits of tourism remain in the community (See 3.1.3).

66 R.Mirzaei Chapter three: Methodology
- Dependent variables are assumed to be the effect of independent variables (Pizam, 1994).
After review of related research, the following dependent variables were formulated: support
for tourism development, positive socioeconomic, negative socioeconomic, positive
environmental and negative environmental impacts of nature-based tourism (see 3.3.2). It
should be noted that overall impacts of tourism were considered as independent variables for
predicting support for tourism development.
3.1.3.5 Research questions
Based on research aim and objectives the 21 questions were developed. The questions are
provided in pages five and six ( see part 1.2 ).

67 R.Mirzaei Chapter three: Methodology
3.1.3.6 Research hypothesizes
Based on research aim, objectives and questions the following hypothesizes were proposed.
Direction of the relationships between variables suggested based on literature review.
Hypothesis 1a. A direct positive relationship exists between the perceived PSEI and
residents’ support for NBT development.
Hypothesis 1b. A direct negative relationship exists between the perceived NSEI and
residents’ support for NBT development.
Hypothesis 1c. A direct positive relationship exists between the perceived PEI and
residents’ support for NBT development.
Hypothesis 1d. A direct negative relationship exists between the perceived NEI and
residents’ support for NBT development
Hypothesis 2a. There is a direct positive relationship between the level of community
concern and the perceived PSEI.
Hypothesis 2b. There is a direct negative relationship between the level of community
concern and the perceived NSEI.
Hypothesis 2c. There is a direct positive relationship between the level of community
concern and the perceived PEI.
Hypothesis 2d. There is a direct negative relationship between the level of community
concern and the perceived NEI.
Hypothesis 3a. There is a direct positive relationship between attachment to the community
and the perceived PSEI.
Hypothesis 3b. There is a direct negative relationship between attachment to the
community and the perceived NSEI.

68 R.Mirzaei Chapter three: Methodology
Hypothesis 3c. There is a direct positive relationship between attachment to the community
and the perceived PEI.
Hypothesis 3d. There is a direct negative relationship between attachment to the
community and the perceived NEI.
Hypothesis 4a. There is a direct positive relationship between the utilization of tourism
facilities by residents and the perceived PSEI.
Hypothesis 4b. There is a direct negative relationship between the utilization of tourism
facilities by residents and the perceived NSEI.
Hypothesis 4c. There is a direct positive relationship between the utilization of tourism
facilities by residents and the perceived PEI.
Hypothesis 4d. There is a direct negative relationship between the utilization of tourism
facilities by residents and the perceived NSEI.
Hypothesis 5a. There is a direct positive relationship between the understandings of
economic benefits remains in the society and the perceived PSEI.
Hypothesis 5b. There is a direct negative relationship between the understandings of
economic benefits remains in the society and the perceived NSEI.
Hypothesis 5c. There is a direct positive relationship between the understandings of
economic benefits remains in the society the perceived PEI.
Hypothesis 5d. There is a direct negative relationship between the understandings of
economic benefits remains in the society and the perceived NEI.

69 R.Mirzaei Chapter three: Methodology
3.1.4 Research design
The next step after formulating goal, objectives, variables, and hypotheses is research
design. Selltiz, Jahoda, Deutsch, & Cook (1965, p.50) define research design as “the
arrangement of conditions for collection and analysis of data in a manner that aims to combine
relevance to the research purpose with economy in procedure.” Research design is a
conceptual framework for conducting the research, in fact it points out the steps of research
and their order.
Based on Selltiz, Wrightsman and Cook, research design includes:
1- Formulation of research problem,
2- Processes and appropriate methods for data collection,
3- Define the study population and
4- Choose appropriate methods for processing and analyzing data (cited in Pizam,
1994, p. 97).
Research design can be categorized in three groups: exploratory, descriptive or diagnostic
and experimental or casual (Pizam, 1994).
3.1.4.1 Exploratory designs
Selltiz et al. argued that exploratory research studies are mainly undertaken for more
precise investigation of a problem or developing hypotheses for more study and clarification
of concepts or discovery of ideas and insights (cited in Pizam ,1994). Exploratory designs
“seek relations” rather than “predict relations” (Pizam, 1994). In exploratory design the
problem is too ambiguous to be formulated and tested via statistical tests.
There are a significant number of studies in the field of host community attitudes towards
tourism which developed factors and variables related to this topic that clarify concepts and
provide appropriate vision over tourism impacts issues (Andriotis, 2000). So since the main
problem of this research has been investigated by other researchers, the exploratory design
could not been adopted and the other types of research design will be used.

70 R.Mirzaei Chapter three: Methodology
3.1.4.2 Descriptive designs
Descriptive designs are used for one or more of the following purposes (Churchill, 1987,
p.53-54 cited in Pizam, 1994):
1- “To describe the characteristics of certain groups,
2- To estimate the proportion of people in a specific population who behave in a certain way
and
3- To make specific predictions or discover relations and interactions among variables.”
Descriptive research studies describe the characteristics of particular phenomenon,
individual or group. In most descriptive studies, the researcher develops hypotheses, gathers
related data, and then according to sample analyses makes some statements about population.
Descriptive designs can be classified under two major types: surveys and case studies (Pizam,
1994).
According to Kerlinger and Lee (2000,p.599), survey research studies large and small
populations by selecting and studying samples chosen from the population to discover the
relative incidence, distribution, and interrelations of variables. Survey research studies are
commonly used in tourism studies (Beeton, 2005). As Robson (1993, p.49) proposed, surveys
refer to the “collection of standardized information from a specific population, or some sample
from one, usually but not necessarily, by means of questionnaire or interview” (cited in
Andriotis, 2000). This research by using surveys and design questions could investigate local
community attitudes towards tourism impacts and evaluate these impacts and residents’
support for tourism development in Mazandaran.
Case studies are thorough examinations of specific social settings or particular aspects of
social settings (Black & Champion, 1976, p.90 cited in Pizam, 1994). In general, a case study
is an empirical inquiry which:
“Investigates a contemporary phenomenon within its real-life context: when the
boundaries between phenomenon and context are not clearly evident; and in which multiple
sources of evidence are used” (Yin, 1984, p. 23 cited in Pizam, 1994).

71 R.Mirzaei Chapter three: Methodology
3.1.4.3 Casual designs
Casual design is a method for investigate the relationship between one or more independent
variables and dependent variables. According to Malhotra (1996, p.97) casual designs attempt:
• “To understand which variables are the causes (independent variables) and which
variables are the effects (dependent variables) of a phenomenon.
• To determine the nature of the relationship between the causal variables and the effect to
be predicted” (cited in Andriotis, 2000).
This study tries to recognize the relationship between independent and dependent variables
related to tourism impacts in Mazandaran. Particularly, some relations will be explored such
as:
- The relationship between tourism impacts and support for tourism;
-The relationship between socio demographic variables and different type of tourism
impacts;
- The relationship between community concern and perceived tourism impacts;
- The relationship between community attachment and perceived tourism impacts and
- The relationship between the understandings of economic benefits remains in the society
and perceived tourism impacts.
3.1.5 Data collection methods
Date collection is an important part of research. Improper data collection method could
lead to a deviation of research result. Data collection methods could be categorized in three
different groups: investigator observation, investigator or his or her agents communicating
with the subjects (for instance, interviews or questionnaires) and secondary resources (Pizam,
1994). All methods of data collection were used in this research.
During interviews with local community, the researcher had opportunity to observe the
nonverbal behavior and feedbacks from respondents regarding the questions. Thus, the
questions that were unintelligible, vague and unclear for respondents were identified and were
excluded from final analysis. For example, “conceptual model of support for tourism

72 R.Mirzaei Chapter three: Methodology
development” (figure3.2) that was initially designed had a factor called “Ecocentric attitude”
and the concepts like the balance of nature and ecological catastrophe supposed to measure
this factor. Many of the respondents pretend that they know the meaning of these concepts,
although their reactions, questions, and feedbacks showed that this factor was completely
unfamiliar for them. As a result, it was eliminated and a new factor was suggested based on
the local conditions of Mazandaran.
3.1.5.1 Questionnaire design
An important part of the research data were collected through interviews. A questionnaire,
originally in English and translated to Persian, consisting of three parts was developed.
Part one: The first part that includes questions about local community perception towards
tourism impacts has 39 questions. The respondents were asked to indicate their perceptions of
the statements on nature-based tourism impacts by using a five level Likert type scale ranging
from 1= strongly disagree to 5= strongly agree. The statements were written in form of
positive and negative sentences to avoid bias in responses.
Part two: Second part concerned with residents’ participation in tourism planning and
development processes in Mazandaran has four questions. The residents were asked whether
they have ever participated in tourism planning and development process in their community.
Part three: The third part raises questions about nine different socio-demographic
characteristics of respondents (Appendix I).

73 R.Mirzaei Chapter three: Methodology
3.1.5.2 Pilot study
The questionnaire was written in English and then was translated into Persian. A sample of
thirty respondents in Babolsar and thirty residents in Kelardasht were chosen to pretest in
order to evaluate content validity of questionnaire and respondents’ understanding of
questions. In September 2011, face to face interviews were conducted with residents. After the
pretest some changes were made including wording of questions, eliminating and changing
some questions and changing the order and layout of questions in order to make the
questionnaire more understandable.
3.1.6 Sample
In order to examine local community perceptions of nature-based tourism impacts in
Mazandaran and their support for tourism development, local residents who have lived at least
for one consecutive year in Babolsar or Kelardasht were sampled.
For determining final sample size the Cochran (1977) equation was used. According to this
equation a sample size of around 660 for Babolsar and 382 for Kelardasht were chose (table
3.1)
Table 3.1 sample size and response rate
City Total population
Sample size
Response
No Percent
Babolsar 130000 660 397 60.15
Kelardasht 40000 382 190 49.73

74 R.Mirzaei Chapter three: Methodology
3.1.7 Collecting data
In order to achieve a sample that provides characteristics of the population from which the
sample was obtained, systematic sampling technique was used. First the households were
classified according to neighborhoods and then in selected streets one out of every three
homes was integrated in sample. An adult from each home was interviewed. If the property
was a residential complex, up to three households were interviewed. If a house was vacant or
an adult was not at home to answer, the interviewer went to the nearby house. Up to 30
households were interviewed in each street.
In Babolsar a group of thirty tourism management students from University of Mazandaran
were selected to conduct the interviews. A two-day workshop on how to design a
questionnaire and conduct interview was designed and conducted by researcher for students in
University of Mazandaran. In Kelardasht 18 members of “sustainable development foundation
of Kelardasht” which is an active NGO were volunteers to help researcher in conducting
interviews. Since all volunteers had a bachelor degree or were master students and were
familiar with research methods, during one-day workshop the principles of doing face to face
interviews were taught them.
Due to the comparative limitation and constraint on interviewing man with woman and
vice versa in community, the interviewers were divided in groups of two consisting of one
female and one male. They were asked if the interviewee was a female, the female interviewer
conduct the interview, and if the respondent was a man the male interviewer conduct it.
Hereby the researcher tried to reduce the effect of gender on responses, specially provide
better situation for female respondents to express their opinions.
The interviews were conducted in September and October 2011. Four hundred and nine
questionnaires were completed in Babolsar, 12 questionnaires were excluded from analysis
due to missing and incomplete answers. Two hundred and fifteen interviews were done in
Kelardasht, 25 questionnaires were eliminated, and 190 complete questionnaires were
analyzed. A total of 587 questionnaires were completed accurately and achieved for further
analysis.

75 R.Mirzaei Chapter three: Methodology
3.2 Data analysis
The next step in research is data processing and analysis. Statistical Package for the Social
Science (SPSS) version 20 for windows was used to analyze findings of research and perform
different kind of statistical analyses. Excel program was used for drawing charts.
3.2.1 Descriptive statistics
Descriptive statistics were used to describe the basic features of sample. The frequency
distribution, which is a common tool for describing a single variable, was used to describing
socio demographic characteristics and distribution of different attitudes. The means are the
same as averages and were produced in this research.
3.2.2. Correlation
The correlation is a single number that describes how strongly two variables are related.
The chi-square test is probably the most popular test for comparing frequencies in cross-
tabulations of two nominal variables to examine whether there is any sort of relationship
between the two variables involved in table (Veal, 1997).
The null hypothesis (H0) assumes that observed and expected values are not significantly
different or there is no relationship between the two variables. The alternative hypothesis (H1)
assumes there is a relationship between independent and dependent variables or observed and
expected variables are significantly different (Veal, 1997).
In this study, if the level of probability was below 0.05 the null hypothesis was rejected. It
means that only those correlations where the value of P is below 0.05 are significantly
different from zero (Veal, 1997).
Spearman's rank correlation coefficient (ρ) Spearman's rho was used to assess strength of
association between two ranked variables. It can take values from +1 to -1. A, ρ of +1
indicates a perfect positive correlation of ranks, a ρ of zero indicates no association between
ranks and a ρ of -1 indicates a perfect negative association of ranks. The closer the Spearman
correlation coefficient (ρ) is to zero, the weaker the association between the ranks (Johnson &
Bhattacharyya, 2010).

76 R.Mirzaei Chapter three: Methodology
Mann-Whitney U test was used to compare differences between response based on means
calculated for two independent groups and one dependent variable which has non normal
distribution. Kruskal-Wallis analysis of variance was applied for comparison of more than two
independent groups. If null hypothesis reject then at least one of the samples is different from
the other and the Kruskal-Wallis test leads to significant results.
The Friedman test was applied to measure the differences between groups and ranking
variables. Correlation was used to measure the strength of association between variables;
afterwards multiple regression analysis was used to examine the casual relationship between
variables. Regression analysis is a statistical test which is used for examining the casual
relationship between a dependent variable and a set of independent variables (Buglear, 2003;
Rogerson, 2001; Veal, 1997).
Using regression, path analysis was conducted to determine which casual variables to
include in the model and which paths were important and which one were not statistically
important to the model.
Principal components analysis (PCA) or factor analysis was used in order to approve and
improve the final indicators which in this study were used for predicting the local community
perceptions and attitudes towards nature-based tourism impacts. Factor analysis is often used
to reduce the number of variables that might be used to examine a factor.
3.2.3 Sampling adequacy
There are a few methods to detect sampling adequacy: (1) Kaiser-Meyer-Olkin (KMO)
Measure of Sampling Adequacy for the overall data set; (2) KMO measure for each individual
variable; and (3) Bartlett's test of sphericity.
The KMO measure is used as an index of whether there are linear relationships between the
variables and thus whether it is appropriate to run a principal component analysis on data set.
Its value can range from 0 to 1, with values above 0.6 suggested as a minimum requirement
for sampling adequacy, but values above 0.8 considered good and indicative of principal
component analysis being useful.

77 R.Mirzaei Chapter three: Methodology
Table 3.2 KMO and Bartlett's Test
Kaiser-Meyer-Olkin Measure of Sampling Adequacy. .830
Bartlett's Test of Sphericity
Approx. Chi-Square 4519.239
df 741
Sig. .000
Table 3.2 shows the KMO measure was .830 which is good or "meritorious" on Kaiser's
(1974) classification of measure values.
3.2.4 Bartlett's test of sphericity
Bartlett's test of sphericity says that there are no correlations between any of the variables.
This is important because if there are no correlations between variables, then it will not be
possible to reduce the variables to a smaller number of components and there will be no point
in running a principal component analysis. Table 3.2 shows that Bartlett's test of sphericity is
statistically significant (p = .000) and null hypothesis is rejected.
3.2.5 Reliability analysis
Cronbach's alpha was used to measure the internal consistency to determine how much the
items on the scale were measuring the same underlying dimension. A questionnaire was
employed to measure different, underlying constructs. One construct, community concern,
consisted of three questions. The scale had a high level of internal consistency, as determined
by a Cronbach's alpha of 0.722 (table 3.3). Appendix II

78 R.Mirzaei Chapter three: Methodology
Table 3.3 Reliability analysis for variables
Variable Cronbach's
Alpha
Cronbach's Alpha Based
on Standardized Items
N of
Items
Community concern .722 .727 3
Community attachment .756 .761 2
Utilization of tourism facilities .745 .748 3
General understandings of economic benefits .769 .774 4
Positive Socio-cultural Impacts .795 .798 6
Negative Socio-cultural Impacts .799 .801 10
Positive Environmental impacts .768 .771 4
Negative Environmental Impacts .825 .828 5
Another construct, community attachment, consisted of two questions. The scale had a high
level of internal consistency, as determined by a Cronbach's alpha of 0.756 (table 3.3).
Utilization of tourism facilities and services consisted of three questions had a high level of
internal consistency, as determined by a Cronbach's alpha of 0.748 (table 3.3). Another
construct, general understandings of economic benefits remains in society, consisted of four
questions. The scale had a high level of internal consistency, as determined by a Cronbach's
alpha of 0.774 (table 3.3).
Positive socioeconomic impacts (PSEI) consisted of six questions had a high level of
internal consistency, as determined by a Cronbach's alpha of 0.798 (table 3.3). The next
construct was negative socioeconomic impacts (NSEI), consisted of 10 questions had a high
level of internal consistency, as determined by a Cronbach's alpha of 0.799 (table 3.3).
One other construct, positive environmental impacts (PEI), consisted of four questions. The
scale had a high level of internal consistency, as determined by a Cronbach's alpha of 0.771
(table 3.3). Negative environmental impacts (NEI) consisted of five questions had a high level
of internal consistency, as determined by a Cronbach's alpha of 0.828 (table 3.3).

79 R.Mirzaei Chapter four: Results
CHAPTER FOUR
RESULTS
4.0 Introduction
This chapter describes the findings of Mazandaran local community’s surveys on
perceptions and attitudes towards nature-based tourism impacts and support for tourism
development based on personal interviews with 587 residents from Mazandaran province
by using a variety of descriptive, bivariate correlations and multivariate statistics.
It first presents the characteristics of sample, which may provide some information on
similarities and differences in perceptions and attitudes, and better understanding of
residents’ attitudes toward tourism. It then to identify the relationships between dependent
and independent variables used a variety of statistical tests and where significant
relationships and differences were recognized, these relationships and differences were
discussed.
4.1 Socio-demographic characteristics of sample
Results of the survey on gender, age, level of education, marital status, length of
residence, occupational status, occupation in tourism sectors and level of income of
respondents will be present in details in this part.
4.1.1 Gender
Results showed that 60% of the sample populations were male and 40% were female
(Figure 4.1). This may have been because of the more limitation for Iranian females in
compare with males to talk to foreigners and answer their questions especially when the
interviewer is a man.

80 R.Mirzaei Chapter four: Results
Figure 4.1 Gender of respondents (According to city)
Source: Findings of research
4.1.2 Age
Table 4.1 shows, the majority of respondents (33%) are between 18-25, followed by 25-
35 age group with 26 % and the lowest frequency (2%) belongs to age group over 65. The
higher proportion of young generation (59%) is consistent with the last census conducted
in 2011.
Table 4.1: Age of respondents
Age Frequency Percent
From 18 to 25 197 33
From 26 to 35 152 26
From 36 to 45 113 19
From 46 to 65 103 18
Over 65 11 2
Valid total 576 98
Missing system 11 2
Total 587 100
Source: findings of research
Babolsar Kelardasht Total
Female 35 44 40
Male 65 56 60
65 56 60
35 44 40
0
20
40
60
80
100
Pe
rce
nt
Gender

81 R.Mirzaei Chapter four: Results
4.1.3 Level of Education
A little more than half (54%) of the residents have a university degree and 43% have
completed elementary school (5 years), middle (8 years) or high school (12 years) and 3%
did not answer to this question (table 4.2). Results are quite consistent with the share of
young population (59%) that most of them possess a university degree.
Table 4.2 Level of education of respondents
Level of Education Frequency Percent
Up to Diploma 252 43
University degree 317 54
Valid total 569 97
Missing system 18 3
Total 587 100
Source: findings of research
4.1.4 Income
In 2011, the annual base salary was 3.500.000 Toman (one US dollar was 950 Toman).
Over 32% of respondents have very low income and 35% have relatively low income. On
the other hand, only 5% have an income over 15.000.000 Toman. Due to the lack of data,
the comparison with official statistics is not possible. Table 4.3 shows level of
respondents’ income.
Table 4.3 Level of income of respondents
Level of Income (Toman) Frequency Percent
Less than 3.500.000 187 32
From 3.500.000 to 8.500.000 206 35
From 8.500.000 to 15.000.000 60 10
Over 15.000.000 27 5
Valid Total 480 82
Missing system 107 18
Total 587
Source: findings of research

82 R.Mirzaei Chapter four: Results
4.1.5 Marital Status
The majorities (60%) of respondents were married, 36% were single, and 4% did not
answer to this question. Table 4.4 displays the marital status of respondents.
Table 4.4 Marital status of respondents
Marital Status Frequency Percent
Single 212 36
Married 352 60
Valid total 564 96
Missing system 23 4
Total 587
Source: findings of research
4.1.6 Length of residence in Mazandaran
According to findings, more than 64% of respondents had inhabited in Mazandaran for
more than 15 years and 10% had lived less than 5 years, (table 4.5).
Table 4.5 Length of Residence in Mazandaran
Length of Residence Frequency Percent
Less than 5 years 61 10
Between 6 and 15 years 90 15
More than 15 years 375 64
Valid total 526 90
Missing system 61 10
Total 587
Source: findings of research
High portion of residents with more than 15 years living in Kelardasht can be due to
that a large number of local people had been migrated in 1929 by Rezashah to Kelardasht,
where they settled.

83 R.Mirzaei Chapter four: Results
4.1.7 Employment Status
According to results, 48% are employed, 17% unemployed and 33% are retired, student
or homemaker.
Table 4.6 Employment status of respondents
Employment Status Frequency Percent
Employed 281 48
Unemployed 97 17
Other (student, retired or
homemaker)
196 33
Valid total 574 98
Missing system 13 2
Total 587
Source: findings of research
Figure 4.6 shows the employment status of residents in Babolsar and Kelardasht.
4.1.8 Employment in tourism sectors
More than 53% of respondents do not involved in tourism businesses and 27% engaged
in tourism related jobs (table 4.7). The main tourism related activity are villa or room to
rent, villa caretaker, gardening, working as construction worker in building villas.
Table 4.7 Employment in tourism sectors
Employment in Tourism Frequency Percent
Employ in tourism
sectors
161 27
Do not employ in tourism
sectors
311 53
Valid total 472 80
Missing system 115 20
Total 587
Source: findings of research

84 R.Mirzaei Chapter four: Results
4.2 Local community perceptions of nature-based tourism impacts
This section presents the results of local community perceptions towards nature-based
tourism impacts in Mazandaran and correlations between dependent and independent
variables based on research questions (table 4.8).
Table 4.8 Distribution of residents’ responses to statements
N Nature-based Tourism Impacts 1
%
2
%
3
%
4
%
5
%
Mean Std.
Deviation
1 Tourism has led to an increase in the availability of
recreational facilities and spaces
9 12 7 41 31 3.71 1.275
2 Tourism provides job opportunities for local
community
7 12 8 38 35 3.82 1.221
3 Tourism encourages a variety of cultural activities by
the local population (crafts, arts)
14 19 13 32 22 3.29 1.364
4 Tourism makes local residents feel more proud of
their town and community
9 17 17 29 28 3.48 1.309
5 Because of tourism our roads and other public
facilities are kept at a high standard
19 25 12 30 14 2.97 1.368
6 Our standard of living increases considerably because
of the tourism
7 20 20 37 16 3.35 1.177
7 Tourism improves understanding and image of
different communities and cultures
3 9 11 42 35 3.96 1.057
8 Tourists have a positive impact on the area’s cultural
identity
10 26 17 33 14 3.15 1.236
9 Tourists’ keen interest in natural and cultural sites
result in these sites are cared for than they otherwise
would be
17 19 11 32 21 3.20 1.416
10 Tourism could create a positive feeling about area
among tourists
3 6 19 44 28 3.88 0.976
11 Due to the presence of tourists in the area and
imitating their fashions, traditional clothing of local
community has been changed during past years
7 9 21 53 57 3.86 1.199
12 Local residents have a lower quality of life as a result
of living in a tourist area
17 33 17 23 10 2.76 1.252
13 Tourism has increased drug addiction 12 17 18 27 26 3.37 1.355
14 Tourism has led to more vandalism in area 14 21 16 28 21 3.23 1.356
15 Tourists disrupt the peace and tranquility of public
parks
11 24 11 32 22 3.30 1.341
16 High spending tourists have an undesirable effect on
our way of life
16 24 14 23 23 3.11 1.421
17 Crime rate in the area has increased due to tourism 14 25 18 24 19 3.10 1.349
18 Tourism increased price of land and housing 3 7 7 29 54 4.25 1.039
19 Tourism prevents local language from being use as
much as it otherwise would
6 16 11 38 29 3.69 1.211
20 Tourism has resulted in unpleasantly overcrowded
beaches, hiking trails, parks and other outdoor places
7 17 6 30 40 3.79 1.320
21 Tourism result in an increase in the cost of living 6 14 7 32 41 3.87 1.266
22 Tourism causes changes in our traditional cultures 7 14 12 34 33 3.72 1.248
23 Local businesses are the ones which benefit most
from tourists
4 10 15 42 29 3.80 1.099
24 Tourism gives benefits to a small group of people in
the area
25 36 12 20 7 2.47 1.257
25 Tourism creates more jobs for foreigners than local 13 24 23 28 12 3.01 1.228

85 R.Mirzaei Chapter four: Results
community
26 Tourism helps to increase local awareness and
appreciation of the environment
10 19 13 35 23 3.44 1.289
27 Tourism provides an incentive for conservation of
natural resources
8 16 17 37 22 3.47 1.228
28 Tourism preserves environment and improves the
appearance of area
12 25 11 34 18 3.22 1.316
29 Tourists increase noise in the area 9 23 12 31 25 3.41 1.315
30 The quality of natural environment in area has
deteriorated by tourists
8 20 11 40 21 3.46 1.240
31 Tourism development increases the traffic problems 2 6 5 29 58 4.34 0.970
32 The area experiences more litter problems because of
the presence of tourists
3 4 6 33 54 4.29 0.979
33 Construction of tourist villages and other tourist
facilities has destroyed the natural environment
8 17 12 34 29 3.59 1.287
34 Tourists increasing pollution in beaches and
mountains
6 12 7 33 42 3.92 1.232
35 What’s happen in the area is important for me 5 1 7 21 77 4.51 0.907
36 I love living in this area and I moved here, I’d be
upset and disturbed
7 1 9 27 39 4.14 1.260
37 My favorite recreational facilities and services are
exist in this area
17 19 1 15 25 2.65 1.429
38 The state of area’s residents are courteous and
friendly to tourists
6 11 12 42 29 3.74 1.170
39 I support more tourism development 18 24 20 25 13 2.90 1.316
Source: findings of research
4.3 Normality test
The Shapiro-Wilk and Kolmogorov-Smirnov tests were used to test the normality
distribution of data. If the assumption of normality has been violated, the "Sig." value will
be less than .05 (i.e., the test is significant at the p < .05 level).
This is because the Kolmogorov-Smirnovand the Shapiro-Wilk tests are testing the null
hypothesis that the data's distribution is equal to a normal distribution. Rejecting the null
hypothesis means that the data's distribution is not equal to a normal distribution. In the
table 4.9, all the "Sig." values are less than .05 (they are .000).

86 R.Mirzaei Chapter four: Results
Table 4.9 Tests of normality
Variables Kolmogorov-Smirnova Shapiro-Wilk
Statistic df Sig. Statistic df Sig.
negative socioeconomic impacts .066 578 .000 .986 578 .000
positive environmental impacts .107 578 .000 .969 578 .000
negative environmental impacts .107 578 .000 .942 578 .000
positive socioeconomic impacts .066 578 .000 .987 578 .000
community concern .107 578 .000 .971 578 .000
community attachment .281 578 .000 .752 578 .000
General understanding of economic benefits .087 578 .000 .985 578 .000
utilization of tourism facilities by residents .088 578 .000 .979 578 .000
a. Lilliefors Significance Correction
Therefore scores of all variables were non-normally distributed as assessed by
Kolmogorov-Smirnov and Shapiro-Wilk tests (p<.05).

87 R.Mirzaei Chapter four: Results
4.4 Assessing research questions and hypothesizes
In this part, the results of research questions and hypothesizes examination will be
presented. Based on the results of previous studies and confirmatory factor analysis (see
appendixIII) independent variables were choose.
4.4.1 Research question 1: perceptions of socioeconomic impacts
Table 4.10 presents the responses to 21 statements on socioeconomic impacts of nature-
based tourism in Mazandaran. It should be noted that the impacts associated with providing
job opportunity or increasing standards of living, have been considered both as economic
or socioeconomic impact in several studies. In this study they have been considered among
socioeconomic impacts.
Respondents generally have negative perceptions of socioeconomic impacts of tourism,
although some positive impacts have been appreciated. More than 83% of respondents
believe or strongly believe that tourism development has increased the price of land and
housing. Previous studies in area (Ghadami, 2007; Ghadiri, Heydari & Ramezanzadeh,
2012; Mahdavi, Ghadiri & Sanaei, 2007) also represented similar results.
Approximately 73% of people stated that tourism resulted in an increase in the cost of
living. Similar to previous studies (Rahnemaei, Farhoudi, Dittmann & Ghadami, 2008;
Aligholizadeh, Badri & Faraji, 2005) this study suggested that tourism has resulted in
unpleasantly overcrowded beaches, hiking trails, parks and other outdoor places with more
than 70 % of local community strongly agree or agree.
The role of tourism in preventing local language from being use as much as it otherwise
would and its impact on changing the traditional cultures were supported by 67% of
residents.
Surprisingly, three statements related to the behavior of the tourists in destination that
seem to be basis of approval many restrictions against tourists, were not supported strongly
by residents. Over 39% were disagree and 18% were neutral that crime rate in the area has
increased because of tourism.

88 R.Mirzaei Chapter four: Results
More than 33% were disagree and 18% were neutral that tourism has increased drug
addiction and drinking alcohol and 35% were disagree and 14% were neutral that tourists’
behavior has led to more promiscuity in area.
Respondents also confirmed some positive socioeconomic impacts. More than 77% of
people perceived that tourism improves understanding and image of different communities
and cultures. Residents appreciated tourism for increasing job opportunities and the
availability of recreational facilities and spaces. Over 72% of responses approved the
statement that tourism could create a positive feeling about area among tourists.
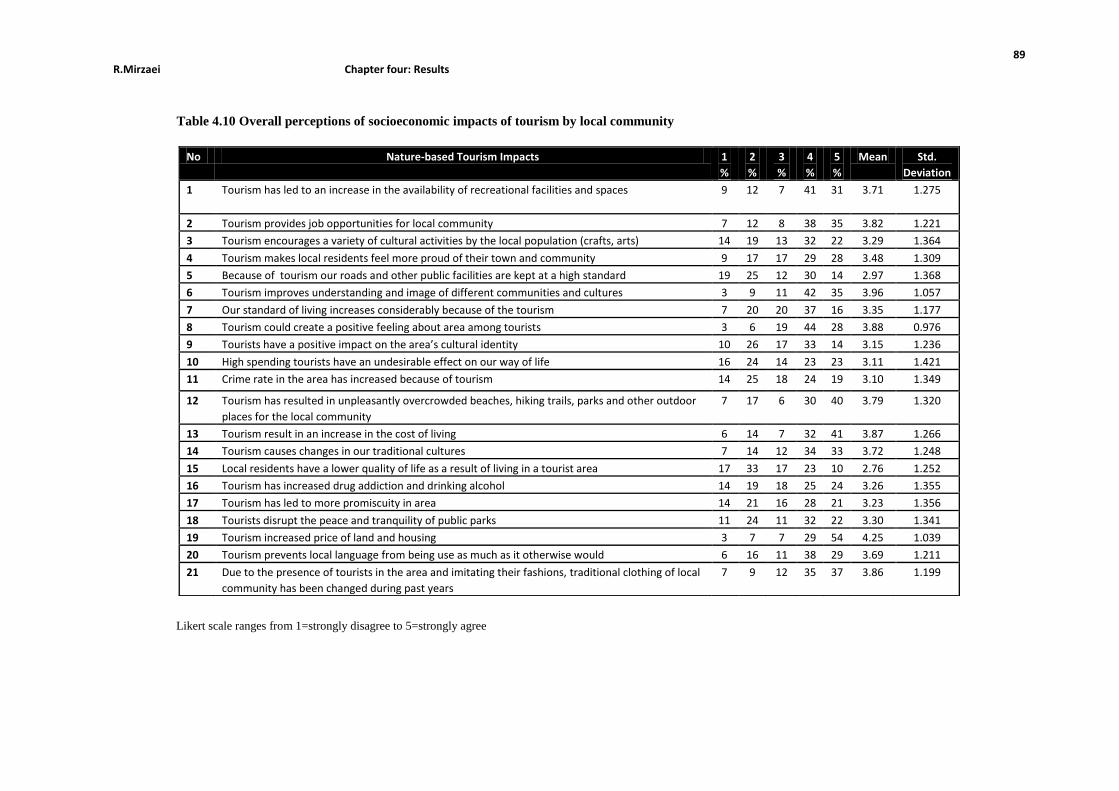
89 R.Mirzaei Chapter four: Results
Table 4.10 Overall perceptions of socioeconomic impacts of tourism by local community
Likert scale ranges from 1=strongly disagree to 5=strongly agree
No Nature-based Tourism Impacts 1
%
2
%
3
%
4
%
5
%
Mean Std.
Deviation
1 Tourism has led to an increase in the availability of recreational facilities and spaces 9 12 7 41 31 3.71 1.275
2 Tourism provides job opportunities for local community 7 12 8 38 35 3.82 1.221
3 Tourism encourages a variety of cultural activities by the local population (crafts, arts) 14 19 13 32 22 3.29 1.364
4 Tourism makes local residents feel more proud of their town and community 9 17 17 29 28 3.48 1.309
5 Because of tourism our roads and other public facilities are kept at a high standard 19 25 12 30 14 2.97 1.368
6 Tourism improves understanding and image of different communities and cultures 3 9 11 42 35 3.96 1.057
7 Our standard of living increases considerably because of the tourism 7 20 20 37 16 3.35 1.177
8 Tourism could create a positive feeling about area among tourists 3 6 19 44 28 3.88 0.976
9 Tourists have a positive impact on the area’s cultural identity 10 26 17 33 14 3.15 1.236
10 High spending tourists have an undesirable effect on our way of life 16 24 14 23 23 3.11 1.421
11 Crime rate in the area has increased because of tourism 14 25 18 24 19 3.10 1.349
12 Tourism has resulted in unpleasantly overcrowded beaches, hiking trails, parks and other outdoor
places for the local community
7 17 6 30 40 3.79 1.320
13 Tourism result in an increase in the cost of living 6 14 7 32 41 3.87 1.266
14 Tourism causes changes in our traditional cultures 7 14 12 34 33 3.72 1.248
15 Local residents have a lower quality of life as a result of living in a tourist area 17 33 17 23 10 2.76 1.252
16 Tourism has increased drug addiction and drinking alcohol 14 19 18 25 24 3.26 1.355
17 Tourism has led to more promiscuity in area 14 21 16 28 21 3.23 1.356
18 Tourists disrupt the peace and tranquility of public parks 11 24 11 32 22 3.30 1.341
19 Tourism increased price of land and housing 3 7 7 29 54 4.25 1.039
20 Tourism prevents local language from being use as much as it otherwise would 6 16 11 38 29 3.69 1.211
21 Due to the presence of tourists in the area and imitating their fashions, traditional clothing of local
community has been changed during past years
7 9 21 53 57 3.86 1.199

90 R.Mirzaei Chapter four: Results
4.4.2 Research question 2: perceptions of environmental impacts
Table 4.11 presents the responses to 10 statements on environmental impacts of nature-
based tourism in Mazandaran. Residents generally have negative perceptions of
environmental impacts of tourism. Respondents perceived the most negative environmental
impacts in form of increasing traffic problems, litter problems, and environmental
degradation due to construction of villas and second-homes.
Over 87% of respondents strongly agree or agree that tourism development increases
the traffic and litter problems. Aligholizadeh et al. (2005) and Ghadami (2007) have found
similar results.
The vast majority of residents (more than 85%) also blamed tourism for environmental
degradation via construction of villas and tourist villages, especially in coastal strip and
forest areas.
More than 56 % of residents agree that tourists increase noise in the area. Less people
agree with this statement might be an indication that conceptual carrying capacity of
residents still has not reached the threshold.
Consistent with the results of previous studies (Rahnemaei et al., 2008; Aligholizadeh et
al., 2010), the respondents approve coasts, forests, and mountainous areas experiences
more litter problems because of the presence of tourists. More than 87 % were agree or
strongly agree with related statements.
Respondents have perceived slightly positively (almost 59%) the statements that
tourism increases local awareness and appreciation of the environment and provides
incentives for conservation of natural resources.

91 R.Mirzaei Chapter four: Results
Table 4.11 overall perceptions of environmental impacts of tourism by local community
Likert scale ranges from 1=strongly disagree to 5=strongly agree
No Nature-based Tourism Impacts 1 % 2
%
3
%
4
%
5 % Mean Std.
Deviation
1 Tourists’ keen interest in natural and cultural sites result in these
sites are cared for than they otherwise would be
17 20 14 28 21 3.16 1.416
2 Tourism helps to increase local awareness and appreciation of the
environment
10 19 13 35 23 3.44 1.289
3 Tourism preserves environment and improves the appearance of
area
22 30 11 24 13 2.46 1.011
4 Tourism provides an incentive for conservation of natural
resources
8 16 17 37 22 3.47 1.228
5 Tourism development increases the traffic problems 2 6 5 29 58 4.34 0.970
6 Tourists increase noise in the area 9 23 12 31 25 3.41 1.315
7 Construction of villas, tourist villages and other tourist facilities
has destroyed the natural environment
3 5 7 41 44 4.18 0.992
8 Tourists increasing pollution in beaches and mountains 6 12 7 33 42 3.92 1.232
9 The quality of natural environment has deteriorated by tourists 8 20 11 40 21 3.46 1.240
10 The area experiences more litter problems because of the
presence of tourists
3 4 6 33 54 4.29 0.979

92 R.Mirzaei Chapter four: Results
4.4.3 Research question three and four: relationship between community concern and
NBT impacts
According to proposed conceptual model (figure 3.2), it was required to examine
whether there is a relationship between community concern and perceived impacts (table
4.12).
For this purpose a Spearman's rank order correlation was run to assess the relationship
between local community concern and positive and negative socioeconomic and
environmental impacts of tourism in Mazandaran.
There was a statistically significant relationship between all variables, so we can reject
the null hypothesis and accept the alternative hypothesis. Therefore, the community
concern has strong correlation with all four types of NBT impacts.
According to the results, there was a strong, negative correlation between community
concern and positive socioeconomic impacts, which was statistically significant (rs (577) =
-.186, p< .0005). Therefore, hypothesis 2a was accepted however, since it is a negative
correlation coefficient between two variables, the correlation is reverse.
There was a strong, positive correlation between community concern and negative
socioeconomic, which was statistically significant (rs (577)= .740, p<.0005). It means that
Hypothesis 2b. was accepted however the correlation is direct and positive.
There was a strong, negative correlation between community concern and positive
environmental impacts, which was statistically significant (rs (577)= -.232, p <.0005).
Therefore, hypothesis 2c was accepted but due to the negative correlation coefficient, the
correlation is reverse.
Also There was a strong, positive correlation between community concern and negative
environmental impacts, which was statistically significant (rs (576)= .458, p< .0005). it
means that hypothesis 2d can be accepted however the correlation is direct and positive.

93 R.Mirzaei Chapter four: Results
Table 4.12 correlation between community concern and overall impacts
variables community concern
Positive socioeconomic impacts Correlation Coefficient -.186**
Sig.
N
.000
579
Negative socioeconomic impacts Correlation Coefficient .740**
Sig.
N
.000
579
Positive environmental impacts Correlation Coefficient -.232**
Sig.
N
.000
579
Negative environmental impacts Correlation Coefficient .458**
Sig.
N
.000
578
It means that local community concernment about their society was strongly associated
with their perception of socioeconomic and environmental impacts of tourism.
**. Correlation is significant at the 0.01 level (2-tailed).

94 R.Mirzaei Chapter four: Results
4.4.4 Research question five and six: relationship between community attachment and
NBT impacts
A Spearman's rank order correlation was run to assess the relationship between local
community attachment to their society and positive and negative socioeconomic and
environmental impacts of tourism in Mazandaran. There was a statistically significant
relationship between three pair of variables, so we can reject the null hypothesis and accept
the alternative hypothesis in all pairs except negative socioeconomic impacts (table 4.13).
Put another way, there was a strong, positive correlation between attachment to the
community and PSE, which was statistically significant (rs (577)= .182, p<.0005). Also
There was a strong, positive correlation between community attachment and positive
environmental impacts, which was statistically significant (rs (577)= .182, p< .0005).
This means that according to the results hypothesis 3a and hypothesis 3c were approved
and accepted.
Table 4.13 correlation between community attachment and overall impacts
variables community attachment
positive socioeconomic impacts Correlation Coefficient .182**
Sig.
N
.000
579
negative socioeconomic impacts Correlation Coefficient .079
Sig.
N
.058
579
positive environmental impacts Correlation Coefficient .182**
Sig.
N
.000
579
negative environmental impacts Correlation Coefficient .129**
Sig.
N
.002
578
Also there was a strong, positive correlation between community attachment and NEI,
which was statistically significant (rs (576)= .129, p< .0005). Therefore, hypothesis 3d was
accepted. There was no significant correlation between community attachment and NSEI
of tourism in Mazandaran and hypothesis 3b was rejected.
**. Correlation is significant at the 0.01 level (2-tailed).

95 R.Mirzaei Chapter four: Results
4.4.5 Research question 7 and 8: relationship between use of tourism facilities and NBT
impacts
A Spearman's rank order correlation was run to assess the relationship between
utilization of tourism facilities by residents and positive and negative socioeconomic and
environmental impacts of tourism in Mazandaran. There was a statistically significant
relationship between positive impacts, so we can reject the null hypothesis and accept the
alternative hypothesis for these two pair of variables (table 4.14).
In other words, there was a strong, positive correlation between utilization of tourism
facilities by residents and positive socioeconomic, which was statistically significant (rs
(577) = .375, p<.0005). In addition, There was a strong, positive correlation between
utilization of tourism facilities by residents and positive environmental impacts, which was
statistically significant (rs (577) = .445, p< .0005).
Table 4.14 correlation between utilization of tourism facilities by residents and overall impacts
variables community attachment
positive socioeconomic impacts Correlation Coefficient .375**
Sig.
N
.000
579
negative socioeconomic impacts Correlation Coefficient -.031
Sig.
N
.451
579
positive environmental impacts Correlation Coefficient .445**
Sig.
N
.000
579
negative environmental impacts Correlation Coefficient -.066
Sig.
N
.113
578
There were no significant correlation between utilization of tourism facilities by
residents and negative socioeconomic impacts of tourism in Mazandaran. It might indicate
that those residents who have utilized tourism facilities and services were perceived more
positive impacts. Therefore, Hypothesizes 4a and 4 c were approved by results.
**. Correlation is significant at the 0.01 level (2-tailed).

96 R.Mirzaei Chapter four: Results
4.4.6 Research question 9 and 10: relationship between residents’ understanding of
economic benefits remain in the society and NBT impacts
Based on proposed conceptual model (figure 3.2), the relationship between general
understanding of residents from the extent of tourism’s economic benefits that remain in
the society and overall impacts of tourism was examined (table 4.15).
For this purpose a Spearman's rank order correlation was run to assess the relationship
between general understanding of economic benefits and positive and negative
socioeconomic and environmental impacts of tourism in Mazandaran. There was a
statistically significant relationship between all variables, so we can reject the null
hypothesis and accept the alternative hypothesis for all four pairs of variables.
In other words, there was a strong, positive correlation between general understanding
of economic benefits and positive socioeconomic, which was statistically significant (rs
(577) = .226, p<.0005) so, hypothesis 5a was approved.
In addition, There was a strong, positive correlation between general understanding of
economic benefits and positive environmental impacts, which was statistically significant
(rs (577) = .248, p< .0005) so hypothesis 5c was approved.
Table 4.15 correlation between general understanding of economic benefits and overall impacts
variables General understanding of economic benefits
positive socioeconomic impacts Correlation Coefficient .226**
Sig. N
.000 579
negative socioeconomic impacts Correlation Coefficient -.134**
Sig. N
.001 579
positive environmental impacts Correlation Coefficient .248**
Sig. N
.000 579
negative environmental impacts Correlation Coefficient -.169**
Sig. N
.000 578
**. Correlation is significant at the 0.01 level (2-tailed).
While, There was a strong, negative correlation between general understanding of
economic benefits and negative socioeconomic impacts, which was statistically significant
(rs (577)= -.134, p< .0005) and there was a strong, negative correlation between general
understanding of economic benefits and negative environmental impacts, which was

97 R.Mirzaei Chapter four: Results
statistically significant (rs (576)= -.169, p <.0005) so, hypothesis 5b and hypothesis5d were
approved.
This might indicate those residents who believe that local community gains economic
benefit from tourism development are likely perceived more positive and less negative
impacts of tourism.

98 R.Mirzaei Chapter four: Results
4.4.7 Research question 11 Correlation between overall socioeconomic and
environmental impacts
Results display that positive socioeconomic (PSEI) impacts are positive significantly
correlated with positive environmental impacts (PEI) and negative significantly correlated
with negative socioeconomic (NSEI) and negative environmental impacts (NEI) (table
4.16).
NSEI are positive significantly related with PEI and negative significantly correlated
with NEI. Positive environmental impacts are negatively correlated with NEI.
Generally all negative impacts are significantly correlated with each other that cause the
high percentage of responses to negative socioeconomic (table 4.10) and negative
environmental impacts statements (table 4.11).
It can be interpreted that, those who perceived more NSEI are likely perceived more
NEI. The negative correlation between negative and positive impacts could explain the
relatively low mean of PSEI and PEI.
Table 4.16 Correlation between overall socioeconomic and environmental impacts
PSEI NSEI PEI NEI
PSEI
Spearman Correlation 1.000 -.164**
.433**
-.158**
Sig. (2-tailed) .000 .000 .000
N 587 583 581
NSEI
Spearman Correlation
1.000
-.126**
.611**
Sig. (2-tailed) .002 .000
N 583 581
PEI
Spearman Correlation
1.000
-.126**
Sig. (2-tailed) .002
N 581
NEI
Spearman Correlation
1.000
Sig. (2-tailed)
N
**. Correlation is significant at the 0.01 level (2-tailed).

99 R.Mirzaei Chapter four: Results
4.4.8 Research question 12: Impacts of socio-demographic characteristics on
perceived impacts
Based on conceptual model of research (figure 3.2) it was assessed if there is any
difference between residents with different socio-demographic characteristics in their
attitudes towards tourism impacts and the level of community concern and attachment,
utilization of tourism facilities and services and general understanding of economic
benefits for local community.
4.4.8.1 Relationship between gender and overall impacts
A Mann-Whitney test was run to determine if there were differences in perceived
impacts, community concern, community attachment, utilization of tourism facilities and
general understanding of economic benefits for local community between males and
females residents (table 4.17).
There was statistically significant difference in perceived negative environmental
impacts between males (Mdn = 4.00) and females (Mdn = 4.20), z = 2.530, p = .011. the
results shows the females perceived NEI more than males.
Table 4.17 relationship between gender and main variables
variables Mdn male
Mdn female
sig. (Mann-Whitney U test)
positive socioeconomic impacts 3.71 3.57 0.170
negative socioeconomic impacts 3.60 3.70 0.219
positive environmental impacts 3.50 3.50 0.322
negative environmental impacts 4.00 4.20 0.011
community concern 3.66 3.66 0.816
community attachment 5.00 4.50 0.012
utilization of tourism facilities by residents 3.00 3.00 0.754
General understanding of economic benefits 3.00 3.00 0.592
Asymptotic significances are displayed. The significance level is .05
In addition, there was statistically significant difference in attachment to the community
between males (Mdn = 5.00) and females (Mdn = 4.50), z = -2.50, p = .012. The males feel
mor attachment to the society than females. There were no statistically significant
difference in other variables scores between males and females.

100 R.Mirzaei Chapter four: Results
4.4.8.2 Relationship between level of education and overall impacts
A Mann-Whitney test was run to determine if there were differences in perceived
impacts, community concern and attachment, utilization of tourism facilities and general
understanding of economic benefits for local community between respondents with
different level of education (table 4.18).
There was statistically significant difference in perceived PSEI between residents with
up to diploma degree (Mdn = 3.71) and those with university degree (Mdn = 3.57), z = -
2.86, p = .004.
Table 4.18 Relationship between level of education and main variables
variables up to
diploma
university
degree
sig. (Mann-
Whitney U test)
positive socioeconomic impacts 3.71 3.57 0.004
negative socioeconomic impacts 3.60 3.66 0.771
positive environmental impacts 3.75 3.25 0.000
negative environmental impacts 4.00 4.00 0.958
community concern 3.33 3.66 0.086
community attachment 5.00 4.50 0.000
utilization of tourism facilities by residents 3.16 3.00 0.000
General understanding of economic benefits 3.00 3.00 0.188
Asymptotic significances are displayed. The significance level is .05.
The respondents perception of positive environmental impacts was statistically
significant difference between residents with up to diploma degree (Mdn = 3.75) and those
with university degree (Mdn = 3.66), z = -5.08, p = .000. Respondents whit up to diploma
degree perceived PSEI and PEI more than residents with university degree.
In addition, there was statistically significant difference in attachment to the
community between residents with up to diploma degree (Mdn = 5.00) and those with
university degree (Mdn = 4.50), z = -3.91, p = .000. There was also statistically significant
difference in utilization of tourism facilities between residents with up to diploma degree
(Mdn = 3.16) and those with university degree (Mdn = 3.00), z = -3.49, p = .000.
There were no statistically significant differences between level of education and other
variables namely NSEI and NEI, community concern and general understanding of
economic benefits and the null hypothesizes were retained.

101 R.Mirzaei Chapter four: Results
4.4.8.3 Relationship between marital status and overall impacts
A Mann-Whitney test was run to determine if there were differences in perceived
impacts, community concern and attachment, utilization of tourism facilities and general
understanding of economic benefits for local community between respondents with
different marital status (table 4.19).
There was statistically significant difference in perception of PEI between single
(Mdn = 3.25) and married (Mdn = 3.50), z = -.212, p = .000 residents. There was
statistically significant difference in attachment to the community between single (Mdn =
4.50) and married (Mdn = 5.00), z = -2.76, p = .004 residents.
Table 4.19 Relationship between marital status and main variables
Marital status single married sig. (Mann-Whitney U
test)
positive socioeconomic impacts 3.71 3.57 0.832
negative socioeconomic impacts 3.50 3.70 0.233
positive environmental impacts 3.25 3.50 0.041
negative environmental impacts 4.00 4.00 0.882
community concern 3.33 3.66 0.423
community attachment 4.50 5.00 0.000
utilization of tourism facilities by residents 3.00 3.00 0.891
General understanding of economic benefits 3.00 3.00 0.666
Asymptotic significances are displayed. The significance level is .05.
According to the results, married respondents were more attached to the community and
perceived PEI more than single respondents
There were no statistically significant differences between marital status and other
variables including negative socioeconomic and environmental impacts, community
concern and general understanding of economic benefits and the null hypothesizes
retained.

102 R.Mirzaei Chapter four: Results
4.4.8.4 Research question 13: relationship between employment in tourism sectors
and overall impacts
A Mann-Whitney test was run to determine if there were differences in perceived
impacts, community concern and attachment, utilization of tourism facilities and general
understanding of economic benefits for local community between respondents with
different marital status (table 4.20).
Table 4.20 Relationship between employment in tourism sectors and main variables
Asymptotic significances are displayed. The significance level is .05.
Surprisingly, there were no statistically significant differences between employment in
tourism sectors and all main variables and all null hypothesizes were retained.
variables do not working in tourism sector
working in tourism sector
sig. (Mann-Whitney U test)
positive socioeconomic impacts 3.635 3.689 0.530
negative socioeconomic impacts 3.558 3.612 0.378
positive environmental impacts 3.355 3.349 0.975
negative environmental impacts 3.951 3.912 0.385
community concern 3.429 3.464 0.633
community attachment 4.394 4.404 0.732
utilization of tourism facilities by residents
2.997 2.979 0.982
General understanding of economic benefits
3.059 3.028 0.641

103 R.Mirzaei Chapter four: Results
4.4.8.5 Relationship between age and overall impacts
A Kruskal-Wallis test was run to determine if there were differences in perceived
impacts, community concern and attachment, utilization of tourism facilities and general
understanding of economic benefits for local community between residents in different age
groups (table 4.21).
NEI scores were high (Mdn= 4.00) in all age groups but the difference were not
statistically important. This might indicate the consensus of respondents in perceptions of
the negative environmental impacts of tourism.
There was statistically significant difference in attachment to the community between
different age groups with 18 to 25 (Mdn = 4.50), 25 to 35 (Mdn = 4.75), 35 to 45
(Mdn = 5.00), 45 to 65 (Mdn = 5.00) and over 65 (Mdn = 5.00), χ2
(4) = 33.42, p = .000. In
addition, there was statistically significant difference in utilization of tourism facilities by
residents between different age groups with 18 to 25 (Mdn = 3.00), 25 to 35 (Mdn = 3.00),
35 to 45 (Mdn = 3.00), 45 to 65 (Mdn = 3.00) and over 65 (Mdn = 3.33), χ2(4) =
10.21, p = .037.
There were no statistically significant differences between age groups and other
variables including overall impacts, community concern and general understanding of
economic benefits and the null hypothesizes retained.
Table 4.21 Relationship between age and main variables
variables 18 to 25 25 to 35 35 to 45 45 to 65 over 65 sig. (Kruskal- Wallis Test)
positive socioeconomic impacts 3.71 3.77 3.57 3.42 4.00 0.075
negative socioeconomic impacts
3.60 3.65 3.60 3.70 3.60 0.723
positive environmental impacts 3.50 3.25 3.50 3.50 3.50 0.265
negative environmental impacts
4.00 4.00 4.00 4.00 4.99 0.917
community concern 3.33 3.66 3.33 3.66 2.66 0.537
community attachment 4.50 4.75 5.00 5.00 4.50 0.000
utilization of tourism facilities by residents
3.00 3.00 3.00 3.00 3.33 0.037
General understanding of economic benefits
3.00 3.00 3.00 3.00 3.25 0.642
Asymptotic significances are displayed. The significance level is .05.
Results indicate the resident over 45 were more attached to the community and were
more in favor of tourism facilities and services.

104 R.Mirzaei Chapter four: Results
4.4.8.6 Relationship between length of residence and overall impacts
A Kruskal-Wallis test was run to determine if there were differences in perceived
impacts, community concern and attachment, utilization of tourism facilities and general
understanding of economic benefits for local community between local populations with
different length of residence (table 4.22).
Table 4.22 Relationship between length of residence and main variables
variables under 5
years
5 to 15
years
more than
15 years
sig. (Kruskal-
Wallis Test)
positive socioeconomic impacts 3.71 3.57 3.71 0.978
negative socioeconomic impacts 3.70 3.70 3.60 0.527
positive environmental impacts 3.50 3.50 3.50 0.957
negative environmental impacts 4.00 4.20 4.00 0.070
community concern 3.66 3.33 3.66 0.183
community attachment 4.00 4.50 5.00 0.000
utilization of tourism facilities by residents 3.00 3.00 3.00 0.569
General understanding of economic benefits 3.25 3.00 3.00 0.143
Asymptotic significances are displayed. The significance level is .05.
Level of attachment to the community scores increased from under five years residence
in the area (Mdn = 4.00), 5 to 15 years (Mdn = 4.50) and more than 15 years (Mdn = 5.00)
and the difference was statistically significant χ 2(2) = 42.39, p = .000.
According to the results, the longer the length of stay in the area, the greater the
attachment to the community.
There were no statistically significant differences between length of residence and other
variables including overall impacts, community concern, utilization of tourism facilities
and general understanding of economic benefits, therefore the null hypothesizes retained.

105 R.Mirzaei Chapter four: Results
4.4.8.7 Relationship between level of income and overall impacts
A Kruskal-Wallis test was run to determine if there were differences in perceived
impacts, community concern and attachment, utilization of tourism facilities and general
understanding of economic benefits for local community between local populations with
different level of incomes (table 4.23).
Table 4.23 Relationship between level of income and main variables
variables less than 3,500,000
Toman
3,500,000 to 8,500,000
Toman
8,500,000 to 15,000,000
Toman
more than 15,000,000
Toman
sig. (Kruskal-
Wallis Test)
positive socioeconomic impacts
3.57 3.71 3.71 3.85 0.375
negative socioeconomic impacts
3.70 3.60 3.60 3.50 0.488
positive environmental impacts
3.50 3.50 3.50 3.75 0.422
negative environmental impacts
4.00 4.00 3.80 3.80 0.257
community concern 3.33 3.66 3.33 3.00 0.150
community attachment 5.00 5.00 5.00 5.00 0.309
utilization of tourism facilities by residents
3.00 3.00 3.00 3.33 0.621
General understanding of economic benefits
3.00 3.00 3.25 3.25 0.021
Asymptotic significances are displayed. The significance level is .05.
There was statistically significant difference in general understanding of economic
benefits between different income groups with less than 3,500,000 Toman (Mdn = 3.00),
from 3,500,000 to 8,500,000 Toman (Mdn = 3.00), from 8,500,000 to 15,000,000 Toman
(Mdn = 3.25) and more than 15,000,000 Toman (Mdn = 3.25), χ2(3) = 9.74, p = .021.
The results show residents with higher incomes believed that tourism benefits more for
local community than for foreigners. This may be due that most of the tourism businesses
owners have higher income than other residents may do.
There were no statistically significant differences between income groups and other
variables including overall impacts, community concern, community attachment, and
utilization of tourism facilities, therefore the null hypothesizes retained.

106 R.Mirzaei Chapter four: Results
4.4.8.8 Relationship between place of residence and overall impacts
A Mann-Whitney test was run to determine if there were differences in perceived
impacts, community concern and attachment, utilization of tourism facilities and general
understanding of economic benefits among residents with different place of residence
(table 4.24). There was statistically significant difference in all main variables except
negative socioeconomic impacts between residences in Kelardasht and Babolsar.
There was statistically significant difference in perceived positive socioeconomic
impacts between residences of Kelardasht (Mdn = 3.42) and residences of Babolsar (Mdn =
3.71), z = 2.530, p = .000. It means that residents of Babolsar perceived more PSEI than
Kelardasht’s residents that might be due to the more job opportunities and facilities in
Babolsar compared with Kelardasht.
Table 4.24 Relationship between place of residence and main variables
variables Kelardasht Babolsar sig. (Mann-Whitney U test)
positive socioeconomic impacts 3.42 3.71 0.000
negative socioeconomic impacts 3.60 3.60 0.572
positive environmental impacts 3.25 3.50 0.000
negative environmental impacts 4.00 4.00 0.031
community concern 3.66 3.33 0.005
community attachment 5.00 4.50 0.040
utilization of tourism facilities by residents 3.00 3.00 0.001
General understanding of economic benefits 2.75 3.25 0.000
Asymptotic significances are displayed. The significance level is .05.
A statistically significant difference was observed in perceived PEI between residences
of Kelardasht (Mdn = 3.25) and residences of Babolsar (Mdn = 3.50), z = 4.02, p = .000.
There was statistically significant difference in perceived NEI between residences of
Kelardasht (Mdn = 4.00) and residences of Babolsar (Mdn = 4.00), z = 2.16, p = .031. The
high scores (4.00) of negative environmental impacts might be due to the very high
intensity of environmental degradation in both cities.
Level of concern about the community was also statistically significant different by
residences of Kelardasht (Mdn = 3.66) and residences of Babolsar (Mdn = 3.33), z = -
2.18, p = .005. In addition, there was statistically significant difference in community
attachment between residences of Kelardasht (Mdn = 5.00) and residences of Babolsar
(Mdn = 4.50), z = -2.05, p = .040. The higher scores of community concern and community

107 R.Mirzaei Chapter four: Results
attachment in Kelardasht compared with Babolsar might be due to the social structure and
demographic profiles in Kelardasht that is more consist of ethnic groups with closer social
relationships, which in turn will strengthen the community concern and attachment.
There was statistically significant difference in utilization of tourism facilities and
services between residences of Kelardasht (Mdn = 3.00) and residences of Babolsar
(Mdn = 3.00), z = 3.395, p = .001.
The general understanding of the level of economic benefits that remain the society was
statistically significant difference between residences of Kelardasht (Mdn = 2.75) and
residences of Babolsar (Mdn = 3.25), z = 6.79, p = .000. The higher score (3.25) in
Babolsar could be because of the diversification of economic activities related to tourism
in Babolsar compared with Kelardasht.

108 R.Mirzaei Chapter four: Results
4.4.9 Modeling support for nature based tourism development
A standard multiple regression was run to determine the overall fit of the proposed
model (figure 4.2) and the relative contribution of each of the predictors variables to the
total variance explained. For this purpose the independence of cases, linearity,
homoscedasticity and multicollinearity of data were examined (see Appendix IV).
A multiple regression was run to predict PSEI from community concern, community
attachment, utilization of tourism facilities by residents and general understanding of
economic benefits of tourism. There was independence of residuals, as assessed by a
Durbin-Watson statistic of 2.035.
The assumptions of linearity, independence of errors, homoscedasticity, unusual points
and normality of residuals were met. These variables statistically significantly predicted
PSCI, F (4, 574) = 39.01, p < .05, adj. R2 = .21. All four variables added statistically
significantly to the prediction, p < .05. Regression coefficients and standard errors can be
found in table 4.25.
Table 4.25 multiple regression results of predictors for PSEI
Sig. Beta SE B Variable
.000 .206 2.063 (Constant)
.012 -.095 .028 -.070 community concern
.000 .147 .027 .107 community attachment
.000 .301 .029 .229 utilization of tourism facilities by residents
.000 .216 .037 .211 General understanding of economic benefits of tourism
a. Dependent Variable: positive socioeconomic impacts
Note: Significant level at p<.05, R2 = .21, B=unstandardized regression coefficient, SE= standard error of the coefficient, Beta= standard coefficient
The model explained 21% of the variance in attitudes towards positive socioeconomic
impacts of NBT in Mazandaran (figure 4.2).

109 R.Mirzaei Chapter four: Results
A multiple regression was run to predict negative socioeconomic impacts from
community concern, community attachment, utilization of tourism facilities by residents
and general understanding of economic benefits of tourism.
There was independence of residuals, as assessed by a Durbin-Watson statistic of 1.856.
The assumptions of linearity, independence of errors, homoscedasticity, unusual points and
normality of residuals were met. These variables statistically significantly predicted
NSEI, F (4, 574) = 177.94, p < .05, adj. R2 = .55.
Community concern and community attachment added statistically significantly to the
prediction, p < .05. Regression coefficients and standard errors can be found in table 4.26.
There were no significant correlation between utilization of tourism facilities by
residents, general understanding of economic benefits of tourism and NSEI.
Table 4.26 multiple regression results of predictors for NSEI
Sig. Beta SE B Variable
.000 .169 1.265 (Constant)
.000 .737 .023 .590 community concern
.004 .081 .022 .065 community attachment
.105 .046 .024 .038 utilization of tourism facilities by residents
.178 -.038 .030 -.041 General understanding of economic benefits of tourism
a. Dependent Variable: negative socioeconomic impacts Note: Significant level at p<.05, R2 = .55, B=unstandardized regression coefficient, SE= standard error of the coefficient, Beta= standard coefficient
The model explained 55% of the variance in attitudes towards negative socioeconomic
impacts of NBT in Mazandaran.

110 R.Mirzaei Chapter four: Results
A multiple regression was run to predict positive environmental impacts from
community concern, community attachment, utilization of tourism facilities by residents
and general understanding of economic benefits of tourism. There was independence of
residuals, as assessed by a Durbin-Watson statistic of 1.909. The assumptions of linearity,
independence of errors, homoscedasticity, unusual points and normality of residuals were
met.
These variables statistically significantly predicted PEI, F (4, 574) = 57.56, p < .05,
adj. R2 = .28. All four variables added statistically significantly to the prediction, p < .05.
Regression coefficients and standard errors can be found in table 4.27.
Table 4.27 multiple regression results of predictors for PEI
Sig. Beta SE B Variable
.000 .280 1.398 (Constant)
.000 -.170 .038 -.179 community concern
.002 .110 .037 .115 community attachment
.000 .385 .039 .417 utilization of tourism facilities by residents
.000 .190 .050 .265 General understanding of economic benefits of tourism
a. Dependent Variable: positive environmental impacts Note: Significant level at p<.05, R2 = .28, B=unstandardized regression coefficient, SE= standard error of the coefficient, Beta= standard coefficient
The model explained 28% of the variance in attitudes towards positive environmental
impacts of NBT in Mazandaran.

111 R.Mirzaei Chapter four: Results
A multiple regression was run to predict negative environmental impacts from
community concern, community attachment, utilization of tourism facilities by residents
and general understanding of economic benefits of tourism. There was independence of
residuals, as assessed by a Durbin-Watson statistic of 1.880. The assumptions of linearity,
independence of errors, homoscedasticity, unusual points and normality of residuals were
met.
These variables statistically significantly predicted NEI, F (4, 574) = 50.90, p < .05,
adj. R2 = .26. Community concern, community attachment and general understanding of
economic benefits of tourism added statistically significantly to the prediction, p < .05.
Table 4.28 multiple regression results of predictors for NEI
Sig. Beta SE B Variable
.000 .239 2.354 (Constant)
.000 .468 .032 .413 community concern
.000 .140 .032 .123 community attachment
.403 -.031 .034 -.028 utilization of tourism facilities by residents
.021 -.085 .043 -.100 General understanding of economic benefits of tourism
a. Dependent Variable: negative environmental impacts Note: Significant level at p<.05, R2 = .26, B=unstandardized regression coefficient, SE= standard error of the coefficient, Beta= standard coefficient
Regression coefficients and standard errors can be found in table 4.28. There was no
significant correlation between utilization of tourism facilities by residents and NEI.

112 R.Mirzaei Chapter four: Results
4.4.10 Research questions 14 to 21: path analysis to predict support for tourism
development
A multiple regression was run to predict support for tourism development from PSEI,
NSEI, PEI, NEI, community concern, community attachment, utilization of tourism
facilities by residents and general understanding of economic benefits of tourism. There
was independence of residuals, as assessed by a Durbin-Watson statistic of 1.920. The
assumptions of linearity, independence of errors, homoscedasticity, unusual points and
normality of residuals were met.
These variables statistically significantly predicted support for tourism development, F
(4, 574) = 56.79, p < .05, adj. R2 = .44. Table 4.29 shows PSEI, NEI and community
concern added statistically significantly to the prediction, p < .05.
Table 4.29 multiple regression results of predictors for support for tourism development
Model B B SE Beta Sig.
(Constant) .182 .287
.527
positive socio-cultural impacts .713 .051 .515 .000
negative socio-cultural impacts .037 .067 .029 .582
positive environmental impacts -.056 .038 -.057 .140
negative environmental impacts -.113 .047 -.097 .017
community concern .125 .048 .123 .010
community attachment -.031 .033 -.031 .343
utilization of tourism facilities by residents .333 .038 .316 .000
General understanding of economic benefits of tourism .011 .045 .008 .800
a. Dependent Variable: Support for tourism development Note: Significant level at p<.05, R2 = .44, B=unstandardized regression coefficient, SE= standard error of the coefficient, Beta= standard coefficient
The model explained 44% of the variance in support for nature-based tourism
development in Mazandaran. Regression coefficients and standard errors can be found in
table 4.29. Figure 4.2 depicts the fit proposed model of support for nature based tourism
development.
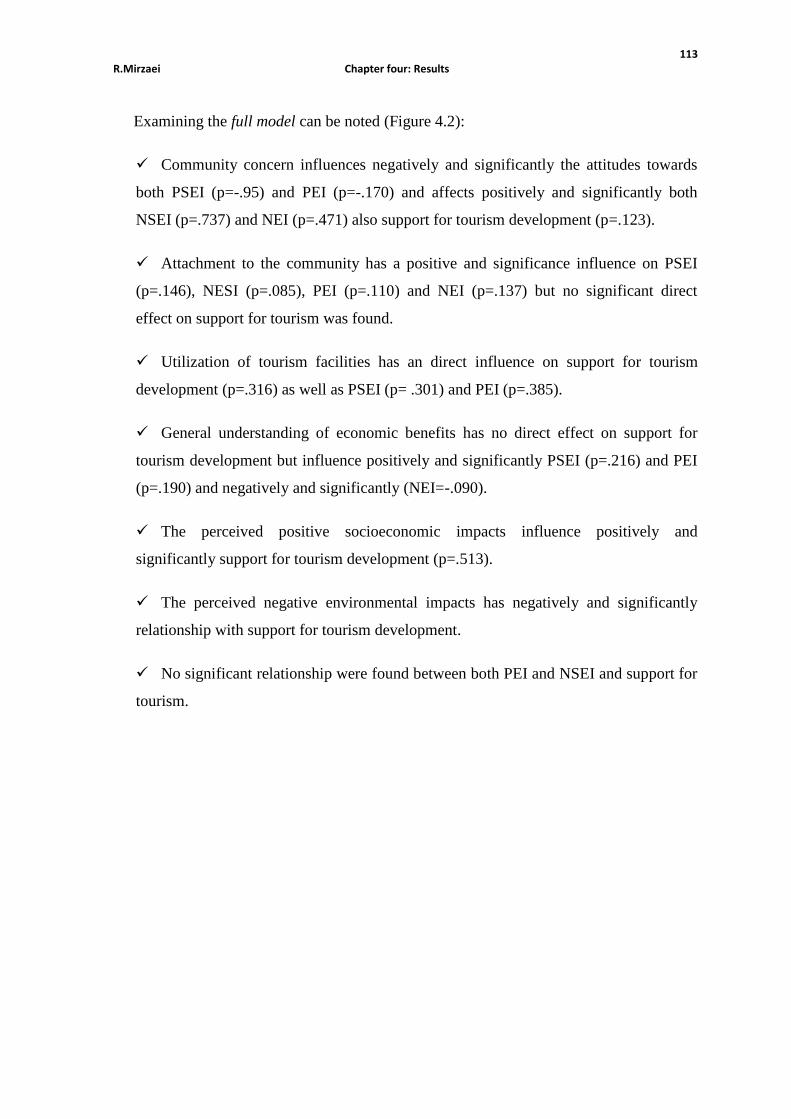
113 R.Mirzaei Chapter four: Results
Examining the full model can be noted (Figure 4.2):
Community concern influences negatively and significantly the attitudes towards
both PSEI (p=-.95) and PEI (p=-.170) and affects positively and significantly both
NSEI (p=.737) and NEI (p=.471) also support for tourism development (p=.123).
Attachment to the community has a positive and significance influence on PSEI
(p=.146), NESI (p=.085), PEI (p=.110) and NEI (p=.137) but no significant direct
effect on support for tourism was found.
Utilization of tourism facilities has an direct influence on support for tourism
development (p=.316) as well as PSEI (p= .301) and PEI (p=.385).
General understanding of economic benefits has no direct effect on support for
tourism development but influence positively and significantly PSEI (p=.216) and PEI
(p=.190) and negatively and significantly (NEI=-.090).
The perceived positive socioeconomic impacts influence positively and
significantly support for tourism development (p=.513).
The perceived negative environmental impacts has negatively and significantly
relationship with support for tourism development.
No significant relationship were found between both PEI and NSEI and support for
tourism.

114 R.Mirzaei Chapter four: Results
Figure 4.2 Fit model of support for tourism development
Support for tourism development
.316
e=.88
e=.85
.123
.515
-.097
-.095
.737
-.170
.147
.468
.081
.110
.140
-.085
.385
.301
.216
.190
.75
PSEI
NSEI
NEI
CC
CA
UT
ECRC
PEI

115 R.Mirzaei Chapter four: Results
4.4.11 Decomposition of the correlation between exogenous variables and tourism
development
Table3 4.30 to 4.34 illustrates the results of decomposition of the correlation between
independent variables and support for tourism development.
The total influence of community concern on support for tourism development (.0597) is
less than direct influence of this variable on the support for tourism (.123). The negative
relationship of this variable with PSEI and the strongly positive influence on NEI which has a
negative effect on support for tourism development reduced the total influence of community
concern on support for tourism development (.0597).
Table 4.30 Decomposition of the correlation between community concern and support for tourism
development
Community concern
Variable A Effect of CC on perceived impacts
B Effect on support for tourism development
(A×B) Indirect effect
Percentage of total effect on support for tourism
Community concern .123* 205.88 PSEI -.095 .515* -.0489 -81.89 NSEI .737* .029 .0213 35.77 PEI -.170* -.057 .0099 16.21 NEI .468* -.097* -.0453 -75.98 Total indirect effects -.0632
Total effects .0597 100

116 R.Mirzaei Chapter four: Results
The strength and direction of the influence of community attachment on support for
tourism development has been changed due to the indirect effect of this variable on PSEI
(table 4.31). While the direct effect of community attachment on support for tourism is -.031
the total effect is .0272.
Table 4.31 Decomposition of the correlation between community attachment and support for tourism
development
Community attachment
Variable A Effect of CA on perceived impacts
B Effect on support for tourism development
(A×B) Indirect effect
Percentage of total effect on support for tourism
Community attachment -.031 -113.95 PSEI .147* .515* .0757 278.28 NSEI .081* .029 .0023 8.63 PEI .110* -.057 -.0062 -23.04 NEI .140* -.097* -.0135 -49.91 Total indirect effects .0582
Total effects .0272 100
The direct relationship between utilization of tourism facilities by residences (.316) and
support for tourism development accounts for 70.63% of total effect (.447) of this variable.
The indirect effects of this variable on PSEI explain the remaining effect (table 4.32.
Table 4.32 Decomposition of the correlation between utilization of tourism facilities and tourism
development
Utilization of tourism facility and services by residents
Variable A Effect of UT on perceived impacts
B Effect on support for tourism development
(A×B) Indirect effect
Percentage of total effect on support for tourism
UT .316* 70.63 PSEI .301* .515* .1550 34.64 NSEI .046 .029 .0013 0.29 PEI .385* -.057 -.0219 -4.90 NEI -.031 -.097* -.0030 -0.672 Total indirect effects .1313
Total effects .4473 100

117 R.Mirzaei Chapter four: Results
Table 4.33 Decomposition of the correlation between general understanding of economic benefits of
tourism and support for tourism development
General understanding of economic benefits of tourism
Variable A Effect of ECRC on perceived impacts
B Effect on support for tourism development
(A×B) Indirect effect
Percentage of total effect on support for tourism
ECRC - .008 - 6.92 PSEI .216* .515* .1112 96.26 NSEI -.038 .029 -.0011 -.95 PEI .190* -.057 -.0108 -9.37 NEI -.085* -.097* .0082 7.13 Total indirect effects .1075
Total effects 0.1155 100
The total effect of general understanding of tourism benefits of tourism on support for
tourism (.115) is increased compare to its direct influence (.008) because of the indirect
positive relationships with PSEI (table 4.33).
4.4.12 Path analysis to predict support for tourism development in reduced model
A multiple regression was run to predict support for tourism development from positive
socioeconomic impacts, negative environmental impacts, community concern, community
attachment, utilization of tourism facilities by residents and general understanding of
economic benefits of tourism.
Some of the path coefficients for model were derived from multiple regression analyses
(part 4.3.9) and multiple regression analyses for reduced model (table 4.34). For the reduced
model three layers of multiple regressions were used:
Figure 4.3 shows the reduced model in which all the above-mentioned effects were
regarded. For the reduced model three layers of multiple regressions were used:
1) With PSEI as criterion and community concern, community attachment, utilization of
tourism facilities by residents and general understanding of economic benefits of tourism
as predictors.
2) With NEI as criterion and community concern, community attachment, utilization of
tourism facilities by residents and general understanding of economic benefits of tourism
as predictors.

118 R.Mirzaei Chapter four: Results
3) With support for more tourism development as criterion and CC, CA, UT, EB, PSEI and
NEI as predictors.
There was independence of residuals, as assessed by a Durbin-Watson statistic of 1.919.
The assumptions of linearity, independence of errors, homoscedasticity, unusual points and
normality of residuals were met. All variables statistically significantly predicted support for
tourism development, F (4, 576) = 75.26, p < .05, adj. R2 = .44. Regression coefficients and
standard errors can be found in table 4.34.
Table 4.34 multiple regression results of predictors for support for tourism in reduced model
Sig. Beta SE B Variable
.725 .287 .086 (Constant)
.000 .494 .051 .684 Positive socioeconomic impacts
.008 -.095 .047 -.110 Negative environmental impacts
.000 .147 .048 .151 Community concern (CC)
.000 .299 .038 .314 Utilization of tourism services (UT) a. Dependent Variable: support for tourism development Note: Significant level at p<.05, R2 = .44, B=unstandardized regression coefficient, SE= standard error of the coefficient, Beta= standard coefficient
Figure 4.3 illustrates an input path diagram representing proposed reduced model.
Figure 4.3 Reduced model of support for tourism development
-.095
.468
.147
.140
.301
-.085
.216
e=.88
e=.85
.299
.494
-.095
.147
Support for tourism
development
CA
UT
e=.74
CC
ECRC
PSEI
NEI

119 R.Mirzaei Chapter four: Results
Testing the reduced model involves comparing how well it fits the data compared to how
well the full model fits the data.
Fit of the full model = 1- 0.89²×0.85²×0.75² = 0.678
Fit of the reduced model = 1- 0.882×0.85
2×0.75
2 = 0.676
The summary statistic showing the relative fit of the reduced model to the full model is
= = 0.9907
The redurced model like full model fit the data.
1 - Fit of full model
1 - Fit of reduced model
1 - 0.678
1 – 0.676

R.Mirzaei Chapter Five: Tourism development in Mazandaran 120
Chapter 5: Tourism development in Mazandaran
5.1 Iran at a Glance
Iran has been in Persian literature the title of the country since Sassanian era (224-651
BC) and became the officially international title for the country in 1935. In Western
countries, Iran had been traditionally known as Persia. Iran located in southwest Asia in the
Middle East region. Around 75 million people live in an area of 1,648,195 square
kilometer (SCI, 2011). Google Maps (2013) represents the location of Iran in relation to
neighboring countries (Map 5.1).
Map 5.1 Iran
Source: Google Maps, 2013
Afghanistan
Pakistan
Turkey

R.Mirzaei Chapter Five: Tourism development in Mazandaran 121
Iran faces to Persian Gulf and Gulf of Oman on the south, Caspian Sea, Turkmenistan,
Azerbaijan and Armenia on the north, Afghanistan and Pakistan on the East and Turkey
and Iraq on the west. Table 5.1 shows length of borderlines of Iran.
Table 5.1 Length of Iran’s borderlines (Kilometer)
Total Iran-
Iraq
Iran-
Turkey
Iran-
Torkemanestan
Iran-
azarbaijan
Iran-
armenia
Northern
coastline
Iran-
Afghanistan
Iran-
pakistan
Southern
coastline
8865 1609 511 1205 759 48 765 945 978 2045
Source: SCI (2011)
The landscape of Iran is dominated by Alborz and Zagros mountain ranges, two vast
deserts namely Dasht-e Kavir and Dasht-e Lut, two coastal areas of Persian Gulf , to the
south with around 2045 km length, and Caspian Sea, to the north around 765 km length,
and several rivers which drain into the Persian Gulf, Caspian Sea or the desert areas of the
Central Plateau (Map 5.2).
Map 5.2 Topography of Iran
Source: Iran Travel and Tourism Organization (ITTO), 2002

R.Mirzaei Chapter Five: Tourism development in Mazandaran 122
The Alborz Range stretches parallel to the Caspian Sea in the north and the highest
peak is Damavand at 5,671 meters. The Zagros Range runs parallel to the Persian Gulf to
the southeast and the highest peak is Dena at 4,409 meters. Iran’s forest area is estimated at
about 14,202,559 ha (equal to 9 percent of the country’s land area) and are divided into
two areas including the Caspian forests (the Hyrcanyan forests) in the north which known
as the oldest forests in the world and dry and semi-dry forests (Forest, Range & Watershed
Organization (FRWO), 2013a). The two deserts of the Central Iranian Plateau cover
around 20% of Iran’s total land area (FRWO, 2013b).
5.1.1 Iran’s Climate
The climate of Iran is influenced by its location and above-mentioned geographical
characteristics. Iran has various climates; the range between the maximum and minimum
daily temperatures is up to 40 degree centigrade and while there is 2000mm of
precipitation in the Caspian Sea coasts, central part receives less than 50 mm (FRWO,
2005). In general, climate in Iran ranging from arid and semiarid in central part to
subtropical along the Caspian Sea lowland in north and cold in mountainous areas of
Alborz and Zagros. The climate of Persian Gulf littoral is mild in winter, hot, and humid in
summer. Diversification of geographical and climatic conditions of country makes it
possible to travel to Iran throughout the year and in all seasons.
5.1.2 Flora and Fauna of Iran
Iran hosts 8200 plant species of which 1720 is native ones. The field studies reveal the
existence of over 500 bird species, 1600 mammal species (equal to all mammal species in
Europe), 180 reptile species (26 native ones), 270 fish species and 13 amphibian species in
Iran (FRWO, 2005, p.5).
5.1.3 Iran’s Economy
Iran’s economy is based on oil, gas and Petrochemical industry, agriculture, mining and
industry. Iran is estimated to have around 9% of the world’s oil reserves (CBI, 2013). The
majority of country land surface is not arable and only one-third is suited for agriculture.
Cereal crops such as wheat, barley, rice, fruits, sugar beet, tobacco, saffron, tea, and
pistachio nuts are the Iran’s major agricultural products.

R.Mirzaei Chapter Five: Tourism development in Mazandaran 123
5.1.4 The History of Iran
Iran has a long history. Hegel (1837/1902, p.147) considered the ancient Persians to be
the first historic people:
“In Persia first arises that light which shines itself and illuminates what is around...The
principle of development begins with the history of Persia; this constitutes therefore the
beginning of history” (cited in Baum & O’Gorman, 2010).
It is believed that the oldest Persian urban civilization was Elamite who arose in
Khuzestan around the city of Shush on 2700 BC (Shahmiri, 2013). In around 2000 BC, it is
thought that the Aryans entered North and North East of Iran (Mobin, 2013). “With the
mixing of the Aryan and Elamite races, three main tribes gradually came to dominate the
area covered by modern day Iran. The Medes inhabited the west around Hamadan, the
Parthians who inhabited the east of Iran around the Caspian Sea, and the Persians who
inhabited the southern areas of Iran. The coalescence of these three tribes over time led to
the rise of the Persian Empire and its great impact on the rest of the world through science,
architecture, technology, art, and literature” (ITTO, 2002).
Cyrus the Great established the Achaemenid Empire in 550 BC; it was the largest
Empire that the ancient world had seen, extending from Anatolia and Egypt across western
Asia to northern India and Central Asia (Department of Ancient Near Eastern Art
(DANEA), 2004).
The Archaemenian Dynasty lasted until 330 BC when Alexander conquered
Achaemenid Empire. Parthians in 190 BC defeated Macedonian Seleucid, the founder of
Seleucid dynasty. Early Persian architecture emerged during the reign of the Parthian
Kings (ITTO, 2002). Ardeshir I was the founder of Sassanid Empire in 224 AD. During the
reign of Shapur I Zoroastrianism was made the state religion (DANEA, 2003), many of the
finest fire temples that can still be seen today were constructed during this time (ITTO,
2002). A series of wars had weakened the Sassanid Empire, this weakened Iran, and Arab
forces, united under Islam, defeated the Sassanid armies in 642 (DANEA, 2003).
Shah Ismaeil founded the Safavid dynasty in 1502, the greatest dynasty to emerge from
Iran in the Islamic period (Yalman, 2002). It was in this period, which Shia became the

R.Mirzaei Chapter Five: Tourism development in Mazandaran 124
official religion in Iran and Esfahan was rebuilt to become one of the prime centers
throughout the known world, including Europeans (ITTO, 2002).
Then Nader Shah established Afsharieh dynasty which was defeated by Karim Khan
Zand, a Lor, who moved the capital to Shiraz which he built into a great city (ITTO, 2002).
The weakened successors to Karim Khan Zand handed over the power to the Ghajars who
established their capital in Tehran in 1795 (ITTO, 2002).
In 1925 Reza shah came to power and founded Pahlavi dynasty, which was overthrown
by Islamic revolution in November 1978 and the Pahlavi dynasty was then replaced by the
Islamic Republic of Iran that despite the most severe difficulties including an 8-year war
with Iraq continues to the present time (ITTO, 2002).
5.1.5 Tourism Resources in Iran
Due to the unique strategic location, Iran has always been considered as a major
regional power from the earliest times. This location has placed it as a bridge between
Asia, Middle East, and Europe. Different ethnic groups have lived in Iran since ancient
times. This has established it as a major hub for science, art, literature, and great
architecture. The combination of these factors has led to formation of Iran’s rich and
unique tangible and intangible cultural heritage dating from ancient times (ITTO, 2002).
The symbols of this rich cultural and historical heritage are scattered throughout the
vast territory of Iran in a variety of landscapes and climates. The varied landscapes of Iran
are set within National parks, protected areas, wildlife refuges, national natural
monuments, biosphere reserves, wetlands, and forest parks that prepare the main resources
for nature-based tourism in the country.
5.1.5.1 Cultural Resources of Iran
Iran is incredibly rich in cultural and heritage resources (Baum & O’Gorman, 2010)
with 16 inscribed world heritage sites (table 5.2 and Map 5.3), 54 properties on the
UNESCO tentative list (UNESCO, 2013a), 10 elements on the list intangible cultural
heritage (UNESCO, 2013b). Eight out of 15 inscribed sites are ancient historical sites:
Pasargade, Persepolis, Bisotun, Tchogha Zanbil, Takht-e Soleyman, the Persian gardens,
Shushtar Hydraulic System, and Bam complex (Map 5.3). The other listed sites are two
tombs, Soltanyeh and Gonbad-e Qābus, one historical large square, Naghshe Jahann, one

R.Mirzaei Chapter Five: Tourism development in Mazandaran 125
historical mosque namely Masjed-e Jāmé of Isfahan, Golestan Palace and St. Thaddeus
Monastery.
Table 5.2 Iran’s Properties inscribed on the World Heritage List
Name Description Place Historical Period Inscription
Persepolis Capital of the
Achaemenid Empire
Shiraz 513 BC 1979
Tchogha Zanbil Holy city of the
Kingdom of Elam
Susa 1250 BC 1979
Meidan Emam
(Naghshe Jahan)
Royal square Esfahan beginning of the
17th century
1979
Takht-e
Soleyman
Archaeological site Takab 6th
and 7th
and 13th
century
2003
Pasargade First capital of the
Achaemenid Empire
Shiraz 6th
century BC 2004
Bam and its
cultural
landscape
fortified settlement and
citadel
Bam 6th
to 4th
centuries
BC
2005
Soltanyeh Mausoleum Zanjan 1302 2005
Bisotun Archaeological site Kermanshah 521 BC 2006
Armenian
Monastic
Ensembles
Three monastic
ensembles
Jolfa 7th century 2008
Shushtar
Historical
Hydraulic
System
Historical site Shushtar 5th
century BC 2009
Tabriz Historic
Bazaar Complex
Historical site Tabriz 18th
century 2010
Sheikh Safi al-
din Khānegāh
Ensemble
Historical complex Ardabil 16th
to 18th
century 2010
The Persian
Garden
collection of nine
gardens
Shiraz, Esfahan,
Kashan, Behshahr,
Mahan, Yazd, Birjand
6th
century BC to
19th
century
2011
Masjed-e Jāmé
of Isfahan
Historical mosque Esfahan 841 2012
Gonbad-e
Qābus
Tomb Gonbad-e Qābus
1006 2012
Golestan Palace Palace
Tehran 18th
century 2013
Source: UNESCO, 2013a

R.Mirzaei Chapter Five: Tourism development in Mazandaran 126
This list indicates some aspects of Iran’s cultural and historical capabilities that can
provide motivation for international tourists to visit Iran.
Map 5.3 Iran’s properties inscribed on the World Heritage List (2013)
Source: UNESCO, 2013a, Draft R.Mirzaei, 2013
5.1.5.2 Natural Resources of Iran
Iran is a large country that its topography varies considerably from major depressions
below sea level to mountains in excess of 5,600 meters. The geomorphology of the country
is varied and interesting. It includes mountain features, desert features such as dunes and
salty lakes, coastal beaches, and karst features such as extensive caves (tourist consult,
1974).

R.Mirzaei Chapter Five: Tourism development in Mazandaran 127
There has been considerable environmental degradation and over-exploitation of natural
resources in Iran in the past few decades (Mirzaei, 2007). Several factors such as
population growth, unsustainable and low performance utilization of basic resources and
destructive human activities especially in rural settlements is threatening the biodiversity
of the country (Department of Environment (DOE), 2010, p.10).
The scale and scope of natural degradation led to the founding of the Iranian Wildlife
Association in 1956. The IWA was an independent body with a mandate to oversee the
protection and preservation of the country’s wildlife as well as compliance with pertinent
laws.
Following the approval of the Hunting and Fishing Bill in 1967, the Hunting and
Fishing Organization replaced the IWA. In 1971, the HFO was transformed into the
Department of Environment (DOE). The High Council of Hunting and Fishing was
renamed as the High Council for Environment Protection. The reorganization added
environmental activities including preventing actions detrimental to environmental balance
to its mandate.
In 1989, the post of prime minister in an amendment of the Constitution of the Islamic
Republic of Iran was removed. Pursuant to the 1992 amendment to the Environment
Protection and Enhancement Act of 1972 and change in the composition of members of the
High Council for Environment Protection, the DOE became an affiliate of the Office of the
President. The President chairs the Council and a Vice-President heads the DOE.
To preserve the existing biodiversity over the wide geographic expanse of Iran, four
types of areas have been designated for conservation and protection, namely national
parks, wildlife refuge, protected areas, and natural national monuments. By the year 2013,
the size of the DOE supervised areas reached over 17.087 million hectares, about 10.4 %
of the total land area in 272 under protected areas (DOE, 2013).
Iran’s most prominent natural resources are located in these areas (Map 5.4).
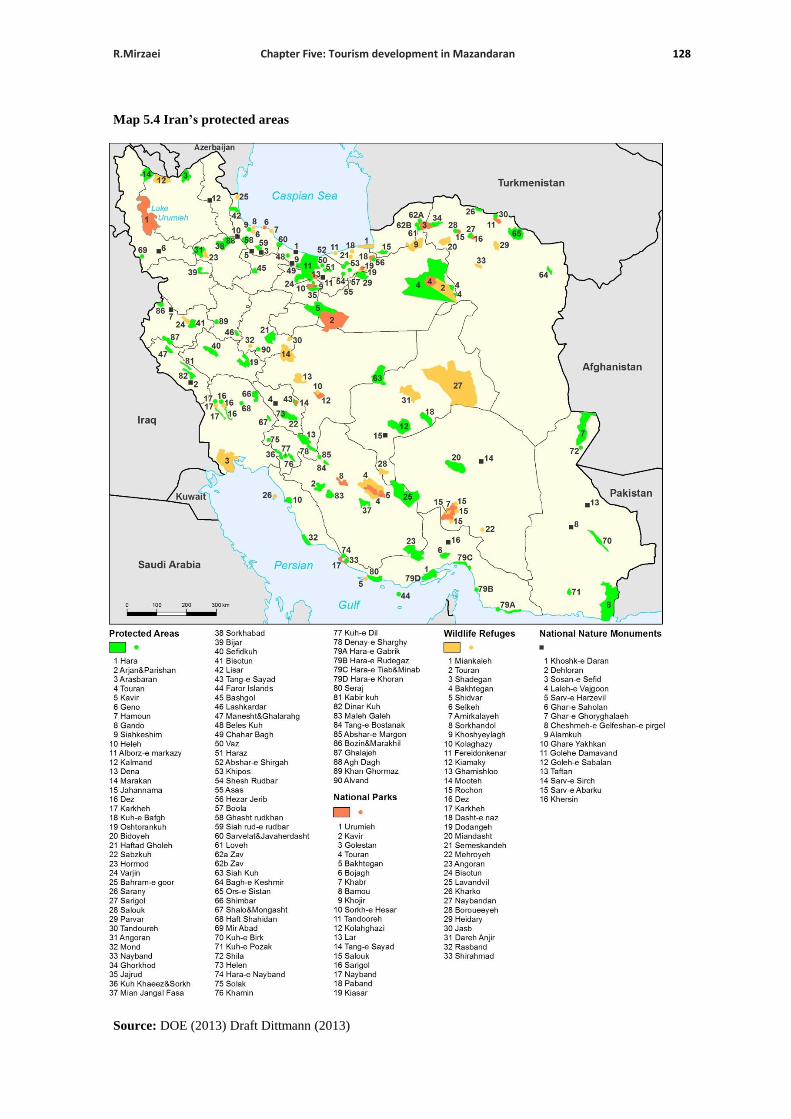
R.Mirzaei Chapter Five: Tourism development in Mazandaran 128
Map 5.4 Iran’s protected areas
Source: DOE (2013) Draft Dittmann (2013)

R.Mirzaei Chapter Five: Tourism development in Mazandaran 129
5.1.5.2.1 National Parks
A national park is a designated part of Iran’s environment, including forests,
rangelands, woodlands, prairies, water, or mountains. As such, it is brought under
protection to help permanently preserve its natural ecology and create a suitable
environment for the flourishing of wildlife and flora under natural conditions. The national
parks system currently covers almost 1.986 million hectares in 28 national parks (DOE,
2013).
5.1.5.2.2 National Natural Monuments
This applies to exemplary and rare instances of flora, fauna or remarkable land
formations or landscapes or even ancient trees, which are brought under protection through
suitable perimeters. Presently 35 national natural monuments cover 37576 hectares (DOE,
2013).
5.1.5.2.3 Protected Areas
A protected area in Iran exemplifies natural resources such as forests, rangelands,
prairies, water or mountains that are significantly important due to their impact on wildlife
breeding, preservation of plant species or their natural state. Over 166 protected areas
cover about 9.48 million hectares (DOE, 2013).
5.1.5.2.4 Wildlife Refuges
Wildlife refuge in Iran means natural resources incorporating forests, rangelands,
prairies, water, and mountains that have natural habitats and special climatic conditions.
These habitats have been brought under protection to help effectively protect and revive
wild animals. Total area of 43 wild life refuges is 5.586 million hectares (DOE, 2013).
Details of the four categories of protected areas managed by the Department of
Environment are given in table 5.3.
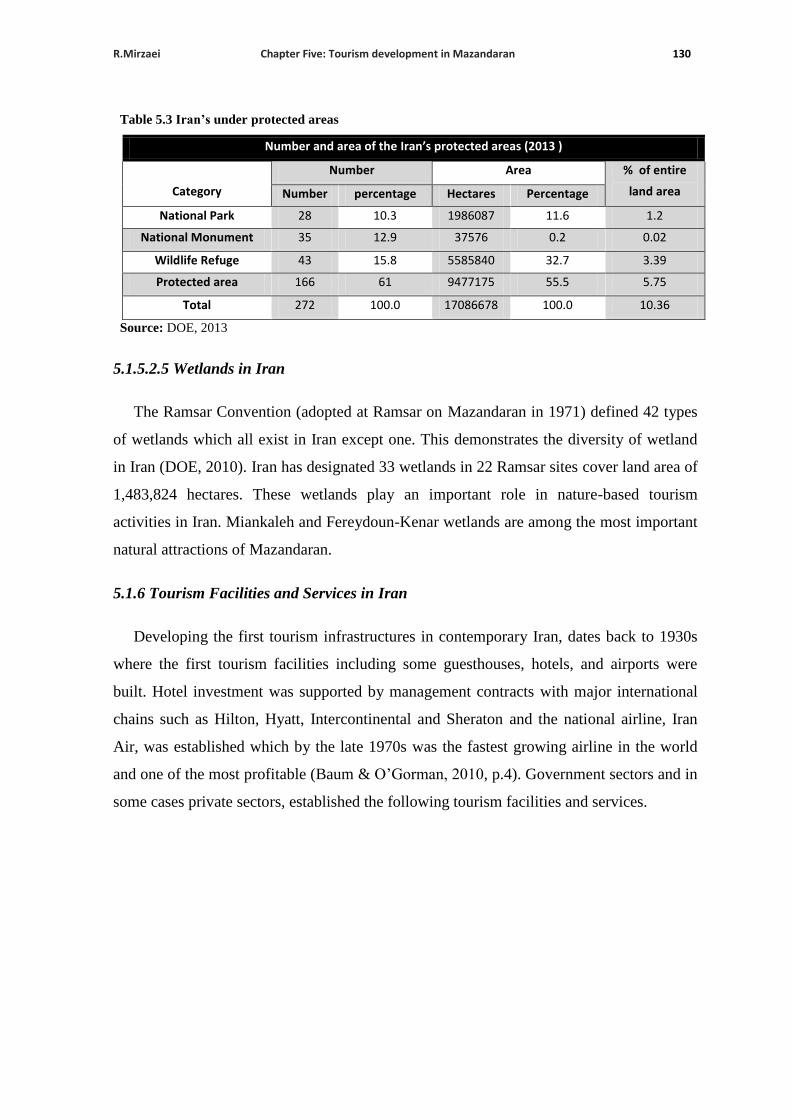
R.Mirzaei Chapter Five: Tourism development in Mazandaran 130
Table 5.3 Iran’s under protected areas
Number and area of the Iran’s protected areas (2013 )
% of entire
land area
Area Number
Category Percentage Hectares percentage Number
1.2 11.6 1986087 10.3 28 National Park
0.02 0.2 37576 12.9 35 National Monument
3.39 32.7 5585840 15.8 43 Wildlife Refuge
5.75 55.5 9477175 61 166 Protected area
10.36 100.0 17086678 100.0 272 Total
Source: DOE, 2013
5.1.5.2.5 Wetlands in Iran
The Ramsar Convention (adopted at Ramsar on Mazandaran in 1971) defined 42 types
of wetlands which all exist in Iran except one. This demonstrates the diversity of wetland
in Iran (DOE, 2010). Iran has designated 33 wetlands in 22 Ramsar sites cover land area of
1,483,824 hectares. These wetlands play an important role in nature-based tourism
activities in Iran. Miankaleh and Fereydoun-Kenar wetlands are among the most important
natural attractions of Mazandaran.
5.1.6 Tourism Facilities and Services in Iran
Developing the first tourism infrastructures in contemporary Iran, dates back to 1930s
where the first tourism facilities including some guesthouses, hotels, and airports were
built. Hotel investment was supported by management contracts with major international
chains such as Hilton, Hyatt, Intercontinental and Sheraton and the national airline, Iran
Air, was established which by the late 1970s was the fastest growing airline in the world
and one of the most profitable (Baum & O’Gorman, 2010, p.4). Government sectors and in
some cases private sectors, established the following tourism facilities and services.

R.Mirzaei Chapter Five: Tourism development in Mazandaran 131
5.1.6.1 Transportation network
Presently, Iran has 9 international airports located at Tehran, Shiraz, Esfahan, Tabriz,
Mashhad, Kish Island, Zahedan and Bandarabas. The Imam Khomeini airport in Tehran
has the highest traffic volume in country. Tourism statistics show that the share of air
transport is gradually decreasing in past years while the share of road transport is
increasing in Iran (table 5.4).
Table 5.4 Inbound tourism by mode of transport % (2007-2009)
year Air Road% Water Rail
2007 40.8 58.6 0.5 0.1
2008 34.6 64.6 0.6 0.1
2009 27.9 71.2 0.7 0.1
Source: ICHTO, 2010
A number of 41 domestic airports in Iran form a hub and spoke system with the hub
centered on Tehran. In tourism development master plan of Iran the air transport system is
described as follows:
“Overall, capacity is limited, services unreliable, safety questionable, reservation and
booking systems manual, ticket prices high and required in cash, and considerable demand
turned away” (ITTO, 2002, p.81).
Over the past years and especially after political and economic sanctions against Iran,
the Iran Air has been unable to deliver the fleet size required to meet demand. Aging and
outdated fleet, not to provide fuel to Iranian aircrafts on international flights and increase
in foreign exchange rate are among the main reasons for poor operation of Iran Air.
After the Islamic revolution, Western country markets have fallen dramatically and
neighboring Islamic countries have been the main inbound tourism market. Concurrent
with these changes in market the mode of transport shifted from air transport to land
transport (table 3.6). Road transportation is presently the main mode of transport to and
within Iran (ITTO, 2002).

R.Mirzaei Chapter Five: Tourism development in Mazandaran 132
The main international land gateways to Iran are from Iraq via Mehran and
Shalamcheh, from Turkey via Jolfa and Bazargan, From Azarbaijan via Astara, and from
Afghanistan via Taybad.
Fixed share of rail transport could be due to the limited capacity of the sector. In
general, rail transportation in Iran is not so developed. The quality and comfort of the
rolling stock varies considerably, capacities are generally limited, in-journey services are
poor, and speeds generally low thus taking a considerable time to complete a journey
(ITTO, 2002).
The central station located in Tehran from which six main lines radiate as follows:
I- The North-East line to Khorassan. This line is the most important one for religious
tourism as Imam Reza shrine in Mashhad is the most prominent pilgrimage site in Iran.
II- The North line to Golestan in Caspian Sea. This route goes through Firouzkooh,
Sari and Gorgan and can be used by Eco-tourists.
III- The North-West line goes to Tabriz and from there to Turkey, Azerbaijan and
Armenia.
IV- The South line goes to Khozestan.
V- The Central line which passes through Esfahan and Shiraz. This line is very
important to visit historical monuments.
VI- The South-East line goes to Yazd, Persian Gulf coasts in Bandarabas and Zahedan.
5.1.6.2 Accommodation Establishments in Iran
Iran Cultural Heritage and Tourism Organization (ICHTO) categorized accommodation
establishments into hotels, guesthouses, and hotel apartments. The hotels are graded from
one to five stars. There are some other forms of accommodation establishments like
Ecolodges, chalets, villas, motels and camping sites which their statistics and data are not
available, although the data exist in police departments.
There were 2332 accommodation units in Iran in 2012 of which 843 were hotels, 1397
were guest houses and 77 were hotel apartments (ICHTO, 2012). Table 5.5 shows the
classification and capacity for accommodation units in Iran.

R.Mirzaei Chapter Five: Tourism development in Mazandaran 133
Table 5.5 Accommodation establishments in Iran
Hotel Category No of units No of Rooms No of Beds
5 Star Hotels 17 3786 7775
4 Star Hotels 68 6587 13360
3 Star Hotels 172 10122 22050
2 star hotels 313 9975 22964
1 star hotels 273 6785 14486
Guest houses 1397 25892 68194
Hotel apartments 77 682 2869
Unclassified 15 950 1117
Total 2332 64779 152815
Source: ICHTO, 2012
The accommodation establishments do not have access to Global Distribution Systems
(GDS) that are the most important and effective channel for communicating with potentials
customers.
5.2 Tourism development in Iran
The remains of Achaemenid Empire (550 BC) extensive and well developed road
networks, known as the king road, which connected Susa to Persepolis shows that travel
has long been flourished in Iran. Herodotus said stations and guesthouses were located
about every 4 Farsang1 (18 km) along this road system (cited in Briant, 1998).
Travel has been highly regarded in other Iranian dynasty. During the Safavid era (1501-
1722 AD) was one of the brightest periods of travel and tourism in Iran. It was during the
reign of Shah Abbas that he decided to rebuild and revive the Silk Road and for this
purpose, restoration of caravansaries was one of the most important requirement measures.
These caravansaries were known as Shah Abbasi Caravansaries.
Contemporary history of tourism development in Iran dates back to 1930s where the
first tourism facilities including some guesthouses and hotels were built. Based on tourism
activities in different historical periods and compare it to Butler’s tourism area life cycle
(Butler, 1980), contemporary tourism development in Iran can be categorized in four
stages:
1 A Persian scale equal to 4.5 km

R.Mirzaei Chapter Five: Tourism development in Mazandaran 134
- Stage I (1930-1962): exploration and involvement
- Stage II: (1962-1978): development and consolidation;
- Stage III: (1979-1988): depression and decline
- Stage IV: (1988-2013): unsteady rejuvenation
5.2.1 Stage I (1930-1962): Exploration and involvement
At the time of Reza Shah, infrastructures development and security in the country have
facilitated the travel requirements. The first official organizations associated with tourism
in the country were established. Significant number of tourism facilities including
guesthouses (called Jalbe-Saiahan), hotels, and airports were built and major attractions
were developed.
According to Butler (1980), small numbers of tourists characterizes the exploration
stage and there would be no specific facilities provided for tourists. As the number of
visitors increase, residents will provide some facilities and services for visitors and will
enter the involvement stage (Butler 1980). In Iran, the government provided the first
tourism facilities and services.
Unfortunately, no official tourism statistics for this period are available to compare the
number of visitors however according to the first official figures in 1969 more than
241,198 international tourists visited Iran. This figure suggests that in previous years the
number of tourists should have been increasing.
5.2.2 Stage II (1962-1978): Development
In 1941, Mohammadreza Pahlavi took power. During his reign extensive relationships
with the West, especially America was established and in turn, tourism was considered as
an important strategy to introduce Iranian history and culture. At the pick 2500 year
celebration of Persian Empire1 was held in Shiraz. Following these activities, Western
Europe and America were Iran’s most important tourism market.
1 The 2,500 year celebration of the Persian Empire (Persian رانایشاهنشاهیۀسال۰۰۲۲هایجشن ) consisted of an
elaborate set of festivities that took place on 12-16 October 1971 on the occasion of the 2,500th anniversary of the founding of the Iranian monarchy (Persian Empire) by Cyrus the Great. The intent of the

R.Mirzaei Chapter Five: Tourism development in Mazandaran 135
The government continued to develop tourism facilities and services. Ministry of
information and tourism established heavy marketing and promotion programs. The first
tourism master plan was developed. The numbers of tourist arrivals were increased
steadily. The main tourism markets in this period were European countries and America
(Ehlers, 1974). Figure 5.1 shows the number of tourist arrivals from 1969 to 1978.
According to Butler (1980) development stage marked by a well-defined tourist market,
and natural and cultural attractions will be developed. Changes in the physical appearance
of the area will be noticeable. This stage of Butler’s model was seen in Iran, especially in
Caspian Sea lowland where the changes in land uses of coastal areas, mainly due to
tourism activities, was initiated.
Figure 5.1 Number of tourist arrivals in Iran (1969-1978)
Source: Bureau of statistics and marketing (1978)
5.2.3 Stage III (1978-1988): Depression and Decline
In 1978, the main tourism market of Iran were United States of America %12.7,
England %9.5, west Germany %8.2, Turkey %7.2 and Saudi Arabia %5.6 (Bureau of
statistics and marketing, 1978). After the Islamic revolution, many sectors including
tourism experienced a dramatic stagnation. Tense political relations with the western
countries and particularly America, which were the main tourism markets for Iran and the
Iran-Iraq war, interrupted the growing trend of tourism in Iran and the number of tourists
celebration was to demonstrate Iran's long history and to showcase its contemporary advancements under Mohammad Reza Pahlavi, the Shah of Iran (“2,500 year celebration of the Persian Empire”, 2013, Para.1).
0
100000
200000
300000
400000
500000
600000
700000
800000
1969 1970 1971 1972 1973 1974 1975 1976 1977 1978
Number of tourist arrivals

R.Mirzaei Chapter Five: Tourism development in Mazandaran 136
started to decrease considerably. Figure 5.2 shows number of tourist arrivals from 1978 to
1988.
Figure 5.2 Number of tourist arrivals in Iran (1978-1988)
Source: Bureau of statistics and information, 1997
Following the above-mentioned changes which was intensified by occupation of the
American Embassy in Tehran and the Iran hostage crises (from November 4, 1979 to
January 20, 1981), tourism market experienced major changes and shifted to neighboring
countries including Pakistan, Afghanistan and India. While America and Western Europe
had a market share more than 40 % in1978, after 10 years and in 1988, Pakistan,
Afghanistan and India with more than 44% market share were the main tourism market in
Iran. Figure 5.3 illustrates tourist arrivals by country in 1978 and 1988.
Figure 5.3 Tourist arrivals by country (1978, 1988)
Source: Bureau of statistics and information (1997)
0
100000
200000
300000
400000
500000
600000
1978 1979 1980 1981 1982 1983 1984 1985 1986 1987 1988
Number of tourist arrival
America 13%
England 9%
Germany 8%
Turkey 7% Saudi
Arabia 6%
Italy 5%
France 5%
Other countries
47%
Tourist arrivals by country 1978
India 6%
Pakistan 33%
Afghanistan
5%
Japan 4%
W.Germany
5%
Other countries
47%
Tourist arrivals by country 1988

R.Mirzaei Chapter Five: Tourism development in Mazandaran 137
5.2.4 Stage IV (1988-2011) Unsteady Rejuvenation
After the Iran-Iraq war and in the first and second Five-Year development plans (1989-
1998), the government policy on tourism was not clear. These plans were relatively high
centralized and although an important and basic policy was to support nongovernmental
sectors, it had not been implemented. In addition, in terms of privatization policies of
governmental dependent companies, during carrying out these two plans some companies
and institutions were set up, which were somehow governmental dependent and were
considered as the main competitors of private and nongovernmental sectors (Dittmann
&Mirzaei, 2013).
For this reason, governmental support in cooperative and private sectors' active
investment and participation as well as nongovernmental investments had experienced a
gentle upward trend. As a general summation, it can be mentioned that tourism in this
stage have had a relatively centralized structure and governmental sectors were dominant
player.
Therefore, government played a major role in tourism activities. Some major problems
of tourism were shortage of accommodation catering establishments; weak transportation
facilities and services; unfamiliarity of organizations, institutions and people with the
proper way to communicate with tourists; some executive and legal problems in
administrative, banking, trading and customs systems (The Plan & Bodjet Organization of
Iran (PBO), 1998).
In third Five-Year plan which began in 2001, tourism development was considered and
a new approach to tourism was adopted. Anticipated executive strategy of the plan was
codifying the tourism master plan in the first year of program, 2001. In this framework, a
new tourism master plan was prepared in 2002. Despite having an appropriate structure,
due to some operational weaknesses and also problems in using fundamental planning
concepts and techniques, like zoning, remained as much a draft report and did not find any
applicability.

R.Mirzaei Chapter Five: Tourism development in Mazandaran 138
Map 5.5 Tourism regions
Source: ITTO, 2002
Map 5.5 Shows the tourism’s regions in this plan, where Iran is divided into seven
regions. Although the primary purpose of zoning is to integrate and combine uses that
seem to be compatible and have similar characteristics, this map shows that for instance
Mazandaran and Qom provinces, which have completely different geographical features,
socioeconomic characteristics, climatic conditions, and tourism potentials are in a common
region named Alborz
In inbound tourism sector, the plan aimed to attract 4 million tourists at the end of 1384.
The comparison between the number of tourist arrivals in 1384 (1.89 million), according to
official statistics, and the plan's goal (4 million) indicates that just 47% of the goal was
accomplished (ITTO, 2009).
However, it should be clear that the experts believe statistics show the number of
travelers, not tourists. Due to the lack of statistical framework and definitions used in
preparing statistics, numerous contradictions are in the tourism statistics.

R.Mirzaei Chapter Five: Tourism development in Mazandaran 139
Figure 5.4 Number of tourist arrivals in Iran (1988-2011)
Source: ICHTO, 2011
For instance, while figure 5.4 depicts a steady growth in number of international
arrivals from 1988 to 2011, an unpublished report of Iran Cultural, Heritage and Tourism
Organization (2011) shows out of 3,294,126 travelers in 2011, who have been account as
tourists in official statistics, only 346,423 hold a tourist visa. According to the report, only
around 10 % of travelers who have travelled to Iran were tourists (table 5.6).
Table 5.6 number of tourist arrivals based on type of visa
Type of Vis Number of tourist arrivals
Business 718
Student 2045
Tourist 346423
Pilgrimage 635396
Visa cancellation 961058
Entrance 546740
Diplomats, transit passengers and commuters 801746
Tourists and travelers 3,294,126
Iranians living abroad 123367
Total (Tourists and residents) 3417493
Source: ICHTO, 2012
Reviewing the results of the third plan policies in the tourism sector, points out that in
some cases the qualitative goals have been achieved. For example, the actions related to
the Article 164 of the third development plan represent that the executive regulations have
been approved and notified to be executed by the Cabinet of Iran. The main meaning and
purpose of this Article is to improve the banking system services for tourists.
0
500,000
1,000,000
1,500,000
2,000,000
2,500,000
3,000,000
3,500,000
19
88
19
89
19
90
19
91
19
92
19
93
19
94
19
95
19
96
19
97
19
98
19
99
20
00
20
01
20
02
20
03
20
04
20
05
20
06
20
07
20
08
20
09
20
10
20
11
international tourist arrivals

R.Mirzaei Chapter Five: Tourism development in Mazandaran 140
According to the content of this Article the anticipated policy in the third plan
regulation involves tourism foreign exchange permission in the ports of entry by internal
banks based on the negotiated rates. The carried out actions related to the implementation
of this policy include approving and applying the executive regulation of Article 164 of
third plan by the cabinet.
The assessments suggest that despite the implementation of this Article, banking system
services did not improve so much because making the International Credit Card System is
the urgent need of the visitors that has not been anticipated in the mentioned regulation
(Soleymanpour, 2009).
Table 5.7 shows the executive strategy performance of the third five-year development
plan of Iran in tourism sector.

R.Mirzaei Chapter Five: Tourism development in Mazandaran 141
Table 5.7 Executive Strategy performance of the Third Development Plan in tourism sector
Purpose The executive guidelines anticipated in the plan
The applied executive guidelines and the related taken actions
To assign accommodation and catering establishments
Assigning accommodation units of Tourism and Touring Organization to nongovernmental sector
Assigning accommodation units of governmental organizations to nongovernmental sector
Assigning the significant portion of the accommodation facilities of Cultural Heritage and Tourism Organization to the governmental organization such as Civil Servants Pension and Social Security
Developing a Bill on accommodation units of governmental organizations though did not progress well.
To reform the tourism industry development law
Making necessary arrangements for reforming the law within one year after approval of the third plan (2002) by the Cultural Heritage and Tourism Organization
The authorities have approved the Bill of reforming the law of tourism industry development.
To develop coordination among related executive organizations in order to provide essential facilities
Reforming entry and exit rules for foreign citizens to facilitate the entry of incoming-tourists
Issuance of common visa for the nationals whose countries are the affiliated members of the Islamic Conference and the Silk Road Conference
Creating welfare facilities for the transit passengers
Coordinating with the Ministry of Foreign Affairs and the Ministry of Intelligence service about issuance of electronic visa and abolition of visa for some Islamic countries
To improve and develop supervision and evaluation of tourism infrastructures and facilities
Reforming the regulation about supervision on the tourism establishments in accordance with International standards
The regulation about supervision on the tourism travel agencies has been approved by the Cabinet
To promote tourism culture
Preparing projects, procedures, training methods and etc. to promote tourism culture and the way the community possess the historical and cultural monuments and introducing tourism attractions
Doing feasibility studies to identify, introduce and develop various tourism attractions in some provinces
Training about 10000 people in different levels to offer tourism services
Source: Soleymanpoor, 2009

R.Mirzaei Chapter Five: Tourism development in Mazandaran 142
In fourth five-year development plan the coastal areas were considered. In article 36
mentioned:
“The government has a duty to provide the comprehensive plan of organizing coastal
areas up to the end of the first year of fourth development plan (year 2005) with priority
given to the Caspian Sea, in order to organize coasts and to prevent pollution and
degradation of coastal areas” (PBO, 2004: article 36).
Determination of coastal boundary and release the occupied beaches were the main
executive strategies of this important article. According to note of this article by the end of
fourth development plan (year 2008) sixty meters retreat of coastal boundary must be fully
accomplished. The main frameworks for tourism activities and the management of tourism
impacts concerning the nongovernmental sector were mentioned in the Article 114 (PBO,
2004).
In addition, the Article 145 stipulated that establishing or managing all kinds of inns,
guesthouses, residential complexes, polyclinics, sport and recreation centers and so on by
governments and public organizations is prohibited. All organizations are required to
transfer the ownership or the right of exploitation of these kinds of facilities and services to
the nongovernmental sectors up to the end of the third year (year 2007) of the fourth
development plan.
According to official statistics, the numbers of tourist arrivals from 1988 to 2011 have
been increasing.
Generally, in this stage government tried to develop tourism but the results were not
satisfied due to the lack of planning and experts and unplanned investments.

R.Mirzaei Chapter Five: Tourism development in Mazandaran 143
5.3 Tourism in Mazandaran
At the time of Reza Shah, infrastructures development and security in the country have
facilitated the travel requirements. The first official organizations associated with tourism
were established. Mazandaran was among the first destinations, which was developed in
this period. According to Amirsharifi, in Kelardasht, coincide with the construction of
summer palace of Reza Shah some villas were also built (cited in Ghadami, 2007). The
number of tourists was limited and most of the upper classes and senior officers of the
Army or the courtiers.
Since 1960s which coincides with an increase in relative income of middle classes in
Iran, the number of tourists in Mazandaran gradually increased. The coastline strip of
Caspian Sea was the most important destination for domestic tourism in the country and
swimming was the main activity for tourists. A significant number of coastal resorts and
accommodation establishments were developed in Babolsar, Ramsar, Chalous,
Mahmoudabad and Farahabad.
After the Islamic revolution, many sectors including tourism experienced a dramatic
stagnation that interrupted the growing trend of tourism in Iran. Domestic travel patterns
were changed considerably.
5.3.1 General Characteristics
Mazandaran is located in south of the Caspian Sea and north of the Alborz Mountains.
Three territories are detectable in Mazandaran: coastal strip, slopes and Alborz Mountains.
In province of Mazandaran around 3,074,000 people live in 23,842 square kilometres (SCI,
2011). The population density in Mazandaran is 129 people per square kilometres.
According to 2011 census, Unemployment rate in Mazandaran was at 4 percent compare
with 4.5 percent in urban areas and 3.3 percent in rural areas.
Table 5.8 indicates the proportion of employment in agriculture declined steadily
throughout the last 25 years, while the proportion of industry and the service sectors,
increased.

R.Mirzaei Chapter Five: Tourism development in Mazandaran 144
Table 5.8 Employment by sector in Mazandaran (census 1986 to 2011)
Source: agriculture organization of Mazandaran, 2013
5.3.2 Demographic Structure in Mazandaran
The population in Mazandaran has been increasing steadily from 835,109 in 1956 to
3,073,943 in 2011 (table 5.9). Another important change in the population of Mazandaran
is decreasing the proportion of rural to urban population.
Table 5.9 Population and average annual growth rate in Mazandaran
Year Population Average annual growth (%)
1956 835,109 -
1966 1,250,090 4.12
1976 1,5965,65 2.48
1986 2,274,763 3.6
1996 2,602,008 1.35
2006 2.922.432 1.16
2011 3.073.943 1.02
Source: SCI, 2013
The gradual decline of percentage of rural population from 76% in 1956 to 68% in 1976
to 45.3% in 2011 indicates that the trend of urban population growth and rural population
decline in Mazandaran have intensified in recent years (Table 5.10). Tourism has been an
important factor in the gradual transformation of rural to urban livelihood in Mazandaran.
Sector 1986 1996 2006 2011 5 years growth
Agriculture 40.7 31.3 20.98 19.2 -8.48
Industry 17.8 23.9 29.68 31.9 7.48
Services 41.5 44.8 47.86 49 2.38

R.Mirzaei Chapter Five: Tourism development in Mazandaran 145
Table 5.10 urban and rural population in Mazandaran
1956 1966 1976 1986 1996 2006 2011
Urban Number 200707 300709 511787 893473 1202469 1554143 1682152
Percent 24 24 32 39.2 46.2 53.1 54.7
Rural
Number 634402 949381 1084778 1381290 1399539 1368289 1391791
Percent 76 76 68 60.8 53.8 46.9 45.3
Source: SCI, 2013
5.3.3 Location and Natural Environment
Mazandaran located in the north of Iran, faces the Caspian Sea on the north, and
surrounded by Alborz Mountain on the south. It has border with provinces of Tehran,
Gilan, Golestan, Semnan, Qazvin and Alborz (Map 5.6).
Map 5.6 Mazandaran
Source: own draft
Mazandaran is known mainly as a famous tourism destination as well as the main center
of rice production in Iran. Due to the geographical characteristics of the area local
community are strongly dependent on natural resources and this in turn result in more
environmental degradation. Mazandaran is one of Iran’s fishing areas and has the largest
forests area in country (Agriculture organization of Mazandaran, 2013).
The Persian coast of Caspian Sea extends for more than 700 kilometres and around 330
kilometres of shore located in Mazandaran (SCI, 2013). The nature of this area influenced
by Alborz mountain range, Caspian Sea and high level of precipitation result in diverse
vegetation cover, forest, marsh, wetlands, numerous rivers and shrubberies which
unfortunately, has been severely damaged during the past years (Ehlers, 1980).

R.Mirzaei Chapter Five: Tourism development in Mazandaran 146
Based on the latest divisions in 2011 the province is consisted of 19 townships, 53 cities
and 122 rural districts (SCI, 2013). Map 5.7 shows the boundaries of the townships.
Map 5.7 boundaries of the townships of Mazandaran
Source: SCI, 2012, Draft R.Mirzaei, 2013
The townships are as follows:
1- Ramsar includes the cities of Ramsar, Katalem and Sadat-shahr
2- Tonekabon includes the cities of Tonekabon, Khorramabad, Nashtaroud, ,
3- Abasabad includes the cities of Abasabad, Kelarabad, Motel-Gho and Langaroud.
4- Chalous includes the cities of Chalous, Marzanabad and Kelardasht.
5- Noushahr includes the city of Noushahr
6- Nour includes the cities of Nour, Chamestan, Baladeh, Izad-shahr, Royan
7- Amol includes the cities of Amol, Reyneh, Gazanak, Dabodasht
8- Mahmoudabd includes the cities of Mahmoudabad and Sorkh-roud
9- Babol invludes the cities of Babol, Amirkolah, Gotab, Galogah, Khoshroud-pey,
Marzikolah and Zargarmahaleh
10- Freydounkenar includes the cities of
11- Babolsar includes the cities of Babolsar, Bahnemir and Kolebast
12- Joibar includes the cities of Joibar and Kohikheil
13- Ghaemshahr includes the cities of Ghaemshahr and Kiakolah
14- Savadkouh includes the cities of Savadkouh, Polsefid, Shirgah, Alasht and Zirab
15- Sari
16- Miandoroud

R.Mirzaei Chapter Five: Tourism development in Mazandaran 147
17- Nekah
18- Behshahr
19- Galougah
5.3.4 Climate of Mazandaran
The Alborz Mountain range stretches like a wall in the south of Mazandaran and
prevents Caspian Sea’s moisture to enter the central plateau of Iran. The moisture causes
significant precipitation in the northern slopes of the Alborz Mountains that due to the
wind direction, topography, distance and proximity to the sea and latitude three types of
climate can be distinguished in Mazandaran:
- Temperate and humid climate in the western and central Caspian Sea plains which are
restricted to the foothills of North Alborz. Due to the proximity to the sea and the forest,
the area has a high rainfall and moderate temperature. The average precipitation is 870 mm
and reduced from West to East. The precipitation is least in spring (12%) and high in
autumn (43%). Because of persistent cloud cover and relative high humidity the
temperature is moderate and its range is limited. In general the area has mild winter and
warm humid summer and frost rarely occurs.
- Mountain climate that can be divided into two groups:
a) Moderate mountain climate: certain changes in climate are observed with the
gradual increase of the height of the Caspian plain towards the North highlands of
Alborz. At altitudes of 1500 to 3000 meters, the cold mountain climate becomes
apparent which has cold winter with long frost period and short and mild summers.
b) Cold mountain climate: In areas above 3000 meters altitude, the temperature drops
sharply and long frost led to formation of long freezing winters and short cool summers.
Precipitation in this area is often in the form of snow that during the cold winter
accumulates and lasts until the mid of the summer.

R.Mirzaei Chapter Five: Tourism development in Mazandaran 148
5.3.5 Topography of Mazandaran
The main terrains of the areas are plain area in the north and mountainous area in the
south. Alborz mountain range is divided into three regions of western, central and eastern
by the rivers that flow along the north-south.
- The western area stretches from Sefidroud valley in west to Chalous and Karaj
valley. Takhte-Soleyman is the famous mountain range in this area.
- The central area is the widest part of Alborz Mountain that stretches from Chalous
valley to Babol and Darband in east. The most famous and important tourism
destinations are located in this area.
- The eastern area starts from Darban and Babol and stretches to east.
Part of plain areas and almost all part of mountainous areas are covered with forests
known as Hyrcanian forests or Caspian forests. The Caspian forests are known as the
oldest forest in the world that extend from Astara to Giledareh in the east of Golestan
province and are around 800 kilometers in length and 20 to 70 kilometers in width
(FRWO, 2013a). Forests in Mazandaran cover more than 46.5 % of its area equal to
1,107,256 hectares (Agriculture organization of Mazandaran (AMO), 2013).
The beautiful rural scenery, rice paddies, vegetable fields, tea plantations with its main
areas around Lahijan (Ehlers, 1970), and orchards next to long straight beaches, wetlands,
wonderful forests, diversity of flora and fauna; has long made the region a unique
destination for tourists.
5.3.6 Tourism facilities and services
The first tourism establishments was built in Mazandaran in 1930s. In this section,
different types and capacities of facilities are presented.

R.Mirzaei Chapter Five: Tourism development in Mazandaran 149
5.3.6.1 Accommodation Establishments in Mazandaran
According to the statistical Year book of Mazandaran (SCI, 2013) there were 281 hotel in
Mazandaran in 2011 of which one were classified as 5 stars, six as 4 stars, eighteen as 3
stars, 25 as 2 stars and 37 as 1 star. Table 5.11 summarizes the capacity of hotels in
Mazandaran.
Table 5.11 Accommodation establishments based on grade
Year 1 star 2 stars 3 stars 4 stars 5 stars total
1996 15 26 4 2 1 48
2001 15 24 8 3 1 159
2007 19 24 14 3 1 229
2008 54 35 16 7 1 293
2009 34 35 18 6 1 265
2010 34 25 18 6 1 266
2011 37 25 18 6 1 281
Source: SCI, 2013
Table 5.12 shows the number of hotel rooms based on grade in Mazandaran.
Table 5.12 Number of hotel rooms based on grade
Year 1 star 2 stars 3 stars 4 stars 5 stars total
1996 352 788 323 153 174 1790
2001 236 711 342 210 174 1882
2007 291 681 743 213 157 4472
2008 376 652 407 392 157 4624
2009 519 700 708 430 174 4957
2010 525 700 798 430 174 5148
2011 640 816 890 436 174 5652
Source: SCI, 2013

R.Mirzaei Chapter Five: Tourism development in Mazandaran 150
According to the current classification system operated by ICTTO the accommodation
establishments in Iran have been classified into hotels, apartment hotels, pensions, inns,
youth hostels, tourist camps, seacoast establishments, mineral water establishments (spas),
and tourism areas (ITTO, 2002).
Table 5.13 presents tourism establishments’ capacities in Mazandaran and table 5.14
shows number of rooms in different tourism establishments.
Table 5.13 Tourism establishments’ capacities
Year Hotel
apartment
Beach
resort
Inn Camping
site
Tourism
areas
2001 9 99 - - -
2007 28 115 25 - -
2008 41 115 21 3 -
2009 35 120 20 2 4
2010 39 120 17 2 4
2011 52 120 16 2 4
Source: SCI, 2013
Table 5.14 Number of rooms in tourism establishment
Year Hotel
apartment
Beach
resort
Inn Camping
site
Tourism
areas
total
2001 209 - - - - 209
2007 551 1372 464 - - 2387
2008 841 1372 340 87 - 2640
2009 653 1372 302 67 32 2426
2010 766 1372 284 67 32 2521
2011 934 1372 291 67 32 2696
Source: SCI, 2013

R.Mirzaei Chapter Five: Tourism development in Mazandaran 151
Data on the other establishments exists in the Police Department, this is not available for
tourism planning and development purposes. In addition, other accommodation
establishments are sometimes used for tourism purposes such as school dormitories, rented
accommodation, campsites, corporate and government guesthouses.
Tourism high seasons in Mazandaran are from 20th
of March to 5th
of April which are
coincident with Iranian new year celebration namely Nouroz, and from 21st of June to 22
nd
of September which are summer holidays in Iran. During Nouroz holiday in 2005 around
1,470,000 and in 2006 around 935,000 tourists visited Mazandaran (Tourism Organization
of Mazandaran, 2005, 2006).
Comparing the number of visitors and accommodation establishments’ capacity,
indicate that a significant part of demand is not met, therefore visitors have to
accommodate on the streets sidelines, parks, or schools. (Figure 5.5)
Figure 5.5 tourists accommodate on the street sideline
Photo by R.Mirzaei

R.Mirzaei Chapter Five: Tourism development in Mazandaran 152
5.3.6.2 Coastal Establishments in Mazandaran
There are around 30 special swimming areas (Salemsazi Darya) in the approximate
length of 20 km coastal areas of Mazandaran. Cheap beach accommodation units called
“Pelazh” are designed in these areas. Accommodation capacities of these units are very
limited and the quality is very low. These centers operate under the supervision of
municipalities and police; do not meet the minimum safety and faced with the problem of
shortage of lifeguards. Due to the budget cut in last two years, the lifeguard members have
declined to less than half.
Sea level rising in coastal areas and its consequences is another problem in coastal strip
of Mazandaran. During the past years, a significant part of low elevation coastal zone
submerged. Impeded drainage seriously affects tourists, residents, and agricultural
productions. Submerged houses and wastewater wells are very dangerous for swimmers.
5.3.7 Transformation of Coastal Strip and Caspian Plain
The high densification of residential and commercial buildings in coastal strip have
transformed many agricultural lands, villages and orchards into urban or tourist areas. Plain
villages have lost their traditional characteristics and rural and natural landscapes were
damaged. Furthermore, agricultural lands functions convert from a productive economic
activity into tourist villages.
Map 5.8 shows transformation in 7 km coastal strips from 1966 to 2012. Kroeger
(1981) produced a map that depicts the beginning of tourism development in coastal strip
of Mazandaran from Nashtarud to Abas Abad in 1960s. Almost the entire coastal strip was
free and tourists had easy access to the beaches. A large part of the beach was covered by
littoral vegetation and natural landscape dominated. The southern part of the coastal road,
outside the urban areas, was completely covered by forest except near the city boundaries
that scattered traditional houses were built. There were no residential areas or business
districts in rice fields.

R.Mirzaei Chapter Five: Tourism development in Mazandaran 153
Map 5.8

R.Mirzaei Chapter Five: Tourism development in Mazandaran 154
After 10 years in 1976, some changes took place in coastal area. Ehlers (2013) called it
the “take-off” period of Caspian tourism. However, large parts of coastal lands were still
open and tourist villas, second homes, and tourism businesses occupied few parts of the
coasts. While almost the entire coastal strip bounded with land plots ready for construction,
coastal boundary were still free. Coastal vegetation was still there and there were scattered
tourist villas. Tourist complexes are emerging in parts of the coast. In the southern part of
the coastal road, the numbers of traditional houses were increased and a very limited
number of tourist villas were built. Rice fields and forests were still almost untouched.
In 2012, there has been tremendous conversion in coastal strip. All part of coastal strip
is occupied and there is no access to the beach. Tourist villas and second homes cover
beaches and coastal boundary is completely occupied. Indeed, sea has become the
“exclusive courtyard” for tourist villas. There is no littoral vegetation and residential areas
expanded. The traditional houses’ territory is expanding which probably is a preload to
further expansion of residential areas. In the southern part of the coastal road, very
extensive destruction of forests occurred and converted to agricultural lands, tourist villas
or traditional houses. The urban area grows dramatically and tourism businesses have
developed along the coastal road (figure 5.6).
Figure 5.6 Caspian Sea littoral near Chalous
Photo by R.Mousavi

R.Mirzaei Chapter Five: Tourism development in Mazandaran 155
5.3.8 Form of Nature-Based Tourism in Mazandaran
There are three different form of nature-based tourism in Mazandaran: rural tourism,
beach tourism, and second-home tourism.
5.3.8.1 Rural tourism in Mazandaran
Around 1,391,791 people or 45 percent of all Mazandaran’s population are working on
600,707 hectares farmlands in 3671 villages (AOM, 2013). During the past decades rural
areas and farmlands have become one of the main destinations for tourists from different
part of country. The beautiful rural sceneries, rice paddies, vegetable fields, tea plantations,
and beautiful orchards next to the traditions and hospitality of local community are the core
product of rural tourism in Mazandaran.
The Iran Cultural Heritage and Tourism Organization defined 17 villages as target
villages in order to develop sustainable tourism in Mazandaran (ICHTO, 2007). Generally,
same day visitors and second-homes in form of tourist villages are concentrated in plain
villages and scattered second-homes are located in forest areas (Aligholizadeh, Ghadami,
& Ramezanzadeh, 2010). Most of villages are located between Caspian plains and forested
mountains. However, there are few villages in forest and mountainous areas.
Depend on tourism facilities and services the villages are influenced differently by
tourists. Plain villages are more and deeper influenced by tourists although in the last few
years mass tourism flows affected forest villages.
Through field research and travel to different part of Mazandaran’s coastal strip the
main zones of Caspian Sea lowland were identified as illustrated in figure 5.7. In
Mazandaran, sea and forest are the main axis of development. The seacoast is covered by
garden houses, villas and buildings and partly by very simple tourist resorts namely Pelazh.
A high traffic coastal autobahn separates coastlines from Caspian plain. Residential areas,
shops, restaurants, and farmland are scattered along the southern part of highway.
Beyond the road are rice fields, plain villages, and tourist villages. The roads
connecting villages to highway are very narrow, without sidewalk, parking place and
traffic sings making it very dangerous for locals and visitors. There is no main road
between villages. While most residents of villages earn from renting rooms to visitors, the
ratio of private villas and second home in this area is very high. A study conducted in

R.Mirzaei Chapter Five: Tourism development in Mazandaran 156
Noushahr county by Ghadami et al. (2010) showed that there are more than 15 public and
134 private tourist villages, consist of 3576 units, and more than 3033 scattered villas. In
other words, more than 48% of all residential units are second homes.
Behind the farmlands is the forest zone. Although, forest cover this region there are
limited small villages and scattered second homes. The main economic activity is livestock
and forestry although tourists also visit villages. Massive destruction of forests to farmland
and second home conversion has severely damaged the environment.
Figure 5.7 Morphological zoning of Caspian Sea lowland, North of Iran

R.Mirzaei Chapter Five: Tourism development in Mazandaran 157
The last region is altitudes above 3000m. Since there is less supervision on this area,
there is a mass speculation in forms of mountainous villages, country houses, and villas. In
recent years many villas are built in this zone without any planning (refer to map 5.8). This
trend has been intensifying by other factors that will be discussed in chapter six.
Golamifard, Jourabiam, Hosseini & Mirzaei (2013) examined land use conversion in
Mazandaran from 1988 to 2011. Results of study show that more than 33,487 hectares of
forests areas were reduced and converted to 21,367 hectares of agricultural lands and
13,155 hectares of residential areas, mainly second-homes. Modeling results for the year
2016 showed that the area of forestland and open land compare to the year 2011 will
decrease and agricultural and residential land uses will increase (Map 5.9).
Map 5.9 Land cover change in Mazandaran (1988, 2000, 2006, 2011)
Source: Golamifard et al. 2013
Forest Agricultural
land
Residential
areas
Deep
sea
Shallow
sea
Wetland Open
land
1988
2000
2006
2011

R.Mirzaei Chapter Five: Tourism development in Mazandaran 158
An important point can be seen in land cover change between 2006 and 2011 is open
spaces and second home expansion in altitudes above 3000m concurrent with the loss of
forest and agricultural lands. Development of tourist villas and second homes in the
mountainous and forest areas are probably the main cause of deforestation and agricultural
land use conversion.
5.3.8.2 Beach Tourism in Mazandaran
Mazandaran has 338 kilometers coastline. A 25 meters road is divided coastline strip
into two parts, northern and southern. The width of northern part (the beach) varies from
50 to 3000 meters. In recent years, the development of tourism facilities and services on
the coastline of Mazandaran has been very limited and most of the spaces are allocated to
building private villas and residential complexes for government organizations. Due to the
uncontrolled construction, there have been major changes in coastal areas.
Second-homes, residential areas, and tourism establishments are covered beaches and
coastal areas transferred to inaccessible private lands for villas, hotels or company-owned
holiday facilities (Ehlers, 2013).
Table 5.15 General land use in Caspian Sea coastal strip 2012 (in meter)
Area Villas Residential&
business areas1
Fenced
land
Pelazh Open beach2 Protected
area
Other3
Ramsar to
Tonekabom
10260 21437 1358 2170 0 45
Tonekabon to
Nashtaroud
6054 370 1686 400 0 100
Nashtaroud to
Noushahr
25436 13375 1200 6450 0 580
Noushahr to
Mahmoudabad
53380 9460 3207 3080 0 1617
Mahmoudabad
to Miankaleh
19657 18500 3020 1734 44500 54000 16500
Total 114787 63142 9271 15034 44500 18842
% 36.56 20.12 2.96 4.78 29.58 6
% In tourist
areas
56.1 30.86 4.53 7.34 0 0 1.1
1: Include residential and business areas and tourism establishments
2: There is no building in these areas however land use and ownership is not clear
3: Park, airport or industry zone

R.Mirzaei Chapter Five: Tourism development in Mazandaran 159
Table 5.15 shows general land use of northern part of coastline in Mazandaran. Public
and private villas and second homes cover more than 36% of entire coastal strip in
Mazandaran. In high dense tourist areas from Ramsar to Babbolsar the figure is more than
56 %. Residential, business areas and tourism establishments cover more than 20% of
entire coasts and 30% in tourist areas. In other words, public and private villas, shops,
restaurants, airport, and hotels cover around 95% of coastal areas that are not accessible to
tourists.
Map 5.10 depicts density of coastline strip in northern and southern part of the coastal
road in 2012. Along the coastal road in touristic region from Ramsar to Babolsar which
road is close to the sea, the beach is completely occupied and residential, business areas
and tourist villages cover the southern part. After the Babolsar, the distance between the
road and the sea is greater and consequently no buildings and facilities are on the coast.
According to Kroeger (1981) in 1976 except near Ramsar, Chalus and Noushahr with
limited holiday resorts, mainly company owned, the southern part were almost entirely
open. During last four decade, tourism as the main driving factor has transformed
dramatically Caspian Sea lowland. Coasts as the main and central attraction are not
accessible to visitors and the area has lost much of its tourist potentials.
Furthermore, under the old landowning system, the custom was for the holding to
remain within the same peasant family without being divided (Bromberger, 2012). Ehlers
(1970, p. 299) argued this custom favored a degree of stability in the size of farms and of
the agricultural population (cited in Bromberg 2012). However, today the fragmented
farms are converted into second-homes and tourist villages in turn the area of agricultural
land is diminishing day by day.

R.Mirzaei Chapter Five: Tourism development in Mazandaran 160
Map 5.10 coastal densification in Mazandaran 2012

R.Mirzaei Chapter Five: Tourism development in Mazandaran 161
5.3.8.3 Second-Home Tourism in Mazandaran
Since the early 1970s, coinciding with rising oil prices and the growth of nation income,
minority of people who have benefited from the revenues began to buy villas and apartments
as second-homes in some European countries (Gharib, 2003).
Another group of people began to build second-homes around the big cities such as Tehran.
As the Tehran grew, the demand for second-home increased and the new second-home district
expanded to Caspian Sea coastal areas. Increasing demand for land and villa on coasts of the
Caspian Sea, that previously was left pristine and untouched (Map 5.7), caused an influx of
brokers and real state agencies in the area. Their presence has led to mass unplanned
construction in the coastal areas and conversion of forests, gardens, and agricultural lands to
residential and single villas.
During the Iran-Iraq war this trend has recede somewhat and property sales were stagnant.
After the war, the unplanned expansion of coastal construction, forest degradation and the
conversion of farmlands and paddies to residential areas continued with greater intensity than
before. Villas, residential complexes, or fenced lands occupy today almost the entire coastal
strip and public access to beach is very limited.

162 R.Mirzaei Chapter six: Discussion and recommendations
CHAPTER 6
DISCUSSIONS AND RECOMMENDATIONS
6.0 Introduction
The main purposes of this research were threefold. Firstly, it was to understand the local
communities’ perception of the socioeconomic and environmental impacts of nature-based
tourism in Mazandaran. Secondly, it was to recognize the factors influencing local
communities’ perception of nature-based tourism impacts. Thirdly, it sought to understand
how residents’ perceptions of tourism impacts and the factors influencing their perceptions
were related to support for nature-based tourism development in Mazandaran.
In order to achieve the research objectives a literature review in chapter two examined the
tourism impacts on community and tourism development paradigms. In chapter three, the
research plan and related analysis, methods and techniques used for analyzing data were
discussed in detail. Data were collected through interviewing residents in Babolsar and
Kelardasht in order to understand the local communities’ perceptions of nature-based tourism
development in Mazandaran, to predict residents support for tourism development, and to
develop recommendations towards removing barriers for tourism development in Mazandaran.
Chapter four presented the results and findings of research.
The tourism development stages in Iran and its characteristics, and the main types of
tourism and resources in Mazandaran are presented in chapter five. This chapter will examine
how residents’ perceptions of tourism development and impacts are consistent with reality of
tourism in Mazandaran. Finally, the implications for tourism planning and development, as
well as for future research are presented.
6.1 Summary of the results from residents’ perceptions of tourism impacts and support
for NBT development
Recent studies have focused on host communities’ perception and attitudes towards
tourism impacts or tourism development, although little research has been conducted
concerning residents’ attitudes towards tourism impacts and their relationship with support for
tourism development. Since tourism relies heavily upon the goodwill of the local residents;

163 R.Mirzaei Chapter six: Discussion and recommendations
consideration of their support, and perceptions and attitudes toward tourism impacts are
essential for its development, successful operation, and sustainability (Ap, 1992; Gursoy,
Jurowski & Uysal, 2002). Given the importance of understanding local community attitudes,
this thesis tried to model local population’s perceptions of the socioeconomic and
environmental impacts of nature-based tourism and their relationship with support for tourism
development in Mazandaran
Undoubtedly, tourism has been a main economic activity in Mazandaran with many
benefits for the local community. Residents appreciated tourism for increasing job
opportunities, development of recreational facilities and spaces, creating a positive feeling
about area among tourists, and enhancing social relationships between tourists and residents.
Despite above-mentioned perceived benefits; unbridled, unplanned, and unmanaged
development of tourism in Mazandaran in past years has led to widespread environmental
degradation and the destruction of tourism resources. Tourism is a service activity based on
attracting tourists to visit tourism attractions. Thus, the tourism industry depends on not only
the quantity but also the quality of these attractions (Andriotis, 2002). Both community and
environment have certain limits, crossing these limits can cause irreversible changes that may
result in an opposition towards tourism development and tourists. This can have a major
influence on socioeconomic and environmental aspects of the society and the future success of
a destination (Andriotis, 2002; Swarbrooke, 1993). Tourism development will only be
successful if the planers understand that local communities are heterogeneous not homogenous
(Mason, 2008); thus, it is necessary to consider their needs, wants and their different attitudes
towards tourism.
The findings of study (See 4.3) show respondents generally have negative perceptions of
environmental impacts, which are perceived more than costs and benefits of socioeconomic
impacts of tourism, although some positive impacts have been appreciated. Irrespective of
socio-demographic characteristics, place of residence, attitude toward community or tourism
benefits, the local community in Mazandaran indicate a high negative perception of
environmental impacts of tourism.

164 R.Mirzaei Chapter six: Discussion and recommendations
Results indicate that socioeconomic benefits ranked second followed by socioeconomic
costs. In fact, positive environmental impacts were the least perceived impacts, which could be
due to the lack of environmental conservation strategies in tourism development plans.
Moreover, negative consequences of villas and second-homes expansions in coastal and forest
areas are so widespread that any potential positive impacts are overshadowed.
Similar to the previous studies (Ghadami, 2007; Ghadiri, Heydari & Ramezanzadeh, 2012;
Mahdavi, Ghadiri & Sanaei, 2007) the results indicate that tourism development has increased
the price of land and housing. Farming and gardening compared to tourism economic
activities, particularly second-home development, have lower economic capacity and are
therefore less attractive to residents (Ghadami et al., 2010). Thus, poor agricultural
infrastructures and lack of integrated management approach, and on the other hand ever
increasing demand for private villas and second homes resulted in a dramatic increase in land
prices. Ghadami et al. (2010) revealed 1215 percent increase of land prices in Noushahr from
2000 to 2006.
A sharp increase in the number of visitors during high seasons, e.g. Nouroz and summer
holidays, has increased the cost of living of local people. Approximately 73% of people stated
that tourism resulted in an increase in the cost of living. Similar to previous studies
(Rahnemaei, Farhoudi, Dittmann & Ghadami, 2008; Aligholizadeh, Badri & Faraji, 2005), this
study suggested that tourism has resulted in unpleasantly overcrowded beaches, hiking trails,
parks and other outdoor places. Residents believed that tourism development has resulted in
preventing the local language from being used as much as it otherwise would. Furthermore,
they believe in the role of tourism in changing the traditional cultures.
Community concern and community attachment are the variables that influence the
respondents’ perception of NSEI. Particularly, those who have a high degree of concern about
the society perceived more negative socioeconomic consequences of NBT in Mazandaran.
Surprisingly, three statements related to the behavior of tourists in destinations that seem to
be used by the government as grounds for imposing many restrictions against tourists, were
not supported strongly by residents. According to the results (See 4.3.1) the majority of

165 R.Mirzaei Chapter six: Discussion and recommendations
respondents disagreed that tourism has increased drug addiction and drinking alcohol and that
tourists’ behavior has led to more promiscuity in area.
Respondents also confirmed some positive socioeconomic impacts. They appreciated
tourism for increasing job opportunities and the availability of recreational facilities and
spaces. The proportion of employment in agriculture declined steadily throughout the last 25
years, while the proportion of industry and the service sectors increased. Due to the second-
home tourism development in area, most of the activities were associated with construction
jobs, concrete block producing, welding, carpentry, villa caretaking, and gardening (FRWTO,
2013a).
Over 72% of responses confirmed that tourism could create a positive feeling about the
area among tourists, and more than 77% of people perceived that tourism improves the
understanding and image of different communities and cultures. It shows that decision makers
should consider tourism as a powerful tool for bringing together different ethnic groups and
strengthening cultural relationships between them, an issue that is very important and crucial
in multi-ethnic societies like Iran.
Residents generally have negative perceptions of the environmental impacts of tourism.
Respondents perceived the most negative environmental impacts in the form of increasing
traffic problems, litter problems, and environmental degradation due to construction of villas
and second-homes. In recent years, the development of tourism facilities and services on the
coastline of Mazandaran has been very limited and most of the spaces are allocated to building
private villas and residential complexes for government organizations or a limited member of
high-income people. Many people who spend their one or two weeks holiday in Caspian Sea,
due to the lack of accommodation establishments have to buy private villas.
Because of the uncontrolled construction, there have been major changes in coastal areas.
In other words, public and private villas, shops, restaurants, airport, and hotels cover around
95% of coastal areas in touristic regions that are not accessible to tourists (See 5.3.8.2).
In general, during last four decades, tourism as the main driving factor has transformed the
Caspian Sea lowland dramatically. The lack of a comprehensive plan for the development and

166 R.Mirzaei Chapter six: Discussion and recommendations
protection of coastal areas, unplanned and inappropriate land use accordance with the
requirement of the area, improper use of regulations and rules of detailed plans of urban areas
for the constructions in coastal areas, as well as the destruction and fragmentation of coastal
lands and their allocation to villas or second-homes; have led to severe degradation and
damages of the coastal strip since 1970s.
Coasts as the main and central attraction are not accessible to visitors and the area has lost
much of its tourist potential. Villas, second-homes, residential complexes, fenced lands, and
tourism establishments occupy today almost the entire coastal strip and public access to beach
is very limited or in some areas impossible. In fact, seashore has become the “exclusive
courtyard” for tourist villas (Figure 6.1).
Figure 6.1 Seashore as “exclusive courtyard”in Sisangan
Photo: Cortesy from Google earth
Along the coastal road the in touristic region from Ramsar to Babolsar which is close to the
sea, the beach is completely occupied and residential, business areas and tourist villages cover
the southern part of the coastal highway. After Babolsar, the distance between the road and the
sea is greater and consequently no buildings and facilities are on the coast.
The high densification of residential and commercial buildings in coastal strip have
transformed many agricultural lands, villages and orchards into urban or tourist areas. Plain
villages have lost their traditional characteristics and rural and natural landscapes are

167 R.Mirzaei Chapter six: Discussion and recommendations
damaged. Furthermore, functional agricultural lands are converted from areas of productive
economic activity into tourist villages.
Some other factors intensifying environmental problems in coastal areas include:
- Accommodation capacities are very limited, low quality and rather expensive. Therefore,
a significant part of demand is not met and visitors have to find accommodation on the streets
sidelines, parks, or beaches. As a result, the whole area has becoming a giant rubbish dump.
Heaps of mineral water bottles, plastic bags, leftovers foods, and fruits are seen along the
beaches, at the margin of roads, or in forests.
- Lack of recreational facilities and services for tourists and very high density of visitors in
limited areas where they have access to the beach.
- Severe restrictions imposed by security forces and police on swimming and walking on
the beach will force people to go to more remote areas. The entry of tourists to the more
remote beaches that do not have any facility and services, but where there are fewer
restrictions may contribute to the death of a significant number of visitors who swim in these
areas. According to officials, more than 98% of 566 drowned people in Mazandaran coasts,
from 2010 to 2012, have been swimming in these areas (“The Caspian Sea drowning”, 2013).
Furthermore, these areas are affected by environmental damages (Figure 6.2).
Figure 6.2 Restrictions on swimming an walking on the beach
Photo by ISNA Photo by R.Mirzaei
Right picture: Walking on the beaches is crime, violators will be prosecuted

168 R.Mirzaei Chapter six: Discussion and recommendations
- Sea level rising in coastal areas and its consequences like the submerging of villas on
coastal zone and their impeded drainage. Submerged houses and wastewater wells are very
dangerous for swimmers and have an important role in sea pollution.
The combination of these factors has led to the “counter-beach” phenomenon in
Mazandaran. The change in the flow of coastal tourists affects the neighboring regions
particularly the Caspian plain, forests and mountainous areas. The uncontrolled expansion of
second-homes has resulted in major environmental and social degradations. Figure 6.3 depicts
the spatial relationships between a coastal zone with villas or second-homes and adjacent
environment as the second-home areas expand, in the area that the distance between coastal
areas and forests is close.
In the first phase, few villas are found on the coastline, the coastal boundary is free and
there is no villa or second home in plain areas or forests. As the number of villas on the
coastline increases, the second- home region expands to the plain area. The coastal boundary
is still open and there is very limited number of villas in low altitude slopes. Particularly,
public companies are developing tourist villages (Phase II).
In the third phase, the second-home region expands more, so the coastal boundary is
occupied in some areas. Tourist villages are developed in plain areas and villas expand to the
tree line. The growth rate of second-home region in coastal strip has been declining however,
in plain and forest areas it is increasing.
In the fourth and final stage, the original second-homes area becomes engulfed by
residential areas. Roughly the entire coastal strip is covered by second-homes and villas, there
is rarely open beach and the coastal boundary is completely occupied. Beaches lose their
tourism functions and become less appealing to most tourists. Second-home regions are
dramatically expanded in plain and forest areas. Tourist villages are developing in high
altitudes. Environmental degradation and deforestation is increasing. Additionally, new
constructions are developed near forest and mountain villages mainly for use as second-homes
by rural emigrants. Many of the former farm dwellings in plain and forest areas became the
second-homes of high-income people and the former property owners are today’s servants.

169 R.Mirzaei Chapter six: Discussion and recommendations
This expansion of second-homes and its consequences in the Caspian Sea littoral are not
just a function of tourism development, but also of the activities of speculators and real estate
developers, population increase, increase in car ownership, greater leisure time, political
privileges, abuse of legal vacuums, as well remote areas as being more affordable, which all
contribute to intensifying this trend.
Lack of recreational facilities in Tehran, lack of agricultural economic feasibility, and in
turn sale of agricultural lands and interest among the villagers to buy a car, are other factors
promoting the formation of the process whereby after buying the land and building villa by
new owner the former farmer will become the new caretaker.
An extensive array of research conducted by Ehlers (1970, 1971 a, b, c, d, 1974, 1980)
demonstrate the great potentials of tourism in Caspian Sea littoral in the past. However, the
above-mentioned trend has resulted in a deterioration of the Mazandaran coastline image to
the extent that today it attracts mainly the low-spending segments of the domestic markets that
are highly concentrated in special areas, and during specific times, during summer and Nouroz
holiday, without any planning, or organizing. Obviously, the mentioned trend in near future
will lead to the loss of leisure and tourism functions of the Caspian Sea lowland as the most
important destination for domestic tourism in Iran.

170 R.Mirzaei Chapter six: Discussion and recommendations
Figure 6.2 Model of villas and second-home expansion in Caspian Sea lowland,
North of Iran
Second-home line
Treeline

171 R.Mirzaei Chapter six: Discussion and recommendations
To prevent the continuation of this trend and to achieve residents’ support for tourism
development model 4.2 was developed based on the previous studies. The decomposition of
the variables describes residents’ opinions on tourism and the circumstances under which they
are willing to support tourism development.
The community concern has a direct and positive effect on local community support for
tourism development (ρ16=0.123). Furthermore, those residents who are concerned about their
society evaluate the negative environmental and socioeconomic impacts of tourism as strongly
negative (ρ56=0.471, ρ36=0.737) and have negative perception of positive socioeconomic and
environmental impacts (ρ26= -0.095, ρ46= -0.170). The total effect of this variable shows that
the result of cost and benefits analysis for residents with high level of concern about their
society is small and positive (0.05) for nature-based tourism development. It may indicate that
although this group of residents still slightly support tourism however, if the authorities do not
control and mange negative environmental and socioeconomic impacts of tourism, in near
future they will be against tourism development.
The decomposition of community attachment shows although the direct effect of this
variable on support for tourism is a little negative (-.031) but the total effect is somewhat
positive (0.02). Attached residents assess all types of impacts positively, so it is difficult to
explain the relationship between attachment to the community and attitudes towards tourism
impacts or support for tourism, this difficulty is shared with a previous studies by McCool and
Martin (1994) and Um and Crompton (1987).
General understanding of tourism’s economic benefits remaining in the society has an
indirect effect on support for tourism (0.11). The direct effect of this variable is not significant
but once the variable passes through tourism impacts the total effect is positive. The
decomposition analysis shows the significant effect of this variable on PSEI which is strongly
positive (ρ28= 0.316).
The direct effect of community use of tourism facilities and services by residents has direct
strong positive relation with support for tourism development (ρ19= 0.316). It means those
residents who use the tourism facilities strongly support tourism development. These residents
perceived very positively the socioeconomic and environmental benefits of tourism (ρ29=

172 R.Mirzaei Chapter six: Discussion and recommendations
0.311, ρ49= 0.385) although at the same time they believe that tourism will degrade the
environment (ρ59= -0.031); this may be due to the widespread and clear environmental
degradation in Mazandaran. Jourowski et al. (1997) suggested that the resource users
perceived the economic, social, and environmental impacts positively. The total effect of this
variable is also strongly direct and positive (0.44). The results suggest that resource users
strongly support tourism development.
The model provides a theoretical framework for assessing local community support for
tourism development in a developing society. Previous studies suggested a linear relationship
between tourism impacts and support for tourism development (King et al., 1992; Perdue et
al., 1990). However, this model revealed that the local community support for tourism
development is a result of cost and benefit analysis of tourism impacts by residents in which
their perceptions of tourism impacts are influenced by some attitudinal and socio-demographic
factors.
6.2 Implications
There is an increasing concern on potential negative effects of tourism on host
communities and a growing need to develop tourism in a planned and sustainable way to
maximize the benefits and control the costs. An important element in planning is considering
local communities in the planning process. This is based on the concept that planning is for the
residents of a destination (Inskeep, 1991) and their support is necessary for successful tourism
development (Swarbrook, 1993). Therefore, identifying and understanding the factors that
influence local community support for tourism development is very important for planners and
for the success of any project (Gursoy et al., 2002, p. 98).
The proposed model can help planers and decision makers to assess levels of support for
tourism development before investment in tourism projects. The planers should assess levels
of community concern. The more concern residents have for their society, the more they will
support tourism development. The findings of this research suggested that local communities
in Mazandaran are concerned about their community. This implies that investors and planners
should consider the aspects that residents have concern about, particularly environmental
degradations.

173 R.Mirzaei Chapter six: Discussion and recommendations
Limited studies have simultaneously assessed the relationship between perceived tourism
impacts and the support of tourism development and factors which predict these
interrelationships through an appropriate data analysis technique, such as path analysis.
A new factor introduced by this research is general understanding of residents of the level
of economic benefits remaining in the society. Residents believing that much of tourism’s
economic benefits will remain in the society and go to the local community will support
tourism development. The results show that the local community in Mazandaran will support
tourism if they receive economic gain from tourism. This indicates that planners, investors,
and decision makers should involve residents directly in tourism activities. Another important
strategy is to inform local communities on the direct and indirect economic benefits of tourism
development for their society, since residents may not have enough information about the
socioeconomic benefits of tourism.
The greater use of tourism facilities and services by residents will result in their support for
tourism development. The local community of Mazandaran will support tourism and exchange
their resources with tourists if they are able to access more recreational facilities. This
suggests that planners should provide more recreational opportunities through organizing
coastal and forest areas and remove restrictions to the use of existing recreational facilities.
Similar to the previous studies conducted by Jourowski et al. (1997) and Gursoy et al.
(2002) the findings of this research confirm the effectiveness of social exchange theory as the
theoretical framework for predicting residents’ attitudes toward tourism impacts and
development. Another theoretical contribution is to consider general understanding of
economic benefits of tourism remaining in the society which was the second important factor,
after utilization of tourism facilities by residents, in predicting support for tourism
development in urban setting.

174 R.Mirzaei Chapter six: Discussion and recommendations
6.3 Recommendations
Based on the results, the following recommendations are suggested:
6.3.1 Organizing coastal areas
The most important performance measure for organizing coastal areas is to stop the
construction of villas and second-homes in vulnerable forest and coastal areas and remove
barriers that impede tourists’ access to beaches. Rules and regulations that must be taken into
account in constructions in coastal areas include the Coastal Lands Act passed in 1976.
According to this law, the width of coastal boundary must be 60 meters from the high water
mark of 1963. Of course, due to the sea level rising in the past years a new baseline for
indicating high water mark should be identified.
Integrated management of beaches in all three coastal provinces, Mazandaran, Gilan and
Golestan, and continuous monitoring of land use changes should be considered. A
comprehensive plan for tourism development in the 40 km of almost unspoiled beaches (see
map 5.15) should be developed before speculators attack and repeat the bitter experience of
similar areas. These measures may help to relieve some of the troubles that manifested for
residents such as litter and traffic problems.
6.3.2 Develop strategies to help spread the benefits of tourism to the wider community
Planners need to contribute local communities to provide their traditional products in a way
that appeals to tourists. Generally, local communities’ products are traditional ones that are not
appreciated by tourists, e.g. local dairy products are less popular and suffering loss of prestige
day by day, both from the point of view of the risk to human health and in respect of the short
shelf-life of the end product (Fao, 2013). Therefore, in most cases a business relationship
cannot be established between residents and tourists, except in limited cases such as renting
rooms to tourists and caretaking.
Furthermore, tourism planners and decision makers in Mazandaran need to develop
strategies to help distribution of tourism benefits among various social groups in order to gain
their support for tourism development. Development of small scale tourism and providing

175 R.Mirzaei Chapter six: Discussion and recommendations
low-interest loans to local communities to invest in tourism projects particularly in developing
low-cost accommodation establishments such as ecolodges is also recommended. Public
organizations may transfer the ownership or the right of exploitation of their resorts and tourist
villages to the local residents. This would not only help spread the benefits of tourism to
residents, but also can bring communities together and the wider social benefits (Ritchie &
Inkari, 2006).
6.3.3 Development recreational facilities throughout the coastal strip
The finding of this research revealed that those residents who use tourism resource-based
facilities and services are strongly supportive of tourism development. In fact, it was the most
important factor for gaining residents’ support for tourism development. On the other hand,
lack of recreational facilities and services is one of the main factors in environmental
degradation. The high density of tourism establishments in limited part of coastal areas,
mainly around Ramsar, Tonekabon, Noushahr, Nour, and Babolsar, have intensified pressures
on the environment and local communities and increase the scope of environmental and
socioeconomic costs.
Establishing new recreational facilities and improvement of existing facilities with a
commitment to sustainable development principles and respect for local patterns will not only
promote residents’ support for tourism, but also will help to conserve environment and
enhance tourists’ satisfaction.
6.3.4 Involving local community in development process
Planners need to understand that host communities consist of different social groups with
different interests. Many community members may not enjoy the benefits of tourism. Women
are among groups that their critical role in tourism planning in Mazandaran has been
neglected. The results of this research show that female residents are more eager to support
tourism development. Therefore, planners, decision makers, and investors should involve them
in tourism development process.
There are several types of community partnership in tourism development. According to
Timothy (1998), the most important form of partnership includes cooperation between public

176 R.Mirzaei Chapter six: Discussion and recommendations
organizations, different levels of government, and the private. The establishment of
community based tourism NGOs can help to promote residents’ role in tourism development.
However, it is critical in host communities to consider the extent to which community may
cooperate with government and public organizations (Boya& Singh, 2003). Lankford and
Howard suggested, “Local governments and tourism promoters should lay particular emphasis
on the finding that if people feel they have access to the planning/public review process and
that their concerns are being considered, they will support tourism” (1994, p. 135).
6.3.5 Developing education programs
The findings of this study suggest that those residents who have a positive understanding of
economic benefits of tourism remaining in the society are more likely to support tourism
development. Education is needed to explain direct, indirect, and induced benefits of tourism
for society. If people are uninformed of tourism’s benefits, they may over time change their
mind, become opposed to tourism development, and reject tourism. To help local community
to better understand tourism and its impacts, educational programs can be developed through
tourism exhibitions, public meetings, workshops, and television and radio programs.
6.3.6 Commitment to practical use of impact assessment techniques
The results indicate that there has been considerable environmental degradation and over-
exploitation of natural resources due to the unplanned expansion of coastal construction and
the conversion of farmlands and paddies to residential areas. “Impact analysis is conducted to
predict the likely economic, social, and environmental effects of alternative tourism plans.
Impact assessment suggest who and what may be positively and adversely impacted by the
proposed developments and help the community decide which, if any, of alternative plans
should be adopted”( Dwyer & Edwards, 2010, p.34). Thus, commitment to use impact
assessment techniques in development projects contributes to control negative environmental
and socioeconomic impacts when the environment is affected by development.

177 R.Mirzaei Chapter six: Discussion and recommendations
6.4 Future research
This thesis did not assess the attitudes of business owners who play an important role in
providing services to tourists. Further studies are needed to examine their perceptions of
factors predicting their support for tourism development. Results show the perceived NSEI
and PEI did not have direct relationship with support for tourism. Further studies are needed to
examine relationship between these factors. Since attitudes towards tourism may change over
time, longitudinal research is suggested to assess changes in local communities’ attitudes
towards tourism impacts and development.
Since the type and level of tourism development in other part of Caspian Sea littoral are
different, it would be meaningful to examine residents’ perception of tourism in these areas,
particularly in western coast of Gilan. This research examined perceptions of residents of
nature-based tourism; further study could provide additional insight into the applicability of
the proposed model for other types of tourism such as cultural tourism.
The relationship between general understanding of economic benefits remaining in society
and attitudes towards tourism was assessed for the first time in this study. More study is
required to examine the exact impact of this variable on support for tourism development.
Although many restrictions against tourist are based on the hypothesis that tourists’
behavior have negative impacts on society, the findings of this study reject this hypothesis.
Further study is needed in other areas with different levels of development to examine
relationship between tourists’ behavior and social problems in tourist destinations.
Due to the dramatic fluctuation in residents’ income in last two years, it would be
meaningful to examine the relationship between the economic status of communities and their
perceptions of tourism impacts.
As the type of tourists varies in different part of Caspian Sea littoral, they have different
environmental behaviors. Identification of the factors influencing environmental behaviors of
tourists would have both theoretical and management implications.
178 R.Mirzaei Refrences
References
Agriculture organization of Mazandaran. (2013). Agriculture in Mazandaran. Retrieved from
http://www.jkmaz.ir/KS-UpFile/KS-file/SIMAYE%20KESHAVARZI/(1392-3-1)-
%5B426765%5D-broshor%2090%20(sima90).zip
Akis, S., Peristianis, N., & Warner, J. (1996). Residents’ attitudes to tourism development: the
case of Cyprus. Tourism management, 17(7), 481-494.
Aligholizadeh Firozjahi, N., Badri, A., & Faraji, H. (2005). Local community attitude toward
economic and environmental impacts of tourism in rural areas, Noushahr as case
study. Roosta va Tosee, 10 (1), 1-23.
Aligholizadeh Firozjahi, N., Ghadami, M., & Ramezanzadeh, M. (2010). The local community
attitude towards tourism development in rural areas, Golijan as case study. Human
geography researches, 71, 35-48.
Allen, L. R., Hafer, H. R., Long, P. T., & Perdue, R. R. (1994). Rural residents’ attitudes
toward recreation and tourism development. Journal of Travel Research, 31(4), 27-33.
Allen, L. R., Long, P.T., Perdue, R.R., & Kieselbach, S. (1988). The Impact of Tourism
Development on Residents’ Perceptions of Community Life. Journal of Travel
Research, 27(1),16–21.
Andereck, K. L., Valentine, K. M., Knopf, R. C. & Vogt, C. A. (2005). Residents’ perception
of community tourism impacts. Annals of tourism research, 32(4),1056-1076.
Andereck, K. L., & Vogt, C.A. (2000). The relationship between residents’ attitudes toward
tourism and tourism development options. Journal of Travel Research, 39(1), 27-36.
Andriotis, K. (2002). Local Community Perceptions of Tourism as a Development Tool: The
Island of Crete (Doctoral dissertation, University of Bournemouth, UK). Retrieved
from http://www.angelfire.com/ks/andriotis/PhDthesis.html.
Andriotis, K. (2004). The perceived impact of tourism development by Cretan residents.
Tourism and hospitality Planning and Development, 1 (2), 123-144.
Andriotis, K. (2005). Community Groups' Perceptions of and Preferences for Tourism
Development: Evidence from Crete. Journal of Hospitality and Tourism Research,
29(1), 67-90.
Andriotis, K. & Vaughan, R.D. (2003). Urban residents’ attitudes toward tourism
development: the case of Crete. Journal of Travel Research, 42,172-85.
Ap, J. (1990). Residents’ Perceptions Research on the Social Impacts of Tourism. Annals of
Tourism Research, 17 (4), 610-616.

179 R.Mirzaei Refrences
Ap, J. (1992). Residents’ perceptions of tourism impacts. Annals of Tourism Research, 19(4),
665-690.
Ap, J., & Crompton, J. L. (1993). Residents’ strategies for responding to tourism impacts.
Journal of Travel Research, 31(3), 47-50.
Ap, J.,&Crompton, J. L. (1998). Developing and testing a tourism impact scale. Journal of
Travel Research, 37(2), 130-138.
Archer, B.H. (1977). Tourism multipliers: The state of the art. Bangor Occasional Papers in
Economics, 11. Cardiff: University of Wales Press.
Archer, B.H. (1982). The value of multiplier and their policy implications. Tourism
Management. 3(4), 236-241.
Archer, B.H. (1988). Tourism and island economies: impact analyses. In Cooper, C.P. &
Lockwood, A. (Eds.), Progress in Tourism, Recreation and Hospitality Management
(pp. 125-134). Chichester: Wiley.
Archer, B.H. (1995). Importance of tourism for the economy of Bermuda. Annals of Tourism
Research, 22(4), 918-930.
Archer, B.H., & Fletcher, J. (1988). The tourist multiplier. Teoros, 7, 6-10.
Archer, B.H. & Fletcher, J. (1990). Tourism: its economic importance. In: Quest, M. (Eds.),
Horwath Book of Tourism (pp. 10-25). London and Basingstoke: MacMillan.
Archer, B.H. & Fletcher, J. (1996). The economic impact of tourism in the Seychelles. Annals
of Tourism Research, 23(1), 32-47.
Arneger, J., Woltering, M., & Job, H. (2010). Toward a product-based typology for nature-
based tourism: a conceptual framework. Journal of sustainable tourism, 18 (7), 915-
928.
Auty, R.M. (1995). Patterns of Development: Resources, Policy and Economic Growth.
London: Edward Arnold.
Avcikurt, C., & Soybali, H. (2001). Residents’ Attitudes towards Tourism in Ayvalik, Turkey.
Tourism Analysis, 6, 259-265.
Baker, S. (2006). Sustainable development. New York: Routledge.
Baretje, R. (1982). Tourism’s external account and the balance of payments. Annals of
Tourism Research, 9(1), 57-67.
Baum, T.G. & O’Gorman, K. D. (2010). Iran or Persia: What’s in a name, the decline and fall
of a tourism industry? In: Tourism and Political Change. Goodfellow, Oxford.

180 R.Mirzaei Refrences
Beeton, S. (2005). The Case Study in Tourism Research: A Multi-Method Case Study
Approach. In Ritchie, B., Burns, P., & Palmer, C (Eds.), Tourism Research Methods
Integrating Theory with Practice. New York: CAB International.
Belisle, F. J., & Hoy, D. R., (1980). The Perceived Impact of Tourism by Residents: A Case
Study in Santa Marta, Colombia. Annals of Tourism Research 7, 83–101.
Berno, T. (1999). When a Guest is a Guest. Cook Islanders View Tourism. Annals of Tourism
Research, 26 (3), 656-675.
Black, J. & Champion, D.J. (1976). Methods and Issues in Social Research, New York: Wiley.
Blau, P. M. (1964). Exchange and Power in Social Life. New York: Wiley.
Bordens, K. S. & Abbott, B. B. (2002). Research design and methods: A process approach (5th
ed.). New York: McGraw-Hill.
Bottrill, C., & Pearce, D. (1995). Ecotourism: Towards a key elements approach to
operationalising the concept. Journal of Sustainable Tourism, 3(1), 45-54.
Boyd, S. & Singh, S. (2003). Destination Communities: Structures, Resources and Types. In
Singh, S., Timothy, D.J., & Dowling, R.K. (Eds.), Tourism in Destination
Communities (pp. 19-33). UK: CABI Publishing.
Brayley, R. E. (2000). Tourism Development as a Change Agent in Community Attitudes
toward the Natural Environment. Visions in Leisure and Business, 18, 26-31.
Briant, P. (1998). History of Achaemenid Empire (M. Semsar, Trans.), Tehran: Zaryab.
(Original work published 1996).
Britton, S.G. (1982). The political economy of tourism in the third World. Annals of Tourism
Research, 9(2), 331-358.
Britton, S. (1987a) Tourism in small developing countries development issues and research
needs. In Britton, S., & Clark, W.C. (Eds.), Ambiguous Alternative Tourism in Small
Developing Countries (pp. 167–87). Suva: University of the South Pacific.
Britton, S. (1987b) Tourism in Pacific-islands states: Constraints and opportunities. In Britton,
S., & Clark, W.C. (Eds.), Ambiguous Alternative Tourism in Small Developing
Countries (pp. 113–140). Suva: University of the South Pacific.
Britton, S.G. (1989). Tourism, dependency and development: A model of analysis. In Singh,
T., Theuns, H., & Go, F.M. (Eds.), Towards Appropriate Tourism: The Case of
Developing Countries (pp. 93-116). Frankfurt: Peter Lang.
Brohman, J. (1995). Economism and critical silences in development studies: A theoretical
critique of neoliberalism. Third World Quarterly.16 (2), 297–318.

181 R.Mirzaei Refrences
Brohman, J. (1996a). New directions in tourism for third world development. Annals of
Tourism Research. 23(1), 48-70.
Brohman, J. (1996b). Popular Development: Rethinking the Theory and Practice of
Development. Oxford: Blackwell.
Bromberger, C., (2012, January 19). Landholding and Social Stratification.
Encyclopædia Iranica, online edition. Retrieved from http://www.iranicaonline.org/articles/gilan-xix-landholding
Brougham, J. E., & Butler, R.W. (1981). A Segmentation Analysis of Resident Attitudes to
Social Impact of Tourism. Annals of Tourism Research, 8 (4), 569-90.
Browett, J.G. (1980). Development, the diffusionist paradigm and geography. Progress in
Human Geography. 4(1), 57-79.
Brunt, P., & Courtney, P. (1999). Host perceptions of sociocultural impacts. Annals of
Tourism Research, 26, 493–515.
Buckley, R. (2009). Ecotourism Principles & Practices. UK:CABI Publication.
Buckley, P.J. & Geyikdagi, N. (1993). Tourism and foreign currency receipts. Annals of
Tourism Research, 20(2), 361-364.
Buglear, J. (2003). Quantitative methods for business and management. UK: Pearson.
Bureau of statistics and marketing. (1978). Tourist arrivals in Iran. Tehran: Statistic center of
Iran.
Bureau of statistics and information. (1997). Tourist arrivals in Iran. Tehran: Iran travel and
Tourism Organization.
Burr, S.W., Zeitlin, J., Chase, L., Ramaswamy, V., Green, G., & Dougherty, M. (2010).
Resources for Agritourism Development. Logan, UT: Institute for Outdoor Recreation
and Tourism, Utah State University. Retrieved from
extension.usu.edu/iort/htm/publications/publication=10492
Butcher, J. (1997). Sustainable Development or Development? In M. J. Stabler (Eds.),
Tourism and Sustainability: Principles to Practice, (pp. 27-38). New York: CAB
International.
Butler, R. (1975). Tourism as an Agent of Social Change. Occasional Papers in Geography.
Peterborough, Ontario: Trent University.
Butler, R.W. (1980). The concept of a tourism area cycle of evolution. Canadian Geographer,
24, 5–12.
Butler , R. W. ( 1991). Tourism, environment and sustainable development. Environmental
Conservation , 18 , 201- 209.
182 R.Mirzaei Refrences
Bystrzanowski, J. (1989). Tourism a factor of change: a socio cultural study. Vienna:
European co-ordination center for research and documentation in social sciences.
Caneday, L. & Zeiger, J. (1991). The social, economic, and environmental costs of tourism to
a gaming community as perceived by its residents. Journal of travel research, 30(2),
45-49.
Carmichael, B. A. (2000). A Matrix Model for Resident Attitudes and Behaviours in a Rapidly
Changing Tourism Area. Tourism Management, 21 (6), 601-611.
Ceballos-Lascurain, H. (1996). Tourism, Ecotourism and Protected Areas. Gland, Switzerland:
IUCN.
Central Bank of Iran (CBI), 2013. Summary of economic developments in Iran. Tehran:
Central Bank of Iran.
Chambers, R. (1997). Paradigm shifts and the practices of participatory research and
development. In N. Nelson & S. Wright (Eds.), Power and Participation Development
– Theory and Practice (pp. 30–42). UK: Intermediate Technology Publication.
Chen, J. S. (2000). An Investigation of Urban Tourism Residents’ Loyalty of Tourism. Journal
of Travel and Tourism Research, 24 (1): 5-19.
Chen, J. C. (2001). Assessing and visualizing tourism impacts from urban residents'
perspectives. Journal of Hospitality and Tourism Research, 25(3), 235-250.
Ching Yang, J. Y., (2006). Nature based tourism impacts in I-lan, Taiwan: Business managers
perceptions (unpublished doctoral dissertation). University of Florida: USA.
Chipeta, C. (1981). Indigenous Economics: A Cultural Approach. NY: Exposition Press.
Chris Choi, H.S., & Sirakaya, E. (2005). Measuring residents' attitude toward sustainable
tourism: Development of sustainable tourism attitude scale. Journal of Travel
Research, 43, 380-394. doi: http://jtr.sagepub.com/content/43/4/380
Christaller, W. (1963). Some considerations of tourism location in Europe: The peripheral
regions underdeveloped countries – recreation areas. Regional Science Association.
12(1), 95–105.
Churchill, G.A. Jr., (1987). Marketing Research: Methodological Foundations (4th
ed.).
Chicago: Dryden Press.
Cochran WG. (1997). Sampling Techniques. New York: John Wiley & Sons.
Cooke, K. (1982). Guidelines for socially appropriate tourism development in British
Columbia. Journal of Travel Research, 21(1), 22–28.
Creswell, J. W. (2007). Qualitative inquiry and research design: Choosing among five
approaches (2nd
ed.). Thousand Oaks: Sage Publications.
183 R.Mirzaei Refrences
Cropanzano, R. & Mitchell, M. S. (2005). Social exchange theory: an interdisciplinary review.
Journal of management, 31(6), 874-900.
Davis, H. (1968). Potentials for tourism in developing countries. Finance and Development,
5(4), 34–39.
Davis, D., Allen, J., & Cosenza, R.M., (1988). Segmenting Local Residents by Their
Attitudes, Interests and Opinions Toward Tourism. Journal of Travel Research, 27(2),
2–8.
Davis, J. S., & Morais, D. B. (2004). Factions and Enclaves: Small Towns and Socially
Unsustainable Tourism Development. Journal of Travel Research, 43 (1), 3-10.
Department of Ancient Near Eastern Art (DANEA). (2003). The Sasanian Empire (224–
651 A.D.). In Heilbrunn Timeline of Art History. New York: The Metropolitan
Museum of Art, 2000–. http://www.metmuseum.org/toah/hd/sass/hd_sass.htm
(October 2003).
Department of Ancient Near Eastern Art (DANEA) (2004). "The Achaemenid Persian Empire
(550–330 B.C.)". In Heilbrunn Timeline of Art History. New York: The Metropolitan
Museum of Art, 2000–. http://www.metmuseum.org/toah/hd/acha/hd_acha.htm
(October 2004)
Department of Environment (DOE). (2010). Fourth national report to the convention on
biological diversity. Retrieved from www.cbd.int/doc/world/ir/ir-nr-04-en.pdf
Department of Environment. (DOE) (2013). List of Iran’s under protected areas. Retrieved
from http://www.doe.ir/Portal/Home/Default.aspx?CategoryID=194f31a0-4030-446f-
8a8a-3b49774ba52d
Dittmann, A (2013) (In press). Geoparks and Geotourism- a comparative introduction. In
Dittmann, A. (Eds.), The Iranian challenge, potential and constraints of Geo-Park and
Geo-Tourism. Frankfurt: Peter Lang.
Dittmann, A & Mirzaei, R (2013) (In press). Tourism development in Iran. In Dittmann, A.
(Eds.), The Iranian challenge, potential and constraints of Geo-Park and Geo-Tourism.
Frankfurt: Peter Lang.
Doxey, G. V., (1975). A Causation Theory of Visitor–Resident Irritants: Methodology and
Research Inferences. Proceedings of the 6th Annual Conference of the Travel and
Tourism Research Association 1,195–198.
Duffield, B.S. (1982). Tourism: the measurement of economic and social impact. Tourism
Management. 3(4), 248-255.
Dwyer, L., & Edwards, D. (2010). Sustainable Tourism Planning. In Liburd, J., & Edwards, D.
(Eds.), Understanding the Sustainable Development of Tourism (pp. 19-44). Oxford:
Goodfellow Publishers.

184 R.Mirzaei Refrences
Eagles, Paul F.J., McCool, Stephen F., & Haynes, Christopher D.A. (2002). Sustainable
Tourism in Protected Areas: Guidelines for Planning and Management. IUCN Gland,
Switzerland and Cambridge, UK.
Eber, S. (Eds.), (1992). Beyond The Green Horizon: Principles for Sustainable Tourism.
Godalming, Surrey: World Wide Fund for Nature.
Edgell, D.L. (1990). International Tourism Policy. New York: Van Nostrand Reinhold.
Ehlers, E. (1970). Die Teelandschaft von Lahidjan/Nordiran, in Beiträge zur Geographie der
Tropen and Subtropen. Festschrift für Herbert Wilhelmy, Tübingen. 229-242.
EHLERS, E. (1971a). Die Städte des südkaspischen Küstentieflandes. Die Erde, 102, 6-33.
EHLERS, E. (1971b). Nordpersische Agrarlandschaften. Landnutzung und sozialstruktur in
Ghilan und Mazanderan. Geographische Rundschau 23, 329-342.
Eckart, E. (1971c). Agrarsoziale Wandlungen im Kaspischen Tiefland Nordpersiens,
Deutscher Geographentag Erlangen-Nürnberg, 289-311.
Ehlers, E. (1971d). Das Südkaspische Tiefland (Nordiran) und Kaspisches Meer. Zu ihrer
Entwicklungsgeschichte im Jung-Pleistozän. - Tübinger Geographische Studien, vol.
44. Tübingen.
EHLERS, E. (1974). Some Geographic and Socio-Economic Aspects of Tourism in Iran.
Orient 15, 97-105.
Ehlers, E. (1980). Iran, grundzuege einer geographischen landeskunde. Wissenschaftliche
Laenderkunden Band 18, Darmstadt.
Ehler, E. (2013) (In press). Caspian tourism-Framework conditions from an ecological and
cultural perspective. In Dittmann, A. (Eds.), The Iranian challenge, potential and
constraints of Geo-Park and Geo-Tourism. Frankfurt: Peter Lang.
Ekins, P. (2000). Economic Growth and Environmental Sustainability: The Prospects for
Green Growth. London: Routledge.
Emerson, R. M. (1976). Social Exchange Theory. Annual Review of Sociology, 2, 335-362.
Retrieved from: http://www.jstor.org/stable/2946096
Erisman, M. (1983). Tourism and cultural dependency in the West Indies. Annals of Tourism
Research. 10(3), 337-362.
Fao (2013). The technology of traditional milk products in developing country. Retrieved from http://www.fao.org/docrep/003/t0251e/T0251E09.htm
Fennell, D. (1999). Ecotourism: An Introduction. London, Routledge.
Firth, R. (1967). Themes in economic anthropology. London, Tavistock.

185 R.Mirzaei Refrences
Foa, U. G., & Foa, E. B. (1974). Societal structures of the mind. Springfield, IL: Charles C
Thomas.
Foa, U. G., & Foa, E. B. (1980). Resource theory: Interpersonal behavior as exchange. In
Gergen, K. J., Greenberg, M. S., & Willis, R. H. (Eds.), Social exchange: Advances in
theory and research. New York: Plenum.
Forest, Range & Watershed Organization (2005). Iran Third Country Report. Retrieved
30/03/2013, from:
http://www.frw.org.ir/files/english/ThirdReport.pdf
Forest, Range & Watershed Organization (2013a). Country profile, Natural Resources:
Forests. Retrieved 30/03/2013, from:
http://www.frw.org.ir/CountryProfile/NaturalResources/Forests/pageid/85/language/en
-US/Default.aspx
Forest, Range & Watershed Organization (2013b). Country profile, Natural resources: Deserts.
Retrieved 30/03/2013, from:
http://www.frw.org.ir/CimayeManabeTabeeKeshvar/ByabanhayeIran/pageid/47/langu
age/fa-IR/Default.aspx
Fredline, L., Deery, M., & Jago, L. (2006). Development of a scale to assess the social impacts
of tourism within communities. CRC for sustainable tourism Pty Ltd.
Fredline, E., & Faulkner, B. (2000). Host Community Reactions. A Cluster Analysis. Annals
of Tourism Research, 27 (3), 763-84.
Fridgen, J. D. (1991). Dimensions of Tourism. East Lansing MI: The Educational Institute of
the American Hotel and Motel Association.
Friedmann, J. (1980). An alternative development? In J. Friedmann, E.Wheelwright &
J.Connell (Eds.), Development Strategies in the Eighties (pp. 4-11). Sydney:
Development Studies Colloquium, Monograph No.1.
Gee, C. Y., Mackens, J. C., & Choy, D. J. (1989). The Travel Industry. New York: Van
Nostrand Reinhold.
Ghadami, M. (2007). Modeling sustainable urban and tourism development, Kelardasht as
case study. (Unpublished doctoral dissertation). University of Tehran: Tehran.
Ghadami, M., Aligholizadeh, N., & Anamoradnejad, R. (2010). The role of tourism in
changing land use in tourism destinations, Noushahr as case study. Urban and regional
research and study, 3, 21-42.
Ghadiri Masom, M., Heydari, Z. & Ramezanzadeh, M. (2012). Immigration aspects of second
home tourism, Tonekabon as case study. Tosee Rostaei, 4(1), 53-71.

186 R.Mirzaei Refrences
Gharib, S. (2003). Criteria and terms for sustainable development in coastal strip of Caspian
Sea. Journal of Fine Arts, 13.
Gholamaliifard, M., Jorabian, S., Hosseini, H., & Mirzaei, M. (2013). Modeling land use
change in coastal areas of Mazandaran. Mohitshenasi, 4, 109-124.
Gilbert, D., & Clark, M. (1997). An exploratory examination of urban tourism impact, with
reference to residents attitudes in the cities of Canterbury and Guildford. Cities, 14(6),
343–352.
Goodwin, H. (1996). In pursuit of ecotourism. Biodiversity and conservation, 5(3), 277-291.
Goeldner, C., & Ritchie, J. (2009). Tourism: principles, practices, philosophies. 11th
ed. New
York: John Wiley and Sons.
Goldsworthy, D. (1988). Thinking politically about development. Development and Change,
19(3), 505–530.
Google Maps (2013). Iran. Retrived from https://maps.google.de/maps?q=iran&ie=UTF-
8&hq=&hnear=0x3ef7ec2ec16b1df1:0x40b095d39e51face,Iran&gl=de&ei=4D3hUayr
I4Tc4QSLvYGgCw&ved=0CJ0BELYD
Gould, G. (1994). Evaluating Tourism Impacts: Study Book. Bournemouth: Bournemouth
University.
Gouldner, A. W. (1960). The norm of reciprocity: a preliminary statement. American
sociological review, 25, 161-178.
Gursoy, D., Chen, J. S., & Yoon, Y. (2000). Using Structural Equation Modeling to Assess the
Affects of Tourism Impact Factors and Local Residents Support for Tourism
Development. In annual conference proceedings of the Travel and Tourism Research
Association, 243–250. Boise ID: TTRA.
Gursoy, D., Chi, C. G., & Dyer, P. (2010). Locals' Attitudes toward Mass and Alternative
Tourism: The Case of Sunshine Coast, Australia, Journal of Travel Research, vol.
49(3): 381-394
Gursoy, D., Jurowski, C., & Uysal, M. (2002). Resident attitudes: A structural modeling
approach. Annals of Tourism Research, 29, 79–105.
Gursoy, D., & Rutherford, D. G. (2004). Host attitudes toward tourism: An Improved
Structural Model. Annals of Tourism Research , 31(3), 495–516.
Graburn, N., & Jafari, J. (1991). Introduction tourism social science. Annals of Tourism
Research, 18 (1), 1–11.
Gunn, C. A., (1988). Tourism Planning. New York: Taylor & Francis.

187 R.Mirzaei Refrences
Hall, C.M. (1994). Tourism and Politics: Policy, Power and Place. Chichester: Wiley.
Hall, C.M. (1996). Political effects of tourism in the Pacific. In Hall, C.M. & Page, S.J. (Eds.),
Tourism in the Pacific: Issues and Cases (pp. 81-90). London: Thomson.
Hall, C.M., & Boyd, S. (2005). Tourism and Nature-based Tourism in Peripheral Areas:
Development or Disaster. Channelview Publications.
Hall, C. M., & B. Weiler, Eds. (1992). Special Interest Tourism. London: Belhaven.
Haralambopoulos, N., & Pizam, A. (1996). Perceived Impacts of Tourism: The Case of
Samos. Annals of Tourism Research, 23 (3), 503-526.
Harrill, R. (2004). Residents' Attitudes toward Tourism Development: a Literature Review
with Implications for Tourism Planning. Journal of Planning Literature, 18, 251-266.
Harrill, R., & Potts, T.D. (2003). Tourism planning in historic districts: Attitudes toward
tourism development in Charleston . Journal of the American Planning Association,
69(3), 233-244.
Harris, R., Griffin, T., & Williams, P. 2002. Sustainable tourism: a global perspective.
Oxford: Butterworth Heinemann.
Harrison, D. (1992). International tourism and the less developed countries: The background.
In D. Harrison (Eds.), Tourism and the Less Developed Countries, (pp. 1–18).
Toronto: Belhaven.
Hearne, R.R., & Salinas, Z.M. (2002), The use of choice experiments in the analysis of tourist
preferences for ecotourism in Costa Rica, Journal of Environmental Management, 65,
153-163.
Hegel, G. W. F. (1902). Lectures on the Philosophy of History (Sibree, J. translation). London:
Henry G. Bohn. (original work published 1837).
Hiller, H. Q. (1977). Industrialism, Tourism, Island Nations and Changing Values. In Farrell,
B. (Eds.), Social and economic consequences of tourism in the south pacific (pp. 115-
121). Santa Cruz: Centre for south pacific studies.
Hills, T. L., & Lundgren, J. (1977). The impact of tourism in the Caribbean: A methodological
study. Annals of tourism research, 4(5), 249-267.
Hoivik, T., & Heiberg, T. (1980). Centre-periphery tourism and self-reliance. International
Social Science Journal 32 (1), 69–98.
Holden, A. (2000). Environment and Tourism. New York: Routledge.
Homans, G. C. (1958). Social behavior as exchange. American journal of sociology, 63, 597-
606.

188 R.Mirzaei Refrences
Howie, F. (2003). Managing the tourist destination. London: Thomson Learning.
Hsu, C. H. C. (1998). Impacts of Riverboat Gaming on Community Quality. Journal of
Hospitality and Tourism Research, 22 (4), 323-337.
Huang, Y. H., & Stewart, W. P. (1996). Rural Tourism Development: Shifting Basis of
Community Solidarity. Journal of Travel Research, 34 (4), 26-31.
Hudman, L. E., & Hawkins, D. E. (1989). Tourism in Contemporary Society: An Introductory
Text. Englewood Cliffs, NJ: Prentice Hall.
Hughes, H.L. (1983). The tourist as a source of local government finance. Service Industries
Journal, 3(2), 120-135.
Huh, C., & Vogt, V. (2008). Change in Residents’ Attitudes toward Tourism over Time: A
Cohort Analytical Approach. Journal of Travel Research, 46, 446-455. DOI:
10.1177/0047287507308327.
Hunt, D. (1989). Economic Theories of Development: An Analysis of Competing Theories.
Hertfordshire: Harvester Wheatsheaf.
Hunter, C. (1997). Sustainable Tourism as an Adaptive Paradigm. Annals of Tourism
Research, 24, 850–867.
Husbands, W. (1981). Centres, peripheries, tourism and socio-spatial development. Ontario
Geography, 17, 37–60.
ICHTO. (2007). The Ecotourism National Plan of Iran. Tehran: ICHTO.
ICHTO. (2010). Comparison between inbound tourism from 2007 to 2009. Tourism
development office, Tehran.
ICHTO. (2011). Selected international tourism statistics of Iran. Unpublished report. Tehran:
Tourism development and marketing bureau.
ICHTO. (2012). Where to stay in Iran, Accommodations. ICHTO.ir. Retrieved Sep 6, 2012
from http://www.ichto.ir/Default.aspx?tabid=1228
Inbakaran R, Jackson M. (2003). Segmenting the host community: An empirical analysis of
attitudes toward increasing tourism in Victoria, Australia. In , Aicken, M., & Ryan, C.
(Eds.), Taking Tourism to the Limits Refereed Research Papers (pp.315-337). New
Zealand: University of Waikato Management School.
Inbakaran R, Jackson M. (2004). A multivariate analysis of resident attitudes towards tourism
development in regional Victoria. In Cooper, C. , Arcodia, C., Solnet, D., & Whitford,
M. (Eds.), Creating tourism knowledge, Proceedings of the CAUTHE Conference.
Brisbane: The University of Queensland.

189 R.Mirzaei Refrences
Infield, M., & Namara, A. (2001). Community Attitudes and Behavior towards Conservation:
An Assessment of a Community Conservation Program around Lake Mburo National
Park, Uganda. Oryx, 35 (1), 48-60.
Inskeep, E. (1991). Tourism Planning: An Integrated and Sustainable Development
Approach. New York: Van Nostrand Reinhold.
Ionides, D., & Debbage, K. (1997). Post-Fordism and flexibility: The travel industry polyglot.
Tourism Management, 18, 229–241.
Iroegbu, H., & Chen, J. S. (2001). Urban Residents’ Reaction toward Tourism Development:
Do Subgroups Exist? Tourism Analysis, 6 (2), 155-61.
Iran Travel& Tourism Organization (ITTO). (2002). Tourism Master Plan of Iran. Tehran:
National project office.
Iran Travel & Tourism Organization (ITTO). (2009). The statistics Yearbook. Tehran: ITTO.
IUCN, (1980). World Conservation Strategy: Living Resources Conservation for Sustainable
Development. Gland, Switzerland: World Conservation Union.
IUCN. (1994). Guidelines for Protected Area Management Categories. Gland, Switzerland and
Cambridge, UK.
International Union for Official Travel Organization ( IUOTO). (1976). The Impact of
International Tourism on the Economic Development of the Developing Countries.
Geneva: International Union of Official Travel Organisations.
Jackson, M.J. (1986). Economic Impact Studies: The Methodology Applied to Tourism.
Bristol: Bristol Polytechnic.
Jackson, M.S. & Inbakaran, R.J., (2006). Evaluating residents’ attitudes and intentions to act
towards tourism development in regional Victoria, Australia. International Journal of
Tourism Research, 8, 355-366.
Jacobs, M. (1995). Sustainability and community. Australian Planner, 32(3), 109–115.
Jafari, J. (1973). Role of Tourism on Socio-Economic Transformation of Developing
Countries. (Unpublished M.Sc. Thesis). Cornell University, Ithaca.
Jafari, J. (1987). Tourism Models: The Sociocultural Aspects. Tourism Management, 8 (2),
151-159.
Jamieson, W., & Jamal, T. (1997). Tourism Planning and Destination Management. In Gee,
C., & Fayos-Sola, E. (Eds.), International Tourism: A Global Perspective (pp. 321-
337). Madrid, Spain: World Tourism Organization.
Jennings, G. & Nickerson, N. P. (2006). Quality tourism experiences. Oxford: Elsevier
Butterworth–Heinemann.

190 R.Mirzaei Refrences
Jenkins, C.L. (1997). Impacts on the development of international tourism in the Asian region.
In: Go, F.M. & Jenkins, C.L. (Eds.), Tourism and Economic Development in Asia and
Australasia (pp. 48-66). London: Cassel.
Johnson, R.A & Bhattacharyya, G. K. (2010). Statistics Principles and Methods. U.S.A: John
Willey and Sons.
Johnson, J. D., Snepenger, D. J., & Akis, S. (1994). Residents’ perception of tourism
development. Annals of Tourism Research, 12(3), 629-642.
Jurowski, C., Uysal, M., &Williams, D. R. (1997). A theoretical analysis of host community
resident reactions to tourism. Journal of Travel Research, 36(2), 3-11.
Kaiser, H.F. (1974). An index of factorial simplicity. Psychometrika, 39, 31-36.
Kang,Y. S., Long, T. L.,&Perdue, R. R. (1996). Resident attitudes toward legal gambling.
Annals of Tourism Research, 23(1), 71-85.
Kaul, R. (1985). Dynamics of Tourism: The Phenomenon. New Delhi: Sterling.
Kavallinis, I., & Pizam, A. (1994). The Environmental Impacts of Tourism: Whose
Responsibility Is It Anyway? The Case Study of Mykonos. Journal of Travel
Research, 33(2), 26-32.
Kayat, K. (2002). Power, Social Exchanges, and Tourism in Langkawi: Rethinking Resident
Perceptions. International Journal of Tourism Research, 4 (3): 171-91.
Keller, C.P. (1984). Centre–periphery tourism development and control. In J. Long & R.
Heacock (Eds.), Leisure, Tourism and Social Change. UK: Dunfermline College of
Physical Education.
Keogh, B. (1990). Public participation in community tourism planning. Annals of Tourism
Research, 17(3), 449-465.
Kerlinger, F. & Lee, H. (2000). Foundations of Behavioral Research. (4th
ed.), Orlando, FL:
Harcourt College Publishers.
Kershaw, A., & Lickorish, L. (1958). The Travel Trade. London: Practical Press.
King, B., Pizam, A., & Milman, A. (1993). Social impacts of tourism: Host perceptions.
Annals of Tourism Research, 20 (4), 650–665.
Ko, D. W. & Stewart, W. P. (2002). A structural equation model of residents’ attitudes for
tourism development. Tourism management, 23, 521-530.
Kröger, T. (1981). Der Fremdenverkehr im kaspischen Tiefland Nordpersiens. (Unpublished
doctoral dissertation). Universität Marburg: Marburg.

191 R.Mirzaei Refrences
Kuvan, Y., & Akan, P. (2005). Residents’ attitudes toward general and forest-related impacts
of tourism: the case of Belek, Antalya. Tourism Management, 26, 691–706
Lal, D. (1985). The misconceptions of ‘development economics’. Finance and Development
22. Reprinted in K. Wilber (Eds.), The Political Economy of Development and
Underdevelopment (pp. 28–36). Toronto: McGraw-Hill.
Lankford, S. V. (1991). An Analysis of Resident Preferences, Attitudes and Opinions toward
Tourism and Rural Regional Development in the Columbia River Gorge. (Unpublished
doctoral dissertation). University of Oregon.
Lankford, S. V. (1994). Attitudes and perceptions toward tourism and rural regional
development. Journal of Travel Research, 31(3), 35-43.
Lankford, S. V., & Howard, D. (1994). Development of a tourism impact attitude scale.
Annals of Tourism Research, 21(1), 121-139.
Lankford, S. V., Williams, A., & Knowles-Lankford, J. (1997). Perceptions of outdoor
recreation opportunities and support for tourism development. Journal of travel
research, 35, 65-69.
Lawson, R. W., Williams, J., Young, T., & Cossens, J. (1998). A comparison of residents’
attitudes towards tourism in 10 New Zealand destinations. Tourism Management,
19(3), 247–256.
Lea, J. (1988). Tourism and Development in the Third World. London and New York:
Routledge.
Lickorish , L. ( 1994). An Introduction to Tourism. London: Sage .
Lickorish, L. & Jenkins.C. (1997). An Introduction to Tourism. Oxford: Butterworth-
Heinemann.
Lindberg, K., Andersson, T.D., & Dellaert, B.G. (2001). Tourism Development: Assessing
Social Gains and Losses.” Annals of Tourism Research, 28 (4), 1010-1030.
Lindberg, K., Enriquez, J., & Sproule, K. (1997). Ecotourism questioned: Case studies from
Belize. Annals of tourism Research, 23(3), 543-62.
Liu, J. C., Sheldon, P.,&Var, T. (1987). Resident perceptions of the environmental impact of
tourism. Annals of Tourism Research, 14, 17-37.
Liu, J. C., & Var, T., (1986). Resident Attitudes Toward Tourism Impacts in Hawaii. Annals
of Tourism Research, 13, 193–214.
Liu, J., Var, T., & Timur, A. (1984). Tourist - income multipliers for Turkey. Tourism
Management, 5(4), 280-287.

192 R.Mirzaei Refrences
Long, P. T., Perdue, R. R., & Allen, L. (1990). Rural resident tourism perceptions and
attitudes by community level of tourism. Journal of Travel Research, 28(3), 3-9.
Maddox, R. N. (1985). Measuring Satisfaction with Tourism. Journal of Travel Research
23(3), 2–5.
Madrigal, R. (1993). A tale of tourism in two cities. Annals of Tourism Research, 20(2), 336-
356.
Madrigal, R. (1995). Residents’ Perceptions and the Role of Government. Annals of Tourism
Research, 22, 86–102.
Mahdavi, M., Ghadiri, M. & Sanaei, M. (2007). The impacts of second homes on social and
economic structure in Kelardasht. Human geography researches, 65, 19-31.
Malhotra, N.K. (1996). Marketing research: An applied analysis. 2nd
(ed.) London: Prentice.
Malloy, D. & Fennell, D. (1998). Ecotourism and ethics: moral development and
organisational cultures. Journal of Travel Research, 36, 47–56.
Mason, P. (2003). Tourism impacts, planning and management. UK: Butterworth-Heinemann.
Mason, P. (2008). Tourism impacts, planning and management (2nd
ed.). UK: Butterworth-
Heinemann.
Mason, P., & Cheyne, J. (2000). Residents’ Attitudes to Proposed Tourism Development.
Annals of Tourism Research, 27 (2), 391-411.
Mason, P. & Mowforth, M. (1996). Codes of conduct in tourism. Progress in Tourism and
Hospitality Research, 2, 151–67.
Mathews, H., & Richter, L. (1991). Political science and tourism. Annals of Tourism
Research, 18 (1), 120–35.
Mathieson, A., & Wall, G. (1982). Tourism: Economic, physical, and social impacts. New
York: Longman.
McCool, S. F., & Martin, S. T. (1994). Community attachment and attitudes toward tourism
development. Journal of Travel Research, 32(3), 29-34.
McGehee, N.G. & Andereck, K. (2004). Factors Influencing Rural Resident's Support of
Tourism. Journal of Travel Research, 43(2), 131-140.
McKercher, B. (1993). Some fundamental truths about tourism: understanding tourism’s
social and environmental impacts. Journal of Sustainable Tourism, 1(1), 6–16.
McKercher, B. (1998). The business of nature-based tourism. Melbourne: Hospitality Press.

193 R.Mirzaei Refrences
McKercher, B. (2001). Attitudes to a Non-Viable Community-Owned Heritage Attraction.
Journal of Sustainable Tourism, 9 (1), 29-43.
Medlik, S. (2003). Dictionary of Travel, Tourism and Hospitality. London: Butterworth &
Heinemann.
Mehmetoglu, M. (2007). Nature-based tourists: The relationship between their tip expenditure
and activities. Journal of Sustainable Tourism, 15(2), 200-215.
Mill, R. C., & Morrison, A. M. (1985). The Tourism System: An Introductory Text.
Englewood Cliffs, NJ: Prentice Hall.
Milman, A., & Pizam, A. (1988). Social Impacts of Tourism on Central Florida. Annals of
Tourism Research, 15 (2), 191-204.
Milne, S. (1997). Tourism, dependency and South Pacific micro-states: beyond the vicious
cycle? In D.G. Lockhart & D. Drakakis-Smith (Eds.), Island Tourism: Trends and
Prospects (pp. 281-301). London: Pinter.
Mirzaei, R. (2007). An integrated tourism management frameworks for Iran protected areas
(Unpublished master thesis). Allame Tabatabai University, Tehran.
Miossec, J.M. (1977). Une modéle de l’espace touristique. L’ Espace Géographique. 6(1), 41-
48.
Mobin, A. (2013). History of Iran, The Aryan Movement. Iranchamber.com. Retrived May 6,
2013 from http://www.iranchamber.com/history/articles/aryan_movement.php
Molm, L. D., & Cook, K.S. (1995). Social Exchange and Exchange Networks. In Cook, K.S,
Alan Fine, G., & House, J (Eds.), Sociological Perspectives on Social Psychology (pp.
209–235).Needham Heights, MA: Allyn & Bacon
Murphy, P. E. (1981). Community Attitudes to Tourism: A Comparative Analysis. Tourism
Management, 2 (3): 189-95.
Murphy, P. E. (1983). Perceptions and Attitudes of Decision making Groups in Tourism
Centers. Journal of Travel Research , 21, 8-14.
doi: http://jtr.sagepub.com/content/21/3/8.refs.html
Murphy, P. E. (1985). Tourism: A Community Approach. New York: Routledge.
Mydral, G. (1957). Economic Theory and Underdeveloped Regions. London: Methuen.
Nash, D. (1989). Tourism as a form of Imperialism. In Smith, V. (Eds.), Hosts and guests: The
anthropology of tourism (2nd
ed.) (pp. 37-52). Philadelphia: University of Pennsylvania
Press.
Nelson, J. G. (1994). The spread of ecotourism: Some planning implications. Environmental
Conservation, 21(3), 248-255.

194 R.Mirzaei Refrences
Newsome, D., A. Moor, S., & K. Dowling, R. (2002). Natural Area Tourism, Ecology,
Impacts and Management. UK: Channel View Publication.
OECD (2012). OECD Tourism Trends and Policies 2012, OECD Publishing. http://dx.doi.org/10.1787/tour-2012-en
OECD (2010). OECD Tourism Trends and Policies 2010, OECD Publishing.
http://dx.doi.org/10.1787/tour-2010-en
Oppenheim, A.N. (1992). Questionnaire Design Interviewing and Attitude Measurement.
London:Pinter.
Oppermann, M., & Chon, K.S. (1997). Tourism in Developing Countries. London: Thompson.
Oosterhaven, J. & Van Der Knijff, E. C. (1988). On the economic impacts of recreation and
tourism: The input-output approach. Built Environment. 13(2), 96-108.
Pearce, D. (1989). Tourist Development (2nd
ed.). New York: Longman.
Pearce, P. (1989). Social impacts of tourism. In the social, cultural and environmental impacts
of tourism. Sydney, Australia: New south Wales tourism commission.
Pearce, P. L., Moscardo, G., & Ross, G. F. (1996). Tourism community relationships. Oxford.
Pedersen, A. (1991). Issues, problems, and lessons learned from ecotourism planning projects.
In: J. Kusler (Eds.), Ecotourism and resource conservation (pp. 61-74). Madison:
Omnipress.
Peppelenbosch, P., & Tempelman, G. (1973). Tourism and the developing countries.
Tijdschrift voor Economische en Sociale Geografie, 64 (1), 52–8.
Perdue, R.R., Long, P. T, & Allen, L. (1987). Rural Resident Tourism Perceptions and
Attitudes. Annals of Tourism Research, 14, 420-29.
Perdue, R. R., Long, P. T., & Allen, L. (1990). Resident Support for Tourism Development.
Annals of Tourism Research, 17 (4), 586–599.
Pigram, J.J., (1990). Sustainable tourism - policy considerations. Journal of Tourism Studies,
1(2), 2–9.
Pigram, J.J., & Wahab, S. (2005). Sustainable tourism in a changing world. In S.Wahab & J.J.
Pigram (Eds.), Tourism, Development and Growth the challenge of sustainability (pp.
14-28). London: Taylor & Francis e-Library.
Pirskin, J. (2001). Assessment of natural resources for nature-based tourism: the case of the
Central Coast Region of Western Australia. Tourism Management, 22, 637-648.
Pizam, A. (1978). Tourism’s impacts: The social costs to the destination community as
perceived by its residents. Journal of Travel Research, 16(4), 8-12.

195 R.Mirzaei Refrences
Pizam, A. (1994). Planning a tourism research investigation. In: Ritchie, J.R.B. & Goeldner,
C.R. (Eds.), Travel, Tourism and Hospitality Research: A Handbook for Managers (2nd
ed.) (pp.91-104). New York: Wiley.
Pizam, A., & Milman, A. (1986). The Social Impacts of Tourism. Tourism Recreation
Research, 11, 29–32.
Pizam, A., Milman, A. & King, B. (1994). The Perceptions of Tourism Employees and Their
Families toward Tourism. Tourism Management,15, 53-61.
Pizam, A. & Pokela, J. (1985). The perceived impacts of casino gambling on a community.
Annals of. Tourism Research, 12, 147-165.
Potter, R.B., Binns, T., Elliott, J.A. & Smith, D. (1999). Geographies of Development. Essex:
Longman.
Preister, K. (1989). The theory and management of tourism impacts. Tourism recreation
research, 15, 15-22.
Punch, K.F. (1998). Introduction to Social Research: Quantitative and Qualitative Approaches.
Thousand Oaks: Sage Publications.
Rahnemaei, M. T., Farhoudi, R., Dittmann, A. & Ghadami, M. (2008). Assessing Carrying
capacity in tourism destinations, Kelardasht as case study. Human Geography
Researches, 66, 17-33.
Richards, V. (1983). Decolonilisation in Antigua: Its impact on agriculture and tourism. In:
Henry, P. & Stone, C. (Eds.), The New Caribbean: Decolonilisation, Democracy and
Development (pp.15-35). Philadelphia: Institute for the Study of Human Issues.
Ritchie, J. R. B. (1988). Consensus Policy Formulation in Tourism: Measuring Resident
Views via Survey Research. Tourism Management, 9(3), 199-212.
Ritchie, B.W. & Inkari, M. (2006). Host community attitudes toward tourism and cultural
Tourism Development: The Case of the Lewes District. International journal of
tourism research, 8, 27-44.
Ritzer,G. (2005). Encyclopedia of social theory( 2nd
ed.) California: Sage publication.
Robson, C. (1993). Real World Research. Oxford:.Blackwell.
Rogerson, P. A. (2001). Statistical Methods For Geography. London: Sage publication.
Ross, G. F. (1992). Resident perceptions of the impact of tourism on an Australian city.
Journal of Travel Research, 30(3), 13–17.
Ross, S., & Wall, G. (1999 a). Ecotourism: towards congruence between theory and practice.
Tourism Management, 20 (1), 123–132.

196 R.Mirzaei Refrences
Ross, S., & Wall, G. (1999 b). Evaluating ecotourism: The case of North Sulawesi, Indonesia.
Tourism Management, 20, 673-682.
Rostow, W. (1967). The Stages of Economic Growth: A Non-Communist Manifesto ( 2nd
ed.).
Cambridge: Cambridge University Press.
Rostow, W. (1990). The Stages of Economic Growth: A Non-communist Manifesto (3rd
ed.).
Cambridge: Cambridge University Press.
Ruiz, A.L. (1985). Tourism and the economy of Puerto Rico: an input-output approach.
Tourism Management. 6(1), 61-65.
Ryan, C. (1995). Researching Tourist Satisfaction: Issues, Concepts, Problems. London:
Routledge.
Ryan, C., Hughes, K., & Chirgwin, S. (2000). The gaze, spectacle and ecotourism. Annals of
Tourism Research, 27 (1), 148-163.
Ryan, C., & Montgomery, D. (1994). The attitudes of Bakewell residents to tourism and issues
in community responsive tourism. Tourism Management, 15, 358–369.
Sanchez, A., Meji, M. & Bueno, N. (2009). Understanding Residents' Attitudes toward
development of Industrial Tourism in a Former Mining Community. Journal of travel
research, 47(3), 373-387.
Scace, R. (1992). Ecotourism in Canada. Ottawa: Canadian Environmental Advisory Council.
Schafer, J. (1989) Utilizing indigenous agricultural knowledge in the planning of agricultural
research projects designed to aid small-scale farmers. In D.M. Warren, L.J. Slikkerveer
& S.O. Titilola (Eds.), Indigenous Knowledge Systems: Implications for Agriculture
and International Development (pp. 116-120). Iowa: State University.
Schuurman, F. (1993). Introduction: Development theory in the 1990s. In F. Schuurman
(Eds.), Beyond the Impasse: New Directions in Development Theory (pp. 1–48).
London: Zed Books.
Selltiz, C., Jahoda, M., Deutsch, M. & Cook, SW. (1965). Research methods in social
relations. New York: Holt, Rinehart & Winston.
Selltiz, C., Wrightsman, L. S. & Cook, S. W. (1976). Research Methods for Recreation and
Leisure. Iowa: William C. Brown Co.
Seward, A.B. & Spinard, B.K., 1982. Tourism in the Caribbean: The Economic Impact.
Ottawa: International Development Research Centre.
Shafer, E.L., & Choi, Y. (2003). Nature Based Tourism Policy. The Center for Rural
Pennsylvania. retrieved from:
http://agmarketing.extension.psu.edu/Retail/PDFs/naturebsdtourism.pdf

197 R.Mirzaei Refrences
Shahmiri, S. (2013). History of Iran, Elamite Empire. Iranchamber.com. Retrieved May 6,
2013 from http://www.iranchamber.com/history/elamite/elamite.php
Sharpley, R. (2009). Tourism Development and the Environment: Beyond sustainability.
London: Earthscan.
Shaw, G & Williams, A. M. (2004). Tourism and Tourism Spaces. London: Sage Publications.
Sheldon, P. & Var, T. (1984). Residents attitudes toward tourism in North Wales. Tourism
Management, 5, 40-47.
Simmons, D. G., & Becken, S. (2004). The Cost of Getting There: Impacts of Travel to
Ecotourism Destinations. In R. Buckley (Eds.), ENVIRONMENTAL IMPACTS OF
ECOTOURISM (pp. 15-23). UK: CABI Publishing.
Sinclair, M.T. (1991). The tourism industry and foreign exchange leakages in a developing
country. In: Sinclair, M.T. & Stabler, M.J. (Eds.), The Tourism Industry: An
International Analysis (pp. 185-204). Wallingford: CAB, pp.185-204.
Sinclair, M.T. (1998). Tourism and economic development. Journal of Development Studies,
34(5), 1-51.
Sinclair, M.T. & Bote Gomez, V. (1996). Tourism, the Spanish economy and the balance of
payments. In: Barke, M., Newton M. & Towner, J. (Eds.), Tourism in Spain: Critical
Perspectives. Wallingford: CAB.
Singh, B. P. (1984). The Impact of Tourism on the Balance of Payments. Athens: Centre of
Planning and Economic Research.
Sirakaya, E., Teye, V., & Somez, S. (2002). Understand residents’ support for tourism
development in the Central Region of Ghana. Journal of Travel Research, 41(1), 57-
67.
Smith, S. (1989). Tourism Analysis: A Handbook. New York: Longman.
Smith, S. (1995). The tourism satellite account: Perspectives of Canadian tourism associations
and organisations. Tourism Economics. 1(3), 225-244.
Smith, C. & Jenner, P. (1992). The leakage of foreign exchange earnings from tourism. Travel
and Tourism Analyst, 3, 52-66.
Snaith, T., & Haley, A. J. (1995). Tourism’s impact on host lifestyle realities.In A.V. Seaton
(Eds.), Tourism, the State of the Art (pp. 826-835). New York: Wiley.
Snaith, T., & Haley, A.J. (1999). Residents opinions of tourism development in the historic
city of York, England. Tourism Management, 20 (5), 595-603.

198 R.Mirzaei Refrences
Snepenger, D., O’Connell, R., & Snepenger, M. (2001). The Embrace-Withdraw Continuum
Scale: Operationalizing Residents’ Responses Toward Tourism Development. Journal
of Travel Research, 40, 155-161.
Soleymanpoor, H. (2009). Development of Nature-Based Tourism in the Islamic Republic of
Iran: A Framework for Indices and Standards. Tehran: Azad University.
Statistics Centre of Iran (SCI). (2011). The initial reports of 2011 census of Iran. Retrieved
from. http://www.amar.org.ir/module/News/shownews/page-1924.aspx?NewsId=278
Statistics center of Iran (SCI). (2012). Statistical Yearbook of Mazandaran. Tehran: Statistic
center of Iran.
Statistics center of Iran (SCI). (2013). Statistical Yearbook of Mazandaran. Tehran: Statistic
center of Iran.
Stokowski, P. A. (1996). Crime patterns and gaming development in rural Colorado. Journal
of Travel Research, 24(3), 63-69.
Stronza, A., & Durham, W. H. (2008). ecotourism and conservation in the americas. UK:
CABI Publications.
Swarbrooke, J. ( 1999). Sustainable Tourism Management. Wallingford: CABI Publications.
Telfer, D. J. (2002). The Evolution of Tourism and Development Theory. In R. Sharpley &
D.J. Telfer (eds.), Tourism and development: concepts and issues (pp. 35-78).
Clevedon: Channel view Publications.
Telfer, D. & Wall, G. (1996). Linkages between tourism and food production. Annals of
Tourism Research, 23(3), 635-653.
Teye, V.B. (1987). Developing Africa’s tourism potential: prospects and issues. Tourism
Recreation Research, 12(1), 9-14.
Teye, V., Sonmez, S.F., & Sirakaya, E. (2002). Residents’ Attitudes Toward Tourism
Development, Annals of Tourism Research, 29 (3), 668-688.
The Caspian Sea drowning, (2013, June 30), Khabaronline. Retrieved from
http://Khabaronline.ir
The International Ecotourism Society (TIES), (1991a). The Ecotourism Society Newsletter
Number 1, Spring.
The International Ecotourism Society (TIES), (1991b). Ecotourism Guidelines for Nature-
Based Tour Operators. North Bennington: The Ecotourism Society.
The plan and budget organization of Iran (PBO). (1989). The first five-year socio cultural and
economic development plan of Iran (1989-1994). Tehran: The plan and budget
organization.

199 R.Mirzaei Refrences
The plan and budget organization of Iran (PBO). (1994). The second five-year socio cultural
and economic development plan of Iran (1994-2000). Tehran: The plan and budget
organization.
The plan and budget organization of Iran (PBO). (1998). The third five-year socio cultural and
economic development plan of Iran (2001-2004). Tehran: The plan and budget
organization.
The plan and budget organization of Iran (PBO). (2004). The fourth five-year socio cultural
and economic development plan of Iran (2004-2009). Tehran: The plan and budget
organization.
Timothy, D.J. (1998). Cooperative tourism planning in a developing destination. Journal of
Sustainable Tourism 6(1), 52–68.
Tomljenovic, R., & Faulkner, B. (1999). Tourism and older residents in a sunbelt resort.
Annals of Tourism Research 27(1), 93-114.
Tosun, C. (2002). Host Perceptions of Impacts: A Comparative Tourism Study, Annals of
Tourism Research, 29, 231–253.
Tourism Canada. (1995). Adventure Travel in Canada: An Overview of Product, Market and
Business Potential Industry .Canada, Ottawa.
Tourism New South Wales. (2006). Understanding nature-based tourism. Retrieved from http://archive.tourism.nsw.gov.au/Sites/SiteID6/objLib13/2_defining_nature_tourism.pdf
Tourism Organization of Mazandaran. (2005). Report on Nowrooz tourists in Mazandarn.
Sari: Tourism Organization of Mazandaran.
Tourism Organization of Mazandaran. (2006). Report on Nowrooz tourists in Mazandarn.
Sari: Tourism Organization of Mazandaran.
Tourist consult (1974). The tourism master plan of Iran. Tehran: Ministry of information and
tourism.
Tovar, C. & Lockwood, M. (2008). Social impacts of tourism: An Australian regional case
study. International Journal of Tourism Research, 10 (4), 365-378.
Turner, L. (1976). The international division of leisure: Tourism and the Third World. World
Development, 4 (3), 253–60.
Um, S. & Crompton, J. L. (1987). Measuring resident’s attachment levels in a host
community. Journal of Travel Research, 25 (3), 27-29. DOI:
10.1177/004728758702600105
UNEP & UNWTO. (2005). Making Tourism More Sustainable - A Guide for Policy Makers.
UNESCO (2013a). Properties inscribed on the World Heritage List: Iran Retrieved 08/07/13,
from http://whc.unesco.org/en/statesparties/ir
UNESCO (2013b). Representative list of the intangible cultural heritage of humanity of Iran.
Retrieved 08/03/2013 from
http://www.unesco.org/culture/ich/index.php?lg=en&pg=00311&topic=mp&cp=IR

200 R.Mirzaei Refrences
UNWTO. (2005). Sustainable Development of Tourism - Conceptual Definition. retrieved
from:
http://sdt.unwto.org/en/content/about-us-5 (accessed in June 2009).
UNWTO., (2010) Home page: World Tourism Organization: www.unwto.org/index. php
(accessed 29.04.10).
UNWTO., (2012) Home page: World Tourism Organization. Retrieved from:
http://mkt.unwto.org/en/publication/unwto-tourism-highlights-2012-edition . Php
(accessed 17.10.12).
UNWTO., (2013). UNWTO Tourism Highlights. Retrieved from:
http://mkt.unwto.org/en/publication/unwto-tourism-highlights-2013-edition
Vanhove, N. (1997). Mass Tourism: Benefits and Costs. In S. Wahab & J. J. Pigram (Eds.),
Tourism, Development and Growth the challenge of sustainability (pp.46-72). London:
Taylor & Francis e-Library.
Veal, A.J. (1997). Research Methods for Leisure and Tourism: A Practical Guide (2nd
ed.).
London: Pitman.
Wall, G. (2005). Sustainable tourism-unsustainable development. In S.Wahab & J.J. Pigram
(Eds.), Tourism, Development and Growth the challenge of sustainability (pp. 29-43).
London: Taylor & Francis e-Library.
Walpole, M. J., & Goodwin, H. J. (2001). Local Attitudes towards Conservation and Tourism
around Komodo National Park. Environmental Conservation, 28 (2), 160-166.
Wanhill, S.R.C. (1988). Tourism Multipliers under capacity constraints. Service Industries
Journal, 8(2), 136-142.
Wanhill, S. (1997). Introduction-Tourism Development and Sustainability. In Cooper, C., &
Wanhill, S. (Eds.), TOURISM DEVELOPMENT Environmental and Community
Issues (pp. Xi-Xvii). England: Wiley.
Wan ko, D. & Stewart, W.P. (2002). A structural equation model of residents’ attitudes for
tourism development. Tourism management, 23, 521-530.
Wearing, D. & Neil, J. (1999). Ecotourism: Potential, Pitfalls and Possibilities. London,
Butterworth-Heinemann.
Wearing, D. & Neil, J. (2009). Ecotourism: Impacts, Potentials and Possibilities. London,
Butterworth-Heinemann.
Weaver, D., Faulkner, B., & Lawton, L. (1998). Nature-based tourism in Australia and
Beyond: a preliminary investigation. CRC Tourism Work in Progress Report Series,
Report 1, Griffith University.
Weeks, K. R., & Hetherington, N. J. (2006). The valley of the kings, Luxor, Egypt site
management master plan. Cairo: Theban mapping project.
Wellings, P.A., & Crush, J. (1983). Tourism and dependency in Southern Africa: The
prospects and planning of tourism in Lesotho. Applied Geography, 3 (3), 205–23.
Wheeler , B. ( 1993). Sustaining the ego? Journal of Sustainable Tourism , 1, 121 – 129 .

201 R.Mirzaei Refrences
Wheeler, B. (2006). The king is dead. Long live the product. Elvis, authenticity, sustainability
and the product life cycle. In R.W. Butler (Eds.), The tourism area life cycle:
Applications and modifications (pp. 339-348). Clevedon: Channel View Publications.
Wilkinson, P.F. (1987) Tourism in small island nations: a fragile dependency. Leisure Studies,
6(2), 127-146.
Wilkinson, P.F. (1997). Jamaican tourism: from dependency theory to a world-economy
approach. In D.G., Lockhart & D. Drakakis-Smith (Eds.), Island Tourism: Trends and
Prospects (pp. 182-204). London: Pinter.
Williams, J. & Lawson, R. (2001). Community Issues and Resident Opinions of Tourism.
Annals of Tourism Research, 28, 269–290
Willis, K. (2005). Theories and Practices of Development. London: Routledge
World Commission on Environment and Development (WCED). (1987). Our Common
Future. Oxford: Oxford University Press.
WTTC (1995). European Union Travel and Tourism: Towards 1996 and Beyond. Brussels:
World Travel and Tourism Council.
WTTC. (2011). Travel & Tourism Economic Impacts. Retrieved from:
www.wttc.org/site_media/uploads/downloads/world2011.pdf . Php (accessed 1.05.11).
WTTC. (2012). Progress & priorities. Retrieved from: http://www.wttc.org/site_media/uploads/downloads/Progress_Priorities_2011_2012.pdf
WTO. (1993). Sustainable Tourism Development: A Guide for Local Planners. Madrid: World
Tourism Organisation.
Wu, C. (1982) Issues of tourism and socioeconomic development. Annals of Tourism
Research, 9(3), 317–30.
Yalman, S. Based on original work by Komaroff, L. (2002). The Art of the Safavids before
1600 . In Heilbrunn Timeline of Art History. New York: The Metropolitan Museum of
Art, 2000–. http://www.metmuseum.org/toah/hd/safa/hd_safa.htm (October 2002).
Yin, R. K., (1984). Case Study Research: Design and Methods. Newbury Park: Sage
Publications.
Yoon, Y. S., Chen, J.S., & Gursoy. D. (1999). An Investigation of the Relationship between
Tourism Impacts and Host Communities’ Characteristics. Anatolia: International
Journal of Tourism and Hospitality Research, 10 (1), 29-44.
Young, G. (1973). Tourism, Blessing or Bright? , Middlesex, England: Penguin books.
Yu, C.P, Chancellor, C.H. & Cole, S.T., (2011). Measuring Residents’ Attitudes toward
Sustainable Tourism: A Reexamination of the Sustainable Tourism Attitude Scale.
Journal of Travel Research, 50(1), 57–63.
2,500 year celebration of the Persian Empire. (n.d.). In Wikipedia. Retrieved March 10, 2013,
from http://en.wikipedia.org/wiki/2,500_year_celebration_of_the_Persian_Empire

202
Appendix I : Questionnaires in English and Persian
Dear resident,
This survey is meant to investigate local community perceptions towards nature-based
tourism (NBT) impacts in Mazandaran.. Nature-based tourism is the tourism activities,
which based on natural, ecological landscapes in Mazandaran. For examples, beaches,
forest recreational areas, botanical gardens, lakes, waterfalls, natural trails, hot springs,
cold springs, leisure farming, and bird watching etc. Your valuable response is extremely
helpful to this study. Responses to this questionnaire will be completely anonymous. Your
identity will remain anonymous. We greatly appreciate you taking time to complete this
questionnaire.
Roozbeh Mirzaei, Ph.D. Student, Principal Investigator
Andreas Dittmann, Ph.D., Supervisor
Geography institute, Justus Liebig University Giessen, Germany

203
Part1. Nature Based Tourism Impacts
In this part, we would like to know your opinion about nature-based tourism
(NBT)
Socio-cultural and environmental impacts in Mazandaran.
Please indicate how strongly you agree or disagree with the following statements.
1- Tourism has led to an increase in the availability of recreational facilities and
spaces
Strongly agree Strongly disagree
2- High spending tourists have an undesirable effect on our way of life
3- Tourism causes changes in our traditional cultures
4- Local residents have a lower quality of life as a result of living in a tourist area
5- The crime rate in the area has increased because of tourism.
6- Because of tourism our roads and other public facilities are kept at a high
standard
7- I think tourism has led to more vandalism in Namak Abrod
8- Tourism has resulted in unpleasantly overcrowded beaches, hiking trails, parks
and other outdoor places for the local community
9- Tourists disrupt the peace and tranquility of public parks
10- Tourism has increased drug addiction
11- Our standard of living increases considerably because of the tourism
12- Tourism result in an increase in the cost of living
5 4 3 2 1
5 4 3 2 1
5 4 3 2 1
5 4 3 2 1
5 4 3 2 1
5 4 3 2 1
5 4 3 2 1
5 4 3 2 1
5 4 3 2 1
5 4 3 2 1
5 4 3 2 1
5 4 3 2 1

204
13- Tourism provides job opportunities for local community
14- Tourism increased price of land and housing
15- Tourists’ keen interest in natural and cultural sites result in these sites are
cared for than they otherwise would be
16- Tourism has resulted in unpleasantly overcrowded beaches, footpaths, parks
and outdoor places
17- Tourism improves understanding and image of different communities and
cultures
18- Tourism increased cost of living in Namak Abroud
19- Tourism encourages a variety of cultural activities by the local population
(crafts, arts)
20- Tourism prevents local language from being use as much as it otherwise
would
21- Tourism could create a positive feeling about area among tourists
22- Local businesses are the ones which benefit most from tourists
23- Tourists have a positive impact on the area’s cultural identity
24- The state of area’s residents are courteous and friendly to tourists
25- Tourism creates more jobs for foreigners than local community
26- Tourism gives benefits to a small group of people in the area
5 4 3 2 1
5 4 3 2 1
5 4 3 2 1
5 4 3 2 1
5 4 3 2 1
5 4 3 2 1
5 4 3 2 1
5 4 3 2 1
5 4 3 2 1
5 4 3 2 1
5 4 3 2 1
5 4 3 2 1
5 4 3 2 1
5 4 3 2 1

205
27- Tourism makes local residents feel more proud of their town and makes them
feel good about themselves and their community
28- I believe that tourists increase noise in the area
29- I believe that tourism helps to increase local awareness and appreciation of the
environment
30- I believe that tourism cause evolution of agriculture and fishing
31- I believe that the quality of natural environment in Namak Abrod has
deteriorated by tourists.
32- Tourism development increases the traffic problems in Namak Abrod
33- Tourism preserves environment and improves the appearance of Namak
Abrod
34- The area experiences more litter problems because of the presence of tourists
35- Local community in Namak Abroud feel proud to belong to it
36- Tourism provides an incentive for conservation of natural resources
37- Construction of tourist villages and other tourist facilities has destroyed the
natural environment
38- Tourists increasing pollution in beaches
5 4 3 2 1
5 4 3 2 1
5 4 3 2 1
5 4 3 2 1
5 4 3 2 1
5 4 3 2 1
5 4 3 2 1
5 4 3 2 1
5 4 3 2 1
5 4 3 2 1
5 4 3 2 1
5 4 3 2 1

206
Part two. Involvement
The following questions ask about how involved you are in tourism planning in
Mazandaran
a. Mazandaran government invites you to participate in tourism planning
b. Mazandaran government knows your concerns and issues regarding NBT
c. Mazandaran government accepts your opinions
d. Do you have desire to be involved in decision making process?
e. You influence province tourism planning
f. what happens to Mazandaran is important to me
g. I am proud of being a Mazandaran resident
Please indicate times and money you spend in the following. h. How many times have you participated in local government’s tourism activities, as a
tourist, over the
last 12 months?
Never participated 1 ~ 6 times 6 ~ 10times More than 10
times
i. How many times have you participated in local government’s tourism planning, as a
decision maker in the past 12 months?
No Time 1 ~ 5 times 6 ~ 10 times More than 10 times
Part three. Socio-demographic characteristics
a.What is your gender? Male Female
b. How old are you? 18-25 25-35 35-45 45-65 more than 65
c. What is your family status? Single married divorced
d. What is your highest level of education? (Please select only one category)
Elementary Jr. high school High school/ vocational school Jr. college
BA degree Graduate degree Other professional degree
e. Since when have you lived in this area?
f. What is the name of your place of resident?
g. What is your employment status? Employed unemployed others
h. How many member of your family are employed in tourism businesses?
i. How much is your annual personal income?
Less than 3.500.000 Toman 3.500.000 to 8.500.000 8.500.000 to 15.000.000 more
than 15.000.000
j. Any other comments, which you think important impacts of Mazandaran NBT?
Thank you for your cooperation!

207
منطقه ساکن محترماین پرسشنامه ابزاری است جهت شناسایی ادراکات مردم محلی از اثرات اجتماعی فرهنگی و زیست محیطی گردشگری مبتنی بر
مازندران. پاسخ های ارزشمند شما برای انجام این تحقیق بسیار سودمند خواهد بود. هویت شما و پاسخ های ارایه طبیعت در استان
شده توسط شما کاملا ناشناس خواهد بود و از اینکه برای تکمیل این پرسشنامه وقت ارزشمند خود را اختصاص می دهید بینهایت
سپاسگزاریم.
ره دکتری جغرافیا و برنامه ریزی گردشگریپژوهشگر دو –روزبه میرزائی
استاد راهنما –آندریاس دیتمن
آلمان -دانشکده جغرافیا و گردشگری دانشگاه یوستوس لیبیگ گیسن
. اثرات گردشگری مبتنی بر طبیعت1بخش
بر طبیعت در مازنددران در این بخش ما مایلیم نظرات شما را در خصوص اثرات اجتماعی فرهنگی و زیست محیطی گردشگری مبتنی
بدانیم.
موافقت و یا مخالفت خود را با عبارت عنوان شده مشخص نمایید )نظر شما می تواند در طیفدی از لطفا با انتخاب گزینه مربوطه میزان
د(.قرار گیر "=کاملا مخالفم5"و "= مخالفم4 " "= نظری ندارم3 " "= موافقم2"تا "= کاملا موافقم1 "
توسعه گردشگری در منطقه منجر به افزایش خدمات و فضاهای تفریحی موجود شده است. -1
کاملا مخالفم کاملا موافقم
گردشگری موجب افزایش فرصت های شغلی برای مردم محلی شده است -2
کاملا مخالفم کاملا موافقم
گردشگری مردم محلی را به انجام دادن فعالیت های فرهنگی گوناگون از جمله ساخت صنایع دستی تشویق -3
کرده است
کاملا مخالفم کاملا موافقم
محلی از اینکه به این منطقه تعلق دارند و در اینجا زندگی می کنند احساس گردشگری باعث شده است مردم -4
غرور کنند
کاملا مخالفم کاملا موافقم
منطقه خرج می کنند تاثیر نامطلوبی بر شیوه زندگی مردم محلی دارند. درگردشگرانی که پول زیادی -5
کاملا کاملا موافقم مخالفم
توسعه گردشگری منجر به افزایش نرخ جرم و جنایت در منطقه شده است. -6
کاملا مخالفم کاملا مولفقم
مسیرهای کوهها، کنار رودخانه ها، ، جنگل هاتوسعه گردشگری باعث شلوغ شدن بیش از حد و آزاردهنده -7
پیاده روی، پارک ها و سایر مکانهای تفریحی برای مردم محلی شده است
کاملا مخالفم کاملا موافقم
5 4 3 2 1
5 4 3 2 1
5 4 3 2 1
5 4 3 2 1
5 4 3 2 1
5 4 3 2 1
5 4 3 2 1
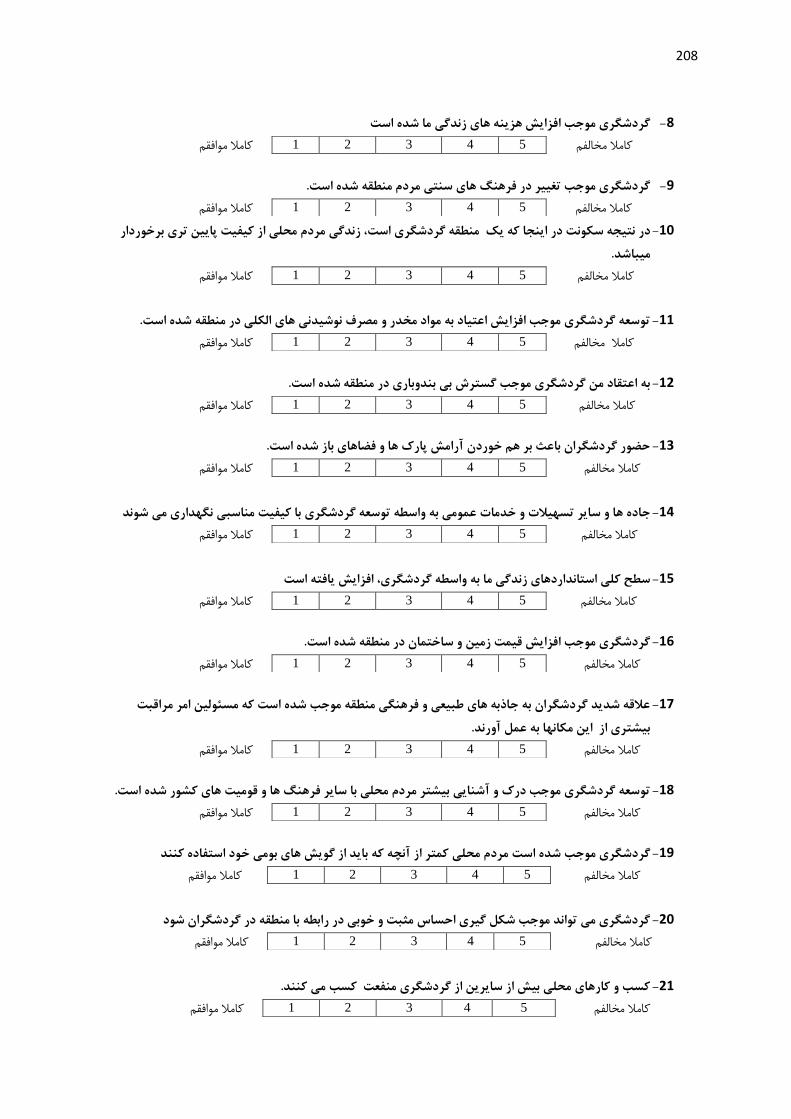
208
گردشگری موجب افزایش هزینه های زندگی ما شده است -8
کاملا مخالفم کاملا موافقم
گردشگری موجب تغییر در فرهنگ های سنتی مردم منطقه شده است. -9
کاملا مخالفم کاملا موافقم
لی از کیفیت پایین تری برخوردار مردم مح، زندگی گردشگری استمنطقه اینجا که یك در نتیجه سکونت در -11
.میباشدکاملا مخالفم کاملا موافقم
توسعه گردشگری موجب افزایش اعتیاد به مواد مخدر و مصرف نوشیدنی های الکلی در منطقه شده است. -11
کاملا مخالفم کاملا موافقم
به اعتقاد من گردشگری موجب گسترش بی بندوباری در منطقه شده است. -12
کاملا مخالفم کاملا موافقم
حضور گردشگران باعث بر هم خوردن آرامش پارک ها و فضاهای باز شده است. -13
کاملا مخالفم کاملا موافقم
جاده ها و سایر تسهیلات و خدمات عمومی به واسطه توسعه گردشگری با کیفیت مناسبی نگهداری می شوند -14
کاملا مخالفم کاملا موافقم
یافته استسطح کلی استانداردهای زندگی ما به واسطه گردشگری، افزایش -15
کاملا مخالفم کاملا موافقم
گردشگری موجب افزایش قیمت زمین و ساختمان در منطقه شده است. -16
کاملا مخالفم کاملا موافقم
علاقه شدید گردشگران به جاذبه های طبیعی و فرهنگی منطقه موجب شده است که مسئولین امر مراقبت -17
بیشتری از این مکانها به عمل آورند. کاملا مخالفم کاملا موافقم
کشور شده است.توسعه گردشگری موجب درک و آشنایی بیشتر مردم محلی با سایر فرهنگ ها و قومیت های -18
کاملا مخالفم کاملا موافقم
مردم محلی کمتر از آنچه که باید از گویش های بومی خود استفاده کنند است گردشگری موجب شده -19 کاملا مخالفم کاملا موافقم
با منطقه در گردشگران شودگردشگری می تواند موجب شکل گیری احساس مثبت و خوبی در رابطه -21کاملا مخالفم کاملا موافقم
کسب و کارهای محلی بیش از سایرین از گردشگری منفعت کسب می کنند. -21کاملا مخالفم کاملا موافقم
5 4 3 2 1
5 4 3 2 1
5 4 3 2 1
5 4 3 2 1
5 4 3 2 1
5 4 3 2 1
5 4 3 2 1
5 4 3 2 1
5 4 3 2 1
5 4 3 2 1
5 4 3 2 1
5 4 3 2 1
5 4 3 2 1
5 4 3 2 1

209
گردشگران تاثیر مثبتی بر هویت فرهنگی منطقه دارند -22
کاملا مخالفم کاملا موافقم
ساکنین منطقه برخورد مودبانه و دوستانه ای با گردشگران دارند -23
کاملا مخالفم کاملا موافقم
مشاغل ایجاد شده توسط گردشگری بیشتر در اختیار افراد غیر بومی قرار دارند -24
کاملا مخالفم کاملا موافقم
منافع گردشگری به گروه اندکی از مردم می رسد -25
مخالفمکاملا کاملا موافقم
به نظر من گردشگران سر و صدا می کنند و باعث شلوغ شدن منطقه می شوند -26
کاملا مخالفم کاملا موافقم
محلی در رابطه با محیط زیست را ارتقا می دهد و موجب شده است تا مردم گردشگری، سطح آگاهی مردم -27
بومی احترام بیشتری برای محیط زیست منطقه قایل شوند.
کاملا مخالفم کاملا موافقم
گردشگری موجب ارتقای وضعیت کشاورزی و ماهیگیری منطقه شده است -28
کاملا مخالفم کاملا موافقم
به نظر من کیفیت محیط زیست منطقه به دلیل حضور گردشگران کاهش یافته است. -29
کاملا مخالفم کاملا موافقم
توسعه گردشگری موجب گسترش مشکلات ترافیکی منطقه شده است. -31
کاملا مخالفم کاملا موافقم
گردشگری موجب حفاظت از محیط زیست می شود و به بهبود چشم اندازهای طبیعی و شکل ظاهری منطقه -31
کمك می کند.
کاملا مخالفم کاملا موافقم
به نظر من حضور گردشگران در منطقه موجب تولید ذباله بیشتر می شود -32
کاملا مخالفم کاملا موافقم
توسعه گردشگری و منافع ناشی از آن موجب ایجاد انگیزه در مردم محلی برای حفاظت بهتر از محیط زیست -33
شده است
کاملا مخالفم کاملا موافقم
است. ساخت شهرک ها و سایر تسهیلات گردشگری موجب آسیب رساندن به محیط زیست شده -34
کاملا مخالفم کاملا موافقم
5 4 3 2 1
5 4 3 2 1
5 4 3 2 1
5 4 3 2 1
5 4 3 2 1
5 4 3 2 1
5 4 3 2 1
5 4 3 2 1
5 4 3 2 1
5 4 3 2 1
5 4 3 2 1
5 4 3 2 1
5 4 3 2 1

210
شده اند. کوهستانگردشگران موجب آلودگی -35
کاملا مخالفم کاملا موافقم
پوشش سنتی مردم بومی منطقه به واسطه حضور گردشگران و الگو برداری از نوع پوشش آنها توسط محلی ها -36
یافته است.در طی سالیان گذشته تغییر
کاملا مخالفم کاملا موافقم
اتفاق می افتد برای من مهم و واجد اهمیت است.منطقه آنچه در -37
کاملا مخالفم کاملا موافقم
من زندگی در این منطقه را دوست دارم و چنانچه از اینجا نقل مکان کنم، متاسف و ناراحت خواهم شد. -38
کاملا مخالفم کاملا موافقم
وجود دارند این منطقهمکان های تفریحی مورد نیاز من در حال حاضر در -39
کاملا مخالفم کاملا موافقم
بخش دوم. مشارکت
مطرح شده است. مازندرانشما در توسعه و برنامه ریزی گردشگری در مشارکتپرسش های زیر در زمینه میزان
محلی نگرانی ها و نقطه نظرات شما در رابطه با توسعه گردشگری را می دانند؟مقامات -الف
در جلسات مربوط به برنامه ریزی و توسعه گردشگری فرد تصمیم گیرندهماه گذشته چند مرتبه به عنوان یک 12در طول -1-الف
در منطقه مشارکت داشته اید؟
نند تور مسافرتی، جشنواره و برنامه هایی برای گذران اوقات فراغت( از طرف آیا در یکسال گذشته برنامه گردشگری خاصی )ما -ب
دولت برای استفاده شما طراحی شده است؟
در برنامه های ارایه شده توسط دولت شرکت داشته اید؟ گردشگرماه گذشته چند مرتبه به عنوان یک 12در طول -1-ب
بخش سوم. ویژگی های جمعیت شناسی
مذکر مونث : جنسیت -الف
چند ساله هستید؟ -ب
55بیش از 45 -55 35 -45 25 -35 25-11
تحصیلات شما چه میزان است؟ -پ
فوق لیسانس و دکتری لیسانس فوق دیپلم دیپلم زیر دیپلم
وضعیت خانوادگی شما در حال حاضر چگونه است؟ -ت
مجرد متاهل مطلقه
چند سال است که در این منطقه سکونت دارید؟ -ج
وضعیت شغلی شما چگونه است؟ -چ
شاغل بیکار سایر موارد
آیا تا کنون در مشاغل مرتبط با گردشگری فعالیت نموده اید؟ -ح
چند نفر؟؟ آیا کسی از اعضای خانواده شما در مشاغل مرتبط با گردشگری کار می کند -خ
شده است( ارایه)مقادیر به تومان میزان است؟درآمد سالیانه شما چه -د
بیش از 000/000/15تا 000/500/1بین 000/500/1تا 000/500/3بین 000/500/3کمتر از
000/000/15
بنویسید.لطفا چنانچه نظر دیگری در رابطه با اثرات گردشگری مبتنی بر طبیعت در مازندران دارید -ذ
با سپاس فراوان از همکاری شما
5 4 3 2 1
5 4 3 2 1
5 4 3 2 1
5 4 3 2 1
5 4 3 2 1

211
Appendix II R E L I A B I L I T Y A N A L Y S I S - S C A L E (A L P H A)
Item-Total Statistics
Scale Mean if
Item Deleted
Scale Variance
if Item Deleted
Corrected Item-
Total
Correlation
Squared
Multiple
Correlation
Cronbach's
Alpha if Item
Deleted
q1 133.68 208.969 .225 .346 .740
q2 133.58 211.336 .170 .302 .743
q3 134.10 211.396 .142 .312 .745
q4 133.97 211.073 .155 .202 .744
q5 134.34 207.058 .237 .192 .740
q6 134.29 205.649 .294 .385 .737
q7 133.58 205.668 .309 .423 .736
q8 133.53 206.093 .305 .325 .736
q9 133.69 206.133 .312 .346 .736
q10 134.69 213.601 .098 .168 .747
q11 134.04 202.321 .386 .491 .732
q12 134.20 202.807 .363 .513 .733
q13 134.12 204.469 .326 .452 .735
q14 134.45 209.233 .193 .301 .742
q15 134.08 208.505 .265 .267 .739
q16 133.17 209.749 .267 .196 .739
q17 134.20 204.939 .297 .378 .737
q18 133.48 209.815 .252 .252 .739
q19 133.73 208.846 .244 .281 .739
q20 133.55 213.891 .139 .192 .744
x15 133.60 207.936 .308 .159 .737

212
q22 134.32 210.744 .181 .286 .743
q23 133.67 210.907 .192 .209 .742
x16 134.40 220.926 -.101 .148 .755
q25 134.97 219.817 -.070 .195 .754
q26 134.04 204.401 .339 .490 .735
q27 133.97 210.568 .177 .410 .743
q28 134.52 211.236 .151 .242 .744
q29 133.98 210.649 .183 .363 .742
q30 133.08 208.928 .311 .391 .737
q31 134.17 210.337 .181 .342 .743
q32 133.15 207.925 .345 .383 .736
q33 133.93 208.599 .248 .451 .739
q34 133.84 207.078 .277 .312 .738
q35 133.51 206.501 .308 .408 .736
q36 133.55 207.107 .300 .335 .737
q37 132.92 211.144 .248 .333 .740
q38 133.32 208.235 .238 .298 .740
q39 134.77 209.693 .170 .167 .744

213
Appendix III Factor Analysis
Factor Analysis
KMO and Bartlett's Test
.832
3236.096
325
.000
Kaiser-Meyer-Olkin Measure of Sampling
Adequacy.
Approx. Chi-Square
df
Sig.
Bart let t's Test of
Sphericity
Communalities
1.000 .643
1.000 .581
1.000 .532
1.000 .558
1.000 .570
1.000 .452
1.000 .459
1.000 .587
1.000 .565
1.000 .495
1.000 .376
1.000 .623
1.000 .614
1.000 .586
1.000 .478
1.000 .508
1.000 .508
1.000 .615
1.000 .434
1.000 .634
1.000 .582
1.000 .618
1.000 .594
1.000 .590
1.000 .597
1.000 .522
x19
x20
x21
x22
x23
x24
x25
x27
Q6
Q7
Q8
Q11
Q12
Q13
Q16
x31
x30
x32
x33
x34
x35
x36
x37
x38
x40
x39
Initial Extraction
Extraction Method: Principal Component Analysis.

214
Total Variance Explained
5.182 19.931 19.931 5.182 19.931 19.931 3.346 12.868 12.868
2.877 11.065 30.996 2.877 11.065 30.996 2.531 9.733 22.601
1.491 5.736 36.732 1.491 5.736 36.732 2.360 9.078 31.679
1.382 5.317 42.049 1.382 5.317 42.049 1.886 7.255 38.934
1.306 5.021 47.070 1.306 5.021 47.070 1.754 6.748 45.682
1.072 4.125 51.195 1.072 4.125 51.195 1.238 4.760 50.442
1.012 3.890 55.085 1.012 3.890 55.085 1.207 4.643 55.085
.939 3.610 58.695
.885 3.403 62.098
.860 3.308 65.406
.820 3.152 68.558
.770 2.962 71.519
.732 2.815 74.334
.713 2.742 77.076
.684 2.629 79.705
.670 2.579 82.284
.579 2.228 84.512
.572 2.198 86.710
.544 2.092 88.802
.495 1.903 90.705
.485 1.866 92.571
.445 1.711 94.282
.427 1.641 95.923
.391 1.503 97.426
.352 1.353 98.778
.318 1.222 100.000
Component
1
2
3
4
5
6
7
8
9
10
11
12
13
14
15
16
17
18
19
20
21
22
23
24
25
26
Total % of Variance Cumulativ e % Total % of Variance Cumulativ e % Total % of Variance Cumulativ e %
Initial Eigenvalues Extraction Sums of Squared Loadings Rotation Sums of Squared Loadings
Extraction Method: Principal Component Analysis.

215
Component Matrixa
-.251 .462 .245 .465 .294 -.018 -.063
-.224 .378 .437 .386 .154 .008 .156
-.355 .436 .146 .298 .266 -.164 -.091
-.198 .322 .121 -.026 .353 .509 .130
-.242 .349 .036 -.322 -.015 -.069 .529
-.343 .435 -.186 -.233 -.037 .107 -.209
-.178 .506 .288 -.141 -.136 -.205 .086
.316 .157 .063 .298 -.214 .568 .033
.593 .113 .084 .220 -.321 .059 .198
.613 .134 -.259 .064 .138 -.040 .099
.512 .187 -.012 -.078 -.146 .206 .096
.667 .194 .016 .170 -.259 -.103 .182
.670 .164 -.026 .278 -.245 -.006 -.012
.660 .158 -.166 .107 .044 -.280 -.076
.151 .332 .369 -.403 -.001 -.083 -.198
.254 .277 .402 -.207 -.353 -.193 -.018
.366 .275 .386 -.255 -.128 .120 -.232
-.364 .445 -.447 -.054 -.152 .070 .233
-.357 .458 -.191 .049 -.197 -.110 -.081
-.365 .545 -.353 -.001 -.254 .122 -.019
-.230 .558 -.324 .088 .004 -.191 -.262
.694 .148 -.203 .131 .174 -.156 -.035
.529 .199 -.025 -.201 .418 -.090 .226
.481 .277 -.120 -.359 .310 .153 .138
.480 .193 -.067 -.120 .062 .276 -.481
.622 .165 -.076 -.004 .299 -.095 -.063
x19
x20
x21
x22
x23
x24
x25
x27
Q6
Q7
Q8
Q11
Q12
Q13
Q16
x31
x30
x32
x33
x34
x35
x36
x37
x38
x40
x39
1 2 3 4 5 6 7
Component
Extraction Method: Principal Component Analy sis.
7 components extracted.a.

216
Rotated Component Matrixa
-.010 .164 -.020 .775 -.011 -.055 .111
-.129 -.005 .101 .710 .087 .163 .126
-.027 .261 -.195 .652 .018 .010 .001
-.006 .106 -.057 .273 .006 .075 .681
.000 .238 -.079 .030 .146 .677 .165
-.092 .578 -.205 .016 .172 -.036 .191
-.068 .275 -.006 .288 .446 .306 -.057
-.017 -.004 .641 .044 -.024 -.206 .361
.238 -.132 .683 -.037 .099 .035 -.108
.630 -.025 .282 -.097 -.078 -.046 -.025
.310 -.010 .439 -.174 .188 -.006 .147
.408 -.074 .618 -.030 .139 .062 -.212
.374 -.051 .633 -.005 .085 -.174 -.182
.631 -.026 .270 -.025 .071 -.147 -.295
.131 .029 -.088 .035 .668 .001 .063
.017 -.012 .258 .013 .620 .133 -.197
.131 -.062 .209 -.019 .633 -.158 .129
-.057 .683 .012 -.012 -.182 .311 .124
-.143 .603 -.031 .181 .046 .072 -.094
-.145 .764 .073 .061 -.025 .087 .109
.121 .678 -.128 .249 .023 -.113 -.124
.702 -.066 .267 -.011 -.016 -.166 -.145
.706 -.162 .003 -.002 .125 .179 .147
.622 .015 .037 -.176 .195 .101 .348
.357 .080 .159 -.150 .284 -.539 .212
.678 -.122 .122 .020 .102 -.150 -.002
x19
x20
x21
x22
x23
x24
x25
x27
Q6
Q7
Q8
Q11
Q12
Q13
Q16
x31
x30
x32
x33
x34
x35
x36
x37
x38
x40
x39
1 2 3 4 5 6 7
Component
Extraction Method: Principal Component Analy sis.
Rotation Method: Varimax with Kaiser Normalization.
Rotation converged in 11 iterations.a.
Component Transformation Matrix
.700 -.336 .515 -.229 .191 -.191 -.078
.294 .685 .185 .449 .392 .148 .184
-.310 -.563 .064 .437 .615 .087 .078
-.094 -.068 .433 .629 -.538 -.262 -.212
.511 -.263 -.586 .365 -.221 -.058 .376
-.229 .000 .322 -.160 -.110 -.243 .864
.074 -.167 .249 -.001 -.285 .896 .143
Component
1
2
3
4
5
6
7
1 2 3 4 5 6 7
Extraction Method: Principal Component Analysis.
Rotation Method: Varimax with Kaiser Normalization.

217
Appendix IV Regressions
Model Summaryb
Model R R Square Adjusted R
Square
Std. Error of the
Estimate
Durbin-Watson
1 .462a .214 .208 .59980 2.035
a. Predictors: (Constant), General understandin of economic benefits of tourism,
community attachment, community concern, utilization of tourism facilities by residents
b. Dependent Variable: positive socio-cultural impacts
ANOVAa
Model Sum of Squares df Mean Square F Sig.
1
Regression 56.137 4 14.034 39.010 .000b
Residual 206.500 574 .360
Total 262.637 578
a. Dependent Variable: positive socio-cultural impacts
b. Predictors: (Constant), General understanding of economic benefits of tourism, community
attachment, community concern, utilization of tourism facilities by residents
Coefficientsa
Model Unstandardized Coefficients Standardized
Coefficients
t Sig.
B Std. Error Beta
1
(Constant) 2.063 .206 10.001 .000
community concern -.070 .028 -.095 -2.523 .012
community attachment .107 .027 .147 3.941 .000
utilization of tourism facilities
by residents .229 .029 .301 7.931 .000
General understandin of
economic benefits of tourism .211 .037 .216 5.722 .000
a. Dependent Variable: positive socio-cultural impacts

218
Residuals Statisticsa
Minimum Maximum Mean Std. Deviation N
Predicted Value 2.7156 4.7338 3.6177 .31165 579
Residual -2.19154 1.85011 .00000 .59772 579
Std. Predicted Value -2.894 3.581 .000 1.000 579
Std. Residual -3.654 3.085 .000 .997 579
a. Dependent Variable: positive socio-cultural impacts
Negative socio-cultural impacts
Model Summaryb
Model R R Square Adjusted R
Square
Std. Error of the
Estimate
Durbin-Watson
1 .744a .554 .550 .49143 1.856
a. Predictors: (Constant), General understandin of economic benefits of tourism,
community attachment, community concern, utilization of tourism facilities by residents
b. Dependent Variable: negative socio-cultural impacts
ANOVAa
Model Sum of Squares df Mean Square F Sig.
1
Regression 171.897 4 42.974 177.948 .000b
Residual 138.620 574 .241
Total 310.517 578
a. Dependent Variable: negative socio-cultural impacts
b. Predictors: (Constant), General understandin of economic benefits of tourism, community
attachment, community concern, utilization of tourism facilities by residents
Model Unstandardized
Coefficients
Standardized
Coefficients
t Sig.
B Std. Error Beta
1
(Constant) 1.265 .169 7.489 .000
community concern .590 .023 .737 26.014 .000
community attachment .065 .022 .081 2.897 .004
utilization of tourism facilities
by residents .038 .024 .046 1.622 .105
General understandin of
economic benefits of tourism -.041 .030 -.038 -1.349 .178

219
Residuals Statisticsa
Minimum Maximum Mean Std. Deviation N
Predicted Value 2.1567 4.6180 3.5583 .54534 579
Residual -1.39738 1.61705 .00000 .48972 579
Std. Predicted Value -2.570 1.943 .000 1.000 579
Std. Residual -2.844 3.291 .000 .997 579
a. Dependent Variable: negative socio-cultural impacts
Positive environmental impacts
Model Summaryb
Model R R Square Adjusted R
Square
Std. Error of the
Estimate
Durbin-Watson
1 .535a .286 .281 .81346 1.909
a. Predictors: (Constant), General understandin of economic benefits of tourism,
community attachment, community concern, utilization of tourism facilities by residents
b. Dependent Variable: positive environmental impacts
ANOVAa
Model Sum of Squares df Mean Square F Sig.
1
Regression 152.356 4 38.089 57.561 .000b
Residual 379.827 574 .662
Total 532.182 578
a. Dependent Variable: positive environmental impacts
b. Predictors: (Constant), General understandin of economic benefits of tourism, community
attachment, community concern, utilization of tourism facilities by residents

220
Support for tourism development
Model Summaryb
Model R R Square Adjusted R
Square
Std. Error of the
Estimate
Durbin-Watson
1 .606a .367 .363 .74732 1.969
a. Predictors: (Constant), negative environmental impacts, positive environmental
impacts, positive socio-cultural impacts, negative socio-cultural impacts
b. Dependent Variable: support for more tourism development
ANOVAa
Model Sum of Squares df Mean Square F Sig.
1
Regression 186.838 4 46.710 83.637 .000b
Residual 321.685 576 .558
Total 508.523 580
a. Dependent Variable: support for more tourism development
b. Predictors: (Constant), negative environmental impacts, positive environmental impacts,
positive socio-cultural impacts, negative socio-cultural impacts
Model Unstandardized Coefficients Standardized
Coefficients
t Sig.
B Std. Error Beta
1
(Constant) .478 .267 1.791 .074
positive socio-cultural impacts .806 .052 .582 15.613 .000
negative socio-cultural impacts .167 .054 .131 3.069 .002
positive environmental impacts .034 .036 .035 .936 .350
negative environmental
impacts -.131 .049 -.113 -2.654 .008

221
Model Unstandardized Coefficients Standardized
Coefficients
t Sig.
B Std. Error Beta
1
(Constant) 1.398 .280 4.999 .000
community concern -.179 .038 -.170 -4.753 .000
community attachment .115 .037 .110 3.102 .002
utilization of tourism facilities
by residents .417 .039 .385 10.633 .000
General understandin of
economic benefits of tourism .265 .050 .190 5.286 .000
Residuals Statisticsa
Minimum Maximum Mean Std. Deviation N
Predicted Value 2.0437 5.2029 3.3364 .51341 579
Residual -2.29698 2.17125 .00000 .81064 579
Std. Predicted Value -2.518 3.636 .000 1.000 579
Std. Residual -2.824 2.669 .000 .997 579
a. Dependent Variable: positive environmental impacts
Negative environmental impacts
Model Summaryb
Model R R Square Adjusted R
Square
Std. Error of the
Estimate
Durbin-Watson
1 .512a .262 .257 .69614 1.880
a. Predictors: (Constant), General understandin of economic benefits of tourism,
community attachment, community concern, utilization of tourism facilities by residents
b. Dependent Variable: negative environmental impacts
ANOVAa
Model Sum of Squares df Mean Square F Sig.
1
Regression 98.673 4 24.668 50.903 .000b
Residual 277.682 573 .485
Total 376.355 577
a. Dependent Variable: negative environmental impacts
b. Predictors: (Constant), General understandin of economic benefits of tourism, community
attachment, community concern, utilization of tourism facilities by residents

222
Model Unstandardized Coefficients Standardized
Coefficients
t Sig.
B Std. Error Beta
1
(Constant) 2.354 .239 9.834 .000
community concern .413 .032 .468 12.831 .000
community attachment .123 .032 .140 3.889 .000
utilization of tourism facilities
by residents -.028 .034 -.031 -.836 .403
General understandin of
economic benefits of tourism -.100 .043 -.085 -2.322 .021
Model Summaryb
Model R R Square Adjusted R
Square
Std. Error of the
Estimate
Durbin-Watson
1 .483a .234 .228 .82173 1.939
a. Predictors: (Constant), General understandin of economic benefits of tourism,
community attachment, community concern, utilization of tourism facilities by residents
b. Dependent Variable: support for more tourism development
ANOVAa
Model Sum of Squares df Mean Square F Sig.
1
Regression 118.242 4 29.561 43.778 .000b
Residual 387.587 574 .675
Total 505.830 578
a. Dependent Variable: support for more tourism development
b. Predictors: (Constant), General understandin of economic benefits of tourism, community
attachment, community concern, utilization of tourism facilities by residents

223
Model Unstandardized Coefficients Standardized
Coefficients
t Sig.
B Std. Error Beta
1
(Constant) 1.360 .283 4.813 .000
community concern .060 .038 .059 1.591 .112
community attachment .027 .037 .026 .713 .476
utilization of tourism facilities by
residents .478 .040 .453 12.066 .000
General understandin of
economic benefits of tourism .157 .051 .116 3.101 .002
Full model
Model Summaryb
Model R R Square Adjusted R
Square
Std. Error of the
Estimate
Durbin-Watson
1 .666a .444 .436 .70167 1.920
a. Predictors: (Constant), General understandin of economic benefits of tourism,
community attachment, community concern, utilization of tourism facilities by residents,
positive socio-cultural impacts, negative environmental impacts, positive environmental
impacts, negative socio-cultural impacts
b. Dependent Variable: support for more tourism development
ANOVAa
Model Sum of Squares df Mean Square F Sig.
1
Regression 223.693 8 27.962 56.793 .000b
Residual 280.144 569 .492
Total 503.838 577
a. Dependent Variable: support for more tourism development
b. Predictors: (Constant), General understandin of economic benefits of tourism, community
attachment, community concern, utilization of tourism facilities by residents, positive socio-
cultural impacts, negative environmental impacts, positive environmental impacts, negative socio-
cultural impacts

224
Model Unstandardized Coefficients Standardized
Coefficients
t Sig.
B Std. Error Beta
1
(Constant) .182 .287 .633 .527
positive socio-cultural impacts .713 .051 .515 13.937 .000
negative socio-cultural impacts .037 .067 .029 .551 .582
positive environmental impacts -.056 .038 -.057 -1.479 .140
negative environmental impacts -.113 .047 -.097 -2.396 .017
community concern .125 .048 .123 2.580 .010
community attachment -.031 .033 -.031 -.950 .343
utilization of tourism facilities by
residents .333 .038 .316 8.797 .000
General understandin of
economic benefits of tourism .011 .045 .008 .253 .800
Related Documents