Project Number: ME-RLN-1105 Modeling the NorEaster Engine A Major Qualifying Project Report Submitted to the Faculty of the WORCESTER POLYTECHNIC INSTITUTE in partial fulfillment of the requirements for the Degree of Bachelor of Science in Mechanical Engineering by ________________________ Malena Lund ________________________ Daniel Mullen ________________________ Matthew Rosen ________________________ Daniel Sullivan April 26, 2012 Approved: ________________________ Prof. Robert Norton ________________________ Prof. John Hall

Welcome message from author
This document is posted to help you gain knowledge. Please leave a comment to let me know what you think about it! Share it to your friends and learn new things together.
Transcript

Project Number: ME-RLN-1105
Modeling the NorEaster Engine
A Major Qualifying Project Report
Submitted to the Faculty
of the
WORCESTER POLYTECHNIC INSTITUTE
in partial fulfillment of the requirements for the
Degree of Bachelor of Science
in Mechanical Engineering
by
________________________
Malena Lund
________________________
Daniel Mullen
________________________
Matthew Rosen
________________________
Daniel Sullivan
April 26, 2012
Approved:
________________________
Prof. Robert Norton
________________________
Prof. John Hall

i
Abstract
The United States Military has increased their demand for engines that can fly in
Unmanned Aerial Vehicles (UAVs). These engines must be powerful and light enough to
maximize the aircraft’s efficiency. The objective of this project is to model the dynamic
behavior of the O’Neill Motor Company, Inc.’s innovative coaxial counter-rotating cam engine
called the NorEaster engine. The engine’s output power was calculated using a mathematical
model that we developed using Mathcad, and the weights of the newest NorEaster engine
designs were obtained from another MQP team. Therefore, we were able to calculate the power
to weight ratio of the NorEaster engine. The military’s desired minimum power to weight ratio
for the NorEaster engine is 0.5. Additionally, we performed dynamometer tests and pressure
tests on the existing NorEaster engine prototype and developed mathematical models for both
gasoline and diesel NorEaster engine designs. A future NorEaster engine that operates on
gasoline, has a 4 inch bore, a firing temperature of 2000 K, and a compression ratio of 10 is
predicted to have a power to weight ratio of 0.46. Similarly, a future NorEaster engine design
that operates on diesel fuel with a 4 inch bore, a cut off ratio of 2.75, and a compression ratio of
20 is predicted to have a power to weight ratio of 0.49. Based on these results, we recommend
further development of an eight cylinder diesel engine with the specified parameters.

ii
Executive Summary
The NorEaster engine designed by the O’Neill Motor Company, Inc. is an innovative
cam engine that utilizes coaxial counter rotation to generate lift for Unmanned Aerial Vehicles
(UAVs). The objective of this report is to calculate the power to weight ratio of the NorEaster
engine and the new designs associated with it. The military’s desired minimum power to weight
ratio for the NorEaster engine is 0.5.
Methodology
In order to understand the strengths and weaknesses of the existing NorEaster prototype,
we researched the types of rotors used on helicopters and performed dynamometer and pressure
tests on the current prototype engine.
During our rotor analysis, we assessed the limitations on the diameter of the rotor blades
and learned how they vary with angular velocity. To ensure a safe and reliable flight, the rotor
tip velocity must remain subsonic. Given this limitation, we discovered that the maximum rotor
radius varies with altitude, forward speed and rpm. The maximum engine rpm values are 3120,
4052, and 4984 for the three forward speeds of 300 mph, 200 mph and 100 mph, respectively.
We discovered that the engine will stall at an angle of attack of approximately 20 degrees when
using the requested airfoil, NACA 0015.
In addition to rotor analysis, we analyzed the output power of the existing NorEaster
engine by performing a dynamometer test. We calculated the power of the prototype engine by
measuring the current and voltage across several resistors. From this test, we discovered that the
output power increased by 0.389 horsepower for every increase of 100 rpm. As anticipated, the
power produced by the prototype NorEaster engine increased as the engine’s rpm increased.
Finally, we performed a pressure test to calculate the pressure inside the cylinders of the
prototype NorEaster engine. We installed a Dytran pressure transducer on the inside surface of
the cylinder head and relayed its signal through a charge amplifier. We read the signal on an HP
Dynamic Signal Analyzer in mV as a function of time and converted it to psi using a 6.22
mV/psi conversion factor that we measured during a calibration test. During the pressure test,
we mounted a shaft encoder on the outer rotating shaft of the NorEaster engine in order to

iii
pinpoint the piston’s location at top dead center (TDC) in relation to the pressure readings. From
this data, we discovered that there are some leaks in the current prototype, since its average
maximum pressure reading was only 355.8 psi. Ideally, the maximum pressure inside of the
cylinder head should be around 1000 psi.
Results
Upon analyzing the prototype of the NorEaster engine, we decided to use the air-standard
Otto Cycle analysis method to calculate the power produced by existing and future engine
designs. We developed two mathematical models that calculate the anticipated power for the
engine and divided it by the anticipated engine weight for diesel and gasoline designs. The
values for the engine weight were determined by another MQP team that is working on
designing a new NorEaster engine. For the gasoline engine, we recommend using a 4 inch bore
with a compression ratio of 10 and a firing temperature of 2000 K in order to obtain a power to
weight ratio of 0.46. For the diesel engine, we recommend using a 4 inch bore with a
compression ratio of 20 and a cut-off ratio of 2.75 in order to obtain a power to weight ratio of
0.49.
Conclusion and Recommendations
Based on the power to weight ratios that we calculated using our mathematical model,
further development of the diesel NorEaster engine design is recommended. We would suggest
building a second generation prototype of the NorEaster engine with eight cylinder heads and the
optimized parameters provided above.
iv
Table of Contents
Abstract ............................................................................................................................................ i
Executive Summary ........................................................................................................................ ii
List of Figures ................................................................................................................................ vi
List of Tables ............................................................................................................................... viii
1.0 Introduction ............................................................................................................................... 1
2.0 Literature Review...................................................................................................................... 3
2.1 How an Engine Works .......................................................................................................... 3
2.1.1 Four-Stroke Cycle........................................................................................................... 3
2.1.2 Isentropic Relationships ................................................................................................. 4
2.1.3 Air-Standard Otto Cycle Analysis .................................................................................. 6
2.1.4 Crankshaft Engines ....................................................................................................... 10
2.1.5 Cam Engines ................................................................................................................. 11
2.1.6 The Existing NorEaster Engine Design ........................................................................ 12
2.1.7 Engine Design Optimization ........................................................................................ 15
2.2 Comparison to Existing Drone Engines and Companies .................................................... 15
3.0 Methodology ........................................................................................................................... 17
3.1 Free Body Diagram of the NorEaster Engine ..................................................................... 17
3.2 Weight Calculations ............................................................................................................ 18
3.3 Cylinder Compression Ratio Measurement ........................................................................ 19
3.4 Mechanical Compression Test ............................................................................................ 20
3.5 Blade to Engine Relationships ............................................................................................ 20
3.5.1 Maximum Blade Diameter Compared to Engine RPM ................................................ 20
3.5.2 Limitations of NACA0015 ........................................................................................... 21
3.6 Dynamometer Testing ......................................................................................................... 24
v
3.6.1 Procedure ...................................................................................................................... 24
3.6.2 Dynamometer Test 1 Results ........................................................................................ 25
3.6.3 Dynamometer Test 2 Results ........................................................................................ 27
3.7 Pressure Transducer Test .................................................................................................... 28
3.7.1 Procedure ...................................................................................................................... 28
3.7.2 Pressure Transducer Test Results ................................................................................. 31
4.0 Results ..................................................................................................................................... 37
4.1 Gasoline Engine Results...................................................................................................... 37
4.1.1 Current Gasoline Engine Results .................................................................................. 41
4.2 Diesel Engine Results.......................................................................................................... 41
4.3 Overall Findings for the NorEaster Engine Designs ........................................................... 43
5.0 Conclusions and Recommendations ....................................................................................... 45
6.0 References ............................................................................................................................... 47
Appendix A – Blade to Engine Relationships .............................................................................. 50
Appendix B – Dynamometer Mathcad ......................................................................................... 51
Appendix C – Gasoline and Diesel Mathematical Models ........................................................... 55
Gasoline Engine Model ............................................................................................................. 55
Diesel Engine Model ................................................................................................................. 63

vi
List of Figures
Figure 1: Pressure versus Volume Diagram for an Ideal Otto Cycle (Glenn Research Center,
2008) ............................................................................................................................................... 4
Figure 2: Given Parameters and Variables from a Sample Problem (Moran and Shapiro, 2011) .. 8
Figure 3: Increase in Power as the Engine Speed Increases ........................................................... 9
Figure 4: Pressure versus Volume Diagram of an Actual Otto Cycle (MIT, 2006) ....................... 9
Figure 5: Thermal Efficiency depending on the Compression Ratio (MIT, 2006) ...................... 10
Figure 6: The Interior of a V-Arrangement Crank Shaft Engine (Loeffler, 2003) ....................... 11
Figure 7: The NorEaster Engine’s Two-Lobe Cam Design .......................................................... 12
Figure 8: The NorEaster’s Existing Cam Design ......................................................................... 13
Figure 9: View of the Snowflake Plate Inside of the NorEaster Engine ...................................... 14
Figure 10: Fully Assembled NorEaster Engine ............................................................................ 14
Figure 11: The Sikorsky X2 .......................................................................................................... 16
Figure 12: Free Body Diagram of the NorEaster Engine ............................................................. 17
Figure 13: Graph of the Propeller Blade Diameter vs. the Potential Revolutions per Minute ..... 21
Figure 14: Image of the NACA 0015 Providing Lift and Drag Coefficients (MIT XFOIL) ........ 22
Figure 15: Lift and Drag Coefficients of NACA 0015 at Varying Angles of Attack (CSEE) ..... 23
Figure 16: Circuit Board Used for the Dynamometer Test Performed on the NorEaster Engine 25
Figure 17: Graph Comparing Horsepower to RPM ...................................................................... 26
Figure 18: Graph Comparing Horsepower to RPM ...................................................................... 28
Figure 19: PCB Charge Amplifier Model 462S05 ....................................................................... 29
Figure 20: HP Signal Analyzer ..................................................................................................... 29
Figure 21: The Valve and Gage Used to Calibrate the Pressure Transducer................................ 30
Figure 22: Shaft Encoder Model 776 Mounted on the NorEaster Engine .................................... 31
Figure 23: Pressure Data: Compression Test ................................................................................ 32
Figure 24: Pressure Data: Retarded Spark with Low Time Resolution ........................................ 33
Figure 25: Pressure Data: Advanced Spark with High Time Resolution ..................................... 34
Figure 26: Calibration Turning Force ........................................................................................... 35
Figure 27: Calibration Torque ...................................................................................................... 35
Figure 28: Power to Weight Ratio as a Function of Firing Temperature ..................................... 37

vii
Figure 29: Power to Weight Ratio as a Function of Compression Ratio ...................................... 38
Figure 30: Power to Weight Ratio as a Function of Bore Size ..................................................... 39
Figure 31: Equation to Calculate Weight as a Function of Bore Size .......................................... 40
Figure 32: A 2 dimensional cross-section of a cylinder ............................................................... 40
Figure 33: Power to Weight Ratio as a Function of Cut-Off Ratio .............................................. 41
Figure 34: Power to Weight Ratio as a Function of Compression Ratio ...................................... 42
Figure 35: Power to Weight Ratio as a Function of Bore Size ..................................................... 42

viii
List of Tables
Table 1: Variables and Values Used to Calculate Power in Figure 2 ............................................. 7
Table 2: Current Two Cylinder Engine Component Weights ...................................................... 18
Table 3: Weights from the NorEaster Design Group’s SolidWorks Models................................ 19
Table 4: Measurements to Calculate the Volume when the Piston is at Top Dead Center .......... 19
Table 5: Comparison of RPM with Corresponding Horsepower.................................................. 26
Table 6: Comparison of RPM with Corresponding Horsepower.................................................. 27
Table 7: Pressure, Turning Force, and Torque Summation .......................................................... 36
Table 8: Comparison of the Power to Weight Ratios at Different Weight and Engine Parameters
....................................................................................................................................................... 43
Table 9: Fire Scout Power to Weight ............................................................................................ 44

1
1.0 Introduction
At the start of the 21st century, the United States military increased production of
unmanned aerial vehicles (UAV). UAVs, also known as drones, are primarily used for two
purposes: combat missions and surveillance missions. They minimize the harm presented to
American troops and increase tactical advantages during war. Drones equipped with modern
video and infrared technology can be used for surveillance missions. They can provide military
officials with real-time images of dangerous locations that are of higher quality than the satellite
images military officials currently rely on. Because UAVs are relatively small targets that are
difficult to detect, they provide the military with new opportunities during war without putting
soldiers in danger. Most UAVs are small airplanes that can quickly fly over an area and collect
the information needed.
The military has recently developed a need for a more agile UAV that can provide clearer
images and more accurate calculations for combat missions. Helicopter drones are an excellent
way to meet this need since they can hover over an area for a period of time and easily move in
all three dimensions. Upon recognizing this need, the O’Neill Motor Company, Inc. began
developing a small cam engine that is intended for military helicopter drones. The NorEaster
engine produces counter-rotation between two co-axial blades to obtain lift and thrust, so there is
no need for a tail rotor. Due to the nature of this design, the most significant advantage of the
engine is the inherent 4:1 gear reduction ratio that allows for slow revolutions of the shaft and
eliminates the need for a gearbox.
The goal of our project is to identify the output power of the NorEaster engine in order to
assess its uses in the field. The military’s desired minimum power to weight ratio for the
NorEaster engine is 0.5. We have concentrated our efforts on determining the output power of
the NorEaster engine and identifying several parameters that can be adjusted in order to
maximize it. The O’Neill Motor Company, Inc.’s objective is to design a NorEaster engine that
meets the military’s requirements and can be used to increase their capabilities.
Our project bridges the gap in information between the prototype design of the NorEaster
engine and the development of a more effective product by creating a model which simulates the
engine’s performance. We researched means of optimizing an engine’s power and identified the
important aspects of engine design that must be considered in next generation engines. During

2
our investigation of the engine’s output power, we compared our results to those of existing
helicopter’s to assess the benefits of the NorEaster engine.
In order to analyze the output power of the NorEaster engine, we modeled the engine in a
computer program called Mathcad. Our mathematical model incorporates the thermodynamic
equations for work and power of a four-stroke engine. We performed several power-related
experiments to gather information on the NorEaster engine and assess the current design. These
experiments and models were used to determine how to increase the engine’s output power.
Chapter 4 provides details on how to calculate the output power of the NorEaster engine and
compares this innovative design to other competitive engine designs. The analysis of the
information that we gathered led to the development of improved engine designs that can
enhance the performance of the NorEaster engine and increase its appeal amongst the branches
of the United States military that use UAV technology.
3
2.0 Literature Review
Aircraft engines have a variety of complicated and innovative designs. For example, fixed
wing aircraft are typically propelled by turbofan engines, while rotating blade aircraft are often
propelled by turboprop or turboshaft engines. The O’Neill Motor Company, Inc. has introduced
another type of aircraft engine: the cam engine. The NorEaster engine uses a cam design to
generate power.
2.1 How an Engine Works
Engines are machines containing moving parts that are used to generate motion. There
are many different engine parameters, such as fuel type, compression ratio and bore size, that can
be altered to accommodate different applications such as size, power, and weight. As each
engine is designed to meet the desired specifications, these parameters can be modified to
optimize the engine’s performance for that application.
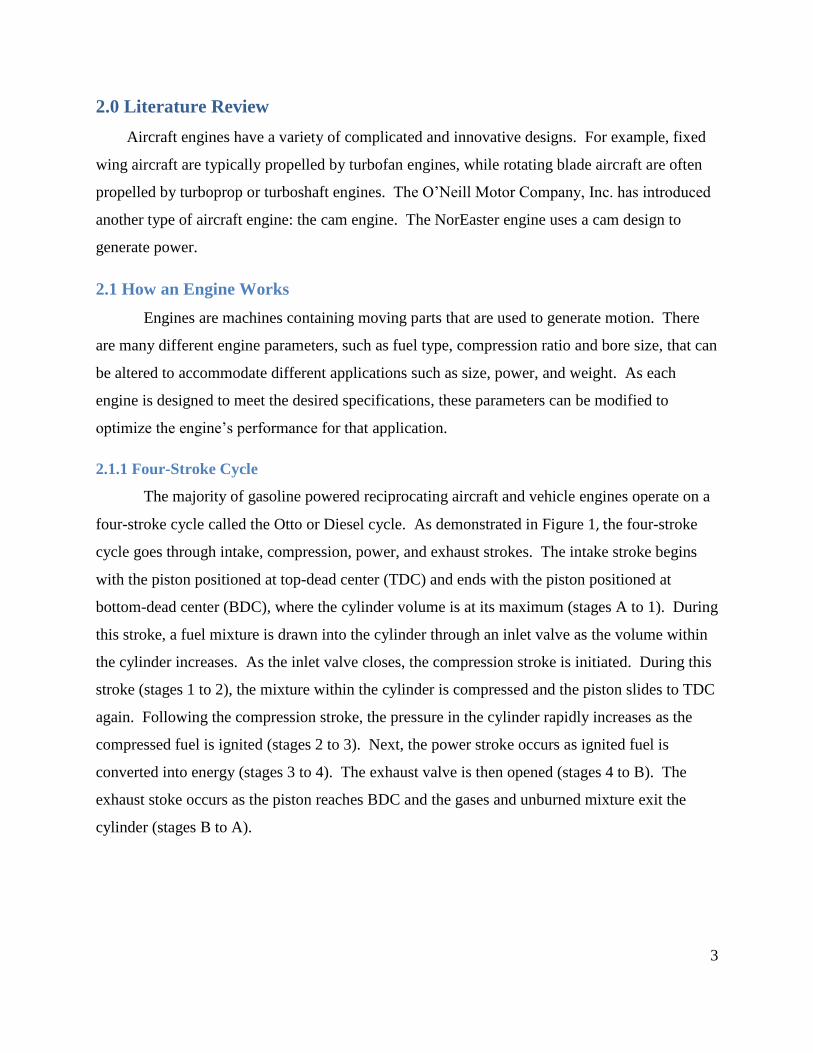
2.1.1 Four-Stroke Cycle
The majority of gasoline powered reciprocating aircraft and vehicle engines operate on a
four-stroke cycle called the Otto or Diesel cycle. As demonstrated in Figure 1, the four-stroke
cycle goes through intake, compression, power, and exhaust strokes. The intake stroke begins
with the piston positioned at top-dead center (TDC) and ends with the piston positioned at
bottom-dead center (BDC), where the cylinder volume is at its maximum (stages A to 1). During
this stroke, a fuel mixture is drawn into the cylinder through an inlet valve as the volume within
the cylinder increases. As the inlet valve closes, the compression stroke is initiated. During this
stroke (stages 1 to 2), the mixture within the cylinder is compressed and the piston slides to TDC
again. Following the compression stroke, the pressure in the cylinder rapidly increases as the
compressed fuel is ignited (stages 2 to 3). Next, the power stroke occurs as ignited fuel is
converted into energy (stages 3 to 4). The exhaust valve is then opened (stages 4 to B). The
exhaust stoke occurs as the piston reaches BDC and the gases and unburned mixture exit the
cylinder (stages B to A).

4
Figure 1: Pressure versus Volume Diagram for an Ideal Otto Cycle (Glenn Research Center, 2008)
As shown in Figure 1, each stage of the Otto Cycle varies depending on the pressure and
the specific volume in an engine’s cylinder head. The work is a function of the engine’s
pressures and compression ratio. The work per cycle is the area between the compression stroke
and power stroke. Isentropic relationships can be used to assess the work, which is shaded in
Figure 1. Upon analyzing the pressures and compression ratios at each of the different stages of
the Otto cycle, the work and the power of a four-stroke engine can be determined.
2.1.2 Isentropic Relationships
When assessing the output work of an Otto Cycle, an isentropic relationship can be
assumed for the compression and the power strokes. In an isentropic relationship, there is
constant entropy; therefore, the process is both adiabatic and reversible (Moran, 2011, p. 315).
The combination of these properties allow for engineers to use the Ideal Gas Tables to determine
the relationship between the pressure, temperature, entropy, and internal energy at two different
states. Therefore, the change in pressure, P, and temperature, T, can be determined by using the
following equations,

5
where the compression ratio, r, is the ratio of maximum to minimum volume during the
compression stroke and 𝛾 is the ratio of specific heats. During the combustion process (stages 2-
3), heat is released by,
where Q is the heat released per pound of fuel, and f is the fuel to air ratio for combustion. Also
the pressure during combustion,
(
)
can be calculated from the ideal gas law. During the power stroke (stages 3-4), work is done on
the piston by the gas. Equations used during the compression stroke can be used similarly to
analyze both pressure and temperature during the expansion stroke. The relations used are:
All heat is transferred to the surroundings between stages 4 and B in Figure 1; therefore, the
temperature and pressure return to atmospheric conditions.
In a diesel engine, another parameter called the cut-off ratio, , must be used to calculate
the engine’s output power. The cut-off ratio is the ratio of the volume in the cylinder at the start
of ignition to the volume at the end of ignition (Engineering Software).
Work is done by the piston on the gas during the compression stroke and work is done by
the gas on the piston during the expansion stroke. The difference between the work done during
these two strokes is the work produced during the four-stroke cycle. Therefore the work, W, can
be evaluated by the difference of the heat into the gas and the heat rejected by the gas which is
represented by the formula:
( ) ( )
The output power of the engine is determined by dividing the work by the time it takes for one
cycle to be completed.

6
2.1.3 Air-Standard Otto Cycle Analysis
An air-standard analysis is used when the temperature variation between several of the
states exceeds 1000 K (Moran 2011, p 497). According to calculations performed in Chapter 4
of this report, the temperature in the existing NorEaster engine varies from room temperature
(298 K) to over 1000 K, so the air-standard Otto Cycle analysis should be used to calculate the
work.
During this cycle, one must assume that heat addition occurs instantaneously while the
piston is at top dead center (Moran 2011, p 497). This causes the specific heat at constant
pressure or constant volume to vary too much for the power calculation to depend on a constant
value. Therefore, the work performed by the engine is calculated using internal energies at each
of the four stages.
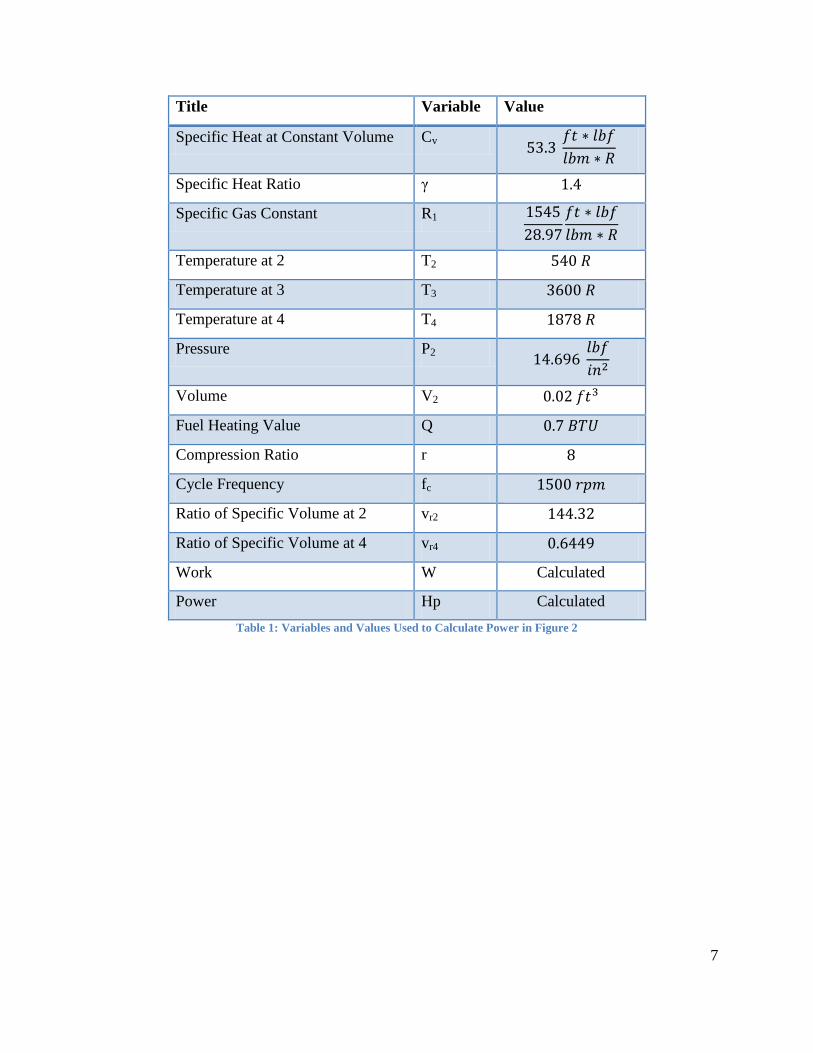
Figure 2 demonstrates how to use an air-standard analysis for an Otto Cycle based on an
example from page 499-501 of Moran and Shapiro’s “Fundamentals of Engineering
Thermodynamics.” Table 1 identifies the variables and known parameters for this example. The
procedure used to calculate the power in this sample problem is also used to calculate the power
of the NorEaster engine.
7
Title Variable Value
Specific Heat at Constant Volume Cv
Specific Heat Ratio γ
Specific Gas Constant R1
Temperature at 2 T2
Temperature at 3 T3
Temperature at 4 T4
Pressure P2
Volume V2
Fuel Heating Value Q
Compression Ratio r
Cycle Frequency fc
Ratio of Specific Volume at 2 vr2
Ratio of Specific Volume at 4 vr4
Work W Calculated
Power Hp Calculated
Table 1: Variables and Values Used to Calculate Power in Figure 2

8
Figure 2: Given Parameters and Variables from a Sample Problem (Moran and Shapiro, 2011)
The graph in Figure 3 shows the theoretical engine speed verses the power that one
cylinder outputs. It is based on the results of the power calculation performed in Figure 2. As
can be viewed in the graph, power is directly related to speed. The slope of the line is 0.0566.
This slope describes the rate at which the power increases with speed.

9
Figure 3: Increase in Power as the Engine Speed Increases
The final critical component of completing a power analysis for an Otto Cycle is the
efficiency (η). As demonstrated in Figure 4, an actual Otto Cycle does not follow the same
pressure-volume curve as the ideal Otto Cycle does.
Figure 4: Pressure versus Volume Diagram of an Actual Otto Cycle (MIT, 2006)
In order to account for inefficiencies in an internal combustion engine, the value for η
must be calculated using the following equation:
600 800 1 103
1.2 103
1.4 103
40
50
60
70
80
90
Power
Engine Speed (rpm)
Po
wer
(h
p)
Power x1 hp
x1
rev

10
The actual output work is the product of the ideal output work and the efficiency rate. Modern
internal combustion engines that use gasoline still have relatively low efficiencies compared to
other methods of power generation such as turbines. However, turbines are too complex and
expensive to completely replace the internal combustion engine.
For internal combustion engines, a correlation can be made between an engine’s
compression ratio and its efficiency. Figure 5 shows the typical engine efficiency for a gasoline
fueled engine at various compression ratios.
Figure 5: Thermal Efficiency depending on the Compression Ratio (MIT, 2006)
For an internal combustion engine with a compression ratio of 7, the ideal thermal efficiency is
approximately 50% (MIT, 2006). However, the actual efficiency for an internal combustion
engine averages only 30% (MIT, 2006). Since gasoline engines do not operate at their ideal
state, the efficiency decreases by approximately 20%. As the compression ratio increases, the
thermal efficiency of an internal combustion engine also increases, until it eventually approaches
a maximum efficiency.
2.1.4 Crankshaft Engines
Crankshaft engines consist of pistons that reciprocate within cylinders and transmit
power to a crankshaft through a connecting rod. The connecting rods are attached to the
crankshaft and oscillate around the shaft while the pistons move within the cylinder. The
cylinders of the engine are typically arranged in one of three ways: inline, V, or flat. When
arranged inline, all cylinders are aligned in a single bank. Both V arrangements (Figure 6) and

11
flat arrangements consist of cylinders arranged in two banks in which the cylinders are set at an
angle to one another or with the angle being 180 degrees for an approved engine.
Figure 6: The Interior of a V-Arrangement Crank Shaft Engine (Loeffler, 2003)
2.1.5 Cam Engines
Similar to crankshaft engines, cam engines also consist of a piston that reciprocates
within cylinders powered by a two- or four-stroke combustion process. The difference is that the
connecting rods motion is strictly translational. This restricts pivoting at the linkage between the
piston and the connecting rod. Consequently, the connecting rods do not rotate around a
crankshaft. Instead, the connecting rods have followers which move within the groove of a
rotating cam, as shown in Figure 7. A four lobe cam allows the pistons to complete two 4-stroke
cycles while the cam only revolves once. This internal gearless reduction produces high torque
and low rpm. A helicopter can use a cam engine to increase the output power since there is no
gearbox.

12
Figure 7: The NorEaster Engine’s Two-Lobe Cam Design
2.1.6 The Existing NorEaster Engine Design
The NorEaster engine uses the cam-follower technology described in Section 2.1.5 to
convert the energy produced in the cylinder head into counter coaxial rotation. In a gasoline
engine, a fuel-air mixture is compressed and ignited by a spark, which in turn causes the cam to
rotate. In a diesel engine, a fuel-air mixture is compressed until its temperature is high enough to
achieve self-ignition, at which point the cams rotate. In the current prototype, the oval shaped
path, labeled “Track A” in Figure 8, rotates at half the reciprocating speed of the pistons. This
relationship is a result of the two lobe design of the cam.
Connecting Rod
Follower
Cam Track

13
Figure 8: The NorEaster’s Existing Cam Design
Within the engine, there are two cams that rotate in opposite directions. This counter-
rotation between the cams creates the co-axial counter rotation of the rotors. The coaxial-counter
rotation design is described in U.S. Patent No. 7,219,631 B1.
The NorEaster engine utilizes gearless reduction to minimize the high speed required of a
typical helicopter engines. In turn, the NorEaster generates suitable rotor speeds to lift the
aircraft off the ground without the assistance of external gears. The current design operates at a
2:1 gear ratio. The new engine design will operate at a 4:1 gear ratio, which helps generate high
torque and at low rpm.
The NorEaster engine was designed to be perfectly balanced. The piston from the cam’s
motion is a pure harmonic, which means that the velocity of the pistons follows a sinusoidal
curve, and the connecting rods are in pure translation, thus adding no harmonics. As the cam
turns and the pistons reciprocate, the valves open and close at different points in the cycle.
Additionally, the pistons and their connecting rods are not offset in the axial direction, which
eliminates unbalanced moments.
The existing NorEaster was designed with various cylinder arrangements in mind. For
example, the transmission case and “snowflake plate” on the existing engine, shown in Figure 9,
can accommodate up to eight cylinders. Adding more cylinders to the existing design would
Track A

14
increase the power produced by the NorEaster and help the O’Neill Motor Company, Inc.
explore various ways to optimize the engine.
Figure 9: View of the Snowflake Plate Inside of the NorEaster Engine
The fully assembled prototype of the NorEaster engine can be seen in Figure 10. This
was constructed by OMC before this project began.
Figure 10: Fully Assembled NorEaster Engine
Snowflake Plate
Engine Cylinder
Octagon Cover
Aluminum Shell
Center Shaft

15
2.1.7 Engine Design Optimization
In order to optimize the engine design, we determined which parameters can be adjusted.
Some of these parameters include the compression ratio, bore size, cut-off ratio, and firing
temperature due to different fuels. Gasoline and diesel engines are optimized in different ways.
Despite these adjustable parameters, the optimized engine design must use the same helicopter
blades and angle of attack to generate lift.
2.2 Comparison to Existing Drone Engines and Companies
The AAI RQ-7 Shadow, Reaper Drone, Predator Drone and Northrop Grumman MQ-8
Fire Scout are existing UAVs that resemble the NorEaster engine. In assessing the performance
of the NorEaster engine, it is helpful to understand the existing UAV market and the
competition’s ability to perform.
The AAI RQ-7 Shadow is an UAV used for the U.S. Army and Marine Corps. It
includes an electro-optical/infrared camera that relays video in real time via a C-band line-of-
sight data link to the ground control station. While in flight, the Shadow uses a Wankel engine
and can generate 38 brake horsepower (UAV Engines LTD, 2004). A Wankel rotary engine, one
of the most common types of rotary engines, uses a rotor to convert pressure into rotating motion
instead of using conventional reciprocating pistons.
The Reaper Drone, also known as the MQ-9, is designed for long-endurance, high-
altitude surveillance. Much larger than the Shadow or Predator, the Reaper Drone is has a
maximum takeoff weight of 10,500 pounds (UAV Engines LTD, 2004). It utilizes a Honeywell
TPE331-10 turboprop engine which outputs 950 shaft horsepower. The turboprop engine drives
the propeller of the aircraft using a reducing gear. This gearing configuration allows the turbine
to transform its high rpm and low torque to low rpm and high torque through gearing. Unlike
large aircraft turbines, the turboprop engine’s exhaust plays only a minor role in propulsion of
the UAV.
The Predator Drone, or the MQ-1, is used primarily by the U.S. Air Force and Central
Intelligence Agency. This UAV can take off with a maximum weight of 2,250 pounds (Military
Factory, 2010). The Predator utilizes a Rotax 914F turbocharged four-cylinder engine (Military
Factory, 2010). The engine is horizontally-opposed, and it can produce 115 horsepower

16
(Military Factory, 2010). It has a dry weight of 172 pounds, a bore of 3.1 inches, a stroke of 2.4
inches, and a displacement of 74 cubic inches (Military Factory, 2010).
The Northrop Grumman MQ-8 Fire Scout is a UAV helicopter. It is used by the U.S.
Armed Forces to provide reconnaissance, situational awareness, and precision targeting for
military support. The Fire Scout has a maximum takeoff weight of 3,150 pounds (Northrop
Grumman, 2011). The Fire Scout is powered by a Rolls-Royce 250 turboshaft engine which
produces 419.7 horsepower. The engine has a dry weight of 173 pounds (Northrop Grumman,
2011).
The Sikorsky X2, displayed in Figure 11, is a manned helicopter which was developed
with a new blade configuration. The configuration has two blades, which rotate in opposite
directions on the same axis, like the NorEaster engine. This allows for most of the forces to
balance out and eliminates the need for a tail rotor. The X2 recently broke the helicopter speed
record at nearly 300 miles per hour. It is powered by a LHTEC T800-LHT-801 turboshaft
engine which produces between 1300 and 1800 shaft horsepower. It has a maximum takeoff
weight of 7,937 pounds (Sikorsky, 2011). Its rotor diameter is 26.4 feet (Sikorsky, 2011).
Figure 11: The Sikorsky X2
The NorEaster engine incorporates the same counter rotating blade configuration seen in
the Sikorsky X2 but sends power to the rotors differently. The performance of the NorEaster
engine can be compared to the Fire Scout, since that engine incorporates similar design aspects
(Northrop Grumman, 2011). These performance measures are provided in Chapter 4 of the
report

17
3.0 Methodology
The combination of several research methods allowed us to determine how to model the
NorEaster engine in a computer simulation, and in turn helped the O’Neill Motor Company Inc.
determine the engine’s output power. The approximate weight of the existing engine prototype
was determined and used to calculate the power to weight ratio. Additionally, several tests were
run to analyze the current engine’s performance. Research on the NorEaster engine can be used
to understand the current limitations of the engine and determine how to best maximize its output
power.
3.1 Free Body Diagram of the NorEaster Engine
The free body diagram, shown in Figure 12, demonstrates where the forces are exerted on
the cams in the NorEaster engine. In this example, the cam turns clockwise. The forces acting
on the cam are labeled in the legend on the figure.
Figure 12: Free Body Diagram of the NorEaster Engine

18
The angle, φ, represents the pressure angle of the cam. This rotation is due to the sum of all of
the forces in their respective directions. The piston force is exerted through the center of the
cam. Future designs can maximize the total force by increasing the piston force and the turning
force. Each of these forces is dependent upon a combination of engine parameters such as the
bore size, compression ratio and temperatures within the cylinder.
3.2 Weight Calculations
Current Two Cylinder Engine
Individual Weight
(lbs.)
Number of Pieces Total Weight
(lbs.)
Octagon Cover 13 2 26
Cam 31 2 62
Snowflake Plate 6 2 12
Engine Cylinder 9 2 18
Aluminum Shell 55.88 1 55.88
Nuts and Bolts -- --
Gearbox Case -- 1
Gears -- --
Piston -- 2
Total Engine
Weight
173.88
Table 2: Current Two Cylinder Engine Component Weights
Several components of the existing engine were weighed within an accuracy of one
pound. SolidWorks was used to estimate the weight the aluminum shell. These can be seen in
Table 2. The top octagon cover, one cam, one engine cylinder and one snowflake plate were
removed from the engine and measured on a scale. The total weight of the current engine,
excluding the gearbox case, gears, pistons, nuts and bolts, is 173.85 pounds.
Because all of the calculations performed in Chapter 4 are based on new engine designs,
these weight calculations need to be adjusted. The NorEaster Design Group provided weight
calculations for a gasoline and diesel engine with differing bores. This information can be found
in Table 3.
19
Bore Size Gasoline Engine (lb) Diesel Engine (lb)
3 inches 812 812
4 inches 842.5 842.5
5 inches 875.7 875.7
Table 3: Weights from the NorEaster Design Group’s SolidWorks Models.
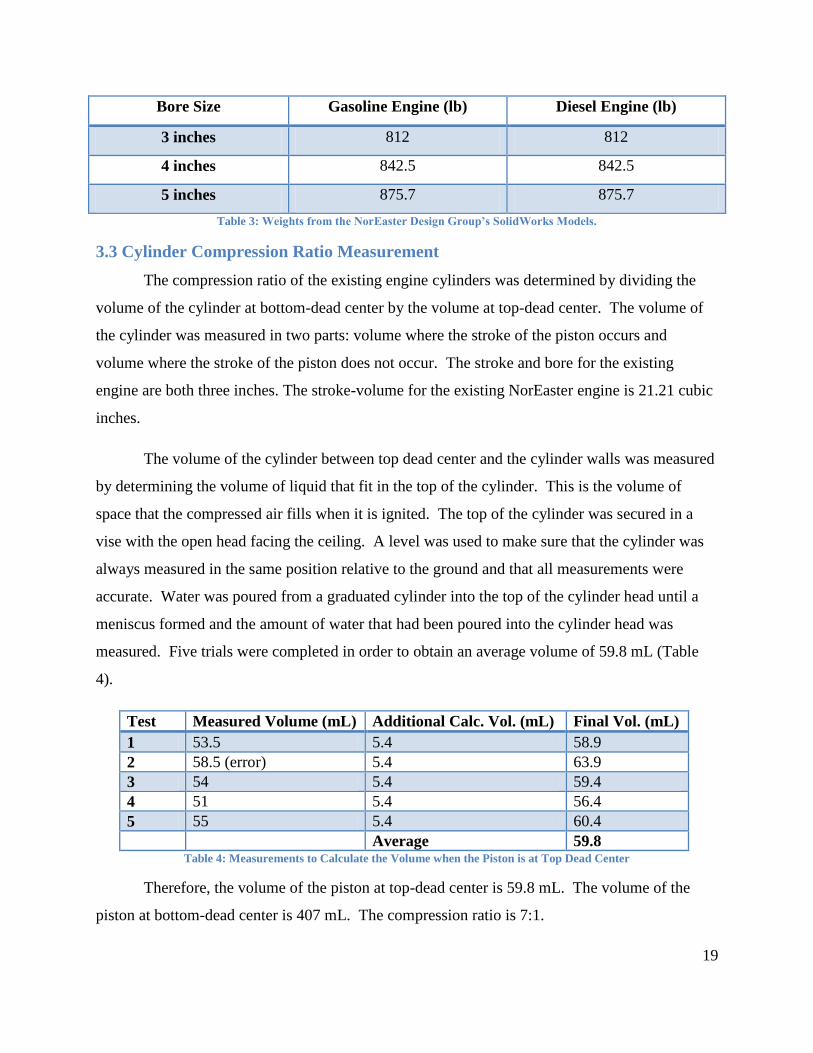
3.3 Cylinder Compression Ratio Measurement
The compression ratio of the existing engine cylinders was determined by dividing the
volume of the cylinder at bottom-dead center by the volume at top-dead center. The volume of
the cylinder was measured in two parts: volume where the stroke of the piston occurs and
volume where the stroke of the piston does not occur. The stroke and bore for the existing
engine are both three inches. The stroke-volume for the existing NorEaster engine is 21.21 cubic
inches.
The volume of the cylinder between top dead center and the cylinder walls was measured
by determining the volume of liquid that fit in the top of the cylinder. This is the volume of
space that the compressed air fills when it is ignited. The top of the cylinder was secured in a
vise with the open head facing the ceiling. A level was used to make sure that the cylinder was
always measured in the same position relative to the ground and that all measurements were
accurate. Water was poured from a graduated cylinder into the top of the cylinder head until a
meniscus formed and the amount of water that had been poured into the cylinder head was
measured. Five trials were completed in order to obtain an average volume of 59.8 mL (Table
4).
Test Measured Volume (mL) Additional Calc. Vol. (mL) Final Vol. (mL)
1 53.5 5.4 58.9
2 58.5 (error) 5.4 63.9
3 54 5.4 59.4
4 51 5.4 56.4
5 55 5.4 60.4
Average 59.8 Table 4: Measurements to Calculate the Volume when the Piston is at Top Dead Center
Therefore, the volume of the piston at top-dead center is 59.8 mL. The volume of the
piston at bottom-dead center is 407 mL. The compression ratio is 7:1.

20
3.4 Mechanical Compression Test
A mechanical compression test was run on both cylinders to ensure that the compression
in the cylinders was sufficient enough to run a pressure test. A compression tester kit was
connected to each of the cylinders at the spark plug holes and turned over the engine using the
electric starter motor. Three trials were run for each cylinder to obtain an average pressure. The
average mechanical cylinder compression for one cylinder head was 113 psi, and 115 psi for the
other cylinder head.
3.5 Blade to Engine Relationships
In order to ensure that the NorEaster functions at optimized conditions, we analyzed the
design of the propeller blades. We assessed the limitations on the diameter of the rotor blades
and analyzed how they vary with revolutions per minute.
3.5.1 Maximum Blade Diameter Compared to Engine RPM
The maximum possible revolutions per minute of the NorEaster engine were calculated.
This calculation depends on the speed of the blades at their tips. The wing tip speed of the
helicopter blade must remain subsonic in order to eliminate the possibility of vibrations that
could disturb flight.
Using the information on the maximum rpm of a helicopter engine, the maximum
helicopter blade radius was calculated. The limitation on the speed of the tip of the helicopter
blade was calculated by dividing the speed of sound by a safety factor of 1.2 and subtracting the
maximum forward speed. The speed of sound is 761.2 mph at sea level and the fastest helicopter
has a top speed of nearly 300 mph. As the helicopter increases its altitude, the maximum
achievable speed will decrease. This calculation can be seen in Appendix A.
Figure 13 shows the engine rpm verses the rotor length. The curve, marked with squares,
is the upper extreme representation of data because it does not take into account a safety factor or
the speed of the helicopter. The other three curves take into account a safety factor of 1.2 and a
maximum forward speed of 100 mph, 200 mph and 300 mph. If the rotor diameter is assumed to
be 12 feet (1.83 m radius), the maximum engine speed is 780 rpm, 1013 rpm and 1246 rpm for a
maximum forward speed of 300 mph, 200 mph and 100 mph respectively. The engine’s pistons
would feel like the engine was rotating four times as fast due to the internal 4 to 1 ratio.

21
Therefore, the performance of the pistons would be compared to maximum engine rpm values of
3120, 4052, and 4984 for the three forward speeds of 300 mph, 200 mph and 100 mph
respectively.
Figure 13: Graph of the Propeller Blade Diameter vs. the Potential Revolutions per Minute
3.5.2 Limitations of NACA0015
Figure 14 shows a screenshot from MIT’s XFOIL program. This program calculates the
lift and drag coefficients at a given angle of attack. The graph shown in Figure 14 shows the
curve of a 2.5 degree angle of attack. In this example, the drag coefficient is -0.00142, and the
lift coefficient is 0.3091.
0
500
1000
1500
2000
2500
3000
3500
4000
4500
5000
5500
0 1 2 3 4 5 6 7
RP
M
Rotor Radius (m)
Rotor Radius Compared to RPM
No Max Speed or Safety Factor
100 mph Max Speed with 1.2Safety Factor
200 mph Max Speed with 1.2Safety Factor
300 mph Max Speed with 1.2Safety Factor

22
Figure 14: Image of the NACA 0015 Providing Lift and Drag Coefficients (MIT XFOIL)
Figure 15 shows the lift and drag coefficients for a NACA 0015 airfoil. As demonstrated
in this figure, the lift to drag ratio ranges from 0 to 100. Both the lift and drag coefficients are a
function of the angle of attack. The drag coefficient increases exponentially, until it reaches its
stall point at an angle of attack of 20 degrees. The lift coefficient increases linearly until it
reaches a stall point at an angle of attack of 20 degrees. Therefore, a NACA 0015 airfoil will
cause an engine to stall at approximately 20 degrees.

23
Figure 15: Lift and Drag Coefficients of NACA 0015 at Varying Angles of Attack (CSEE)
In order to compare the NorEaster engine with similar helicopter engines, the lift force is
an important parameter to assess. Calculating the lift force for a helicopter blade is a
complicated procedure that requires assuming values for many of the engine’s design
characteristics. This rotor design method is often referred to as the blade element method. In
order to avoid these complexities, the lift force on a helicopter can be determined by utilizing the
actuator disk model. Under the actuator disk model, the blade of a helicopter is analyzed as the
rotor blades are spun, so the model resembles that of a flat disk (Scott, 2001). Increasing the
weight of a helicopter and its engine will increase the disk loading.
The lift force on a helicopter is dependent upon two factors. First, as the air comes into
contact with the helicopter blades that form the actuator disk, it is deflected downward. Second,

24
Bernoulli’s principle states that air flowing over a curved surface gathers speed but loses
pressure. As a result, low pressure exists above the actuator disk. The high pressure that builds
up below the disk wants to move towards the low pressure, and in the process of this movement,
lift is generated (Scott, 2001).
For an airfoil, the lift force can be calculated by:
In this equation, the density of air, ρ, is multiplied by the square of the true air speed, v, the plan
form area, A, and the lift coefficient, CL, at the desired angle of attack. In order to calculate this
force, the desired angle of attack of the desired air speed must be decided. These values
typically depend on existing designs in the engine market. The parameters can be optimized to a
certain extent, but they cannot exceed the angle of attack at which the engine would stall out.
For the NACA 0015 airfoil, the maximum angle of attack is 20 degrees. As a result, the lift force
must occur at an angle of attack of less than 20 degrees and at a true air speed that is competitive
with existing technologies.
3.6 Dynamometer Testing
This section of the report discusses the dynamometer testing that was performed on the
current NorEaster Engine.
3.6.1 Procedure
A purpose-built dynamometer was created with the assistance of the O’Neill Motor
Company, Inc. to gather experimental data on the NorEaster’s current output power. A DC
motor was used as a generator. We recorded voltage across four resistors, shown in Figure 16,
and measured the current through the circuit.

25
Figure 16: Circuit Board Used for the Dynamometer Test Performed on the NorEaster Engine
The current was measured with an ammeter. The voltage was measured with a voltmeter. The
rpm of the engine was measured with a tachometer. In an effort to obtain accurate and consistent
data, the current, voltage and engine rpm were recorded when there was a no-slip condition on
the belt connected to the generator.
Once all of the data was recorded, the power was calculated using the equation,
Where P represents power measured in Watts; I represents current measured in amperes; and V
represents voltage measured in volts. The power was converted from Watts to horsepower and a
linear regression was calculated to compare the output power to the engine rpm. For all
computations, see Appendix B.
3.6.2 Dynamometer Test 1 Results
Once all data were collected and calculated, the rpm data were compared to the
corresponding horsepower data, listed in Table 5.

26
RPM Horsepower
1050 0.68
600 5
500 1.87
760 1.67 Table 5: Comparison of RPM with Corresponding Horsepower
As displayed in Figure 17, there is a negative correlation between horsepower and RPM with a
slope of -0.004561 and a y-intercept of 5.623. This means that the engine’s output power
decreased 0.4561 horsepower for every increase in 100 rpm. It was concluded that the results of
this test were not representative of the engine’s capabilities because the engine was not running
well during this test. A negative slope represents that the input to output power is in an inverse
ratio which should not be the case. Also, the line of best fit for the data points has a low R2 value
of 0.343. For a trend-line to be representative of the data in a scatter plot, the R2 value needs to
be between 0.970 and 1.000.
Figure 17: Graph Comparing Horsepower to RPM
The variation in the collected data may be due to several factors. From examining the
engine during the test, it was determined that only one of the two cylinders in the NorEaster
fired. This is a mechanical failure that must be fixed in order to collect accurate data. Secondly,
the ammeter was did not accurately read any values below 10 amps, which resulted in invalid
0 500 1 103
1.5 103
0
2
4
6
8
10
Dynamometer Test Results
RPM
Ho
rsep
ow
er
Yi
y x( )
Xi 0 x
27
data. Additionally, it was very difficult to confirm a no-slip condition when the friction of the
belt on the motor/generator was only being judged by sight and touch. These variables, along
with the typical human error in reading devices such as ammeters, tachometers, and volt meters,
add up. Finally, in the post-procedure inspections, it was determined that there was too much
fuel in the engine during the combustion stage, since each of the brand new spark plugs was
covered in soot after only having been used for approximately twenty minutes. The combination
of these errors account for the low values recorded.
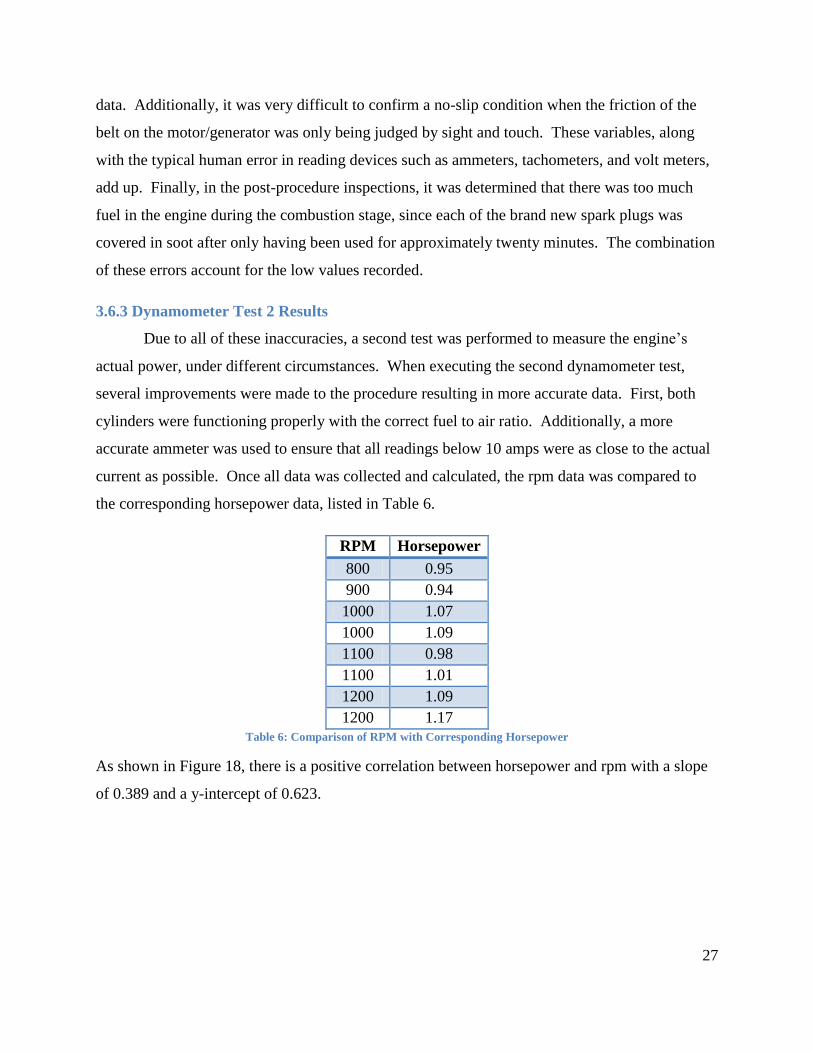
3.6.3 Dynamometer Test 2 Results
Due to all of these inaccuracies, a second test was performed to measure the engine’s
actual power, under different circumstances. When executing the second dynamometer test,
several improvements were made to the procedure resulting in more accurate data. First, both
cylinders were functioning properly with the correct fuel to air ratio. Additionally, a more
accurate ammeter was used to ensure that all readings below 10 amps were as close to the actual
current as possible. Once all data was collected and calculated, the rpm data was compared to
the corresponding horsepower data, listed in Table 6.
RPM Horsepower
800 0.95
900 0.94
1000 1.07
1000 1.09
1100 0.98
1100 1.01
1200 1.09
1200 1.17
Table 6: Comparison of RPM with Corresponding Horsepower
As shown in Figure 18, there is a positive correlation between horsepower and rpm with a slope
of 0.389 and a y-intercept of 0.623.

28
Figure 18: Graph Comparing Horsepower to RPM
This means that the engine’s output power increased by 0.389 horsepower for every increase in
of 100 rpm. The line of best fit for the data points has a low R2 value of 0.476, which is not
within the desired range. Unfortunately, the engine was still not running at its optimal
performance, and the results still have some error in them.
3.7 Pressure Transducer Test
This section of the report provides detail on how the pressure inside one of the cylinder
heads of the NorEaster engine was measured.
3.7.1 Procedure
In order to measure the pressure in the cylinder head as the engine fired, a piezoelectric
Dytran pressure transducer Model 2200C5 was installed flush to the inside surface of the
cylinder head. The pressure transducer’s signal, measured in pC/psi, was relayed to a PCB
Charge Amplifier Model 462S05 as shown in Figure 19, to convert the signal to mV/psi. The
signal from the charge amplifier on the HP Dynamic Signal Analyzer in mV was recorded as a
function of time, shown in Figure 20. The mV reading was converted to psi using a 6.22 mV/psi
conversion factor, which was determined by the calibration method described in the following
paragraph.

29
Figure 19: PCB Charge Amplifier Model 462S05
Figure 20: HP Signal Analyzer

30
In order to calibrate the Dytran pressure transducer, a strain gauge pressure transducer,
model BLH-PR034, and the Dytran transducer, shown in Figure 21, were simultaneously
subjected to the same static pressure from an air hose. The pressure was released suddenly and
data from both pressure transducers, Dytran (V) and Strain Gauge (psi), were recorded as a
function of time. The calibration factor of the Dytran pressure transducer was calculated by
dividing the change in voltage of the Dytran pressure transducer by the change in psi of the strain
gauge pressure transducer. Three calibration tests were run to minimize error yielding an
average calibration factor of 6.22 mV/psi.
Figure 21: The Valve and Gage Used to Calibrate the Pressure Transducer
In order to pinpoint the piston’s location at TDC in relation to the pressure readings, a
Shaft Encoder Model 776, shown in Figure 22, was mounted on the outer rotating shaft that is
attached to the cam. The signal from the shaft encoder was recorded simultaneously with the
pressure transducer in the same signal analyzer as a function of time.

31
Figure 22: Shaft Encoder Model 776 Mounted on the NorEaster Engine
The first test was completed without the cylinder heads firing, allowing for a comparison
between the pressure test and compression test data. Two more relevant tests were performed
and recorded. The data was collected taking pressure measurements at a rate of 16,384 Hz.
After the first test, we noticed that only the cylinder with the pressure transducer in it was firing.
The first test results were compared to the results of a second test in which the spark plug was
removed from the cylinder that was not firing.
3.7.2 Pressure Transducer Test Results
Figure 23 shows the pressure measurements of the motoring NorEaster engine. The
pressure data is displayed by the line labeled A, and the shaft encoder index is represented by the
line labeled B. The sharp increase in the index represents when the piston is at top-dead center
during the power stroke. The peak values of each pressure curve demonstrate that the maximum
pressure during compression is approximately 139.9 psi. A pressure test was run with the engine
firing, shown in Figure 24, using the same setup as the compression test. As exhibited in the
graph, the engine fired after top-dead center at a pressure of 75 psi. We noticed a significant
Shaft Encoder

32
discrepancy between the peak compression values in these two tests. These tests were performed
one after the other with the same setup. At this time the team does not have a solution for why
there is a significant difference in compression pressures between the two tests. Also, both of the
compression pressures measured with the Dytran pressure transducer were different than the
113.5 psi value measured with the mechanical compression tester. Since the two methods of
testing the compression pressure in the cylinder were different, it is reasonable for there to be a
variance in the compression pressures. However, more testing would need to be done to
determine why the difference between the measured pressures was so large.
Figure 23: Pressure Data: Compression Test
0
20
40
60
80
100
120
140
160
0 0.1 0.2 0.3 0.4 0.5 0.6 0.7 0.8
Pre
ssu
re (
psi
)
Time (sec)
Compression Test
Pressure (Psi)
Encoder Index
A
B
B

33
Figure 24: Pressure Data: Retarded Spark with Low Time Resolution
Figure 25 shows the recorded pressures during the two trials for a cylinder firing when
the piston was at TDC. The first trial, labeled B, included both spark plugs, and the second trial,
labeled A, included only one spark plug in. Again the shaft encoder, labeled C, was used to
determine where top-dead center occurred during the tests. The time scale resolution was set to
16,384 Hz during these two trials, and the greatest time scale in which the pressures from two
compression strokes were recorded. This allowed for more accurate pressure measurements.
The data collected from one test to the next is consistent and the difference in the peak pressure
with one spark plug or two is negligible. The average maximum pressure was 341.1 psi.
0
50
100
150
200
250
300
0.00 0.05 0.10 0.15 0.20 0.25
Pre
ssu
re (
psi
)
Time (sec)
Retarded Spark with Low Time Resolution
Pressure (psi)
Encoder Index
A
B

34
Figure 25: Pressure Data: Advanced Spark with High Time Resolution
The turning force, displayed in Figure 26, was calculated from the product of the pressure
from the pressure test, the area of the piston, and the tangent of the pressure angle. From this
calculation, the maximum force which was turning the cam was 2173 N. To find the torque, the
turning force was multiplied by the radius of the cam at that given time. The maximum torque
from the torque graph, shown in Figure 27, for the calibration was 333.2 N*m.
0
50
100
150
200
250
300
350
400
0.00 0.05 0.10 0.15 0.20 0.25
Pre
ssu
re (p
si)
Time (sec)
Advanced Spark with High Time Resolution
1 Spark Plug
2 Spark Plugs
Encoder Index
A B
C
A
B
C

35
Figure 26: Calibration Turning Force
Figure 27: Calibration Torque

36
For the remaining trials, we manually calculated the maximum turning force and torque.
A summary of these values for the other trials are shown in Table 7.
Max Pressure (psi)
Turning Force (N)
Torque (N*m)
Calibration 139.1 2173 333.2
Retarded Spark 265.8 4151 636.6
Somewhat Advanced
263.1 4109 630.1
Advanced 347.6 5428 832.5
Advanced 1 Plug 338.1 5280 809.7 Table 7: Pressure, Turning Force, and Torque Summation
37
4.0 Results
The following section of the report provides conclusions and recommendations for a
future NorEaster engine design. In order to assess the possibilities for the NorEaster engine, we
developed two mathematical models to analyze the differences between a gasoline and diesel
engine. The military has expressed a minimum desired power to weight ratio of 0.5. Upon
analyzing these variables, we developed several conclusions about future designs for the
NorEaster engine.
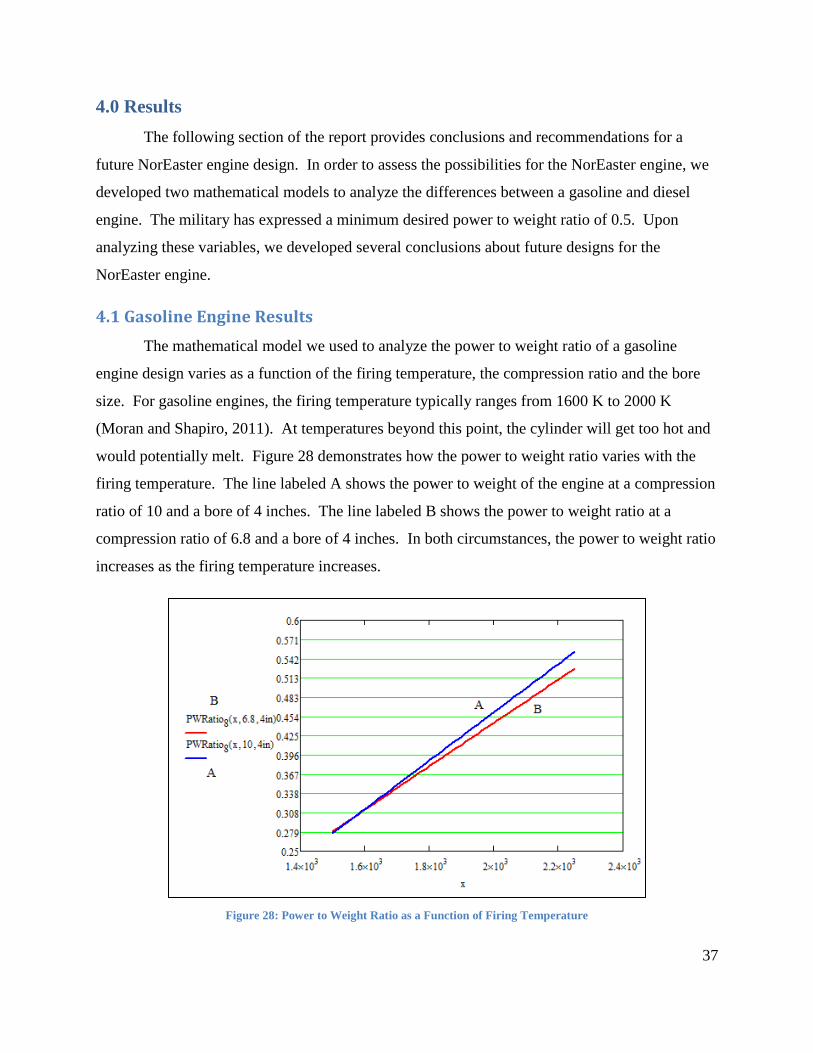
4.1 Gasoline Engine Results
The mathematical model we used to analyze the power to weight ratio of a gasoline
engine design varies as a function of the firing temperature, the compression ratio and the bore
size. For gasoline engines, the firing temperature typically ranges from 1600 K to 2000 K
(Moran and Shapiro, 2011). At temperatures beyond this point, the cylinder will get too hot and
would potentially melt. Figure 28 demonstrates how the power to weight ratio varies with the
firing temperature. The line labeled A shows the power to weight of the engine at a compression
ratio of 10 and a bore of 4 inches. The line labeled B shows the power to weight ratio at a
compression ratio of 6.8 and a bore of 4 inches. In both circumstances, the power to weight ratio
increases as the firing temperature increases.
Figure 28: Power to Weight Ratio as a Function of Firing Temperature
38
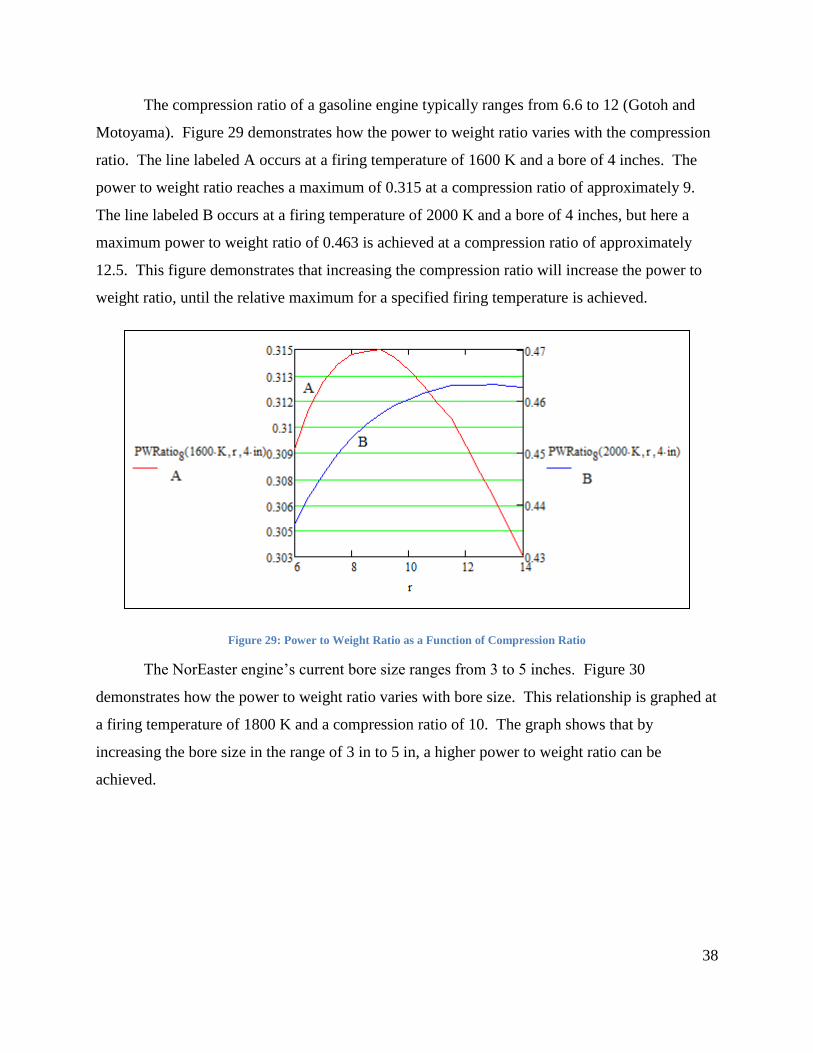
The compression ratio of a gasoline engine typically ranges from 6.6 to 12 (Gotoh and
Motoyama). Figure 29 demonstrates how the power to weight ratio varies with the compression
ratio. The line labeled A occurs at a firing temperature of 1600 K and a bore of 4 inches. The
power to weight ratio reaches a maximum of 0.315 at a compression ratio of approximately 9.
The line labeled B occurs at a firing temperature of 2000 K and a bore of 4 inches, but here a
maximum power to weight ratio of 0.463 is achieved at a compression ratio of approximately
12.5. This figure demonstrates that increasing the compression ratio will increase the power to
weight ratio, until the relative maximum for a specified firing temperature is achieved.
Figure 29: Power to Weight Ratio as a Function of Compression Ratio
The NorEaster engine’s current bore size ranges from 3 to 5 inches. Figure 30
demonstrates how the power to weight ratio varies with bore size. This relationship is graphed at
a firing temperature of 1800 K and a compression ratio of 10. The graph shows that by
increasing the bore size in the range of 3 in to 5 in, a higher power to weight ratio can be
achieved.

39
Figure 30: Power to Weight Ratio as a Function of Bore Size
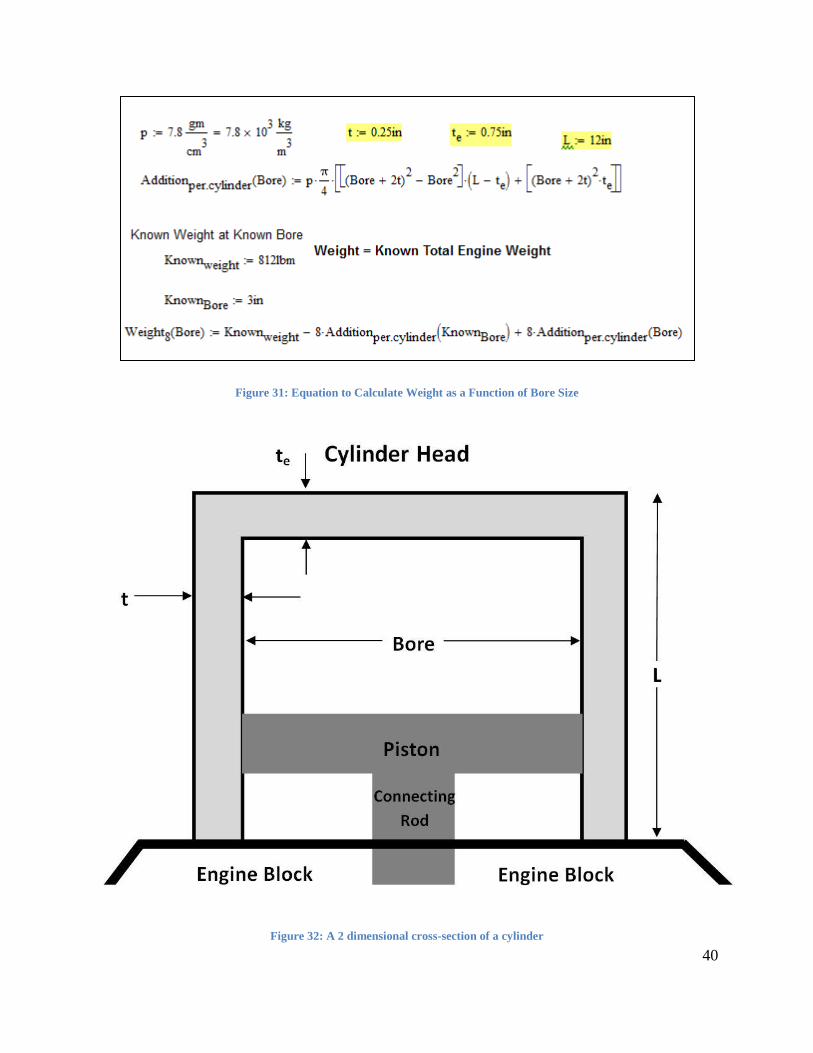
Additionally, the weight of the engine is dependent upon the bore. The NorEaster Design
team gave us the weight from their calculations of a 4 inch bore NorEaster engine experiencing
diesel forces. Figure 31 demonstrates the calculation that was used to estimate the weight of a 3
inch and 5 inch engine. The total weight of the engine is calculated under the assumption that
everything aside from the cylinder will not change drastically by increasing the bore size. Wall
thickness is assumed to be 0.25 inches and the thickness of the top of the cylinder, te, is assumed
to be 0.75 inches. The length of the cylinder was measured to be 12 inches. Figure 32 is a two-
dimensional cross-section of the cylinder. As a result of this equation, the power to weight ratio
is more accurate for different bore sizes.
40
Figure 31: Equation to Calculate Weight as a Function of Bore Size
Figure 32: A 2 dimensional cross-section of a cylinder

41
4.1.1 Current Gasoline Engine Results
Our model predicts a power to weight ratio of 0.259 for an eight cylinder Army head
gasoline NorEaster engine. This would occur at a measured bore of 3 inches, a compression
ratio of 6.8 and a firing temperature of 2000 K. This calculation can be seen in Appendix C.
We expect a new NorEaster engine design to be able to achieve a power to weight ratio
of approximately 0.46 with a 4 inch bore, a 3 inch stroke, a compression ratio of 10 and a firing
temperature of 2000 K.
4.2 Diesel Engine Results
Diesel engines have a higher efficiency than gasoline engines, and diesel fuel is non-
explosive. The ideal efficiency for a diesel engine is 56% (Office of Energy Efficiency and
Renewable Energy, 2003). However, an average achievable efficiency for a diesel engine is
45% (Office of Energy Efficiency and Renewable Energy, 2003). Therefore, we performed a
mathematical analysis for a diesel NorEaster engine.
The mathematical model that was used to analyze the power to weight ratio of a diesel
engine design varies as a function of the cut-off ratio, the compression ratio and the bore size.
The cut-off ratio represents the ratio of the volume in the cylinder at the start of ignition to the
volume at the end of ignition (Engineering Software). For diesel engines, the cut-off ratio
typically ranges from 1.5 to 3.5 (Engineering Software). Figure 33 demonstrates how the power
to weight ratio varies with the cut-off ratio rc. The solid line depicts a compression ratio of 20
and a bore of 4 inches. The dotted line is the power to weight ratio derivative at the same
conditions. Figure 33 shows that the cut-off ratio increasing linearly until 2.5 and then behaves
parabolic. The optimal cut-off ratio for highest power to weight ratio is 2.75.
Figure 33: Power to Weight Ratio as a Function of Cut-Off Ratio

42
The compression ratio on a diesel engine typically ranges from 14 to 24 (Engineers Edge,
2012). Figure 34 demonstrates how the power to weight ratio varies with the compression ratio.
The line occurs at a cut-off ratio of 2.75 and a bore of 4 inches. The power to weight ratio
reaches a maximum of 0.492 at a compression ratio of approximately 20. This figure
demonstrates that increasing the compression ratio will increase the power to weight ratio, until
the relative maximum for a specified cut-off ratio is achieved.
Figure 34: Power to Weight Ratio as a Function of Compression Ratio
Similarly to the gasoline engine, the range of bore sizes on a diesel NorEaster engine
varies from 3 to 5 inches. Figure 35 demonstrates how the power to weight ratio varies with
bore size. The line occurs at a cut-off ratio of 2.75 and a compression ratio of 20. With our
weight estimates, a power to weight ratio of 0.49 can be achieved at a bore of approximately 4
inches. This graph shows that by increasing the bore size within the range of 3 in to 5 in, a
higher power to weight ratio can be achieved.
Figure 35: Power to Weight Ratio as a Function of Bore Size

43
As with the gasoline engine, the weight of the diesel engine is dependent upon the bore.
Figure 31 in Section 4.1 demonstrates the calculation that was used to obtain the weight.
4.3 Overall Findings for the NorEaster Engine Designs
The weights calculated in Sections 4.1 and 4.2 used a safety factor of 2 for most of the
components. The lowest safety factor was 1.5. This results in a conservative weight estimate and
a lower power to weight ratio than with a lower safety factor. Typically, aircraft have a safety
factor of 1.5 (Acar et al., 2004). Table 8 is a table comparing the different weights and power to
weight ratios that can be calculated for both gasoline and diesel engines at varying various
engine design parameters. Table 8 provides a summary of these values. Out of the four
NorEaster engine configurations shown below, the best power to weight ratio is the 4 inch bore
diesel engine. This will give a power to weight ratio of 0.49.
Fire Scout NorEaster Diesel NorEaster Gasoline
3 in Bore 4 in Bore 3 in Bore 4 in Bore
Engine Weight (lb) 173 812 842.5 812 842.5
Power (hp) 419.7 233 414 218.2 388
Power to Weight 2.43 0.29 0.49 0.27 0.46
Table 8: Comparison of the Power to Weight Ratios at Different Weight and Engine Parameters
Table 8 also demonstrates the vast differences in the power to weight of the Fire Scout
turbine engine to the NorEaster engine. The Fire Scout has a power to weight ratio of 2.43.
However, this power to weight ratio does not include the weight of the transmission, gearing, or
tail rotor. These components would not be needed in the NorEaster engine design. Therefore,
comparing these two values is misleading.
Table 9 shows both the power to weight of the Fire Scout at its minimum and maximum
weight. These two values are 0.2 and 0.13 respectively, which are significantly less than the
power to weight of the engine shown in Table 8. Additional weight of the NorEaster can be
attributed to the specific needs of the consumer. To have a better power to weight ratio (horse
power divided by total helicopter weight) than the current Fire Scout, the NorEaster’s total
weight would need to be under 2045 pounds. Since the engine would weigh just under 900
pounds, the additional components would need to be less than 1145 pounds. Because the

44
NorEaster does not require a tail rotor, transmission or gearing, it is difficult to compare the Fire
Scout and the NorEaster without all of Sikorsky’s information.
Fire Scout
Empty Weight (lb) 2073
Power to Empty Weight of Fire Scout 0.2
Max Takeoff Weight (lb) 3150
Power to Max Takeoff Weight of Fire Scout 0.13
Table 9: Fire Scout Power to Weight

45
5.0 Conclusions and Recommendations
The goal of this project was to model the thermodynamic behavior of the NorEaster
engine, calculate the power to weight ratio, and assess its future development possibilities. In
order to perform this calculation, we developed two mathematical models using Mathcad, one
for a diesel engine design and one for a gasoline engine design. Both of these models use air-
standard Otto Cycle analysis to calculate the engine’s output power and then divide that value by
the weight, which was calculated by the NorEaster Design team.
In order to generate these models, we studied the existing prototype of the NorEaster
engine. First, the team analyzed the rotor blades used on the engine. These blades resemble the
NACA0015 airfoils used on aircraft. They are appropriate because they will minimize engine
stalls, and they will help maximize the revolutions per minute.
To further assess the existing NorEaster engine prototype, we performed a dynamometer
test and a pressure test. Unfortunately, these test results showed that there are several problems
and inefficiencies in the prototype. During these tests, we encountered problems due to leaks
and the fact that only one cylinder was regularly firing. While the output power does increase
with rpm, it was not as large an increase as expected. Additionally, the motoring pressure in the
cylinder heads was lower than anticipated. We do not yet have any ample explanation for these
discrepancies in data, but believe that some of them can be attributed to the flaws in the
prototype.
Despite these flaws in the prototype, the team analyzed new designs of the NorEaster
engine. These new designs need to meet the United States Military’s desired power to weight
ratio of 0.5. The Design Team’s NorEaster engine with a 4 inch bore and gasoline fuel generates
a power to weight ratio of 0.46. The same engine running on diesel fuel generates a power to
weight of 0.49. Both of these designs utilize a 2.0 safety factor for most components. The lowest
safety factor in the design is 1.5. The materials selections and safety factor of the engine could
be altered to reduce the weight and thus increase the power to weight ratio. From our calculated
power, we determined that the NorEaster weight would need to be reduced by approximately 15
pounds in order to achieve a power to weight of 0.5. Therefore, we recommend building a larger

46
prototype of the engine with a lower safety factor and ideal engine parameters. This new
prototype could be tested and compared to our mathematical model’s power estimates.
Since the NorEaster engine does not utilize a tail rotor, transmission or gears, we also
recommend obtaining the weight of these components for Sikorsky’s current Fire Scout. This
information will give a clear representation of the advantages and disadvantages of the NorEaster
engine and allow us to better compare the two aircraft.

47
6.0 References
Acar, E., Haftka, R.T. and Kale, A. (2004) “Effects of Error, Variability, Testing and Safety
Factors on Aircraft Safety.” Department of Mechanical and Aerospace Engineering,
University of Florida: Florida Accessed March 22, 2012. http://savannah.gatech.edu/
workshop/rec04/proceedings/papers/Acar_effects_of_error.pdf
CSEE. “NACA 0015.” UMBC: Maryland. Accessed April 25, 2012.
http://www.csee.umbc.edu/~squire/cs455_lairfoil.shtml
Drela, Mark. (2001) “X-Foil 6.94.” MIT Software and Programming. Accessed October 6, 2011.
http://web.mit.edu/drela/Public/web/xfoil/
Dyno Simulation Software. (2007) “Virtual Engine Software.” Challenger Engine Software.
Accessed October 2, 2011.http://www.virtualengine2000.com/Calculator.htm
Engineering Software. “Diesel Cycle Analysis.” Engineering-4e. Germantown, MD. Accessed
February 23, 2012.http://www.engineering-4e.com/diesel.pdf
Engineers Edge. (2012) “Diesel Engine Construction and Operation.” Engineers Edge, LLC:
Solutions By Design. Accessed February 23, 2012.
http://www.engineersedge.com/power_transmission/diesel_engine.htm
Glenn Research Center. (2008) “Ideal Otto Cycle.” NASA. Accessed October 5, 2011.
http://wright.nasa.gov/airplane/otto.html
Gotoh, T. and Motoyama, Y. “The Effect of Higher Compression Ratio in Two-Stroke Engines.”
Yamaha motor Co, Ltd. Accessed February 23, 2012.
http://www.drrinc.com/pdfs/higher_compression6.pdf
Heywood, John. (1988) “Internal Combustion Engine Fundamentals.” McGraw-Hill Book
Company: New York
Loeffler, K. (2003) “Internal Combustion Engine.” Explore Cornell. Accessed October 5,
2011.http://ecommons2.library.cornell.edu/web_archive/explore.cornell.edu/scenedd12.h
48
tml?scene=Digital%20Library%20of%20Kinematics&stop=DLK%20-
%20Gallery&view=DLK%20-%20Gallery%2006
MIT: Massachusetts Institute of Technology. (2006) “Thermodynamics and Propulsion.”
Accessed December 7, 2011.http://web.mit.edu/16.unified/www/SPRING/
propulsion/notes/node25.html
Military Factory. (2010) “General Atomics MQ-1/RQ-1 Predator (Predator A) Unmanned Aerial
Vehicle.” Accessed November 10, 2011.
http://www.militaryfactory.com/aircraft/detail.asp?aircraft_id=46
Moran, M. and Shapiro, H. (2011) “Fundamentals of Engineering Thermodynamics.” 7th
Edition.
John Wiley & Sons, Inc: United States of America.
Northrop Grumman. (2011). “MQ-8B Fire Scout.” Accessed November 7, 2011.
http://www.as.northropgrumman.com/products/mq8bfirescout_navy/index.html
O’Neill, James. (2007) U.S. Patent No. 7,219,631 B1. “High Torque, Low Velocity, Internal
Combustion Engine.”
Office of Energy Efficiency and Renewable Energy. (2003) “Just the Basics: Diesel Engine.”
U.S. Department of Energy. Accessed February 23, 2012.
http://www1.eere.energy.gov/vehiclesandfuels/pdfs/basics/jtb_diesel_engine.pdf
Ricardo. (2011) “Engine Performance.” Ricardo Software. Accessed October 2,
2011.http://www.ricardo.com/en-gb/What-we-
do/Software/Products/WAVE/EnginePerformance/
Scott, Jeff. (2001) “Helicopter Lift Equation.” Accessed December 8,
2011.http://www.aerospaceweb.org/question/aerodynamics/q0037.shtml
Sikorsky. (2011) “Product Innovation: X2 Technology Demonstrator.” United Technologies
Company. Accessed November 13, 2011.http://www.sikorsky.com/Innovation/
Vision+of+the+future/Technologies/X2+Technology

49
Stone, Richard. (1999) “Introduction to Internal Combustion Engines.” 3rd
Edition. Society of
Automotive Engineers, Inc.: Great Britain.
Taylor, Charles. (1985). “The Internal Combustion Engine in Theory and in Practice. “Volume
1.The M.I.T. Press. Cambridge, MA.
Taylor, Charles. (1985). “The Internal Combustion Engine in Theory and in Practice. “Volume
2.The M.I.T. Press. Cambridge, MA.
UAV Engines LTD. (2004) “AR741-38 BHP – For Small Surveillance UAVs” UAV Engines
LTD: United Kingdom. Accessed October 1, 2011.
http://www.uavenginesltd.co.uk/index.php?id=397
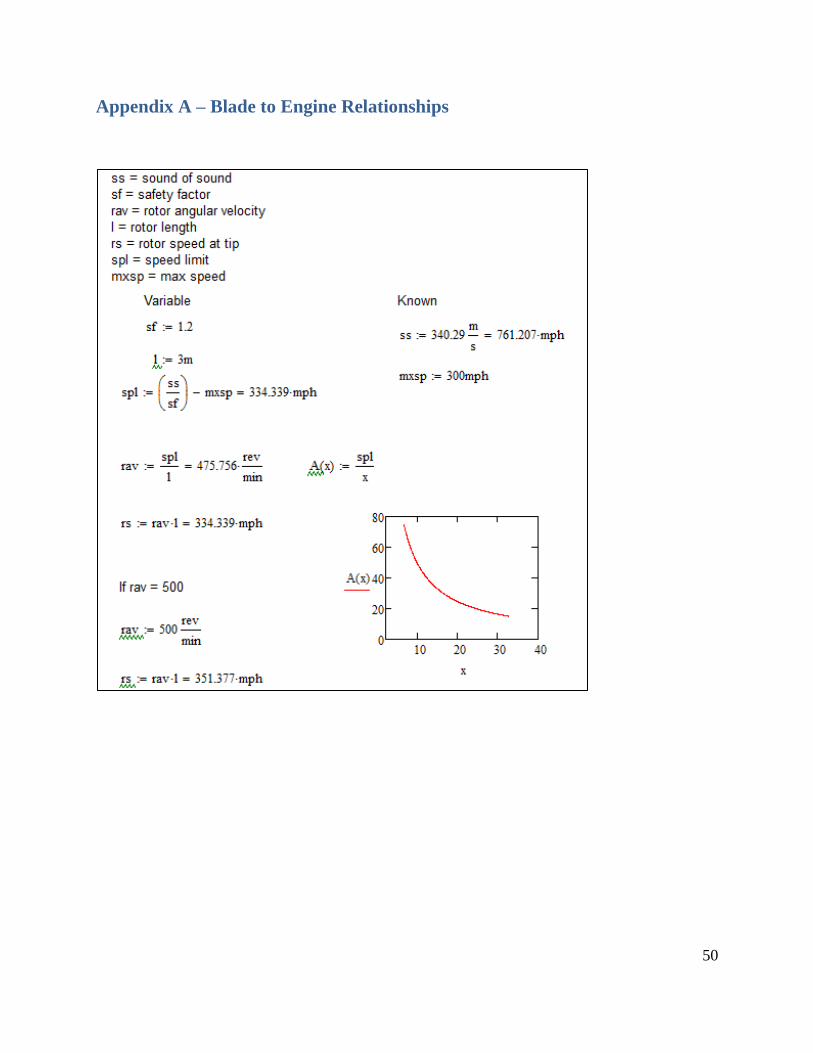
50
Appendix A – Blade to Engine Relationships

51
Appendix B – Dynamometer Mathcad
Dynamometer Test 1 Calculations and Results

52
0 500 1 103
1.5 103
0
2
4
6
8
10
Dynamometer Test Results
RPM
Ho
rsep
ow
er
Yi
y x( )
Xi 0 x
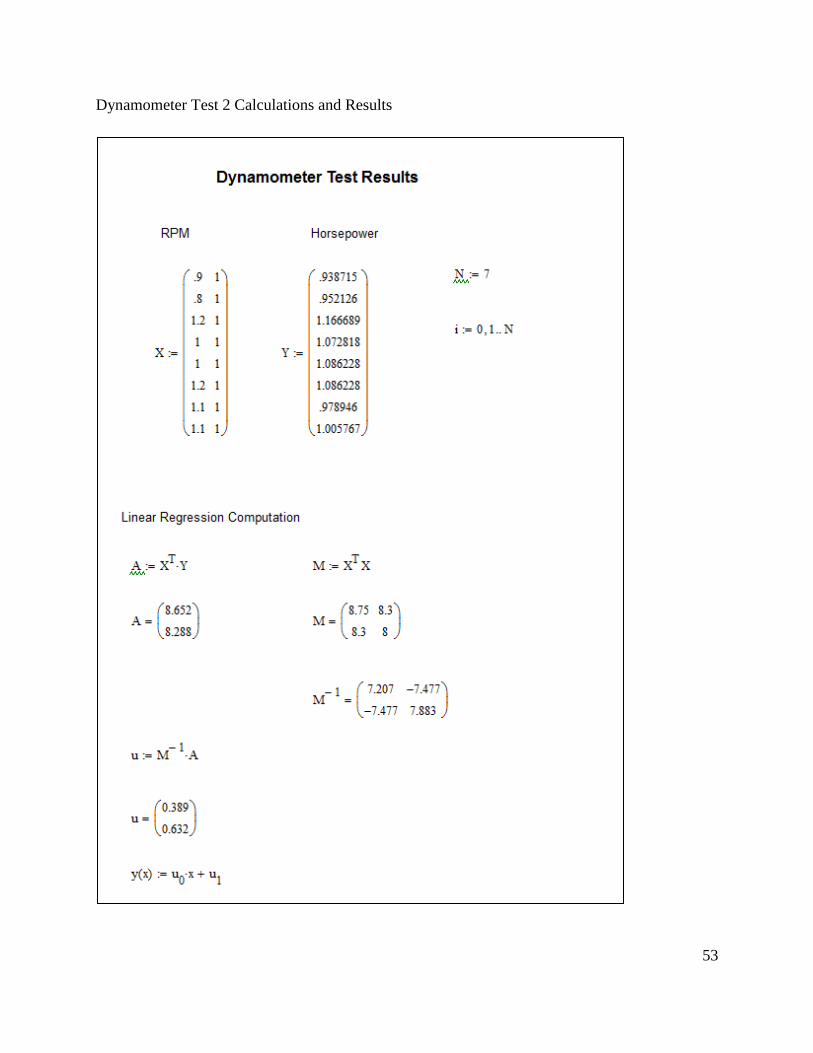
53
Dynamometer Test 2 Calculations and Results
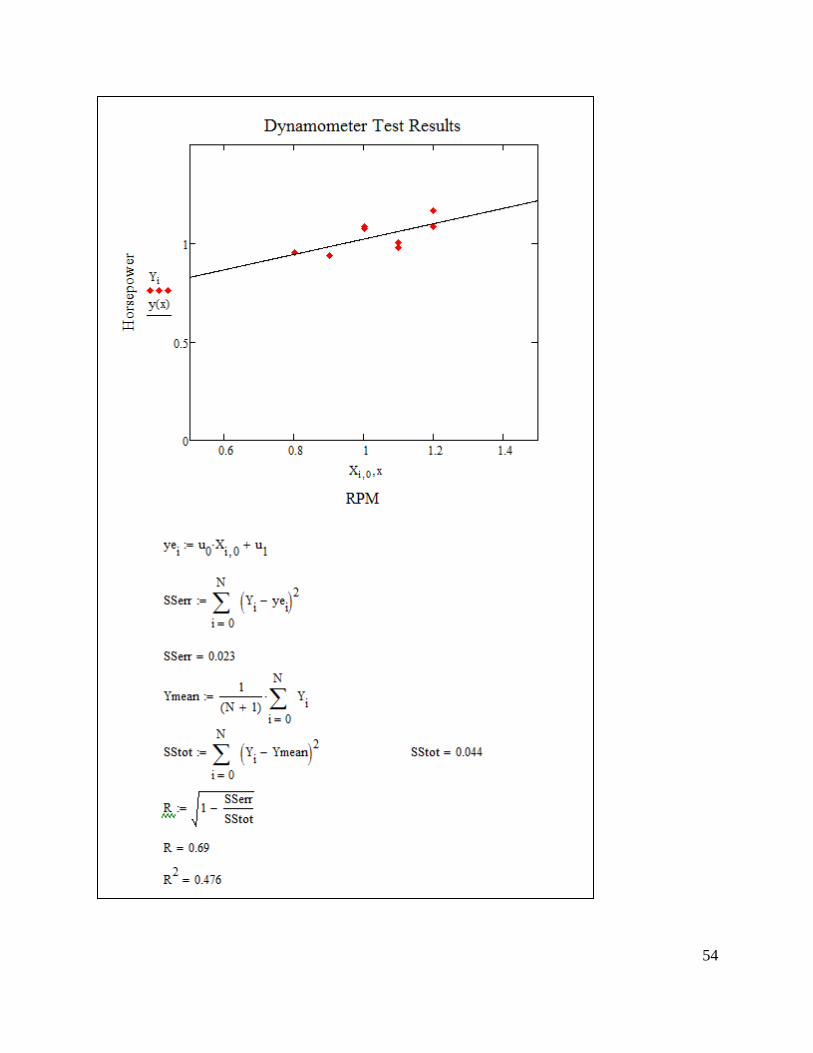
54

55
Appendix C – Gasoline and Diesel Mathematical Models
Gasoline Engine Model
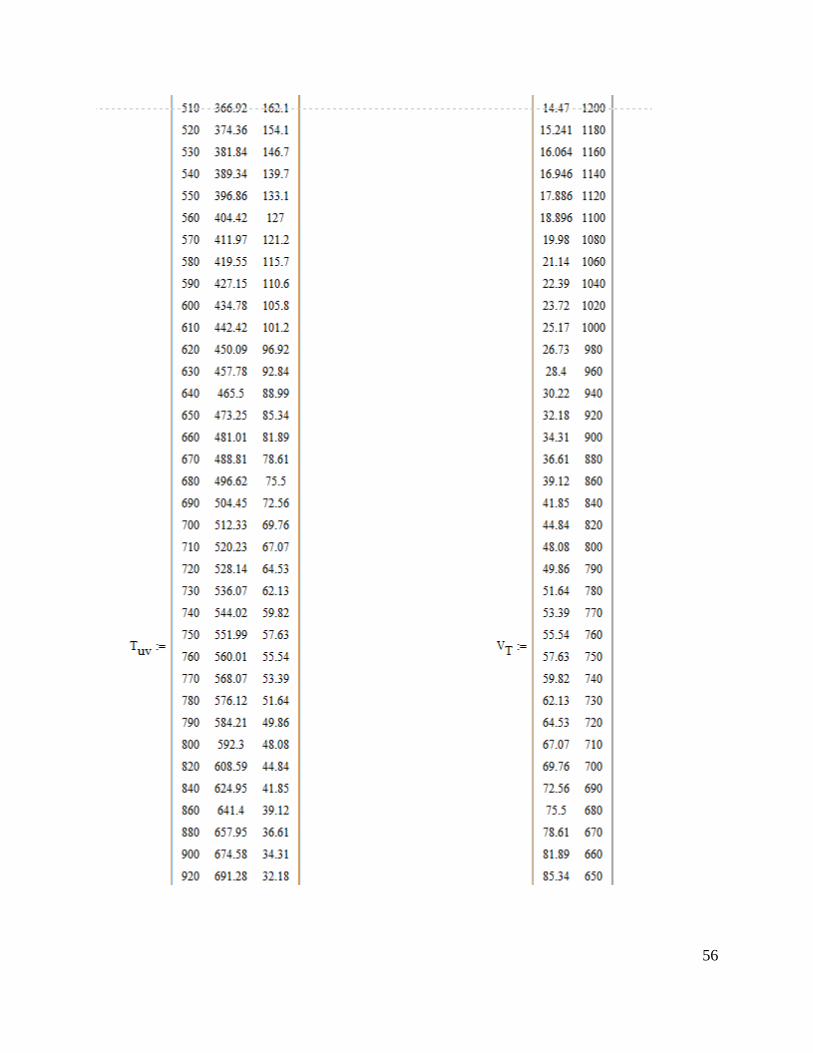
56

57

58
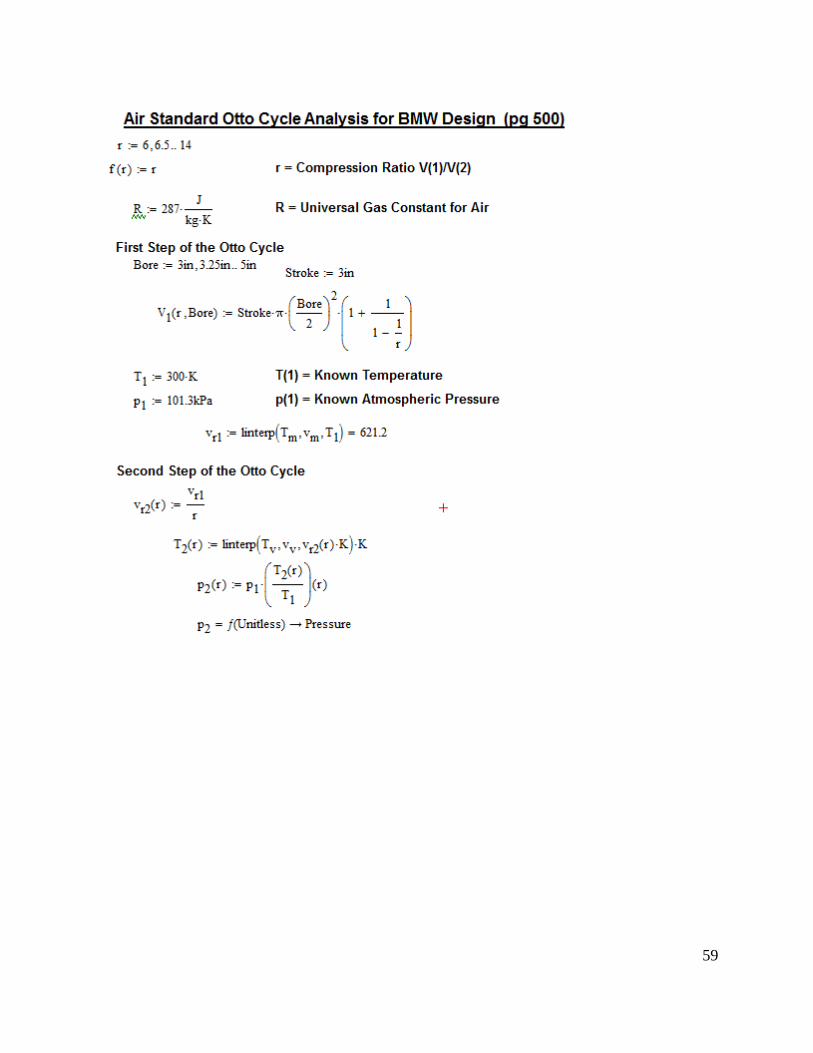
59

60

61
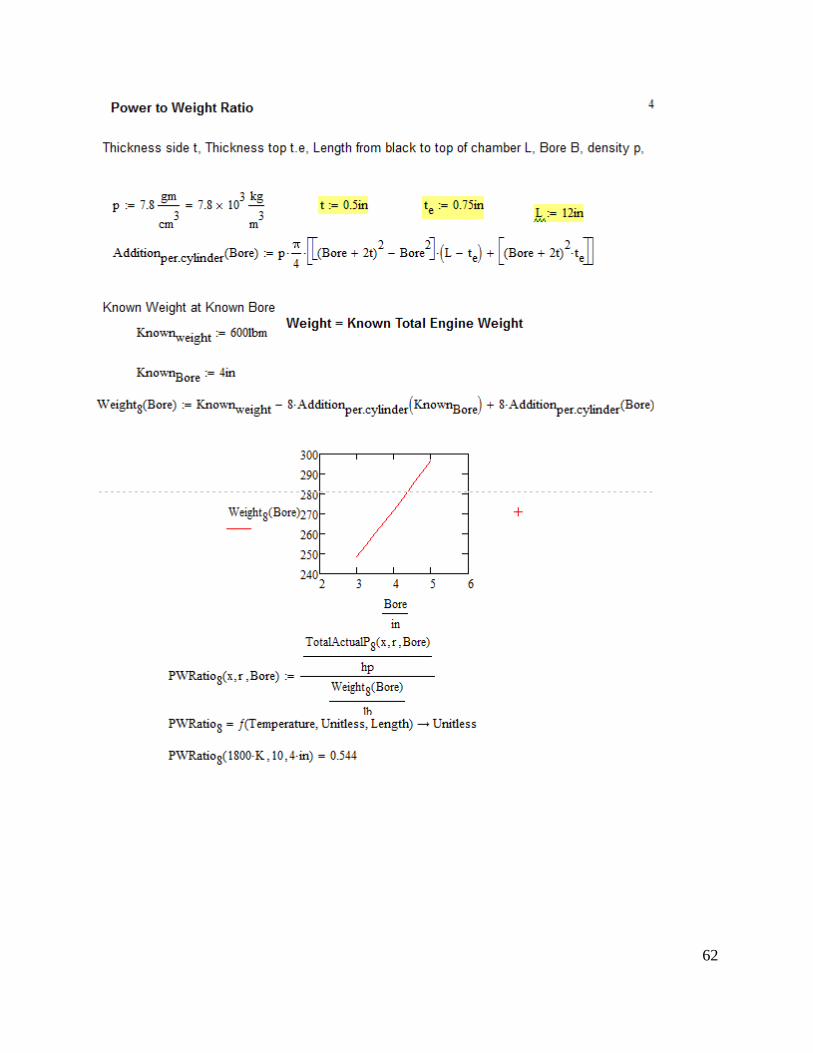
62
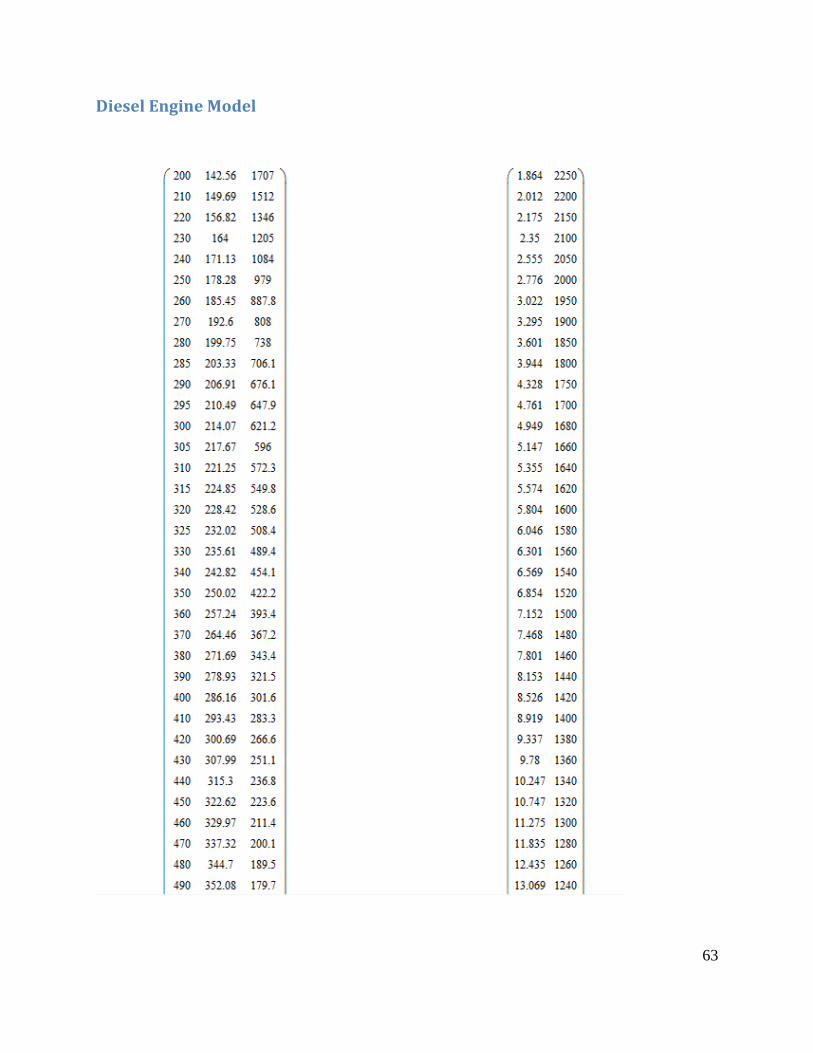
63
Diesel Engine Model

64

65

66

67
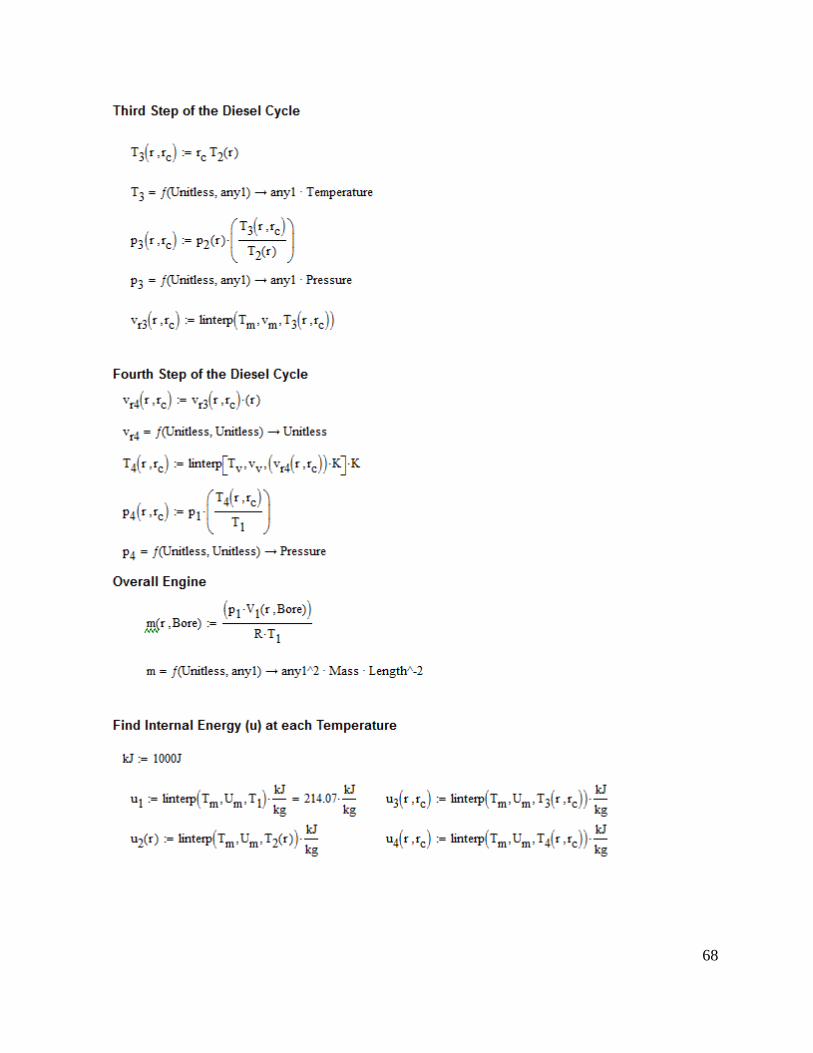
68

69

70

71
Related Documents