HAL Id: tel-01712350 https://tel.archives-ouvertes.fr/tel-01712350 Submitted on 19 Feb 2018 HAL is a multi-disciplinary open access archive for the deposit and dissemination of sci- entific research documents, whether they are pub- lished or not. The documents may come from teaching and research institutions in France or abroad, or from public or private research centers. L’archive ouverte pluridisciplinaire HAL, est destinée au dépôt et à la diffusion de documents scientifiques de niveau recherche, publiés ou non, émanant des établissements d’enseignement et de recherche français ou étrangers, des laboratoires publics ou privés. Modeling the lean organization as a complex system Pierre Masai To cite this version: Pierre Masai. Modeling the lean organization as a complex system. Computational Complexity [cs.CC]. Université de Strasbourg, 2017. English. NNT : 2017STRAD029. tel-01712350

Welcome message from author
This document is posted to help you gain knowledge. Please leave a comment to let me know what you think about it! Share it to your friends and learn new things together.
Transcript
HAL Id: tel-01712350https://tel.archives-ouvertes.fr/tel-01712350
Submitted on 19 Feb 2018
HAL is a multi-disciplinary open accessarchive for the deposit and dissemination of sci-entific research documents, whether they are pub-lished or not. The documents may come fromteaching and research institutions in France orabroad, or from public or private research centers.
L’archive ouverte pluridisciplinaire HAL, estdestinée au dépôt et à la diffusion de documentsscientifiques de niveau recherche, publiés ou non,émanant des établissements d’enseignement et derecherche français ou étrangers, des laboratoirespublics ou privés.
Modeling the lean organization as a complex systemPierre Masai
To cite this version:Pierre Masai. Modeling the lean organization as a complex system. Computational Complexity[cs.CC]. Université de Strasbourg, 2017. English. �NNT : 2017STRAD029�. �tel-01712350�
UNIVERSITÉ DE STRASBOURG
ÉCOLE DOCTORALE 269 Mathématiques, Sciences de l’Information et de l’Ingénieur
[Laboratoire ICube]
THÈSE présentée par :
Pierre MASAI
soutenue le 29 septembre 2017
pour obtenir le grade de : Docteur de l’université de Strasbourg Discipline/ Spécialité : Informatique
MODELING THE LEAN ORGANIZATION AS A COMPLEX SYSTEM
THÈSE dirigée par : Professeur Pierre COLLET Université de Strasbourg Et co-encadrée par : Dr Pierre PARREND Enseignant-Chercheur, Laboratoire ICube/ ECAM Strasbourg-Europe RAPPORTEURS : Professeur Daniel T. JONES Lean Enterprise Academy Dr Roger WALDECK Maître de conférences,
Institut Mines Telecom Atlantique
EXAMINATEURS : Professeur Cecilia ZANNI-MERK INSA Rouen-Normandie, présidente du jury Dr Paul BOURGINE Ecole Polytechnique, Paris Dr Véronique THOMAS-VASLIN Chercheur au CNRS, UPMC/INSERM, Paris

2
To my late father, François Masai (Professor in the History of Philosophy at the Free University
of Brussels) who tasked me on his deathbed in 1979 to do not one, but two PhD’s in order to
maximize the potential of interdisciplinary innovation.
To my wife, Bai Haiyan (白海燕 - White Sea Swallow), my children Cyril and Sacha and my
whole family, who endured and supported my four years of hard labor and very little time to
relax or take vacation with them.
3
Acknowledgements
A big thank you to Dr Pierre Parrend, who brought me to Strasbourg after watching the video
of my presentation at the Lean IT Summit 2012 and constantly encouraged and supported me
through this work.
Thank you to Professor Pierre Collet, who communicated his enthusiasm of complex systems
to me and made me believe in my capability to achieve a PhD on this subject next to my full-
time job at Toyota, as well as to Dr Paul Bourgine and Dr Roger Waldeck who shared their
insights on complex systems with me.
Thank you to Professor Cecilia Zanni-Merk, who accompanied me during the first year of thesis
and brought me back to the academic discipline that my long industrial life had made me lose
sight of.
Thank you to Dr Véronique Thomas-Vaslin for her kindness and patience in introducing me to
the world of biology and immune systems which was totally new to me.
Thank you to my mentor (sensei) at Toyota, Nobukazu Chiba, who taught me the Toyota Way.
As required, he did it in a tough, but thorough way and nurtured my passion for it. Thank you
also to Kazuhiro Shibutani, Teruyoshi Fujiwara and all my Japanese colleagues who tirelessly
answered my questions about the true meaning and origin of Japanese terminology over my
thirteen years at Toyota.
Thank you to Daniel T. Jones for his constant support and kindness despite being constantly
solicited as an authority on lean.
Thank you to Mark Antrobus, Philip Rademakers and Nicolas Toussaint who supported me for
IT technical matters, to Maria Patricio and the Toyota Motor Europe employees for the eHoshin
experiment as well as to the organizations using the eHoshin open source application, and to
Mark Mildon for his valuable corrections from Toyota and English language standpoints.
And, last but not least, thanks to my management at Toyota, Didier Leroy, Dr Johan van Zyl
and Andy Pfeiffenberger, who encouraged me and supported me to pursue this demanding
activity on top of my work.

5
Table of Contents Table of Contents ..................................................................................................................... 5
List of Figures ........................................................................................................................... 8
List of Tables ............................................................................................................................. 9
Foreword .................................................................................................................................. 10
Introduction .............................................................................................................................. 11
First Part: State of the Art ..................................................................................................... 17
1 What is lean? ..................................................................................................................... 19
1.1 Short History of lean ................................................................................................. 19
1.2 Bibliography of lean ................................................................................................. 21
1.2.1 Industrial Context .............................................................................................. 21
1.2.2 Academic Context ............................................................................................. 25
1.2.3 Online resources about lean .............................................................................. 28
1.2.4 Conferences on lean .......................................................................................... 28
1.3 Lean for several organization types .......................................................................... 28
1.3.1 Industry ............................................................................................................. 29
1.3.2 Information Technology ................................................................................... 29
1.3.3 Government ....................................................................................................... 29
1.3.4 Non-Governmental Organizations .................................................................... 30
1.3.5 Start-Ups ........................................................................................................... 30
1.3.6 Healthcare ......................................................................................................... 30
1.3.7 Education .......................................................................................................... 31
1.4 Ontologies: definitions and usage ............................................................................. 32
1.4.1 Ontology definition ........................................................................................... 32
1.4.2 The KREM model ............................................................................................. 32
1.4.3 KREM experience layer for the lean organization ........................................... 33
1.5 Ontology editors (Protégé and Hozo) ....................................................................... 34
2 Complex Systems ............................................................................................................. 35
2.1 Properties of Complex Systems ................................................................................ 35
2.1.1 The advent of complexity ................................................................................. 36
2.1.2 Rules of emergence ........................................................................................... 38
2.1.3 Complex Adaptive Systems .............................................................................. 39
2.2 Modeling Complex Systems ..................................................................................... 41
6
2.2.1 Modeling approaches ........................................................................................ 41
2.2.2 Modeling artefacts ............................................................................................ 42
2.2.3 Simulation tools ................................................................................................ 42
2.3 Complex Systems and organizations ........................................................................ 43
2.4 The immune system as example of Complex System .............................................. 45
Second Part: Contribution ..................................................................................................... 51
3 The Lean Organization Framework (LOF) ................................................................. 53
3.1 Introduction ............................................................................................................... 53
3.2 Ontology represented in Protégé ontology editor ..................................................... 53
3.3 The Lean Organization Framework .......................................................................... 57
3.4 Rules of lean ............................................................................................................. 60
3.5 The Lean Framework applied to various organization types .................................... 62
3.5.1 Industry ............................................................................................................. 62
3.5.2 Government ....................................................................................................... 62
3.5.3 Non-Governmental Organizations .................................................................... 64
3.5.4 Start-Ups ........................................................................................................... 64
3.5.5 Healthcare ......................................................................................................... 65
3.5.6 Education .......................................................................................................... 65
3.5.7 Lean Foundation ............................................................................................... 67
3.6 Lean IT ...................................................................................................................... 69
3.6.1 LOF applied to IT ............................................................................................. 70
3.6.2 Application of the LOF concepts to Enterprise Architecture ........................... 82
3.6.3 Discussion on Lean Enterprise Architecture ..................................................... 94
3.6.4 The Toyota Data Hub ........................................................................................ 97
3.6.5 Comparison between Scrum and lean. ............................................................ 106
3.7 The Immune System ............................................................................................... 108
4 Experimentation .............................................................................................................. 113
4.1 Lean in the cultural context ..................................................................................... 113
4.1.1 Introduction ..................................................................................................... 113
4.1.2 Integration of culture in lean organization modeling ..................................... 114
4.1.3 A domain ontology for the strategic dimensions of culture ............................ 115
4.1.4 The influence of culture in the lean organization ........................................... 122
4.1.5 Experiment, in silico ....................................................................................... 125
4.2 Simulating the hoshin process as a Complex System ............................................. 127
7
4.2.1 Definitions ....................................................................................................... 128
4.2.2 Concepts .......................................................................................................... 130
4.2.3 Simulations, in silico ....................................................................................... 131
4.2.4 Learnings about lean organizations ................................................................ 137
4.3 Open Source eHoshin first cycle (January-March 2016), in vivo ........................... 138
4.3.1 Description of the experiment ......................................................................... 138
4.3.2 Results of the experiment ................................................................................ 139
4.3.3 Global sharing of the open source eHoshin application ................................. 141
4.4 eHoshin advanced experiment (January-March 2017), in vivo .............................. 144
4.4.1 Description of the advanced experiment ......................................................... 144
4.4.2 Results of the advanced experiment ............................................................... 151
4.5 Updated model after two years of experimentation, in silico ................................. 154
Conclusion ............................................................................................................................. 163
Appendix 1 – lean concepts ............................................................................................... 183
Appendix 2 – Second experiment programs .................................................................. 217
Appendix 3 – Summary in French .................................................................................... 226
Résumé en français ............................................................................................................. 250
Summary in English ............................................................................................................. 250
8
List of Figures Figure 1 - The LOF Ontology in PROTÉGÉ ............................................................................ 55
Figure 2 - Final Graphviz representation of the LOF ontology with relations ......................... 56
Figure 3 - Health monitoring .................................................................................................... 87
Figure 4 - Visualization of EA Annual Plans and Monthly PDCA Reports ............................. 90
Figure 5 - Hybrid diagram ........................................................................................................ 91
Figure 6 - JIRA dashboard ........................................................................................................ 92
Figure 7 - Data & Standards kanban board .............................................................................. 93
Figure 8 - Point to point integration .......................................................................................... 94
Figure 9 - Enterprise Service Bus integration ........................................................................... 95
Figure 10 - REST integration .................................................................................................... 96
Figure 11 - Access to Toyota Motor Europe product data before improvements .................... 98
Figure 12 - LOF concepts applied to Enterprise Architecture .................................................. 99
Figure 13 - Simplified product data model ............................................................................... 99
Figure 14 - GET example for Avensis .................................................................................... 100
Figure 15 - Improved product data architecture ..................................................................... 101
Figure 16 - Built in quality with ownership ............................................................................ 103
Figure 17 - REST Architecture ............................................................................................... 104
Figure 18 - Hybrid on premise and cloud infrastructure ......................................................... 105
Figure 19 - Scrum and lean terminology comparison ............................................................ 107
Figure 20 – The Immune System in time and space (courtesy of V.Thomas-Vaslin) ............ 109
Figure 21 – The lean ecosystem in time and space (courtesy of V.Thomas-Vaslin) ............. 109
Figure 22 - The Upper Ontology of Culture (UOC) by Blanchard and Mizoguchi ............... 117
Figure 23 - The Culture Map (CM) ontology in hozo ............................................................ 121
Figure 24 - The House of TPS (HoT) ontology in hozo ......................................................... 122
Figure 25 - The hoshin kanri process ..................................................................................... 128
Figure 26 - The nemawashi process ........................................................................................ 129
Figure 27 - The hoshin kanri ontology ................................................................................... 130
Figure 28 - The nemawashi ontology ..................................................................................... 131
Figure 29 - Evolution in time of the average item value for hoshin kanri .............................. 133
Figure 30 - Evolution of the number of items from the original hoshin kanri proposal ......... 133
Figure 31 - Evolution in time of the average item value for nemawashi ................................ 135
Figure 32 - Evolution of the number of items kept from the original nemawashi proposal ... 135
9
Figure 33 - hoshin creation process ........................................................................................ 139
Figure 34 - eHoshin participation to the first experiment ....................................................... 140
Figure 35 - Example interaction with a hoshin leader ............................................................ 141
Figure 36 – Structure of the eHoshin Application .................................................................. 142
Figure 37 - Django administration screen for eHoshin ........................................................... 143
Figure 38 - The lean 2040 initiative on eHoshin .................................................................... 144
Figure 39 - Structure of multiple, nested hoshin documents .................................................. 147
Figure 40 - Use case diagram of the eHoshin v2 application for IS ....................................... 148
Figure 41 - eHoshin v2 home page ......................................................................................... 149
Figure 42 - Akari blog design for eHoshin v2 ........................................................................ 150
Figure 43 - Report screen on Akari eHoshin v2 ..................................................................... 153
Figure 44 - Pseudocode for Hoshin Simulation v2.2 .............................................................. 157
Figure 45 - Test control file for the Hoshin Simulation v2.2 .................................................. 159
Figure 46 – Results of Hoshin Simulation v2.2 ...................................................................... 160
Figure 47 - Comparison of hoshin simulation ........................................................................ 161
List of Tables
Table 1 - Lean concepts applied to Enterprise Architecture ..................................................... 82
Table 2 - Comparison of enterprise architectures based on LOF concepts .............................. 97
Table 3 - Hofstede’s cultural dimensions for Argentina and Belgium ................................... 118
Table 4 - Check and Act leading to eHoshin v2 ..................................................................... 145
Table 5 - Summary of key requirements for eHoshin v2 ........................................................ 146
Table 6 - Roles and Responsibilities for eHoshin v2 .............................................................. 148
Table 7 - Implementation of each item in Akari ..................................................................... 151
Table 8 - eHoshin v2 statistics, after Phase 1 ......................................................................... 153
Table 9 - eHoshin v2 statistics, after Phase 2 ......................................................................... 153
Table 10 - Hoshin Quality Scorecard v1 ................................................................................. 156
Table 11 - Overview of parameters and ranges used in the Hoshin Simulation v2.2 ............. 158
Table 12 - Test Cases for the Hoshin Simulation v2.2 ........................................................... 158
10
Foreword Why one more thesis on lean and what is new about this? I have been working inside Toyota
for the past 13 years, after studying the Toyota Production Systems tools in the automotive
industry outside Toyota for the previous 20 years. This has shown to me the difference between
applying the tools and understanding the underlying philosophy of lean, which can make such
a difference towards bringing the concepts to fruition in companies other than Toyota. Even
Toyota is struggling to apply the lean concepts to the office area, including the IT function
where I am working. So, from 2012, I engaged with the lean movement to understand what had
been done with these concepts outside Toyota (the lean principles have been applied to
healthcare, start-ups, government, non-governmental organizations, education, IT with agile
and Scrum, etc.), with the intention to bring the good ideas back into Toyota and consolidate
them with the strength of the Toyota DNA and culture.
In this process, I met with many interesting people I am indebted to (in particular Professor Dan
Jones, Dr Jeff Sutherland, Steve Bell and Marie-Pia Ignace). They are part of a vibrant lean
community looking at Toyota for inspiration. This has been a very humbling experience for me,
because in each of my keynote speeches, I was expected to bring deep insights to the community.
It also brought me in contact with Dr Pierre Parrend, who convinced me to give a course of
Lean IT to the ECAM engineering school and brought me in contact with Professor Pierre Collet,
who in turn convinced me that that the nascent science of complex systems could be applicable
to lean and that new insights could be gained by modeling lean as a complex system.
My ambition with this work has been to lay the foundations for a more structured handling of
lean knowledge, leading to a Lean Organization Framework in order to help the adoption of
lean outside Toyota, as well as to experiment with a model of a typical process of lean at Toyota
and outside that behaves like a Complex System, top down and bottom up.
11
Introduction Methodology
It is particularly arduous to apply scientific research to the Toyota Way, since the best way to
embrace lean is to practice it, which is possibly why there are more books than scientific works
on this subject. Many principles of lean also seem at first sight to be common sense, so it is
difficult to demonstrate its benefits to laymen by theory only. For example, “Customer First”
or continuous improvement (kaizen) may seem very familiar and logical to them. When lean is
applied to other organization types, it very often starts with a small subset of the Toyota
practices and others gradually come. For example, Eric Ries explained in [1] how he was
looking for another way to start companies after a failure, got interested in lean, read some
books and started his Lean Start-Up approach, which had great success. But he essentially
started with one thing, put the Customer First by quickly bringing a minimum viable product
(MVP) to the market. Then improve from there, instead of establishing complex business plans
before starting, which are almost always different from the reality. While this is a great thing to
do and a true innovation for start-ups, it relies only on one of the lean concepts and lean start-
ups would greatly benefit from other important concepts like hoshin1, andon, etc., that will be
studied later in this work and are all defined in Appendix 1 and referenced in the Index. This
led to the idea of developing a model with deeper explanation of the various concepts that could
be used by whoever would start applying lean to a new field and help them translate their subject
matter expertise into an effective application of lean.
1 In the text, we make use of terms of Japanese origin. To make sure the reader not familiar with this language can find his/her way, we have written all these terms in italics (like kaizen) and explained them in the first appendix at the end of the thesis, with a translation in English and French, an explanation of the origin the term and its meaning, as well as examples of application to six different domains of knowledge. The word lean itself is written in italics to highlight its specific meaning in this work, except when part of an expression like “Lean IT” or “Lean Organization Framework”. When an accurate English translation has been found, we mention the locution, followed by its Japanese counterpart, as in visualization (mieruka). If no easy translation could be found, we will use the Japanese term only as in pokayoke or andon. In the case where the Japanese term does convey some more precise meaning (as anzen for safety) or when the Japanese term is just the English term transposed in Japanese katakana alphabet, as for Just in Time, written ジャストインタイム (i.e. “jasuto in taimu”), the English term only will be used.
12
The models and experiments presented show how this can be done.
Industrial Challenges
This can be expressed as two main industrial challenges:
- Can lean be modeled in a way that can be comprehensive, stable and formal in order to
speed up a qualitative implementation of lean in organizations of all nature? Many
books on lean that are valuable to promote the lean mindset do not attempt to be
comprehensive and many lean practitioners are using only a subset of the concepts and
practices that are available. A comprehensive and structured knowledge base would help
speed up and increase the quality of implementations.
- Can a free collaborative model for setting objectives in organizations be shared,
enabling them to use lean as their core strategy and supporting emerging organizational
models that support participation of all employees to achieve better results?
Research Challenges
Can a knowledge base of lean be formalized, in order to be further enhanced by the lean
practitioners? This knowledge base should support a smooth and qualitative implementation of
lean in a continuously growing number of domains and organizations. This can be broken down
in three research challenges:
- Can lean be formally modeled using ontologies? This has not been done before except
for some limited subsets of lean. It is only by doing this that expert knowledge can be
gained and the formal model gradually enhanced, instead of constantly “reinventing the
wheel”, as a number of books about lean demonstrate. This is the subject of the two
papers that have been presented at the KES conference (Knowledge Engineering
Systems) in Singapore in 2015 and in York in 2016 and published in [2] and [3].
- Can a model be created as an aid for those who have applied lean without internal
Toyota knowledge to complete their understanding and perfect their own
implementations? Can such a model be leveraged to apply lean to new domains? The
approach is illustrated with the case study of a Lean Foundation as a new domain where
lean has not been applied before and by a detailed case study on Lean IT and Lean
13
Enterprise Architecture, where many additional insights and excellent results can be
gained from a deep application of lean concepts.
- Which Complex System properties does a typical lean process present? The process of
objectives setting (hoshin kanri) is chosen as an example of top down and bottom up
lean process involving multiple agents. The novel comparison of lean and the immune
system reinforces the demonstration that the lean organization is a Complex System, at
the mesoscopic level, while the immune system is a Complex System at the microscopic
level.
Organization of the thesis
The thesis is organized in two parts.
The first part is a “State of the Art” of lean and Complex Systems. In the first chapter, we
explain the history of the Toyota Production System and lean and review the recent literature
which has applied lean to more and more diverse fields in the last decennia. Lean is usually
explained with a practical approach, ideally on the shop floor. A very popular approach explains
lean or the Toyota Production System using a “House of TPS”, with two pillars, Just in Time
and jidoka, that will be called Stop in Time in this work. The Just in Time is all about flow, all
activities are pulled from the customer demand and lean aims at eliminating all waste in the
process. But before establishing Just in Time, Stop in Time (jidoka) is needed: each flow can
be stopped when a problem is encountered, and the human, who is now liberated from the
machine by automation and Stop in Time, can look after many machines. In the example of the
Type G automatic loom imagined by Sakichi Toyoda, the founder of Toyota Industries Co. Ltd.,
ancestor of the current Toyota Motor Corporation, it was 30 machines per operator. Then, the
foundations of the house are shown and the roof (which contains Satisfied Stakeholders, or best
time, best cost, best quality), as well as the foundations (like Safety or continuous improvement)
are then shown and explained. This approach is very useful for pedagogy, but does not easily
scale to explain all the terms (there are more than one hundred). It is not unique as different
authors place the same concepts in different places of the house and the terms themselves are
also linked to each other in many ways. This leads to the need for ontologies to describe the
concepts and their relations, and the explanation of the KREM model (Knowledge, Rules,
Experience and Meta-Data) to represent knowledge in a structured way. The second chapter
explains the nascent science of Complex Systems, its origins and concepts, Complex Adaptive
14
Systems (CAS) and the various modeling techniques used to represent them. It explains how
organizations behave as Complex Systems with their employees as agents. Finally, a well-
known example of Complex System is introduced with its vocabulary, the human body and in
particular the immune system, which will be later compared with the lean organization, at a
different level.
The second part details the Contributions:
Chapter 3 explains how the lean concepts are ordered, leading to the choice of nine top concepts
which are key to all lean initiatives and showing the top concepts as well as the other concepts
in an ontology of lean called Lean Organization Framework (LOF). The nine concepts of the
LOF are then applied to the organization types explained in Chapter 1. Finally, a parallel is
drawn between lean organizations and the immune system. This incursion in biology opens
avenues of research on how the understanding of the human being can further enhance our
understanding of the lean mechanisms and give new ideas on how to apply them.
Chapter 4 first explains how lean can be applied to various cultural environments, a key success
factor for lean implementations and hence an important dimension to use in modeling lean.
Findings from an anthropologist (Geert Hofstede) and a business school professor (Erin Meyer)
are used to create a series of nested ontologies that show how cultural knowledge can be
understood and modeled. When this is done, the particular knowledge about lean can be adapted
to the cultural information. This is shown with examples and pseudo-code.
A process of lean is introduced, the hoshin kanri2 process, the process used to manage the
direction of the organization, the “compass management” process. This process is chosen
because it is typical of Complex Systems interactions between agents at different levels in the
organization, going top down and bottom up at the same time. The model is first introduced in
silico, demonstrating in theory that in the Complex System environment, good employees can
generate ideas for objectives that match the quality of hoshin items proposed by the best top
executives, and can even exceed it (which is called an emerging property in Complex Systems
language). Two iterations of in vivo experiments are then explained. The first round of
experiment, conducted in 2016, involves the creation of an open source application called
eHoshin, which has been used within Toyota Motor Europe and exposed on the internet to all
2 hoshin kanri started in Japanese companies in the 1960’s as part of Total Quality Management (TQM) as policy deployment, it is described very thoroughly in the book of Yoji Akao [138].
15
organizations willing to join (which almost one hundred organizations did so far). The results
of this experiment confirmed the predictions of the theoretical model, but also provided ideas
for improvements. These ideas were implemented in a second round of experimentation,
conducted in 2017 at Toyota Motor Europe, in the IT function in different geographical
locations but also in a different legal entity (Toyota GB), and are in the process of extension to
other functions of the company. Finally, those learnings are retrofitted to the model, and the
final in silico model is explained, leading to a maturity model for hoshin kanri to be further
improved in the next years of usage. The Complex System properties of emergence, co-
evolution, sensitivity to initial conditions, etc. are demonstrated with these examples, showing
the Complex System behavior of the lean organization.
The work is completed by an extensive bibliography, description of the author’s publications,
teaching activities and conferences and an index of lean terms with the pages where they are
introduced. Two appendices are proposed: in the first appendix, the terminology of lean is
explained, one table per concept. The Toyota Production System and the twenty-five main
concepts are explained with one table per concept, putting the concepts in their historical
context and describing them, as well as their application to six different fields, the Lean IT, the
Lean Healthcare, the Lean Education, the Lean Start-Up, the Lean Foundation and the Immune
System. The two last fields are novel, and the first four are enhanced by this work. The
remaining concepts mentioned in the LOF ontology are explained briefly at the end with their
Japanese name and meaning. In the second appendix, the Python programs used for the revised
in silico model of the hoshin kanri are listed, as well as the code of the hoshin_grapher
producing line graphs based upon output generated from the hoshin simulator and an example
of script to run the simulation

16

17
First Part:
State of the Art

19
1 What is lean?
1.1 Short History of lean
In short, lean means starting from the customer’s needs (pull flow) and eliminate all the waste
in the process bringing the products or services to the customer.
More than 25 years have passed since the publication by Daniel T. Jones, James P. Womack
and Daniel Roos of The Machine That Changed the World [4], based on the Massachusetts
Institute of Technology’s five-year study on the future of the automobile (called IMVP –
International Motor Vehicle Program), the first book in the west revealing the major impact of
the Toyota Production System (TPS), in Japanese Toyota seisan hōshiki (トヨタ生産方式).
The word lean was coined by John Krafcik, a member of the IMVP research team, who visited
90 automotive plants around the world as part of the research, he published in MIT Sloan
Management Review [5]. John Krafcik went from Toyota to MIT, and moved on to work for
Ford, Hyundai North America and is working since 2016 for Alphabet (parent company of
Google), as CEO of Waymo.
The core idea of lean is to maximize customer value while minimizing waste, as explained by
Taiichi Ōno, the architect of TPS in [6]. The concepts and practices that originated at Toyota
have had a sweeping success, at first in the manufacturing of automobiles, where they have
been widely adopted, but then in all types of human organizations, as will be seen throughout
this work. For a good historical perspective, see [7] in English and [8] in French, and for a
description of Toyota Way, the books of Professor Jeffrey Liker who studied Toyota for more
than thirty years are a reference in the West [9].
One of the most important aspects of lean is the capability to leverage the human capital of the
whole enterprise. How is this achieved? By developing problem solving skills for the whole
workforce in order to have all the employees contribute to the day to day improvement of the
enterprise, to ensure the whole management functions as problem solvers at their level and
coaches for the levels below them in order to foster those improvement skills. These are the
improvement and coaching routines or kata, explained by Mike Rother in [10]. Making Things
20
(monozukuri) is the nature of the industry, but Toyota added the dimension of Making People
(hitozukuri), which creates emerging dynamics in the organization. The drive to improve comes
from each individual in the organization, and the organization fosters challenge and teamwork.
The individuals working in the organization interact to create an evolving system that
continuously improves, even without strong top down directions. This is more relevant, since
the focus will be on delivering added value to the customer, while removing waste along the
way. This maximizes the product power (pricing) and reduces the cost, hence maximizes the
profit (which is equal to price minus cost). It also shapes a sustainable enterprise, contributing
to society through employment and taxes and other sustainable activities like long term
ecological goals or local community support. In modeling terms, the agents (employees of the
lean organization) perform processes they are associated with (like mounting a wheel on a car),
but also improvement processes (applying the practice of problem solving with their current
skills), receive coaching on how to improve their skills and coach others. The reason why many
of Toyota’s concepts have not been applied earlier is that they may seem counter-intuitive.
Here are some examples:
- stopping the line when there is a problem, forcing many people to stop working, in
order to solve the problem at one place only,
- stopping the work when a certain levelled quantity is achieved even when there is
time and manpower to produce more, reducing stocks, even when the lack of stock
may lead to a stop of the production process.
This is also the reason why it is particularly interesting to model these principles in order to
demonstrate why they make the system work better and guide those who need to implement
them by convincing them that those principles are important to apply. The apparent
contradictions that drive success at Toyota are well explained in [11].
The lean approach has spread to the manufacturing of goods in general and it has thence been
applied successfully to many sectors and organizations. When led from the top of the company
as in CEO Art Byrne’s turnaround of the Wiremold company described in [12], it has delivered
superior results and transformed whole industries, with an acceleration of its propagation in the
last few years. As examples, it is worth mentioning the work on Lean Product Development
[13], Start-Up [1], Healthcare [14], IT [15], [16] and [17], Government [18], [19], or Education
[20], [21].
21
1.2 Bibliography of lean
1.2.1 Industrial Context
This section will quote academic and non-academic works. The non-academic works,
essentially books, mostly relate to the personal experience of the authors with practicing lean.
They are important to understand, as well as the evolution from Japanese only books on Toyota
Production System, to western books on lean manufacturing, to any books on lean in any
context.
- The seminal book is the book by Taiichi Ōno, the father of TPS, Toyota Production
System, Beyond Large Scale Production [6]. It is full of great insights, and the more
you study lean, the more it makes sense.
- The book that started it all in the West, and established the word “lean” in English, now
more than 25 years ago: The Machine that Changed the World [4].
- A key book on the Toyota Way is [9], used to teach the Toyota Way even within Toyota
in the West, together with its companion exercise book. Liker is a Professor of the
university of Michigan, who studied Toyota over a period of more than 30 years. In a
presentation that he gave at Toyota Motor Europe in 2007, the Japanese CEO at the
time, Mr. Sasaki, thanked him for explaining things about Toyota that he did not realize,
having been an insider of the company for so long.
- A very important book, because it is explaining the apparent contradictions that shape
Toyota and is written by Japanese experts who have access to many resources not
available to western scholars of lean is [11]. This book describes a state of paradox, as
defined in Complex Systems theory that will be explained in Chapter 2.
- Western books on lean to read include of course the other two books of the trilogy by
Jim Womack and Dan Jones, on lean thinking [22], and lean solutions [23]. To
understand the work of a lean coach, and the merit to go and see to understand the real
situation deeply, a must read is the book of James P. Womack explaining his genba
walks, or observations on the shop floor [24].
- Mike Rother [10] focuses on two kata or routines, that are key to Toyota’s success, the
coaching kata, to teach all employees (or “members”, as Toyota calls them) to perform
continuous improvement whatever their level is in the company, and the improvement
kata, to perform the continuous improvement or kaizen itself. The claim of the author
that understanding those two routines will be enough to understand the whole of lean
22
is largely overstated, but it is undeniable that it is key for lean to have an organization
where every individual is coached to improve every day.
- A small book by two Swedish researchers [25] is a good recommendation for those
who are new to lean and want to understand in simple terms what it is all about. It
explains the whole logic of waste elimination in a simple and clear way, starting by a
comparison of breast cancer diagnostics in a lean environment showing that a patient
based (customer based) solution takes two hours, while a doctor centric solution takes
weeks if not months.
Japanese works on lean (here mentioned in their English translation) are key to understand the
historical context in all details. The following works can be highlighted:
- the book of Masaaki Imai on kaizen, which claims that kaizen is the key to everything.
Again, like for the kata of Rother [10], this concept will not be enough of explain the
whole of lean, but Imai has been successful to this day promoting the concept, and it is
indeed a fundamental concept of the Toyota Production System. Professor Fujimoto is
also a very good specialist of Toyota history and expresses very interesting views in
[26]. This is particularly interesting for our project because he describes the Toyota
Production System as an evolutionary system. Here is a quote from the book:
“I describe this highly irregular historical process multi-path system emergence,
in which decision makers often don’t know beforehand which path will lead to
a successful outcome – deliberate planning, environmental imperatives,
intuition, imitation or luck. The word emergence generally means that a certain
system trait cannot be explained by the behavior of its constituent parts alone”.
- a more recent book from Satoshi Hino [27], which is very well documented on Toyota.
- Professor Hirotaka Takeuchi is the author of the article [28], which gave inspiration to
Jeff Sutherland and Ken Schwaber’s SCRUM [29], a very successful implementation
of lean to project management in IT and other fields.
- the book by Toshiko Narusawa and John Shook [30]. It is a unique, bilingual text
written to enable Japanese coaches and western employees to work together using the
same reference. John Shook has been the first western manager (kacho) working at
23
Toyota in Japan from 1983 to 1994 and is now an advisor to the Lean Enterprise
Institute3 in North America.
- The current top expert of TPS, Nampachi Hayashi, a direct student of Taiichi Ōno,
started work at Toyota on April 1st, 1965, and is still active in the company in 2017. He
still participates very often to European Production Kaizen Meetings (EPKM), the
latest one being at the Toyota plant in Burnaston, UK, on March 30th, 2017, 52 years
after he joined the company. Nampachi Hayashi was also the sensei or coach of Freddy
Ballé, then working for Valeo, the French automotive supplier, and Michaël Ballé, his
son, Doctor of Sorbonne University, who has written a number of books on lean
presenting it as novels and are a very nice way to get acquainted to the world of lean
and understand its benefits: learning about lean turnaround [31], lean transformation
[32], lean leadership [33] and lean strategy [34].
Lean Healthcare:
A good specialist of Lean Healthcare is Mark Graban, who has written on lean hospitals in [14],
and is also an active blogger on this subject [35]. Hospitals are a very fertile ground for lean
because all the dysfunctions that have been going on for years that patients can all witness
easily. This stems from the fact that the customer (the patient) has almost never been put first
in that environment, because everything was optimized for the expensive resources such as the
doctors. In addition, personnel like nurses were rarely consulted, even though the time a nurse
can spend with patients instead of looking for medicines or performing administrative tasks is
fundamental for efficiency and patient satisfaction. Modig [25] has a very simple explanation
of this and links it nicely to a simple explanation of what lean is, essentially the Customer First
and waste elimination principles. The Victoria Mason hospital in Canada is a very well
documented case of lean turnaround in this context [36], where hospital personnel even had the
chance to design the hospital building itself for optimization and reduction of waste.
Dr. Sami Bahri, a doctor of dental surgery in Jacksonville, Florida, has successfully applied the
principles of lean to his dental practice, succeeding for example to move from 3 to 2 hygienists
in his practice by applying leveling (heijunka) techniques from lean, see [37] and [38]. Another
dentist experience is shared in [7] by Mary Poppendieck, an author on Lean IT, showing how
3 www.lean.org
24
the repair of a crown and a tooth could be performed within one day in Cape Town while it
routinely takes weeks and different actors in other countries.
Lean IT:
In 2005, Fujitsu published a small book on TPS (Toyota Production System) applied to IT, “IT
屋のトヨタ生産方式”, or “TPS applied to the IT department” [39], unfortunately an English
translation does not yet exist. However, the authors have written an article in English describing
the contents of the book [40]. The book contains a number of illustrations: “big room” (obeya)
and wall charts in the working areas, waste elimination techniques, etc. It focuses on four
principles:
(1) Improvement of standard work through genba (actual situation on the shop floor of IT).
(2) Establishment of visualization to easily detect abnormalities.
(3) Utilization of tools designed to avoid simple human mistakes, without aiming at
automation per se, and generating precise program descriptions according to standardization
rules.
(4) Daily improvement cycle.
Steve Bell, supported by his wife Karen, has published books on lean applied to IT, coining the
term Lean IT: first in [15], then developed further in [16], and with Mike Orzen in [17].
Dr Jeff Sutherland, now CEO of Scrum inc., has applied lean techniques to IT projects and
other things he learned during an incredibly varied career from a military instructor at West
Point Academy (using visualization techniques to teach soldiers of a particularly weak regiment
to march and achieve a unique result: being the regiment chosen to accompany General
McArthur to his grave), to obtaining a PhD in medicine using IT tools, to being the savior of
huge failing IT projects in defense and private companies, to inventing Scrum together with
Ken Schwaber. He describes this journey in his latest book [29]. When Jeff kindly accepted our
invitation to speak at Toyota Motor Europe headquarters in Brussels in February 2016, he gave
credit to Toyota for many of the techniques he used for Scrum, that he had the merit to simplify
and bring to a large public. He also owes a lot to Takeuchi and Nonaka [28]. He calls Ikujiro
Nonaka “the grandfather of Scrum”. They met for the first time only in January 2011. For 17
25
years, Nonaka did not realize that the ideas developed in his paper were being used intensively
in IT4.
Jez Humble has worked on lean leadership and continuous integration (CI) [41], explaining the
benefits of delivering small chunks of programming code routinely to production by committing
to trunk in order to bring value quicker to the customers.
Jeff Gothelf and Josh Seiden have worked on Lean UX (User Experience), bringing lean to the
world of Web designers [42]
In France, Institut Lean France, under the leadership of its president Marie-Pia Ignace, is
advancing Lean IT by organizing the yearly global Lean IT Summit and supporting Lean IT
implementations in large companies like BNP Paribas bank. The book she wrote with others
[43] is a very good introduction on Lean IT in French language.
Lean Personal Organization
The lean concepts can even be applied by a single individual, then becoming a “Factory of
One”, the book by Daniel Markovitz [44]. Concepts explained later in this work and in the
Appendix are used here, like genba, kanban, 5S, etc.
1.2.2 Academic Context
Even though lean is very practically oriented, and many excellent lean practitioners inside and
outside Toyota have never published any research papers, there is also an increasing corpus of
academic literature about lean that should not be ignored in this research.
The very interesting article by Professors Takeuchi and Nonaka [28], has studied lean practices
and led to the rugby term used by Jeff Sutherland to create Scrum with Ken Schwaber, see 1.3.2.
Ontologies will be explained in more detail in Section 1.4. They are theoretical descriptions of
the concepts involved in a particular domain of knowledge and their relationships. Few
ontologies of lean exist, and those available show the application of lean to a particular domain
4 see Atlassian Blog, 24/1/2011 “A father of Scrum meets a grandfather of Scrum in Japan” by Sean Ozawa on www.atlassian.com, consulted on April 14, 2017
26
There is an attempt at an ontology of lean in the supply chain area by Nitin Khanna, as a master
thesis for the university of Agra, India [45]. In this ontology, boxes are concepts and links are
specialization/generalization relationships and the most abstract concepts are on the left. It
includes both application domain and lean management related entities. However, it is more an
enumeration of lean tools than a hierarchical classification of lean concepts. Also in the supply
chain area, the works of Kärkäinen and Ala-Risku stand out, for example in [46] where they
propose a lean, agent-based information system for Small and Medium Enterprises to support
their supply chain visualization activities and hence their performance.
Several authors have tried to find the “DNA” of Toyota, that is so difficult to copy outside. At
the lean UK Summit in November 2016, James Womack said: “we are too dependent on Toyota,
as we do not have yet model companies of lean in other sectors.”
Spear and Bowen [47] [48], have defined four rules of lean, which will be described in section
3.4.
Lean in program management
In this area, Oehmen [49] summarizes the findings of the project conducted between 2011 and
2012. The core of this document contains:
(1) the ten themes for major engineering program management challenges
(2) the six Lean Principles (LP) that are broken down in 43 Lean Enablers with 286 sub-
enablers to overcome these challenges, better integrate program management and
systems engineering, and lead engineering programs to excellence.
The ten themes for main engineering program management challenges identified and
addressed in this guide are:
1. Firefighting—Reactive program execution
2. Unstable, unclear, and incomplete requirements
3. Insufficient alignment and coordination of the extended enterprise
4. Processes are locally optimized and not integrated for the entire enterprise
5. Unclear roles, responsibilities, and accountability
6. Mismanagement of program culture, team competency, and knowledge
7. Insufficient program planning
8. Improper metrics, metric systems, and Key Performance Indicators (KPIs)
27
9. Lack of proactive program risk management
10. Poor program acquisition and contracting practices
The 43 Lean Enablers (LE) and 286 sub-enablers for Managing Engineering Programs—
actionable best practices— are summarized in six categories that represent the six lean
Principles (LP):
LP 1: Maximize Program Value
LP 2: Optimize the Value Stream
LP 3: Create Program Flow
LP 4: Create Pull in the Program
LP 5: Pursue Program Perfection
LP 6: Treat People as your most important asset
The Lean Aerospace Initiative has developed a self-assessment tool (LESAT tool) for lean
implementations [50], describing 60 drivers and 300 practices for lean.
Bozdogan [51] compares the Lean Enterprise System with other management methods like
Total Quality Management (TQM), Six Sigma, Theory of Constraints (TOC), Agile
Manufacturing and Business Process Reengineering, showing lean as the more complete of
them, but highlighting some complementarities as well.
Lean IT
Most articles about Lean IT have an empiric nature. More academic examples include:
Al-Baik and Miller [53], where waste elimination in a medium sized IT organization is
discussed, with an example leading to a lead time reduction of 60% and customer satisfaction
increase of 15%.
The master thesis of Ioana Serban [52], which discusses the pros and cons of Lean IT and Agile
in the context of the IT development department at Toyota Motor Europe.
Articles about Scrum and Agile include the works by Sutherland [54], a study of emerging
properties implementing the same project in parallel with eight different teams [55] or a study
of decision making at agile daily meetings [56].
28
1.2.3 Online resources about lean
Today, there are numerous websites and blogs about lean. Following a few links on lean enables
to stay in touch with the actual practice of lean.
- www.planetlean.com :
a gold mine of articles and interviews about lean, edited by Roberto Priolo.
They interviewed us twice:
22 July 2014, video interview:
http://planet-lean.com/how-toyota-integrates-it-across-europe
3 December 2014, video interview (at the Lean IT Summit 2014, by Roberto Priolo)
http://planet-lean.com/the-application-of-lean-it-at-toyota-motor-europe
- www.leanuk.org
(Official site of the lean Enterprise Academy, founded by Daniel T. Jones, in the UK)
- www.lean.org
(Official site of the lean Enterprise Institute, founded by James P. Womack, in the USA)
1.2.4 Conferences on lean
The Lean Summit UK, takes place every year in November. It is organized by Daniel T. Jones,
Dave Brunt and the team of the Lean Enterprise Academy. It is the place to hear about all kinds
of applications of lean (to government, healthcare, etc.) as new frontiers of lean are explored.
The Lean IT Summit, that takes place every year in Paris in October, is organized by Maria-
Pia Ignace (the President of Institut Lean France). It is a major global event on Lean IT. The
first summit was held in 2011 and every year since then. Every year, a member of the Toyota
family has given a keynote speech there, and the videos of the presentations are online and
some links provided after the bibliography at the end of this work.
1.3 Lean for several organization types
Let’s now review the way that lean has been applied to various organization types. This will
provide the input for the generic framework that is developed in Chapter 3. There is another
29
reference where different applications of lean have been compiled together [7]. It has been
developed in parallel with this work and contains other examples, like Lean Armed Forces,
Lean Justice, Lean Auditing, Lean Mining, etc., described by academics and lean practitioners.
It has been used to validate this work, in particular the applicability of the framework proposed
in Chapter 3, by going through the examples one by one and checked the framework applies.
1.3.1 Industry
This is pretty much the classical way to apply lean, developed in numerous books and articles,
like [9] and commented above. Most concepts apply to all other domains, including some of
the more specific terms explained in Appendix 1 under Making Things (monozukuri). All
concepts explained in this work apply to industry, where they were born.
1.3.2 Information Technology
Lean IT is much newer. Since this work is a doctoral thesis in Computer Science, more time
was spent developing this as a Subject Matter Expert. However, it must be understood that
while lean obtains good results when applied to IT (for example with Scrum/Agile), improving
IT only gives only a small productivity boost to large companies. The achievements are bigger
when IT can be used to support lean for the whole company. It is with this in mind that the
eHoshin experiment described in Chapter 4 was conducted. IT is used to improve
communication between all relevant members, even globally distributed, in order to create their
buy-in and to smooth the execution of better objectives for the company. Little can be more
important than this. This is why the focus will be more on supporting hoshin or visualization
(mieruka/obeya/A3) with IT than improving IT itself. But IT takes a growing part in the success
of companies, and an efficient IT is a key factor in company success, so Lean IT is also quite
important.
1.3.3 Government
All citizens are painfully aware of the shortcomings of Governments. At the same time, this
gives a huge opportunity for improvement, from the local community government level to the
administration of the largest countries. The Chinese Government 13th five-year plan (第十三
个五年计划 di shisan ge wunian jihua) setting the objectives of China for the period 2016-
2020 is an example of hoshin. Putting the citizen in the center as the customer of government
is a paradigm shift that enables to create totally new models that are both more efficient and
30
better accepted by the population. A good example was given at the 2013 Lean Summit UK5
by the metropolitan borough council of Solihull in the West Midlands. They explained how
they bundled together several administrative activities for the same family to solve their
problems with a holistic view and not a one by one view that moved problems around but failed
to solve them structurally. For example, a family was dumping litter on the road which led to
complaints from the neighbors. As a solution, another administration asked them to fill in a
form to obtain an additional dustbin in the road, which they were unable to do as they were
illiterate. In the Lean Government approach, by recognizing this situation in a holistic way, the
same administration would help them to fill in the form, therefore offering the structural
solution to solve the neighborhood dispute, closing several files at the same time that had never
been handled properly by any individual administration. The United States Environmental
Protection Agency has developed a Lean Government Starter Kit, now available in Version 3.0
[57], to help each State agency to implement Lean Government in the right way.
1.3.4 Non-Governmental Organizations
Since non-governmental organizations have scarce resources, a systematic waste elimination is
key, and creativity of all involved stakeholders, all motivated by their noble cause, provides a
fertile ground for excellent application of lean.
1.3.5 Start-Ups
Eric Ries [1] has proposed a new way to start a company: bring a Minimum Viable Product
(MVP) to the market, quickly integrate customer feedback, iterate this process, and only later
build the business plan. If the product is not satisfactory according to early customer feedback,
do not hesitate to pivot and go for an alternative product, maybe several times in a row. This
simple reverse of longstanding traditions in new businesses has brought up a revolution. While
this application of the Customer First principle is brilliant, is our belief that more of lean
concepts can be applied to start-ups, based on the detailed description in the second part of this
work.
1.3.6 Healthcare
The shift from resource-based to patient-based healthcare (again based on the Customer First
principle, since the customer is the patient in this case) has given an extraordinary application
5 https://www.youtube.com/watch?v=ULvSP0qm6uE
31
of lean. On top of Customer First, Value Stream Mapping (VSM) and continuous improvement,
other concepts are key here, like the 5S (seiri, seiton, seiso, seiretsu, shitsuke in Japanese or
Sort, Set in Order, Shine, Standardize and Sustain in English), since having the right tools at
the right place and a perfectly clean workplace is of course lifesaving in the context of
Healthcare.
1.3.7 Education
Here also, everything starts by defining the customer. Though it seems obvious that the
customer of education is the student who needs to be educated, many educational programs are
designed to optimize the work of teachers. For example, by giving the same course every time,
whatever the level of the students or the evolution of the field, many students are left behind,
as shown in [58]. The MOOCs (Massive Online Open Courses) are providing an excellent
example of what is possible here, because they provide an educational content that can be pulled
by the student at his own pace, while providing a number of mechanisms like discussion with
mentors (cf. Machine Learning of Andrew Ng on Coursera6, or the course of Pierre Collet on
Evolutionary Stochastic Optimization on the French platform FUN7), discussion between peers
and access to top resources from all over the world through the power of IT (an internet
connection and browser is enough). Still, this does not completely replace the need for face to
face training. The problem of efficiently training a large group while taking into account each
individual’s progress is a problem that is still largely unsolved today. In TPS, the problem-
solving coaches will focus on one student at a time, so a better balance of one by one time
between teacher and student and plenary sessions may provide some hint at future progress.
This may not be feasible with thousands of students attending the same MOOC, but in this case,
new roles have emerged, like more advanced students supporting others or communities by
country or city of origin of the students. The lean teaching approach has been pioneered by M.L.
“Bob” Emiliani, author of several articles and books on the subject [20] [21].
6 https://www.coursera.org 7 https://www.fun-mooc.fr
32
1.4 Ontologies: definitions and usage
1.4.1 Ontology definition
As defined by Gruber [59], an ontology is a formal explicit specification of a shared
conceptualization of a domain of interest.
1.4.2 The KREM model
The framework used for Knowledge Management in this thesis is the KREM model, initially
proposed by Cecilia Zanni-Merk at the Bioinformatics, Data Mining and Optimization team of
ICube laboratory at Strasbourg University [60]. It has been successfully used in several domains
[61] [62]. Conventionally, a knowledge-based system is composed of a fact base and a rule base,
on which various types of reasoning can be made. But the observation of the drawbacks of this
classical architecture (the difficulties in eliciting expert knowledge, mainly because experts
operate tacit knowledge, and basically, the non-completeness of this elicitation) led the team to
evolve this model, based on the use of semantic technologies. Semantic technologies use
methods originating in automatic language processing, machine learning and knowledge
representation to build the ontologies and the rules that will enable their implementation.
Semantic technologies are also intended to create new meaningful relationships, and therefore
new knowledge, based on information of different kinds and form. Enriching documents with
meta-data or creating specific linguistic or terminological standards are examples of the
possibilities offered by semantic technologies to facilitate decision making through effective
knowledge management. But decision-making, to be effective, must result from reasoning and
analysis on this knowledge and also take into account the experience of decision-makers, as
well as their expertise. Naturally, the capitalization of experience appears as a possibility of
improvement of the architecture. Finally, the use of meta-knowledge to drive the execution of
knowledge-based systems becomes a need. Meta-knowledge is knowledge about the domain
knowledge, the rules or the experience. It can take the form of context up to the use of
knowledge, culture or protocols. Context is any information that characterizes a situation related
to the interaction between human beings, applications and the surrounding environment and is
identified as belonging to four types: identity, location, status and time [63]. Context is typically
the location, identity and state of people, groups, and computational and physical objects. Time
is information that helps to recognize a situation using historical data. The Culture aspect of
meta-knowledge intends to reflect the different ways decisions are made in different cultures.
Protocols typically include: the ways the other pieces of knowledge are used to accomplish the
33
task (for example, diagnosis), strategies for problem solving or heuristics. Finally, Meta-
knowledge may be closely related to experience knowledge. To take these ideas into account,
the KREM model has four interacting components that can be broken down by project or
application domain. Re-use of components is encouraged. The KREM components are:
- Knowledge to operate, implemented as domain ontologies that need to be developed.
- Rules to allow different types of reasoning (monotonous, spatial, temporal, fuzzy or
other depending on the application)
- Experience, to allow the capitalization and reuse of previous knowledge.
- Meta-Knowledge, including knowledge about the other three components, giving the
context of the problem to be solved.
The first step for formalizing a knowledge domain is the definition of its scope and first-level
entities. This is typically done using an ontology, which enables to represent the relationships
between these entities. In [2], two complementary ontologies of lean were defined: the ontology
for the House of TPS, which structures the core issues in lean Management, and the ontology
for hoshin kanri, which represents the entities necessary to model this particular process. The
hoshin kanri process is of particular interest because it displays the behavior of the agents (the
employees in the house of TPS) at various levels in the organization going back and forth. This
will be developed in chapters 3 and 4 with a more complete version of the ontology and a more
thorough version of the hoshin kanri process description.
1.4.3 KREM experience layer for the lean organization
This layer is intended to capitalize experience knowledge, at the very heart of lean. This layer
is in the first steps of development and it is possible to explore the feasibility of using a wide
variety of methods for knowledge capitalization like SOEKS (Set of Experience Knowledge
Structure) and DDNA (Decisional DNA) [64]. The main goal is to enrich the layer with
knowledge coming from the Toyota practices. SOEKS has been successfully tested in several
diverse domains, mainly in engineering and medicine, e.g. for diagnosis of Alzheimer and
breast cancer [65] or IT project management [66]. By definition, a SOEKS has four components:
Variables, Functions, Constraints and Rules. Variables usually involve representing knowledge
using an attribute-value language. This is a traditional approach from the origin of knowledge
representation. Variables are related among them in the shape of functions. Functions, the
34
second component, describe associations between variables. Therefore, the set of experiences
uses functions and establishes links among the variables constructing multi objective goals.
Constraints are another form expressing relationships among the variables. A constraint is a
restriction of the feasible solutions in a decision problem and limits the performance of a system
with respect to its goals. Finally, rules are suitable for representing inferences or for associating
actions with conditions under which the actions should be performed. They are conditional
relationships of the universe of variables. In this way, the four components of the set of
experiences can be uniquely combined to represent the business practices of the company. To
complete this activity for lean would be a titanic work that will not be completed in this work,
but the basis and the structure for further gathering and structuring of experience on lean will
be established in the next chapters with the Lean Organization Framework (LOF) ontology.
1.5 Ontology editors (Protégé and Hozo)
Two ontology editors have been used for this work.
- hozo8, developed by Mizoguchi and others in Japan [67], is an ontology editor which is
very suitable for representing relationships between individuals and culture-related
artefacts, enabling the elicitation of the internal structure of a concept, a role assignation
to structural elements and the specialization of concepts, as explained in [68]. It is used
in this context here, but its limited English language support and lack of current
maintenance makes it a less appropriate candidate to work on the broader lean ontology.
- Protégé (Stanford university)9, which is the most used ontology editor, and is correctly
maintained on various platforms. It was used for building the ontology of lean shown
in section 3.2, and complemented with Graphviz, a graph editor originally developed by
AT&T [69] to describe complex IT networks.
8 http://www.hozo.jp 9 https://protege.stanford.edu. The Protégé resource is supported by grant GM10331601 from the National Institute of General Medical Sciences of the United States National Institutes of Health.
35
2 Complex Systems
In this chapter, the science of Complex Systems is introduced in its historical context, the
properties of complex systems relevant for the modeling of both natural and artificial systems
are detailed. In particular, the way simple rules can define complex behaviors and approaches
for modeling Complex Systems are presented. The application of Complex Systems to
organizations is explained and the immune system is introduced as an example of Complex
System that will be compared to the lean organization.
2.1 Properties of Complex Systems
A Complex System consists of a large number of interconnected agents that, as a whole, exhibit
a coordinated behavior without any centralized control. That is, a Complex System exhibits
properties (called emergent properties) that originate from the interactions of the individual
agents, but do not obviously result from their properties. Water shows properties that water
molecules do not exhibit (water boils, individual water molecules do not) and human beings as
a team can achieve things that they could not achieve alone.
“Complex Systems may have many components (elements or spatio-temporal fields)
that collaborate to create a functioning whole. Thereby the function creates itself, i.e., it
comes about by the dynamical interaction of the components without an intervening
regulatory body. One speaks of Self-Organization or also of Emergence. Important is
that the word complex is not to be confused with the word complicated”
(Eberhard Bodenschatz, 2009)
The word “complex” does not mean the same as “complicated”, which is the contrary of
“simple”. An example often quoted of complication is a puzzle: if it has many pieces, it can be
very complicated to complete. However, there is only one state to achieve, which does not make
it complex.
Emergent properties are large-scale effects of a system resulting from the (local) interactions
between the agents. They are often hard to predict. The appearance of emergent properties is
the single most distinguishing feature of Complex Systems [70].
36
2.1.1 The advent of complexity
Complex Systems science is not new. Now that it becomes evident that the properties of
complex systems can be found in many different sciences, it becomes possible to trace the
concepts back in time. A good historical perspective can be found in [71] by J. Guespin-Michel
in French, and in [72] by E. Mittleton-Kelly.
In antiquity, Aristotle said in metaphysics “the whole is more than the sum of the parts”, already
suggesting emerging properties, of course not from a purely mathematical point of view, but
more from systems thinking point of view. In the words of Fritjof Capra10:
“From the beginning of biology, philosophers and scientists had realized that the form of
a living organism is more than shape, more than a static configuration of components in
a whole. The first systems thinkers expressed this realization in the famous phrase the
whole is more than the sum of its parts.”
Since the late nineteenth century, complex phenomena were observed in physics and chemistry.
In 1888, Henri Poincaré discovered a family of curves as part of his research on the three-body
problem which behaved in a chaotic deterministic way (this wording was used only later). He
discovered after making himself an error in an essay that got a prize that his differential
equations had a very high sensitivity to initial conditions, see [73]. Complex Systems that are
simple to model can also show such properties. An example of a simple physical system that
exhibits a rich dynamic behavior is the double pendulum11, a pendulum with another pendulum
attached to its end. This model shows a strong sensitivity to initial conditions.
In 1925-1926, Lotka and Volterra established the predator-prey equations to describe the
complex dynamics of biological systems in which a predator and his prey interact. This is a
couple of first order non-linear differential equations. These equations are still being used and
improved today as an example of complex dynamics of a biological system, which can be
oscillating or even chaotic [74]. They are also used to describe phenomena in economics.
10 Schrödinger Lecture, Dublin, September 9th 1997
11 https://jakubmarian.com/how-can-chaos-be-deterministic/
37
From the 1960’s, Ilya Prigogine studied thermodynamics and dissipative structures far from
equilibrium at the Free University of Brussels: his research brought him the Nobel Prize in 1977.
In particular, the Belousov-Zhabotinsky reaction is a prototypical example of dynamic
equilibrium between five chemical reactants oscillating between two states, which can be
visualized through the two colors of the reacting solution. The Benard cells illustrate how, in
dissipative structures, ordered patterns emerge in states far from the equilibrium. These
examples and others are developed in [75] and also in Feistel and Ebeling [76].
There is no single unified theory of complexity, but several theories arising from various
sciences studying Complex Systems, like biology, chemistry, physics, mathematics, computer
sciences and social sciences.
The philosopher Edgar Morin has elaborated Complex Thought (la pensée complexe) in 1982
[77], which also encourages multi-disciplinary thinking. It draws on elements of what is now
knows as complexity theory by rejecting a paradigm of simplicity that he believes is slowing
down progress.
The Chilean biologists Maturana and Varela developed the concept of autopoïesis (automatic
generation of rules) [78], a system capable of reproducing and maintaining itself, like cells that
reproduce themselves through mitosis.
Jeanine Guespin-Michel calls the current emergence of Complex Systems science “la
revolution du complexe” [71], suggesting that there is a revolution going on, a paradigm change
in the sense of Kuhn [79]. It was indeed difficult for Complex Systems science to be maturing
independently from the developments of science, in particular computer science that made more
complex simulations possible, but also the evolution of society, where multidisciplinarity and
self-organized entities have become more common and acceptable (see Section 2.3).
As Stephen Wolfram of the Institute for Advanced Study in Princeton says in 198412, Complex
Systems theory is starting to develop into a scientific systems theory in its own right, cutting
between the boundaries of several scientific disciplines. Simple cellular automata that can
create complex aggregate behavior are investigated exhaustively by Wolfram [80].
12 In Santa Fe (October 6-7, 1984) at “a response to the challenge of emerging synthesis in science” workshop, available as PDF under the name “complex systems theory”, January 1985
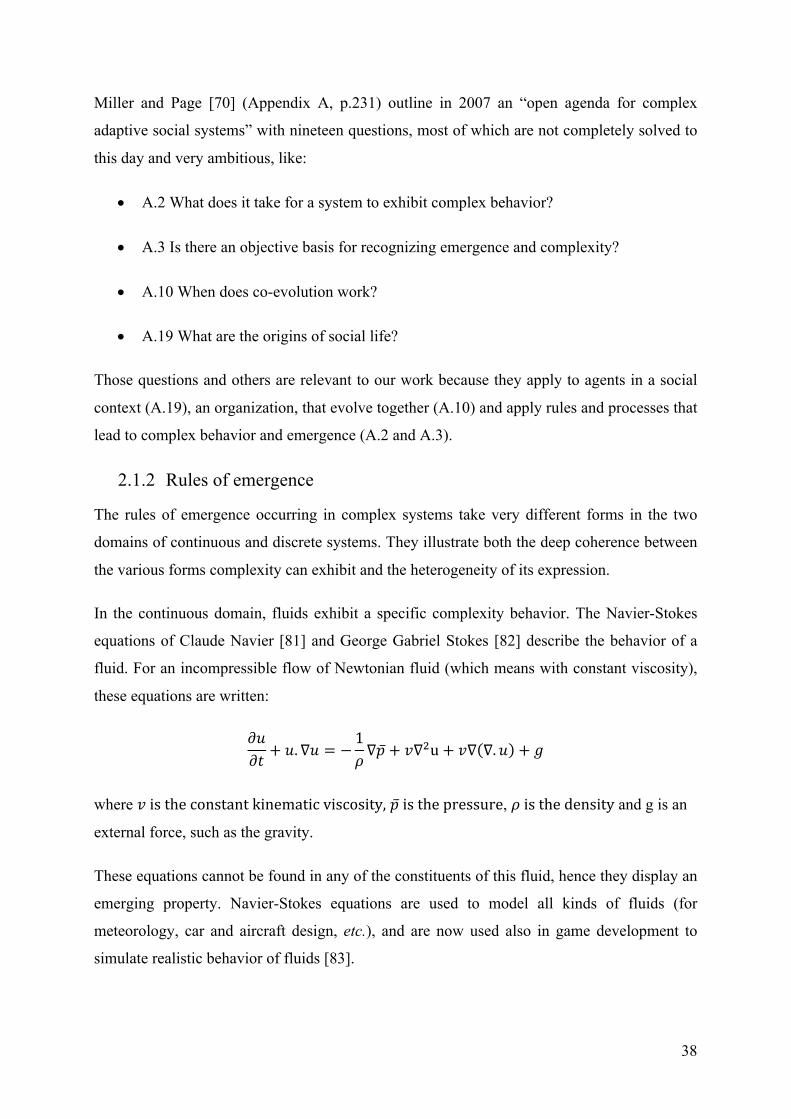
38
Miller and Page [70] (Appendix A, p.231) outline in 2007 an “open agenda for complex
adaptive social systems” with nineteen questions, most of which are not completely solved to
this day and very ambitious, like:
• A.2 What does it take for a system to exhibit complex behavior?
• A.3 Is there an objective basis for recognizing emergence and complexity?
• A.10 When does co-evolution work?
• A.19 What are the origins of social life?
Those questions and others are relevant to our work because they apply to agents in a social
context (A.19), an organization, that evolve together (A.10) and apply rules and processes that
lead to complex behavior and emergence (A.2 and A.3).
2.1.2 Rules of emergence
The rules of emergence occurring in complex systems take very different forms in the two
domains of continuous and discrete systems. They illustrate both the deep coherence between
the various forms complexity can exhibit and the heterogeneity of its expression.
In the continuous domain, fluids exhibit a specific complexity behavior. The Navier-Stokes
equations of Claude Navier [81] and George Gabriel Stokes [82] describe the behavior of a
fluid. For an incompressible flow of Newtonian fluid (which means with constant viscosity),
these equations are written:
𝜕𝑢𝜕𝑡+ 𝑢. ∇𝑢 = −
1𝜌∇𝑝 + 𝑣∇-u + 𝑣∇ ∇. 𝑢 + 𝑔
where 𝑣istheconstantkinematicviscosity, 𝑝isthepressure, 𝜌isthedensity and g is an
external force, such as the gravity.
These equations cannot be found in any of the constituents of this fluid, hence they display an
emerging property. Navier-Stokes equations are used to model all kinds of fluids (for
meteorology, car and aircraft design, etc.), and are now used also in game development to
simulate realistic behavior of fluids [83].
39
Ants provide an excellent example of self-organization: in an ant colony, complex dynamical
systems have the ability to self-organize and be adaptive. The emergence of self-organization
is not programmed or a consequence of external instructions, but results from local interactions
at the microscopic level and the interplay between the system and its environment. In [84]
Manderick and Moyson simulate the adaptive response of ant colonies to their environment by
an intrinsically parallel algorithm. A mathematical model with differential equations is
proposed and used to determine the parameters of the simulation. For these parameter values,
self-organization is observed in the ant colony.
Another example of discrete complex systems are flocks of birds, which can be programmed in
a very realistic way, respecting three rules only13. Boids (bird-oids), virtual representations of
flying flock of birds, were proposed by Reynolds [85]. A very realistic result could be obtained
by using only three simple rules:
- Rule 1: avoid collision with neighboring birds
- Rule 2: match the velocity of neighboring birds
- Rule 3: stay near neighboring birds,
sometimes called rules of separation, alignment and cohesion.
The double pendulum explained in section 2.1.1 also provides a simple set of rules creating
deterministic chaos.
2.1.3 Complex Adaptive Systems
Systems that change and reorganize their component parts to adapt to the problems posed by
their surroundings are now called Complex Adaptive Systems (CAS) [86]. They can now be
modeled with massively parallel computer systems, which have contributed to their
development in recent years.
The work on CAS was developed by scientists associated with the Santa Fe Institute in New
Mexico, USA, like its founder and Nobel Prize winner Murray Gell-Mann, John Holland or
Stuart Kauffman.
Holland [87], Miller and Page [70] and Mittleton-Kelly [72] establish that CAS are
13 www.lalena.com
40
characterized by the following properties:
• Emergence:
the whole is more than the sum of the parts. Agents together produce results that far
exceed what they could do individually.
• Immergence
the organization as a whole influences the behavior of an agent at the local level.
• Co-evolution:
agents evolve jointly. Top-down decisions based on issues from one given operational
team will have an impact on other teams, and vice-versa. This leads to direct
(management-operators) and indirect (operator team to operator team) co-evolution.
• Connectivity:
entities are interconnected.
• Distributed Control:
the control is distributed to the lowest possible level. Problem-solving emerges from
issues triggered at the level of individual operators and handled as locally as
possible.
• Far-from-equilibrium:
a system without external influences tends towards an equilibrium. This is not the case
when observing organizations that are constantly evolving due to external conditions,
for example creating new rules (a phenomenon called autopoïesis, “making self”).
• Non-linearity:
there is a strong dependency on initial conditions, hence the importance to start
processes with parameters that are carefully considered after deep reflection of the
previous cycle and relevant environmental parameters. When this is the case, it may be
difficult to find the initial conditions that will make it possible to achieve the desired
result, and remediation mechanisms may be needed (like feedback loops).
• State of paradox:
different elements of the system are apparently opposed to each other. Ago-antagonistic
properties prove to be key to understanding the complex behavior of human-scale
systems such as lean organizations, as discussed in this work. For example, Just in Time
fosters continuous flow, but Stop in Time (jidoka) stops the whole flow as soon as a
problem is encountered, even if some other parts of the flow could continue
independently.
41
Complex Systems associated with discrete phenomena are considered in this work, like the
interaction of agents in a social system. The properties of CAS remain the same as for
continuous Complex Systems, but the tools to represent them may be different, as will be
discussed in section 2.2.
This work argues that the lean organization exhibits the properties of a Complex Adaptive
System (CAS), as shown in theory in Chapter 3 and in practice in Chapter 4.
2.2 Modeling Complex Systems
Since the evolution of computer science has enabled the modeling of Complex Adaptive
Systems, which is exploited in this work, related concepts will now be explained, first the
modeling approaches, then the modeling artefacts and finally some representative modeling
tools.
2.2.1 Modeling approaches
Systems thinking
Systems thinking is a general term for looking at things systemically and for thinking in terms
of feedback. Two major tools of systems thinking are the causal loop diagram, and the system
archetype. The term “systems thinking” was made popular by the publication of The Fifth
Discipline by Peter Senge [88].
Systems dynamics
System Dynamics is the study and analysis of dynamic feedback systems using computer
simulation. The field of system dynamics has been developed from the work of Jay Forrester to
integrate engineering techniques for understanding feedback control systems into the study of
social and business policy14. System dynamics for risk management has been extensively
developed by Rasmussen in his seminal article [90], see also the thesis of Dulac showing
dynamic risk and safety modeling for the NASA15.
14 http://www.albany.edu/cpr/projects_systems_dynamics.shtml 15 National Aeronautics and Space Agency of the United States of America
42
2.2.2 Modeling artefacts
Feedback
Feedback is a process in which a decision or action causes changes which, after a time, cause a
revision of the decision or action. For example, if you are trying to catch a person running in
front of you it is necessary to run faster till you get beside them and then slow down to match
their pace. Though feedback is a very simple concept, its implications can be quite
surprising. Feedback loops typically involve more than one person or organization, each
responding to the actions of another in such a way as to, eventually, change the behavior of
others. Examples of behaviors that result from feedback:
• Arms races: two countries try to surpass each other, thereby producing more and more
arms, each country’s increase triggering an increase of the other country’s armament.
• Stock market bubbles: a few sales of shares at the same moment creates more sales,
which eventually generate so many sales that panic happens as there is nobody to
purchase the shares and the share prices plummet.
• Inner city degradation: the more a city degrades, the more natural it becomes for
individuals to degrade it further.
Archetype
An archetype is an abstraction of a feedback structure that is known to generate a particular
type of behavior. For example, escalation is an archetype in which two organizations try to
exceed a capability of the other and end up simultaneously growing that capability. An arms
race is an example of the escalation archetype.
Causal loop diagram
A causal loop diagram is a picture containing words and directed arrows connecting those words,
usually with at least one closed loop representing feedback.
2.2.3 Simulation tools
A simulation is a calculation of the implications of all the relationships that have been specified
for the variables in a model. Simulations result in the behavior of all the variables in the model
over time. These results are normally reviewed as time graphs or tables.
43
A number of tools are available to perform the simulation of systems:
- Software designed originally to help school teachers create physical models, which
evolved towards a full-fledged modeling suite, including hardware sensors, etc. is
Coach7, by the company CMA in the Netherlands.
- Industrial strength simulation software for improving the performance of real systems
is provided by the company Ventana Systems [91] based in the USA. It is called
vensim®.
Modeling feedback loops in lean organizations using Coach7 or vensim® is possible. However,
it is not optimal because of the discrete nature of human interaction in organizations.
Since these tools are focused on continuous simulation rather than discrete simulation, they can
be pretty inefficient for discrete event style simulation. This is a reason why the models that are
presented in Chapter 4 were programmed specifically and not using a generic tool, another
reason being that the specific tool allowed for fine-tuning of our specific simulation. However,
for producing a larger number of simulations types, or for those who do not have access to IT
specialists, it may be more efficient to use some of these tools.
2.3 Complex Systems and organizations
A Complex System can be defined as any system consisting of a large number of interacting
autonomous entities, creating several layers of collective organizations leading to emergent and
immergent behaviors, as explained in 2.1.3.
The modeling of organizations as Complex Systems poses the challenge of modeling discrete
entities exhibiting characteristics of Complex Systems at the mesoscopic scale, i.e. at the scale
of visible events. Such modeling requires the analysis of three complementary domains:
concepts, models, empirical [65].
Concepts are typically expressed as ontologies. Models can be either built as Complex Adaptive
Systems (CAS) [70], or using stochastic approaches [92] and [93]. The empirical domain is
provided by observation or experience. CAS models provide efficient views for representing
emerging behavior from atomic interactions. In cases where emergent properties can be
quantified, but not well understood, stochastic approaches and probabilistic models such as
44
fuzzy logic, probabilistic graphs, or Bayesian behaviors [87], [92], [93] enable to identify the
relationship between entities. Static relationship structures are best represented as networks [94].
The application of complexity models to the analysis of organizations is often limited to a
conceptual level implying emerging structures [95], or key properties such as: “connectivity
and interdependence”, “co-evolution”, “dissipative structures”, “far from equilibrium and
history”, “exploration of the space of possibilities”, “feedback”, “self-organization and
emergence”, or “chaos and complexity” [72]. Analysis of interactions within an organization is
a fertile domain for network models, in particular for understanding networks of collaborating
enterprises [96] or corporate control mechanisms [94].
The advent of these organization models which highlight the emergent behaviors of human
organizations occurs in parallel with a phenomenon of reinventing organizations and
management structures in a growing number of enterprises [97]: the old hierarchical models
disappear to make place for self-organization. Some examples surveyed by Frédéric Laloux in
this book, like W.L. Gore and Associates, have been around for many years. However, what is
surprising here is the diversity of organizations and countries where companies without a
management structure are emerging. It includes a nurse organization in the Netherlands, a
supplier of automotive parts in France, an electricity utility in the United States of America and
a hospital in Germany. Holacracy [98], introduced by Brian Robertson, who calls it “the
operating system of the organization”, proposes a way to have an organization working without
hierarchy, using a constitution and other mechanisms readily available to all 16 . Self-
organization was also introduced at Menlo Innovations, an IT company, by Richard Sheridan
[99]. It describes how the quality of the software produced improved with pair programming
rather than management checks, boosting the morale of the employees – hence the title of
Sheridan’s book “Joy, inc.”.
A panorama of the evolutionary theory of the firm is provided by Hölzl [100]. The literature on
this is extensive. Schumpeter and the principle of creative destruction can provide an analogy
with the renewal of the cells in a living organism as will be further developed in section 2.4.
Dosi speaks about a “technology paradigm” [101] and explains that decentralized organizations
create the problem-solving capability of the economic system and also the capability to
formulate new problems and new behaviors. Routines (kata) have the double character as
16 https://www.holacracy.org
45
problem-solving skills and mechanisms of governance. In Chapters 3 and 4, an effort will be
made at describing the concepts and at modeling typical processes of the lean organization, in
silico and in vivo, and this work confirms how important it is to understand the rules and the
routines of the organizations.
2.4 The immune system as example of Complex System
Francisco Varela [102] explains cognition and emerging properties fundamental to the function
of the brain. Biology provides us with a particularly interesting example of Complex System
with the immune system, introduced as follows by John Holland [86] as an example of Complex
Adaptive System:
“To arrive at a deeper understanding of complex adaptive systems – to understand what
makes them complex and what makes them adaptive – it is useful to look at a particular
system. Consider the immune system. It consists of large numbers of highly mobile units,
called antibodies, that continually repel or destroy an ever-changing case of invaders
(bacteria and bio-chemicals), called antigens. Because the invaders come in an almost
infinite variety of forms, the immune system cannot simply develop a list of all possible
invaders. Even if it could take the time to do so, there is simply not room enough to store
all that information. Instead, the immune system must change or adapt (“fit to”) its
antibodies as new invaders appear. It is this ability to adapt that has made these systems
so hard to simulate.”
The human body and the immune system in particular are commonly regarded as Complex
Systems, possibly the most complex that exists (along with the brain). As part of the argument
that the lean organization is a Complex System, analogies between the immune system (from
the microscopic to the mesoscopic level) and the lean organization (from the mesoscopic to the
macroscopic level) will be shown in Section 3.7. In order to make that section more intelligible
to the neophyte, the main concepts used in that section are introduced here. The references used
for these definitions are the book of Philippe Kourilsky on immunology and complexity [103]
(in French) which gives a relatively simple introduction of this difficult subject and the
comprehensive encyclopedia LIFE, The Science of Biology [104]. The terminology of
immunology is very extensive, and it is not the purpose of this work to define all the terms in
detail.
46
Immunology and biology in general can be used as role models of usage of mesh terms and
ontologies. Taking the cell as an example, we can find immediately its definition as a mesh
term on the NCBI site17 or in the ontobee ontology18. Ontobee dynamically dereferences and
presents individual ontology term URIs to (i) HTML web pages for user-friendly web browsing
and navigation, and to (ii) RDF source code of semantic web applications. These have been
used and refined for many years based on the research of thousands of scientists. This is the
type of activity that is started with this work at a more modest scale for the terminology of lean.
Molecules:
DNA: deoxyribonucleid acid, a molecule that carries the necessary genetic instructions
used in the growth, functioning and reproduction of every known living organism.
98% of human DNA is non-coding, meaning that these sections do not serve as patterns
for protein sequences.
RNA: ribonucleid acid. RNA strands are created using DNA strands as a template in a
process called transcription. Under the genetic code, these RNA strands are translated
to specify the sequence of amino acids within proteins in a process called translation.
Messenger RNA (mRNA): a large family of RNA molecules that convey
genetic information from DNA to the ribosome, where they specify the amino
acid sequence of the protein products of gene expression.
Gene: a gene is a region (locus) of DNA which is made up of nucleotides and is the
molecular unit of heredity.
Protein: large biomolecules or macromolecules, consisting of one or more long chains
of amino acid residues; Proteins perform a vast array of functions within organisms,
including catalyzing metabolic reactions, DNA replication, responding to stimuli and
transporting molecules from one location to another.
Cytokines: broad and loose category of small proteins that are important in cell
signaling. They are released by cells and influence the behavior of other cells.
Chemokines: a family of small cytokines. They induce directed chemotaxis in
nearby cells. Some can be induced during an immune response to recruit cells
of the immune system to a site of infection. They interact with chemokine
receptors on the surface of their target cells.
17 https://www.ncbi.nlm.nih.gov/mesh/?term=cell 18 http://www.ontobee.org/ontology/CL?iri=http://purl.obolibrary.org/obo/CL_0000000
47
Cell: the fundamental, structural and functional units or subunits of living organisms.
They are composed of cytoplasm containing various organelles and a cell membrane. It
is the smallest unit of life than can replicate independently, the “building block of life”.
Lymphocytes: white blood cells
T cells: a type of lymphocytes, themselves white blood cells. They protect the
body against cancer, etc. They are called T cells, because they mature in the
thymus. T cells can present antigens to other T cells. They are part of the innate
immune system. T cell receptors (TCR19) recognize fragments of antigens
B cells: a type of lymphocyte, sub-type of white blood cells. They present
antigen and secret cytokines. They mature in the bone marrow, and for birds, in
the bursa of Fabricius (hence the “B”). They express B cell receptors (BCR)
which allow them to bind a particular antigen against which it will initiate an
antibody response.
NK cells (Natural Killer cells): a type of cytotoxic bone marrow-derived
lymphocyte critical to the innate immune system. The role NK cells play is
analogous to that of cytotoxic T cells in the vertebrate adaptive immune
response. NK cells provide rapid responses to viral-infected cells. Typically,
immune cells detect major histocompatibility complex (MHC) presented on
infected cell surfaces, triggering cytokine release, causing lysis or apoptosis. NK
cells are unique, however, as they have the ability to recognize stressed cells in
the absence of antibodies and MHC, allowing for a much faster immune
reaction. They were named "natural killers" because of the initial notion that
they do not require activation to kill cells that are missing "self" markers of MHC
class 1.This role is especially important because harmful cells that are missing
MHC 1 markers cannot be detected and destroyed by other immune cells, such
as T lymphocyte cells.
Organ:
Thymus: the thymus is a primary lymphoid organ of the immune system. T cells mature
within the Thymus.
19 https://www.ncbi.nlm.nih.gov/mesh/?term=T+cell++receptor
48
Organism: it is any individual life form. It can be a prokaryote (bacteria and archaea) or an
eukaryote (all others, like animals, plants, fungi, …), that contain a membrane-bound cell
nucleus and organelles (specialized subunits within cells).
Lymphatic system: the lymphatic system is part of the circulatory system and the immune
system. It comprises a network of lymphatic vessels that carry a clear fluid called lymph. It
provides an accessory return route to the blood for the three liters of blood per day (of a total
of 20) that are not reabsorbed directly into the blood vessel in the process of filtration removing
plasma and leaving the blood cells. Its main other function is the immune system. Lymph
contains lymphocytes and other white blood cells. The system also includes the structures
dedicated to the circulation and production of lymphocytes, which includes the thymus and the
bone marrow, creating and training B cells, T cells and NK cells. Unlike T and B cells, NK
cells do not produce somatic diversified receptors and are not specific for antigens. B cells
immediately join the circulatory system and travel to secondary lymphoid organs in search of
pathogens. Hematopoietic progenitors travel from bone marrow to thymus where they
differentiate and mature into T cells. Mature T cells join B cells collaborate during an immune
response (also for autoimmunity). There is 95% selection during the education in the thymus
before the release of mature T cells. There is also 95% cell death (apoptosis or cell suicide)
after an immune response in order to return the size of peripheral tissues (lymph nodes and
spleen) to a “normal” size.
Genome: The genetic material of an organism. It consists of DNA and includes both the genes
and noncoding DNA, as well as the genetic material of some organelles.
Actions involving the entities above:
Autophagy: a cell eating itself,
Mitosis: a cell reproducing itself,
Apoptosis: a cell committing suicide,
Chemotaxis: the movement of a cell or an organism in response to a chemical stimulus.
Immunology
Immunology can be innate or acquired, and it involves the billions of molecules and cells
described above in a myriad of interactions, as a Complex System. It will be shown in section
3.7 that these interactions at the microscale to mesoscale can be compared to the lean

49
organization at the mesoscale of the agents in the organization to the macroscale of the
organization in its ecosystem.

51
Second Part:
Contribution

53
3 The Lean Organization Framework (LOF)
3.1 Introduction
In this chapter, the concepts explained in Chapter 1 are further developed to build a
comprehensive ontology for lean, the Lean Organization Framework. Regrouping all the
concepts in one place clarifies the hierarchy of notions and makes explicit which ones are just
tools or methods, and which ones are the important top concepts. These top concepts are then
applied to the organization types explained in Chapter 1, illustrating the usefulness of this
method to enhance existing applications of lean and to proceed swiftly with new ones, like the
Lean Foundation or Lean Enterprise Architecture, two novel examples introduced here. Finally,
the parallel between lean and the immune system is explained, reinforcing the understanding
of lean as a Complex System.
3.2 Ontology represented in Protégé ontology editor
Given the difficulty of using hozo (www.hozo.jp), which has not been maintained for years, the
more mainstream Protégé, developed at Stanford University, was chosen to represent the full
ontology with all the concepts presented in Appendix 1. However, in 4.1, hozo will be used,
because it is more adapted to the cultural context which was the reason why it was created in
the first place. Figure 1 shows a more complete version of the ontology, now in Protégé and
departing from the traditional structure of the House of TPS to show only the concepts and the
relationships between them. To get the best possible visualization, the Protégé ontology was
exported from the Protégé native Ontograph visualization to a .dot file (format of the Graphviz20
tool mentioned before) that has been further optimized for better readability in Figure 2 using
the svg format21, the Scalable Vector Graphics format defined by W3C, the World Wide Web
Consortium and Inkscape22 as an editing tool.
The concepts used in lean were gathered (around one hundred of them) and structured as an
ontology with the most important concepts at the top and the tools, methods and other concepts
20 http://www.graphviz.org 21 https://www.w3.org/TR/SVG/ 22 https://inkscape.org/en/
54
at lower levels. This has delivered an novel description of the concepts from the one used in the
literature and for training purposes (the house of TPS). This has helped create a framework that
is resilient when applied to all types of lean organizations. The visualization of the ontology is
shown on Figure 2. All the concepts mentioned are explained individually in Appendix 1, 25
of them with a full page including history, description and application to six domains of
knowledge, and the others in the text of this Appendix. This chapter will focus on the top
concepts that emerge from this classification to show how they apply universally to different
organization types.
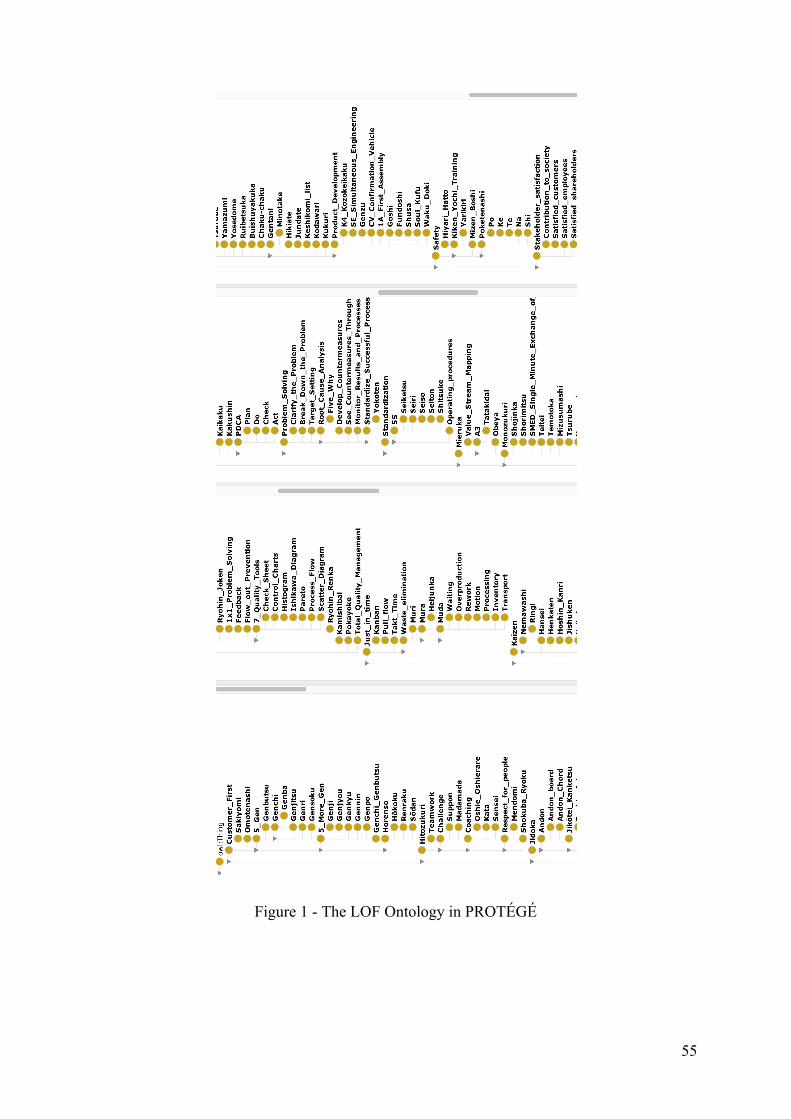
55
Figure 1 - The LOF Ontology in PROTÉGÉ
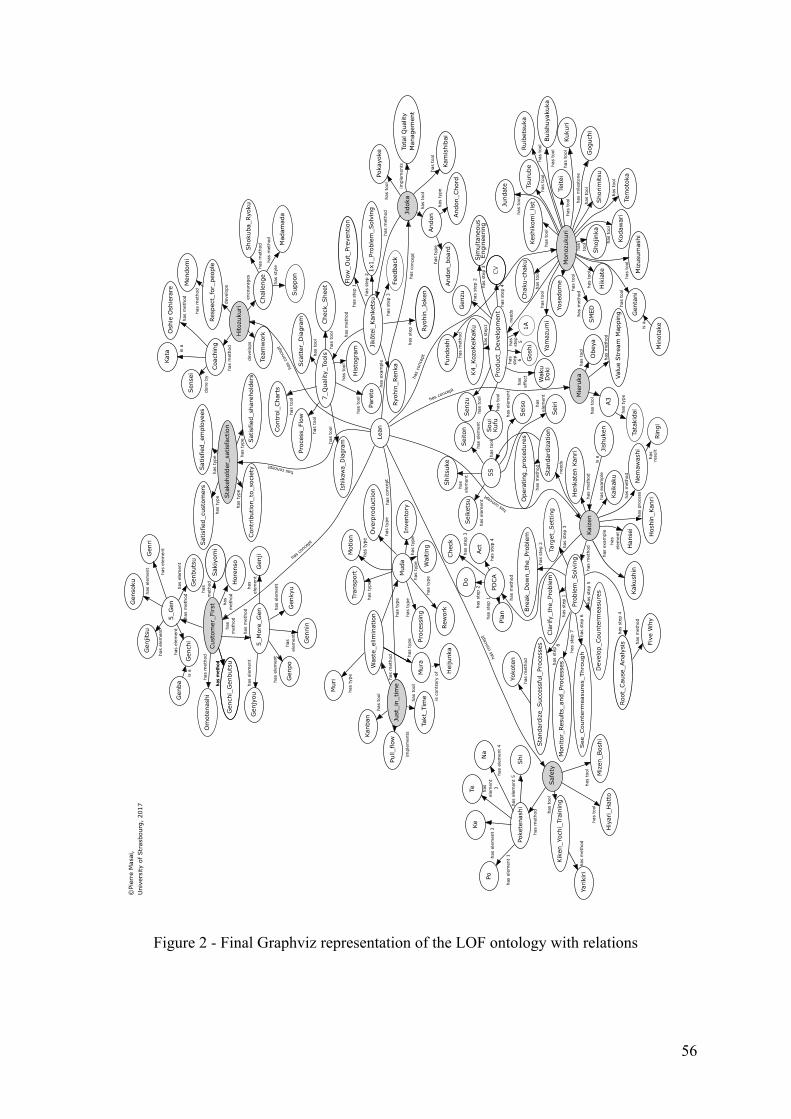
56
Figure 2 - Final Graphviz representation of the LOF ontology with relations
Customer_First
Genchi_Genbutsu
hasmethod
2_Gen
hasmethod
2_More_Gen
hasmethod
Horenso
has
method
Stakeholder_satisfaction
Satisfied_shareholders
hastype
Satisfied_customers
hastype
Satisfied_employees
hastype
Contribution_to_society
hastype
Hitozukuri
Coaching
hasmethod
Challenge
encourages
Teamwork
develops
Respect_for_people
develops
Just_in_time
Kanban
hastool
Pull_flow
implements
Takt_Timehastool
Waste_elimination
hasmethod
Jidoka
Jikōtei_Kanketsu
hasmethod
Andon
hastool
Pokayoke
hastool
Kamishibai
hastool
TotalQuality
Management
implements
Safety
Kiken_Yochi_Training
hastool
Mizen_Boshi
hastool
Hiyari_Hatto
hastool
Poketenashi
hasmethod
Kaizen
HenkatenKanri
hasmethodStandardization
needs
Hoshin_Kanri
hasprocess
Kaikaku
hasexample
Kakushin
hasexample
Hansei
has
element
Problem_Solving
hasmethod
Jishuken Tatakidai
isa
PDCA
hasmethod
Mieruka
A,
hastool
Obeya
hastool
Monozukuri
Shorimitsu
hastool
Gentani
hastool
SMEDhasmethod
Kukuri
hastool
Teitei
hastool hasmilestone
Keshikomi_list
hastool
Mizusumashi
hastool
Yamazumi
hastool
Temotoka
hastool
Yosedome
hastool
Kodawari
hastool
Chaku-chaku
hastool
Buishuyakuka
hastool
Jundate
hastool
Shojinka
has
tool
Hikiate
hastool
Tsurube
hastool
Product_Development
needs
Lean
has concept
hasconcept
hasconcept
hasconcept
hasconcept
hasconcept
hasconcept
hasconc
ept
hasconcept
Genchi
haselement
Genbutsu
haselement
Genri
haselement
©PierreMasai3
UniversityofStrasbourg3©jL1
Gensoku
haselement
Genjitsu
haselement
Genba
isa
Genpo
haselement
Genkyu
haselement
Genji
has
element
Gennin
has
element
Genjyou
haselement
Kata isa
Sensei
doneby
Shokuba_Ryoku
hasmethod
Mendomi
hasmethod
ValueStreamMapping
Muri
hastype
Mura
hastype
Muda
hastype
Heijunka
iscontraryof
Waiting
hastype
Overproduction
hastype
Rework
hastype
Motion
hastype
Processinghastype
Inventory
hastype
Transport
hastype
Feedback
Flow_Out_Prevention
Ryohin_Joken
hasstep,
LxL_Problem_Solving
hasstep©
hasstepU
hasstepL
Ryohin_Renka
hasexample
1_Quality_Tools
hasmethod
Pareto
hastool
Ishikawa_Diagram
hastoolControl_Charts
hastool
Scatter_Diagram
hastool
Check_Sheet
hastool
Process_Flow
hastool
Histogram
hastool
Andon_Chord
hastype
Andon_board
hastype
Yarikiri
hasmethod
Po
haselementL
Te has
element
,
KeNa
haselementU
Shi
haselement2
Operating_procedures
hasmethod
2Shastool
Seirihas
element
has
effect
Seiton
haselement
Seiso
haselement
Seiketsu
haselement
Shitsuke
has
element
Clarify_the_Problem
hasstepL
Standardize_Successful_Processes
Root_Cause_Analysis
hasstepU
Target_Setting
hasstep,
Break_Down_the_Problem
hasstep©
Monitor_Results_and_Processes Develop_Countermeasures
hasstep2
See_Countermeasures_Through
FiveWhy
Yokoten
PlanhasstepL
Do
hasstep©
Act
hasstepU
Check
hasstep,
Minotakeisa
CV
Genzu
Senzu
hasstepU
Fundoshi
hasmethod
Soui
Kufu
hastool
KU_KozoKeiKaKu
hasstepL LA
Goshi
hastool
Simultaneous
Engineering
hasstep,
hastype
Goguchi
hasstep©
hasmethod
Omotenashi
hasmethod
has
step 2
haselement©
hasmethod
hasstep1
hasstep0
hasstep7
hasmethod
Sakiyomi
has
method
Madamada
Suppon
hasmethod
hasstyle
OshieOshierare
hasmethod
Nemawashi
hasmethod
Ringi
has
result
hasmethod
Ruibetsuka
hastool
has
step 0
Waku
Doki
has
method
57
3.3 The Lean Organization Framework
Several attempts have been made to identify rules or principles of lean: Decoding the DNA of
the Toyota Production System [105] (showing four main rules for lean, as will be explained in
section 3.4), Toyota Kata [10] (showing the major importance of two routines, the coaching
kata and the improvement kata for TPS), or Lean Enablers [49] (explaining the Lean Principles
and break them down into Lean Enablers and Sub-Enablers in the case of Program
Management, as explained in section 1.2.2).
The concepts of lean are more fundamental to the success of lean in other organizations than
the tools that are often the only visible part of lean, like fool proof devices that prevent errors
(pokayoke) or emergency chords (andon chords) that are pulled to stop the line in case a defect
is detected, both supporting the Stop in Time (jidoka) principle.
By studying the literature on lean, its applications to different types of organizations and the
various artefacts of lean, the following nine key concepts have emerged as the top-level entities
and they will be used as headlines in the next sections of this work. The complete framework
using these nine top concepts is called the Lean Organization Framework (LOF).
Concept 1: Customer First
Every activity starts from the customer demand. The flow is pulled from the customer and every
activity which does not add value to the customer is relentlessly eliminated. This concept guides
us to “do the right things”. This can be ensured by the management of the direction (hoshin
kanri). Even when the right project is chosen, to do it well requires many interactions and
requirements can change along the way, so the customer need must be understood by going
frequently to his/her place of work (gemba) and understand their problems first hand by looking
at the actual operations. This is called Go and See (genchi genbutsu).
Concept 2: Stakeholders Satisfaction
The result of all the activities of the lean organization must be to satisfy the stakeholders, which
include customers (concept 1), shareholders, society at large, but also employees, who live in
an organization that fosters personal development (concept 3). Shareholders will be satisfied by
the combined action of concepts 4 and 5, since an excellent quality and Just in Time production
of goods or services with waste elimination will improve the company’s organizational
58
efficiency and financial results or output for non-profit organizations. Society at large will
benefit because the lean organization is focused on long term sustainability which is not
possible without a deep integration with society and local communities.
Concept 3: Making People (hitozukuri)
For the purpose of “Making Things” (monozukuri, concept 9), the right people who know how
to make things well are needed. So before making things, “Making People” is necessary. The
set of practices of coaching people for continuous improvement are called hitozukuri (hito =
people, zukuri = making). First, respecting people and their capacity to learn and improve. Then,
coach people to teach them how to solve problems and how to improve continuously (coaching
kata or routine, under the supervision of a master or sensei). When coaching employees, it is
essential to let them express ideas by themselves, to structure them using A3 documents (see
concept 8), to share them with the people knowledgeable about the topics through consensus
building (nemawashi), while letting each of them pursue their own ideas. In this model,
management must help people remove obstacles, rather than block good ideas. Each
improvement will follow the PDCA (Plan-Do-Check-Act) cycle.
Concept 4: Just in Time
The services or goods are produced in the quantity and quality needed, at the moment they are
needed, in order to satisfy the customer. Everything that does not contribute to this is waste
(muda) and must be eliminated. This is also the first pillar of the Toyota Production System.
The flow, pulled by customer demand, must be smooth. Because production is done to satisfy
customer demand, no stocks of intermediate products need to be produced. The goods or
services are produced exactly when needed by the next process down the chain. Activities
without added value will be tracked and eliminated without mercy, except those mandated by
legal or compliance reasons. Before eliminating waste, unreasonable load (muri) and the
production must be levelled (heijunka, or removing its contrary, mura, lack of levelling). Only
then can the seven forms of waste be removed (the seven forms are detailed at the end of
Appendix 1.
Concept 5: Stop in Time (jidoka)
This concept (second pillar of the Toyota Production System together with Just in Time) was
introduced by Sakichi Toyoda when developing the automatic loom (i.e. before Toyota moved
to automobile manufacturing). It means to stop the system when an abnormality is detected,
59
remove the abnormality before restarting the system, and work on problem solving to make
sure the abnormality will not occur again. Everybody working in a lean organization should be
able to stop the flow or modify it in the interest of the recipients if it is going wrong. This
requires courage, sharing and visualizing problems, working on problem solving, explaining
why doing something else is better, etc. It naturally helps management to become better and act
quickly to solve issues, hence improving the utilization of funds. The term Stop in Time is
introduced here to replace the traditional translations “automation with a human touch” or
“autonomation”. Those terms were introduced to highlight the fact that when a problem occurs,
the human takes control to solve the problem before restarting the machine. However,
automation of the problem solving itself will be automated more in the future, for example
using machine learning. So, the essence of Stop in Time is to stop when a problem occurs and
make sure the necessary actions (manual or automated) are taken before the work restarts. The
dichotomy of Just in Time and Stop in Time may support spreading the essence of the lean
message to neophytes in a simpler way.
Concept 6: Safety
If the safety of our employees is not guaranteed, they will not feel secure Making Things and
Making People, so this comes before everything else, even the customers. Hence the frequent
usage of “Safety First”, which seems to contradict “Customer First”. Before work, safety needs
to be guaranteed. Then, during safe work, Customer First needs to be present in everybody’s
minds. Because the time during the work is much longer, Customer First was kept as the first
concept on this list. At Toyota, a set of practices to ensure a safe workplace is elaborated and
taught to the employees (“kiken yochi training” or KYT). This includes rules for the employees
like the “five rules of walking” (poketenashi) explained with the “remaining concepts” at the
end of Appendix 1. Safety hazards and near-misses are immediately reported. Security
countermeasures are immediately shared with other areas that could be impacted.
Concept 7: continuous improvement (kaizen)
A prerequisite to continuous improvement is standardization.
Every activity must be specified in detail so that the stable starting point for each improvement
is known and the improvements can be achieved without regression. Standardized work is a
key basis for stability and for continuous improvement, so this must be an aspirational goal.
Detailed visualization of routines that are performed many times is extremely important.
60
Only when standardized work is established can continuous improvement (kaizen) be applied.
All agents in the organization practice continuous improvement. They should never be satisfied
with status quo, and should move the organization far from equilibrium. Agents are all coached
for continuous improvement. This is a mindset that must be present in the whole organization.
Every single person can improve every day. This mindset can be created by giving employees
a stable employment guaranteeing them that they will not “kaizen themselves out of a job”, but
also by letting them enjoy the benefits of improved work conditions, more satisfied customers,
etc.
Concept 8: Visualization (mieruka)
What cannot be visualized cannot be improved. So work in progress must always be visualized
in a way that enables to see the issues immediately and solve them. In this visualization culture,
exposing problems is encouraged, and the role of management is reversed. It becomes the role
of the management to support the resolution of problems.
Concept 9: Making Things (monozukuri)
These are all the tools and techniques used to make great things. But even great things are done
by people, so training people so that they can make great things is even more essential.
3.4 Rules of lean
This formalized lean model is applicable to all organization forms. The observation of lean
applied to many organization types shows the most productive concepts. It also completes the
historically important concepts traditionally shown as pillars of the House of TPS, Just in Time
and Stop in Time (jidoka), which of course continue to be of paramount importance. The
management system, coaching, continuous improvement mindset and Customer First principles
are equally important. Historically, lean has been applied in Japan first, then in North America.
This has shown that lean was not only successful in Japanese society, but could be successfully
applied by non-Japanese nationals, contrary to a common argument against it. However, when
applying it in Europe, the challenge of language and culture can quickly become daunting.
Indeed, where cultures are extremely diverse (like in Europe or in Asian countries outside
Japan), the combination with a lack of direct access to the teachers can slow down adoption.
Conversely, it has been observed that the workers of Toyota plants in Turkey could learn
61
Japanese more quickly based on the structure of their language and that this gave them access
to first hand coaching from Japan that accelerated their quality improvement. A way to integrate
culture is proposed in section 4.1.
In the Harvard Business Review article “Decoding the DNA of the Toyota Production System”
[105], the authors describe four rules to capture the tacit knowledge that underlies the Toyota
Production System. The objective of these rules is to guide the design, operation and
improvement of every product and service. Here are the four rules:
Rule 1: all work shall be highly specified as to content, sequence, timing and outcome.
Rule 2: every customer-supplier connection must be direct. There must be an unambiguous
yes-or-no way to send requests and receive responses.
Rule 3: the pathway for every product and service must be simple and direct.
Rule 4: any improvement must be made in accordance with the scientific method23, under
the guidance of a teacher, at the lowest possible level in the organization.
To link the rules with the concepts mentioned in the LOF: rule 1 relates to the concept of
standardization, the basis for continuous improvement (kaizen); rule 2 relates to the concept of
Customer First with Go and See (genchi genbutsu); rule 3 relates to the concept of visualization
(mieruka) and rule 4 relates to the concept of Making People (hitozukuri), who in turn are
Making Things (monozukuri). It is better to let the people who best know the workplace (the
genba) take the decisions.
All the rules require that activities, connections and flow paths have built-in tests to signal
problems automatically. It is the continuous response to problems that makes this seemingly
rigid system so flexible and adaptable to changing circumstances.
Other authors have simplified this even further: Masaaki Imai entitles his book kaizen [107],
and says continuous improvement (kaizen) is all. Mike Rother [10] talks about improvement
kata and coaching kata as being all you need to understand, but while there is merit in all of
this, the truth is that what must be done is more complex. Still, it is equally correct that some
of these rules can define lean organizations much better than others. The four rules cited above
are the best set of rules found so far. Can those rules then be modeled to give a kind of “leanness
23 The scientific method, first pioneered by Descartes: everything must be based on facts
62
index” for the organization? The article mentions an incredible difference between the number
of improvements applied in the United States of America (25 per week) and in Japan in the
Kamigo plant (one every 22 minutes, which would be around 25 per shift), so not only the way
improvements are done, but the frequency of the improvements is key. Some companies set
targets on the numbers of kaizen applied.
3.5 The Lean Framework applied to various organization types
In this chapter, the proposed LOF framework is checked against the organization types already
described in 1.3, showing the improvements that can be brought to the state of the art on those
domains by applying the LOF systematically, then showing how it applies to a new domain not
explored before (a Lean Foundation), then demonstrating the Complex System nature of lean
by showing the parallel between the Immune System and lean. Finally, since this is a thesis in
Computer Sciences, a specific case study is dedicated to the application of the LOF in IT.
3.5.1 Industry
This is pretty much the classical way to apply lean, developed in numerous books mentioned
on page 29, and the basis our understanding of the concepts of lean.
3.5.2 Government
Concept 1: Customer First
The customers of the government are the citizens. To put them first instead of the optimizing
the administration resources or serving the interest of politicians drives a whole set of different
behaviors and a steep improvement for citizen services.
Concept 2: Satisfied stakeholders
In Government, it is usual to have different stakeholders to serve, with apparently conflicting
objectives. Lean provides a method to solve those conflicts, from example by reducing cost
through waste elimination and at the same time improving services by focusing on customers
(citizens).
Concept 3: Making People (hitozukuri)
63
To provide good services to the citizens, governments must take care of the development of
public servants. The government also organizes the education system of the country, which
aims to develop people. They can apply Lean Education concepts to this role.
Concept 4: Just in Time
To provide services to the citizens when they are needed and in the quantity and quality needed
is key. E-Government is a way to come closer to such goals.
Concept 5: Stop in Time (jidoka)
Objections raised by opposition parties, failure to be reelected for politicians who do not serve
their constituencies or even strikes represent ways to stop government activities. Of course, a
strike would rather mean “stop too late” than “stop in time”). Public opinion polls can give
warnings on unpopular measures and help the government or parliament to fine-tune their
executive orders and laws.
Concept 6: Safety
Safety of the population is a key goal for government. It can be the principle of precaution, the
protection from nuclear risk, the prevention of diseases, etc.
Concept 7: continuous improvement (kaizen)
Laws and regulations represent a standard that has been approved. Democratic debate and
amendment proposals propose a way to practice continuous improvement. To find ways to
objectively measure that the changes really bring improvements (meaning of kai-zen, change
for good) is a key capability that must be developed – and it is of course very difficult to achieve
consensus between conflicting political interest groups.
Concept 8: Visualization (mieruka)
A frequent complaint to governments is the lack of visualization of their actions, the reason for
them and the usage of public funds. Simple visualization techniques to make the decisions taken
understandable to the public can be extremely useful, including to support unpopular but
necessary measures.
Concept 9: Making Things (monozukuri)
64
This concept can be applied to government-led construction projects, where waste can also be
vastly reduced, applying concept 4.
3.5.3 Non-Governmental Organizations
These organizations are very often under-funded and try to achieve as much as possible to
support their target customers. In this context, every suppression of waste is welcome. Toyota
has supported Non-Governmental Organizations (NGOs) to draw out the waste from the supply
chain for distribution of meals to the poor. There are also websites supporting this cause24. The
LOF concepts for NGOs with project beneficiaries as customers will be discussed in more detail
in section 3.5.7 in the case of a lean foundation.
3.5.4 Start-Ups
Lean Start-Ups described by Ries [1] can be compared to the process of Lean Product
Development as described in [13]. In this comparison, the chief engineer (shusa) is the founder
of the start-up. The Customer First concept is applied with the MVP (Minimum Viable
Product), that enable frequent changes at the beginning, including a change of the whole
business model of the start-up, called “pivot”.
Our suggestion here is to keep an eye on the other principles as well. While the quality of the
product is not the first focus of the start-up, the company has to prepare for the next phase,
where the customers will have to pay for the products and will demand higher quality and more
functionalities. At that point, standardization enabling kaizen and quality will become as
important as Customer First and Just in Time were in the very early stages. I believe that it is
the lack of careful application of these principles that condemn start-ups with otherwise good
products to be forgotten, so my contribution here is to bring those relevant principles to the
table. Discussion about the needs for those things with Elastera, a start-up that Daniel T. Jones
is mentoring, led to the conclusion that a formal hoshin kanri process in a first start-up phase
would be far-fetched but that principles of Stop in Time (jidoka), standardization and
continuous improvement (kaizen) are much more relevant.
In Appendix 1, 25 concepts of the LOF are applied to the Lean Start-Up as one of the six
examples.
24 http://lean4ngo.org/home
65
3.5.5 Healthcare
Here, a broad version of the concepts has been implemented already, so all details will not be
developed. It is important to emphasize that some lean artefacts have a particular importance
in this context, as they are life-saving. This is the case for 5S (to guarantee hygiene and
appropriate tool usage) and fool-proof (pokayoke) devices that can prevent truly catastrophic
mistakes. Graban [14] is a reference in this domain. Appendix 1 also shows the main 25
concepts as applied to healthcare, including the main 9 concepts of the LOF.
3.5.6 Education
Education is the most important contributor to the world’s wellbeing and development, but it is
chronically under-financed everywhere. Hence, it is of paramount importance to be able to
apply the principles of lean to education, to have an affordable education system that provides
the needed level of education to the customers of education, the students. Appendix 1 details
the main 25 concepts of lean applied to education, but here are some examples in more detail:
Concept 1: Customer First
The questions of who is the customer of education may seem trivial, but it is not. If the customer
is the one who pays, some schools may consider the customers are the parents of the students.
Some may even consider that the customer is the state who wants to impose a particular type
of education. But the real customers of the education system are the students. This
understanding creates the basis for the right level of improvement. Professional colleges can
also see the companies who hire their students at the end of education as customers (which is
an extension of viewing the student as a customer because they will give them a job).
To teach the Chinese language to a western audience, it can be emphasized that there are no
articles, no conjugations, no declensions, etc., and the students can produce complete phrases
in different tenses very quickly. Then, of course, the difficulty of the four tones and complex
writing system with Chinese characters and radicals will have to be tackled. However, teaching
Chinese to a Japanese audience would be totally different, an extensive knowledge of Chinese
characters would be assumed from the start, since these are very close to the kanji used in
Japanese.
Concept 4: Just in Time
Many mathematics courses introduce simple notions in a very complicated way, in order to
make sure that complete rigor is achieved. However, if doing this loses 99% of the students, the
66
relevance of complete rigor becomes much less obvious. In such a case, the notions would better
be introduced at a more appropriate time. What is needed is to understand what the students
need to know now. The complicated notions can be brought up at a later stage, when it will be
clear why they are needed. This is the concept of “Minimum Viable Product” applied to
education.
All who have enjoyed their student life for one year only to work super hard, creating
overburden (muri) during the exam period know that this is not the best way to study. Higher
education is now more and more often delivered in smaller modules. These require
concentration by the students for a few weeks on a subject, then to pass a kind of test, before
moving to the next material. On top of avoiding overburden, this also realizes levelling
(heijunka) and removes its contrary, unevenness (mura). As for lean in industry, waste
elimination will proceed in this order: first overburden (muri) then unevenness (mura)
elimination. Then the many forms of waste (muda) can be eliminated, like the waste of waiting
(teachers or students coming late for example) or waste of motion (for example a course
organized in a building, the next in another building far away, then back to the first building),
etc.
Concept 5: Stop in Time (jidoka)
Many teachers do not stop when the class does not follow them. Applying this concept means
to have a simple feedback system to make the teacher aware of the issue. Then, the teacher must
stop, understand the issue, and apply a countermeasure. Maybe their explanation was not clear,
maybe a prerequisite was missing, etc. This will of course lead to continuous improvement
(kaizen).
Concept 7: continuous improvement (kaizen)
Again, how many teachers improve or even are allowed to improve their course every time?
How many government imposed programs prevent them from doing kaizen because they
impose the content of the course? In higher education like universities, the good professors will
naturally update and enhance their courses every time, including current state of the art. Even
so, more and more students claim that they learned the most from Youtube (see the comments
from Bob Emiliani in [58], p.XIV). Kaizen is based on standardization. This point is easier to
achieve in this case, because there is almost always a book to follow, a printed course or course
notes, etc., so the standard is a given in most cases, at least in developed countries, with the
means to have books available.
67
3.5.7 Lean Foundation
Now, let us apply the LOF to a new case that has not been handled before, a Lean Foundation
(the word “foundation” is used here in the sense of a charity, like the Bill and Melinda Gates
Foundation). The LOF was applied to this topic, and the points discussed with the
representatives of two foundations, Mr. Emmanuel Hermand of IHES25 and Mrs. Hélène Monot
of the Fondation de l’Université de Strasbourg26. Thank you to both of them.
Concept 1: Customer First
Who are the customers of a foundation? This is a non-trivial question. In a commercial
enterprise, the customers are those who pay for the products and services offered by the
company. In a government, the customers should be the citizens. In healthcare, the customers
should be the patients. And this even though there is a long history of healthcare services being
optimized for the expensive resources (the doctors) or government services being difficult of
access for the citizens. If the same logic is followed, the customers of a foundation are not the
donors but those who will benefit from the projects of the foundation. In this case, “Customer
First” will mean to choose the most useful projects and pull the flow from there, minimizing
the cost of getting money. Management of the objective (hoshin kanri) can be used to articulate
the priority axes of the foundation and share them with the donors to give them a sense of
purpose, as well as allocate main projects to the responsible persons. Customer First is
supported by Go and See (genchi genbutsu) at the place where the projects happen (genba): go
and see how the money is spent and check that it contributes without waste to the proposed
projects.
Concept 2: Stakeholder Satisfaction
Donors must be satisfied with the usage of their donation, in order to motivate them to give
more or encourage more people to give to the foundation. To achieve this, regular visualization
of the value delivered is important and can be provided by the same means that are used to
follow up the projects themselves.
25 Institut des hautes études scientifiques, European equivalent to Princeton, https://www.ihes.fr 26 https://fondation.unistra.fr
68
Concept 3: Making People (hitozukuri)
The foundation will support people to become self-reliant. This is the very well-known story
about teaching a person how to fish instead of giving fish to feed this person. Respect for people
means to respect all the employees of the organization, recognizing them for their current
competence and coaching them towards the next level. The next level that cannot be impossible
to reach, but should be higher than current, by allocating projects to the employees, stretching
them reasonably to the next level. Respect here is the respect of every agent’s capability to
improve himself and his or her work. A question asked very often is whether there is a lower
limit to competence that makes it impossible to coach people, but a very important point about
lean is that whatever the initial level of the person, it is always possible to define a better level
and coach the person to achieve it. Of course, this works only when combined with a good way
to recruit people and have them work at the right place without being too stretched by the job.
Concept 4: Just in Time
The projects, pulled by the customers, should get started quickly, with the right funding. They
should get results so that more projects can be done and more donors can be convinced.
Waste elimination means here that activities without added value will be tracked and eliminated
without mercy (except those mandated by legal or compliance reasons). For example, lavish
parties for donors that reduce the money available for projects that serve the purpose of the
foundation must be eliminated. Administrative burden that slows down the start of projects
must be removed and projects that do not lead to desired outcomes should be stopped early.
Concept 5: Stop in time (jidoka)
This principle, a fundamental pillar of the Toyota Production System together with Just in Time,
means to stop the system when abnormalities are detected. In our case, everybody working on
a project should be able to stop the project or modify it in the interest of the recipients if it is
going wrong. This requires courage, sharing and visualizing problems, work on problem
solving, explain why doing something else is better, etc. It naturally helps management
becoming better and acting quickly to solve issues, hence improving the utilization of funds.
Concept 6: Safety
No difference to other applications of lean: safety of the employees of the foundation and of
every recipient of the support will always come first in everything the foundation does.
69
Concept 7: continuous improvement (kaizen)
Only when Standardized Work is established, can the continuous improvement (kaizen) be
applied. Every activity of the foundation will be specified in detail (standardization), so that the
stable starting point for each improvement is known and the improvements can be achieved
without regression. All agents in the organization will practice continuous improvement
(kaizen). Never being satisfied with status quo moves the organization far from equilibrium.
Agents are all coached for continuous improvement (kaizen), while letting them pursue their
own ideas (in this model, management will help people remove obstacles, rather than block
good ideas). Each improvement will follow the PDCA (Plan-Do-Check-Act) cycle of
Shewhart/Deming [108].
Concept 8: Visualization (mieruka)
The ongoing projects and their difficulties must be visualized to make sure those who can help
can see the status and propose help proactively, including stopping projects if that is the best
decision. Visualization (mieruka) is also very important to enable the donors to understand what
happens with their money and encourage them to donate again because they feel confident with
the level of transparency provided. When coaching employees, it is essential to leave them
express ideas by themselves, to structure them using A3 documents (A3 is the paper format that
is used a lot at Toyota and other lean organizations as a constraint to create structure and
synthetic thinking for idea sharing and reporting), and share them with those knowledgeable
about the topics by consensus building (nemawashi).
Concept 9: Making things (monozukuri)
This concept will be applicable to the individual projects, based on their specific situation.
3.6 Lean IT
In this PhD in Computer Science it is natural to have a section on Lean IT. As explained in
1.3.2, it is more important to use IT to support lean for the whole company rather than applying
lean itself to IT. It is in this context that the eHoshin application was created (see section 4.3).
IT is used to enable communication for a lot of people, even globally distributed, in order to
create their buy in, choose better objectives for the organization and enable the smooth
70
execution of these objectives. IT is a relatively new field for lean. Steve Bell [15] [16] [17] is a
major author on the Lean IT subject.
3.6.1 LOF applied to IT
In this section, the application of the LOF concepts to Information Systems is described.
Concept 1: Customer First
Many IT failures have been explained by a lack of interaction between customers and IT during
the course of the projects, leading to systems that are barely used or not used at all. This concept
guides us to “do the right things”. This can be ensured by the management of the direction
(hoshin kanri), see [109]. Even when the right project is chosen, to do it well necessitates many
interactions and requirements can change along the way. A good way to address this is to apply
Scrum [110], where a Product Owner will represent the customer and make sure that the
requirements with highest value are delivered first in short cycles called “sprints”, and a Scrum
Master will lead the IT delivery activities.
Concept 2: Stakeholder Satisfaction
Within Toyota IT, all projects – no matter how small or how large – are measured. During the
initial stages of the project, IT members work with the business to explicitly define a number
of Key Performance Indicators (KPIs), which will be used to measure success (or failure) of
the IT developments. Usually these KPIs fall into broad categories of:
(a) Cost reduction
(b) Lead time reduction
(c) Improved quality
The project team will work with the business to quantify these KPIs:
(a) What is the current situation (the value of the KPI at the start of the project)?
(b) What is the target situation (the value of the KPI after delivery of some/all features)?
(c) How, where and by what method will the KPI be measured/evaluated?
(d) Who will be responsible for executing the measurements?
71
After the completion of the project (typically six months after a new system is in the “go live”
stage) the project is “audited” and the measured KPIs are checked to determine if the project
has delivered the business value initially promised. These audit reports are shared between the
IT and business management and if the targets have not been achieved, a reflection is done to
determine which additional activities must be done to meet them. These can be additional
activities on IT side (e.g. extra system features) but also might be actions to further optimize
the business processes.
As an example, consider the “Warranty Problem Follow Up System”. Toyota recovers parts
which have been replaced under warranty from the market. It sends these parts back to the part
supplier and expects the part supplier to investigate the parts and create a problem investigation
report which is analyzed by the Toyota vehicle engineers. Prior to the development of the
mentioned system, the reports created by the suppliers were shared via e-mail. An analysis
showed that suppliers sometimes did not share reports; other reports were late and sometimes
reports got buried in the mailbox of the Toyota engineer without further follow up action. A
relatively simple workflow system was put in place which tracked the recovery of the warranty
parts and the arrival of that part to the supplier? The system allowed the supplier to upload the
investigation report and it also tracked the approval by the Toyota vehicle engineer. The audit
KPIs (Key Performance Indicators) defined at the start of the project were:
(a) 100% tracking reports for all recovered warranty parts
(b) Maximum lead time of 5 weeks for the supplier to deliver the investigation report
(c) Maximum lead time of 3 weeks for the Toyota engineer to approve the report.
The KPIs could be measured in a very simple way: (a) all recovered warranty parts were
scanned (using a barcode) when they were picked up at the dealer and this automatically
triggered the workflow in the system, (b/c) the system maintained a date/time stamp for each
action in the workflow. A few simple database queries allowed IT to automatically collect the
data for measuring the KPIs which were agreed upfront. Six months after the initial
implementation of the system the audit report was presented to the management of the Quality
and IT division in Toyota. A significant improvement could be demonstrated versus the
situation prior to the system’s implementation. By merging sales and manufacturing IT in 2007,
Toyota Motor Europe achieved a 30% cost reduction. By deploying Pan-European application,
Toyota is achieving a further 30% reduction.
72
Concept 3: Making People (hitozukuri)
People development through OJD (on-the-job-development) is a key mechanism through which
employees in Toyota grow their capability. OJD looks at the work the company needs to do,
the work the employee is capable of doing (based on his experience, training and academic
degree), and the work the employee is interested in (as this is a main driver for motivation). In
this framework, Toyota employees are challenged to accept work which the company needs to
do, work which the employee is interested in and at the same time work which is slightly beyond
the employee’s current capability level. Through management coaching the employees are then
supported in the expansion of their capability especially when it concerns the expansion of the
employee’s “Toyota way” capability.
IT work is however a bit special with regards to other work within Toyota. IT work often
requires dedicated technical expertise which is not automotive related and therefore not
immediately tied to Toyota’s core business of making high quality vehicles.
Two mechanisms are used within Toyota’s IT to address that technical capability: (a) individual
contractors with specific technical IT expertise may be hired during specific periods of time to
complement the IT knowledge of the Toyota employees and (b) specific parts of the IT work
are outsourced to a small number of partners; for example, all application maintenance activities
are offshored to an IT partner in India.
Toyota employees therefore have an essential role of managing external contractors and IT
partners making sure that their contributions not only result in proper deliverables for the task
at hand but also that the work is executed in such a way that it is aligned with the “Toyota way”
concepts and according to Toyota’s internal standards.
External IT suppliers who work with Toyota for the first time often suffer difficulties initially.
They are not used to the management style, communication, challenging and reporting which
is so pervasive within Toyota’s IT. It is often observed that (new) IT suppliers struggle during
the first months of doing work for Toyota. This is because they do not only have to deliver the
content work, but also need to manage and report their activities in a way which is totally
different to what they have to do for other clients. This often creates friction and even frustration
73
as it takes time for the IT supplier to understand why Toyota is working in a specific way and
to see the value of this. The Toyota employees play a crucial role to achieve this. They act as a
coach and mentor to support the IT suppliers in understanding and applying Toyota’s
management style and way of working. This is done because of a fundamental belief that
Toyota’s company concepts are useful to IT contractors and partners.
Although no hard-factual evidence is provided in this work, experience has shown that IT
contractors and suppliers successfully deliver projects to Toyota when they successfully align
their own way of working with the Toyota Way concepts.
Concept 4: Just in Time
When value is created, it must be brought to production as soon as possible to make sure the
customers can enjoy this value. In addition, it guarantees that, if a crisis occurs or a more urgent
project takes priority, what has been already done is not lost by never reaching the production
environment, the only place where value can really be added. Each system in the development
process is a stock that should be minimized like the stocks are minimized in the Toyota
Production System. Enabling frequent and timely delivery of value to the end customers
requires to rethink the whole IT function and apply new ideas. One of them is DevOps, which
means moving developed code of good quality directly to operations when it is ready. It has no
meaning to have a streamlined silo in IT like a development team delivering high value new
code every week if the team in charge of the release to production is then blocking this code for
weeks before it can be released. Of course, blocking for lack of quality is just applying concept
2, so this is strongly encouraged.
To achieve this, Toyota’s IT projects are executed in an iterative and more and more agile
manner [28]. Requirements are organized in a business backlog based on expected business
value. This prioritization is done by the business members. The efficiency of the development
team which implements the requirements is explicitly measured in terms of function points or
story points so that it is known how much they can deliver in a certain time span. At the
beginning of each iteration (or agile sprint) the prioritized requirements are then estimated as
well by the development team. Together these two variables (business priority and size)
determine what will be implemented in the next iteration or sprint of the project. This
mechanism of production where “small batches” drive the production process is well known
from the TPS (Toyota Production System) philosophy which is applied in Toyota’s production
plants and which drives the Just in Time philosophy. The effect of this has been measured
74
within Toyota’s IT on one project centered around vehicle order management. Over the course
of two subsequent years the impact of the development method was measured on a comparable
batch of change requests. During the first year, the change requests were implemented using a
traditional waterfall style of development. Change requests were batched up in big chunks of
functionality, requirements were then elaborated and documented and the changes were
subsequently implemented. They then went through a system testing cycle and finally through
a period of user acceptance testing. Over that year, two large system releases were put into
production. The second year, a similar amount of change requests (in terms of function point
size) was managed in an Agile way. The same project team executed the implementation of the
change requests but now in an Agile (Scrum) mode. Over the second year, 15 releases were put
into production. Overall the quality of the releases compared across the two years in terms of
“critical defects” was found to be quite similar. However, it quickly became clear that the time
to market was a lot shorter in the Scrum approach and the business benefit associated with each
change request could be achieved faster. Measured in monetary terms, the business benefit that
was achieved in the first year after nine months was achieved already after five months in the
second year. Although each Scrum iteration comes with some apparent overhead (e.g. overhead
of multiple production deployments) the overall benefit of Just in Time could be easily
demonstrated. The Just in Time concept achieved through Scrum lowers the “work in progress”
(translating requirements into code, testing the code, deploying it to production) which – viewed
in terms of the Toyota Production System terms – is inventory and therefore a form of waste
(muda). Eliminating this waste is an import component to realize Just in Time.
Waste is everywhere, and IT is no exception. By observing and visualizing the processes, it is
always possible to find improvements. Whole teams can be blocked waiting for other teams to
finish some task that is not a priority for them. A server may need to be installed or provisioned
before an application can run. A virus can spread to a whole company forcing everybody to
stop working while a single person is sorting out the damage and applying countermeasures,
etc.
Toyota employees in general – and IT members are no exception – follow a common process
for eliminating waste. When problems occur – for example during the support and maintenance
activity on systems – the fifth concept, Stop in Time (jidoka) will trigger the team / organization
to stop (this fact in itself – a system which has a problem – is already considered a form of
waste). The problem is then broken down in sub problems based on qualitative and quantitative
75
data. Once the point of cause of the problem has been found the process is mapped out and the
root cause of the problem must be identified through a thorough “five why” analysis as
pioneered by Taiichi Ōno [6]. This means asking “why” repeatedly until the root cause of the
problem can be found (no more “whys” can be asked). Of course, it could be less or more than
five times, five is just an image. A lot of time is spent in this problem-solving activity as finding
the real root cause is not obvious and often leads to things which at first sight are totally
unexpected. Consider for example a system incident where a computing process fails as a result
of a division by zero. The first – and immediate – reaction could be to fix the code and capture
such exceptions (which would be good practice anyway). However, why was the specific data
item triggering the exception zero in the first place? Possibly because the user entered the data
into the system at some specific point in time. Then further questioning should reveal why the
user could have made that mistake. Was it just a typing error (in which case a simple validation
rule might be put in place to help avoid that)? Or was it that the user did not know that a
particular field should not have had a zero value (in which case appropriate training might be a
solution). This example illustrates that proper waste elimination results from a proper problem
solving activity. All Toyota employees – and this includes IT members – use the same problem
solving framework to eliminate waste and optimize processes.
Concept 5: Stop in Time (jidoka).
In application development, but also in the running of applications, the process must be stopped
when mistakes are identified. If developers propagate bugs to unit testing, then integration
testing and user acceptance testing, that will inevitably increase the costs of the project.
Likewise, in production, if an abnormality occurs, it is better to stop the system and correct it
before continuing than to propagate errors that can be very tricky to undo, like database
corruption. This concept will ensure to “do the things right”. Within Toyota’s IT there is also
this culture of stopping when things go wrong. IT systems deployed in production environments
are always monitored and if an incident occurs, this is automatically captured (through the use
of monitoring software), measured (through the criticality associated with the application or
application function), visualized (through electronic signaling boards and acted upon (through
a standardized process of “failure reduction” called root-cause analysis and countermeasure
implementation). Toyota’s IT has year by year reports on the number of incidents impacting
business with clear targets to reduce them. There are also application specific measurements
that show metrics like number of incidents per function point or story point. These enable IT to
76
position the application quality compared to known norms like CMM (Capability Maturity
Model) and compared to each other. The incident reduction activity is spread throughout the
whole IT organization. All teams responsible for IT application support get involved in it and
the collected metrics are visualized in the corporate IT “big room” (obeya). This is a dedicated
room where all IT members can see the status of projects and application support activities. In
addition, the problem-solving activity for “rank A” (most important) incidents is shared – using
standardized incident reports – at various levels of IT management to promote organizational
learning. Once the root cause of an incident has been found, countermeasures are formulated
and these are also formally tracked for implementation. This tracking is not only in terms of
(promised) target date but also in terms of effectiveness (i.e. does the countermeasure actually
ensure that the same incident will never occur again). This does require a lot of formalism,
automated and semi-automated tooling and reporting. However, this mechanism of stopping
when the problem occurs (jidoka) drives continuous improvement (kaizen, see concept 6),
sharing of problems (and their solutions) and promotes organizational learning.
Concept 6: Safety
Toyota has a very strong safety culture. Ensuring the safety and health of employees is
considered the foundation of corporate activities and is especially pervasive in the Toyota’s
manufacturing environments and plants. Based on the philosophy of “Respect for People”,
which has been carried out through Toyota’s entire history, all of its employees become one
to create a “safe and energetic work environment” and to prevent accidents and occupational
safety incidents.
In an office environment (of which IT is a specific example), two perspectives drive the safety
culture: safety of IT people and safety of IT systems. In terms of people safety specific IT
related countermeasures are implemented as many IT workers spend hours a day in front of a
computer without thinking about the impact on their bodies. They physically stress their bodies
daily without realizing it by extending their wrists, slouching, sitting without foot support and
straining to look at poorly placed monitors. IT personnel gets specific ergonomic advice and
their workplace is set up to avoid such body stress as much as possible.
Safety of systems is obviously a totally different story. Workstations and PCs have standardized
setups so that it becomes easier to manage them centrally and remotely. PCs are physically
77
secured by attaching them to the desk so they cannot be easily removed. Portable PCs have
special tracking devices which allow automatic tracking of which devices enter and exit the
building. In building areas where highly confidential information is available (e.g. R&D or
production engineering) great care is taken that no camera or video recording devices are
brought in.
Finally, there is the dimension of cybersecurity which is handled by a specific security
department within IT. Policies and countermeasures are implemented here which look
specifically at (external and internal) hacking and cyberattacks. As many of Toyota’s
applications are internet facing (e.g. websites but also applications used by Toyota’s part
suppliers) specific measures are taken to guarantee system safety. In addition, the cybersecurity
department also takes care of data security and protection. For example, ensuring adherence to
policies managing the usage of Toyota’s customer data and making sure that they comply with
regulation such as GDPR (General Data Protection Regulation).
IT also drives a program of information sharing and education around cybersecurity. All Toyota
employees get basic training in IT security to raise awareness on topics such as spam, phishing
or ransomware and information screens available on every office floor display hints and tips to
employees on how to recognize and deal with such security issues.
Concept 7: Continuous Improvement (kaizen)
This is a mindset that must be present in the whole organization. Every single person can
improve every day. This mindset can be created by giving the employees a stable employment,
but also by letting them enjoy the benefits of improved work conditions, more satisfied
customers, etc.
The mechanism of continuous improvement was already demonstrated in the Stop in Time
(jidoka) concept above on incident monitoring and problem solving. That is a reactive
mechanism where action is taken when problems have already occurred. However, the same
mechanism is also used proactively during the system’s support life cycle. Systems are often
constructed using various types of technologies and software components ranging from in-
house developed libraries or micro-services to off the shelf components such as open source
software and software packages like Enterprise Resource Planning (ERP). Tools such as Sonar
or Cast are used to measure technical debt and critical issues.Standardization and standardized
78
work are important components to achieve continuous improvement (kaizen). IT has been
practiced as an art for a long time, so it is not easy to replace one programmer by another and
have both working in exactly the same way. However, standardized work is a key basis for
stability and continuous improvement, so IT must also aspire to this goal. Good visualization
of routines that are performed many times (for example in a service center or an operations
team) is as important as on the assembly line.
Toyota’s IT standardized work is made visible through standardized processes for executing
new projects (development of new IT systems) as well as for the day-to-day support of existing
business applications. This is of course not specific to Toyota. Most (large) IT organizations
have implemented standard systems development life cycle models with appropriate control
and governance points. What may be unique to Toyota however, is that the whole IT
organization is involved in this life cycle at specific points in time. For example, all projects
will start with a so called “kick off” communication to everybody in the organization. This
announces the start of the project providing background on why the project is being done, the
expected benefits for users, some indication of timing, complexity and cost of the investment,
etc. Likewise, when the project is audited (see the example given for the Customer First
concept), the whole organization will be informed about the main results. In addition, at specific
governance checkpoints during the project, representatives of different groups in IT will come
together to assess the feasibility of the proposed solution and provide their feedback to the
project team developing the new system. For example, during the requirements phase, a high-
level design for the system will be created. This is not just a work which is done by the software
architects. Many other parties get involved: members from the purchasing department will
question the architecture based on, for example, license cost. Members of the infrastructure
department will contribute by making sure that the proposed architecture will be easy to deploy.
Likewise, members of the audit department within IT will want to confirm that the system under
development complies with SOX27 requirements. This ultimately creates a form of collective
ownership and makes sure that all parties in the organization have consensus on the chosen
solution. It also avoids that the project team runs into surprises during the system’s development
life cycle.
27 SOX is the “Sarbanes-Oxley act of 2002” of the United States of America, setting expanded requirements for publicly listed companies.
79
In addition, the support and maintenance processes which are followed after go-live of a new
IT application are formalized. Applications are classified into Service Level Agreements
(SLA’s) driven by business criticality (platinum, gold, silver, bronze) each with specific
constraints on acceptable level of incidents, number of expected defects and volume of (minor)
change requests. Data is captured on expected versus actual performance during the
maintenance and support cycle so that the whole application portfolio can be compared and
optimized. Reports about application maintenance performance are again shared at all levels of
IT management so that best practices and improvements get shared across the whole
organization allowing each team to learn from what other teams have done. Standardization,
measurement and reporting are required to drive continuous improvement (kaizen). Toyota’s
philosophy is that without standardization there cannot be improvement. This is also the third
rule of Spear and Bowen [105] (all work shall be highly specified as to content, sequence,
timing and outcome).
Concept 8: Visualization (mieruka)
The Japanese term mieruka means visualization or visual control. This concept takes the
meaning of « a picture says more than a thousand words » to a different level. The purpose here
is to summarize and present information in a simple visual way so that it is easy to understand
and act upon. In the Toyota environment examples of visualization are literally everywhere.
These range from lines on the floor indicating a route to follow to whiteboards which display
progress of projects to electronic display signaling IT related system incidents. Effective
visualization makes things easy to understand and act upon.
In IT for example, each project has a standardized A3 project sheet (called wallchart) which
displays key information about the project: high level schedule (and eventual delays), cost and
quality status, main issues/risks and countermeasures. Individual project wallcharts are « rolled
up » at department level and displayed in an IT corporate obeya (big room). This way, IT top
management can obtain overall status information in a standardized format in a single location.
The main driving concept is that problems are never hidden. Projects which suffer from some
difficulty are reported as being in « X-condition ». The fact that this is visualized in the obeya
allows IT management to easily understand where they need to support and interfere.
80
Although much of this could be easily automated through IT tools, it is often preferred to use
A3 reports and physically hang them up on the walls of the visualization room (obeya). This
allows multiple people to stand around the report to discuss about and align on countermeasures
that need to be taken for projects or activities that are in difficulty. Visualization is such an
important tool in the Toyota culture that all employees are trained on how to make effective
visualizations and A3 project reports. Hints and tips are provided on how to layout A3 papers,
how to present specific pieces of information (e.g. through graphs and charts) and how to
express the status of activities in a standardized way. Whenever you walk into a Toyota office
(be it in HR, logistics or purchasing) one is able to quickly grasp what is happening by looking
at the visualizations on the office walls. This way of sharing and presenting information is so
pervasive in the Toyota DNA that it is a major concept of the lean management.
Concept 9: Making Things (monozukuri)
Literally, monozukuri means “the process of making things” (mono= 'thing' and zukuri – from
tsukuru - 'process of making'). However, the literal translation does not convey the real
connotation of the word monozukuri. The word has a more intense meaning; monozukuri is
about having a state of mind, the spirit to produce not only excellent high quality products but
also have the ability to constantly improve the production system and its processes.
In Toyota’s IT, the “products” that made are twofold:
(a) IT projects which produce a new IT system (or extension to an existing system) to support
specific business processes
(b) Day-to-day operational activities to keep systems running, have them perform according to
the agreed SLAs and provide support to the user community that makes use of the IT tool.
Within Toyota’s IT both of these processes are heavily standardized. IT projects are managed
via a specific delivery life cycle with control and governance points. Operational IT system
exploitation is managed through ITIL style processes and tools. Although Toyota’s IT will look
at industry standards and benchmarks to implement such processes, these processes will always
be fine-tuned with Toyota specifics; e.g. implement PDCA cycles in the IT projects at micro
and macro level; use mieruka to visually show the status of project activities.
Even those processes are standardized within the IT organization, they undergo regular kaizen.
Processes are improved based on new needs and problem situations which occur in the
81
application of the processes. The driving concept behind those improvements is Built in Quality
with Ownership (jikotei kanketsu or JKK). The process is broken down into its steps; problems
are then identified with the input, process and output of each step. Countermeasures are
formulated to address the problems. Based on the countermeasures changes to the inputs,
process or outputs are proposed. They are then subsequently implemented and measured for
their effectiveness. Doing this is usually not very complicated in itself. However, establishing
the organizational mindset and kaizen attitude to keep these improvement cycles going is core
and can be described as Toyota’s DNA.
As an example of such process improvement let’s consider the Feasibility Assessment Report
(FAR) meeting process. When a new IT project is kicked off, the project manager is expected
to come to the FAR meeting. This meeting contains representatives of systems engineering,
operations, networking, vendor management, enterprise architecture, security and so on. At the
meeting the project manager is expected to explain what the project is trying to achieve, which
business problem it will tackle, what IT solution is being proposed, how much the solution is
likely going to cost, what potential technology options there are, etc.
The various participants of the FAR meeting then use standard criteria to assess whether or not
the project is “ready enough” to move ahead. For example, if a project proposed to use a
reporting solution on the cloud that uses on premise live data, the network team might raise
questions or concerns related to data volume and bandwidth required. They may subsequently
request the project team to explicitly quantify these volumes in order to assess that existing
network equipment will be able to handle the required traffic. The project will not be allowed
to proceed to implementation before providing a level of clarity which is accepted by the
network team.
Recently the FAR meeting process was improved to include a number of very basic security
checks (e.g. Is the application being implemented public internet facing? Does the application
utilize and manipulate customer data for which special rules will be needed in terms of GDPR
data handling?). The FAR process was also extended to include a very basic security risk
assessment (low, medium, high) based on a simple security questionnaire. The risk assessment
is recorded on the FAR assessment report. This not only provides visibility to IT top
management on the security risk of the project, but it also triggers specific checks during the
project life cycle to address any security concerns.
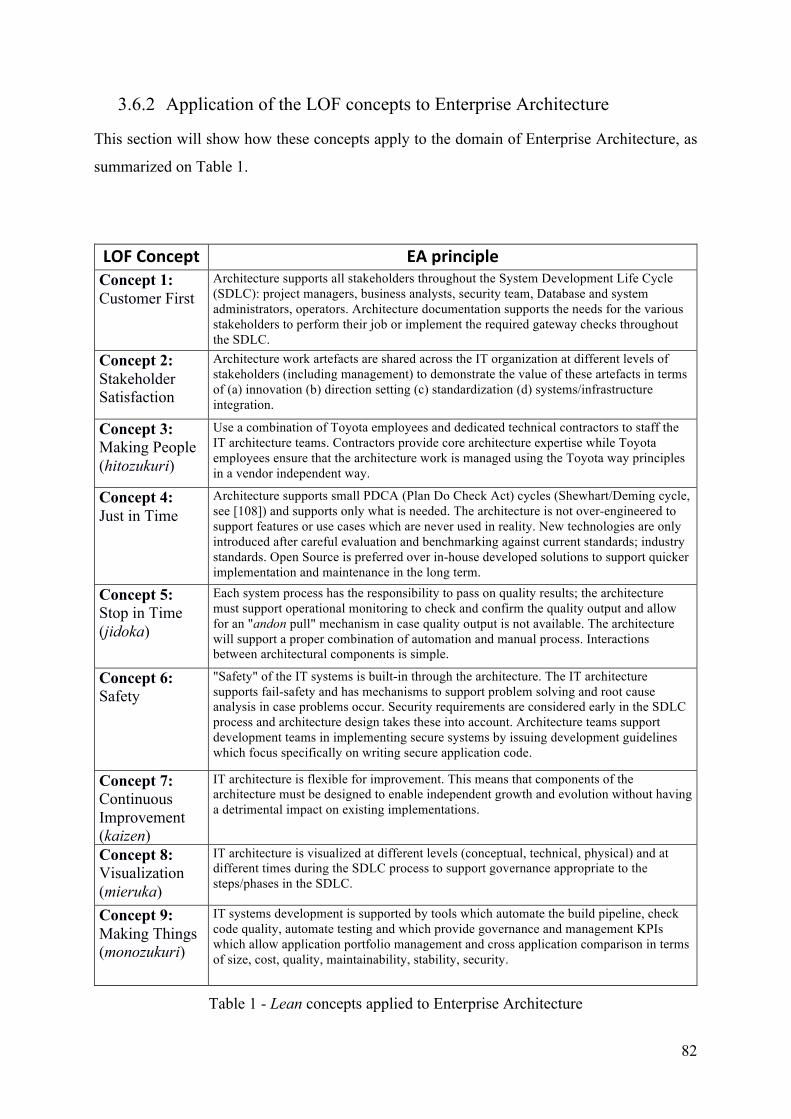
82
3.6.2 Application of the LOF concepts to Enterprise Architecture
This section will show how these concepts apply to the domain of Enterprise Architecture, as
summarized on Table 1.
LOFConcept EAprincipleConcept 1: Customer First
Architecture supports all stakeholders throughout the System Development Life Cycle (SDLC): project managers, business analysts, security team, Database and system administrators, operators. Architecture documentation supports the needs for the various stakeholders to perform their job or implement the required gateway checks throughout the SDLC.
Concept 2: Stakeholder Satisfaction
Architecture work artefacts are shared across the IT organization at different levels of stakeholders (including management) to demonstrate the value of these artefacts in terms of (a) innovation (b) direction setting (c) standardization (d) systems/infrastructure integration.
Concept 3: Making People (hitozukuri)
Use a combination of Toyota employees and dedicated technical contractors to staff the IT architecture teams. Contractors provide core architecture expertise while Toyota employees ensure that the architecture work is managed using the Toyota way principles in a vendor independent way.
Concept 4: Just in Time
Architecture supports small PDCA (Plan Do Check Act) cycles (Shewhart/Deming cycle, see [108]) and supports only what is needed. The architecture is not over-engineered to support features or use cases which are never used in reality. New technologies are only introduced after careful evaluation and benchmarking against current standards; industry standards. Open Source is preferred over in-house developed solutions to support quicker implementation and maintenance in the long term.
Concept 5: Stop in Time (jidoka)
Each system process has the responsibility to pass on quality results; the architecture must support operational monitoring to check and confirm the quality output and allow for an "andon pull" mechanism in case quality output is not available. The architecture will support a proper combination of automation and manual process. Interactions between architectural components is simple.
Concept 6: Safety
"Safety" of the IT systems is built-in through the architecture. The IT architecture supports fail-safety and has mechanisms to support problem solving and root cause analysis in case problems occur. Security requirements are considered early in the SDLC process and architecture design takes these into account. Architecture teams support development teams in implementing secure systems by issuing development guidelines which focus specifically on writing secure application code.
Concept 7: Continuous Improvement (kaizen)
IT architecture is flexible for improvement. This means that components of the architecture must be designed to enable independent growth and evolution without having a detrimental impact on existing implementations.
Concept 8: Visualization (mieruka)
IT architecture is visualized at different levels (conceptual, technical, physical) and at different times during the SDLC process to support governance appropriate to the steps/phases in the SDLC.
Concept 9: Making Things (monozukuri)
IT systems development is supported by tools which automate the build pipeline, check code quality, automate testing and which provide governance and management KPIs which allow application portfolio management and cross application comparison in terms of size, cost, quality, maintainability, stability, security.
Table 1 - Lean concepts applied to Enterprise Architecture
83
Concept 1: Customer First
The Customer First concept supports built-in quality with ownership. “Ownership” is the key
word here. It means that the person executing a process must be capable of judging the quality
of the output of that process. In the case where the process is fully automated, this implies that
either the process itself has the capability to judge the quality of the output or that there is a
human making that judgement.
From an IT architecture point of view, implementing the Customer First concept is not at all
obvious. IT systems and software components are usually easy to identify: these are the
modules, classes, interfaces out of which our systems are composed. Allocating ownership to
such components is usually also relatively easy: the developers or maintainers of these
components. However, that is not the full story. Allocating ownership also means that the
interactions between the different components are simple, easy to understand and ideally as
minimal as possible. Components must therefore have low degrees of (simple) dependencies as
this makes it easier to pinpoint the ownership and allocate responsibility for them to a well-
defined individual and/or team. Of course, this is totally in line with the generally accepted
principles of good software/systems engineering practices such as modularity, uniformity, data
abstraction or information hiding. A modular architecture, i.e. an architecture which allows
system components to be easily “separated” from each other, simplifies allocating ownership.
A uniform architecture, i.e. an architecture which uniformly uses a certain set of patterns,
improves testing (quality) as some of the judgement criteria for testing the components can be
made generic. Proper data abstraction, i.e. an architecture which centralizes common data, again
improves (data) ownership and maintenance. Finally, information hiding, i.e. an architecture
which is built around clearly defined interfaces between system components, again improves
the allocation of ownership.
However, it is also necessary to look beyond the pure « development » aspect of the
components and consider how these components are subsequently deployed in a production
system. Firstly, the « owner » is likely to change (usually it is a different « owner » than the
developer who originally wrote the code for the components). Secondly, how these (new)
owners will judge the quality of the results produced by components must be considered.
Quality from an operational point of view may be very different from quality during the
development lifecycle. Properties such as availability, robustness, scalability, ease of
monitoring, downtime and backup are also important. Therefore, Enterprise Architecture
84
activities in this model do not only pay attention to the components which comprise the IT
systems. They also consider the operational environment and processes in which the target
system has to operate. This is depicted in a so-called “hybrid diagram” which is a combination
of hardware, software, middleware, software stacks, network properties, security and so forth.
The hybrid diagram is created early during the life cycle of system/IT projects and consensus
is built, not only with the IT teams delivering the system/application, but also with the systems
engineering support teams and application maintenance teams which will ultimately be
responsible for “operating” the new system and for providing the day-to-day support to the
business users.
To illustrate how the IT department studied has implemented the built-in quality with ownership
principle, a good example is the Vehicle Master Data Domain (see detailed case study in section
3.6.4). Core vehicle master data (entities, attributes, relations) are managed by a business
governance body controlling the semantics of the vehicle data. That governance body is
business driven and multiple business divisions within the company (R&D, Manufacturing,
After Sales) participate to it (ownership). From an IT architecture point of view, the data is
implemented in a cloud-based database maintained by a central IT team (ownership) which
closely works with the governance body. On top of this there is a REST API which different IT
applications use to consume the vehicle data.
Concept 2: Stakeholder Satisfaction
From the perspective of the EA department in Toyota’s IT there are two important stakeholders.
First, the “application teams” (IT teams which face the Toyota business areas) which are
ultimately EA’s customers. Second, the IT executive management who wants to be informed
about and influence EA’s proposals on application and technology architectures.
To maximize the value of EA for the application teams, the Toyota IT internal SDLC process
mandates that application teams consult EA even at the time of “feasibility study” of their
project. This way, EA is involved early in the project and aware of the discussion between
business and IT on the project’s overall direction and high level requirements of the system to
be built. EA is obviously responsible for overall system and integration architecture but
throughout the SDLC the project team will often consult EA to get advice on technical matters
related to system design, implementation and testing. Each application project is therefore
assigned a dedicated architect from the beginning till the end of the project.
Executive IT management is informed about EA’s activities through a dedicated monthly forum
with the CIO and the different general managers in the IT organization. Through this forum,
85
architectural work is shared with the IT executives and approval is obtained for major
architectural choices, e.g. via technology roadmaps.
Concept 3: Making People (hitozukuri)
The enterprise architecture team in Toyota’s IT consists of 2 sub-teams. The “project
architecture” sub-team supports the different application projects in the various business areas
of Toyota with system architecture and system integration. The second sub-team is called “data
& standards” and is responsible for defining IT standards, reference architecture and technology
roadmaps.
Both teams use a mixture of dedicated contractor resources as well as Toyota internal resources.
The contractors are specialists in the area of Enterprise Architecture and provide the core
technical expertise. The Toyota employees perform most of the management and status
reporting and visualization activities, support mid-term and annual planning, budgeting and
people management and development. In addition, the Toyota employees ensure that the Toyota
way concepts are applied as part of the enterprise architecture processes.
People development is done through a combination of dedicated external training and OJD (on-
the-job-development) where Toyota employees and external contractors collaborate on projects
and hence share knowledge and experience.
Concept 4: Just in Time.
IT systems must start small and support only those business requirements which are needed.
From an IT architecture point of view that means that the architecture of those systems should
be simple and minimal. Therefore, architecture should not be over-engineered: it should support
the business requirements at hand but not more than that. Over-engineering is a form of waste
(over-production) and should therefore be avoided.
However, there is a balance to strike here. The software engineering teams developing the IT
systems often want to use the latest and greatest tools, frameworks and programming languages.
This results in a natural tendency to fall into this over-engineering trap.
If business requirements are viewed as a form of inventory, then this is something which should
be avoided as this goes against the Just in Time concept which Toyota implements in its
manufacturing operations. This means requirements need to be prioritized carefully and
implemented fast – in short cycles - and hence our architectures should be simple, easy to
change and deliver only what is needed to support those business requirements.
86
An example of the Just in Time concept is the use of REST API, a mechanism to achieve
application integration. When an application A needs additional data from application B,
additional REST calls can easily be developed for application B, without impacting the existing
consumers. Backward compatibility can be managed through REST API versioning.
Eliminating waste is the key driver beyond the Toyota manufacturing philosophy. Applying
this to IT systems and applications, duplication of data, platforms and IT standards must be
avoided. From an IT application architecture view point this means that systems architecture
must support the required level of resilience without redundancy of platforms and components.
Rather than building redundancy into the system architectures, the systems are allowed to fail,
providing the necessary support infrastructure to restart them. Only when it is absolutely
necessary, automatic redundancy is implemented: this is the case for some of the IT systems
supporting the production line, as failures in those systems result in line stops (a critical
condition for the manufacturing process). This means that our systems architectures must
support failure flagging, detection of that failure and problem solving processes to stop the
system, investigate the root causes of the failure, fix them and subsequently restart the system.
Concept 5: Stop in Time (jidoka)
Translating this into IT principles, it means that each system/process must pass on quality
results. From an IT architecture point of view this implies that our software must have built-in
quality with check & stop. It is important to note that the concept of Stop in Time (jidoka)
applied to IT architecture and software has little to do with testing. The purpose of software
testing is to find defects, it is as simple as that. Doing more testing will hopefully allow to find
(and fix) more defects during the software development lifecycle or during cycles of system
testing or user acceptance testing. That is “good practice”, but once understood that software
testing is not a measure of quality, it becomes clear that additional mechanisms are needed in
our architecture and this is where Stop in Time (jidoka) comes in. Firstly, our architecture
should be designed to indicate and signal problems when they occur. Secondly, the architecture
should incorporate mechanisms to visualize those problems. These signals are then the starting
point for human supported problem solving activity and ultimately lead to continuous
improvement (kaizen, see concept 7). In our model, IT systems architectures are therefore
closely coupled to their operational environment and always contain mechanisms to support
problem signaling, monitoring and stopping the system when a problem occurs. Rather than
trying to implement an « ideal » IT system/software architecture, the jidoka principle is used to
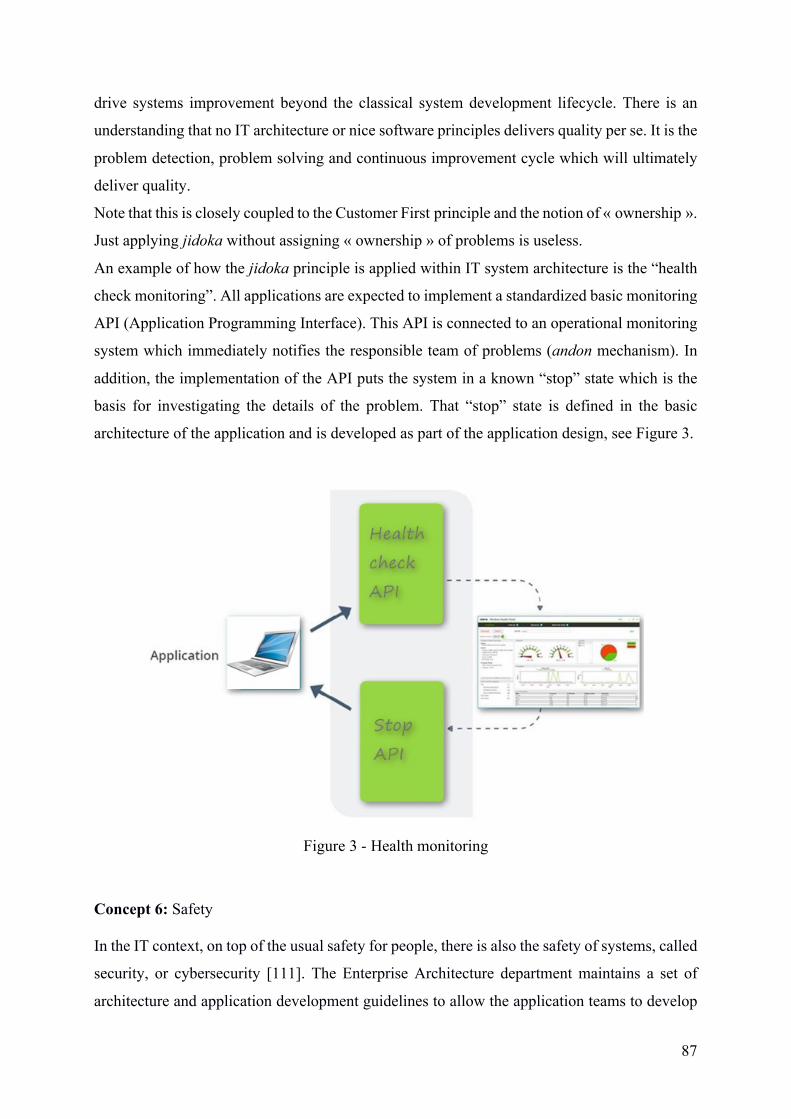
87
drive systems improvement beyond the classical system development lifecycle. There is an
understanding that no IT architecture or nice software principles delivers quality per se. It is the
problem detection, problem solving and continuous improvement cycle which will ultimately
deliver quality.
Note that this is closely coupled to the Customer First principle and the notion of « ownership ».
Just applying jidoka without assigning « ownership » of problems is useless.
An example of how the jidoka principle is applied within IT system architecture is the “health
check monitoring”. All applications are expected to implement a standardized basic monitoring
API (Application Programming Interface). This API is connected to an operational monitoring
system which immediately notifies the responsible team of problems (andon mechanism). In
addition, the implementation of the API puts the system in a known “stop” state which is the
basis for investigating the details of the problem. That “stop” state is defined in the basic
architecture of the application and is developed as part of the application design, see Figure 3.
Concept 6: Safety
In the IT context, on top of the usual safety for people, there is also the safety of systems, called
security, or cybersecurity [111]. The Enterprise Architecture department maintains a set of
architecture and application development guidelines to allow the application teams to develop
Figure 3 - Health monitoring
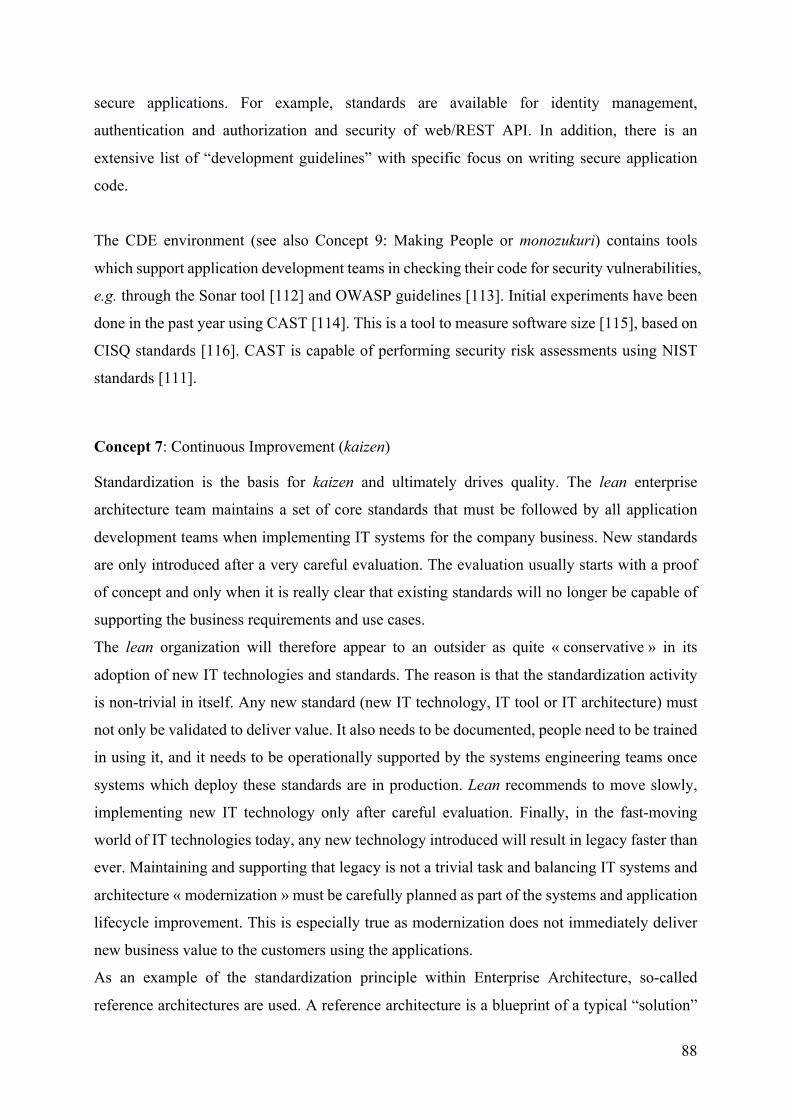
88
secure applications. For example, standards are available for identity management,
authentication and authorization and security of web/REST API. In addition, there is an
extensive list of “development guidelines” with specific focus on writing secure application
code.
The CDE environment (see also Concept 9: Making People or monozukuri) contains tools
which support application development teams in checking their code for security vulnerabilities,
e.g. through the Sonar tool [112] and OWASP guidelines [113]. Initial experiments have been
done in the past year using CAST [114]. This is a tool to measure software size [115], based on
CISQ standards [116]. CAST is capable of performing security risk assessments using NIST
standards [111].
Concept 7: Continuous Improvement (kaizen)
Standardization is the basis for kaizen and ultimately drives quality. The lean enterprise
architecture team maintains a set of core standards that must be followed by all application
development teams when implementing IT systems for the company business. New standards
are only introduced after a very careful evaluation. The evaluation usually starts with a proof
of concept and only when it is really clear that existing standards will no longer be capable of
supporting the business requirements and use cases.
The lean organization will therefore appear to an outsider as quite « conservative » in its
adoption of new IT technologies and standards. The reason is that the standardization activity
is non-trivial in itself. Any new standard (new IT technology, IT tool or IT architecture) must
not only be validated to deliver value. It also needs to be documented, people need to be trained
in using it, and it needs to be operationally supported by the systems engineering teams once
systems which deploy these standards are in production. Lean recommends to move slowly,
implementing new IT technology only after careful evaluation. Finally, in the fast-moving
world of IT technologies today, any new technology introduced will result in legacy faster than
ever. Maintaining and supporting that legacy is not a trivial task and balancing IT systems and
architecture « modernization » must be carefully planned as part of the systems and application
lifecycle improvement. This is especially true as modernization does not immediately deliver
new business value to the customers using the applications.
As an example of the standardization principle within Enterprise Architecture, so-called
reference architectures are used. A reference architecture is a blueprint of a typical “solution”
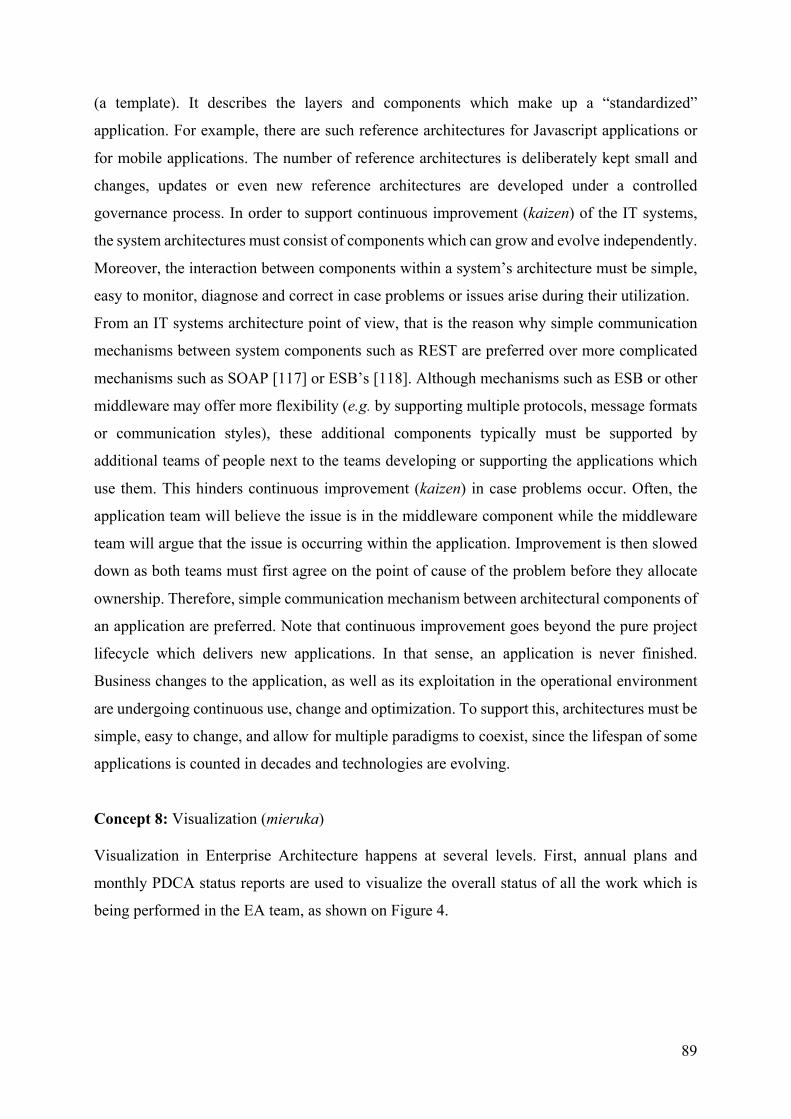
89
(a template). It describes the layers and components which make up a “standardized”
application. For example, there are such reference architectures for Javascript applications or
for mobile applications. The number of reference architectures is deliberately kept small and
changes, updates or even new reference architectures are developed under a controlled
governance process. In order to support continuous improvement (kaizen) of the IT systems,
the system architectures must consist of components which can grow and evolve independently.
Moreover, the interaction between components within a system’s architecture must be simple,
easy to monitor, diagnose and correct in case problems or issues arise during their utilization.
From an IT systems architecture point of view, that is the reason why simple communication
mechanisms between system components such as REST are preferred over more complicated
mechanisms such as SOAP [117] or ESB’s [118]. Although mechanisms such as ESB or other
middleware may offer more flexibility (e.g. by supporting multiple protocols, message formats
or communication styles), these additional components typically must be supported by
additional teams of people next to the teams developing or supporting the applications which
use them. This hinders continuous improvement (kaizen) in case problems occur. Often, the
application team will believe the issue is in the middleware component while the middleware
team will argue that the issue is occurring within the application. Improvement is then slowed
down as both teams must first agree on the point of cause of the problem before they allocate
ownership. Therefore, simple communication mechanism between architectural components of
an application are preferred. Note that continuous improvement goes beyond the pure project
lifecycle which delivers new applications. In that sense, an application is never finished.
Business changes to the application, as well as its exploitation in the operational environment
are undergoing continuous use, change and optimization. To support this, architectures must be
simple, easy to change, and allow for multiple paradigms to coexist, since the lifespan of some
applications is counted in decades and technologies are evolving.
Concept 8: Visualization (mieruka)
Visualization in Enterprise Architecture happens at several levels. First, annual plans and
monthly PDCA status reports are used to visualize the overall status of all the work which is
being performed in the EA team, as shown on Figure 4.
90
Figure 4 - Visualization of EA Annual Plans and Monthly PDCA Reports
Second, the architectures themselves are visualized through A3 documents which are called
“hybrid diagrams”, see example on Figure 5. These are a combination of hardware, software,
middleware, software stacks, network properties, security and so forth. The hybrid diagram is
created early during the life cycle of system/IT projects and consensus is built around it. This
consensus is not only with the IT teams delivering the system/application but also with the
systems engineering support teams and application maintenance teams. These latter two teams
will ultimately be responsible for “operating” the new system and for providing the day-to-day
support to the business users.
91
Figure 5 - Hybrid diagram
Third, the project architecture activities are controlled through a dedicated JIRA dashboard
[119], which shows the overall status and work allocation of projects. This dashboard allows to
drill down into the details of the project’s architecture issues and countermeasures.
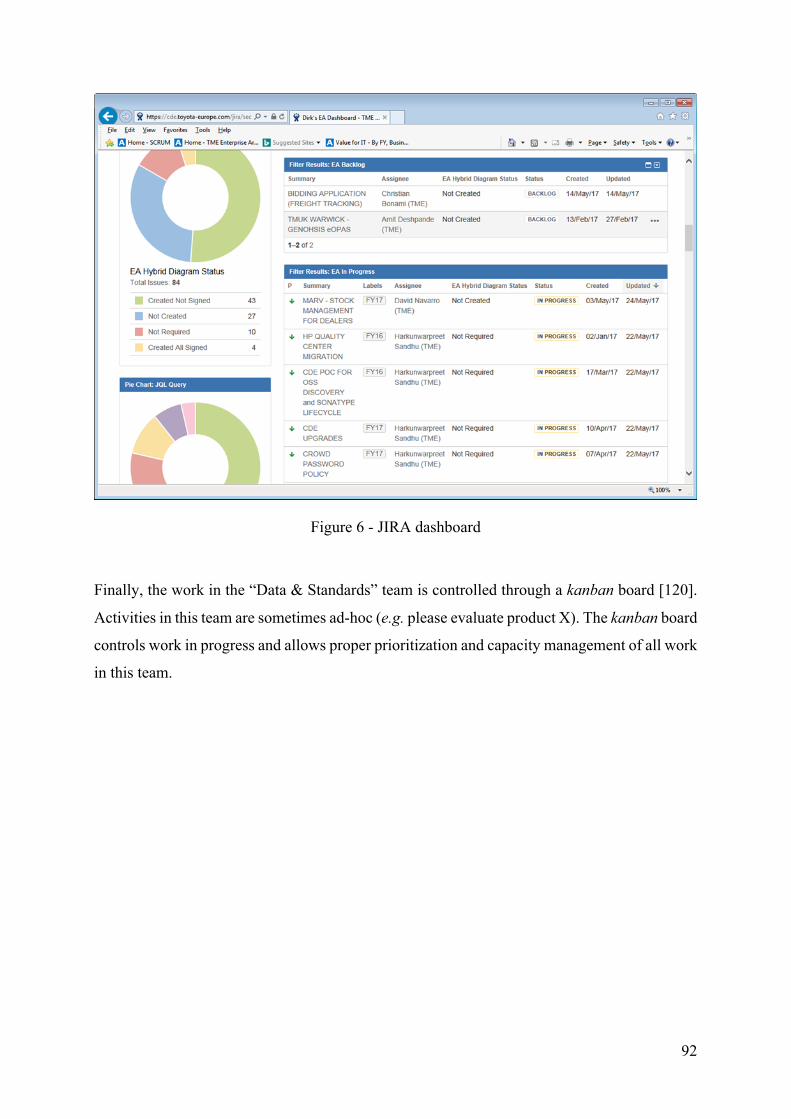
92
Figure 6 - JIRA dashboard
Finally, the work in the “Data & Standards” team is controlled through a kanban board [120].
Activities in this team are sometimes ad-hoc (e.g. please evaluate product X). The kanban board
controls work in progress and allows proper prioritization and capacity management of all work
in this team.
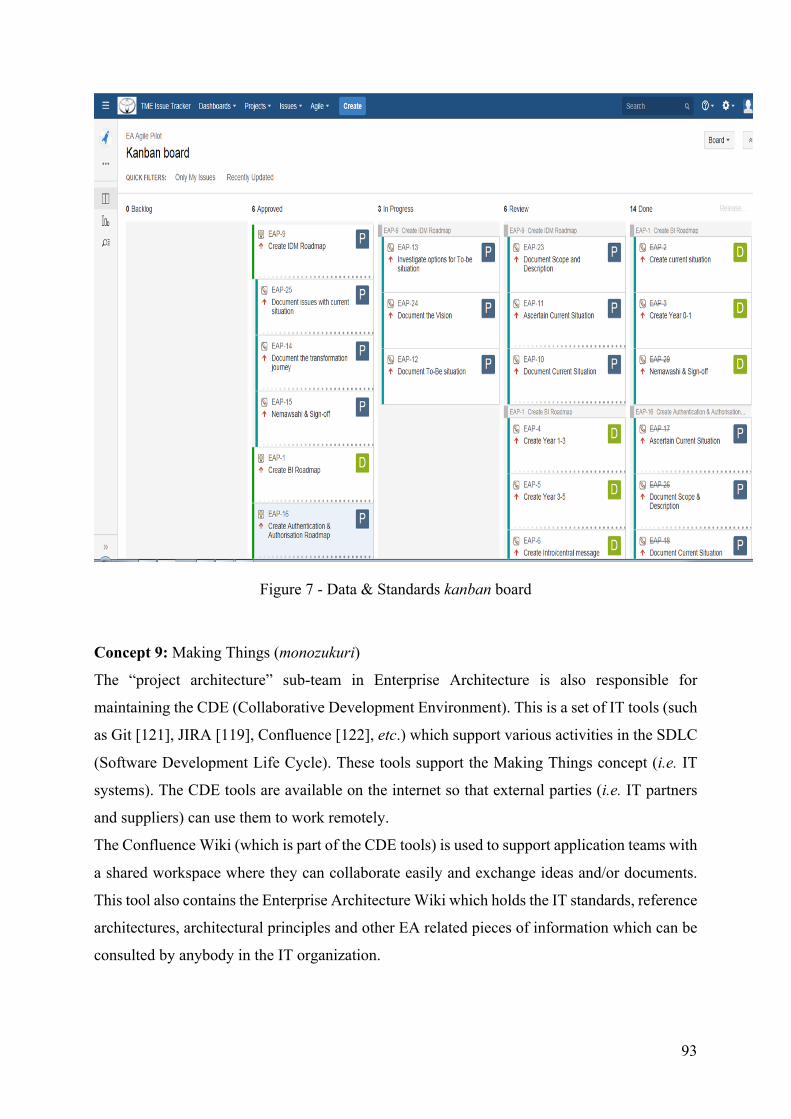
93
Figure 7 - Data & Standards kanban board
Concept 9: Making Things (monozukuri)
The “project architecture” sub-team in Enterprise Architecture is also responsible for
maintaining the CDE (Collaborative Development Environment). This is a set of IT tools (such
as Git [121], JIRA [119], Confluence [122], etc.) which support various activities in the SDLC
(Software Development Life Cycle). These tools support the Making Things concept (i.e. IT
systems). The CDE tools are available on the internet so that external parties (i.e. IT partners
and suppliers) can use them to work remotely.
The Confluence Wiki (which is part of the CDE tools) is used to support application teams with
a shared workspace where they can collaborate easily and exchange ideas and/or documents.
This tool also contains the Enterprise Architecture Wiki which holds the IT standards, reference
architectures, architectural principles and other EA related pieces of information which can be
consulted by anybody in the IT organization.
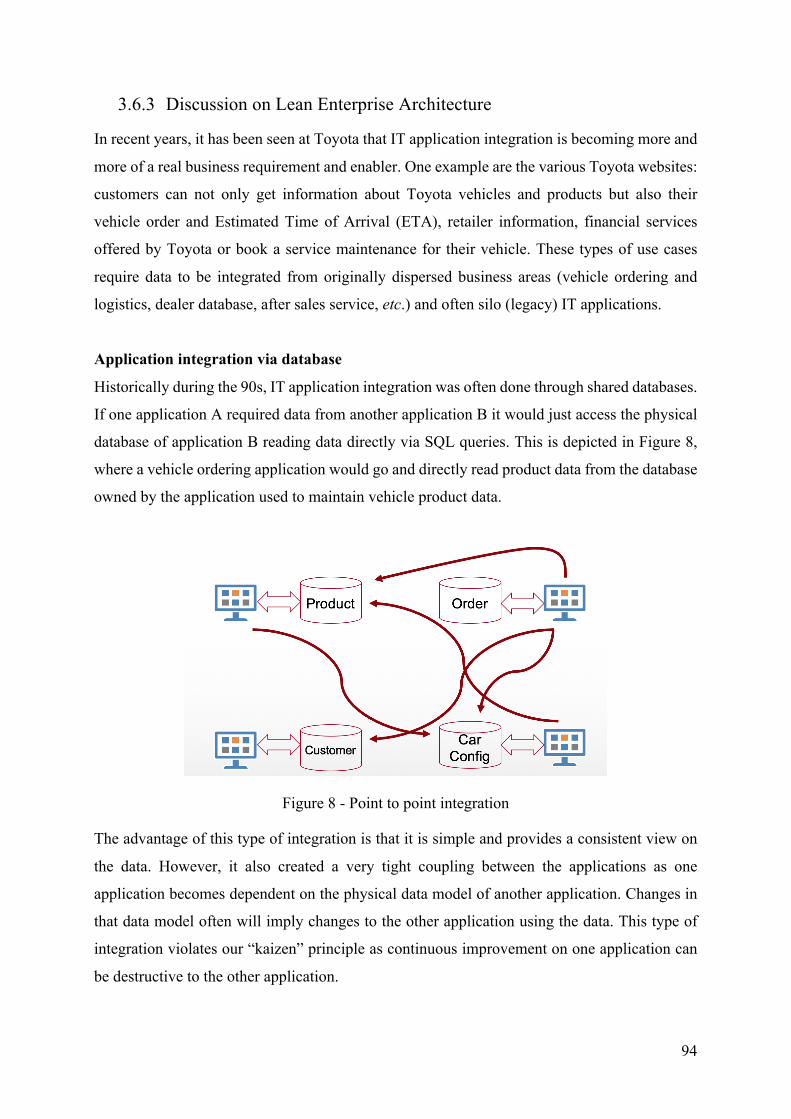
94
3.6.3 Discussion on Lean Enterprise Architecture
In recent years, it has been seen at Toyota that IT application integration is becoming more and
more of a real business requirement and enabler. One example are the various Toyota websites:
customers can not only get information about Toyota vehicles and products but also their
vehicle order and Estimated Time of Arrival (ETA), retailer information, financial services
offered by Toyota or book a service maintenance for their vehicle. These types of use cases
require data to be integrated from originally dispersed business areas (vehicle ordering and
logistics, dealer database, after sales service, etc.) and often silo (legacy) IT applications.
Application integration via database
Historically during the 90s, IT application integration was often done through shared databases.
If one application A required data from another application B it would just access the physical
database of application B reading data directly via SQL queries. This is depicted in Figure 8,
where a vehicle ordering application would go and directly read product data from the database
owned by the application used to maintain vehicle product data.
Figure 8 - Point to point integration
The advantage of this type of integration is that it is simple and provides a consistent view on
the data. However, it also created a very tight coupling between the applications as one
application becomes dependent on the physical data model of another application. Changes in
that data model often will imply changes to the other application using the data. This type of
integration violates our “kaizen” principle as continuous improvement on one application can
be destructive to the other application.
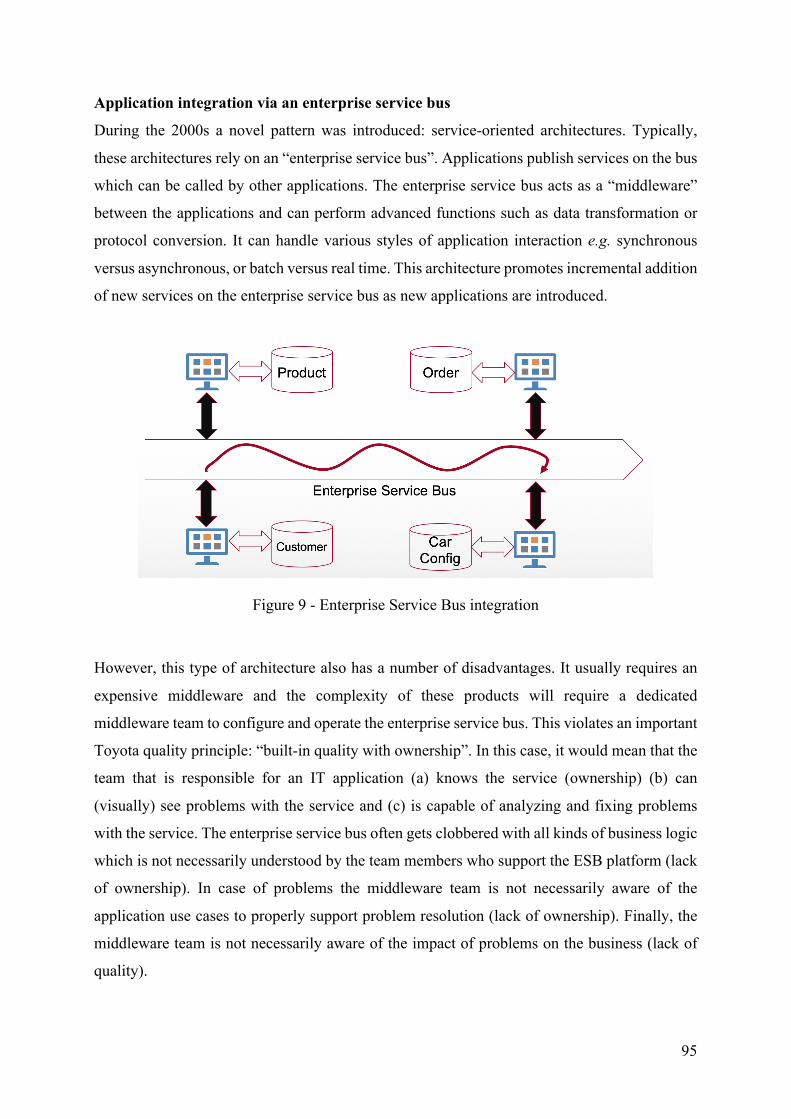
95
Application integration via an enterprise service bus
During the 2000s a novel pattern was introduced: service-oriented architectures. Typically,
these architectures rely on an “enterprise service bus”. Applications publish services on the bus
which can be called by other applications. The enterprise service bus acts as a “middleware”
between the applications and can perform advanced functions such as data transformation or
protocol conversion. It can handle various styles of application interaction e.g. synchronous
versus asynchronous, or batch versus real time. This architecture promotes incremental addition
of new services on the enterprise service bus as new applications are introduced.
Figure 9 - Enterprise Service Bus integration
However, this type of architecture also has a number of disadvantages. It usually requires an
expensive middleware and the complexity of these products will require a dedicated
middleware team to configure and operate the enterprise service bus. This violates an important
Toyota quality principle: “built-in quality with ownership”. In this case, it would mean that the
team that is responsible for an IT application (a) knows the service (ownership) (b) can
(visually) see problems with the service and (c) is capable of analyzing and fixing problems
with the service. The enterprise service bus often gets clobbered with all kinds of business logic
which is not necessarily understood by the team members who support the ESB platform (lack
of ownership). In case of problems the middleware team is not necessarily aware of the
application use cases to properly support problem resolution (lack of ownership). Finally, the
middleware team is not necessarily aware of the impact of problems on the business (lack of
quality).
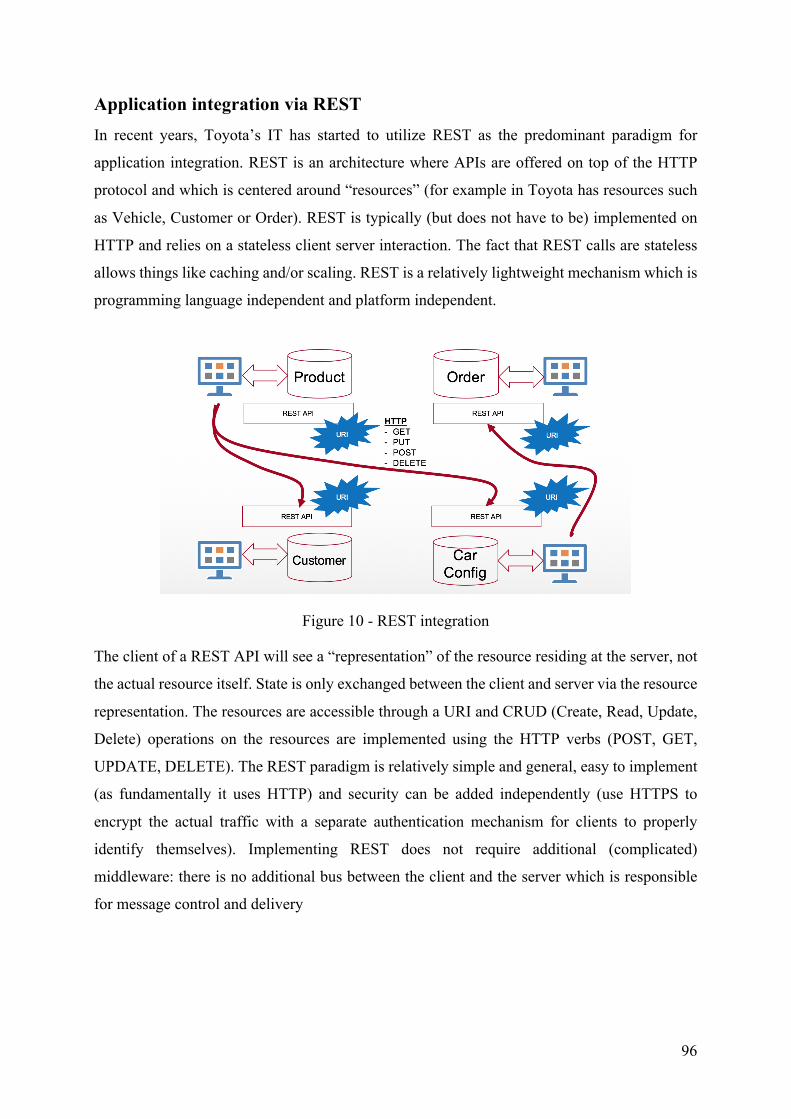
96
Application integration via REST In recent years, Toyota’s IT has started to utilize REST as the predominant paradigm for
application integration. REST is an architecture where APIs are offered on top of the HTTP
protocol and which is centered around “resources” (for example in Toyota has resources such
as Vehicle, Customer or Order). REST is typically (but does not have to be) implemented on
HTTP and relies on a stateless client server interaction. The fact that REST calls are stateless
allows things like caching and/or scaling. REST is a relatively lightweight mechanism which is
programming language independent and platform independent.
Figure 10 - REST integration
The client of a REST API will see a “representation” of the resource residing at the server, not
the actual resource itself. State is only exchanged between the client and server via the resource
representation. The resources are accessible through a URI and CRUD (Create, Read, Update,
Delete) operations on the resources are implemented using the HTTP verbs (POST, GET,
UPDATE, DELETE). The REST paradigm is relatively simple and general, easy to implement
(as fundamentally it uses HTTP) and security can be added independently (use HTTPS to
encrypt the actual traffic with a separate authentication mechanism for clients to properly
identify themselves). Implementing REST does not require additional (complicated)
middleware: there is no additional bus between the client and the server which is responsible
for message control and delivery
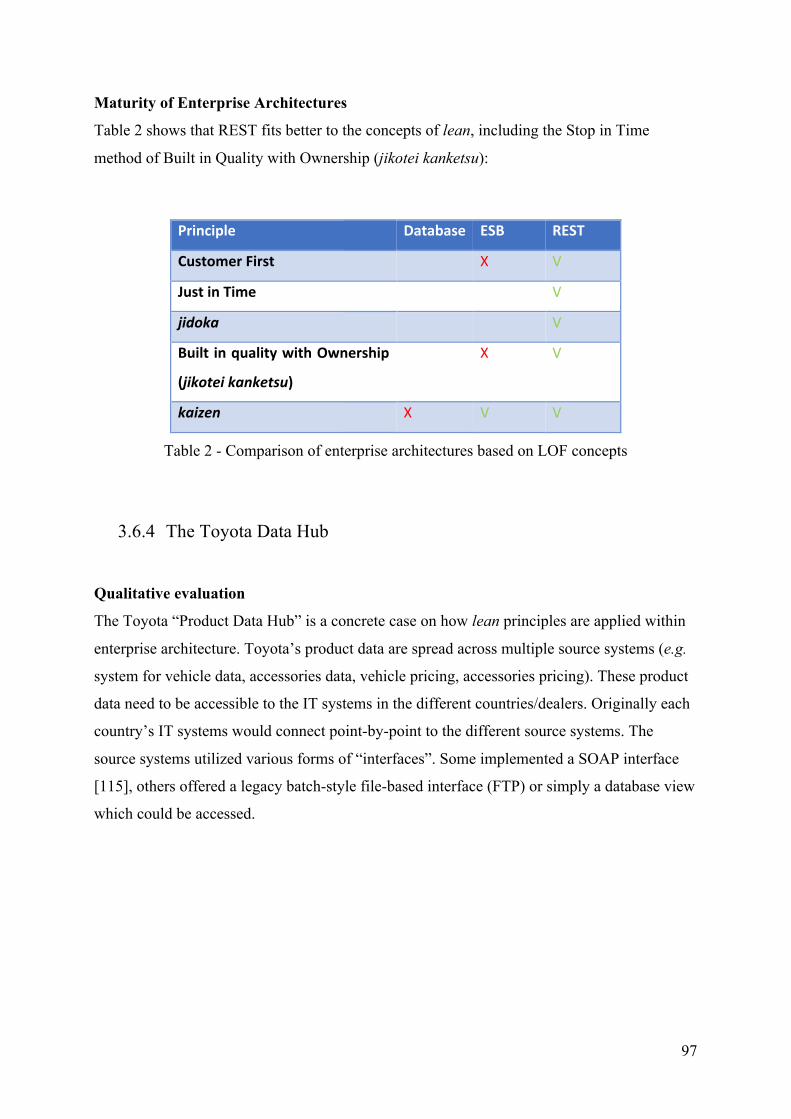
97
Maturity of Enterprise Architectures
Table 2 shows that REST fits better to the concepts of lean, including the Stop in Time
method of Built in Quality with Ownership (jikotei kanketsu):
Principle Database ESB REST
CustomerFirst X V
JustinTime V
jidoka V
Built inqualitywithOwnership
(jikoteikanketsu)
X V
kaizen X V V
Table 2 - Comparison of enterprise architectures based on LOF concepts
3.6.4 The Toyota Data Hub
Qualitative evaluation
The Toyota “Product Data Hub” is a concrete case on how lean principles are applied within
enterprise architecture. Toyota’s product data are spread across multiple source systems (e.g.
system for vehicle data, accessories data, vehicle pricing, accessories pricing). These product
data need to be accessible to the IT systems in the different countries/dealers. Originally each
country’s IT systems would connect point-by-point to the different source systems. The
source systems utilized various forms of “interfaces”. Some implemented a SOAP interface
[115], others offered a legacy batch-style file-based interface (FTP) or simply a database view
which could be accessed.
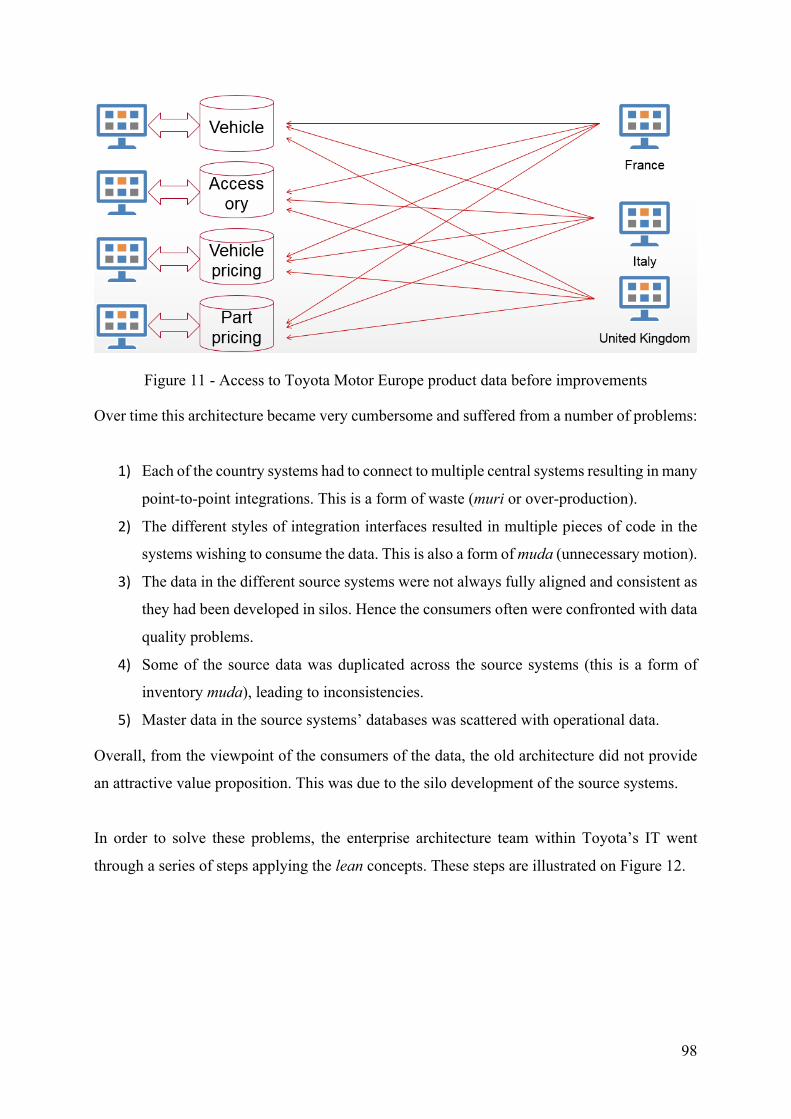
98
Figure 11 - Access to Toyota Motor Europe product data before improvements
Over time this architecture became very cumbersome and suffered from a number of problems:
1) Each of the country systems had to connect to multiple central systems resulting in many
point-to-point integrations. This is a form of waste (muri or over-production).
2) The different styles of integration interfaces resulted in multiple pieces of code in the
systems wishing to consume the data. This is also a form of muda (unnecessary motion).
3) The data in the different source systems were not always fully aligned and consistent as
they had been developed in silos. Hence the consumers often were confronted with data
quality problems.
4) Some of the source data was duplicated across the source systems (this is a form of
inventory muda), leading to inconsistencies.
5) Master data in the source systems’ databases was scattered with operational data.
Overall, from the viewpoint of the consumers of the data, the old architecture did not provide
an attractive value proposition. This was due to the silo development of the source systems.
In order to solve these problems, the enterprise architecture team within Toyota’s IT went
through a series of steps applying the lean concepts. These steps are illustrated on Figure 12.
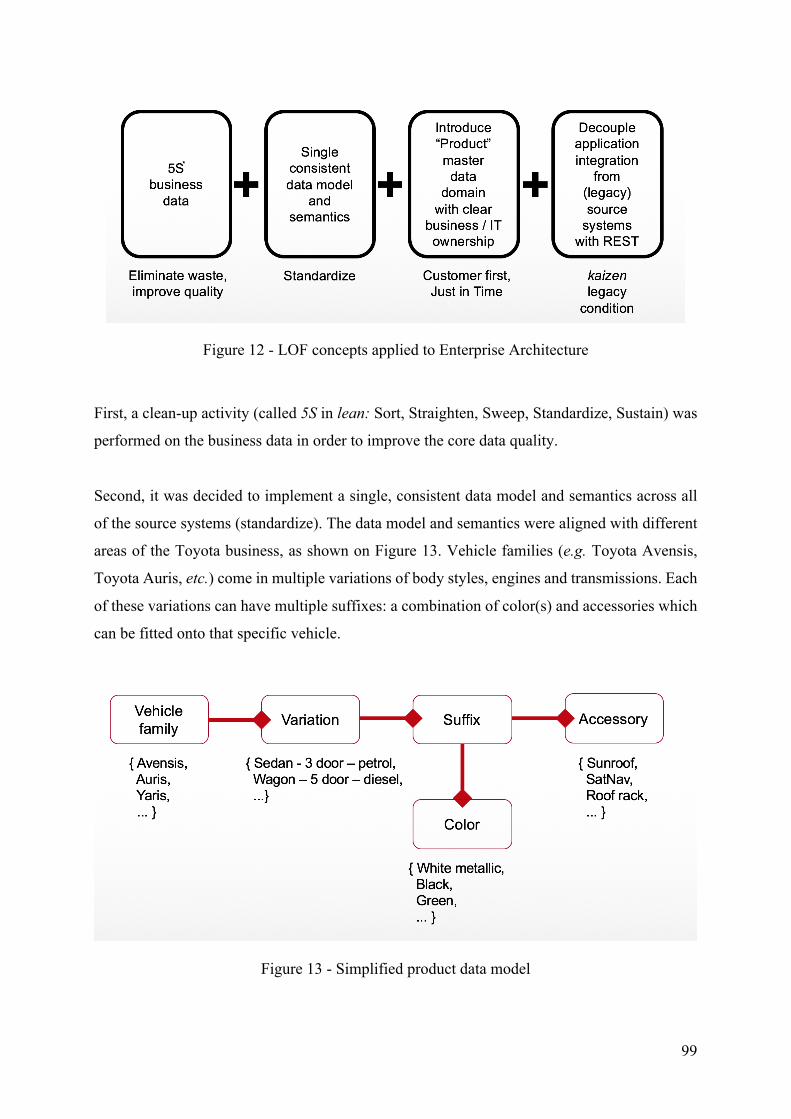
99
Figure 12 - LOF concepts applied to Enterprise Architecture
First, a clean-up activity (called 5S in lean: Sort, Straighten, Sweep, Standardize, Sustain) was
performed on the business data in order to improve the core data quality.
Second, it was decided to implement a single, consistent data model and semantics across all
of the source systems (standardize). The data model and semantics were aligned with different
areas of the Toyota business, as shown on Figure 13. Vehicle families (e.g. Toyota Avensis,
Toyota Auris, etc.) come in multiple variations of body styles, engines and transmissions. Each
of these variations can have multiple suffixes: a combination of color(s) and accessories which
can be fitted onto that specific vehicle.
Figure 13 - Simplified product data model
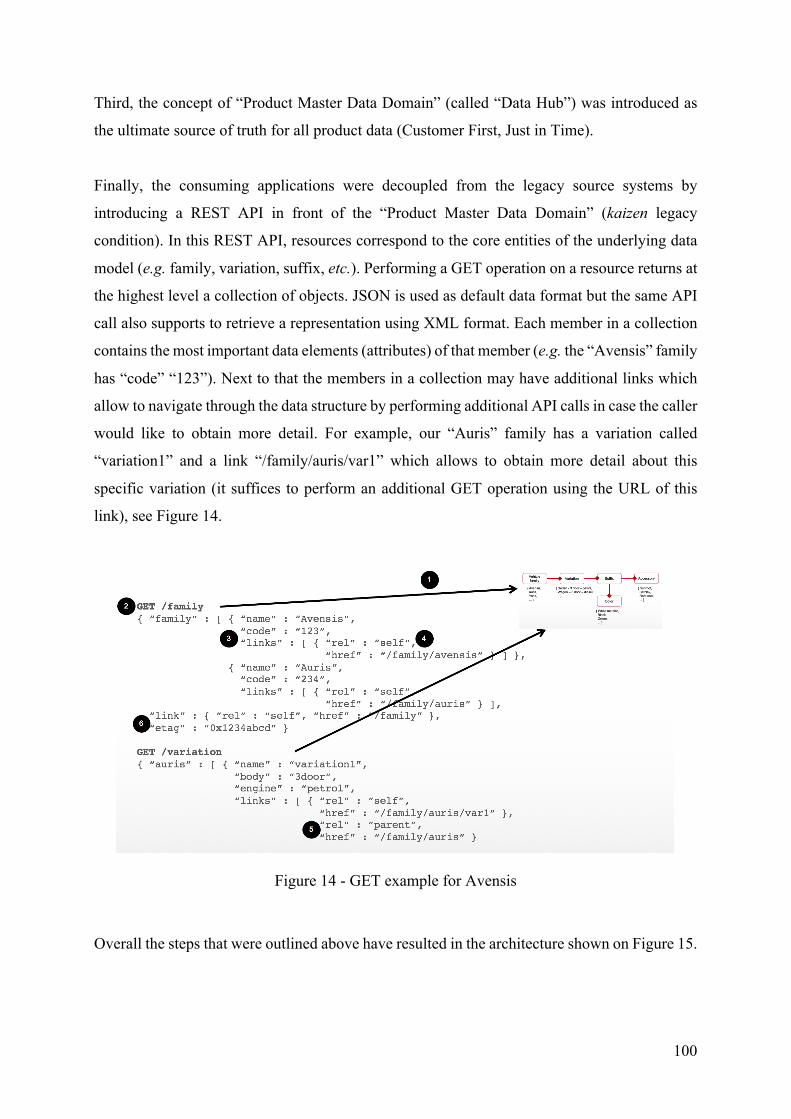
100
Third, the concept of “Product Master Data Domain” (called “Data Hub”) was introduced as
the ultimate source of truth for all product data (Customer First, Just in Time).
Finally, the consuming applications were decoupled from the legacy source systems by
introducing a REST API in front of the “Product Master Data Domain” (kaizen legacy
condition). In this REST API, resources correspond to the core entities of the underlying data
model (e.g. family, variation, suffix, etc.). Performing a GET operation on a resource returns at
the highest level a collection of objects. JSON is used as default data format but the same API
call also supports to retrieve a representation using XML format. Each member in a collection
contains the most important data elements (attributes) of that member (e.g. the “Avensis” family
has “code” “123”). Next to that the members in a collection may have additional links which
allow to navigate through the data structure by performing additional API calls in case the caller
would like to obtain more detail. For example, our “Auris” family has a variation called
“variation1” and a link “/family/auris/var1” which allows to obtain more detail about this
specific variation (it suffices to perform an additional GET operation using the URL of this
link), see Figure 14.
Figure 14 - GET example for Avensis
Overall the steps that were outlined above have resulted in the architecture shown on Figure 15.
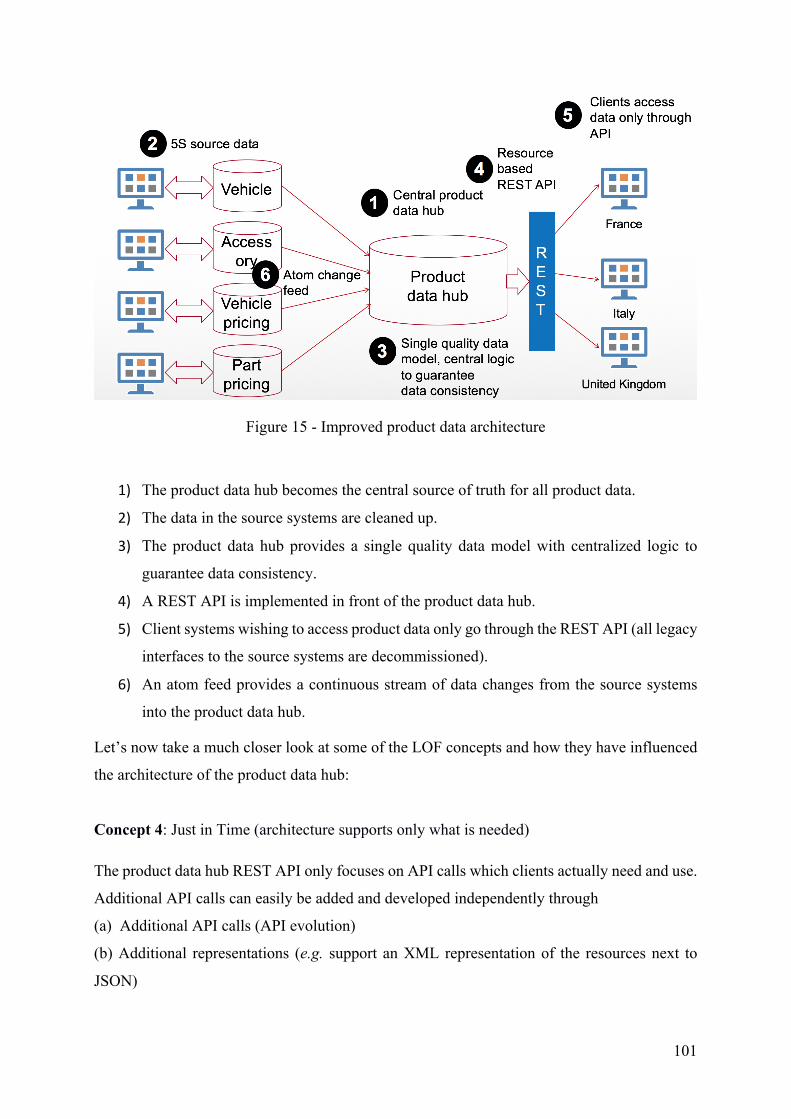
101
Figure 15 - Improved product data architecture
1) The product data hub becomes the central source of truth for all product data.
2) The data in the source systems are cleaned up.
3) The product data hub provides a single quality data model with centralized logic to
guarantee data consistency.
4) A REST API is implemented in front of the product data hub.
5) Client systems wishing to access product data only go through the REST API (all legacy
interfaces to the source systems are decommissioned).
6) An atom feed provides a continuous stream of data changes from the source systems
into the product data hub.
Let’s now take a much closer look at some of the LOF concepts and how they have influenced
the architecture of the product data hub:
Concept 4: Just in Time (architecture supports only what is needed)
The product data hub REST API only focuses on API calls which clients actually need and use.
Additional API calls can easily be added and developed independently through
(a) Additional API calls (API evolution)
(b) Additional representations (e.g. support an XML representation of the resources next to
JSON)
102
(c) Descriptive links indicating what can be done next. Major revisions of the API are supported
through versioning of the REST calls.
The API version number must be specified by the client in a request parameter, e.g.
“curl http://product.toyota-europe.com/family/avensis?version=1”.
Versions are used to establish a contract and associated expectations between clients and
servers. This allows the APIs to evolve and still providing backward compatibility to existing
clients of the API. Together all these elements contribute to providing only what is needed to
clients at the point in time at which they need it.
Concept 5: Stop in Time (jidoka).
All API calls in the REST interface of the product data hub use standard HTTP response codes
to signal back problems to the caller (e.g. 200=OK, 201=resource created, 401=unauthorized,
500=internal server error). These error codes are obviously standardized by the HTTP
specification. In addition, each API call may implement additional error codes in the range 512-
599 which have a semantics specific to the API call. Together with these error codes a pattern
is provided which callers of the API should follow with respect to how they should handle
various classes of errors. In addition, each API call and the returning error is automatically
logged and these logs can be consulted to support problem solving. Built-in quality is achieved
with components that have low degrees of dependency. As each REST call is independent of
other REST calls, it becomes relatively easy to support debugging and problem solving in case
things would go wrong. In addition, as the REST paradigm does not require any special
middleware there is no separate middleware team required to support a REST implementation.
For the product data hub, functional API logging and API monitoring support the team which
has developed the API in diagnosing and resolving issues. An important component in this is
problem visualization (see next figure). Monitoring software captures all error conditions
signaled by the REST APIs. These are visualized on an (electronic) board which is available to
the product data hub development team. This allows the team to immediately see if there is
some potential problem with the service. Server and API logging provides information to the
team which allows them to pinpoint where problems are occurring and identify the root cause
and proper countermeasure. This problem-solving cycle involves the team who originally
developed the API. They can take full ownership of this problem-solving activity as they do not
depend on a middleware component (and middleware support team) to be involved.
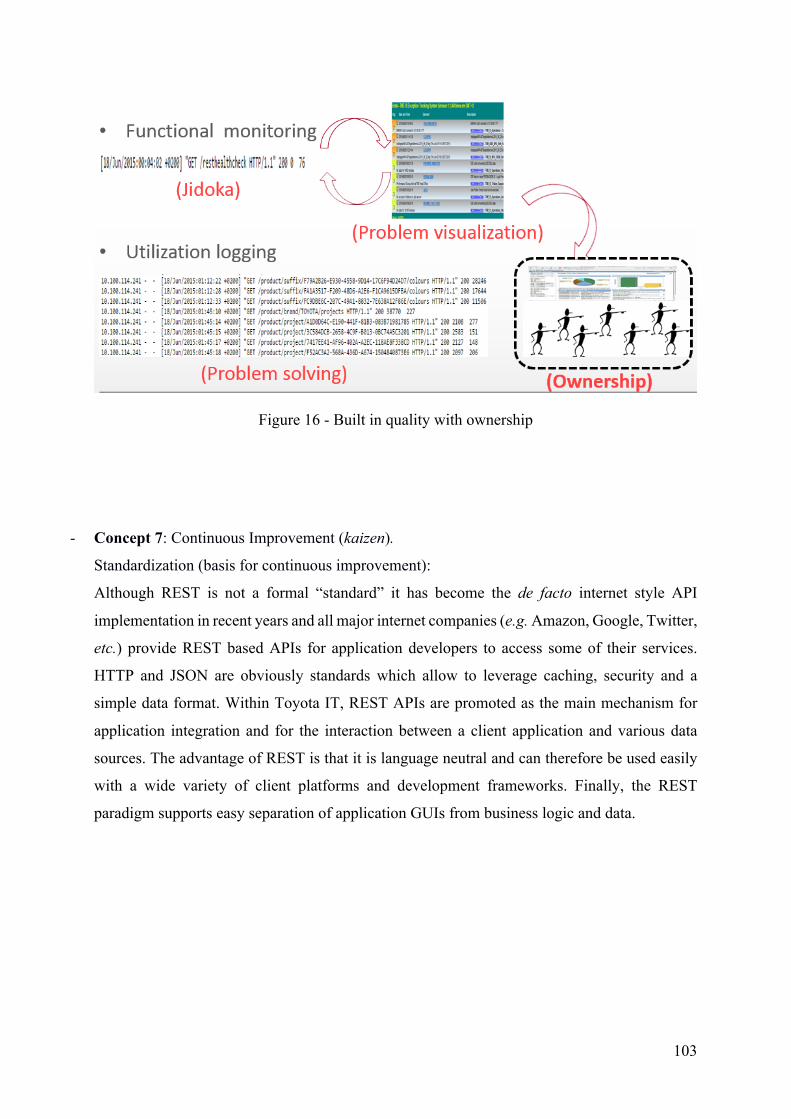
103
Figure 16 - Built in quality with ownership
- Concept 7: Continuous Improvement (kaizen).
Standardization (basis for continuous improvement):
Although REST is not a formal “standard” it has become the de facto internet style API
implementation in recent years and all major internet companies (e.g. Amazon, Google, Twitter,
etc.) provide REST based APIs for application developers to access some of their services.
HTTP and JSON are obviously standards which allow to leverage caching, security and a
simple data format. Within Toyota IT, REST APIs are promoted as the main mechanism for
application integration and for the interaction between a client application and various data
sources. The advantage of REST is that it is language neutral and can therefore be used easily
with a wide variety of client platforms and development frameworks. Finally, the REST
paradigm supports easy separation of application GUIs from business logic and data.
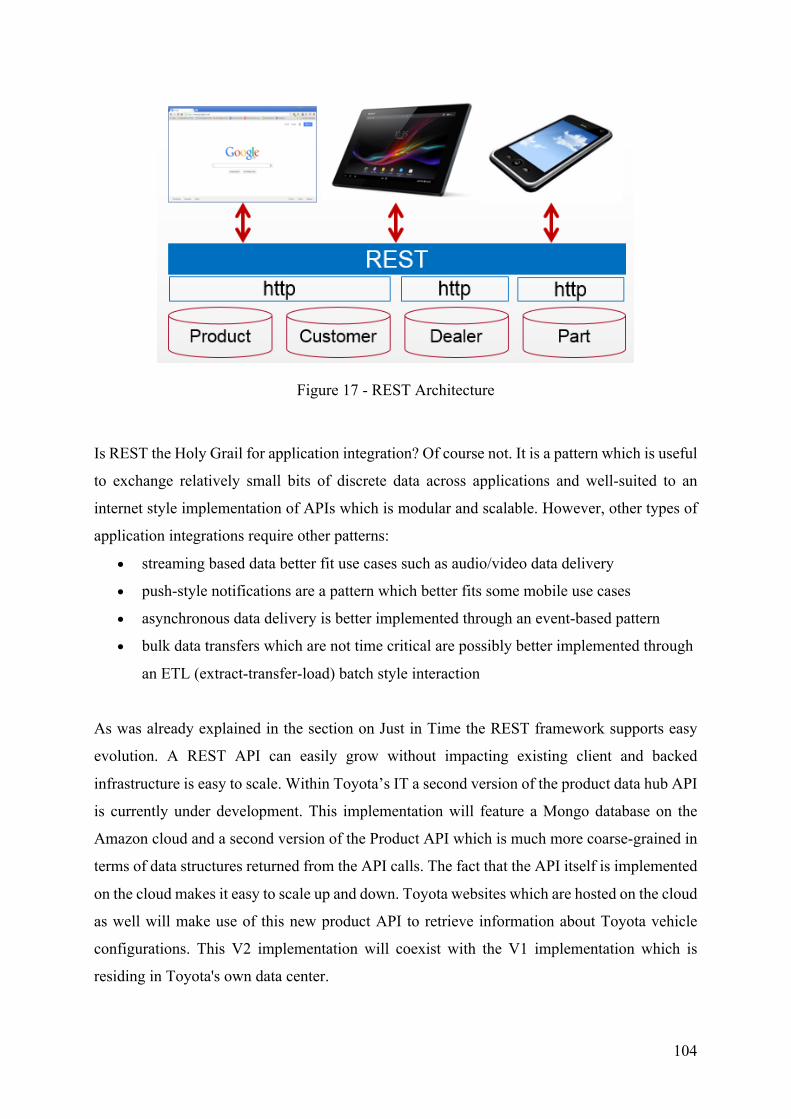
104
Figure 17 - REST Architecture
Is REST the Holy Grail for application integration? Of course not. It is a pattern which is useful
to exchange relatively small bits of discrete data across applications and well-suited to an
internet style implementation of APIs which is modular and scalable. However, other types of
application integrations require other patterns:
• streaming based data better fit use cases such as audio/video data delivery
• push-style notifications are a pattern which better fits some mobile use cases
• asynchronous data delivery is better implemented through an event-based pattern
• bulk data transfers which are not time critical are possibly better implemented through
an ETL (extract-transfer-load) batch style interaction
As was already explained in the section on Just in Time the REST framework supports easy
evolution. A REST API can easily grow without impacting existing client and backed
infrastructure is easy to scale. Within Toyota’s IT a second version of the product data hub API
is currently under development. This implementation will feature a Mongo database on the
Amazon cloud and a second version of the Product API which is much more coarse-grained in
terms of data structures returned from the API calls. The fact that the API itself is implemented
on the cloud makes it easy to scale up and down. Toyota websites which are hosted on the cloud
as well will make use of this new product API to retrieve information about Toyota vehicle
configurations. This V2 implementation will coexist with the V1 implementation which is
residing in Toyota's own data center.
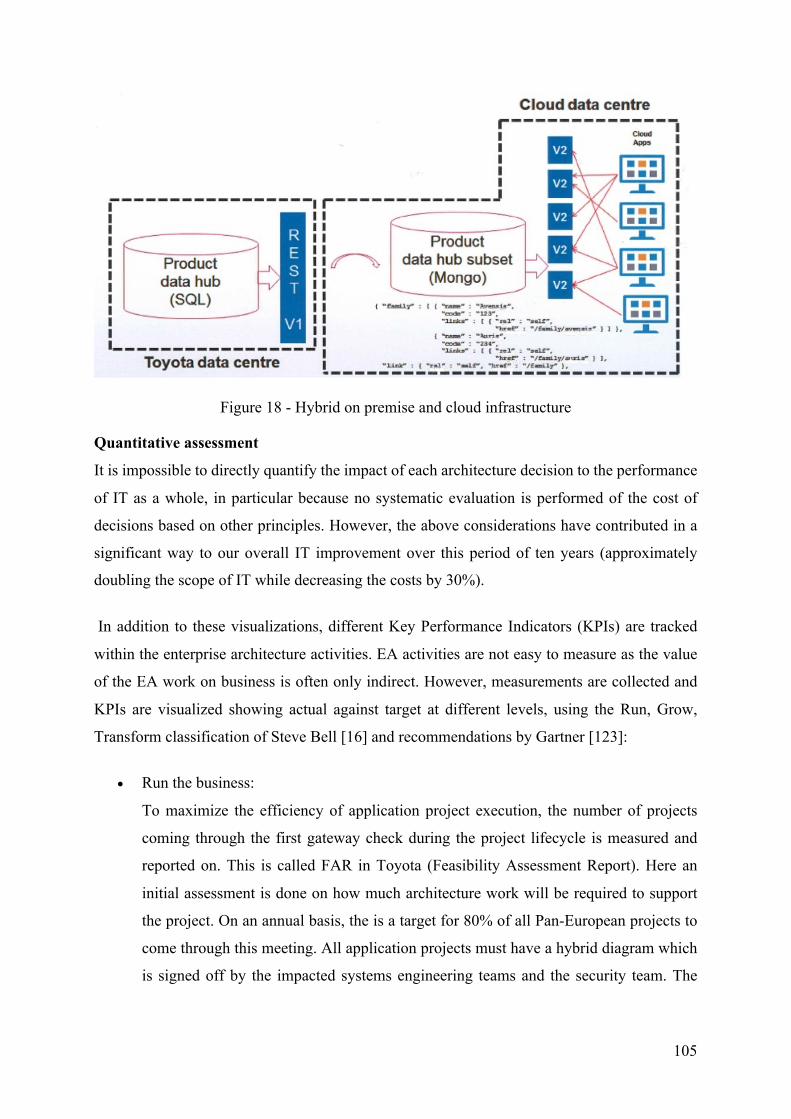
105
Figure 18 - Hybrid on premise and cloud infrastructure
Quantitative assessment
It is impossible to directly quantify the impact of each architecture decision to the performance
of IT as a whole, in particular because no systematic evaluation is performed of the cost of
decisions based on other principles. However, the above considerations have contributed in a
significant way to our overall IT improvement over this period of ten years (approximately
doubling the scope of IT while decreasing the costs by 30%).
In addition to these visualizations, different Key Performance Indicators (KPIs) are tracked
within the enterprise architecture activities. EA activities are not easy to measure as the value
of the EA work on business is often only indirect. However, measurements are collected and
KPIs are visualized showing actual against target at different levels, using the Run, Grow,
Transform classification of Steve Bell [16] and recommendations by Gartner [123]:
• Run the business:
To maximize the efficiency of application project execution, the number of projects
coming through the first gateway check during the project lifecycle is measured and
reported on. This is called FAR in Toyota (Feasibility Assessment Report). Here an
initial assessment is done on how much architecture work will be required to support
the project. On an annual basis, the is a target for 80% of all Pan-European projects to
come through this meeting. All application projects must have a hybrid diagram which
is signed off by the impacted systems engineering teams and the security team. The
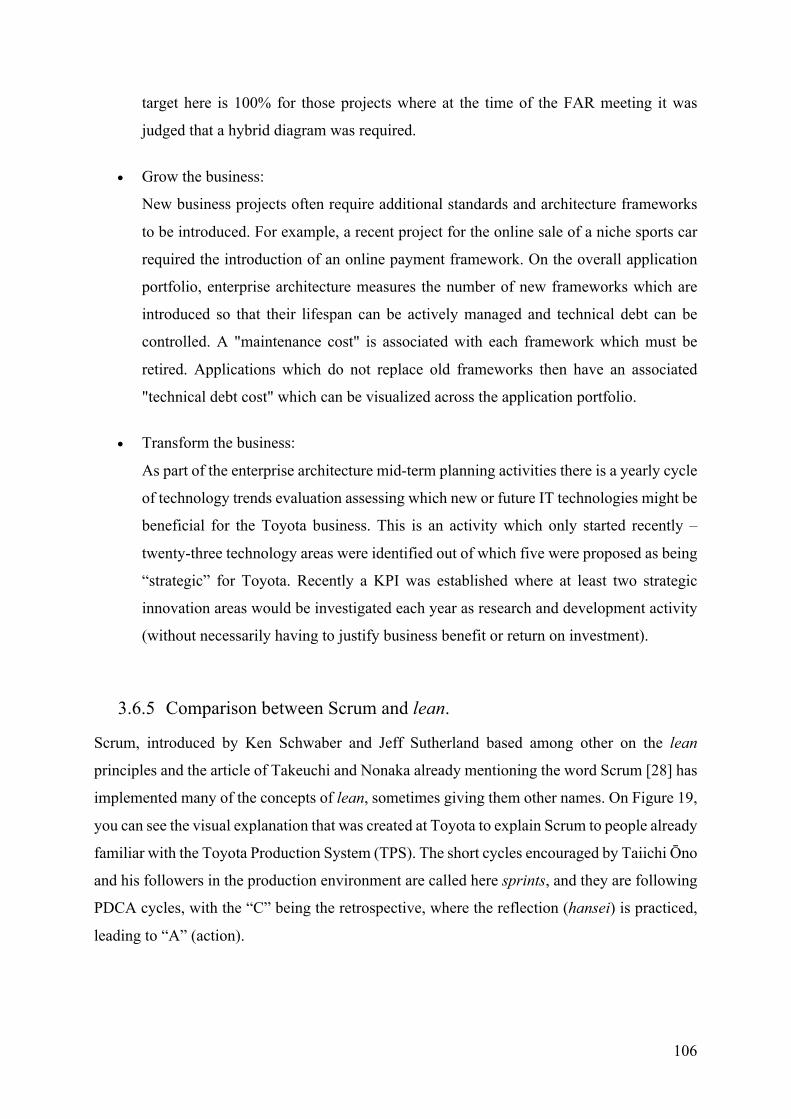
106
target here is 100% for those projects where at the time of the FAR meeting it was
judged that a hybrid diagram was required.
• Grow the business:
New business projects often require additional standards and architecture frameworks
to be introduced. For example, a recent project for the online sale of a niche sports car
required the introduction of an online payment framework. On the overall application
portfolio, enterprise architecture measures the number of new frameworks which are
introduced so that their lifespan can be actively managed and technical debt can be
controlled. A "maintenance cost" is associated with each framework which must be
retired. Applications which do not replace old frameworks then have an associated
"technical debt cost" which can be visualized across the application portfolio.
• Transform the business:
As part of the enterprise architecture mid-term planning activities there is a yearly cycle
of technology trends evaluation assessing which new or future IT technologies might be
beneficial for the Toyota business. This is an activity which only started recently –
twenty-three technology areas were identified out of which five were proposed as being
“strategic” for Toyota. Recently a KPI was established where at least two strategic
innovation areas would be investigated each year as research and development activity
(without necessarily having to justify business benefit or return on investment).
3.6.5 Comparison between Scrum and lean.
Scrum, introduced by Ken Schwaber and Jeff Sutherland based among other on the lean
principles and the article of Takeuchi and Nonaka already mentioning the word Scrum [28] has
implemented many of the concepts of lean, sometimes giving them other names. On Figure 19,
you can see the visual explanation that was created at Toyota to explain Scrum to people already
familiar with the Toyota Production System (TPS). The short cycles encouraged by Taiichi Ōno
and his followers in the production environment are called here sprints, and they are following
PDCA cycles, with the “C” being the retrospective, where the reflection (hansei) is practiced,
leading to “A” (action).
107
Figure 19 - Scrum and lean terminology comparison
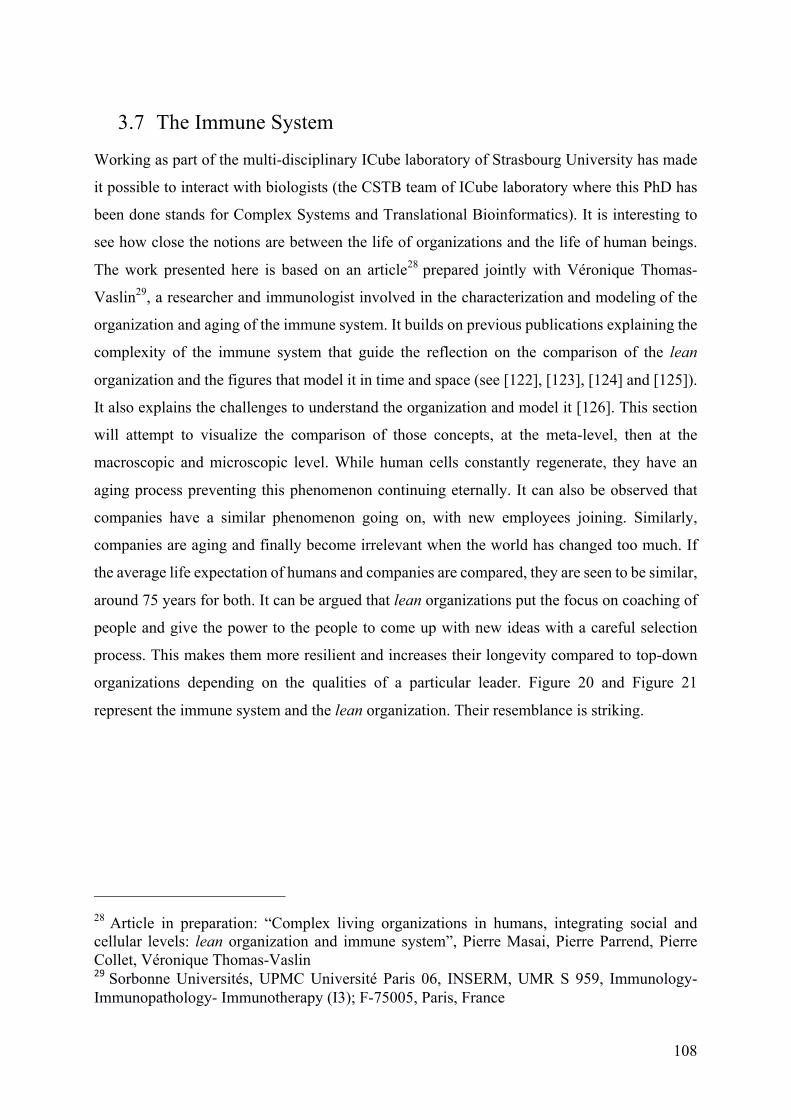
108
3.7 The Immune System
Working as part of the multi-disciplinary ICube laboratory of Strasbourg University has made
it possible to interact with biologists (the CSTB team of ICube laboratory where this PhD has
been done stands for Complex Systems and Translational Bioinformatics). It is interesting to
see how close the notions are between the life of organizations and the life of human beings.
The work presented here is based on an article28 prepared jointly with Véronique Thomas-
Vaslin29, a researcher and immunologist involved in the characterization and modeling of the
organization and aging of the immune system. It builds on previous publications explaining the
complexity of the immune system that guide the reflection on the comparison of the lean
organization and the figures that model it in time and space (see [122], [123], [124] and [125]).
It also explains the challenges to understand the organization and model it [126]. This section
will attempt to visualize the comparison of those concepts, at the meta-level, then at the
macroscopic and microscopic level. While human cells constantly regenerate, they have an
aging process preventing this phenomenon continuing eternally. It can also be observed that
companies have a similar phenomenon going on, with new employees joining. Similarly,
companies are aging and finally become irrelevant when the world has changed too much. If
the average life expectation of humans and companies are compared, they are seen to be similar,
around 75 years for both. It can be argued that lean organizations put the focus on coaching of
people and give the power to the people to come up with new ideas with a careful selection
process. This makes them more resilient and increases their longevity compared to top-down
organizations depending on the qualities of a particular leader. Figure 20 and Figure 21
represent the immune system and the lean organization. Their resemblance is striking.
28 Article in preparation: “Complex living organizations in humans, integrating social and cellular levels: lean organization and immune system”, Pierre Masai, Pierre Parrend, Pierre Collet, Véronique Thomas-Vaslin 29Sorbonne Universités, UPMC Université Paris 06, INSERM, UMR S 959, Immunology-Immunopathology- Immunotherapy (I3); F-75005, Paris, France
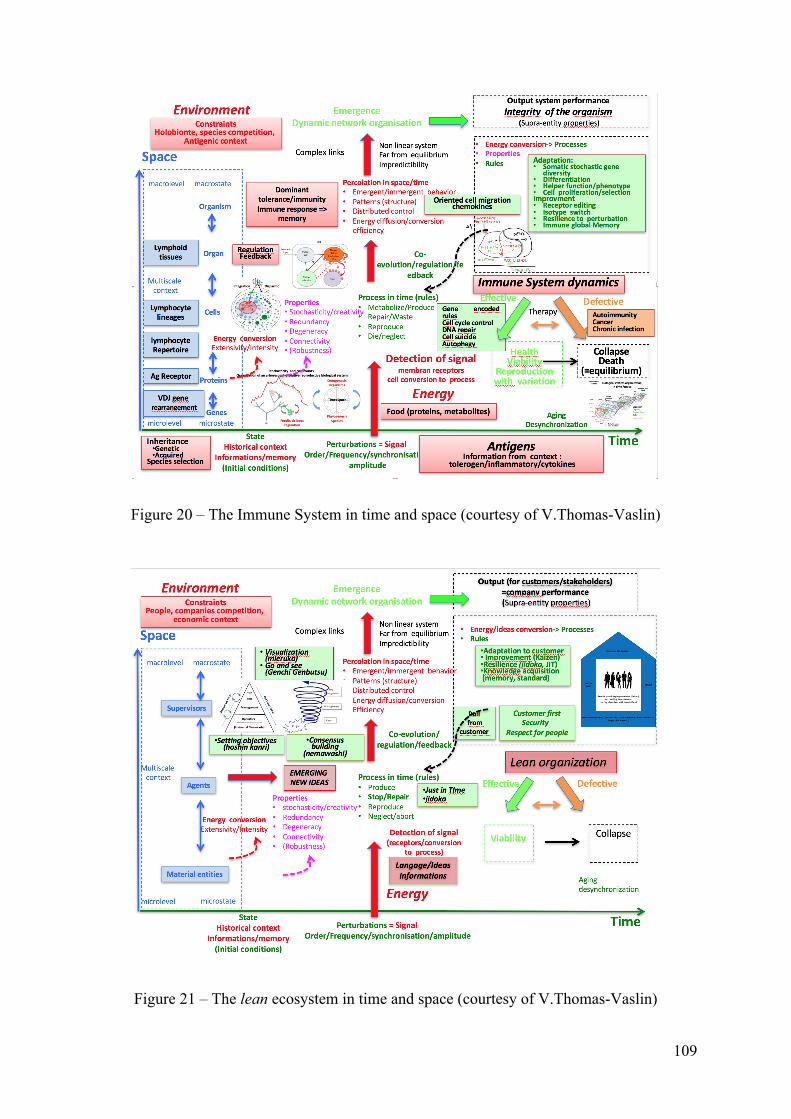
109
Figure 20 – The Immune System in time and space (courtesy of V.Thomas-Vaslin)
Figure 21 – The lean ecosystem in time and space (courtesy of V.Thomas-Vaslin)
110
This enables to compare the lean concepts (at the macro level) and the concepts used in
immunology (at the micro level). The similarities are striking, as we can see when browsing
through the nine main concepts of our LOF model:
Concept 1: Customer First
The organism is considered as a customer and his functions have to be ensured. In particular,
the immune system drives the identity and integrity of the organism. Body viability comes first.
This even reunites the two lean principles of Customer First and Safety. For an individual, the
life of his body and the capacity to survive is mandatory. The immune system does not count
the cells and molecules, but organizes them in order to have emergence of processes to keep
the organism in the viability zone. Defect in some molecules like adhesion molecules, receptors,
etc. lead to diseases while aging can also alter such processes. The context is local, and the cells
respond locally while the global response as tolerance (self-antigens) or immune response
(against a pathogen) emerge from local behavior. Alteration of cell or molecule concentration,
cell interactions, check, etc., can lead to pathologies and eventually death.
Concept 2: Stakeholder Satisfaction
A healthy organism is a satisfied organism with performant functions: able to grow, repair,
reproduce, with autonomy and interacting with other organisms and species without detriments.
Concept 3: Making People (hitozukuri)
The immune system “makes cells” and collaborative cell network and action. T-Cell and B-
Cell lineage differentiation occurs in progressive stages: cells progressively change their
phenotype and adapt their functions. They collaborate with other cell types to produce a
collective immune response to control the pathogen and tumor cells.
Concept 4: Just in Time
Immune cell production of lymphocytes is adaptive to enable the need of the organism in case
of infection with rapid replication of the pathogen. The continuous “basal” production of
diversified lymphocytes is rapidly amplified by cell proliferation, while at the end of the
infection active cell death occurs and most cells enter in quiescence.
Concept 5: Stop in Time (jidoka)
Cells check and repair their material. They check their DNA before progressing in cell cycle,
111
they repair it or go to apoptosis (cell suicide). Check, repair and cell functions are based on
feedback loops that capture the information from the environment to adapt the cell behavior
just in time (see concept 4).
Concept 6: Safety
Globally, cognitive systems ensure the safety of organisms. The immune system preserves the
identity and integrity of the organism at the molecular and cell level by immune-surveillance,
preventing or curing infections. This allows the safe development of allogeneic fetus in the
mother. An organism with a defective immune system is not viable and rapidly dies.
Concept 7: Continuous Improvement (kaizen)
Cell and organism selection during evolution have allowed the continuous improvement of the
biological structures and functions. Also, lymphocytes improve their quality during an immune
response. The standardization element is provided by the genome and the DNA.
Concept 8: Visualization (mieruka)
Cell communication depends on emission of secreted proteins and their receptors on the same
cell or on others. This allows cells to visualize the context of antigen expression and to orient
the immune response accordingly to tolerate or eliminate it.
Concept 9: Making Things (monozukuri)
Cells and organisms have evolved to produce and assemble molecules to ensure specialized
functions and the transmission to the next generations.
In summary, what organisms have learned in millions of years is close to what lean is about,
which is a novel angle to look at lean. Of course, this is just an embryo of a scientific activity.
It will be interesting to watch if this comparison can be brought further and if the biologists can
propose further improvements to lean thanks to their studies of living organisms, in particular
the immune system. As for the opposite, it has happened several times in history that specialists
were pretty sure that some organs had become useless (waste) and could be removed, to only
later realize that these organs had useful properties that were unknown before. This is the case
of the thymus that was removed during a surgical intervention (thymectomy), resulting in the
accelerated aging of the immune system [127]. Similarly, the effect of immuno-suppression
with chemotherapy that depletes dividing cells to prevent graft rejection or to destroy tumors is

112
responsible for immuno-depression and accelerated biological aging of the immune system,
alteration of reconstitution in some old individuals and loss of immunological memory [122].
As a reflection on this, even though large parts of the DNA have unknown function today, the
specialists hesitate to say that they are just a waste transmitted from the past, but tend to think
that new functions may still be discovered.
113
4 Experimentation
This chapter presents the experiments, essentially involving the hoshin kanri process, the
management of the direction of the organization, literally “compass management”. This process
was chosen because it involves many agents in the organization interacting with each other.
They evolve together and generate an emerging set of objectives of better quality than what
each individual could have achieved, as happens for all Complex Systems. This process is
studied first in its cultural dimension. To demonstrate how lean can be modeled and taught
more effectively when understanding the cultural elements essential to its success. Then the
hoshin model is introduced, followed by the description of the eHoshin application
implementing it in vivo, confirming the prediction of the model. After a description of a
reflection on the implementation, the second round of implementation is presented. This leads
to the revised in silico model which integrates the insights gained from experimenting with the
mechanism of hoshin and is a basis for further roll out and future improvements. A similar
method is followed by van Woensel et alii [124] to study emergence of a shared attitude in
organizations as a self-organizing complex process.
4.1 Lean in the cultural context
4.1.1 Introduction
Preparing the ground for the development of culturally aware information systems relies on two
aspects. First, a knowledge engineering formalization. Second, its application to the particular
case considered, in this case the lean organization. It is important to integrate the cultural
dimension in lean modeling. It has been observed that, while lean is applicable to all cultures
and countries, the quality of implementation is highly dependent on the understanding of the
local culture by the lean coaches. Coaches also need to have understood the original concepts
themselves, which originated in a different culture than theirs if they are not Japanese. The work
presented here has been conducted with Cecilia Zanni-Merk and published in [3].
For the knowledge engineering formalization, the Upper Ontology of Culture or UOC
developed by Blanchard and Mizoguchi [68] is proposed as a framework (section 4.1.2). For
the field description and to describe this field and the rules that can be applied to translate
114
behavior in one culture for the benefit of individuals accustomed to other cultures, a Culture
Map (CM) ontology is proposed, based on the description by Erin Meyer [106], using eight
cultural dimensions (section 4.1.3).
The example of the lean organization will be used to illustrate the approach of creating a
common culture that enables employees from all over the world to work together, using a
common language. The Toyota Way 200130 has been the first publication in English language
of the Toyota principles and practices within Toyota (as described for example in [11]). It is a
clear example of translating the concepts that were first intelligible only to a Japanese
population, to the English-speaking workforce of Toyota in North America and the rest of the
world. The Toyota Production System would never have had the global success it has today, if
the Toyota culture had not been made available to the West. The usage of the English word lean
in [4] to describe it also helped. Nonetheless, Toyota Motor Europe covers 53 markets with
almost as many different cultures and languages. In this environment, it is possible to witness
first hand that access to literature in written English is not enough for concepts to percolate to
all audiences in Europe. Further cultural translations are needed.
The cultural concepts formalized in the Meta-Knowledge layer of the KREM model introduced
in section 1.4.2 can be used in practice in the example of lean, using the House of TPS (HoT)
Ontology appearing in the Knowledge layer of the KREM model. Cultural aspects in the meta-
knowledge layer could also steer the behavior of the agents modeled in the Rules layer of the
KREM model.
In 4.1.2, a framework for including culture in lean organization modeling is presented. In 4.1.3,
a domain ontology for the strategic dimensions of culture is shown. In 4.1.4, the influence of
culture on the lean organization is presented. Finally, in 4.1.5, an experiment to practically
illustrate the concepts is detailed.
4.1.2 Integration of culture in lean organization modeling
One goal of the ComplexLean 31 project is to model the lean organization to reproduce
successful implementations of lean as a Complex System. The KREM model explained in 1.4.2
30 Toyota document for internal use only, first published in 2001 based on the request of Fujio Cho, at that time head of manufacturing for Toyota in North America 31 The research project including this thesis, described at http://www.ComplexLean.wordpress.com
115
recommends the usage of meta-knowledge to steer the execution of the model. Culture meta-
knowledge tries to take into account the fact that decisions are made differently depending on
the country or culture [106]. Context has been studied carefully for a long time in areas like
knowledge-based systems and ubiquitous systems, either for handling the complex knowledge
in a dynamic manner [125] [126] [61] or to provide smarter human interfaces [63]. However,
there is no agreement on a concise definition of context in these areas. Bazire [127], after a
thorough revision of works about context, proposed the components of context as the user and
the observer involved, as well as the items, the environment, and other related contexts [128].
Context helps when detecting semantic relations to provide extra information and correct
interpretations for applications. Diverse representations of context exist in different research
areas. McCarthy [125] uses a term c representing context, and the formal representation of a
proposition p is true in the context c is represented as ist(c, p). As described above, Dey [63]
defines context as “any information that characterizes a situation” for context-aware
applications. Separately, Porzel [128] refers to a context work, where a model of context
contains components and the different relations of the components. The components are the
user, an item, and the observer in the environment. Relations here include not only the relations
between the components, but also the relations to other contexts.
Context (and in particular culture context) is represented in the meta-knowledge component of
the KREM architecture in a way similar to the one used in McCarthy [125]. An ontology will
enable the identification of the context for a certain agent, and this agent will reason with a
subset of all the rules in its Rule layer (that will be chosen with the help of the abovementioned
predicate ist). It is with this goal in mind that the Culture Map (CM) ontology is presented in
the following sections.
4.1.3 A domain ontology for the strategic dimensions of culture
Ontologies for the Cultural Domain
An upper ontology or top ontology is an ontology which consists of very general terms used
across domains. The Upper Ontology of Culture or UOC of Blanchard and Mizoguchi [68] is
used here as a core reference ontology, because it is the most comprehensive upper ontology
that represents the cultural domain. It is even catering for its inherent complexity by using a
116
specific ontology editor, hozo32, instead of the better known Protégé33. This allows it to meet
the additional relations that need to be visualized when dealing with the complexity of cultural
contexts, as explained in section 1.5. The UOC Ontology, shown on Figure 22, introduces the
concepts of Culture, Enculturated Agent and Enculturated Complex Agent (EnCompA). They
are subject to interdependent definitions in the UOC. A culture is seen as an accumulation of
elements produced or integrated (endorsed) by a cultural group. A culture cannot exist without
the cultural group that created it and, conversely, a group cannot be said to have a culture if it
does not possess its culture [68]. Hence an EnCompA is defined as the association of a cultural
group and its associated culture.
The ontologies were developed with the hozo ontology editor, which shows a screen with two
parts. On the left, the taxonomy of the concepts, using is-a relations. On the right, a more
detailed view, enabling to show ‘p/o’ (part of) and ‘a/o’ (attribute of) relationships. The
attributes are shown with their description and their cardinality on the left. Their “class-
constraint” on the right shows the class of the object. For example, a culture producer has
cultural group class-constraint. Tangible cultural element has artifact as class-constraint. The
class-constraint can come from even higher level ontologies, like YAMATO [129] and the
artifact class.
32 http://www.hozo.jp 33 http://protege.stanford.edu
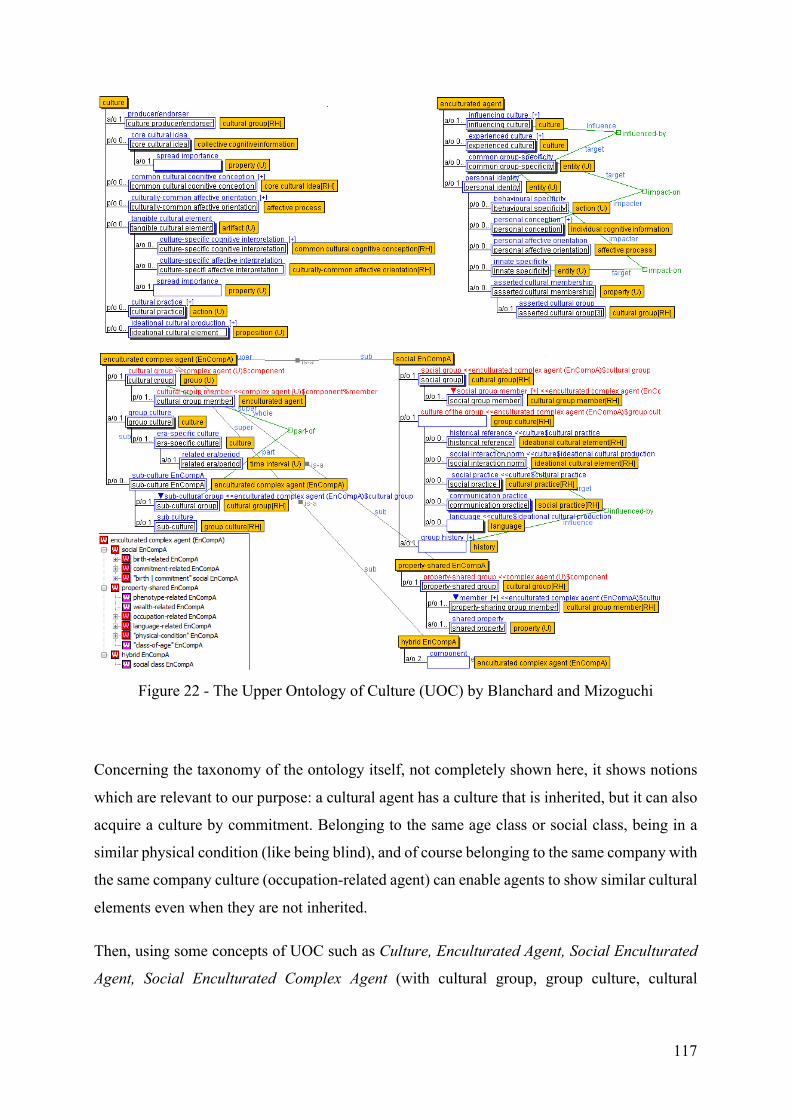
117
Figure 22 - The Upper Ontology of Culture (UOC) by Blanchard and Mizoguchi
Concerning the taxonomy of the ontology itself, not completely shown here, it shows notions
which are relevant to our purpose: a cultural agent has a culture that is inherited, but it can also
acquire a culture by commitment. Belonging to the same age class or social class, being in a
similar physical condition (like being blind), and of course belonging to the same company with
the same company culture (occupation-related agent) can enable agents to show similar cultural
elements even when they are not inherited.
Then, using some concepts of UOC such as Culture, Enculturated Agent, Social Enculturated
Agent, Social Enculturated Complex Agent (with cultural group, group culture, cultural
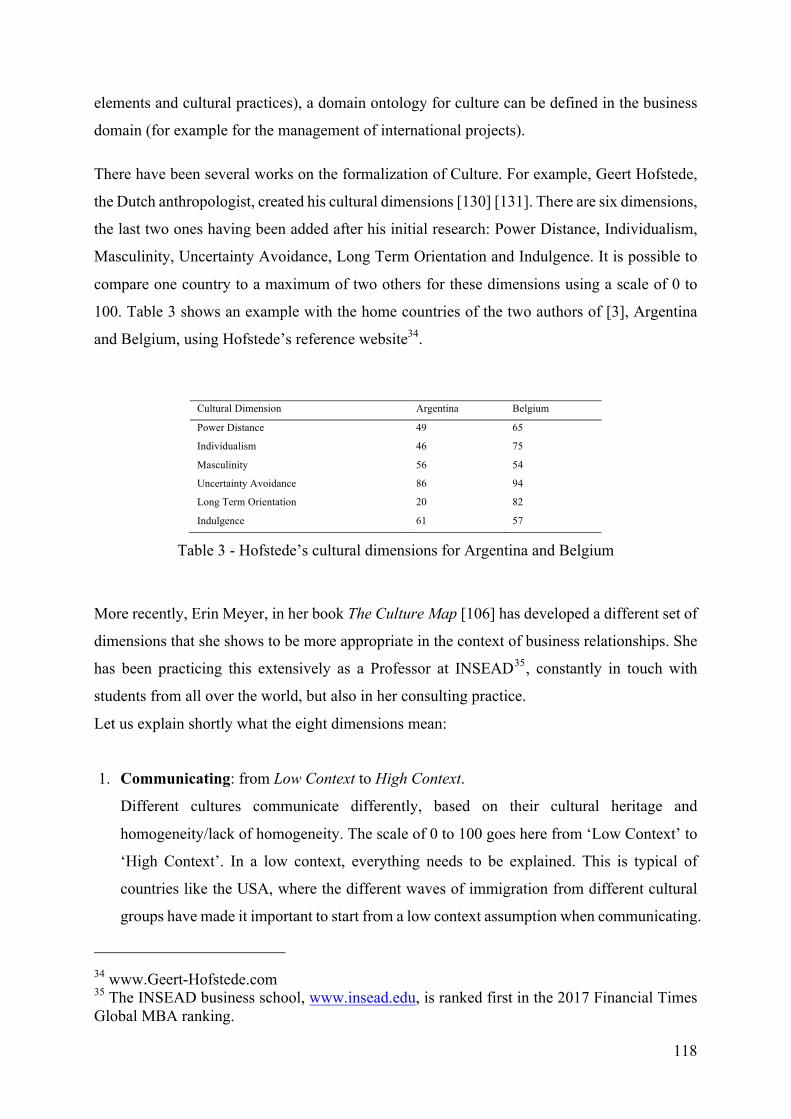
118
elements and cultural practices), a domain ontology for culture can be defined in the business
domain (for example for the management of international projects).
There have been several works on the formalization of Culture. For example, Geert Hofstede,
the Dutch anthropologist, created his cultural dimensions [130] [131]. There are six dimensions,
the last two ones having been added after his initial research: Power Distance, Individualism,
Masculinity, Uncertainty Avoidance, Long Term Orientation and Indulgence. It is possible to
compare one country to a maximum of two others for these dimensions using a scale of 0 to
100. Table 3 shows an example with the home countries of the two authors of [3], Argentina
and Belgium, using Hofstede’s reference website34.
Cultural Dimension Argentina Belgium
Power Distance
Individualism
Masculinity
Uncertainty Avoidance
49
46
56
86
65
75
54
94
Long Term Orientation 20 82
Indulgence 61 57
Table 3 - Hofstede’s cultural dimensions for Argentina and Belgium
More recently, Erin Meyer, in her book The Culture Map [106] has developed a different set of
dimensions that she shows to be more appropriate in the context of business relationships. She
has been practicing this extensively as a Professor at INSEAD35, constantly in touch with
students from all over the world, but also in her consulting practice.
Let us explain shortly what the eight dimensions mean:
1. Communicating: from Low Context to High Context.
Different cultures communicate differently, based on their cultural heritage and
homogeneity/lack of homogeneity. The scale of 0 to 100 goes here from ‘Low Context’ to
‘High Context’. In a low context, everything needs to be explained. This is typical of
countries like the USA, where the different waves of immigration from different cultural
groups have made it important to start from a low context assumption when communicating.
34 www.Geert-Hofstede.com 35 The INSEAD business school, www.insead.edu, is ranked first in the 2017 Financial Times Global MBA ranking.
119
A ‘High Context’ culture would be like the Japanese, where the homogeneity of the cultural
group over time enables the assumption of a high context understanding in communication.
2. Evaluating: from Direct to Indirect negative feedback valuating.
Negative feedback can be given directly (like in the Netherlands) or indirectly (like in
Japan)
3. Persuading: from Principles First to Applications First
Persuading can be done starting with the principles first (like in France) or with the
applications first (like in the USA). Not knowing this may ruin the best prepared of
presentations by losing the audience from the start.
4. Leading: from Egalitarian to Hierarchical.
Egalitarian (like in the Nordic countries) means that all are welcome to express their point
of view, independently of hierarchy. Hierarchical (like in Korea) means that the opinion of
the leader is not contested openly by his subordinates.
5. Deciding: from Consensual to Top Down.
Deciding goes from Consensual, like in Japan, to Top Down, like in China
6. Trusting: from Task-Based to Relationship-Based.
Trusting goes from Task-Based, like in the USA to Relationship-Based, like in Saudi-
Arabia. Task-based means that if people work well, the work can be done based on
competence only. In relationship-based societies, relationship building is a pre-requisite for
a good work relationship. This of course also requires competence, but it will be recognized
only after the relationship is built.
7. Disagreeing: from Confrontational to Avoiding Confrontation.
Disagreeing goes from Confrontational, like in Greece to Avoiding Confrontation, like in
Indonesia. What this means is that in a confrontational culture, it is ok to express
disagreement openly without putting the relationship at stake. However, this is not
acceptable at all for cultures based on the right side of this scale.
8. Scheduling: from Linear Time to Flexible Time.
120
Scheduling goes from Linear Time like in Switzerland to Flexible Time, like in Nigeria,
but with all kinds of relative nuances like in the other examples.
For example, if the scheduling dimension is chosen, an individual belonging to a more flexible
time cultural group may be considered as always late by an individual of another cultural group
with less flexibility. Nevertheless, the less ‘flexible’ individuals may then be considered always
late by a third one belonging to a cultural group positioned even further on the scale towards
linear time than they are. The theory of Adaptive Complex Systems [87] makes it possible to
consider each individual working on a project as an agent, associated with properties that will
vary based on their culture or context. A preliminary alignment of the properties of the agents
at the project level (creation of a common culture for the project, which can be a compromise
between the represented cultures) is mandatory to achieve a good result.
To show the necessity of an alignment, suppose that global project teams arrive to a meeting
scheduled at 9:00 am between 8:30 and 10 am. A system adapting the agenda based on culture
to fit the discussion points to the projected arrival time of each member will reduce
aggressiveness between the participants and contribute to a smooth meeting.
Practically, each individual agent will keep their culture as an attribute and the system will
adapt the agenda if it can be taught what the differences are.
It can be argued that global knowledge workers will have developed a global or company
culture that is not their culture of origin. However, this global culture is too often assumed by
multinational corporations to be shared by all when they start a project with a local group that
has not been previously exposed to global projects. It therefore remains important to take into
account the culture of origin and its evolution for global workers.
These dimensions were formalized in the Culture Map (CM) ontology shown on Figure 23,
showing the particular cultural dimensions and culture that are relevant in business projects that
involve different cultures.
This ontology was created in hozo, showing the eight cultural elements, with quantitative values
from 0 to 100 that are different by country. The cultural groups are shown on the left, using the
Culture and Enculturated Agents notions of the UOC. Cultural dimensions are shown on the
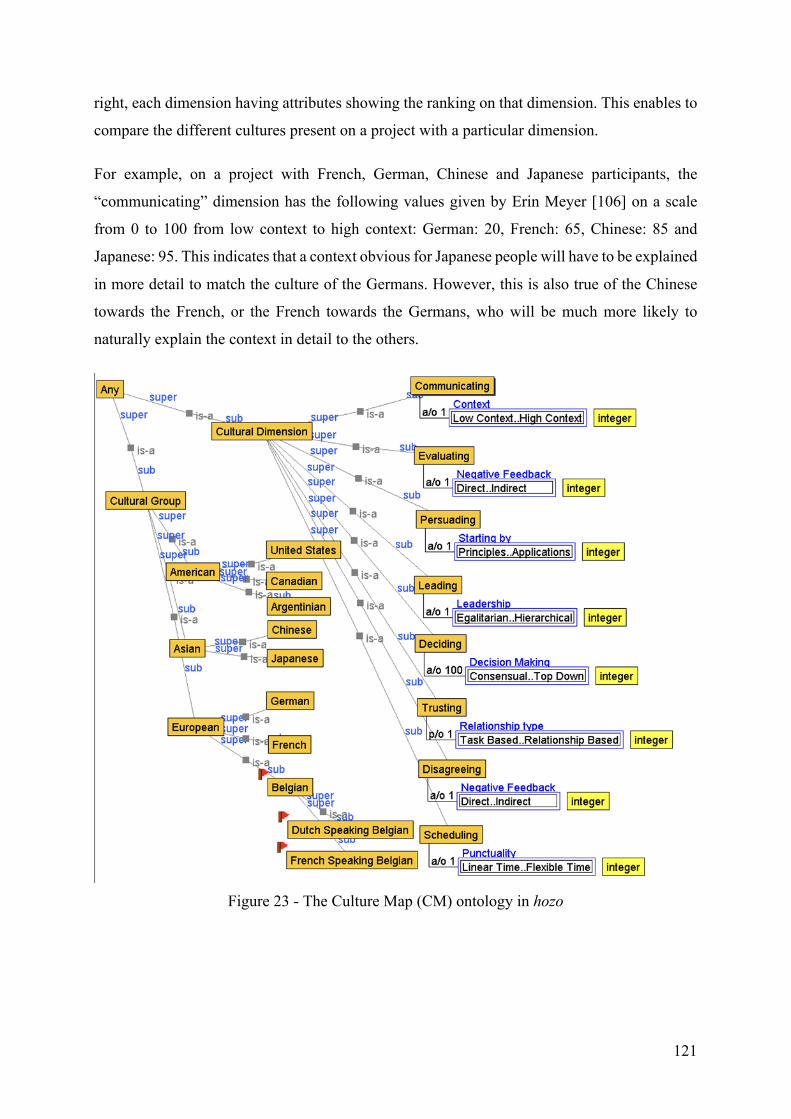
121
right, each dimension having attributes showing the ranking on that dimension. This enables to
compare the different cultures present on a project with a particular dimension.
For example, on a project with French, German, Chinese and Japanese participants, the
“communicating” dimension has the following values given by Erin Meyer [106] on a scale
from 0 to 100 from low context to high context: German: 20, French: 65, Chinese: 85 and
Japanese: 95. This indicates that a context obvious for Japanese people will have to be explained
in more detail to match the culture of the Germans. However, this is also true of the Chinese
towards the French, or the French towards the Germans, who will be much more likely to
naturally explain the context in detail to the others.
Figure 23 - The Culture Map (CM) ontology in hozo
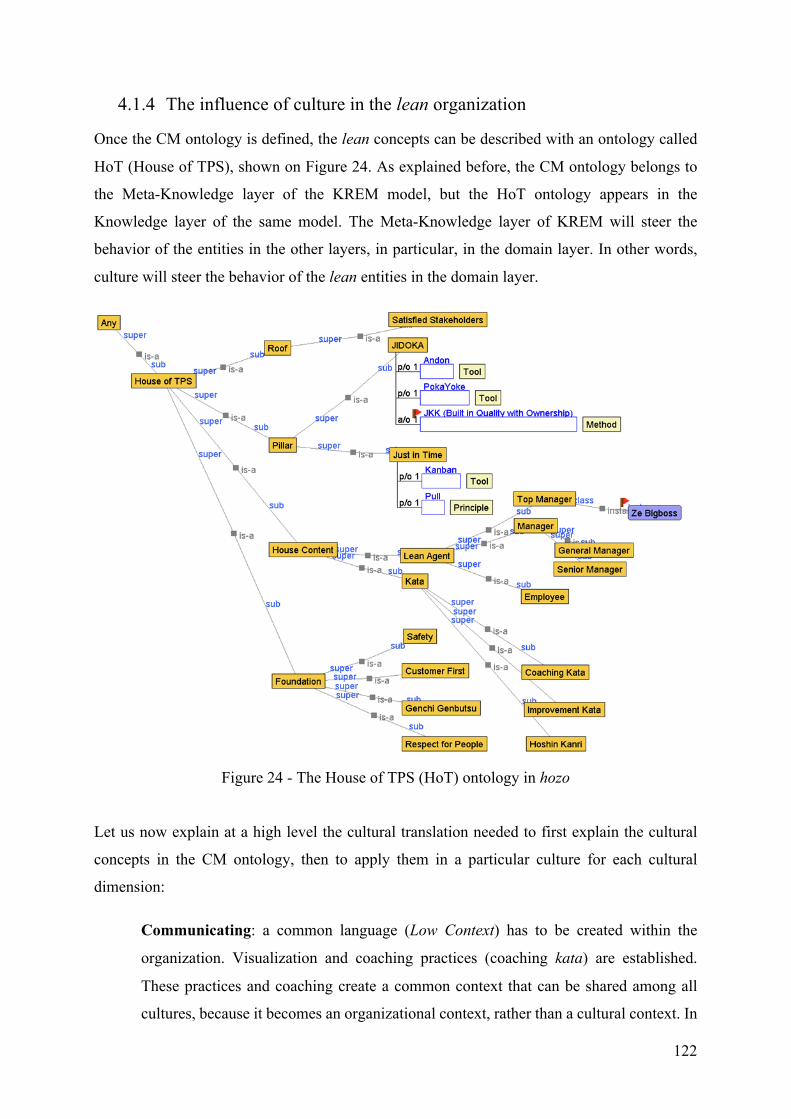
122
4.1.4 The influence of culture in the lean organization
Once the CM ontology is defined, the lean concepts can be described with an ontology called
HoT (House of TPS), shown on Figure 24. As explained before, the CM ontology belongs to
the Meta-Knowledge layer of the KREM model, but the HoT ontology appears in the
Knowledge layer of the same model. The Meta-Knowledge layer of KREM will steer the
behavior of the entities in the other layers, in particular, in the domain layer. In other words,
culture will steer the behavior of the lean entities in the domain layer.
Figure 24 - The House of TPS (HoT) ontology in hozo
Let us now explain at a high level the cultural translation needed to first explain the cultural
concepts in the CM ontology, then to apply them in a particular culture for each cultural
dimension:
Communicating: a common language (Low Context) has to be created within the
organization. Visualization and coaching practices (coaching kata) are established.
These practices and coaching create a common context that can be shared among all
cultures, because it becomes an organizational context, rather than a cultural context. In
123
this way, Japanese culture which is high context and difficult to integrate for foreigners
is replaced by a communication context that is common to all the organization workers
and facilitates communication. Nevertheless, at the same time it finds its sources at the
same time in deeply engrained Japanese coaching practices (with the well-known
concept of sensei, or coach).
Evaluating: this is best done based on a common standard, but respecting the culture of
the employee. Reflection (hansei) is systematically encouraged after each project (it is
the “C” or Check phase in Shewhart’s PDCA cycle [108] popularized by W.Edwards
Deming). However, different cultures will react differently to evaluation. In some
cultures, public reflection after mistakes is expected from children only, while adults
are not expected to reflect on mistakes in public. In Japan, adults are expected to reflect
on their mistakes in order to enable the whole organization to become better at doing
things. This often has to be explained to non-Japanese individuals.
Persuading: this dimension goes from Principles First to Application First. French
culture is an example of Principles First culture, principles are usually explained first,
then practical examples are used later to illustrate them. Lean is based on practice, so it
is clearly Applications First, more like American culture, where examples or
applications are shown first and then used to introduce the theory (the principles). This
must be considered when teaching lean (or anything) to Principle First or Application
First cultures. Hence, in a Principle First culture, the principles, the meaning and the
benefits of lean must be explained to employees before asking them to apply them. In
an Application First culture, it will be possible to start directly with the practice of lean
and explain the principles later.
Leading: Lean can be applied in both egalitarian and hierarchical models. In an
egalitarian culture, applying lean is very natural. This is because lean respects and
values the opinion of all those who are knowledgeable in a particular field, and mandates
Facts-Based Reasoning. When applying lean to hierarchical models, it is essential to
train the leader (or train the trainer). The leader will then have the role to mandate the
practices that will be followed.
Deciding: this dimension goes from Bottom Up to Top Down. Lean is in contradiction
with pure Top Down. The consensus-building practice (nemawashi) is obviously a
124
Bottom Up approach, so in Top Down deciding cultures, the consensus building has to
be mandated by top management, or it will not happen.
Trusting: Lean can be applied in both task-based and relationship-based cultures. Two
Toyota Way values are relevant here (described in the Toyota Way 2001): Teamwork
(which dates back to the heroic age of Toyota where the company employees and
suppliers worked together as one team to achieve the same goal of building the first
Japanese cars) and Respect for People (which means respecting the capacity of every
employee to develop their skills). Teamwork and Respect for People will create the
relationships needed for both cultures. Relationship-building is encouraged so long as
the tasks themselves can be performed with high quality.
Disagreeing: in lean, disagreement is allowed and even encouraged as a way to foster
the emergence of new ideas, while at the same time respecting basic rules (for example
never blame a person while solving problems). Various options will always be
considered before a decision is taken. People disagreeing on which solution to take are
systematically coached to gather the facts needed to demonstrate the best solution. This
strongly helps to reduce the viable options proposed to any top management decision
level.
Scheduling: as mentioned in the introduction, this has to be agreed per site or project.
This can be done by clarifying the expectations and the rules. Most cultures understand
that being on time for a meeting is an acceptable compromise. However, it may not be
clear without explanation that in a high context culture like Japan, a supplier is expected
to arrive at least fifteen minutes before an appointment with their customer to be
considered on time. Explanation of the cultural context to expatriates is mandatory in
such a situation. Conversely, it must be explained to Japanese employees that they are
not expected to show up at a European meeting 15 minutes in advance.
Here, it becomes clear that, when teaching the principles of lean as a common language to
different groups of people from different cultures and nationalities, it is important to explain
the notions that take their roots in the reference culture. Consensus-building practice
(nemawashi) hits a very low score in cultures high on the Deciding scale (more Top Down).
But after this is taught and the cultural elements of lean are integrated by the project teams, it
is still important to bear in mind those cultural differences. An example is given above for
125
Evaluation (hansei, dimension #2), another one is the Scheduling (dimension #8), where
differences may persist for a long time, so a one-off explanation may not be enough. The way
to give feedback may also have to be more or less direct depending on the culture and the
context.
4.1.5 Experiment, in silico
To illustrate the concepts explained here, an experiment is proposed, taking the hoshin kanri
process already described [132] and adding the cultural/contextual dimension to it.
Context of the Experiment
The hoshin kanri process (which means “management of the direction”) shows the behavior of
a typical lean process under different starting conditions. Are the same results obtained if the
process starts from a list of potential objectives injected by the top management? Or do they
gradually emerge out of the input of the employees, gradually going up the levels using a
consensus-building process (nemawashi)? The simulations realized show that if the operators
of the process have good skills and competence, the results can be very good, if not better, when
the process is not started by Top Management. Rather, the process evolves from the positive
dynamics of competent agents interacting with each other. Now, imagine a culture where agents
believe they can only do what the manager tells them to do, High Power Distance in the scale
of Hofstede [130] or the Leading concept on the hierarchical side in the dimension model of
Erin Meyer [106]. In this case, it is easy to imagine that, without appropriate input from Top
Management, nothing would happen. This can be solved by asking Top Management to start
the process, recognizing the cultural context in order to reach the ideal organizational efficiency.
In this case, it is necessary to ask the Top Manager to give a strong order to all their employees
to come up with individual ideas, reassuring them that the Top Manager will take ultimate
responsibility for the result.
The management of the direction (hoshin kanri) process in a cultural context
Let us give a high-level description of the standard rules of the hoshin kanri process:
• The purpose of hoshin kanri is to generate a consensed view of company objectives for
the next period (for example one fiscal year for a legal entity).
• The process takes around 90 days (three months) every year.
• The number of items to come up with may be bounded (e.g. max 10 items).
126
• The process may be started top-down or bottom-up.
• The items proposed at operator level are consensed with peers, then submitted above,
consensed again (including the management ideas), then submitted above until top
management is reached. At that time, the ideas include top management ideas.
• Every agent in the organization is allowed to contribute with ideas.
• All agents have seniority and expertise. The probability to see their proposed items
accepted in the nemawashi process increases with their seniority and expertise. These
rules are modeled without distinction of culture using the Drools36 rules engine and the
Python37 language. The relevant cultural dimensions for the hoshin kanri process are:
Ø Persuading (dimension #3),
Ø Leading (dimension #4),
Ø Deciding (dimension #5),
Ø Scheduling (dimension #8).
This leads to the following culture-related rules from the meta-data layer, which all add a step
before the execution of the hoshin kanri process:
• ∀ agent, if culture(agent).persuading ∈ [0..50] (Principles First),
then add step “explain the hoshin kanri process”
• ∀ agent, if culture(agent).leading ∈ ]50..100] (Hierarchical),
then add step “top management briefing at the beginning of the project”
• ∀ agent, if culture(agent).deciding ∈ ]50..100] (Top Down),
then add step “explain the need for nemawashi”
Writing these three rules, the existence of a function culture(agent).dimension has been
assumed, associated with the ist predicate mentioned in Section 4.1.2. This returns the
positioning of the agent’s culture on a scale of 0 to 100 for the cultural dimension mentioned
after the point. The next two rules are examples of periodical checks that can be added within
the execution of the process, but not before the process as in the three rules above:
• if culture(agent).scheduling ∈ [0..50] (Flexible Time)
36 Drools is a Business Rules Management System (BRMS), see http://www.drools.org/ 37 Python is a programming language created by the Dutch programmer Guido van Rossum in 1989, see https://www.python.org/
127
then perform “progress check” weekly
• if culture(agent).leading ∈ [0..50] (Top Down) ˄ (team_generated_items < threshold)
then perform “top management reminder” weekly
The ambition here is not to be exhaustive. Rather it is to illustrate how the cultural element can
be integrated on top of an existing process, keeping the existing rules and adding new rules
when relevant in the current cultural context. A multicultural model may even consider the
culture of each agent and give advice adapted to the distance that is observed between the agent
and the agreed cultural dimension positioning for the project.
The example above leads us to the following high-level method to integrate culture in a generic
process, taking into account the cultural dimensions from the Culture Map ontology (CM):
• Detect the relevant dimensions for the process and the culture needed to perform the
process in an optimal way.
• For each dimension and agent, add upfront an alignment step if the cultural difference
is higher or lower than a predetermined threshold (for example 50 points on a scale of
100).
• For the execution of the process itself, add mini-steps for some of the dimensions (for
example in a flexible time culture, more frequent checks of the progress may be needed).
In conclusion, the cultural context provided by the Upper Ontology for Culture (UOC) [68] and
the Culture Map ontology (CM) proposed here form a useful framework to enhance knowledge
of a particular field, for example the lean domain described by the House of TPS (HoT) domain
ontology. It enables us to enrich the knowledge and rule models for lean with experience and
meta-knowledge coming from the cultural context. Clarifying the vocabulary and formalizing
the interactions that were otherwise often handled in an informal way has provided us with a
solid basis for future work.
4.2 Simulating the hoshin process as a Complex System
In the models presented here, hoshin kanri and nemawashi are considered as isolated processes.
The specific nemawashi process is abstracted in the hoshin kanri, and only its output (item
selected or not) is considered in the model. The first view for analyzing Complex Systems, i.e.
concepts [65], is given for both of them as ontologies.
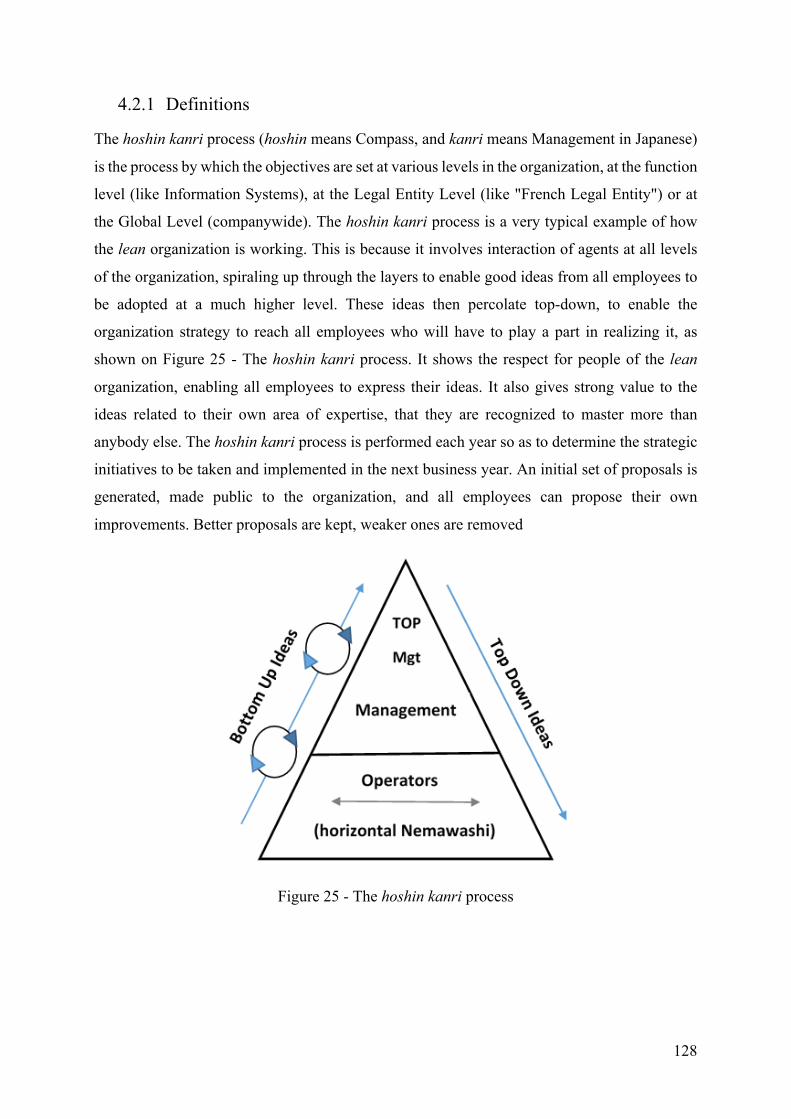
128
4.2.1 Definitions
The hoshin kanri process (hoshin means Compass, and kanri means Management in Japanese)
is the process by which the objectives are set at various levels in the organization, at the function
level (like Information Systems), at the Legal Entity Level (like "French Legal Entity") or at
the Global Level (companywide). The hoshin kanri process is a very typical example of how
the lean organization is working. This is because it involves interaction of agents at all levels
of the organization, spiraling up through the layers to enable good ideas from all employees to
be adopted at a much higher level. These ideas then percolate top-down, to enable the
organization strategy to reach all employees who will have to play a part in realizing it, as
shown on Figure 25 - The hoshin kanri process. It shows the respect for people of the lean
organization, enabling all employees to express their ideas. It also gives strong value to the
ideas related to their own area of expertise, that they are recognized to master more than
anybody else. The hoshin kanri process is performed each year so as to determine the strategic
initiatives to be taken and implemented in the next business year. An initial set of proposals is
generated, made public to the organization, and all employees can propose their own
improvements. Better proposals are kept, weaker ones are removed
Figure 25 - The hoshin kanri process
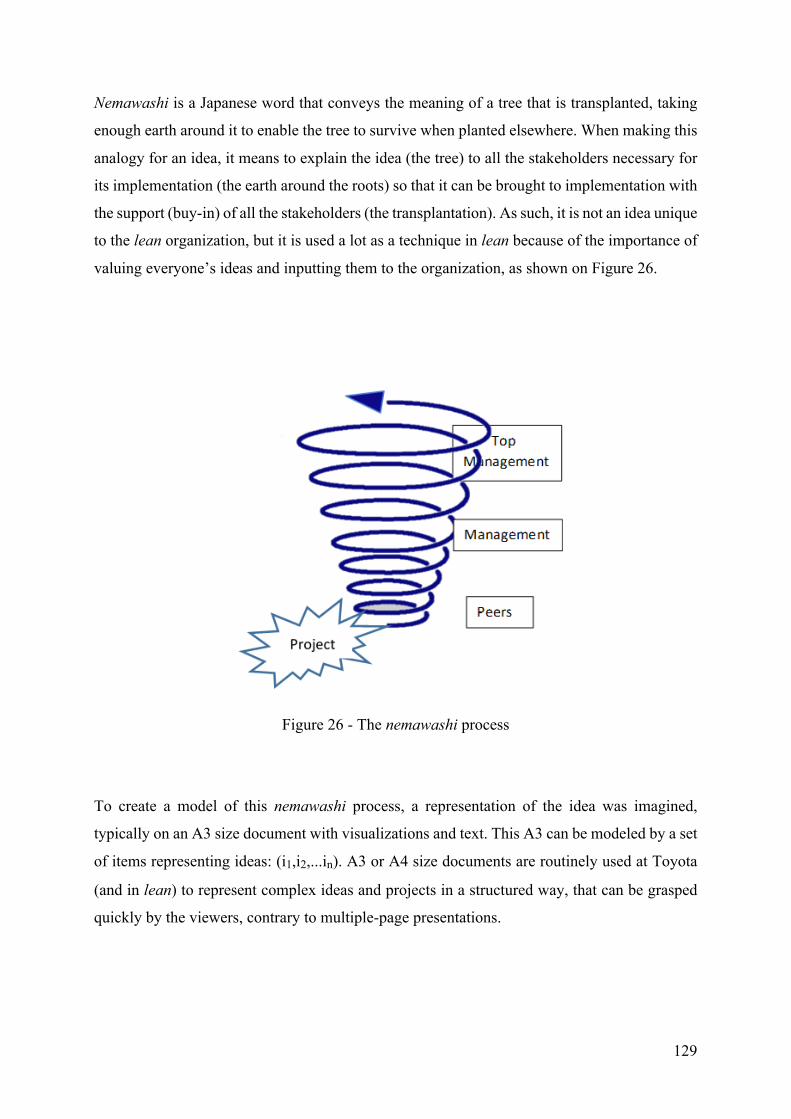
129
Nemawashi is a Japanese word that conveys the meaning of a tree that is transplanted, taking
enough earth around it to enable the tree to survive when planted elsewhere. When making this
analogy for an idea, it means to explain the idea (the tree) to all the stakeholders necessary for
its implementation (the earth around the roots) so that it can be brought to implementation with
the support (buy-in) of all the stakeholders (the transplantation). As such, it is not an idea unique
to the lean organization, but it is used a lot as a technique in lean because of the importance of
valuing everyone’s ideas and inputting them to the organization, as shown on Figure 26.
Figure 26 - The nemawashi process
To create a model of this nemawashi process, a representation of the idea was imagined,
typically on an A3 size document with visualizations and text. This A3 can be modeled by a set
of items representing ideas: (i1,i2,...in). A3 or A4 size documents are routinely used at Toyota
(and in lean) to represent complex ideas and projects in a structured way, that can be grasped
quickly by the viewers, contrary to multiple-page presentations.
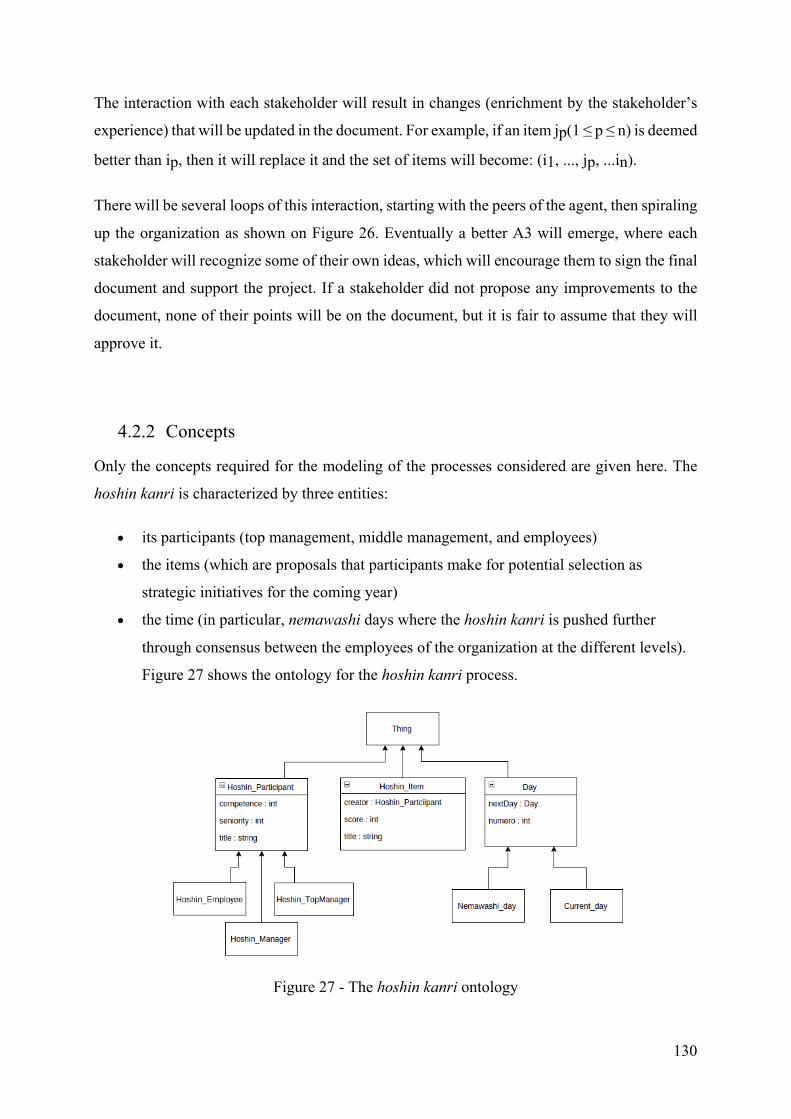
130
The interaction with each stakeholder will result in changes (enrichment by the stakeholder’s
experience) that will be updated in the document. For example, if an item jp(1 ≤ p ≤ n) is deemed
better than ip, then it will replace it and the set of items will become: (i1, ..., jp, ...in).
There will be several loops of this interaction, starting with the peers of the agent, then spiraling
up the organization as shown on Figure 26. Eventually a better A3 will emerge, where each
stakeholder will recognize some of their own ideas, which will encourage them to sign the final
document and support the project. If a stakeholder did not propose any improvements to the
document, none of their points will be on the document, but it is fair to assume that they will
approve it.
4.2.2 Concepts
Only the concepts required for the modeling of the processes considered are given here. The
hoshin kanri is characterized by three entities:
• its participants (top management, middle management, and employees)
• the items (which are proposals that participants make for potential selection as
strategic initiatives for the coming year)
• the time (in particular, nemawashi days where the hoshin kanri is pushed further
through consensus between the employees of the organization at the different levels).
Figure 27 shows the ontology for the hoshin kanri process.
Figure 27 - The hoshin kanri ontology
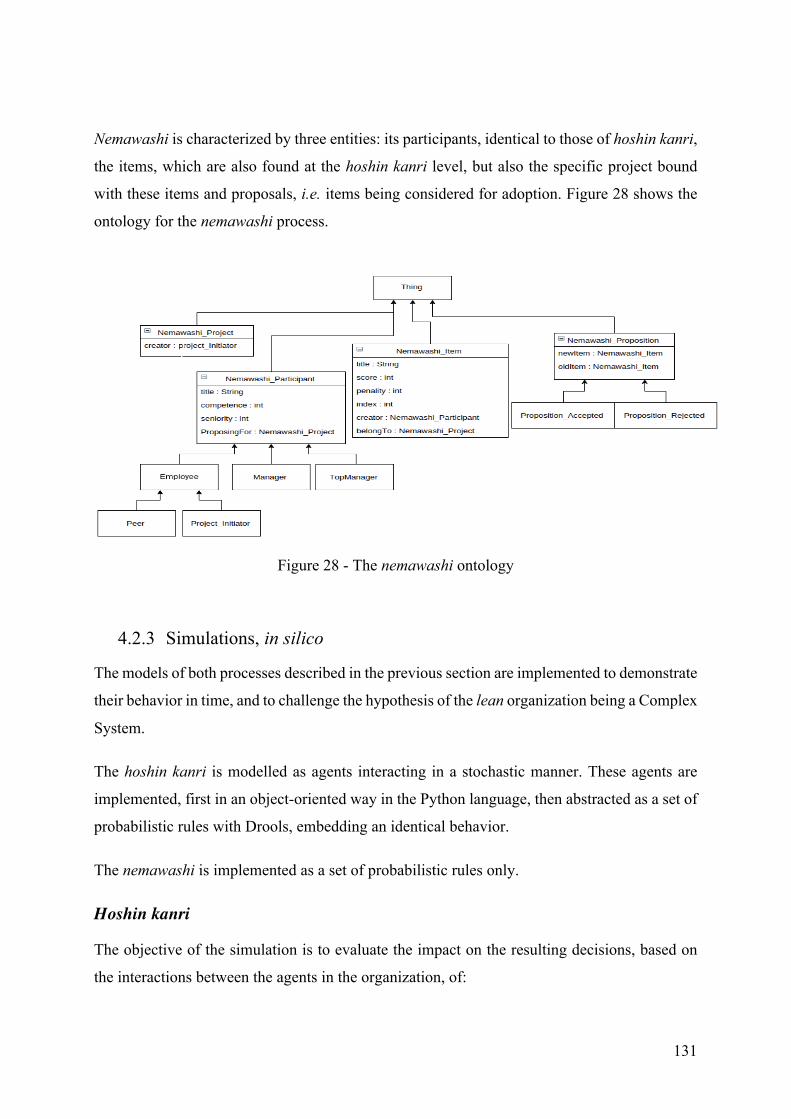
131
Nemawashi is characterized by three entities: its participants, identical to those of hoshin kanri,
the items, which are also found at the hoshin kanri level, but also the specific project bound
with these items and proposals, i.e. items being considered for adoption. Figure 28 shows the
ontology for the nemawashi process.
Figure 28 - The nemawashi ontology
4.2.3 Simulations, in silico
The models of both processes described in the previous section are implemented to demonstrate
their behavior in time, and to challenge the hypothesis of the lean organization being a Complex
System.
The hoshin kanri is modelled as agents interacting in a stochastic manner. These agents are
implemented, first in an object-oriented way in the Python language, then abstracted as a set of
probabilistic rules with Drools, embedding an identical behavior.
The nemawashi is implemented as a set of probabilistic rules only.
Hoshin kanri
The objective of the simulation is to evaluate the impact on the resulting decisions, based on
the interactions between the agents in the organization, of:
132
• Quality of initial proposals
• Emitter of initial proposals, either Top Management or all employees
• Seniority and skills of employees and managers
• Elapsed time.
Simulation parameters are driven from the experience at Toyota:
• The hoshin kanri process is simulated on a period of 90 days, or three months, which is
the typical time frame used for this.
• The agents are at three levels: Top Management, Management and employees.
• Two types of initializations can be performed: either the Top Management proposes the
initial items, or everybody in the organization can propose.
• The hoshin items produced are scored based on a simple rating based on seniority and
experience of each agent. This makes it more likely that Top Management or
Management will have their proposed items retained; however, it does not make it a
certainty.
• The frequency of items input accelerates towards the end of the process,which has been
simulated here by a reverse Fibonacci sequence:
yi =90−fi, for i=1,10, giving: 89, 88, 87, 85, 82, 77, 69, 56, 35 and 1 as values.
• The model presented here is abstracted, because items are often not replaced by others
as a whole. However, interaction between the agents at various levels also use the
nemawashi model to merge several items in a more valuable one.The quality of
proposals is represented on an arbitrary scale from 0 to 100, with 100 representing a
higher quality and 0 a lower quality. This quantification enables to abstract the
comparison process between two items: the better item is kept, the weaker is removed.
Figure 29 shows the evolution in time of the average item value for the hoshin kanri process
after 200 runs, for various initialization processes (by Top Management/by everybody) and
various skill level of employees of the organization (Weak Peers/ Strong Peers). When the Top
Management issues the initial items, the resulting decision quality, as one can expect, depends
on the feedback of the employees If the employees have weaker skills, the resulting decisions
will have a lower overall quality. When the employees have a high seniority and proficiency,
an interesting phenomenon occurs: employee-driven hoshin kanri leads to results as good as
Top Management-driven hoshin kanri. In this case, the presence of management seems to be
useless. Interestingly enough, these results match a radical shift in the culture of lean
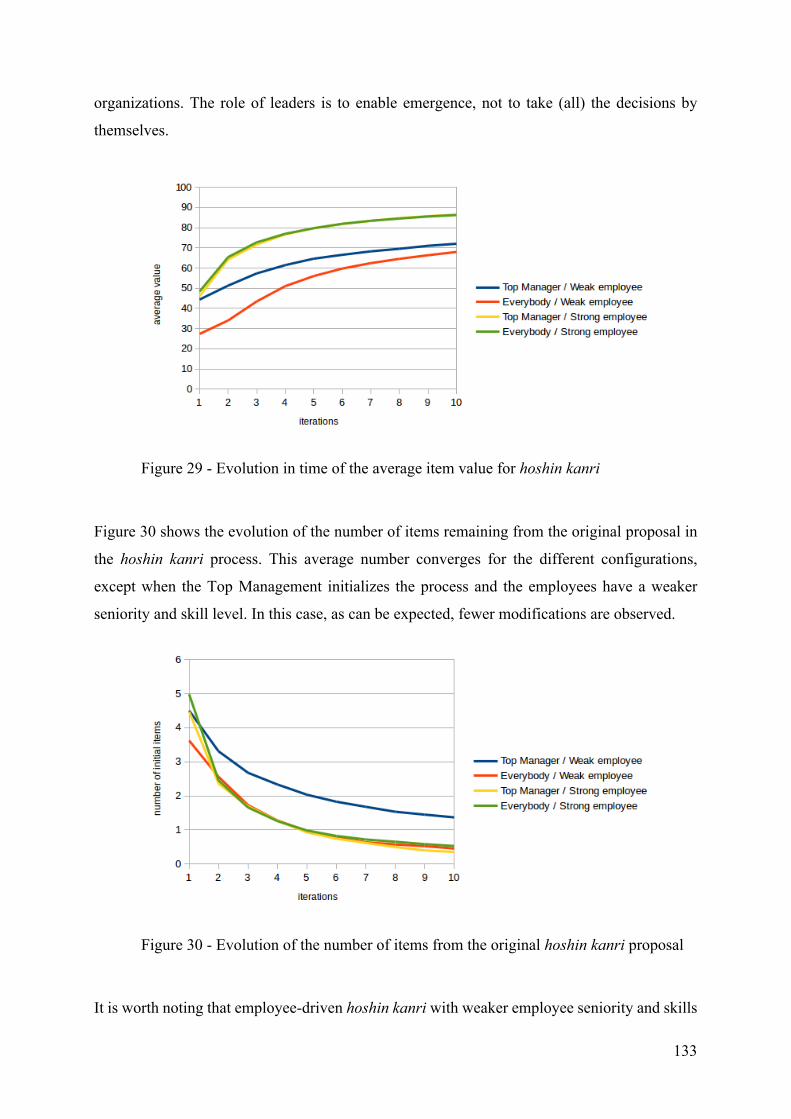
133
organizations. The role of leaders is to enable emergence, not to take (all) the decisions by
themselves.
Figure 29 - Evolution in time of the average item value for hoshin kanri
Figure 30 shows the evolution of the number of items remaining from the original proposal in
the hoshin kanri process. This average number converges for the different configurations,
except when the Top Management initializes the process and the employees have a weaker
seniority and skill level. In this case, as can be expected, fewer modifications are observed.
Figure 30 - Evolution of the number of items from the original hoshin kanri proposal
It is worth noting that employee-driven hoshin kanri with weaker employee seniority and skills

134
lead to as many new proposals (and thus rework) as when employees are more experienced. If
these results are compared to those of Figure 29, it can be seen that the same amount of energy
will then be spent to achieve weaker results. When the employees have weaker experience, the
hoshin kanri process should better be led by the Top Management.
Nemawashi
The nemawashi process is performed at each step of the hoshin kanri for building consensus.
The consensus building process itself is the focus point here, independent of its potential
integration in the hoshin kanri.
The core simulation parameters are the seniority value (in years), as well as the competence
value (a score of 1 to 10) of the nemawashi participant.
The first step is the creation of a project by the initiator. He puts 20 items in it (for example 20
items on an A3 document). Each item is generated with an id, a penalty value (initialized to 0),
and a score. The penalty value is used to represent numerically the likelihood of items to be
rejected based on successive nemawashi rounds.
The maximum score for the nemawashi items is given by following equation:
max_score = initiator’s seniority * initiator’s competence (2)
Then, the item score is randomly chosen between 0 and the maximum score. The penalty is
increased each time a participant makes a proposition to replace it with a better item and when
the initiator does not consider it. The higher the penalty, the higher the chance it will be replaced.
Once the project is initiated, the initiator will show it to his peers, then to the managers, and
finally to the Top Manager to enhance it with the experience of all the participants. Each of
them will see some items and if they have a more valuable idea, propose it to the initiator. The
probability that the initiator accepts to swap the item is given by the following equation:
p = (score of the new item + (5 ∗ penalty of the project’s item))/100 (3)
If the initiator rejects the new idea, the penalty of the project’s item is increased. Otherwise the
items are exchanged. Moreover, if the initiator rejects all the items of a manager, there is an 80%
chance that the manager will not sign (proposing new items again). There is only a 10% chance
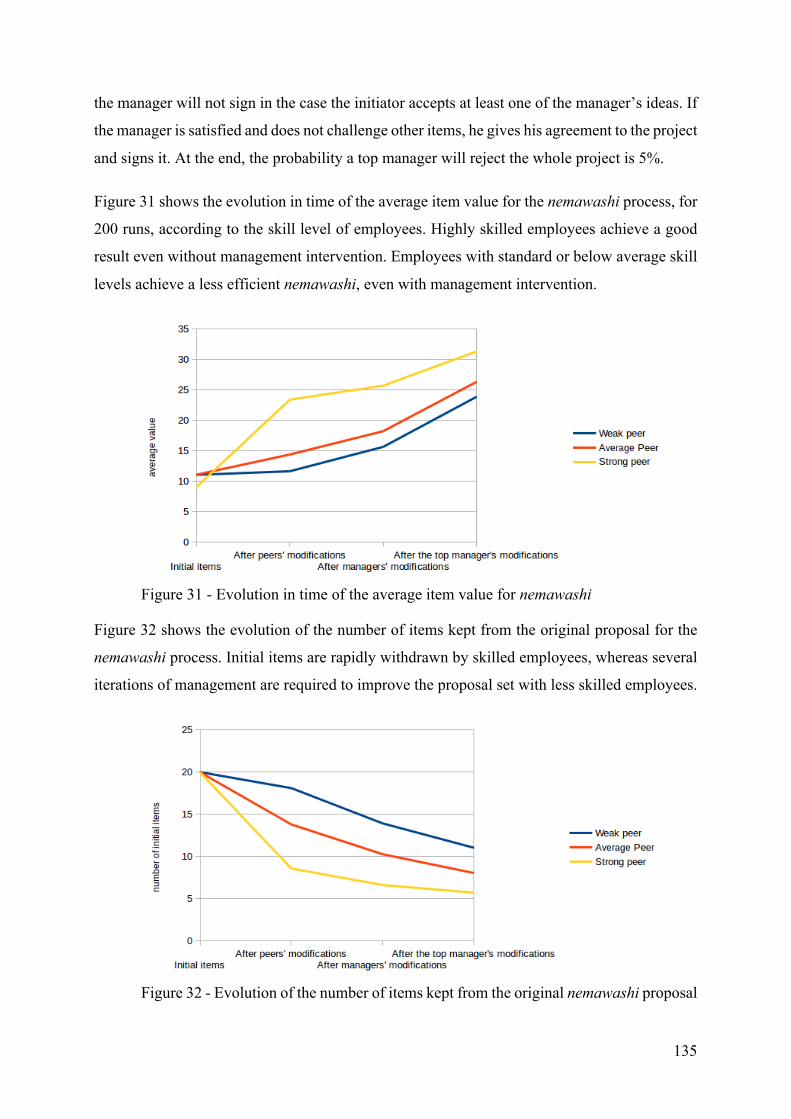
135
the manager will not sign in the case the initiator accepts at least one of the manager’s ideas. If
the manager is satisfied and does not challenge other items, he gives his agreement to the project
and signs it. At the end, the probability a top manager will reject the whole project is 5%.
Figure 31 shows the evolution in time of the average item value for the nemawashi process, for
200 runs, according to the skill level of employees. Highly skilled employees achieve a good
result even without management intervention. Employees with standard or below average skill
levels achieve a less efficient nemawashi, even with management intervention.
Figure 31 - Evolution in time of the average item value for nemawashi
Figure 32 shows the evolution of the number of items kept from the original proposal for the
nemawashi process. Initial items are rapidly withdrawn by skilled employees, whereas several
iterations of management are required to improve the proposal set with less skilled employees.
Figure 32 - Evolution of the number of items kept from the original nemawashi proposal
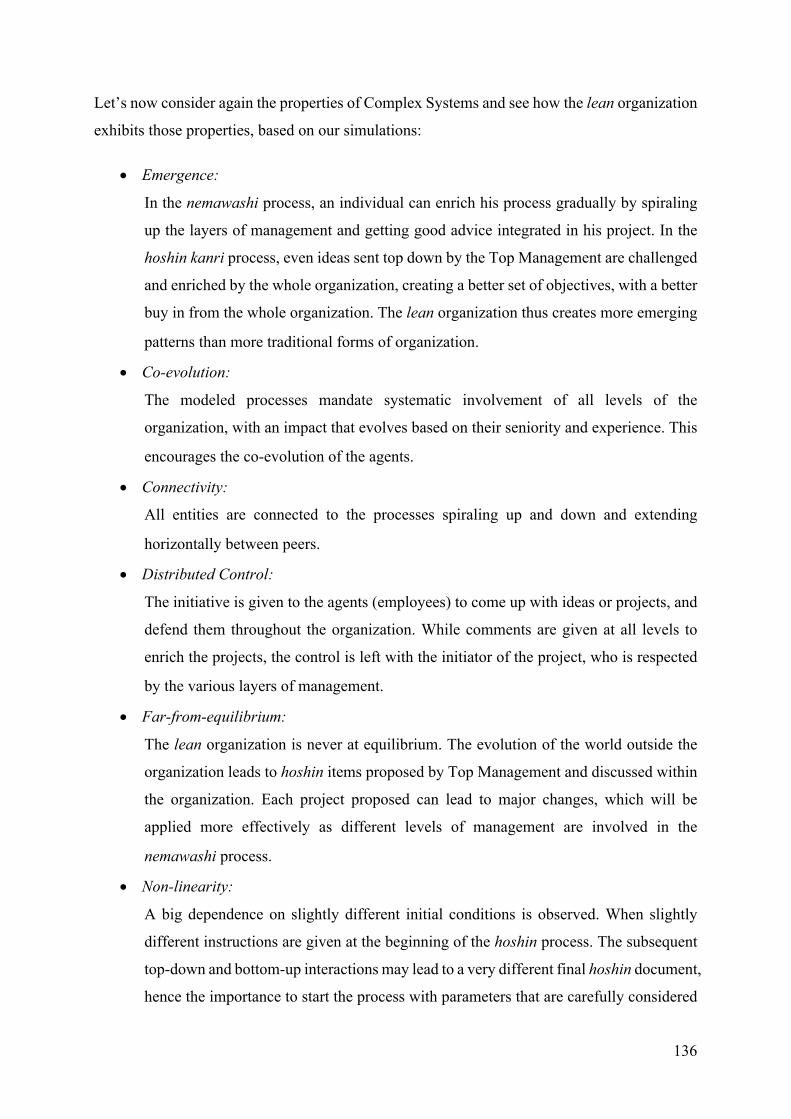
136
Let’s now consider again the properties of Complex Systems and see how the lean organization
exhibits those properties, based on our simulations:
• Emergence:
In the nemawashi process, an individual can enrich his process gradually by spiraling
up the layers of management and getting good advice integrated in his project. In the
hoshin kanri process, even ideas sent top down by the Top Management are challenged
and enriched by the whole organization, creating a better set of objectives, with a better
buy in from the whole organization. The lean organization thus creates more emerging
patterns than more traditional forms of organization.
• Co-evolution:
The modeled processes mandate systematic involvement of all levels of the
organization, with an impact that evolves based on their seniority and experience. This
encourages the co-evolution of the agents.
• Connectivity:
All entities are connected to the processes spiraling up and down and extending
horizontally between peers.
• Distributed Control:
The initiative is given to the agents (employees) to come up with ideas or projects, and
defend them throughout the organization. While comments are given at all levels to
enrich the projects, the control is left with the initiator of the project, who is respected
by the various layers of management.
• Far-from-equilibrium:
The lean organization is never at equilibrium. The evolution of the world outside the
organization leads to hoshin items proposed by Top Management and discussed within
the organization. Each project proposed can lead to major changes, which will be
applied more effectively as different levels of management are involved in the
nemawashi process.
• Non-linearity:
A big dependence on slightly different initial conditions is observed. When slightly
different instructions are given at the beginning of the hoshin process. The subsequent
top-down and bottom-up interactions may lead to a very different final hoshin document,
hence the importance to start the process with parameters that are carefully considered
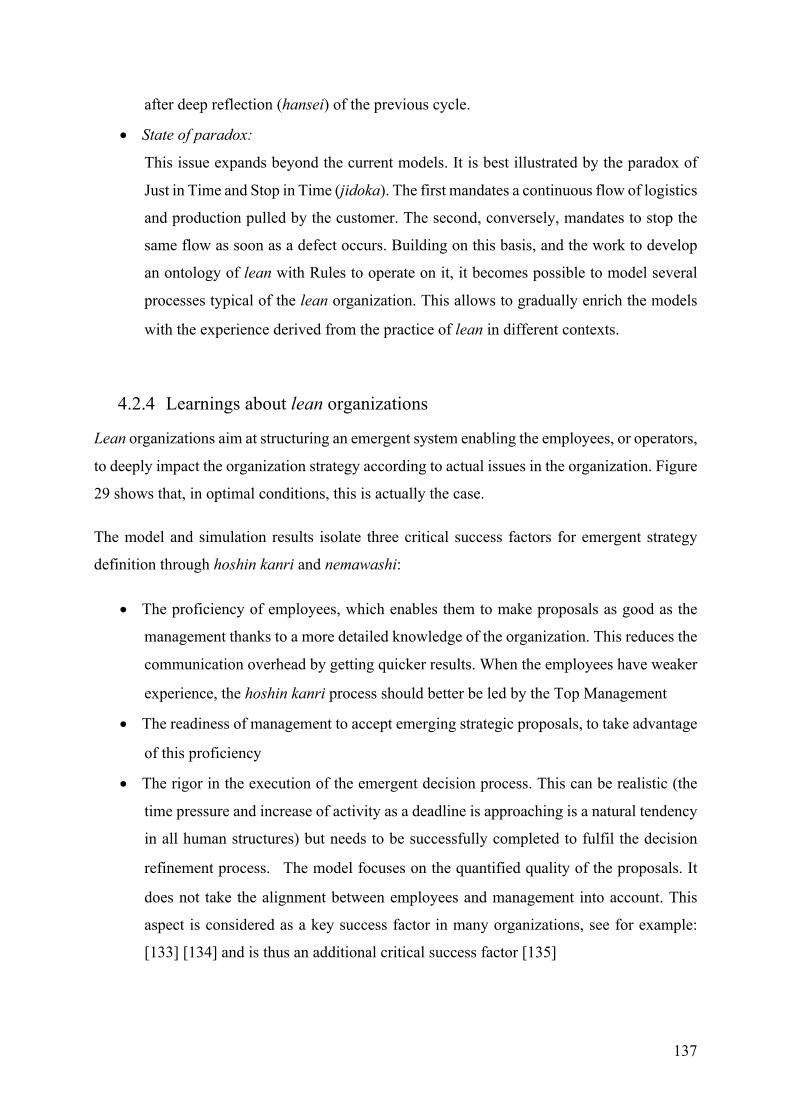
137
after deep reflection (hansei) of the previous cycle.
• State of paradox:
This issue expands beyond the current models. It is best illustrated by the paradox of
Just in Time and Stop in Time (jidoka). The first mandates a continuous flow of logistics
and production pulled by the customer. The second, conversely, mandates to stop the
same flow as soon as a defect occurs. Building on this basis, and the work to develop
an ontology of lean with Rules to operate on it, it becomes possible to model several
processes typical of the lean organization. This allows to gradually enrich the models
with the experience derived from the practice of lean in different contexts.
4.2.4 Learnings about lean organizations
Lean organizations aim at structuring an emergent system enabling the employees, or operators,
to deeply impact the organization strategy according to actual issues in the organization. Figure
29 shows that, in optimal conditions, this is actually the case.
The model and simulation results isolate three critical success factors for emergent strategy
definition through hoshin kanri and nemawashi:
• The proficiency of employees, which enables them to make proposals as good as the
management thanks to a more detailed knowledge of the organization. This reduces the
communication overhead by getting quicker results. When the employees have weaker
experience, the hoshin kanri process should better be led by the Top Management
• The readiness of management to accept emerging strategic proposals, to take advantage
of this proficiency
• The rigor in the execution of the emergent decision process. This can be realistic (the
time pressure and increase of activity as a deadline is approaching is a natural tendency
in all human structures) but needs to be successfully completed to fulfil the decision
refinement process. The model focuses on the quantified quality of the proposals. It
does not take the alignment between employees and management into account. This
aspect is considered as a key success factor in many organizations, see for example:
[133] [134] and is thus an additional critical success factor [135]
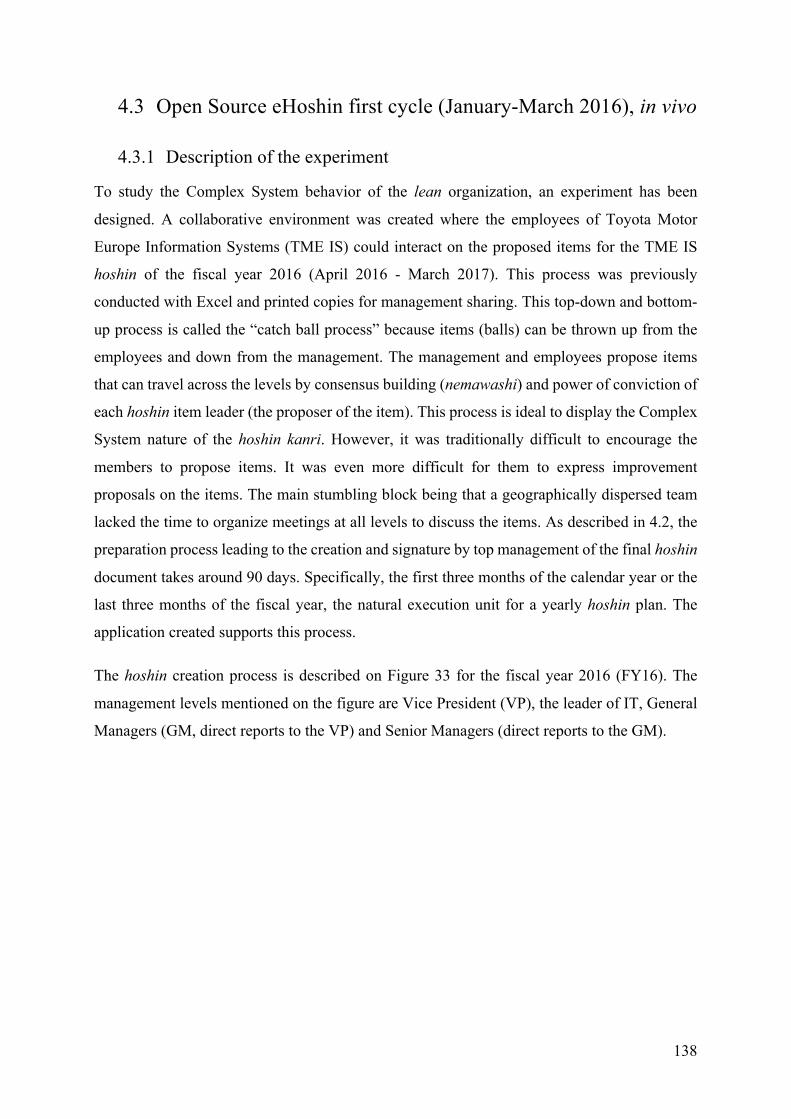
138
4.3 Open Source eHoshin first cycle (January-March 2016), in vivo
4.3.1 Description of the experiment
To study the Complex System behavior of the lean organization, an experiment has been
designed. A collaborative environment was created where the employees of Toyota Motor
Europe Information Systems (TME IS) could interact on the proposed items for the TME IS
hoshin of the fiscal year 2016 (April 2016 - March 2017). This process was previously
conducted with Excel and printed copies for management sharing. This top-down and bottom-
up process is called the “catch ball process” because items (balls) can be thrown up from the
employees and down from the management. The management and employees propose items
that can travel across the levels by consensus building (nemawashi) and power of conviction of
each hoshin item leader (the proposer of the item). This process is ideal to display the Complex
System nature of the hoshin kanri. However, it was traditionally difficult to encourage the
members to propose items. It was even more difficult for them to express improvement
proposals on the items. The main stumbling block being that a geographically dispersed team
lacked the time to organize meetings at all levels to discuss the items. As described in 4.2, the
preparation process leading to the creation and signature by top management of the final hoshin
document takes around 90 days. Specifically, the first three months of the calendar year or the
last three months of the fiscal year, the natural execution unit for a yearly hoshin plan. The
application created supports this process.
The hoshin creation process is described on Figure 33 for the fiscal year 2016 (FY16). The
management levels mentioned on the figure are Vice President (VP), the leader of IT, General
Managers (GM, direct reports to the VP) and Senior Managers (direct reports to the GM).
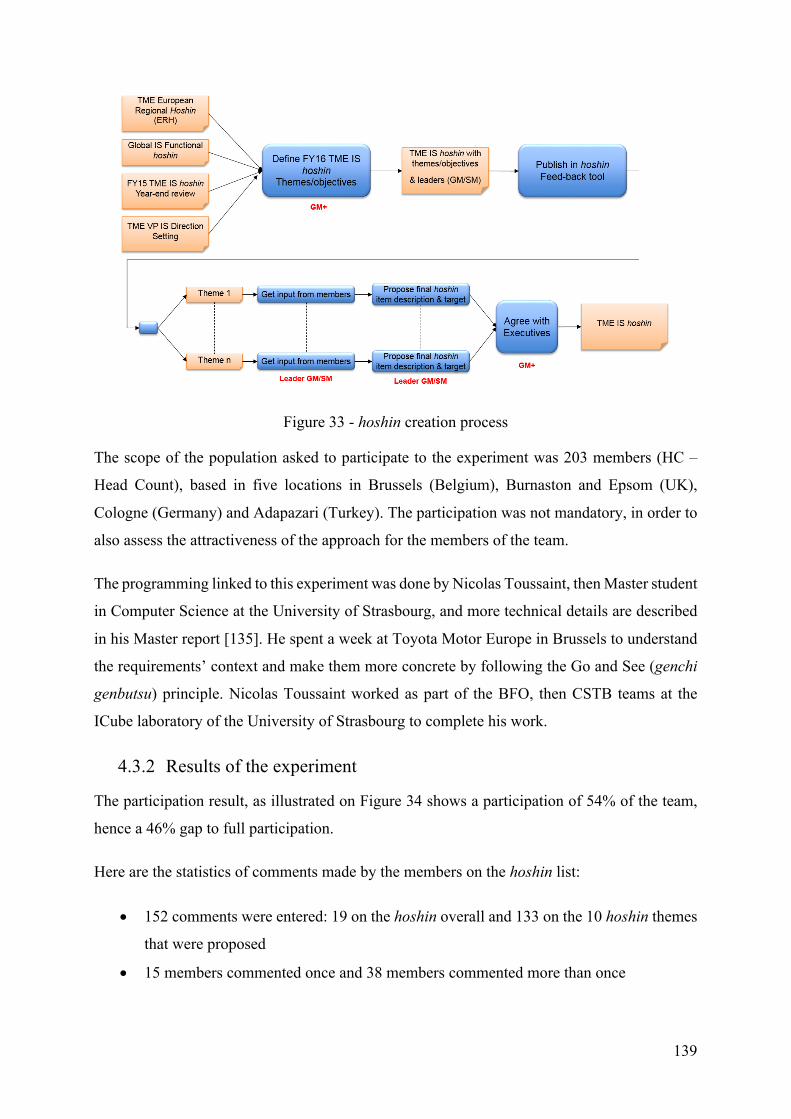
139
Figure 33 - hoshin creation process
The scope of the population asked to participate to the experiment was 203 members (HC –
Head Count), based in five locations in Brussels (Belgium), Burnaston and Epsom (UK),
Cologne (Germany) and Adapazari (Turkey). The participation was not mandatory, in order to
also assess the attractiveness of the approach for the members of the team.
The programming linked to this experiment was done by Nicolas Toussaint, then Master student
in Computer Science at the University of Strasbourg, and more technical details are described
in his Master report [135]. He spent a week at Toyota Motor Europe in Brussels to understand
the requirements’ context and make them more concrete by following the Go and See (genchi
genbutsu) principle. Nicolas Toussaint worked as part of the BFO, then CSTB teams at the
ICube laboratory of the University of Strasbourg to complete his work.
4.3.2 Results of the experiment
The participation result, as illustrated on Figure 34 shows a participation of 54% of the team,
hence a 46% gap to full participation.
Here are the statistics of comments made by the members on the hoshin list:
• 152 comments were entered: 19 on the hoshin overall and 133 on the 10 hoshin themes
that were proposed
• 15 members commented once and 38 members commented more than once
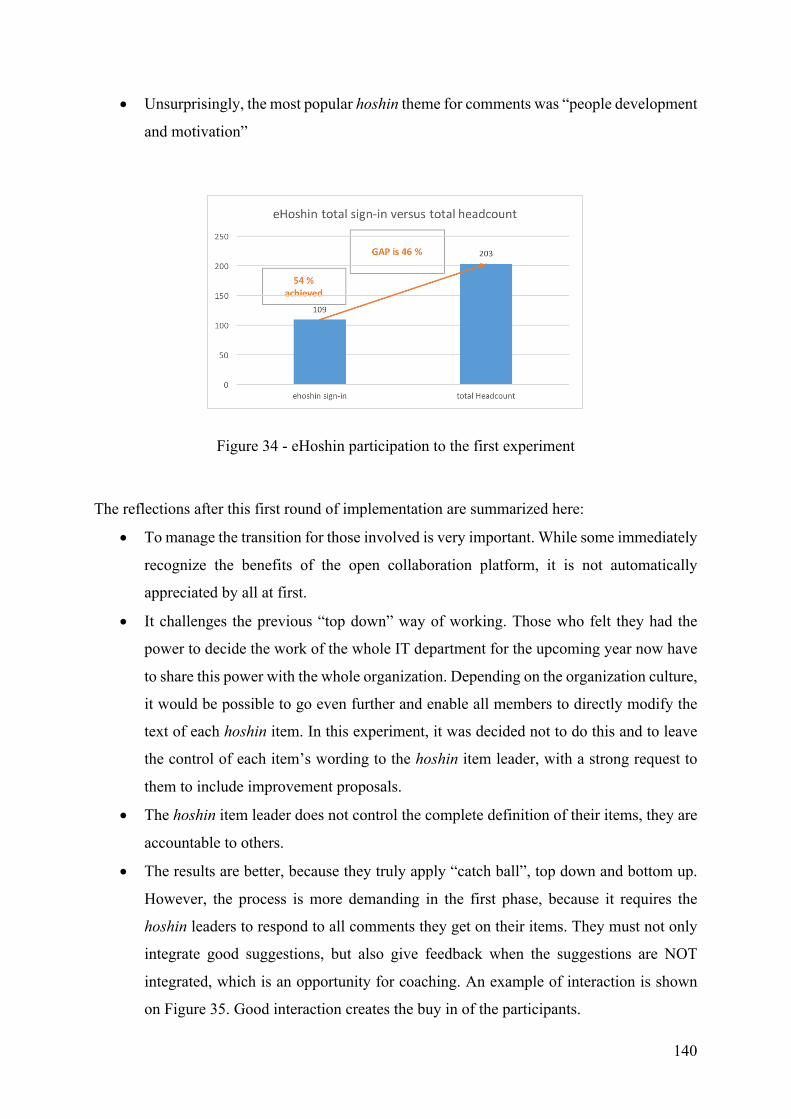
140
• Unsurprisingly, the most popular hoshin theme for comments was “people development
and motivation”
Figure 34 - eHoshin participation to the first experiment
The reflections after this first round of implementation are summarized here:
• To manage the transition for those involved is very important. While some immediately
recognize the benefits of the open collaboration platform, it is not automatically
appreciated by all at first.
• It challenges the previous “top down” way of working. Those who felt they had the
power to decide the work of the whole IT department for the upcoming year now have
to share this power with the whole organization. Depending on the organization culture,
it would be possible to go even further and enable all members to directly modify the
text of each hoshin item. In this experiment, it was decided not to do this and to leave
the control of each item’s wording to the hoshin item leader, with a strong request to
them to include improvement proposals.
• The hoshin item leader does not control the complete definition of their items, they are
accountable to others.
• The results are better, because they truly apply “catch ball”, top down and bottom up.
However, the process is more demanding in the first phase, because it requires the
hoshin leaders to respond to all comments they get on their items. They must not only
integrate good suggestions, but also give feedback when the suggestions are NOT
integrated, which is an opportunity for coaching. An example of interaction is shown
on Figure 35. Good interaction creates the buy in of the participants.
141
Figure 35 - Example interaction with a hoshin leader
4.3.3 Global sharing of the open source eHoshin application
It was decided to share this application as open source to enable its usage by virtually any
organization in the world, formal or informal, profit or non-for profit. Like this, anyone can
create a team to work on a hoshin and start a collaborative process with colleagues or friends
by having them register to the application. To enable this, the following elements were created,
as shown visually on Figure 36:
• A web page called http://www.ehoshin.org, hosted on Wordpress, explains the hoshin
kanri process. It has a link to a presentation explaining how to register and a link to the
eHoshin application itself. In additional, it has a dedicated blog section, enabling people
less familiar with the process to ask questions or share good experiences with the tool.
• The application itself runs on heroku 38 (a cloud application platform owned by
Salesforce.com), on an instance called http://commonehoshin.herokuapp.com. It is
hosted on Amazon Web Services and is written in Python language using the Django
framework39.
• The source code is available on Github, under http://github.com/PierreMasai/eHoshin.
38 https://www.heroku.com 39 https://www.djangoproject.com
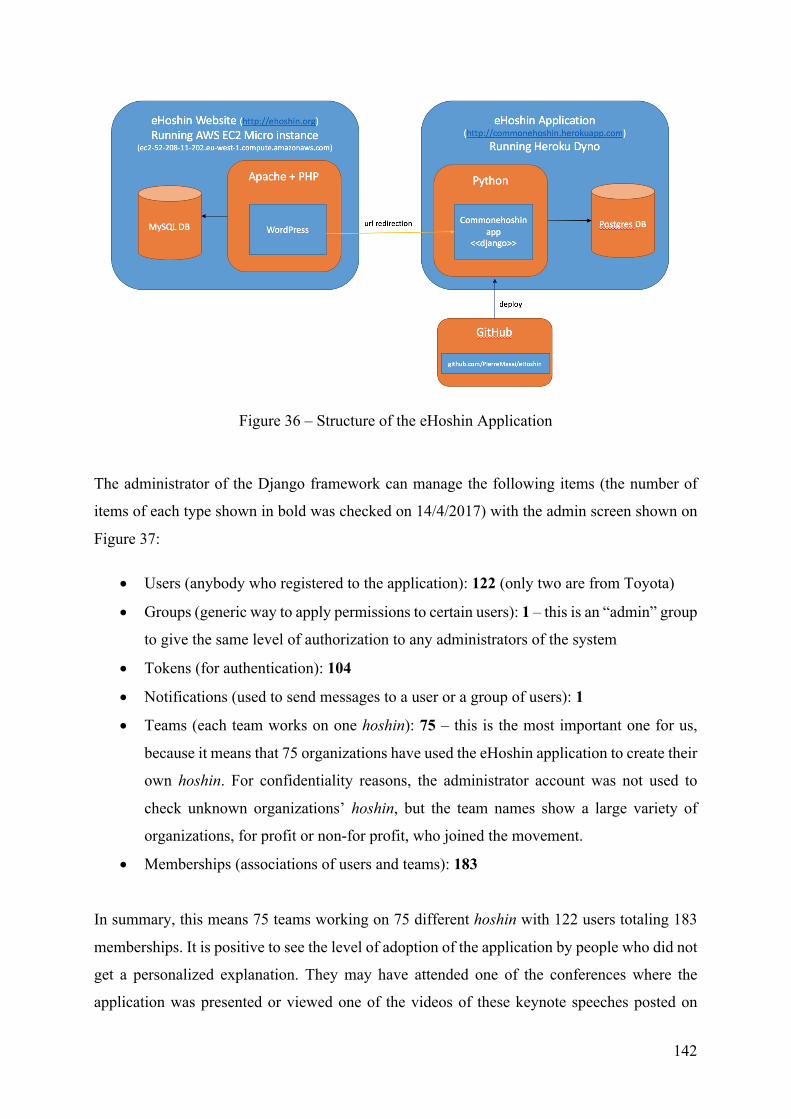
142
Figure 36 – Structure of the eHoshin Application
The administrator of the Django framework can manage the following items (the number of
items of each type shown in bold was checked on 14/4/2017) with the admin screen shown on
Figure 37:
• Users (anybody who registered to the application): 122 (only two are from Toyota)
• Groups (generic way to apply permissions to certain users): 1 – this is an “admin” group
to give the same level of authorization to any administrators of the system
• Tokens (for authentication): 104
• Notifications (used to send messages to a user or a group of users): 1
• Teams (each team works on one hoshin): 75 – this is the most important one for us,
because it means that 75 organizations have used the eHoshin application to create their
own hoshin. For confidentiality reasons, the administrator account was not used to
check unknown organizations’ hoshin, but the team names show a large variety of
organizations, for profit or non-for profit, who joined the movement.
• Memberships (associations of users and teams): 183
In summary, this means 75 teams working on 75 different hoshin with 122 users totaling 183
memberships. It is positive to see the level of adoption of the application by people who did not
get a personalized explanation. They may have attended one of the conferences where the
application was presented or viewed one of the videos of these keynote speeches posted on
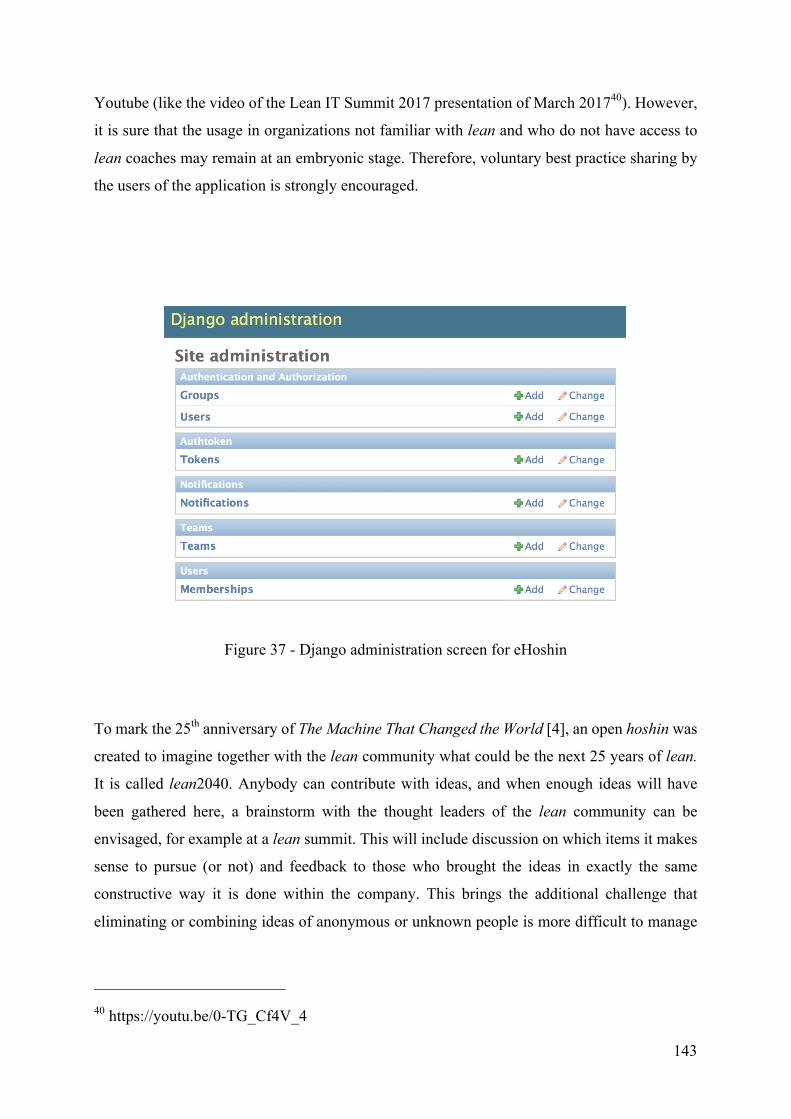
143
Youtube (like the video of the Lean IT Summit 2017 presentation of March 201740). However,
it is sure that the usage in organizations not familiar with lean and who do not have access to
lean coaches may remain at an embryonic stage. Therefore, voluntary best practice sharing by
the users of the application is strongly encouraged.
Figure 37 - Django administration screen for eHoshin
To mark the 25th anniversary of The Machine That Changed the World [4], an open hoshin was
created to imagine together with the lean community what could be the next 25 years of lean.
It is called lean2040. Anybody can contribute with ideas, and when enough ideas will have
been gathered here, a brainstorm with the thought leaders of the lean community can be
envisaged, for example at a lean summit. This will include discussion on which items it makes
sense to pursue (or not) and feedback to those who brought the ideas in exactly the same
constructive way it is done within the company. This brings the additional challenge that
eliminating or combining ideas of anonymous or unknown people is more difficult to manage
40 https://youtu.be/0-TG_Cf4V_4
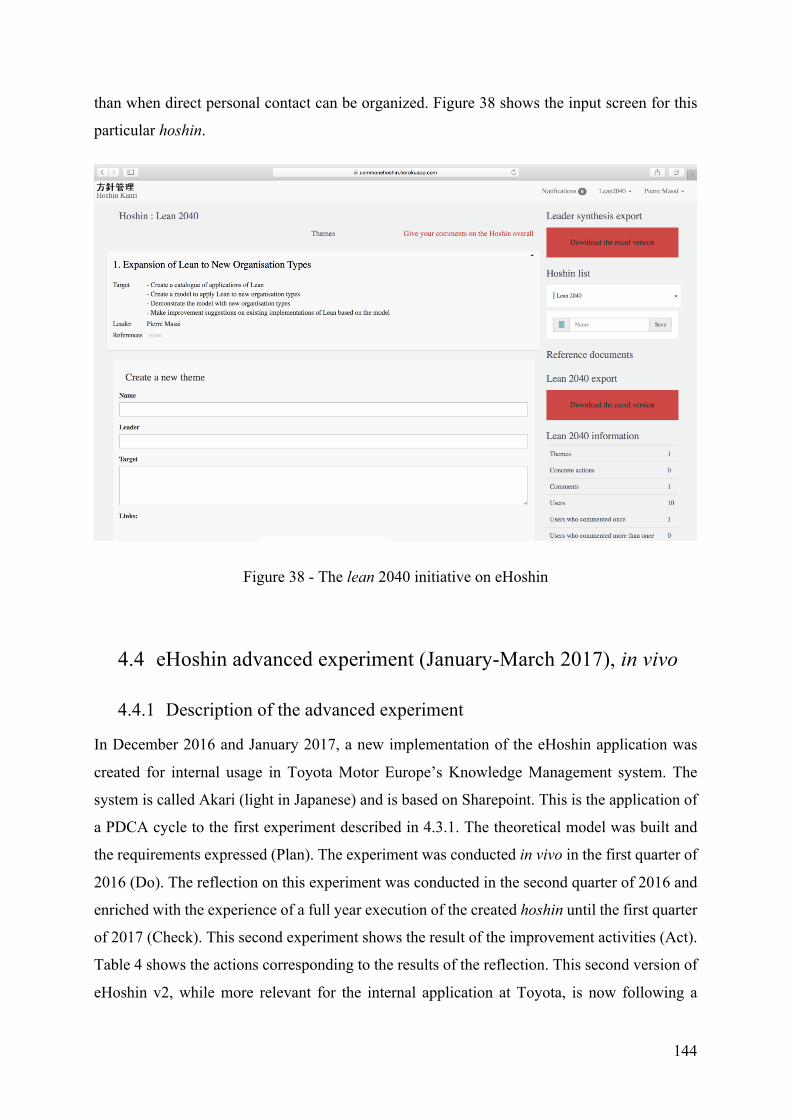
144
than when direct personal contact can be organized. Figure 38 shows the input screen for this
particular hoshin.
Figure 38 - The lean 2040 initiative on eHoshin
4.4 eHoshin advanced experiment (January-March 2017), in vivo
4.4.1 Description of the advanced experiment
In December 2016 and January 2017, a new implementation of the eHoshin application was
created for internal usage in Toyota Motor Europe’s Knowledge Management system. The
system is called Akari (light in Japanese) and is based on Sharepoint. This is the application of
a PDCA cycle to the first experiment described in 4.3.1. The theoretical model was built and
the requirements expressed (Plan). The experiment was conducted in vivo in the first quarter of
2016 (Do). The reflection on this experiment was conducted in the second quarter of 2016 and
enriched with the experience of a full year execution of the created hoshin until the first quarter
of 2017 (Check). This second experiment shows the result of the improvement activities (Act).
Table 4 shows the actions corresponding to the results of the reflection. This second version of
eHoshin v2, while more relevant for the internal application at Toyota, is now following a
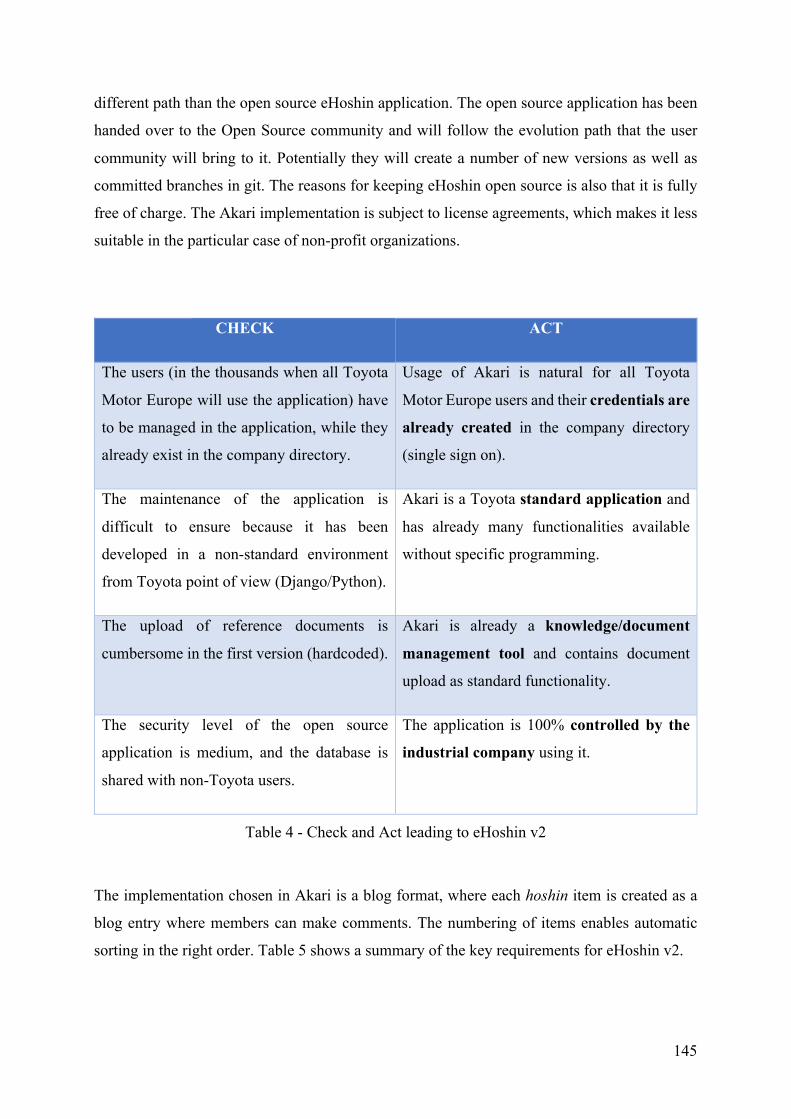
145
different path than the open source eHoshin application. The open source application has been
handed over to the Open Source community and will follow the evolution path that the user
community will bring to it. Potentially they will create a number of new versions as well as
committed branches in git. The reasons for keeping eHoshin open source is also that it is fully
free of charge. The Akari implementation is subject to license agreements, which makes it less
suitable in the particular case of non-profit organizations.
CHECK ACT
The users (in the thousands when all Toyota
Motor Europe will use the application) have
to be managed in the application, while they
already exist in the company directory.
Usage of Akari is natural for all Toyota
Motor Europe users and their credentials are
already created in the company directory
(single sign on).
The maintenance of the application is
difficult to ensure because it has been
developed in a non-standard environment
from Toyota point of view (Django/Python).
Akari is a Toyota standard application and
has already many functionalities available
without specific programming.
The upload of reference documents is
cumbersome in the first version (hardcoded).
Akari is already a knowledge/document
management tool and contains document
upload as standard functionality.
The security level of the open source
application is medium, and the database is
shared with non-Toyota users.
The application is 100% controlled by the
industrial company using it.
Table 4 - Check and Act leading to eHoshin v2
The implementation chosen in Akari is a blog format, where each hoshin item is created as a
blog entry where members can make comments. The numbering of items enables automatic
sorting in the right order. Table 5 shows a summary of the key requirements for eHoshin v2.
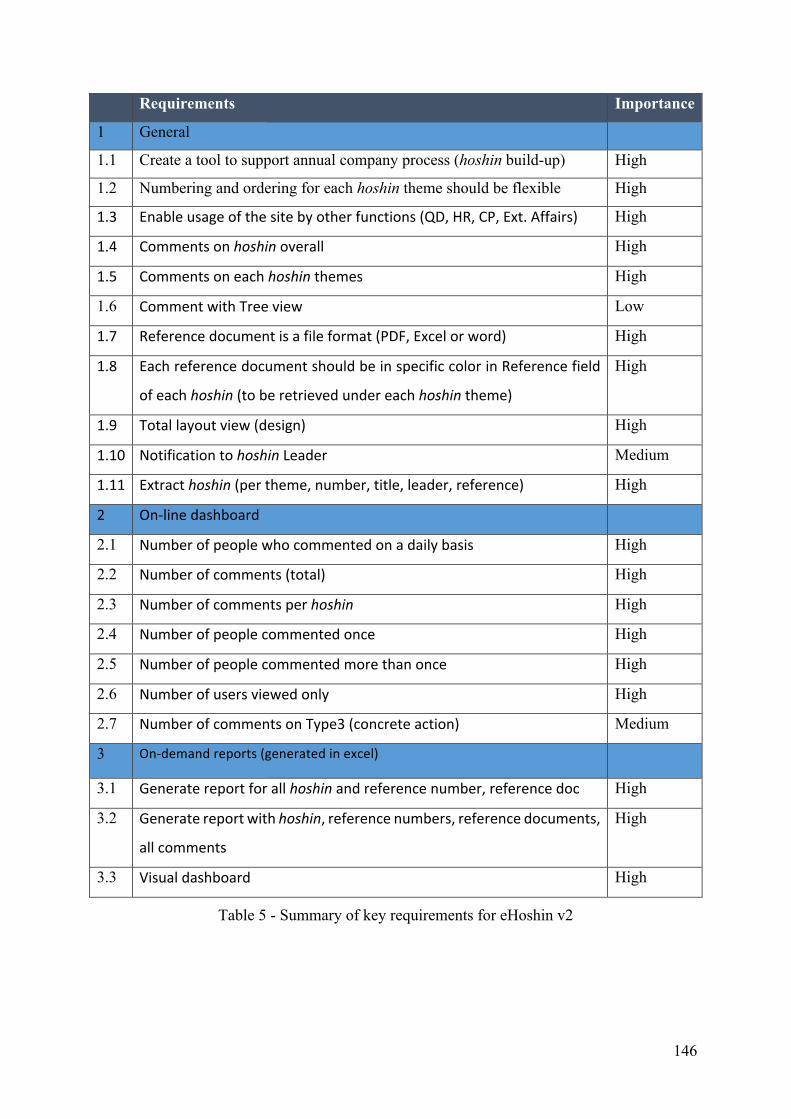
146
Requirements Importance
1 General
1.1 Create a tool to support annual company process (hoshin build-up) High
1.2 Numbering and ordering for each hoshin theme should be flexible High
1.3 Enableusageofthesitebyotherfunctions(QD,HR,CP,Ext.Affairs) High
1.4 Commentsonhoshinoverall High
1.5 Commentsoneachhoshinthemes High
1.6 CommentwithTreeview Low
1.7 Referencedocumentisafileformat(PDF,Excelorword) High
1.8 EachreferencedocumentshouldbeinspecificcolorinReferencefield
ofeachhoshin(toberetrievedundereachhoshintheme)
High
1.9 Totallayoutview(design) High
1.10 NotificationtohoshinLeader Medium
1.11 Extracthoshin(pertheme,number,title,leader,reference) High
2 On-linedashboard
2.1 Numberofpeoplewhocommentedonadailybasis High
2.2 Numberofcomments(total) High
2.3 Numberofcommentsperhoshin High
2.4 Numberofpeoplecommentedonce High
2.5 Numberofpeoplecommentedmorethanonce High
2.6 Numberofusersviewedonly High
2.7 NumberofcommentsonType3(concreteaction) Medium
3 On-demandreports(generatedinexcel)
3.1 Generatereportforallhoshinandreferencenumber,referencedoc High
3.2 Generatereportwithhoshin,referencenumbers,referencedocuments,
allcomments
High
3.3 Visualdashboard High
Table 5 - Summary of key requirements for eHoshin v2
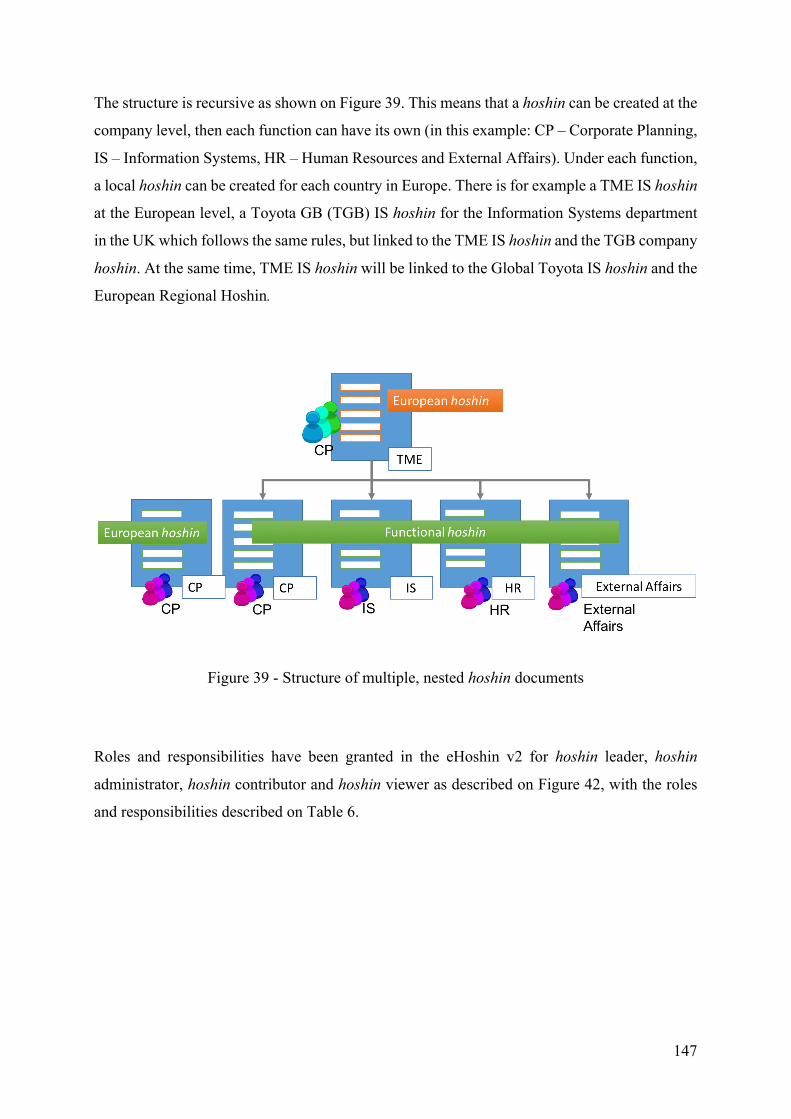
147
The structure is recursive as shown on Figure 39. This means that a hoshin can be created at the
company level, then each function can have its own (in this example: CP – Corporate Planning,
IS – Information Systems, HR – Human Resources and External Affairs). Under each function,
a local hoshin can be created for each country in Europe. There is for example a TME IS hoshin
at the European level, a Toyota GB (TGB) IS hoshin for the Information Systems department
in the UK which follows the same rules, but linked to the TME IS hoshin and the TGB company
hoshin. At the same time, TME IS hoshin will be linked to the Global Toyota IS hoshin and the
European Regional Hoshin.
Figure 39 - Structure of multiple, nested hoshin documents
Roles and responsibilities have been granted in the eHoshin v2 for hoshin leader, hoshin
administrator, hoshin contributor and hoshin viewer as described on Figure 42, with the roles
and responsibilities described on Table 6.
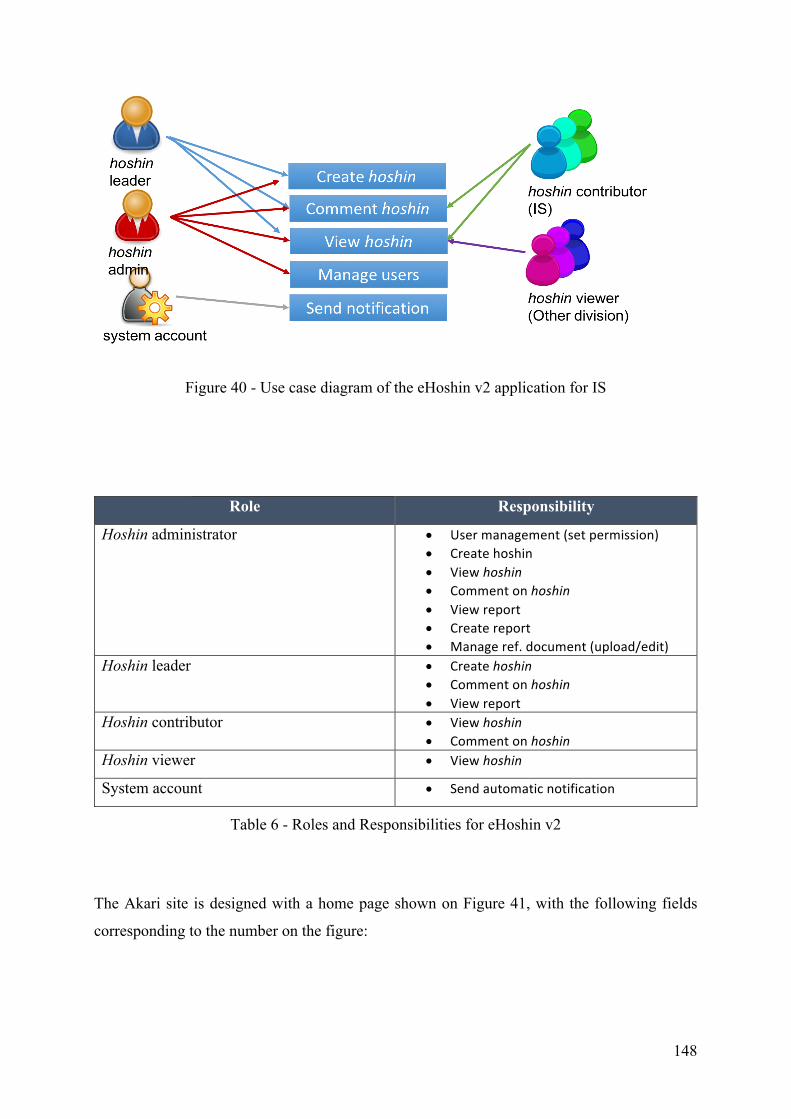
148
Figure 40 - Use case diagram of the eHoshin v2 application for IS
Role Responsibility
Hoshin administrator • Usermanagement(setpermission)• Createhoshin• Viewhoshin• Commentonhoshin• Viewreport• Createreport• Manageref.document(upload/edit)
Hoshin leader • Createhoshin• Commentonhoshin• Viewreport
Hoshin contributor • Viewhoshin• Commentonhoshin
Hoshin viewer • Viewhoshin
System account • Sendautomaticnotification
Table 6 - Roles and Responsibilities for eHoshin v2
The Akari site is designed with a home page shown on Figure 41, with the following fields
corresponding to the number on the figure:
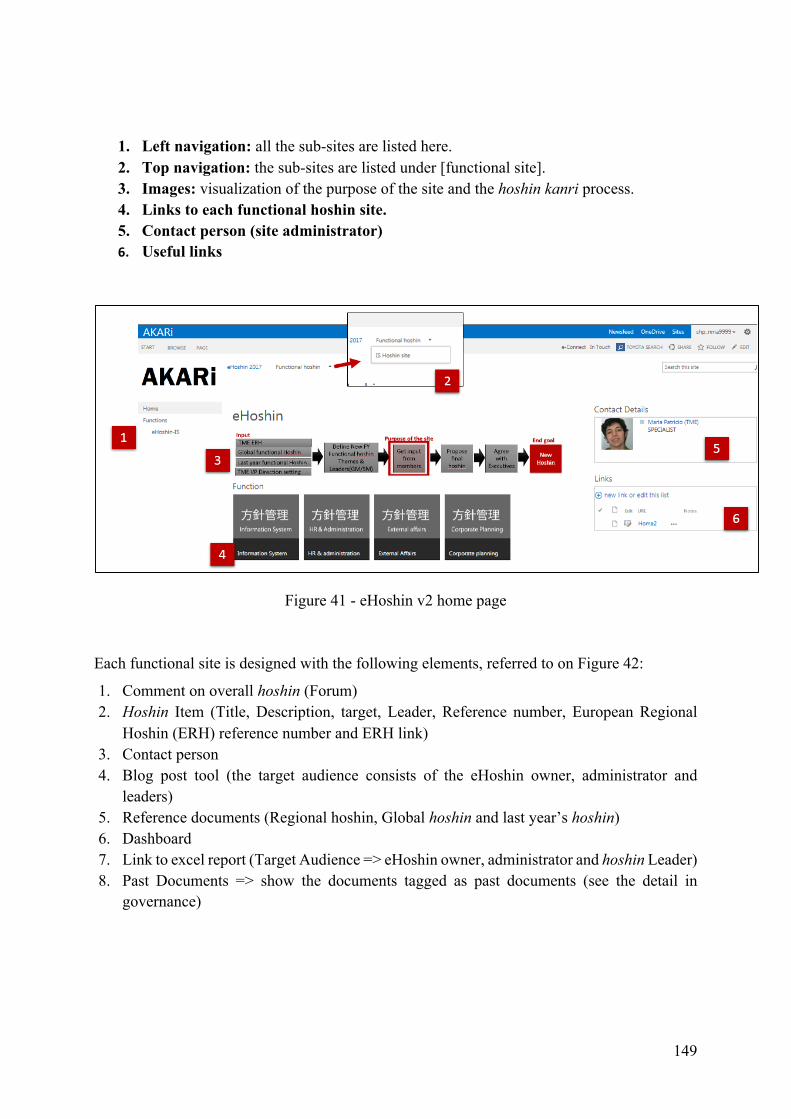
149
1. Left navigation: all the sub-sites are listed here. 2. Top navigation: the sub-sites are listed under [functional site]. 3. Images: visualization of the purpose of the site and the hoshin kanri process. 4. Links to each functional hoshin site. 5. Contact person (site administrator) 6. Useful links
Figure 41 - eHoshin v2 home page
Each functional site is designed with the following elements, referred to on Figure 42:
1. Comment on overall hoshin (Forum) 2. Hoshin Item (Title, Description, target, Leader, Reference number, European Regional
Hoshin (ERH) reference number and ERH link) 3. Contact person 4. Blog post tool (the target audience consists of the eHoshin owner, administrator and
leaders) 5. Reference documents (Regional hoshin, Global hoshin and last year’s hoshin) 6. Dashboard 7. Link to excel report (Target Audience => eHoshin owner, administrator and hoshin Leader) 8. Past Documents => show the documents tagged as past documents (see the detail in
governance)
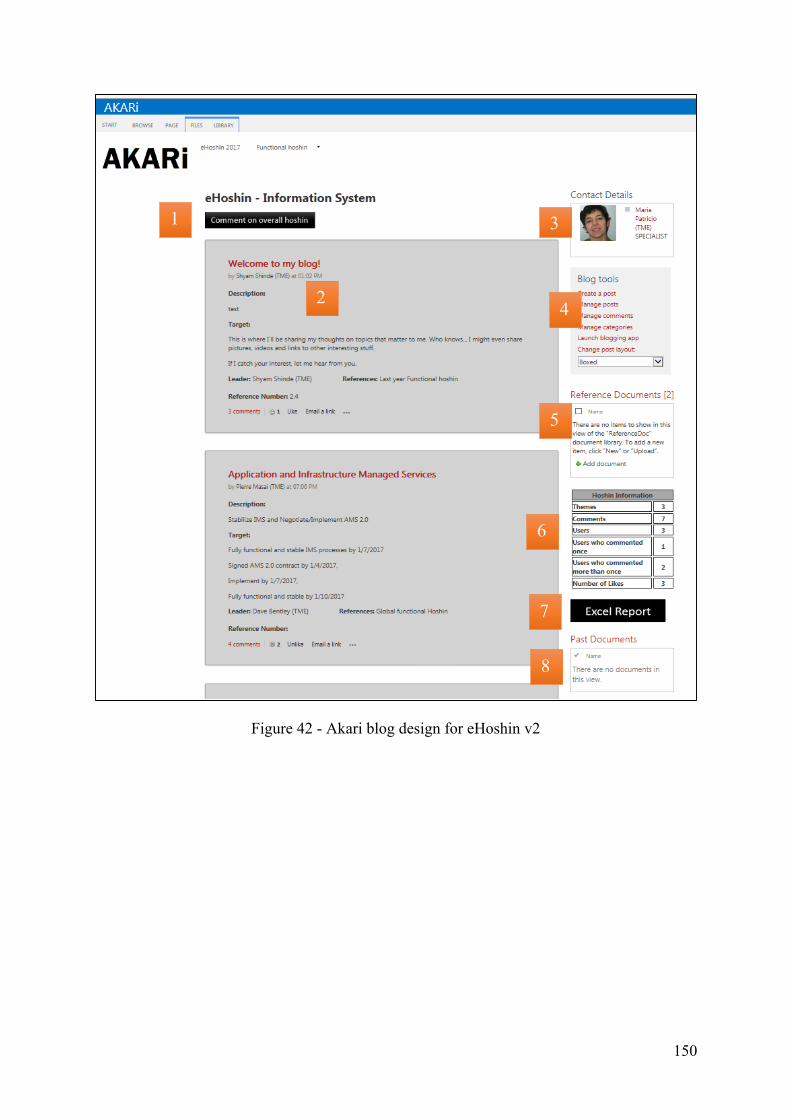
150
Figure 42 - Akari blog design for eHoshin v2
1
2
3
4
5
6
7
8
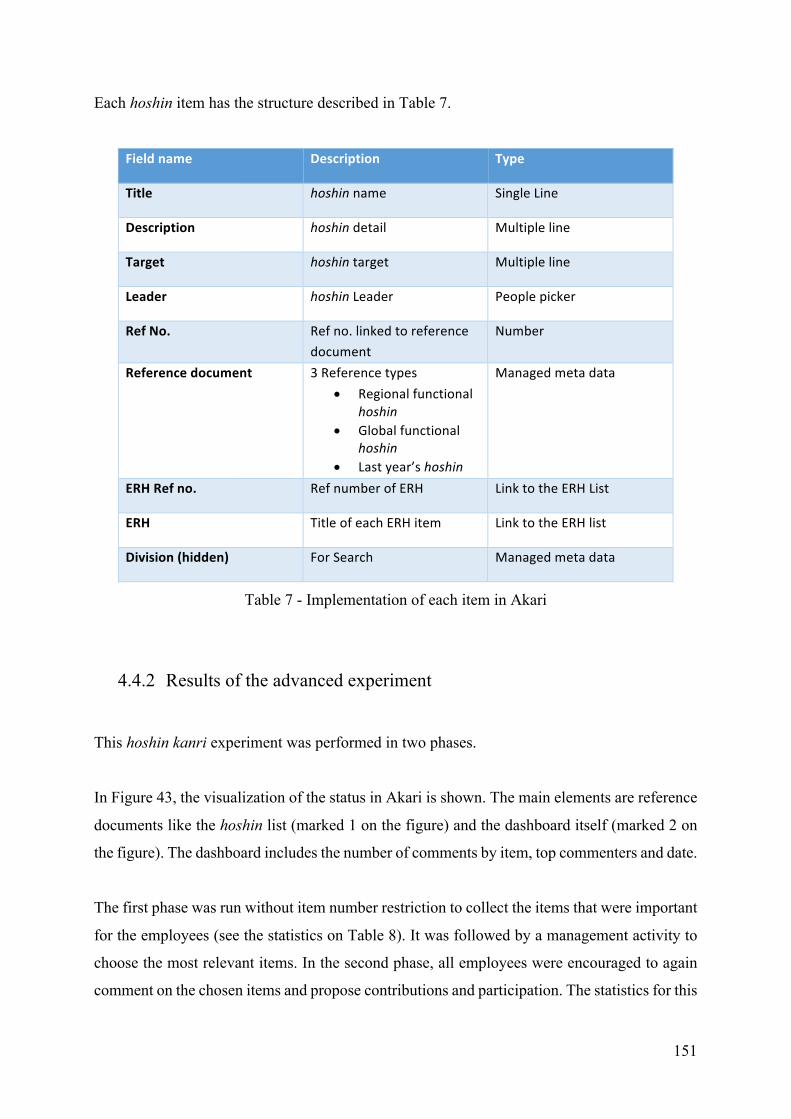
151
Each hoshin item has the structure described in Table 7.
Fieldname Description Type
Title hoshinname SingleLine
Description hoshindetail Multipleline
Target hoshintarget Multipleline
Leader hoshinLeader Peoplepicker
RefNo. Refno.linkedtoreferencedocument
Number
Referencedocument 3Referencetypes• Regionalfunctional
hoshin• Globalfunctional
hoshin• Lastyear’shoshin
Managedmetadata
ERHRefno. RefnumberofERH LinktotheERHList
ERH TitleofeachERHitem LinktotheERHlist
Division(hidden) ForSearch Managedmetadata
Table 7 - Implementation of each item in Akari
4.4.2 Results of the advanced experiment
This hoshin kanri experiment was performed in two phases.
In Figure 43, the visualization of the status in Akari is shown. The main elements are reference
documents like the hoshin list (marked 1 on the figure) and the dashboard itself (marked 2 on
the figure). The dashboard includes the number of comments by item, top commenters and date.
The first phase was run without item number restriction to collect the items that were important
for the employees (see the statistics on Table 8). It was followed by a management activity to
choose the most relevant items. In the second phase, all employees were encouraged to again
comment on the chosen items and propose contributions and participation. The statistics for this
152
second phase are shown on Table 9. Reacting to hoshin items is not mandatory for employees.
It is normal that relatively few employees comment in the second phase, were the hoshin list is
already quite stable. However, the number of employees commenting during the first phase was
less than during the previous experiment, where more iterations and more reminders were sent.
This will be a follow-up point during the next cycle. To define the right balance between a pure
pull system (where all employees are motivated to comment by themselves) and management
encouraging employees to participate in the creation of the next period’s objectives.
It was observed that the single management check in the middle of the process was easier to
organize. This enabled more constructive feedback to the participants than the frequent
adaptation of items during the hoshin kanri process in the previous year. Indeed, if employees
propose items, these should never be removed or merged to others without feedback to those
who proposed them in the first place. Lack of feedback will reduce participation in the next
hoshin cycle. Good feedback, by contrast, coaches the employees to improve the quality and
relevance of the items proposed. For example by explaining the difference between regional
hoshin items and items that should not be at the hoshin level (because they belong to day to day
operational activities of one department). It was observed that better feedback could be given
when the number of formal decision points was reduced. It was also more realistic from an
organizational perspective to have three main management meetings. First to kick off the
activity, second to reduce the number of items to around ten and third to close the hoshin kanri
activity formally. The constant availability of the application for comments between those
management meetings enabled smaller feedback cycles to emerge. The “like” functionality,
popularized by social media, is also a good way to identify the items that are important for many
members of the organization, but this is definitely not the only way. As can be expected, items
about employee motivation are more popular than items about cost reduction activities.
However, this does not mean that cost reduction activities should never be on the hoshin list.
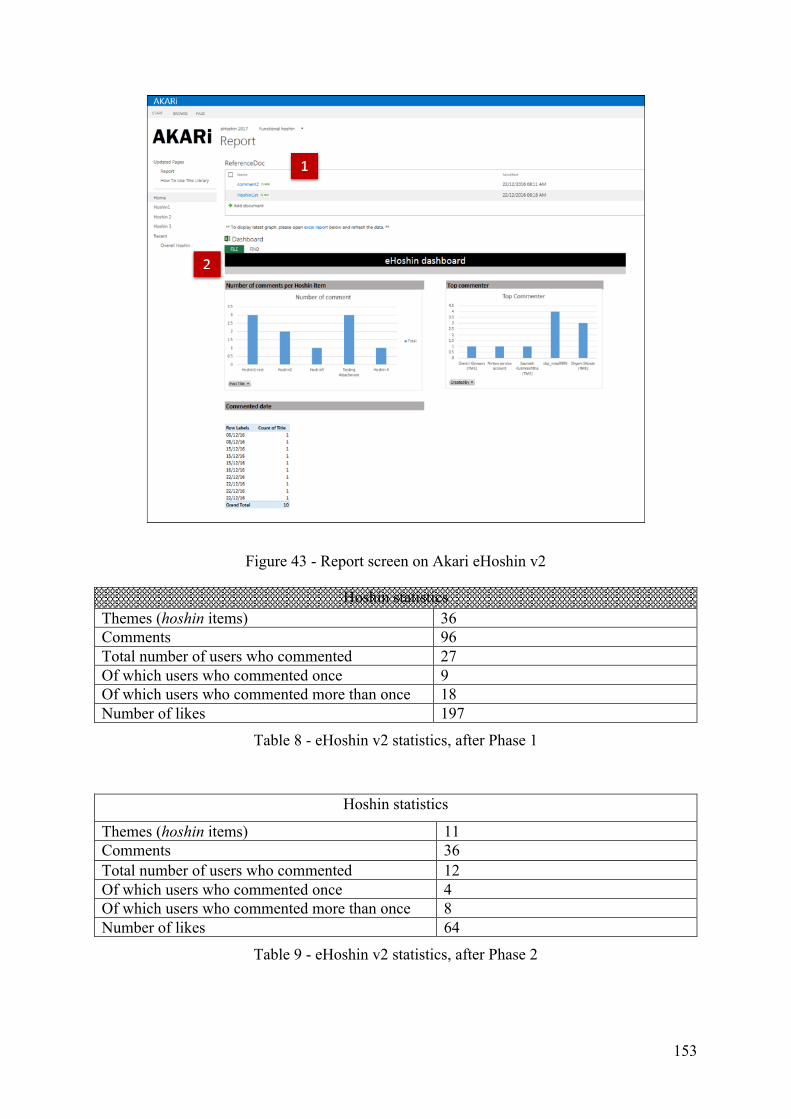
153
Figure 43 - Report screen on Akari eHoshin v2
Hoshin statistics Themes (hoshin items) 36 Comments 96 Total number of users who commented 27 Of which users who commented once 9 Of which users who commented more than once 18 Number of likes 197
Table 8 - eHoshin v2 statistics, after Phase 1
Hoshin statistics
Themes (hoshin items) 11 Comments 36 Total number of users who commented 12 Of which users who commented once 4 Of which users who commented more than once 8 Number of likes 64
Table 9 - eHoshin v2 statistics, after Phase 2
154
4.5 Updated model after two years of experimentation, in silico
The first version of the hoshin simulator in silico presented in section 4.2.3 produced important
insights into how organizational maturity and member capability could lead to the quality of
hoshin documents. While this was a theoretical simulation, it enabled reflection on the
organization itself and consider the correct choice of management-led or member-led hoshin
creation.
The open source eHoshin and Akari eHoshin applications ensured that the barriers to
participation in the hoshin process were reduced or eliminated. This ensured the entire
organization was engaged in the process. It brought the relevant information to one place to
show who was involved, when and how. The system made all inputs obvious and also showed
feedback to demonstrate the Making People (hitozukuri) element of the hoshin process. These
experiments highlighted that the following lean concepts are relevant to the hoshin process:
• Customer First and Just in Time – the customer is the management, representing the
end customers, the deadline is clear and the hoshin related efforts add value to the
hoshin plan.
• Making People (hitozukuri) – each employee’s involvement in the hoshin kanri process
is used as an opportunity to develop them and their management. Even a misjudged
idea or misunderstood objective can be used as a learning process for the member. It is
also a reflection for management to strengthen clarity of the message the next time.
• Visualization (mieruka) – By bringing the entire process into the open, all inputs are
obvious, linkages are evident and timing is recorded.
• Continuous Improvement (kaizen and standardization) – As described earlier, the
standard process embodied by the eHoshin system enables kaizen, year after year, and
when required within the hoshin cycle itself.
However, if the hoshin simulation process and results cannot be integrated into our continuous
improvement (kaizen) process, useful information could be missed.
In the first cycle, the hoshin simulation process stood separate from the hoshin process, each of
them with useful data but not linked. If the simulation results can be used to predict hoshin
155
quality, the pace of the hoshin kaizen process can be accelerated. This is currently a year by
year PDCA cycle. To summarize the operation of the Hoshin Simulator, it is a Python program
which takes the input of an organization with a given maturity (based on observations), a level
of participation and a hoshin consensus building (nemawashi) schedule. The program logic uses
those three variables to produce a set a series of hoshin quality results over the hoshin period.
To gain deeper insight from the simulation, it was needed to collect further objective data about
the hoshin and make the simulation software more flexible. In order to quantify the quality of
the real life hoshin results, the Hoshin Quality Scorecard v1 (HQSV1) shown on Table 10 was
created.
This results in a score from 0 to 30 (six quality aspects, each attracting a score of 0 to 5), which
can then be expressed as a percentage compared to the 0-100 quality score of the hoshin
simulator. In this way, the hoshin items can be scored in the eHoshin application as a result of
the consensus building (nemawashi) process.
When the process is repeated, the aspects can be adjusted as required, as long as each change
is associated with a new version to preserve integrity over the years. For example, if the decision
is made to rescore Aspect 6 (Scope), it can be adjusted and the new scoring method can be
called version 2 (HQSV2). Then, previous years can be rescored and the results can be tracked
over several years as the model gets refined.
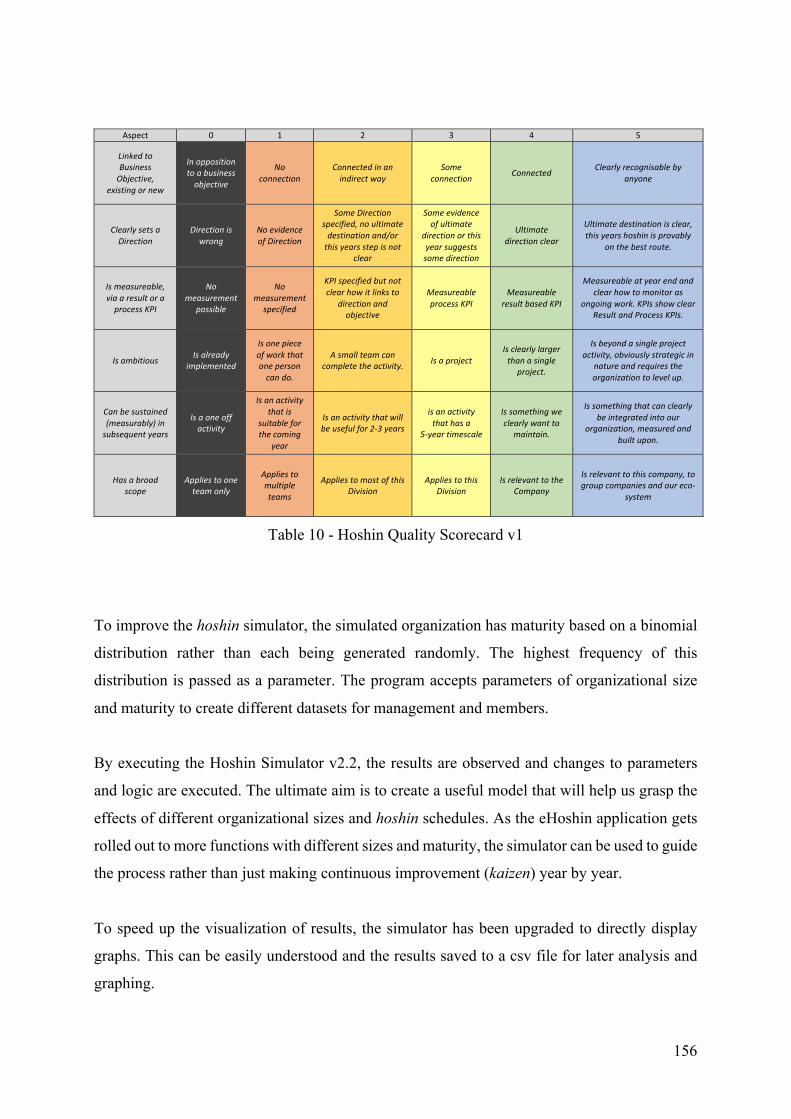
156
Aspect 0 1 2 3 4 5
LinkedtoBusinessObjective,
existingornew
Inoppositiontoabusinessobjective
Noconnection
Connectedinanindirectway
Someconnection Connected Clearlyrecognisableby
anyone
ClearlysetsaDirection
Directioniswrong
NoevidenceofDirection
SomeDirectionspecified,noultimatedestinationand/orthisyearsstepisnot
clear
Someevidenceofultimate
directionorthisyearsuggestssomedirection
Ultimatedirectionclear
Ultimatedestinationisclear,thisyearshoshinisprovably
onthebestroute.
Ismeasureable,viaaresultoraprocessKPI
Nomeasurement
possible
Nomeasurement
specified
KPIspecifiedbutnotclearhowitlinksto
directionandobjective
MeasureableprocessKPI
MeasureableresultbasedKPI
Measureableatyearendandclearhowtomonitoras
ongoingwork.KPIsshowclearResultandProcessKPIs.
Isambitious Isalreadyimplemented
Isonepieceofworkthatonepersoncando.
Asmallteamcancompletetheactivity. Isaproject
Isclearlylargerthanasingle
project.
Isbeyondasingleprojectactivity,obviouslystrategicin
natureandrequirestheorganizationtolevelup.
Canbesustained(measurably)insubsequentyears
Isaoneoffactivity
Isanactivitythatis
suitableforthecoming
year
Isanactivitythatwillbeusefulfor2-3years
isanactivitythathasa
5-yeartimescale
Issomethingweclearlywantto
maintain.
Issomethingthatcanclearlybeintegratedintoour
organization,measuredandbuiltupon.
Hasabroadscope
Appliestooneteamonly
Appliestomultipleteams
AppliestomostofthisDivision
AppliestothisDivision
IsrelevanttotheCompany
Isrelevanttothiscompany,togroupcompaniesandoureco-
system
Table 10 - Hoshin Quality Scorecard v1
To improve the hoshin simulator, the simulated organization has maturity based on a binomial
distribution rather than each being generated randomly. The highest frequency of this
distribution is passed as a parameter. The program accepts parameters of organizational size
and maturity to create different datasets for management and members.
By executing the Hoshin Simulator v2.2, the results are observed and changes to parameters
and logic are executed. The ultimate aim is to create a useful model that will help us grasp the
effects of different organizational sizes and hoshin schedules. As the eHoshin application gets
rolled out to more functions with different sizes and maturity, the simulator can be used to guide
the process rather than just making continuous improvement (kaizen) year by year.
To speed up the visualization of results, the simulator has been upgraded to directly display
graphs. This can be easily understood and the results saved to a csv file for later analysis and
graphing.
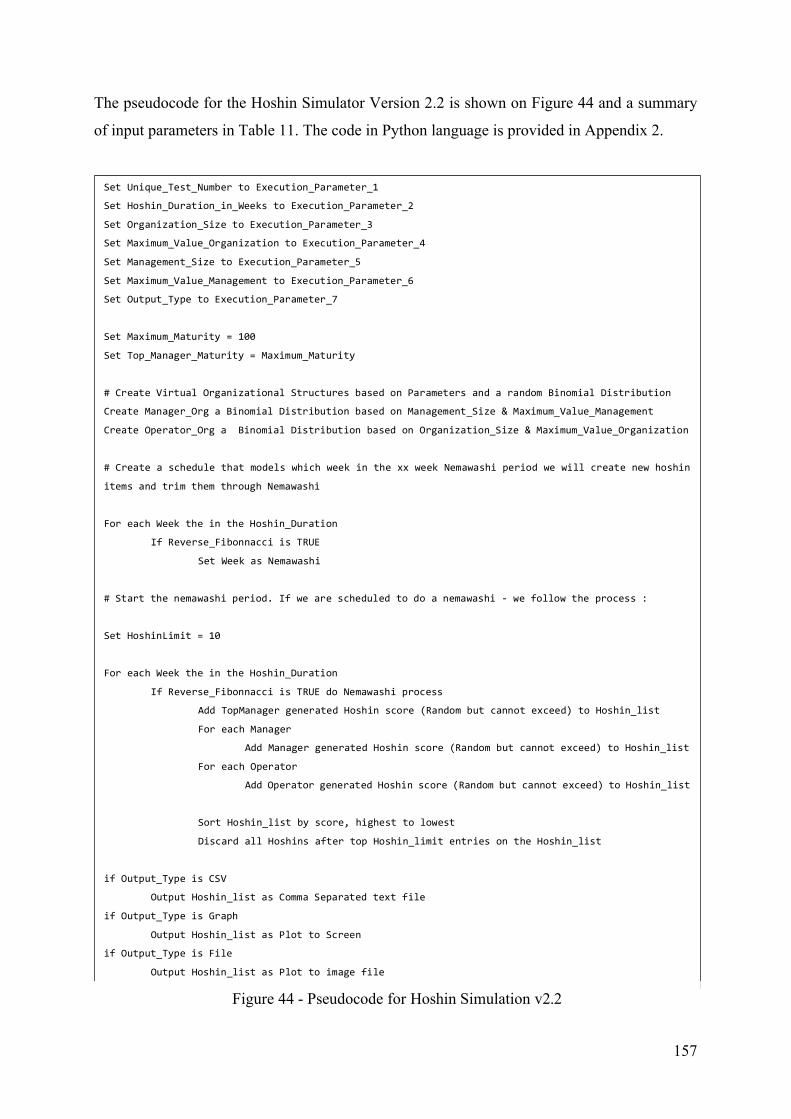
157
The pseudocode for the Hoshin Simulator Version 2.2 is shown on Figure 44 and a summary
of input parameters in Table 11. The code in Python language is provided in Appendix 2.
Set Unique_Test_Number to Execution_Parameter_1
Set Hoshin_Duration_in_Weeks to Execution_Parameter_2
Set Organization_Size to Execution_Parameter_3
Set Maximum_Value_Organization to Execution_Parameter_4
Set Management_Size to Execution_Parameter_5
Set Maximum_Value_Management to Execution_Parameter_6
Set Output_Type to Execution_Parameter_7
Set Maximum_Maturity = 100
Set Top_Manager_Maturity = Maximum_Maturity
# Create Virtual Organizational Structures based on Parameters and a random Binomial Distribution
Create Manager_Org a Binomial Distribution based on Management_Size & Maximum_Value_Management
Create Operator_Org a Binomial Distribution based on Organization_Size & Maximum_Value_Organization
# Create a schedule that models which week in the xx week Nemawashi period we will create new hoshin
items and trim them through Nemawashi
For each Week the in the Hoshin_Duration
If Reverse_Fibonnacci is TRUE
Set Week as Nemawashi
# Start the nemawashi period. If we are scheduled to do a nemawashi - we follow the process :
Set HoshinLimit = 10
For each Week the in the Hoshin_Duration
If Reverse_Fibonnacci is TRUE do Nemawashi process
Add TopManager generated Hoshin score (Random but cannot exceed) to Hoshin_list
For each Manager
Add Manager generated Hoshin score (Random but cannot exceed) to Hoshin_list
For each Operator
Add Operator generated Hoshin score (Random but cannot exceed) to Hoshin_list
Sort Hoshin_list by score, highest to lowest
Discard all Hoshins after top Hoshin_limit entries on the Hoshin_list
if Output_Type is CSV
Output Hoshin_list as Comma Separated text file
if Output_Type is Graph
Output Hoshin_list as Plot to Screen
if Output_Type is File
Output Hoshin_list as Plot to image file
Figure 44 - Pseudocode for Hoshin Simulation v2.2
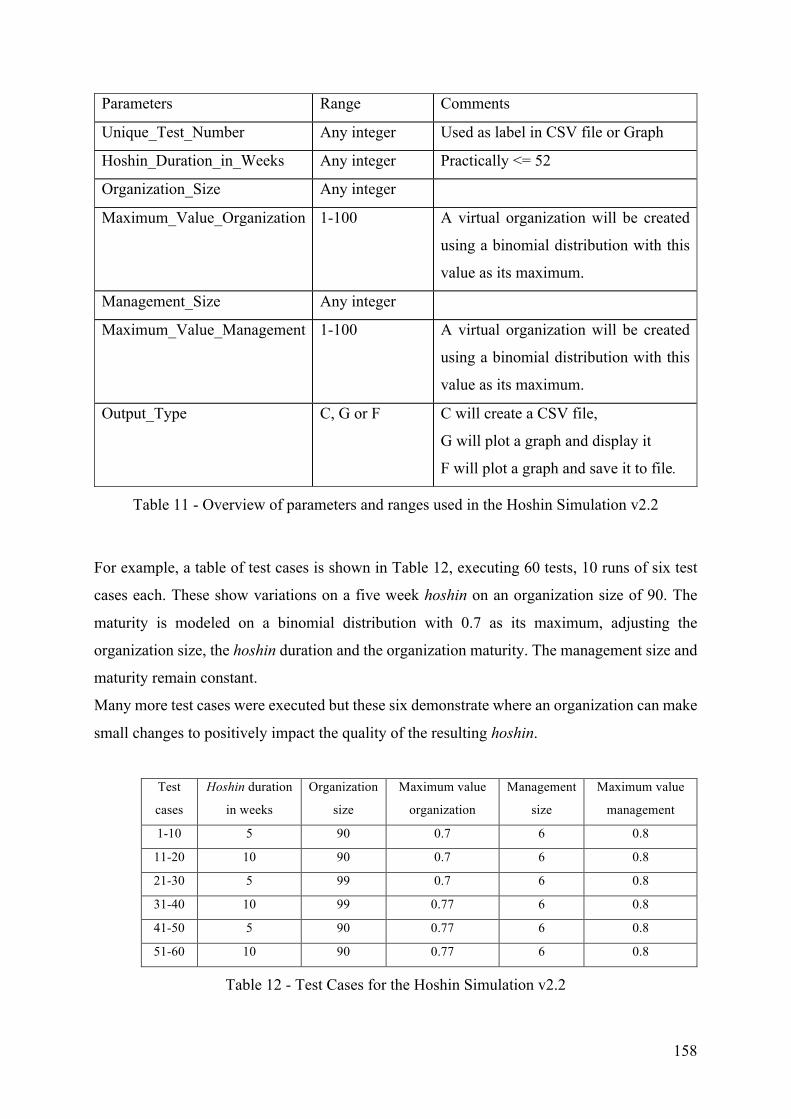
158
Parameters Range Comments
Unique_Test_Number Any integer Used as label in CSV file or Graph
Hoshin_Duration_in_Weeks Any integer Practically <= 52
Organization_Size Any integer
Maximum_Value_Organization 1-100 A virtual organization will be created
using a binomial distribution with this
value as its maximum.
Management_Size Any integer
Maximum_Value_Management 1-100 A virtual organization will be created
using a binomial distribution with this
value as its maximum.
Output_Type C, G or F C will create a CSV file,
G will plot a graph and display it
F will plot a graph and save it to file.
Table 11 - Overview of parameters and ranges used in the Hoshin Simulation v2.2
For example, a table of test cases is shown in Table 12, executing 60 tests, 10 runs of six test
cases each. These show variations on a five week hoshin on an organization size of 90. The
maturity is modeled on a binomial distribution with 0.7 as its maximum, adjusting the
organization size, the hoshin duration and the organization maturity. The management size and
maturity remain constant.
Many more test cases were executed but these six demonstrate where an organization can make
small changes to positively impact the quality of the resulting hoshin.
Test
cases
Hoshin duration
in weeks
Organization
size
Maximum value
organization
Management
size
Maximum value
management
1-10 5 90 0.7 6 0.8
11-20 10 90 0.7 6 0.8
21-30 5 99 0.7 6 0.8
31-40 10 99 0.77 6 0.8
41-50 5 90 0.77 6 0.8
51-60 10 90 0.77 6 0.8
Table 12 - Test Cases for the Hoshin Simulation v2.2
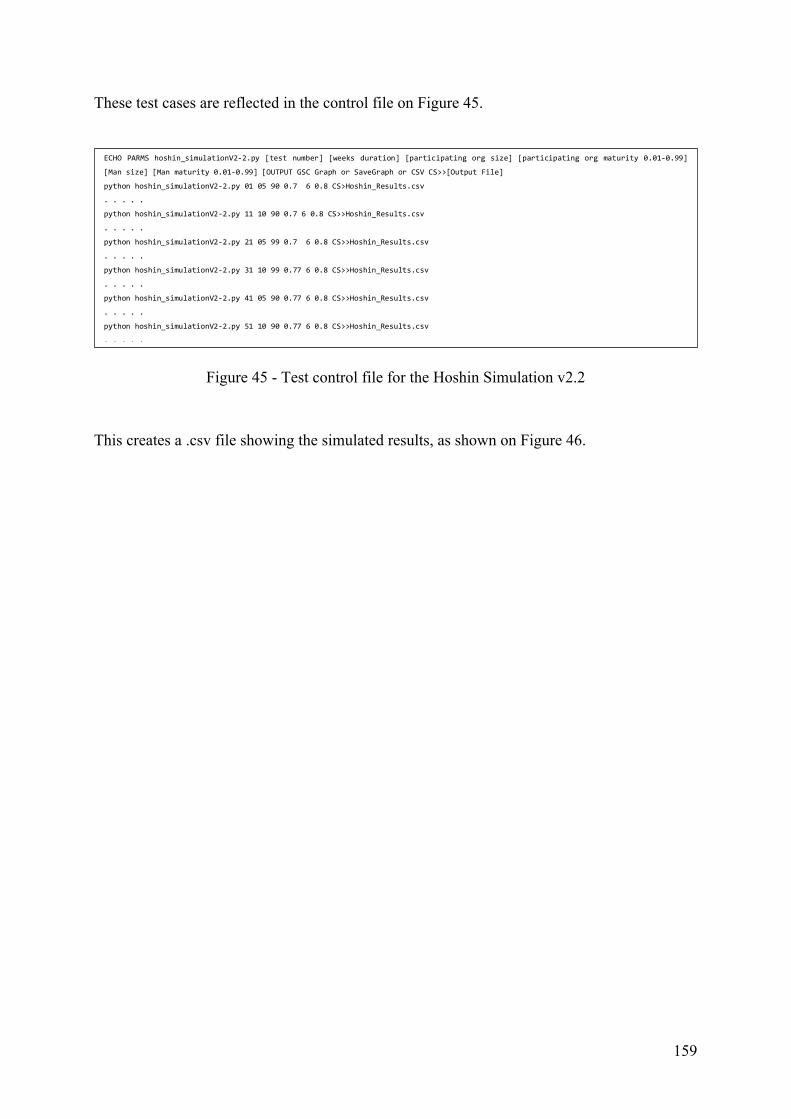
159
These test cases are reflected in the control file on Figure 45.
Figure 45 - Test control file for the Hoshin Simulation v2.2
This creates a .csv file showing the simulated results, as shown on Figure 46.
ECHO PARMS hoshin_simulationV2-2.py [test number] [weeks duration] [participating org size] [participating org maturity 0.01-0.99]
[Man size] [Man maturity 0.01-0.99] [OUTPUT GSC Graph or SaveGraph or CSV CS>>[Output File]
python hoshin_simulationV2-2.py 01 05 90 0.7 6 0.8 CS>Hoshin_Results.csv
. . . . .
python hoshin_simulationV2-2.py 11 10 90 0.7 6 0.8 CS>>Hoshin_Results.csv
. . . . .
python hoshin_simulationV2-2.py 21 05 99 0.7 6 0.8 CS>>Hoshin_Results.csv
. . . . .
python hoshin_simulationV2-2.py 31 10 99 0.77 6 0.8 CS>>Hoshin_Results.csv
. . . . .
python hoshin_simulationV2-2.py 41 05 90 0.77 6 0.8 CS>>Hoshin_Results.csv
. . . . .
python hoshin_simulationV2-2.py 51 10 90 0.77 6 0.8 CS>>Hoshin_Results.csv
. . . . .
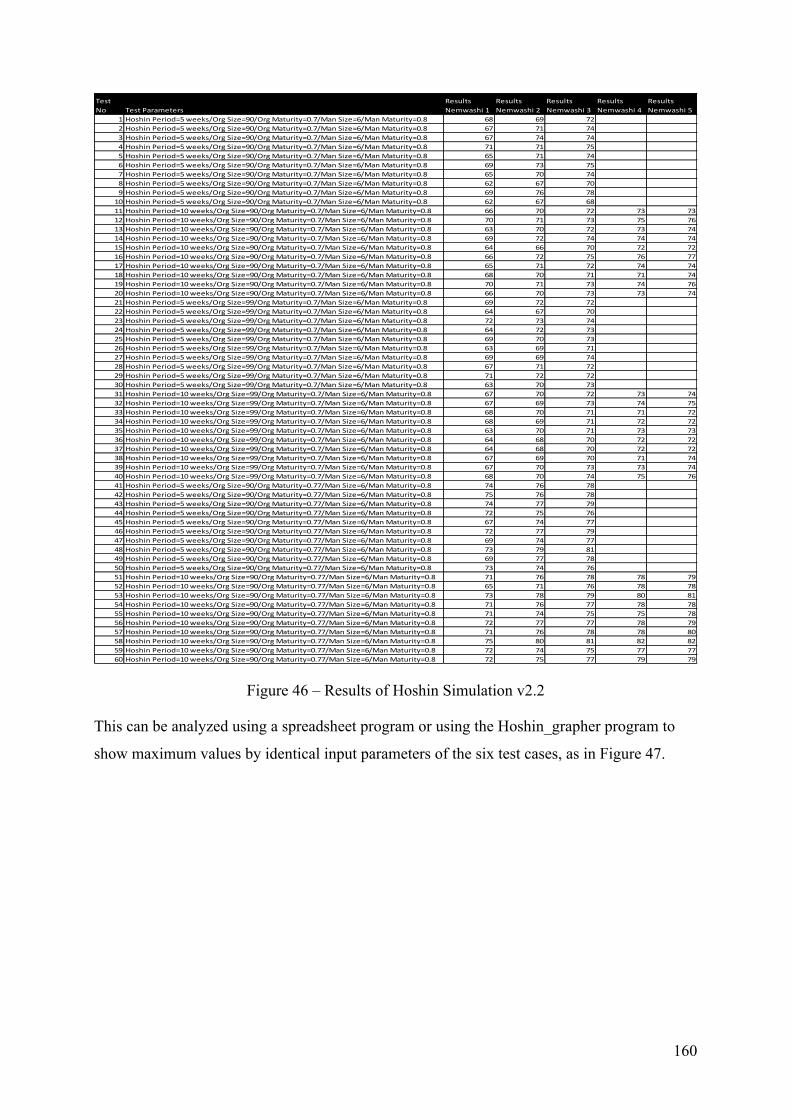
160
Figure 46 – Results of Hoshin Simulation v2.2
This can be analyzed using a spreadsheet program or using the Hoshin_grapher program to
show maximum values by identical input parameters of the six test cases, as in Figure 47.
TestNo TestParameters
ResultsNemwashi1
ResultsNemwashi2
ResultsNemwashi3
ResultsNemwashi4
ResultsNemwashi5
1 HoshinPeriod=5weeks/OrgSize=90/OrgMaturity=0.7/ManSize=6/ManMaturity=0.8 68 69 722 HoshinPeriod=5weeks/OrgSize=90/OrgMaturity=0.7/ManSize=6/ManMaturity=0.8 67 71 743 HoshinPeriod=5weeks/OrgSize=90/OrgMaturity=0.7/ManSize=6/ManMaturity=0.8 67 74 744 HoshinPeriod=5weeks/OrgSize=90/OrgMaturity=0.7/ManSize=6/ManMaturity=0.8 71 71 755 HoshinPeriod=5weeks/OrgSize=90/OrgMaturity=0.7/ManSize=6/ManMaturity=0.8 65 71 746 HoshinPeriod=5weeks/OrgSize=90/OrgMaturity=0.7/ManSize=6/ManMaturity=0.8 69 73 757 HoshinPeriod=5weeks/OrgSize=90/OrgMaturity=0.7/ManSize=6/ManMaturity=0.8 65 70 748 HoshinPeriod=5weeks/OrgSize=90/OrgMaturity=0.7/ManSize=6/ManMaturity=0.8 62 67 709 HoshinPeriod=5weeks/OrgSize=90/OrgMaturity=0.7/ManSize=6/ManMaturity=0.8 69 76 7810 HoshinPeriod=5weeks/OrgSize=90/OrgMaturity=0.7/ManSize=6/ManMaturity=0.8 62 67 6811 HoshinPeriod=10weeks/OrgSize=90/OrgMaturity=0.7/ManSize=6/ManMaturity=0.8 66 70 72 73 7312 HoshinPeriod=10weeks/OrgSize=90/OrgMaturity=0.7/ManSize=6/ManMaturity=0.8 70 71 73 75 7613 HoshinPeriod=10weeks/OrgSize=90/OrgMaturity=0.7/ManSize=6/ManMaturity=0.8 63 70 72 73 7414 HoshinPeriod=10weeks/OrgSize=90/OrgMaturity=0.7/ManSize=6/ManMaturity=0.8 69 72 74 74 7415 HoshinPeriod=10weeks/OrgSize=90/OrgMaturity=0.7/ManSize=6/ManMaturity=0.8 64 66 70 72 7216 HoshinPeriod=10weeks/OrgSize=90/OrgMaturity=0.7/ManSize=6/ManMaturity=0.8 66 72 75 76 7717 HoshinPeriod=10weeks/OrgSize=90/OrgMaturity=0.7/ManSize=6/ManMaturity=0.8 65 71 72 74 7418 HoshinPeriod=10weeks/OrgSize=90/OrgMaturity=0.7/ManSize=6/ManMaturity=0.8 68 70 71 71 7419 HoshinPeriod=10weeks/OrgSize=90/OrgMaturity=0.7/ManSize=6/ManMaturity=0.8 70 71 73 74 7620 HoshinPeriod=10weeks/OrgSize=90/OrgMaturity=0.7/ManSize=6/ManMaturity=0.8 66 70 73 73 7421 HoshinPeriod=5weeks/OrgSize=99/OrgMaturity=0.7/ManSize=6/ManMaturity=0.8 69 72 7222 HoshinPeriod=5weeks/OrgSize=99/OrgMaturity=0.7/ManSize=6/ManMaturity=0.8 64 67 7023 HoshinPeriod=5weeks/OrgSize=99/OrgMaturity=0.7/ManSize=6/ManMaturity=0.8 72 73 7424 HoshinPeriod=5weeks/OrgSize=99/OrgMaturity=0.7/ManSize=6/ManMaturity=0.8 64 72 7325 HoshinPeriod=5weeks/OrgSize=99/OrgMaturity=0.7/ManSize=6/ManMaturity=0.8 69 70 7326 HoshinPeriod=5weeks/OrgSize=99/OrgMaturity=0.7/ManSize=6/ManMaturity=0.8 63 69 7127 HoshinPeriod=5weeks/OrgSize=99/OrgMaturity=0.7/ManSize=6/ManMaturity=0.8 69 69 7428 HoshinPeriod=5weeks/OrgSize=99/OrgMaturity=0.7/ManSize=6/ManMaturity=0.8 67 71 7229 HoshinPeriod=5weeks/OrgSize=99/OrgMaturity=0.7/ManSize=6/ManMaturity=0.8 71 72 7230 HoshinPeriod=5weeks/OrgSize=99/OrgMaturity=0.7/ManSize=6/ManMaturity=0.8 63 70 7331 HoshinPeriod=10weeks/OrgSize=99/OrgMaturity=0.7/ManSize=6/ManMaturity=0.8 67 70 72 73 7432 HoshinPeriod=10weeks/OrgSize=99/OrgMaturity=0.7/ManSize=6/ManMaturity=0.8 67 69 73 74 7533 HoshinPeriod=10weeks/OrgSize=99/OrgMaturity=0.7/ManSize=6/ManMaturity=0.8 68 70 71 71 7234 HoshinPeriod=10weeks/OrgSize=99/OrgMaturity=0.7/ManSize=6/ManMaturity=0.8 68 69 71 72 7235 HoshinPeriod=10weeks/OrgSize=99/OrgMaturity=0.7/ManSize=6/ManMaturity=0.8 63 70 71 73 7336 HoshinPeriod=10weeks/OrgSize=99/OrgMaturity=0.7/ManSize=6/ManMaturity=0.8 64 68 70 72 7237 HoshinPeriod=10weeks/OrgSize=99/OrgMaturity=0.7/ManSize=6/ManMaturity=0.8 64 68 70 72 7238 HoshinPeriod=10weeks/OrgSize=99/OrgMaturity=0.7/ManSize=6/ManMaturity=0.8 67 69 70 71 7439 HoshinPeriod=10weeks/OrgSize=99/OrgMaturity=0.7/ManSize=6/ManMaturity=0.8 67 70 73 73 7440 HoshinPeriod=10weeks/OrgSize=99/OrgMaturity=0.7/ManSize=6/ManMaturity=0.8 68 70 74 75 7641 HoshinPeriod=5weeks/OrgSize=90/OrgMaturity=0.77/ManSize=6/ManMaturity=0.8 74 76 7842 HoshinPeriod=5weeks/OrgSize=90/OrgMaturity=0.77/ManSize=6/ManMaturity=0.8 75 76 7843 HoshinPeriod=5weeks/OrgSize=90/OrgMaturity=0.77/ManSize=6/ManMaturity=0.8 74 77 7944 HoshinPeriod=5weeks/OrgSize=90/OrgMaturity=0.77/ManSize=6/ManMaturity=0.8 72 75 7645 HoshinPeriod=5weeks/OrgSize=90/OrgMaturity=0.77/ManSize=6/ManMaturity=0.8 67 74 7746 HoshinPeriod=5weeks/OrgSize=90/OrgMaturity=0.77/ManSize=6/ManMaturity=0.8 72 77 7947 HoshinPeriod=5weeks/OrgSize=90/OrgMaturity=0.77/ManSize=6/ManMaturity=0.8 69 74 7748 HoshinPeriod=5weeks/OrgSize=90/OrgMaturity=0.77/ManSize=6/ManMaturity=0.8 73 79 8149 HoshinPeriod=5weeks/OrgSize=90/OrgMaturity=0.77/ManSize=6/ManMaturity=0.8 69 77 7850 HoshinPeriod=5weeks/OrgSize=90/OrgMaturity=0.77/ManSize=6/ManMaturity=0.8 73 74 7651 HoshinPeriod=10weeks/OrgSize=90/OrgMaturity=0.77/ManSize=6/ManMaturity=0.8 71 76 78 78 7952 HoshinPeriod=10weeks/OrgSize=90/OrgMaturity=0.77/ManSize=6/ManMaturity=0.8 65 71 76 78 7853 HoshinPeriod=10weeks/OrgSize=90/OrgMaturity=0.77/ManSize=6/ManMaturity=0.8 73 78 79 80 8154 HoshinPeriod=10weeks/OrgSize=90/OrgMaturity=0.77/ManSize=6/ManMaturity=0.8 71 76 77 78 7855 HoshinPeriod=10weeks/OrgSize=90/OrgMaturity=0.77/ManSize=6/ManMaturity=0.8 71 74 75 75 7856 HoshinPeriod=10weeks/OrgSize=90/OrgMaturity=0.77/ManSize=6/ManMaturity=0.8 72 77 77 78 7957 HoshinPeriod=10weeks/OrgSize=90/OrgMaturity=0.77/ManSize=6/ManMaturity=0.8 71 76 78 78 8058 HoshinPeriod=10weeks/OrgSize=90/OrgMaturity=0.77/ManSize=6/ManMaturity=0.8 75 80 81 82 8259 HoshinPeriod=10weeks/OrgSize=90/OrgMaturity=0.77/ManSize=6/ManMaturity=0.8 72 74 75 77 7760 HoshinPeriod=10weeks/OrgSize=90/OrgMaturity=0.77/ManSize=6/ManMaturity=0.8 72 75 77 79 79
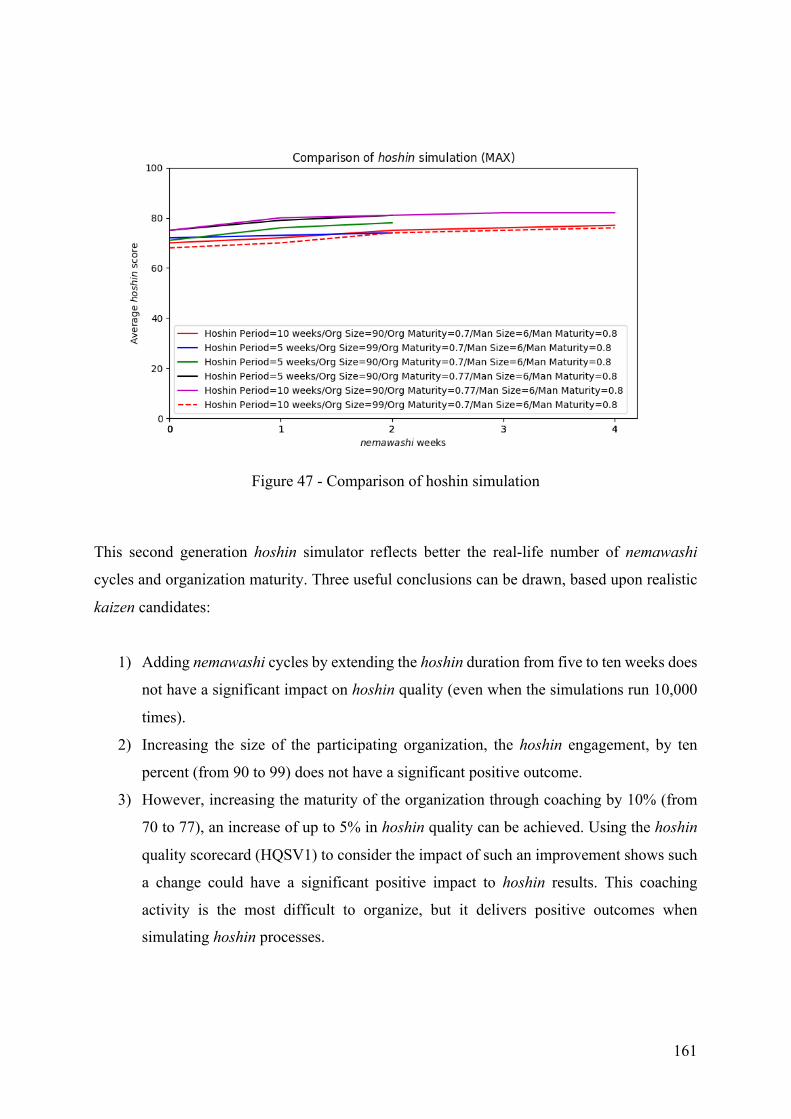
161
Figure 47 - Comparison of hoshin simulation
This second generation hoshin simulator reflects better the real-life number of nemawashi
cycles and organization maturity. Three useful conclusions can be drawn, based upon realistic
kaizen candidates:
1) Adding nemawashi cycles by extending the hoshin duration from five to ten weeks does
not have a significant impact on hoshin quality (even when the simulations run 10,000
times).
2) Increasing the size of the participating organization, the hoshin engagement, by ten
percent (from 90 to 99) does not have a significant positive outcome.
3) However, increasing the maturity of the organization through coaching by 10% (from
70 to 77), an increase of up to 5% in hoshin quality can be achieved. Using the hoshin
quality scorecard (HQSV1) to consider the impact of such an improvement shows such
a change could have a significant positive impact to hoshin results. This coaching
activity is the most difficult to organize, but it delivers positive outcomes when
simulating hoshin processes.
162
It is not at all surprising that the two iterations of simulations delivered two areas to focus on to
improve hoshin quality. This highlights the importance of development of the organization, not
just management. There are no shortcuts to improving quality, as previously explained in
lean concept 3, Making People (hitozukuri).
163
Conclusion The objectives of the new science of complex systems are to find models that correspond to
observed data or emergent phenomena, resulting from the multi-scale interaction of a large
number of autonomous entities.
A model of lean has been proposed, the Lean Organization Framework and structured as an
ontology. This enables to describe the concepts in a structured way to enable further
contributions. This work can now be transferred to the community of lean researchers and
practitioners for enhancement. This is because it is impossible to imagine that the author of this
thesis alone would have reached an exhaustive list of the concepts and their relations. In the
same way that the ontologies in medicine and biology have now been developed by the work
of thousands of scientists and practitioners to a very complete and usable corpus, the ontology
of lean can be further enhanced from the basis presented here.
The way to handle culture has been explained with a number of examples and pseudocode.
A typical process of lean, hoshin kanri, has been modeled, and successfully rolled out to the
public domain with an open source application, eHoshin. This prototype has been enhanced and
further developed in the industrial context of Toyota Motor Europe, in different functions and
legal entities. The theoretical model, in silico, has been applied in two rounds of in vivo
experiments and the experience retrofitted into the theoretical model, in silico. The first model
has shown the merit of involving the employees in the process. Higher performance can be
achieved by performing the process with motivated and competent employees, ultimately
reducing the need for top down direction. It has formed the basis for the development of the
first eHoshin application which demonstrated the predictions of the model. The reflection on
the first experiment led to an improved model in the industrial environment. This in turn helped
refine the model and create a maturity model for hoshin within organizations.
By explaining the properties of the lean organization and comparing them in theory in Chapter
3 and in practice in Chapter 4 with our models, this work shows that the lean organization
displays the properties of a Complex System. The connectivity and distributed control to the
agents, emergent and immergent properties as shown with the hoshin kanri process, co-
evolution as demonstrated by the in vivo experiments and the hoshin maturity model. The
system is far from equilibrium, because each hoshin cycle brings a new challenge to the system
164
coming from the evolving external world and internal drive for continuous improvement. The
state of paradox as shown by the constant dichotomy between Just in Time and Stop in Time
(jidoka).
Research roadmap: lean and complexity:
A parallel was shown between the lean organization and the immune system at different scales.
This gives an avenue for further research:
• Can lean give ideas to biologists on how to develop their field? These ideas must be
further developed in the collaboration with biologists outlined in section 3.7. However,
given the very long and successful path of evolution, it can be assumed that the next
question is more likely to be fertile, as the new field of biomimicry has shown in recent
years (see for example [136]).
• Can the immune system give ideas to lean practitioners to improve their work?
As the Complex Systems science further evolves:
• Can a more rigorous and commonly accepted definition of Complex Systems emerge?
One that will enable formal demonstration that lean is a Complex System and apply
more properties of Complex Systems to lean?
The success of lean is based on the success of the organizations that applied it, starting with
Toyota, but going further:
• Is it possible to demonstrate more scientifically that “lean is good”? Not only by the
consistent results that lean organizations achieve, but by linking those results more
closely to the lean concepts themselves?
Technical roadmap: modeling lean
A model of the hoshin kanri process has been developed, experiments and refined at Toyota.
The logical next steps are to multiply the models and to support the usage outside Toyota:
• More processes of the lean organization can be modeled. Why not simulate an
organization practicing continuous improvement (kaizen) and systematic problem
solving versus other organizations that prefer status quo or do not resolve problems
165
structurally? This would definitely contribute to make the case of lean to a larger
audience.
• The usage of eHoshin by a growing array of companies will help establish a set of best
practices for implementation. It has been obvious that organizations who did not have
training or previous exposure to the hoshin kanri process struggled more to use the
application in a meaningful way. Is it at all possible to achieve its proper usage when
no lean coach is present in the company and if so, how?
• The eHoshin application in its open source version can be further enhanced by the open
source community. For example, by building in the cultural pre-processor indicated in
section 4.1.5. This would accelerate its adoption by various cultures and countries.
Looking forward to see the achievements of the next 25 years of lean, a subject which has
its own entry on the eHoshin open source application.

166
167
Bibliography
[1] E. Ries, The Lean Startup: How Today's Entrepreneurs Use Continuous Innovation to
Create Radically Successful Businesses, Crown Business, 2011.
[2] P. Masai, P. Parrend and C. Zanni-Merk, "Towards a formal model of the lean
enterprise," Procedia Computer Science, vol. 60, pp. 226-235, 2015.
[3] P. Masai and C. Zanni-Merk, "Formalization of a Framework for Cultural Translation in
Global Collaboration. The Case of the Lean Organization," Procedia Computer Science,
vol. 96, pp. 375-384, 2016.
[4] J. P. Womack, D. T. Jones and D. Roos, The Machine That Changed the World: The
Story of Lean Production, The MIT international motor vehicle program, Harper Collins,
1991.
[5] J. F. Krafcik, "Triumph of the lean production system," vol. 30, no. 1, pp. 41-52, 1988.
[6] T. Ōno, Toyota Production System: Beyond Large-Scale Production, Taylor & Francis,
1988.
[7] T. H. Netland and D. J. Powell, The Routledge Companion to Lean Management, Taylor
& Francis, 2016, p. 501.
[8] P. Delort, "Information contre Institution: Workflow, Lean Management et gouvernance
de la firme," Paris, 1997.
[9] J. K. Liker, Toyota Way: 14 Management Principles from the World's Greatest
Manufacturer, McGraw-Hill, 2003.
[10] M. Rother, Toyota Kata: Managing People for Improvement, Adaptiveness and Superior
Results: Managing People for Improvement, Adaptiveness and Superior Results,
McGraw-Hill Education, 2009.
[11] E. Osono, N. Shimizu and H. Takeuchi, Extreme Toyota: Radical Contradictions That
Drive Success at the World's Best Manufacturer, Wiley, 2008.
[12] A. Byrne and J. P. Womack, The Lean Turnaround: How Business Leaders Use Lean to
Create Value and Transform their Company, B. Collection, Ed., McGraw-Hill Education,
2012.
[13] J. Morgan and J. K. Liker, The Toyota Product Development System: Integrating People,
Process and Technology, 2006.
168
[14] M. Graban, Lean Healthcare: Improving Quality, Patient Safety, and Employee
Engagement, CRC Press, 2011.
[15] S. C. Bell, Lean Enterprise Systems: Using IT for Continuous Improvement, New York:
John Wiley & Sons, 2005, p. 459.
[16] S. C. Bell, Run Grow Transform: Integrating Business and Lean IT, CRC Press, 2012.
[17] S. C. Bell and M. A. Orzen, Lean IT: Enabling and Sustaining your Lean Transformation,
CRC Press, 2016, p. 372.
[18] K. Miller, "Lean Government's promise of going 'Lean'," 21 05 2009. [Online].
Available: http://www.governing.com/blogs/public-great/lean-government.html.
[Accessed 25 07 2017].
[19] U. E. P. Agency, "Lean Government Starter Kit (Version 3.0)," 19 01 2017. [Online].
Available: http://www.epa.gov/lean/government. [Accessed 26 07 2017].
[20] B. Emiliani, "Improving business school courses by applying lean principles and
practices," Quality Assurance in Education, vol. 12, no. 4, pp. 175-187, 1 12 2004.
[21] B. Emiliani, "Using kaizen to improve graduate business school degree programs,"
Quality Assurance in Education, vol. 13, no. 1, pp. 37-52, 1 3 2005.
[22] J. P. Womack and J. D. T.:, Lean Thinking: Banish Waste and Create Wealth in your
Corporation, New York: Simon and Schuster, 1996.
[23] J. P. Womack and D. T. Jones, Lean Solutions: How Companies and Customers Can
Create Value and Wealth Together, New York: Simon and Schuster, 2005.
[24] J. P. Womack, Gemba Walks, Cambridge, Massachussets: Lean Enterprise Institute,
2013, p. 311.
[25] N. Modig and P. Ahlström, This is Lean, J. Morrison, Ed., Stockholm: Rheologica
Publishing, 2012.
[26] T. Fujimoto, The evolution of a manufacturing system at Toyota, Oxford: Oxford
University Press, 1999.
[27] S. Hino, Inside the Mind of Toyota, Taylor & Francis Inc, 2005.
[28] H. Takeuchi and I. Nonaka, "The new new product development game; stop running the
relay race and take up rugby," Harvard Business Review, vol. 64 (1), pp. 137-146,
January, February 1985.
169
[29] J. Sutherland, Scrum: doing double the work in half the time, London: Random House
Business Books, 2014, p. 248.
[30] T. Narusawa, Kaizen Express: Fundamentals for Your Lean Journey, LEAN
ENTERPRISE INST, 2009.
[31] F. Ballé and M. Ballé, The Gold Mine, a novel of lean turnaround, Cambridge,
Massachusetts: Lean Enterprise Institute, 2009.
[32] M. Ballé and F. Ballé, The Lean Manager, a novel of lean transformation, Cambridge,
Massachusetts: Lean Enterprise Institute, 2009.
[33] M. Ballé and F. Ballé, Lead with Respect, a novel of lean practice, Cambridge,
Massachusetts: Lean Enterprise Institute, 2014.
[34] M. Ballé, D. T. Jones, J. Chaize and O. Fiume, The Lean Strategy: using lean to create
competitive advantage, unleash innovation, and deliver sustainable growth, New York:
McGraw-Hill, 2017.
[35] M. Graban, "Blog on Lean healthcare," [Online]. Available: http://www.leanblog.org.
[Accessed 25 07 2017].
[36] P. E. Plsek, Accelerating Health Care Transformation with Lean and Innovation: The
Virginia Mason Experience, Boca Raton, Florida: CRC Press, 2013.
[37] D. Bahri, Follow the Learner - The role of a leader in creating a lean culture, Cambridge,
Massachusetts: The Lean Enterprise Institute, 2009.
[38] D. Bahri, The Lean Dentist, Cambridge, Massachusetts: The Lean Enterprise Academy,
2016.
[39] 富. (Fujitsu), 実践!!IT屋の「トヨタ生産方式」(TPS for IT), 名古屋 (Nagoya): 風媒
社, 2005.
[40] T. Sekimura and T. Maruyama, "Development of Enterprise Business Application
Software by Introducing Toyota Production System," Fujitsu Sci.Tech., vol. 42, pp. 407-
413, July 2006.
[41] J. Humble, J. Molesky and B. O'Reilly, Lean Enterprise: How High Performance
Organizations Innovate at Scale, Sebastopol, California: O'Reilly Media, inc., 2015.
[42] J. Goffhelf and J. Seiden, Lean UX: applying lean principles to improve user experience,
Sebastopol, CA: O'Reilly Media inc., 2013, p. 130.
170
[43] M.-P. Ignace, C. Ignace, R. Medina and A. Contal, La pratique du lean management dans
l'IT: Agilité et amélioration continue, Paris: Pearson Education France, 2012, p. 239.
[44] D. Markovitz, A Factory of One, New York: CRC Press, 2011.
[45] N. Khanna, "Lean Ontology for the Supply Chain area," 2007.
[46] M. Kärkkäinen and T. Ala-Risku, "Facilitating the integration of SME’s to supply
networks with lean IT solutions," in Proceedings of eChallenges, 2003.
[47] H. S.Spear, Decoding the DNA of the Toyota Production System, Harvard Business
Review, 1999.
[48] S. J. Spear, "Learning to Lead at Toyota," Harvard Business Review, May 2004.
[49] J. Oehmen and e. alii, The Guide to Lean Enablers for Managing Engineering Programs,
J. M. C. o. P. o. L. i. P. Management, Ed., Josef Oehmen, MIT, Lead Advancement
Initiative, 2012.
[50] D. Nightingale, "LESAT Tool," 2001. [Online]. Available:
https://dspace.mit.edu/bitstream/handle/1721.1/81910/LESAT_Overview_2001.pdf?seq
uence=1. [Accessed 26 12 2016].
[51] K. Bozdogan, "Evolution of the Lean Enterprise System," Encyclopedia of aerospace
engineering, 2010.
[52] O. Al-Baik and J. Miller, "Waste identification and elimination in information
technology organizations," Empirical Software Engineering, vol. 19, no. 6, pp. 2019-
2061, 2014.
[53] I. Serban, "Developing Business Information Systems in a Lean IT Environment,"
University of Leuven, 2015.
[54] J. Sutherland, A. Viktorov, J. Blount and N. Puntikov, "Distributed scrum: Agile project
management with outsourced development teams. In System Sciences," in 40th Annual
Hawai International Conference on System Sciences, 2007.
[55] P. Parrend, P. Masai, C. Zanni-Merk and P. Collet, "Swarm Projects, Beyond the
Metaphor," in International Conference on Swarm Intelligence Based Optimization,
Mulhouse, 2014.
[56] V. G. Stray, N. B. Moe and A. Aurum, "Investigating Daily Team Meetings in Agile
Software Projects," in 38th Euromicro Conference on Software Engineering and
Advanced Applications, 2012.

171
[57] E. P. A. US, "Lean in Government Starter Kit (Version 3.0)," 19 01 2017. [Online].
Available: https://www.epa.gov/lean/lean-government-starter-kit-version-30. [Accessed
26 07 2017].
[58] B. Emiliani, Lean Teaching: A Guide to Becoming a Better Teacher, Center for Lean
Business Management, LLC, 2015, p. 148.
[59] T. Gruber, "Towards Principles for the Design of Ontologies Used for Knowledge
Sharing".
[60] C. Zanni-Merk, KREM: A Generic Knowledge-Based Framework for Problem Solving
in Engineering - Proposal and Case Studies, Lisbonne: Science and Technology
Publications, 2015, pp. 381-388.
[61] C. di Sciascio, C. Zanni-Merk, C. Wemmert, S. Marc-Zwecker and F. de Bertrand de
Beuvron, "Towards a semi-automatic semantic approach to satellite images analysis,"
Procedia Computer Science, vol. 22, pp. 1388-1397, 2013.
[62] N. Gartiser, C. Zanni-Merk, L. Boullosa and A. Casali, "A semantic layered architecture
for analysis and diagnosis of SME," in Procedia Computer Science, 2014.
[63] A. K. Dey, G. D. Abowd and D. Salber, "A Conceptual Framework and a Toolkit for
Supporting the Rapid Prototyping of Context-aware Applications," Human-Computer
Interactions, vol. 16, pp. 97-166, #dec# 2001.
[64] C. Sanin, C. Toro, Z. Haoxi, E. Sanchez, E. Szczerbicki, E. Carrasco, W. Peng and L.
Mancilla-Amaya, "Decisional DNA: A multi-technology shareable knowledge structure
for decisional experience," Neurocomputing, vol. 88, pp. 42-53, 2012.
[65] L. Sanders, "Problématiques géographiques, systèmes complexes et modélisation," in
Rencontres nationales Systèmes Complexes (RNSC), 2013.
[66] E. Sanchez, C. Toro, A. Artetxe, M. Graña, E. Carrasco and F. Guijarro, "A Semantic
Clinical Decision Support System: conceptual architecture and implementation
guidelines," in KES, 2012.
[67] K. Kozaki, Y. Kitamura, M. Ikeda and R. Mizoguchi, Hozo: an Environment for
Building/Using Ontologies Based on a Fundamental Consideration of "Role" and
"Relationship", Springer, 2002.
[68] E. G. Blanchard, R. Mizoguchi and S. P. Lajoie, "Structuring the cultural domain with
an upper ontology of culture," in The Handbook of Research on Culturally-Aware
172
Information Technology: Perspectives and Models, New York, Information Science
Reference, 2011, pp. 179-212.
[69] E. E. Gansner and S. C. North, "An open graph visualization system and its applications
to software engineering," Software Practice and Experience, vol. 30, no. 11, pp. 1203-
1233, 2000.
[70] J. H. Miller and S. E. Page, Complex Adaptive Systems: An Introduction to
Computational Models of Social Life (Princeton Studies in Complexity), Princeton, NJ:
Princeton University Press, 2007.
[71] J. Guespin-Michel, 2016. [Online]. Available at:
http://www.revolutionducomplexe.fr/bienvenue/janine-guespin-michel.
[72] E. Mitleton-Kelly, Complex systems and evolutionary perspectives on organisations: the
application of complexity theory to organisations, Elsevier Science Ltd, 2003.
[73] T.-Y. Li and J. A. Yorke, "Period three implies chaos," American Mathematical Monthly,
vol. 82, pp. 985-992, 1975.
[74] N. Boccara, Modeling Complex Systems, Springer Science & Business Media, 2010, p.
500.
[75] G. Nicolis and I. Prigogine, Exploring Complexity: An Introduction, W.H.Freeman &
Company, 1989.
[76] R. Feistel and W. Ebeling, Evolution of Complex Systems, Berlin: VEB Deutscher
Verlag der Wissenschaften, 1989.
[77] E. Morin, Science avec conscience, Librairie Arthème Fayard, 1982.
[78] H. R. Maturana and F. J. Varela, The tree of knowledge: the biological roots of human
understanding, Shambhala, 1992, p. 64.
[79] T. S. Kuhn, The Structure of Scientific Revolutions, Chicago: The University of Chicago
Press, 1962.
[80] Wolfram, "A new kind of science," 2002.
[81] C. L. M. H. Navier, "Mémoire sur les lois du mouvement des fluides," Mémoires de
l'Académie Royale des Sciences de l'Institut de France, vol. 6, pp. 389-416, 1823.
[82] G. G. Stokes, "On the Theory of Internal Friction of Fluid in Motion," Transactions of
Cambridge Philosophical Society, vol. 8, pp. 287-305, 1845.
173
[83] J. Stam, "Real-time fluid dynamics for games," in Game Developer Conference, San
Jose, CA, 2003.
[84] F. Moyson and B. Manderick, "The Collective Behavior of Ants: an Example of Self-
Organization in Massive Parallelism," in AAAI Spring Symposium on Parallel Models of
Intelligence, Stanford, 1988.
[85] C. W. Reynolds, "Flocks, Herds and Schools: A Distributed Behavioral Model," in
Proceedings of the 14th Annual Conference on Computer Graphics and Interactive
Techniques, 1987.
[86] J. H. Holland, "Complex Adaptive Systems," Daedalus, vol. 121, no. 1, pp. 17-30, 1992.
[87] J. H. Holland, Complexity: A Very Short Introduction, OUP Oxford, 2014.
[88] P. Senge, The Fifth Discipline: The Art and Practice of the Learning Organization,
Doubleday/Currency, 1990, p. 440.
[89] J. Rasmussen, "Risk management in a dynamic society: a modelling problem," Safety
Science, vol. 27, no. 2, pp. 183-213, 01 11 1997.
[90] A. Größler, M. Stotz and N. Schieritz, "A software interface between system dynamics
and agent-based simulations: linking Vensim® and RePast®," in Proceedings of the 21st
system dynamics society international conference, 2003.
[91] Z. Liu and H.-X. Li, "A probabilistic fuzzy logic system for modeling and control," Fuzzy
Systems, IEEE Transactions on, vol. 13, pp. 848-859, 2005.
[92] D. Koller and N. Friedman, Probabilistic graphical models: principles and techniques,
MIT press, 2009.
[93] S. Vitali, J. B. Glattfelder and S. Battiston, "The network of global corporate control,"
PLoSONE, vol. 6, oct 2011.
[94] Z. Messaoudene and J. Gramdi, 7è Congrès international de Génie Industriel, Trois
Rivières, Québec, 2007.
[95] B. C. Csáji and L. Monostori, "A complexity model for networks of collaborating
enterprises," in Proceedings of the 17th World Congress of IFAC (International
Federation of Automatic Control), COEX, Seoul, 2008.
[96] F. Laloux, Reinventing Organizations: A Guide to Creating Organizations Inspired by
the Next Stage in Human Consciousness, Nelson Parker, 2014, p. 360.
174
[97] B. J. Robertson, Holacracy: The New Management System for a Rapidly Changing
World, Henry Holt and Company, 2015, p. 202.
[98] R. Sheridan, Joy, Inc. : How We Built A Workplace People Love, Penguin, 2013, p. 197.
[99] W. Hölzl, "The evolutionary theory of the firm: Routines, complexity and change," in
The Economics of the Firm: Analysis, Evolution, History, Routledge, 2007, pp. 111-126.
[100] G. Dosi, "Opportunities, Incentives and the Collective Patterns of Technological
Change," Economic Journal, vol. 107, pp. 1530-1547, 1997.
[101] F. Varela, Introduction aux sciences cognitives, Paris: Seuil, 1996.
[102] P. Kourilsky, Le jeu du hasard et de la complexité, la nouvelle science de l'immunologie,
Paris: Odile Jacob, 2014, p. 334.
[103] D. E. Sadava, LIFE: The Science of Biology, Macmillan Learning, 2012, p. 1263.
[104] S. J. Spear and H. K. Bowen, "Decoding the DNA of the Toyota Production System,"
1999.
[105] M. Imai, Kaizen, The Key to Japan Competitive Success, New York: Random House
Business Division, 1990.
[106] M. N. D. Best, "Walter A Shewhart, 1924, and the Hawthorne factory," BMJ Quality &
Safety, vol. 15, no. 2, pp. 142-143, 2006.
[107] P. N. P. P.Masai, Is the Lean Organisation a Complex System?, Springer, 2016.
[108] J. Sutherland, Scrum: doing double the work in half the time, CRC Press, 2014.
[109] S. J. Shackelford, A. A. Proia, B. Martell and A. N. Craig, "Toward a Global
Cybersecurity Standard of Care: Exploring the Implications of the 2014 NIST
Cybersecurity Framework on Shaping Reasonable National and International
Cybersecurity Practices," Texas International Law Journal, vol. 50, p. 305, 2015-2016.
[110] P. Tomas, M. Escalona and M. Mejias, "Open source tools for measuring the Internal
Quality of Java software products. A survey," Computer Standards and Interfaces, vol.
36, no. 1, pp. 244-255, 2013.
[111] A. Van der Stock, D. Cruz, J. Chapman, D. Lowery, E. Keary, M. Morana and P. Prego,
"Owasp code review guide, v1.1," The OWASP Foundation Guidelines, 2008.
[112] P. Kruchten, R. L. Nord and I. Ozkaya, "Technical debt: From metaphor to theory and
practice," Ieee software, vol. 29, no. 6, pp. 18-21, 2012.
175
[113] C. R. Symons, Software Sizing and Estimating: Mk II FPA (Function Point Analysis),
New York, NY, USA: John Wiley & Sons, Inc., 1991.
[114] R. M. Soley and B. Curtis, "The Consortium for IT Software Quality (CISQ)," in SWQD,
2013.
[115] F. Curbera, M. Duftier, R. Khalaf, W. Nagy, N. Mukhi and S. Weerawarana, "Unraveling
the Web services web: an introduction to SOAP, WSDL, and UDDI," IEEE Internet
computing, vol. 6, no. 2, pp. 86-93, 2002.
[116] A. Arsanjani, "Service-oriented modeling and architecture," IBM developer works, vol.
1, p. 15, 2004.
[117] J. Fisher, D. Koning and A. Ludwigsen, "Utilizing Atlassian JIRA for Large-Scale
Software Development Management," 2013. [Online]. Available: https://e-reports-
ext.llnl.gov/pdf/763539.pdf.
[118] M. Hammarberg and J. Sunden, Kanban in action, Manning Publications Co., 2014.
[119] J. Loeliger and M. McCullough, Version Control with Git: Powerful tools and techniques
for collaborative software development, O'Reilly Media, inc., 2012.
[120] D. Hedgebeth, "Making use of knowledge sharing technologies," VINE, vol. 37, no. 1,
pp. 49-55, 2007.
[121] Gartner, "EA Business Value Metrics You Must Have Today," 2016.
[122] V. Thomas-Vaslin, A. Six, H. Pham, C. Dansokho, W. Chaara, B. Gouritin, B. Bellier
and D. Klatzmann, "Immunodepression & Immunosuppression during aging," in
Immunosuppression - Role in Health and Diseases, InTech, 2012, pp. 125-146.
[123] V. Thomas-Vaslin, "A complex immunological idiotypic network for maintenance of
tolerance.," Front Immunology, vol. 5, 2014.
[124] V. Thomas-Vaslin, "Complexité multi-échelle du système immunitaire: évolution, du
chaos aux fractales.," in Le vivant critique et chaotique, Paris, Editions Matériologiques,
2015, pp. 333-402.
[125] V. Thomas-Vaslin, "Le rôle des traces dans le système immunitaire: des anticorps au
corps," in L'Homme trace: des traces du corps au corps-trace, vol. 4, CNRS Editions,
2017, pp. 255-294.
176
[126] V. Thomas-Vaslin, "Understanding and Modeling the Complexity of the Immune
System," in First Complex System Digital Campus World E-Conference, Cham, Springer
International Publishing, 2015, pp. 261-270.
[127] D. Sauce and V. Appay, "Altered thymic activity in early life: how does it affect the
immune system in young adults?," Current opinion in immunology, vol. 23, no. 4, pp.
543-548, 2011.
[128] P. Van Woensel, D. de Gilder, P. van den Besselaar and P. Groenewegen, "Managerial
influence on attitude formation in organizations: how to manage emergence," Comput
Math Organ Theory, pp. 1-28, 2016.
[129] E. Meyer, The Culture Map, New York: Public Affairs, 2014, p. 257.
[130] J. McCarthy, Notes on Formalizing Context, Chambéry, France: Kaufmann, 1993.
[131] J.-F. Sowa, "Syntax, Semantics and Proagmatics of Contexts," AAAI, 1995.
[132] M. Bazire and P. Brézillon, "Understanding Context Before Using it," in Context 2005,
LNAI 3554, Berlin Heidelberg, Springer Verlag, 2005, pp. 29-40.
[133] R. Porzel, Contextual Computing: Models and Applications, Springer Science &
Business Media, 2010, p. 189.
[134] R. Mizuguchi, "YAMATO: Yet Another More Advanced Top-level Ontology," in Sixth
Australasian Ontology Workshop, Adelaïde, 2010.
[135] G. Hofstede, Culture's consequences: International differences in work-related values,
vol. 5, Sage Publications, inc., 1984.
[136] G. Hofstede, G.-J. Hofstede and M. Minkov, Culture and Organisation, Software of the
Mind, London/New York: McGraw Hill, 1991.
[137] P. Masai, P. Parrend, N. Toussaint and P. Collet, "Is the Lean Organisation a Complex
System?," in CS-DC 2015 World e-conference, 2015.
[138] M. P. Joshi, R. Kathuria and S. J. Porth, "Alignment of strategic priorities and
performance: an integration of operations and strategic management perspectives,"
Journal of Operations Management, vol. 21, pp. 353-369, 2003.
[139] M. Beer, S. C. Voelpel, M. Leibold and E. B. Tekie, "Strategic management as
organizational learning: Developing fit and alignment through a disciplined process,"
Long Range Planning, vol. 38, pp. 445-465, 2005.
177
[140] N. Toussaint, "Modèles émergents de gestion de service informatique: conception et
développement," Université de Strasbourg, Strasbourg, 2016.
[141] J. M. Benyus, Biomimicry, Innovation inspired by nature, Harper Collins, 2009, p. 324.
[142] A. Medina, D. Santiago, A. J. Rodríguez and I. Martín, The Lean Playbook, Leaners, Ed.,
Madrid: Kerunet Digital Publishing, 2015.
[143] J. DeLong, Beyond the TPS Tools, Xlibris, 2011, p. 195.
[144] Y. Akao, Hoshin Kanri, Cambridge, Massachussets: Productivity Press, 1991.
[145] A. Ward, J. K. Liker, J. J. Cristiano and D. K. Sobek, "The second Toyota paradox: How
delaying decisions can make better cars faster," Sloan management review, vol. 36, p.
43, 1995.
[146] E. Toyoda, Toyota Fifty Years in Motion, Kodansha International Ltd, 1987.
[147] C. Toro, E. Sanchez, E. Carrasco, L. Mancilla-Amaya, C. San\́in, E. Szczerbicki, M.
Graña, P. Bonachela, C. Parra, G. Bueno and others, "Using set of Experience
Knowledge Structure to extend a rule set of clinical decision support system for
alzheimer's disease diagnosis," Cybernetics and Systems, vol. 43, pp. 81-95, 2012.
[148] R. Sheridan, Joy, Inc., Penguin LCC US, 2013.
[149] H. F. Rosenbluth and D. M. Peters, "The customer comes second," New York: William
Morrow \& Company, 1992.
[150] C. Orłowski and E. Szczerbicki, "Hybrid model of the evolution of information
technology (it) support organization," Cybernetics and Systems, vol. 43, pp. 292-302,
2012.
[151] J. R. Norris, Markov Chains, Cambridge University Press, 1998.
[152] C. Marchwinski, J. Shook and A. Schroeder, Lean lexicon, 4th ed ed., Cambridge, M:
Lean Enterprise Institute, 2008.
[153] R. Lopez De Mantaras, D. McSherry, D. Bridge, D. Leake, B. Smyth, S. Craw, B.
Faltings, M. L. Maher, M. T. Cox, K. Forbus and others, "Retrieval, reuse, revision and
retention in case-based reasoning," The Knowledge Engineering Review, vol. 20, pp. 215-
240, 2005.
[154] D. H. Kim and V. Anderson, Systems archetype basics: From story to structure, Pegasus
Communications, 1998.
178
[155] T. Houy, "Articulation entre pratiques managériales et systèmes d'information:
construction d'un idéal type et modélisations," 2008.
[156] J. H. Holland, "Studying complex adaptive systems," Journal of Systems Science and
Complexity, vol. 19, pp. 1-8, 2006.
[157] A. Cavallo and V. Ireland, "Preparing for complex interdependent risks: A system of
systems approach to building disaster resilience," International Journal of Disaster Risk
Reduction, vol. 9, pp. 181-193, 2014.
[158] C. Cassell, J. M. Worley and T. L. Doolen, "The role of communication and management
support in a lean manufacturing implementation," Management Decision, vol. 44, pp.
228-245, 2006.
[159] R. Benjamins, D. Fensel and A. Gomez-Perez, "Knowledge management through
ontologies," in Central Europe Workshop Proceedings, 1998.
[160] Y. Malhotra, "Expert systems for knowledge management: crossing the chasm between
information processing and sense making," Expert Systems with Applications, vol. 20,
pp. 7-16, 2001.
[161] Y. Sugimori, K. Kusunoki, F. Cho and S. Uchikawa, "Toyota production system and
kanban system materialization of just-in-time and respect-for-human system," The
International Journal of Production Research, vol. 15, pp. 553-564, 1977.
[162] N. Sangal, E. Jordan, V. Sinha and D. Jackson, "Using dependency models to manage
complex software architecture," in ACM Sigplan Notices, 2005.
[163] S. Shingo, The Toyota Production System, New York: Productivity Press, 1989.
[164] L. E. Institute, Lean Lexicon, Cambridge, Massachusetts: Lean Enterprise Institute,
2003.
[165] M. Rother and J. Shook, Learning to See, Cambridge, Massachusetts: Lean Enterprise
Institute, 1999.
[166] A. Le Méhauté and S. Reynal, "Kairos management: nouveaux outils pour le
management des opportunités et un développement durable," Le Revue des Sciences de
Gestion, vol. 5, no. 239-240, pp. 97-105, 2009.
[167] R. Glass, S. Seifermann and J. Metternich, "The Spread of Lean Production in the
Assembly, Process and Machining Industry," in 5th CIRP Global Web Conference
Research and Innovation for Future Production, 2017.
179
[168] N. Dulac, "A framework for dynamic safety and risk management modeling in complex
engineering systems," Boston, 2007.
[169] R. Alarcon, E. Wilde and J. Bellido, "Hypermedia-Driven RESTful Service
Composition.," in ICSOC Workshops, 2010.
180
List of publications, teaching experience, conferences, videos and interviews.
Publications:
(1) P. Masai, A.Valette, "A lower bound for a counterexample to Carmichael’s
conjecture", Bolletino dell’Unione Matematica Italiana, vol. 6, pp. 313-316, 1982
(2) P. Masai, “Two Conjectures of Grünbaum on Arrangements of Curves", Discrete Mathematics, vol.41 (2), pp. 173-180, 1982
(3) P. Parrend, P. Masai, C. Zanni-Merk, P.Collet, "Swarm projects, beyond the metaphor” in International Conference on Swarm Intelligence Based Optimization, pp.131-138, Springer, 2014
(4) P. Masai, P. Parrend and C. Zanni-Merk, "Towards a formal model of the lean
enterprise," Procedia Computer Science, vol. 60, pp. 226-235, 2015
(5) P. Masai and C. Zanni-Merk, "Formalization of a Framework for Cultural Translation
in Global Collaboration. The Case of the Lean Organization," Procedia Computer
Science, vol. 96, pp. 375-384, 2016.
(6) P. Masai, P. Parrend, N. Toussaint and P. Collet, "Is the Lean Organisation a Complex
System?," in First Complex Systems Digital Campus World E-Conference 2015,
Springer, 2pp. 55-69, 2016
To be submitted for publication:
(7) P. Masai, P.Rademakers, P.Parrend, P.Collet, “Building Sustainable IT Enterprise
Architectures with the Lean Organization Framework”
(8) P. Masai, P.Parrend, P.Collet, V.Thomas-Vaslin, “Complex living organization in
humans, integrating social and cellular levels: Lean Organization and Immune System”
181
Some authors on lean have also requested my review of their work:
- Michaël Ballé [28]
- Antonio Medina [137], with my quote on the fourth cover page:
“lean is anchored in practice and this book is the “check” in the PDCA of the
author’s practice: it visualizes them, enables others to apply them and enables a
next “Act” to contribute to the further evolution of lean practices. Read it, give
feedback and bring lean to the next level!”
Teaching experience:
Lean IT Course at ECAM Strasbourg-Europe, fifth year of Engineering studies, Computer
Science option, since 2013 (five years including the 2017 session).
Technical conferences:
(In English language)
Lean IT Summit, Paris, 22-23/1/2012:
Keynote speech on 22/1 (Toyota Way IT fundamentals),
Youtube reference: https://youtu.be/R451C_lEn5E, 2195 views (15/4/2017).
Lean UK Summit, Wokefield Park, UK, 6-7/11/2013:
Keynote on 6/11 (Why is IT different at Toyota?),
Youtube reference: https://youtu.be/-Dkcby54jNA, 871 views (15/4/2017).
Lean IT Summit, Paris, 16-17/10/2014:
Keynote on 16/10 (The Quest of One Piece Flow),
Youtube reference https://youtu.be/BNhLNjDzc4Q, 417 views (15/4/2017).
KES International 2016, York, UK, 5-7/9/2016
Presentation on September 7th of the paper in [3].
182
Lean Summit UK, Kenilworth, UK, 15-16/11/2016 (to be released on Youtube)
Lean IT Summit, Paris, 14-15/3/2017,
Keynote on 15/3 (IT for Hoshin and Hoshin for IT),
Youtube reference https://youtu.be/0-TG_Cf4V_4, 277 views (15/8/2017).
(in German language)
Best Practice Days 2017, Darmstadt, 4/7/2017.
(in French language)
Conferences at ECAM Strasbourg-Europe in the conference cycle
“Conférences Expert”:
16/12/2013 (Toyota Way IT fundamentals),
3/12/2014 (The Quest of One Piece Flow),
6/1/2016 (Lean Enterprise Architecture),
16/1/2017 (eHoshin).
183
Appendix 1 – lean concepts

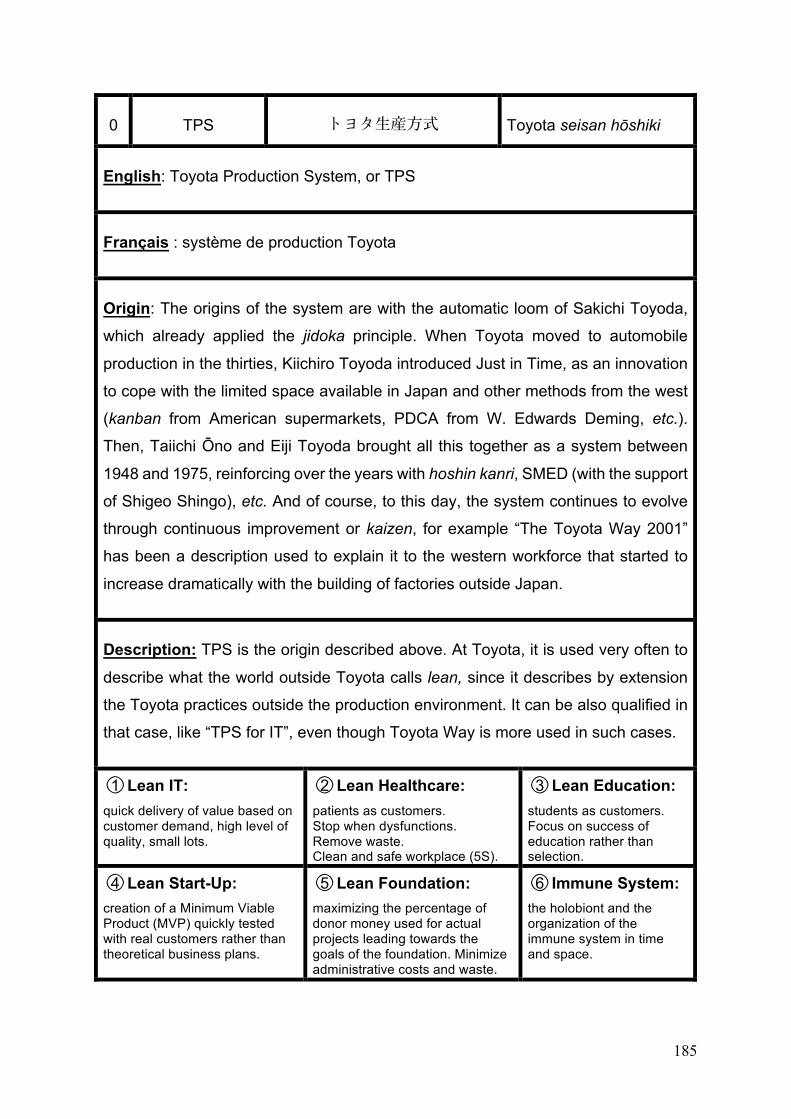
185
0 TPS ⽣産⽅式 Toyota seisan hōshiki
English: Toyota Production System, or TPS
Français : système de production Toyota
Origin: The origins of the system are with the automatic loom of Sakichi Toyoda,
which already applied the jidoka principle. When Toyota moved to automobile
production in the thirties, Kiichiro Toyoda introduced Just in Time, as an innovation
to cope with the limited space available in Japan and other methods from the west
(kanban from American supermarkets, PDCA from W. Edwards Deming, etc.).
Then, Taiichi Ōno and Eiji Toyoda brought all this together as a system between
1948 and 1975, reinforcing over the years with hoshin kanri, SMED (with the support
of Shigeo Shingo), etc. And of course, to this day, the system continues to evolve
through continuous improvement or kaizen, for example “The Toyota Way 2001”
has been a description used to explain it to the western workforce that started to
increase dramatically with the building of factories outside Japan.
Description: TPS is the origin described above. At Toyota, it is used very often to
describe what the world outside Toyota calls lean, since it describes by extension
the Toyota practices outside the production environment. It can be also qualified in
that case, like “TPS for IT”, even though Toyota Way is more used in such cases.
○1 Lean IT: quick delivery of value based on customer demand, high level of quality, small lots.
○2 Lean Healthcare: patients as customers. Stop when dysfunctions. Remove waste. Clean and safe workplace (5S).
○3 Lean Education: students as customers. Focus on success of education rather than selection.
○4 Lean Start-Up: creation of a Minimum Viable Product (MVP) quickly tested with real customers rather than theoretical business plans.
○5 Lean Foundation: maximizing the percentage of donor money used for actual projects leading towards the goals of the foundation. Minimize administrative costs and waste.
○6 Immune System: the holobiont and the organization of the immune system in time and space.
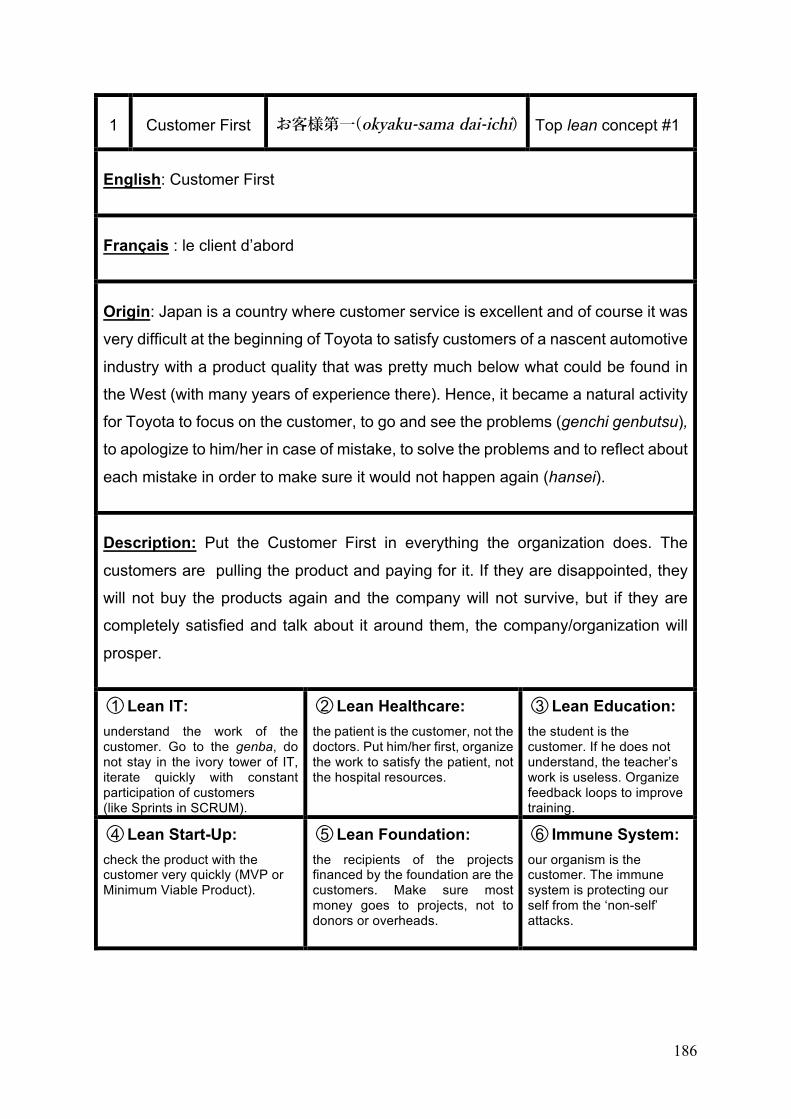
186
1 Customer First お客様第⼀(okyaku-sama dai-ichi) Top lean concept #1
English: Customer First
Français : le client d’abord
Origin: Japan is a country where customer service is excellent and of course it was
very difficult at the beginning of Toyota to satisfy customers of a nascent automotive
industry with a product quality that was pretty much below what could be found in
the West (with many years of experience there). Hence, it became a natural activity
for Toyota to focus on the customer, to go and see the problems (genchi genbutsu),
to apologize to him/her in case of mistake, to solve the problems and to reflect about
each mistake in order to make sure it would not happen again (hansei).
Description: Put the Customer First in everything the organization does. The
customers are pulling the product and paying for it. If they are disappointed, they
will not buy the products again and the company will not survive, but if they are
completely satisfied and talk about it around them, the company/organization will
prosper.
○1 Lean IT: understand the work of the customer. Go to the genba, do not stay in the ivory tower of IT, iterate quickly with constant participation of customers (like Sprints in SCRUM).
○2 Lean Healthcare: the patient is the customer, not the doctors. Put him/her first, organize the work to satisfy the patient, not the hospital resources.
○3 Lean Education: the student is the customer. If he does not understand, the teacher’s work is useless. Organize feedback loops to improve training.
○4 Lean Start-Up: check the product with the customer very quickly (MVP or Minimum Viable Product).
○5 Lean Foundation: the recipients of the projects financed by the foundation are the customers. Make sure most money goes to projects, not to donors or overheads.
○6 Immune System: our organism is the customer. The immune system is protecting our self from the ‘non-self’ attacks.
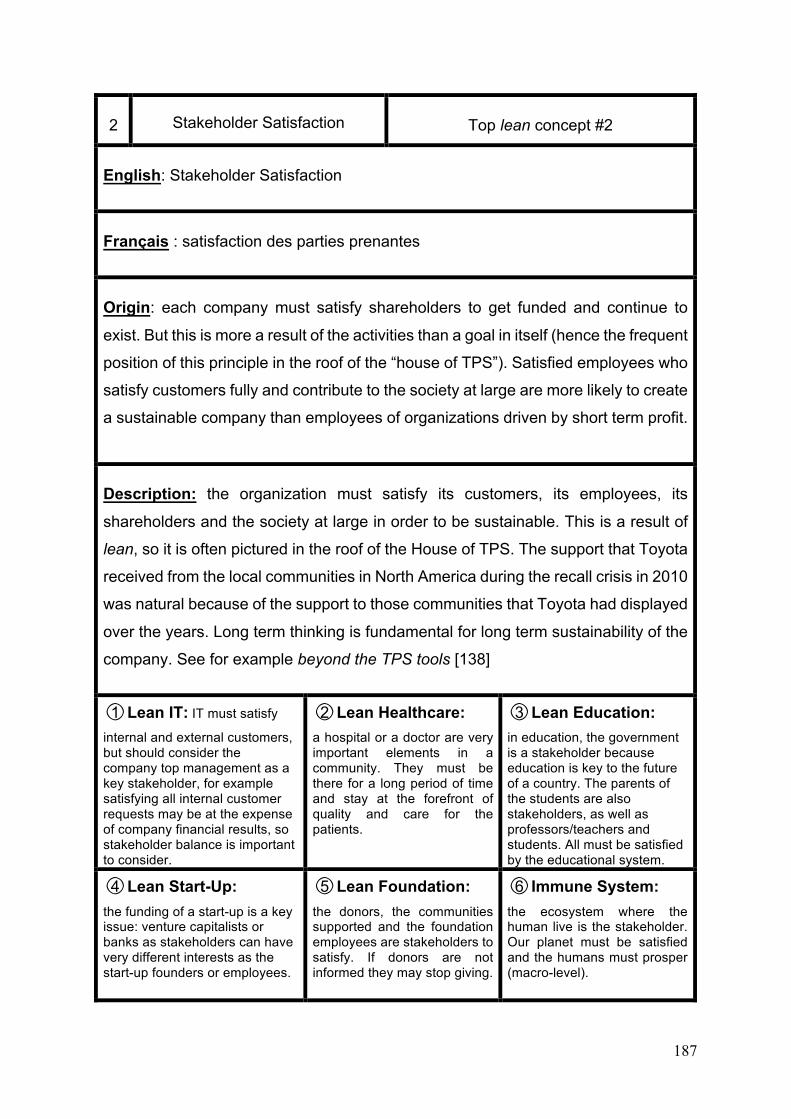
187
2 Stakeholder Satisfaction Top lean concept #2
English: Stakeholder Satisfaction
Français : satisfaction des parties prenantes
Origin: each company must satisfy shareholders to get funded and continue to
exist. But this is more a result of the activities than a goal in itself (hence the frequent
position of this principle in the roof of the “house of TPS”). Satisfied employees who
satisfy customers fully and contribute to the society at large are more likely to create
a sustainable company than employees of organizations driven by short term profit.
Description: the organization must satisfy its customers, its employees, its
shareholders and the society at large in order to be sustainable. This is a result of
lean, so it is often pictured in the roof of the House of TPS. The support that Toyota
received from the local communities in North America during the recall crisis in 2010
was natural because of the support to those communities that Toyota had displayed
over the years. Long term thinking is fundamental for long term sustainability of the
company. See for example beyond the TPS tools [138]
○1 Lean IT: IT must satisfy
internal and external customers, but should consider the company top management as a key stakeholder, for example satisfying all internal customer requests may be at the expense of company financial results, so stakeholder balance is important to consider.
○2 Lean Healthcare: a hospital or a doctor are very important elements in a community. They must be there for a long period of time and stay at the forefront of quality and care for the patients.
○3 Lean Education: in education, the government is a stakeholder because education is key to the future of a country. The parents of the students are also stakeholders, as well as professors/teachers and students. All must be satisfied by the educational system.
○4 Lean Start-Up: the funding of a start-up is a key issue: venture capitalists or banks as stakeholders can have very different interests as the start-up founders or employees.
○5 Lean Foundation: the donors, the communities supported and the foundation employees are stakeholders to satisfy. If donors are not informed they may stop giving.
○6 Immune System: the ecosystem where the human live is the stakeholder. Our planet must be satisfied and the humans must prosper (macro-level).
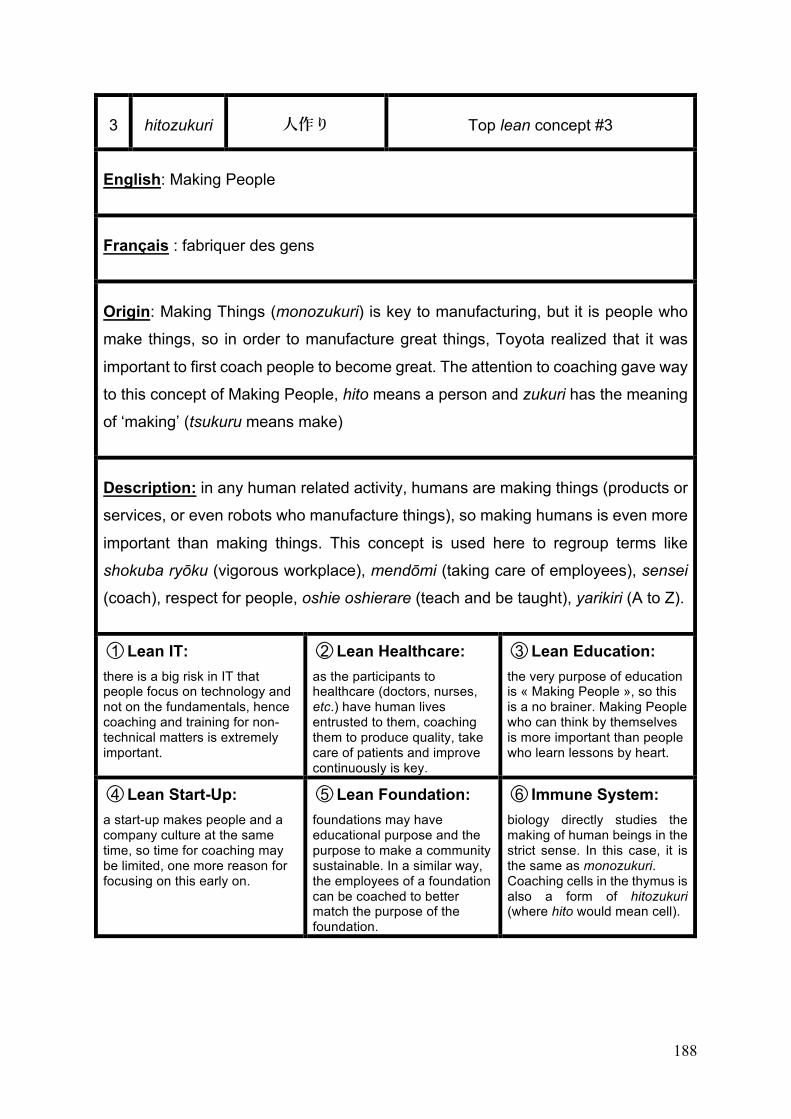
188
3 hitozukuri ⼈作り Top lean concept #3
English: Making People
Français : fabriquer des gens
Origin: Making Things (monozukuri) is key to manufacturing, but it is people who
make things, so in order to manufacture great things, Toyota realized that it was
important to first coach people to become great. The attention to coaching gave way
to this concept of Making People, hito means a person and zukuri has the meaning
of ‘making’ (tsukuru means make)
Description: in any human related activity, humans are making things (products or
services, or even robots who manufacture things), so making humans is even more
important than making things. This concept is used here to regroup terms like
shokuba ryōku (vigorous workplace), mendōmi (taking care of employees), sensei
(coach), respect for people, oshie oshierare (teach and be taught), yarikiri (A to Z).
○1 Lean IT: there is a big risk in IT that people focus on technology and not on the fundamentals, hence coaching and training for non-technical matters is extremely important.
○2 Lean Healthcare: as the participants to healthcare (doctors, nurses, etc.) have human lives entrusted to them, coaching them to produce quality, take care of patients and improve continuously is key.
○3 Lean Education: the very purpose of education is « Making People », so this is a no brainer. Making People who can think by themselves is more important than people who learn lessons by heart.
○4 Lean Start-Up: a start-up makes people and a company culture at the same time, so time for coaching may be limited, one more reason for focusing on this early on.
○5 Lean Foundation: foundations may have educational purpose and the purpose to make a community sustainable. In a similar way, the employees of a foundation can be coached to better match the purpose of the foundation.
○6 Immune System: biology directly studies the making of human beings in the strict sense. In this case, it is the same as monozukuri. Coaching cells in the thymus is also a form of hitozukuri (where hito would mean cell).
189
4 JIT ジャストインタイム Top lean concept #4
English: Just in Time (pull flow)
Français : Juste à Temps (flux tendu)
Origin: Kiichiro Toyoda, starting the automotive production. In post-war Japan, all
resources were scarce, including the natural space scarcity in Japan, a country
covered by mountains with a very limited territory for human beings to live, let alone
for companies to use vast areas of land, contrary to the United States of America.
Description: Just in Time is the principle to produce exactly what is needed for the
customer, at the time where it is needed and in the quantity needed. Doing so
reduces inventory and waste dramatically, while forcing everybody to work together
and be flexible so that the line is not constantly stopped by shortages of all kinds.
○1 Lean IT: avoid to program or migrate code that is never used. This is best achieved by closely involving the customers. Deliver the working programs as close as possible to the time where they are needed by the customers.
○2 Lean Healthcare: optimize the stock of drugs based on usage to ensure availability and validity for the patients.
○3 Lean Education: bring new material to the students at a time where they are ready to understand it. Not before (not understandable) and not too late (redundant).
○4 Lean Start-Up: a Minimum Viable Product is what is needed to check the interest of customers for a product. Develop it in more detail at that stage would be a big waste in case of a pivot.
○5 Lean Foundation: deliver support to the projects that need it, at the time they need it.
○6 Immune System: in case a threat is detected, a huge number of cells are produced to support the fights against the intrusion. They are produced in high quantity and types for the need of the system at that particular time.
190
5 Jidoka ⾃
働
化
self
human+moving
-ization
Top lean concept #5
English: Stop in Time, traditionally called “automation with a human touch” or
“autonomation”
Français : arrêt à temps, automation à visage humain, autonomation
Origin: Sakichi Toyoda and the automatic loom. Sakichi stopped the threads
automatically when a problem occurred to enable resolution.
There is an additional radical (Human) added to the left of the kanji ‘DO’ meaning
‘move’.
Description: Stop the flow in case of anomaly to prevent “defect flow out”
(Propagation of defects). “Stop and call” to make the human understand the issue.
Solve the problem to restart the machine or the process. Start root cause analysis
to prevent reoccurrence. See [30], for a more complete description.
○1 Lean IT: stop the input where wrong, like check digits of bank accounts Stop batch jobs in case of error before the database gets corrupted
○2 Lean Healthcare: stop and call in case of doubt (nurses, doctors). Stop the equipment when an abnormality is encountered, call the specialist
○3 Lean Education: for the teachers: stop when feeling that he/she lost the audience. For the students: stop the teacher when the students are not following any longer.
○4 Lean Start-Up: the pivot of a start-up (change of business model based on customer feedback) is the ultimate example of stopping and doing things differently involving everybody
○5 Lean Foundation: stop a project when the money is being spent and the direction the project takes is wrong. Reflect and restart, or stop.
○6 Immune System: natural elimination of cells when defects are detected. Apoptosis or cell suicide (programmed cell death).
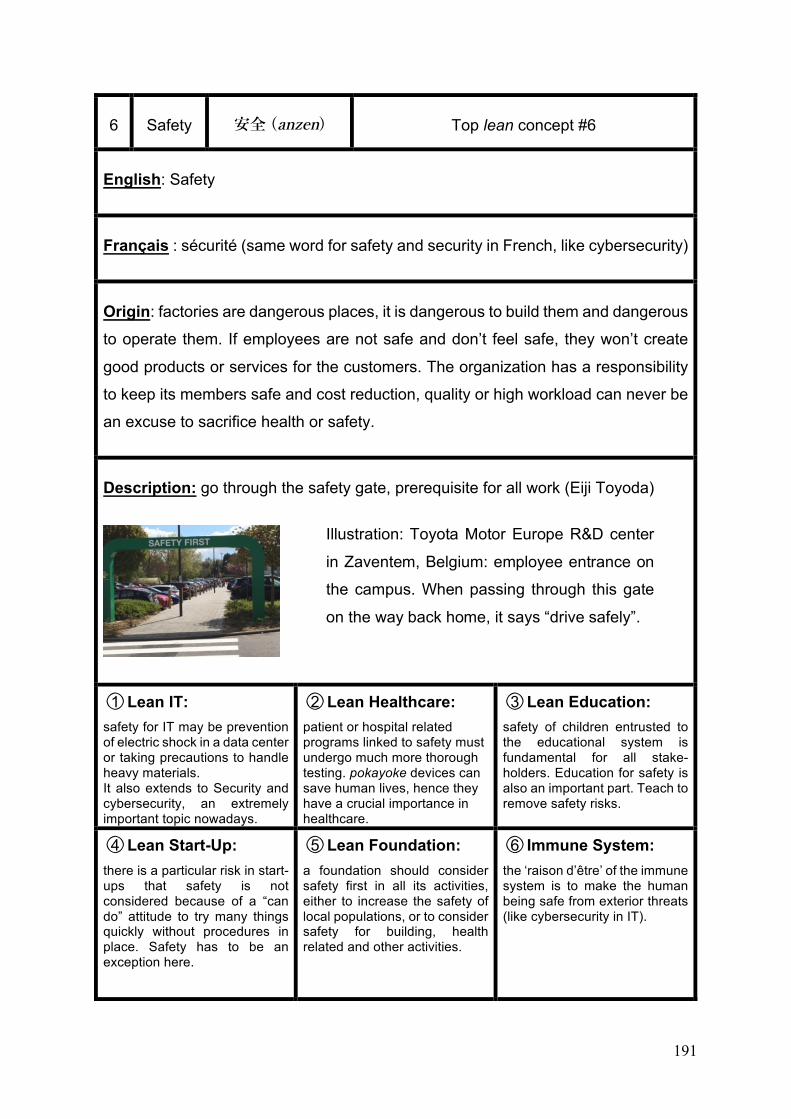
191
6 Safety 安全 (anzen) Top lean concept #6
English: Safety
Français : sécurité (same word for safety and security in French, like cybersecurity)
Origin: factories are dangerous places, it is dangerous to build them and dangerous
to operate them. If employees are not safe and don’t feel safe, they won’t create
good products or services for the customers. The organization has a responsibility
to keep its members safe and cost reduction, quality or high workload can never be
an excuse to sacrifice health or safety.
Description: go through the safety gate, prerequisite for all work (Eiji Toyoda)
○1 Lean IT: safety for IT may be prevention of electric shock in a data center or taking precautions to handle heavy materials. It also extends to Security and cybersecurity, an extremely important topic nowadays.
○2 Lean Healthcare: patient or hospital related programs linked to safety must undergo much more thorough testing. pokayoke devices can save human lives, hence they have a crucial importance in healthcare.
○3 Lean Education: safety of children entrusted to the educational system is fundamental for all stake-holders. Education for safety is also an important part. Teach to remove safety risks.
○4 Lean Start-Up: there is a particular risk in start-ups that safety is not considered because of a “can do” attitude to try many things quickly without procedures in place. Safety has to be an exception here.
○5 Lean Foundation: a foundation should consider safety first in all its activities, either to increase the safety of local populations, or to consider safety for building, health related and other activities.
○6 Immune System: the ‘raison d’être’ of the immune system is to make the human being safe from exterior threats (like cybersecurity in IT).
Illustration: Toyota Motor Europe R&D center
in Zaventem, Belgium: employee entrance on
the campus. When passing through this gate
on the way back home, it says “drive safely”.
192
7 kaizen 改善 (change/good) Top lean concept #7
English: continuous (continual) improvement
Français: amélioration continue
Origin: Masaaki Imai has made this term widely available with his book kaizen [107],
it has roots in the Shewhart cycle or W. Edwards Deming’s PDCA cycle (Plan Do
Check Act) which has been taught by him to Japanese companies after the war.
Japan has been at the forefront of applying continuous improvement in a systematic
way and Deming’s ideas have found a very fertile ground there to develop further.
The Deming price has been awarded to Toyota in 1965.
Description: Continuous improvement requires to understand the current situation and describe
it in detail (standardization, operating procedures) and to make sure that any change
proposed will make it better (applying the scientific method)
○1 Lean IT: make sure a new software is really better than the previous version before releasing.
○2 Lean Healthcare: make sure a new drug really cures a disease better that a previous one and does not cause more harm in some cases (clinical tests).
○3 Lean Education: for a teacher, make sure experience from teaching is reflected in the materials and every year the course becomes better.
○4 Lean Start-Up: from a minimum viable product (MVP), create new version, checking the customer appeal.
○5 Lean Foundation: continuous improvement of foundation projects impact on communities based on feedback and learning is key to the success of a foundation.
○6 Immune System: the big multi-generational kaizen that saw the unicellular organisms evolve gradually to eventually become human beings.
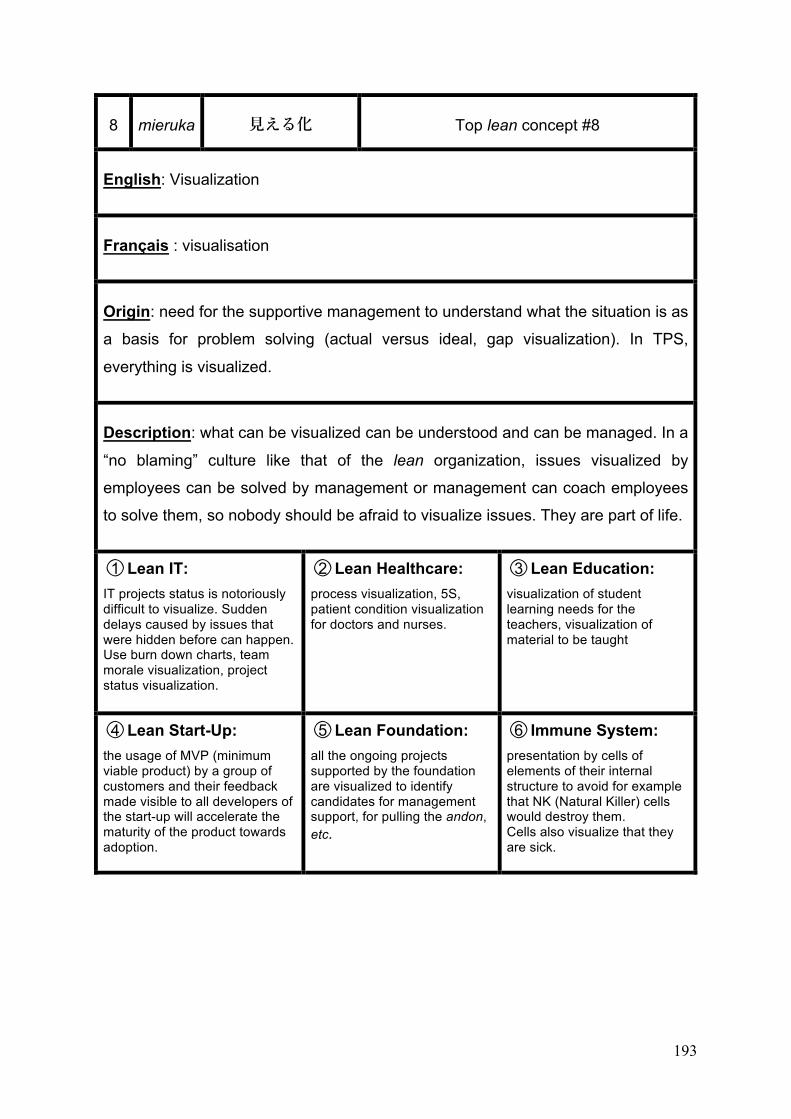
193
8 mieruka ⾒える化 Top lean concept #8
English: Visualization
Français : visualisation
Origin: need for the supportive management to understand what the situation is as
a basis for problem solving (actual versus ideal, gap visualization). In TPS,
everything is visualized.
Description: what can be visualized can be understood and can be managed. In a
“no blaming” culture like that of the lean organization, issues visualized by
employees can be solved by management or management can coach employees
to solve them, so nobody should be afraid to visualize issues. They are part of life.
○1 Lean IT: IT projects status is notoriously difficult to visualize. Sudden delays caused by issues that were hidden before can happen. Use burn down charts, team morale visualization, project status visualization.
○2 Lean Healthcare: process visualization, 5S, patient condition visualization for doctors and nurses.
○3 Lean Education: visualization of student learning needs for the teachers, visualization of material to be taught
○4 Lean Start-Up: the usage of MVP (minimum viable product) by a group of customers and their feedback made visible to all developers of the start-up will accelerate the maturity of the product towards adoption.
○5 Lean Foundation: all the ongoing projects supported by the foundation are visualized to identify candidates for management support, for pulling the andon, etc.
○6 Immune System: presentation by cells of elements of their internal structure to avoid for example that NK (Natural Killer) cells would destroy them. Cells also visualize that they are sick.
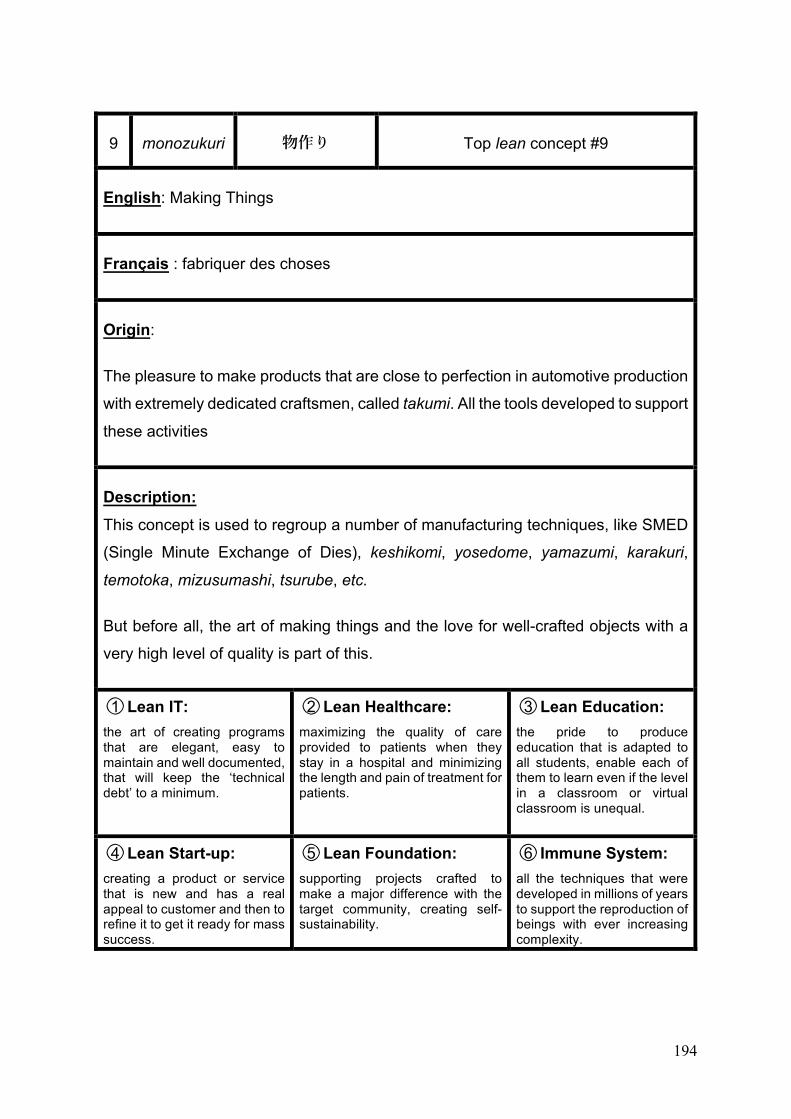
194
9 monozukuri 物作り Top lean concept #9
English: Making Things
Français : fabriquer des choses
Origin:
The pleasure to make products that are close to perfection in automotive production
with extremely dedicated craftsmen, called takumi. All the tools developed to support
these activities
Description: This concept is used to regroup a number of manufacturing techniques, like SMED
(Single Minute Exchange of Dies), keshikomi, yosedome, yamazumi, karakuri,
temotoka, mizusumashi, tsurube, etc.
But before all, the art of making things and the love for well-crafted objects with a
very high level of quality is part of this.
○1 Lean IT: the art of creating programs that are elegant, easy to maintain and well documented, that will keep the ‘technical debt’ to a minimum.
○2 Lean Healthcare: maximizing the quality of care provided to patients when they stay in a hospital and minimizing the length and pain of treatment for patients.
○3 Lean Education: the pride to produce education that is adapted to all students, enable each of them to learn even if the level in a classroom or virtual classroom is unequal.
○4 Lean Start-up: creating a product or service that is new and has a real appeal to customer and then to refine it to get it ready for mass success.
○5 Lean Foundation: supporting projects crafted to make a major difference with the target community, creating self-sustainability.
○6 Immune System: all the techniques that were developed in millions of years to support the reproduction of beings with ever increasing complexity.
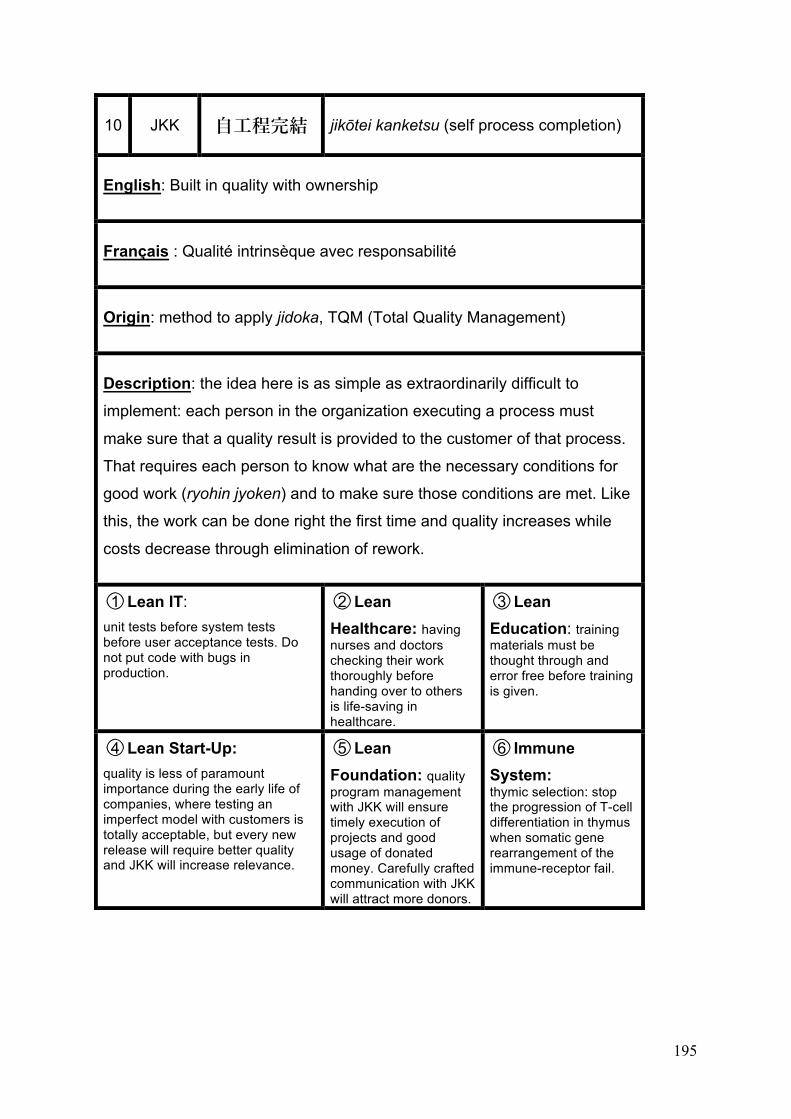
195
10 JKK ⾃⼯程完結 jikōtei kanketsu (self process completion)
English: Built in quality with ownership
Français : Qualité intrinsèque avec responsabilité
Origin: method to apply jidoka, TQM (Total Quality Management)
Description: the idea here is as simple as extraordinarily difficult to
implement: each person in the organization executing a process must
make sure that a quality result is provided to the customer of that process.
That requires each person to know what are the necessary conditions for
good work (ryohin jyoken) and to make sure those conditions are met. Like
this, the work can be done right the first time and quality increases while
costs decrease through elimination of rework.
○1 Lean IT: unit tests before system tests before user acceptance tests. Do not put code with bugs in production.
○2 Lean Healthcare: having nurses and doctors checking their work thoroughly before handing over to others is life-saving in healthcare.
○3 Lean Education: training materials must be thought through and error free before training is given.
○4 Lean Start-Up: quality is less of paramount importance during the early life of companies, where testing an imperfect model with customers is totally acceptable, but every new release will require better quality and JKK will increase relevance.
○5 Lean Foundation: quality program management with JKK will ensure timely execution of projects and good usage of donated money. Carefully crafted communication with JKK will attract more donors.
○6 Immune System: thymic selection: stop the progression of T-cell differentiation in thymus when somatic gene rearrangement of the immune-receptor fail.
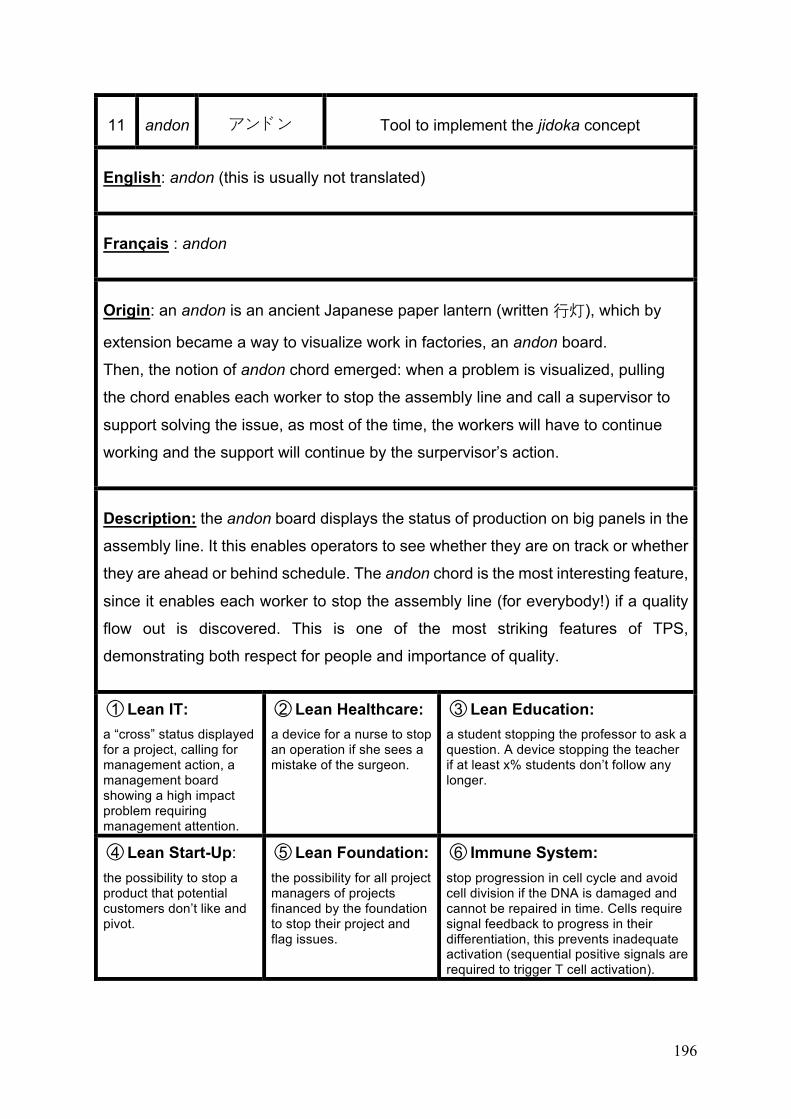
196
11 andon アンドン Tool to implement the jidoka concept
English: andon (this is usually not translated)
Français : andon
Origin: an andon is an ancient Japanese paper lantern (written 行灯), which by
extension became a way to visualize work in factories, an andon board.
Then, the notion of andon chord emerged: when a problem is visualized, pulling
the chord enables each worker to stop the assembly line and call a supervisor to
support solving the issue, as most of the time, the workers will have to continue
working and the support will continue by the surpervisor’s action.
Description: the andon board displays the status of production on big panels in the
assembly line. It this enables operators to see whether they are on track or whether
they are ahead or behind schedule. The andon chord is the most interesting feature,
since it enables each worker to stop the assembly line (for everybody!) if a quality
flow out is discovered. This is one of the most striking features of TPS,
demonstrating both respect for people and importance of quality.
○1 Lean IT: a “cross” status displayed for a project, calling for management action, a management board showing a high impact problem requiring management attention.
○2 Lean Healthcare: a device for a nurse to stop an operation if she sees a mistake of the surgeon.
○3 Lean Education: a student stopping the professor to ask a question. A device stopping the teacher if at least x% students don’t follow any longer.
○4 Lean Start-Up: the possibility to stop a product that potential customers don’t like and pivot.
○5 Lean Foundation: the possibility for all project managers of projects financed by the foundation to stop their project and flag issues.
○6 Immune System: stop progression in cell cycle and avoid cell division if the DNA is damaged and cannot be repaired in time. Cells require signal feedback to progress in their differentiation, this prevents inadequate activation (sequential positive signals are required to trigger T cell activation).
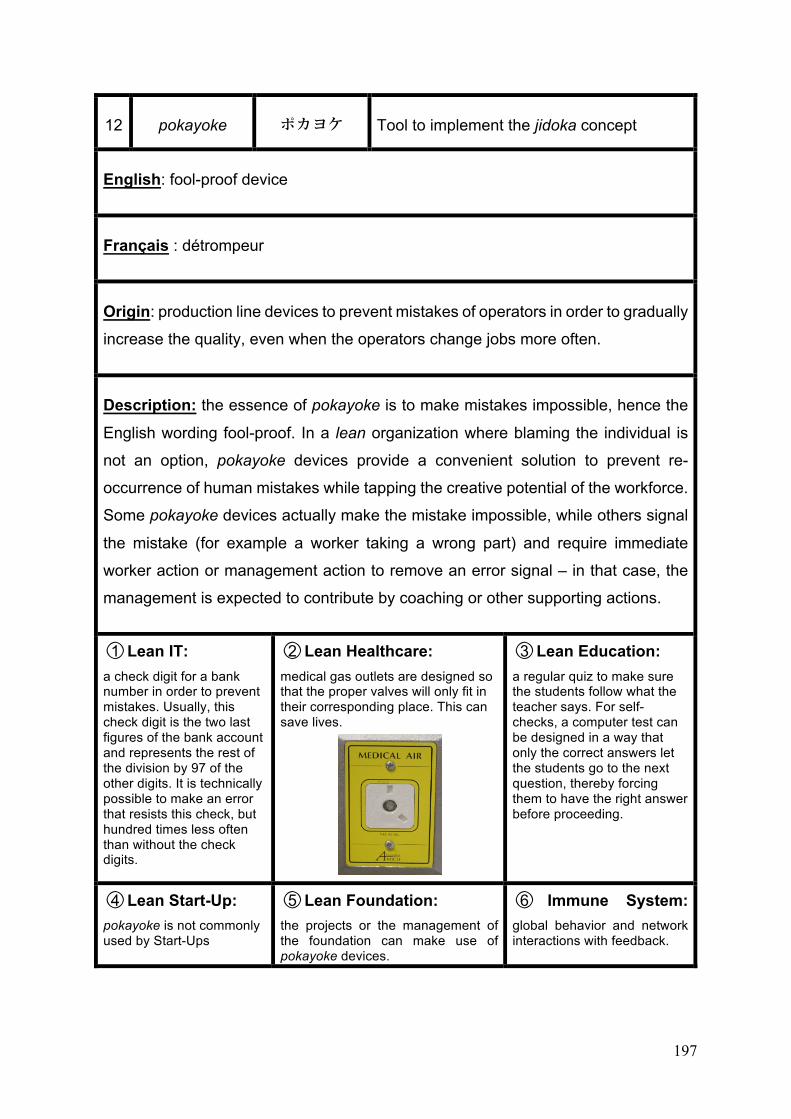
197
12 pokayoke ポカヨケ Tool to implement the jidoka concept
English: fool-proof device
Français : détrompeur
Origin: production line devices to prevent mistakes of operators in order to gradually
increase the quality, even when the operators change jobs more often.
Description: the essence of pokayoke is to make mistakes impossible, hence the
English wording fool-proof. In a lean organization where blaming the individual is
not an option, pokayoke devices provide a convenient solution to prevent re-
occurrence of human mistakes while tapping the creative potential of the workforce.
Some pokayoke devices actually make the mistake impossible, while others signal
the mistake (for example a worker taking a wrong part) and require immediate
worker action or management action to remove an error signal – in that case, the
management is expected to contribute by coaching or other supporting actions.
○1 Lean IT: a check digit for a bank number in order to prevent mistakes. Usually, this check digit is the two last figures of the bank account and represents the rest of the division by 97 of the other digits. It is technically possible to make an error that resists this check, but hundred times less often than without the check digits.
○2 Lean Healthcare: medical gas outlets are designed so that the proper valves will only fit in their corresponding place. This can save lives.
○3 Lean Education: a regular quiz to make sure the students follow what the teacher says. For self-checks, a computer test can be designed in a way that only the correct answers let the students go to the next question, thereby forcing them to have the right answer before proceeding.
○4 Lean Start-Up: pokayoke is not commonly used by Start-Ups
○5 Lean Foundation: the projects or the management of the foundation can make use of pokayoke devices.
○6 Immune System: global behavior and network interactions with feedback.
198
13 Coach 先⽣ Method of hitozukuri
English: coach, and the action of coaching
Français : coach et coaching
Origin: within production in Japan, but then very interestingly while going global,
with the « coordinator » system, which has been misunderstood by many as « not
lean » as it put a Japanese coordinator next to each western executive, but it was
actually the only way, even if costly, to bring the Toyota Way to the rest of the world.
The difficulty is to know when to stop this, meaning when local people have
developed enough capabilities to function as coaches themselves, since at some
points, being coached rather than becoming the coach can become unproductive.
Though from personal experience, to get all the knowledge of a good sensei with
30-35 years of Toyota experience may take five years or more.
Description: coaching is fundamental to lean, it is the second kata of Rother [10].
Without being coached on how to perform kaizen, the employees will not contribute
every day to the continuous improvement of the whole organization to support the
customers better.
○1 Lean IT: peer programming is a practice enabling two programmers to work together and coach each other. Coaching for lean practices is an essential component of Lean IT.
○2 Lean Healthcare: the coaching of young practitioners by experimented doctors, the coaching for PDCA, 5S and other lean practices.
○3 Lean Education: it seems redundant, as coaching is the purpose of education. However, who coaches the teachers to improve the courses for their students?
○4 Lean Start-Up: a start-up starts small by definition, so it is important to find coaches and mentors outside the organization. It could be investors or so called business angels.
○5 Lean Foundation: A foundation can just fund projects, but coaching the communities receiving its support enables sustainability and better usage of funding.
○6 Immune System: thymic education: learning selection of lymphocytes in thymus, then establishment of memory in periphery.
199
14 muri, mura, muda (elimination)
無理 ムラ無駄, or ムリ、ムラ、ムダ
Method of just in time
English: waste elimination
Français : élimination des gaspillages
Origin: Ōno and the Toyota Production System: to achieve perfect flow from the
customer demand, all forms of waste should be eliminated.
Description: waste elimination starts with muri, then mura and finally muda.
• muri (無理): “no reason”, is unreasonable workload for humans or machines.
• mura (ムラ): “unevenness”, is the lack of levelling (heijunka). • muda: (無駄): waste.
Seven forms of waste are recognized, remembered with two anagrams, WORMPIT or TIMWOOD, the P in the first for “Processing” becoming an O in the second for “Over-processing” and the R for Rework becoming D for defects. Using TIMWOOD, they are muda of: Transport, material moving more than necessary, Inventory, keeping useless inventory that can become obsolete, Motion, people moving more than necessary, Waiting, waiting for another process to finish, Overproduction, produce more than what the customer needs, Over-processing, processing goods more than necessary, Defects, redoing the work because of mistakes.
○1 Lean IT: using a machine without buffer (muri), rush before go live (mura), rework due to low quality (muda).
○2 Lean Healthcare: patients waiting for doctors, nurses walking a long time for fetch drugs, expired drugs in inventory.
○3 Lean Education: learn just before an exam,
○4 Lean Start-Up: developing products that customers do not need.
○5 Lean Foundation: funding non-sustainable projects.
○6 Immune System: the human body constantly rejects waste.
200
15 hoshin kanri ⽅針管理 Process supporting kaizen and TQM
English: Compass Management, previously “policy deployment” when top down
Français : management/gestion au cap, management de la direction
Origin: This concept was introduced in Japan in the sixties to help apply Total
Quality Management (TQM) by creating policies that could be deployed in
companies to achieve the improvements requested by TQM, hence the first
translation of “policy deployment”. Panasonic, Bridgestone, Toyota and others
introduced it in the 1960’s. Akao [139] is the reference book on this subject.
Description: Management of the objectives of an organization, combining a top
down process enabling the management to deploy their policy and a bottom up
process enabling employees to submit ideas and getting them incorporated in the
organization objectives through a consensus building or nemawashi process.
○1 Lean IT: the eHoshin application described in this work is IT for hoshin, but each IT department should have its own hoshin, aligned with the business needs of the organization.
○2 Lean Healthcare: The hoshin kanri process can be used to design a hospital to be lean by design, then to run, grow and transform the hospital year after year.
○3 Lean Education: an educational program is an example of hoshin kanri for students. If students could design their own program, that would go one step further.
○4 Lean Start-Up: not applicable in the first stage of a start-up, but soon useful when the organization is growing. It is critical to recognize when this phase is starting.
○5 Lean Foundation: the Lean Foundations can increase their efficiency and use their money better by practicing hoshin kanri.
○6 Immune System: somatic diversification of gene of lymphocytes allowing specific antigen response.
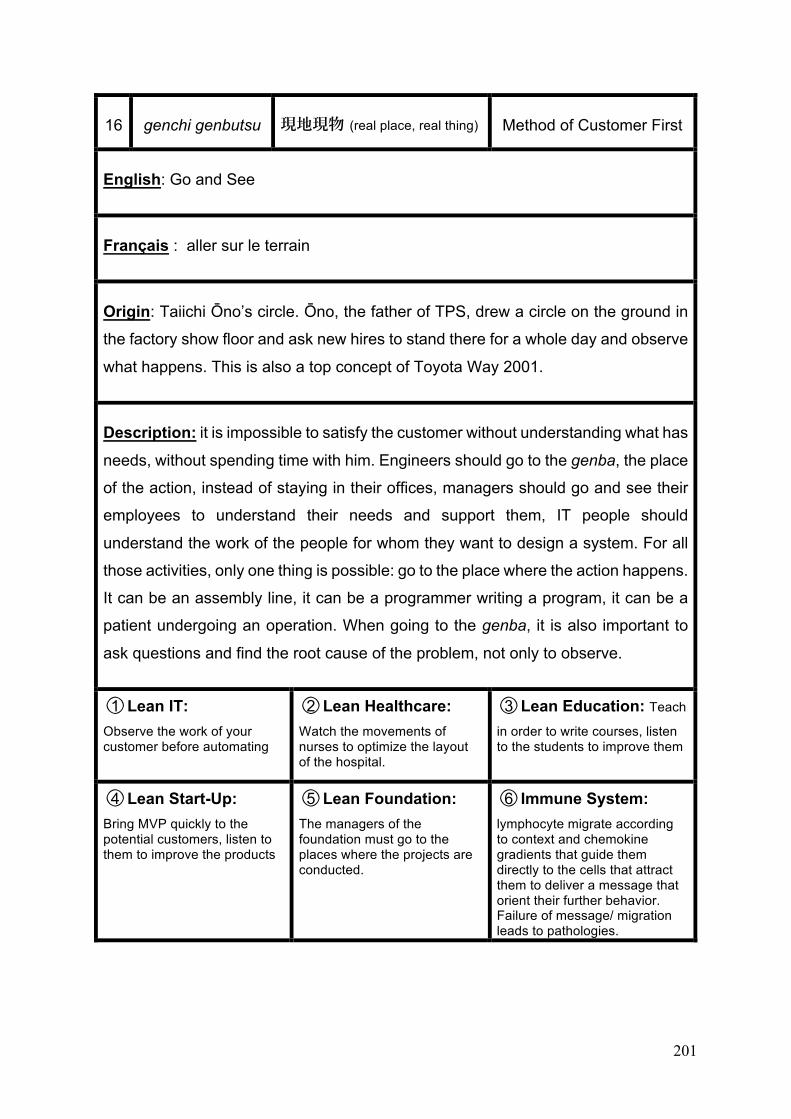
201
16 genchi genbutsu 現地現物 (real place, real thing) Method of Customer First
English: Go and See
Français : aller sur le terrain
Origin: Taiichi Ōno’s circle. Ōno, the father of TPS, drew a circle on the ground in
the factory show floor and ask new hires to stand there for a whole day and observe
what happens. This is also a top concept of Toyota Way 2001.
Description: it is impossible to satisfy the customer without understanding what has
needs, without spending time with him. Engineers should go to the genba, the place
of the action, instead of staying in their offices, managers should go and see their
employees to understand their needs and support them, IT people should
understand the work of the people for whom they want to design a system. For all
those activities, only one thing is possible: go to the place where the action happens.
It can be an assembly line, it can be a programmer writing a program, it can be a
patient undergoing an operation. When going to the genba, it is also important to
ask questions and find the root cause of the problem, not only to observe.
○1 Lean IT: Observe the work of your customer before automating
○2 Lean Healthcare: Watch the movements of nurses to optimize the layout of the hospital.
○3 Lean Education: Teach
in order to write courses, listen to the students to improve them
○4 Lean Start-Up: Bring MVP quickly to the potential customers, listen to them to improve the products
○5 Lean Foundation: The managers of the foundation must go to the places where the projects are conducted.
○6 Immune System: lymphocyte migrate according to context and chemokine gradients that guide them directly to the cells that attract them to deliver a message that orient their further behavior. Failure of message/ migration leads to pathologies.
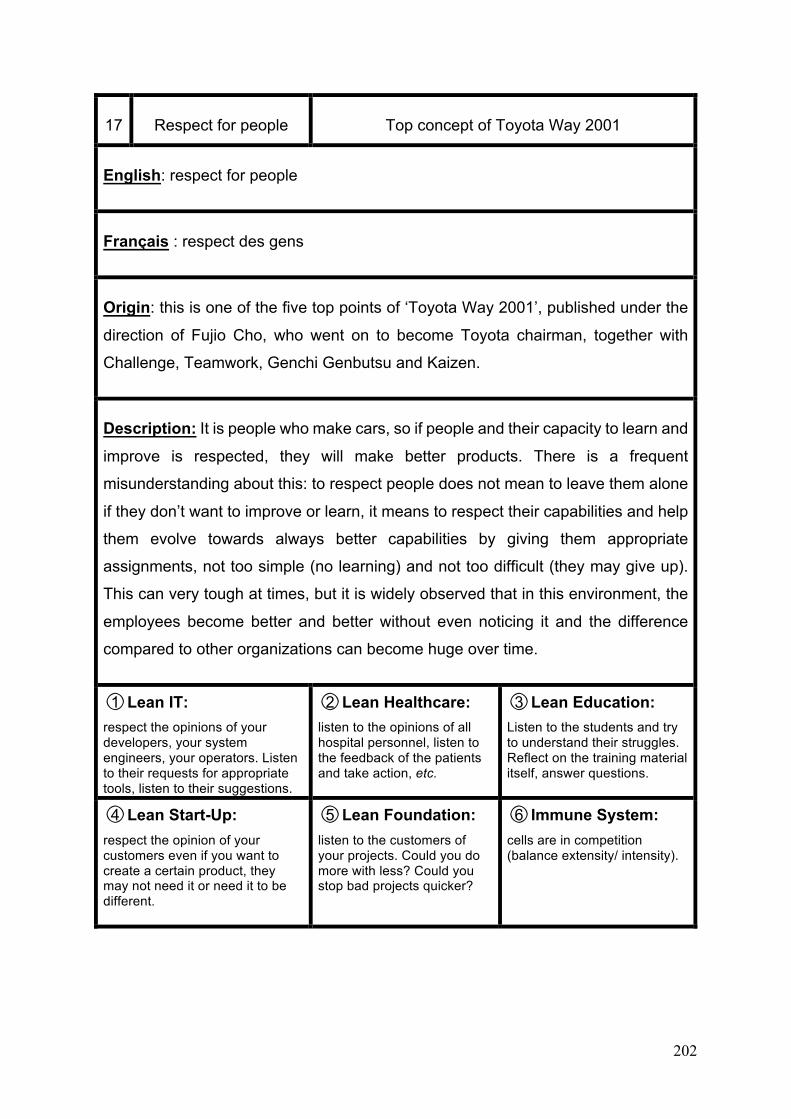
202
17 Respect for people Top concept of Toyota Way 2001
English: respect for people
Français : respect des gens
Origin: this is one of the five top points of ‘Toyota Way 2001’, published under the
direction of Fujio Cho, who went on to become Toyota chairman, together with
Challenge, Teamwork, Genchi Genbutsu and Kaizen.
Description: It is people who make cars, so if people and their capacity to learn and
improve is respected, they will make better products. There is a frequent
misunderstanding about this: to respect people does not mean to leave them alone
if they don’t want to improve or learn, it means to respect their capabilities and help
them evolve towards always better capabilities by giving them appropriate
assignments, not too simple (no learning) and not too difficult (they may give up).
This can very tough at times, but it is widely observed that in this environment, the
employees become better and better without even noticing it and the difference
compared to other organizations can become huge over time.
○1 Lean IT: respect the opinions of your developers, your system engineers, your operators. Listen to their requests for appropriate tools, listen to their suggestions.
○2 Lean Healthcare: listen to the opinions of all hospital personnel, listen to the feedback of the patients and take action, etc.
○3 Lean Education: Listen to the students and try to understand their struggles. Reflect on the training material itself, answer questions.
○4 Lean Start-Up: respect the opinion of your customers even if you want to create a certain product, they may not need it or need it to be different.
○5 Lean Foundation: listen to the customers of your projects. Could you do more with less? Could you stop bad projects quicker?
○6 Immune System: cells are in competition (balance extensity/ intensity).
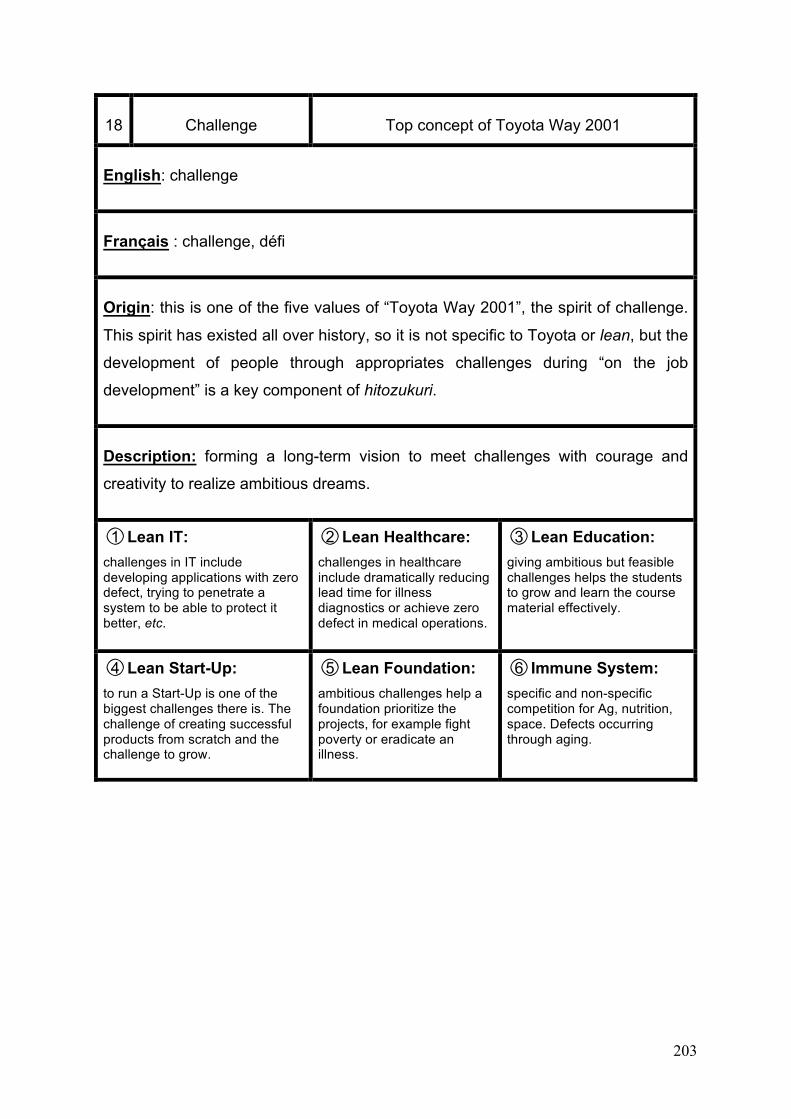
203
18 Challenge Top concept of Toyota Way 2001
English: challenge
Français : challenge, défi
Origin: this is one of the five values of “Toyota Way 2001”, the spirit of challenge.
This spirit has existed all over history, so it is not specific to Toyota or lean, but the
development of people through appropriates challenges during “on the job
development” is a key component of hitozukuri.
Description: forming a long-term vision to meet challenges with courage and
creativity to realize ambitious dreams.
○1 Lean IT: challenges in IT include developing applications with zero defect, trying to penetrate a system to be able to protect it better, etc.
○2 Lean Healthcare: challenges in healthcare include dramatically reducing lead time for illness diagnostics or achieve zero defect in medical operations.
○3 Lean Education: giving ambitious but feasible challenges helps the students to grow and learn the course material effectively.
○4 Lean Start-Up: to run a Start-Up is one of the biggest challenges there is. The challenge of creating successful products from scratch and the challenge to grow.
○5 Lean Foundation: ambitious challenges help a foundation prioritize the projects, for example fight poverty or eradicate an illness.
○6 Immune System: specific and non-specific competition for Ag, nutrition, space. Defects occurring through aging.
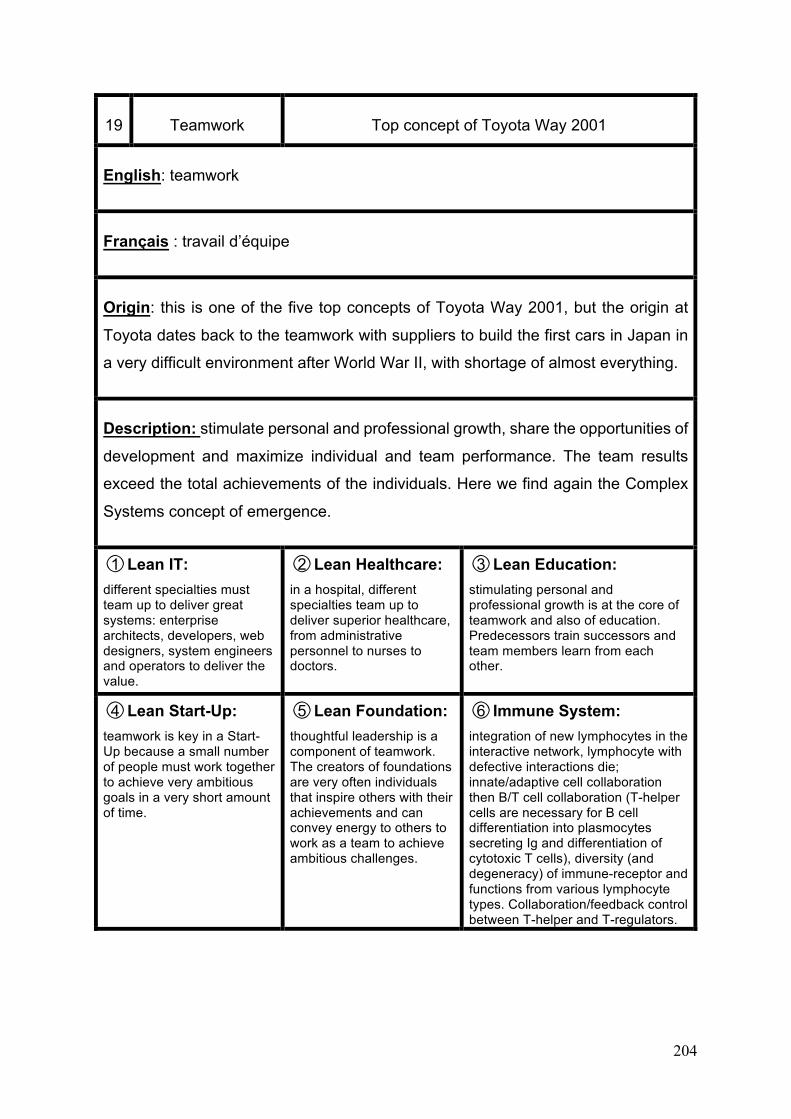
204
19 Teamwork Top concept of Toyota Way 2001
English: teamwork
Français : travail d’équipe
Origin: this is one of the five top concepts of Toyota Way 2001, but the origin at
Toyota dates back to the teamwork with suppliers to build the first cars in Japan in
a very difficult environment after World War II, with shortage of almost everything.
Description: stimulate personal and professional growth, share the opportunities of
development and maximize individual and team performance. The team results
exceed the total achievements of the individuals. Here we find again the Complex
Systems concept of emergence.
○1 Lean IT: different specialties must team up to deliver great systems: enterprise architects, developers, web designers, system engineers and operators to deliver the value.
○2 Lean Healthcare: in a hospital, different specialties team up to deliver superior healthcare, from administrative personnel to nurses to doctors.
○3 Lean Education: stimulating personal and professional growth is at the core of teamwork and also of education. Predecessors train successors and team members learn from each other.
○4 Lean Start-Up: teamwork is key in a Start-Up because a small number of people must work together to achieve very ambitious goals in a very short amount of time.
○5 Lean Foundation: thoughtful leadership is a component of teamwork. The creators of foundations are very often individuals that inspire others with their achievements and can convey energy to others to work as a team to achieve ambitious challenges.
○6 Immune System: integration of new lymphocytes in the interactive network, lymphocyte with defective interactions die; innate/adaptive cell collaboration then B/T cell collaboration (T-helper cells are necessary for B cell differentiation into plasmocytes secreting Ig and differentiation of cytotoxic T cells), diversity (and degeneracy) of immune-receptor and functions from various lymphocyte types. Collaboration/feedback control between T-helper and T-regulators.
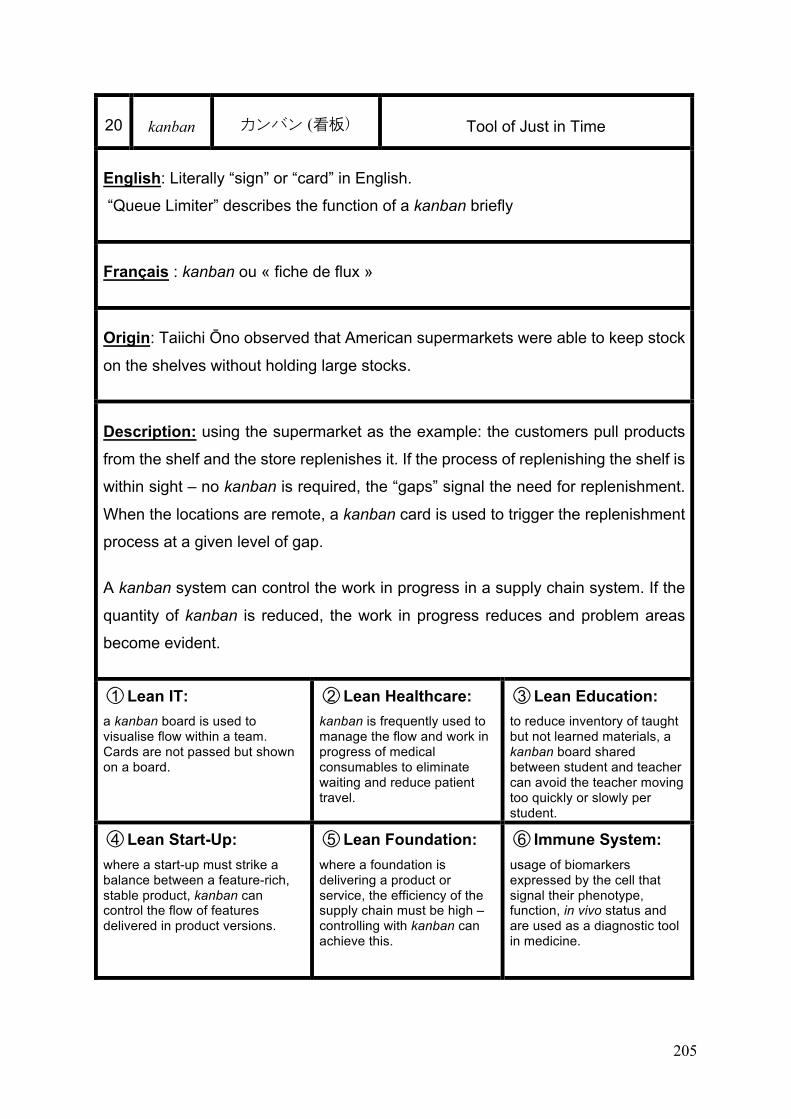
205
20 kanban カンバン (看板) Tool of Just in Time
English: Literally “sign” or “card” in English.
“Queue Limiter” describes the function of a kanban briefly
Français : kanban ou « fiche de flux »
Origin: Taiichi Ōno observed that American supermarkets were able to keep stock
on the shelves without holding large stocks.
Description: using the supermarket as the example: the customers pull products
from the shelf and the store replenishes it. If the process of replenishing the shelf is
within sight – no kanban is required, the “gaps” signal the need for replenishment.
When the locations are remote, a kanban card is used to trigger the replenishment
process at a given level of gap.
A kanban system can control the work in progress in a supply chain system. If the
quantity of kanban is reduced, the work in progress reduces and problem areas
become evident.
○1 Lean IT: a kanban board is used to visualise flow within a team. Cards are not passed but shown on a board.
○2 Lean Healthcare: kanban is frequently used to manage the flow and work in progress of medical consumables to eliminate waiting and reduce patient travel.
○3 Lean Education: to reduce inventory of taught but not learned materials, a kanban board shared between student and teacher can avoid the teacher moving too quickly or slowly per student.
○4 Lean Start-Up: where a start-up must strike a balance between a feature-rich, stable product, kanban can control the flow of features delivered in product versions.
○5 Lean Foundation: where a foundation is delivering a product or service, the efficiency of the supply chain must be high – controlling with kanban can achieve this.
○6 Immune System: usage of biomarkers expressed by the cell that signal their phenotype, function, in vivo status and are used as a diagnostic tool in medicine.
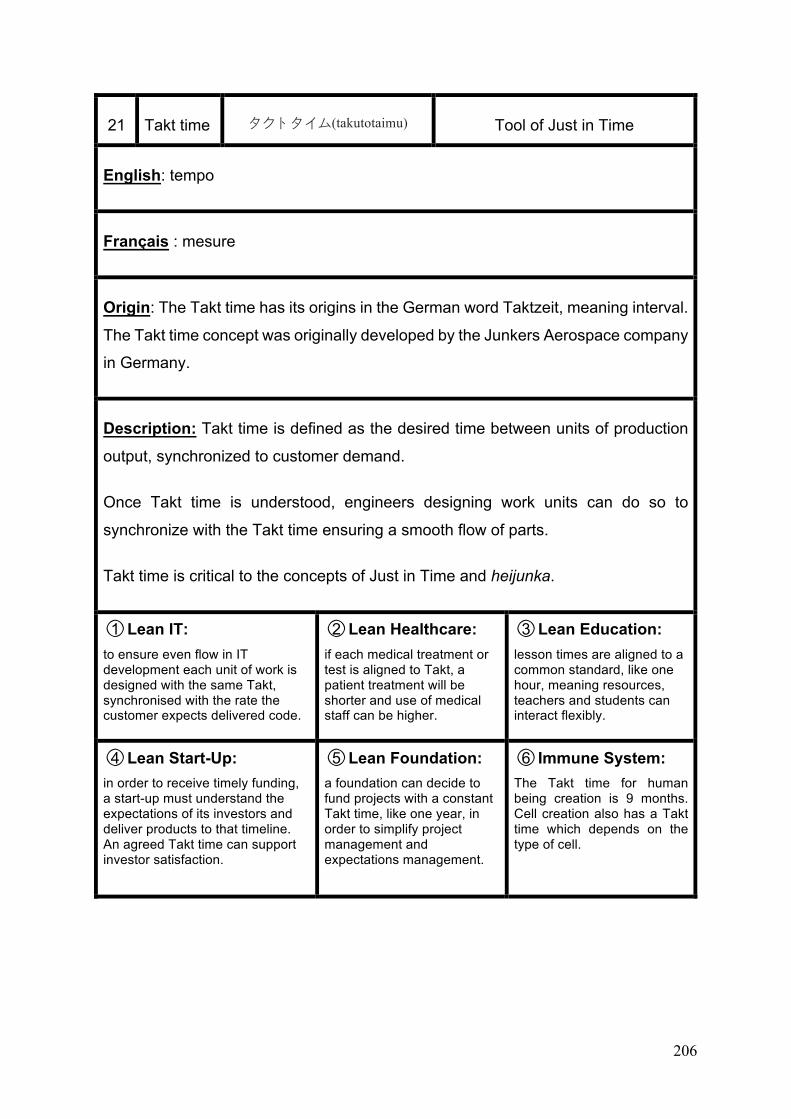
206
21 Takt time タクトタイム(takutotaimu) Tool of Just in Time
English: tempo
Français : mesure
Origin: The Takt time has its origins in the German word Taktzeit, meaning interval.
The Takt time concept was originally developed by the Junkers Aerospace company
in Germany.
Description: Takt time is defined as the desired time between units of production
output, synchronized to customer demand.
Once Takt time is understood, engineers designing work units can do so to
synchronize with the Takt time ensuring a smooth flow of parts.
Takt time is critical to the concepts of Just in Time and heijunka.
○1 Lean IT: to ensure even flow in IT development each unit of work is designed with the same Takt, synchronised with the rate the customer expects delivered code.
○2 Lean Healthcare: if each medical treatment or test is aligned to Takt, a patient treatment will be shorter and use of medical staff can be higher.
○3 Lean Education: lesson times are aligned to a common standard, like one hour, meaning resources, teachers and students can interact flexibly.
○4 Lean Start-Up: in order to receive timely funding, a start-up must understand the expectations of its investors and deliver products to that timeline. An agreed Takt time can support investor satisfaction.
○5 Lean Foundation: a foundation can decide to fund projects with a constant Takt time, like one year, in order to simplify project management and expectations management.
○6 Immune System: The Takt time for human being creation is 9 months. Cell creation also has a Takt time which depends on the type of cell.
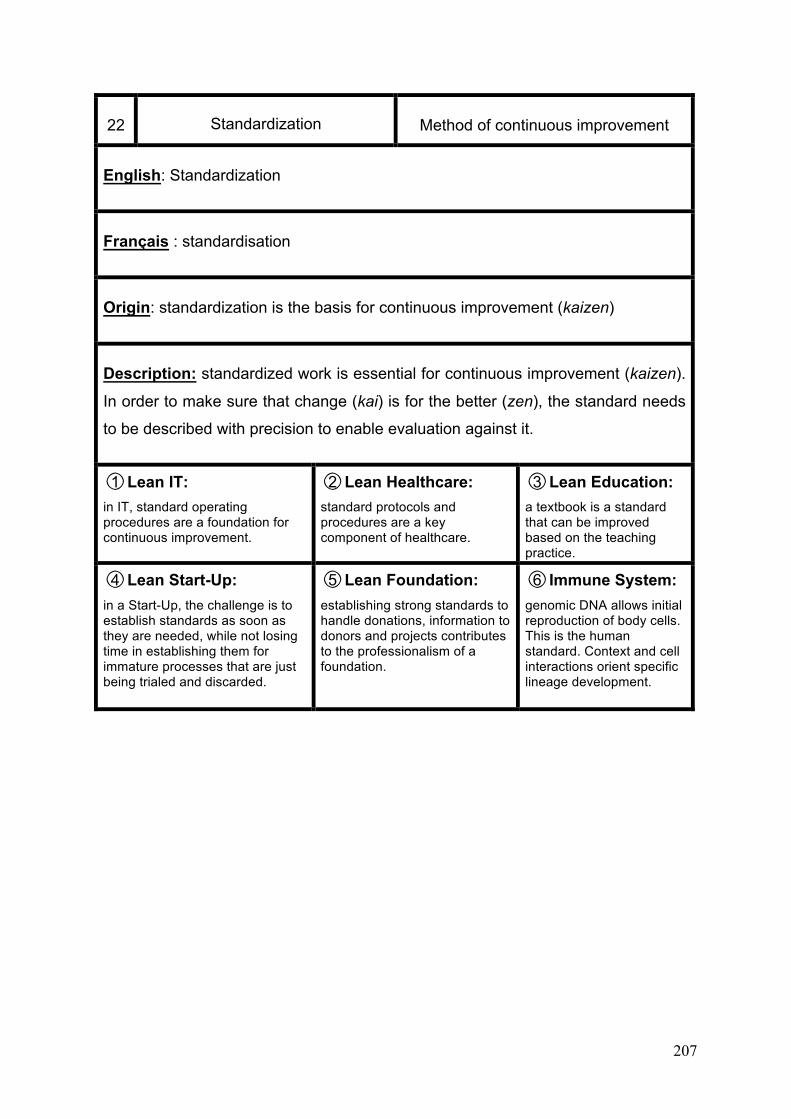
207
22 Standardization Method of continuous improvement
English: Standardization
Français : standardisation
Origin: standardization is the basis for continuous improvement (kaizen)
Description: standardized work is essential for continuous improvement (kaizen).
In order to make sure that change (kai) is for the better (zen), the standard needs
to be described with precision to enable evaluation against it.
○1 Lean IT: in IT, standard operating procedures are a foundation for continuous improvement.
○2 Lean Healthcare: standard protocols and procedures are a key component of healthcare.
○3 Lean Education: a textbook is a standard that can be improved based on the teaching practice.
○4 Lean Start-Up: in a Start-Up, the challenge is to establish standards as soon as they are needed, while not losing time in establishing them for immature processes that are just being trialed and discarded.
○5 Lean Foundation: establishing strong standards to handle donations, information to donors and projects contributes to the professionalism of a foundation.
○6 Immune System: genomic DNA allows initial reproduction of body cells. This is the human standard. Context and cell interactions orient specific lineage development.
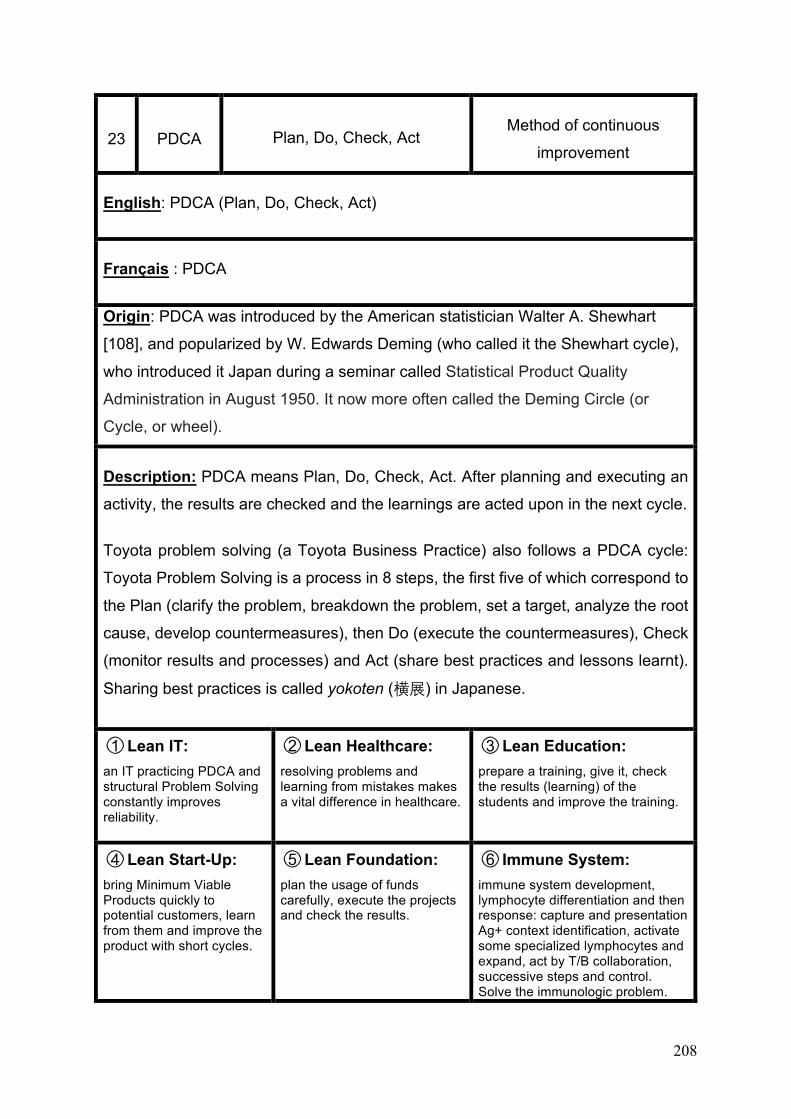
208
23 PDCA Plan, Do, Check, Act Method of continuous
improvement
English: PDCA (Plan, Do, Check, Act)
Français : PDCA
Origin: PDCA was introduced by the American statistician Walter A. Shewhart
[108], and popularized by W. Edwards Deming (who called it the Shewhart cycle),
who introduced it Japan during a seminar called Statistical Product Quality
Administration in August 1950. It now more often called the Deming Circle (or
Cycle, or wheel).
Description: PDCA means Plan, Do, Check, Act. After planning and executing an
activity, the results are checked and the learnings are acted upon in the next cycle.
Toyota problem solving (a Toyota Business Practice) also follows a PDCA cycle:
Toyota Problem Solving is a process in 8 steps, the first five of which correspond to
the Plan (clarify the problem, breakdown the problem, set a target, analyze the root
cause, develop countermeasures), then Do (execute the countermeasures), Check
(monitor results and processes) and Act (share best practices and lessons learnt).
Sharing best practices is called yokoten (横展) in Japanese.
○1 Lean IT: an IT practicing PDCA and structural Problem Solving constantly improves reliability.
○2 Lean Healthcare: resolving problems and learning from mistakes makes a vital difference in healthcare.
○3 Lean Education: prepare a training, give it, check the results (learning) of the students and improve the training.
○4 Lean Start-Up: bring Minimum Viable Products quickly to potential customers, learn from them and improve the product with short cycles.
○5 Lean Foundation: plan the usage of funds carefully, execute the projects and check the results.
○6 Immune System: immune system development, lymphocyte differentiation and then response: capture and presentation Ag+ context identification, activate some specialized lymphocytes and expand, act by T/B collaboration, successive steps and control. Solve the immunologic problem.
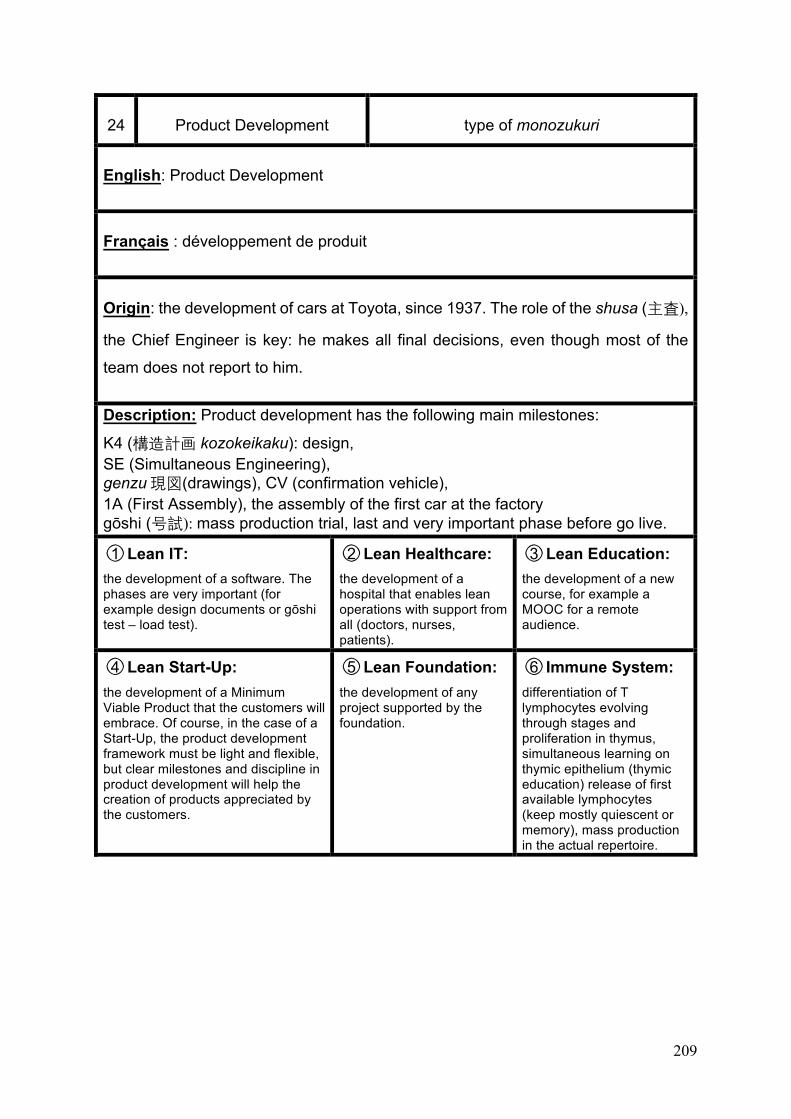
209
24 Product Development type of monozukuri
English: Product Development
Français : développement de produit
Origin: the development of cars at Toyota, since 1937. The role of the shusa (主査),
the Chief Engineer is key: he makes all final decisions, even though most of the
team does not report to him.
Description: Product development has the following main milestones:
K4 (構造計画 kozokeikaku): design, SE (Simultaneous Engineering), genzu現図(drawings), CV (confirmation vehicle), 1A (First Assembly), the assembly of the first car at the factory gōshi (号試): mass production trial, last and very important phase before go live.
○1 Lean IT: the development of a software. The phases are very important (for example design documents or gōshi test – load test).
○2 Lean Healthcare: the development of a hospital that enables lean operations with support from all (doctors, nurses, patients).
○3 Lean Education: the development of a new course, for example a MOOC for a remote audience.
○4 Lean Start-Up: the development of a Minimum Viable Product that the customers will embrace. Of course, in the case of a Start-Up, the product development framework must be light and flexible, but clear milestones and discipline in product development will help the creation of products appreciated by the customers.
○5 Lean Foundation: the development of any project supported by the foundation.
○6 Immune System: differentiation of T lymphocytes evolving through stages and proliferation in thymus, simultaneous learning on thymic epithelium (thymic education) release of first available lymphocytes (keep mostly quiescent or memory), mass production in the actual repertoire.
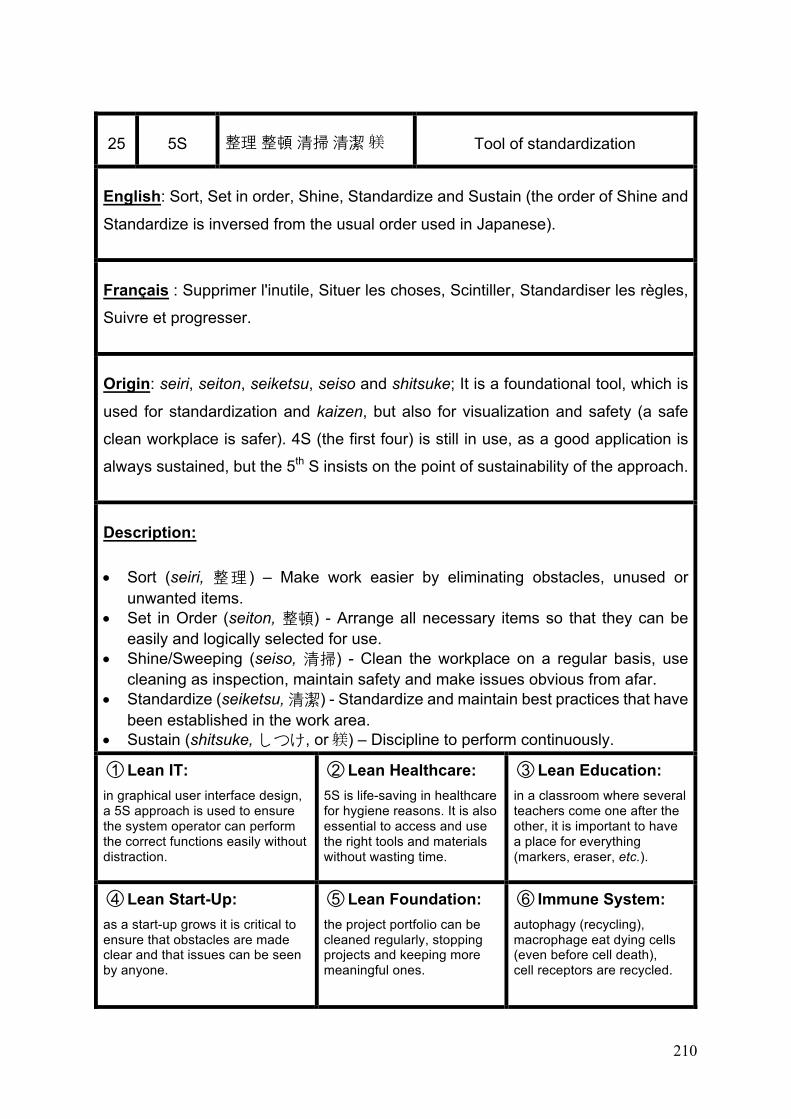
210
25 5S 整理 整頓 清掃 清潔 躾 Tool of standardization
English: Sort, Set in order, Shine, Standardize and Sustain (the order of Shine and
Standardize is inversed from the usual order used in Japanese).
Français : Supprimer l'inutile, Situer les choses, Scintiller, Standardiser les règles,
Suivre et progresser.
Origin: seiri, seiton, seiketsu, seiso and shitsuke; It is a foundational tool, which is
used for standardization and kaizen, but also for visualization and safety (a safe
clean workplace is safer). 4S (the first four) is still in use, as a good application is
always sustained, but the 5th S insists on the point of sustainability of the approach.
Description:
• Sort (seiri, 整理 ) – Make work easier by eliminating obstacles, unused or unwanted items.
• Set in Order (seiton, 整頓) - Arrange all necessary items so that they can be easily and logically selected for use.
• Shine/Sweeping (seiso, 清掃) - Clean the workplace on a regular basis, use cleaning as inspection, maintain safety and make issues obvious from afar.
• Standardize (seiketsu, 清潔) - Standardize and maintain best practices that have been established in the work area.
• Sustain (shitsuke, しつけ, or躾) – Discipline to perform continuously.
○1 Lean IT: in graphical user interface design, a 5S approach is used to ensure the system operator can perform the correct functions easily without distraction.
○2 Lean Healthcare: 5S is life-saving in healthcare for hygiene reasons. It is also essential to access and use the right tools and materials without wasting time.
○3 Lean Education: in a classroom where several teachers come one after the other, it is important to have a place for everything (markers, eraser, etc.).
○4 Lean Start-Up: as a start-up grows it is critical to ensure that obstacles are made clear and that issues can be seen by anyone.
○5 Lean Foundation: the project portfolio can be cleaned regularly, stopping projects and keeping more meaningful ones.
○6 Immune System: autophagy (recycling), macrophage eat dying cells (even before cell death), cell receptors are recycled.
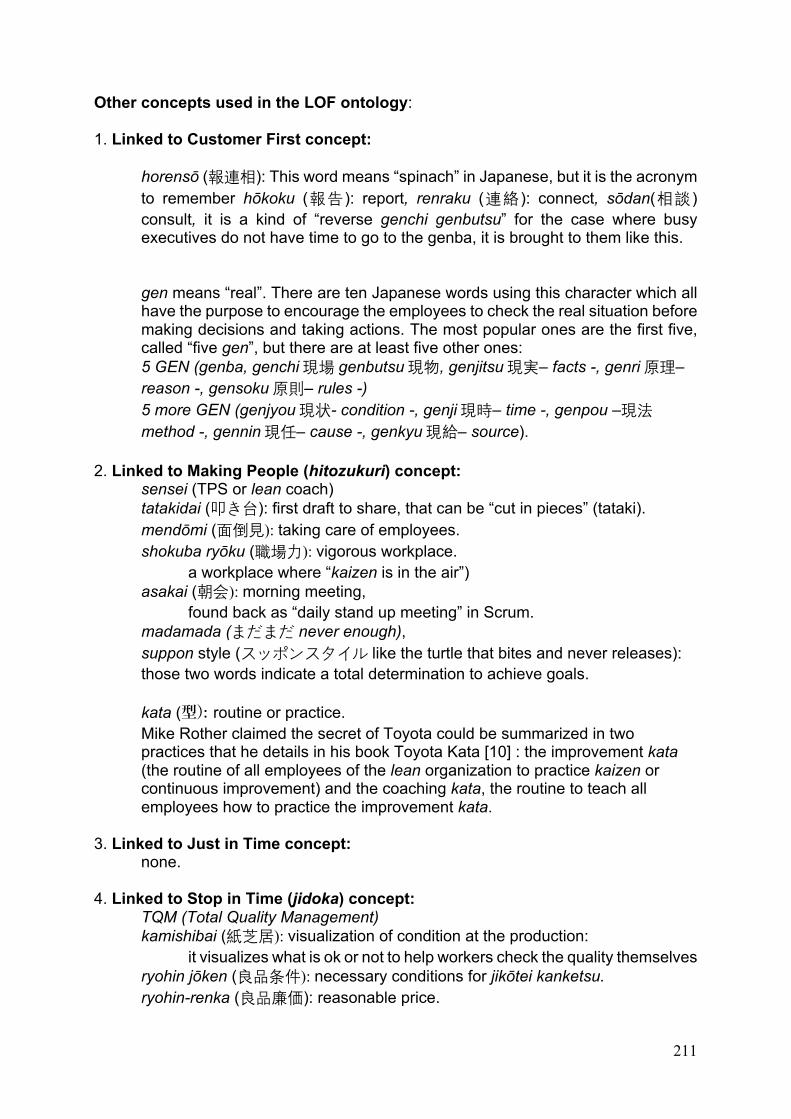
211
Other concepts used in the LOF ontology: 1. Linked to Customer First concept:
horensō (報連相): This word means “spinach” in Japanese, but it is the acronym to remember hōkoku (報告): report, renraku (連絡): connect, sōdan(相談) consult, it is a kind of “reverse genchi genbutsu” for the case where busy executives do not have time to go to the genba, it is brought to them like this. gen means “real”. There are ten Japanese words using this character which all have the purpose to encourage the employees to check the real situation before making decisions and taking actions. The most popular ones are the first five, called “five gen”, but there are at least five other ones: 5 GEN (genba, genchi現場 genbutsu現物, genjitsu現実– facts -, genri原理– reason -, gensoku原則– rules -) 5 more GEN (genjyou現状- condition -, genji現時– time -, genpou –現法method -, gennin現任– cause -, genkyu現給– source).
2. Linked to Making People (hitozukuri) concept: sensei (TPS or lean coach)
tatakidai (叩き台): first draft to share, that can be “cut in pieces” (tataki). mendōmi (面倒見): taking care of employees. shokuba ryōku (職場力): vigorous workplace.
a workplace where “kaizen is in the air”) asakai (朝会): morning meeting,
found back as “daily stand up meeting” in Scrum. madamada (まだまだ never enough), suppon style (スッポンスタイル like the turtle that bites and never releases): those two words indicate a total determination to achieve goals. kata (型): routine or practice. Mike Rother claimed the secret of Toyota could be summarized in two practices that he details in his book Toyota Kata [10] : the improvement kata (the routine of all employees of the lean organization to practice kaizen or continuous improvement) and the coaching kata, the routine to teach all employees how to practice the improvement kata.
3. Linked to Just in Time concept:
none.
4. Linked to Stop in Time (jidoka) concept: TQM (Total Quality Management)
kamishibai (紙芝居): visualization of condition at the production: it visualizes what is ok or not to help workers check the quality themselves
ryohin jōken (良品条件): necessary conditions for jikōtei kanketsu. ryohin-renka (良品廉価): reasonable price.
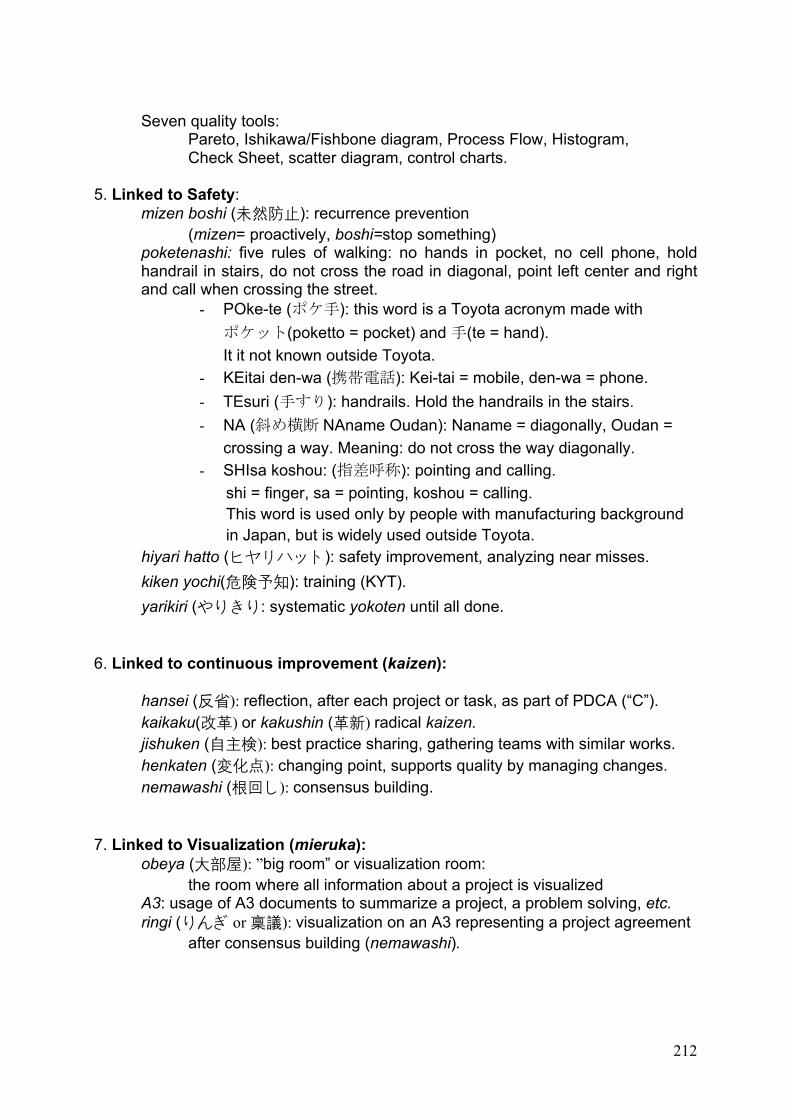
212
Seven quality tools:
Pareto, Ishikawa/Fishbone diagram, Process Flow, Histogram, Check Sheet, scatter diagram, control charts.
5. Linked to Safety:
mizen boshi (未然防止): recurrence prevention (mizen= proactively, boshi=stop something)
poketenashi: five rules of walking: no hands in pocket, no cell phone, hold handrail in stairs, do not cross the road in diagonal, point left center and right and call when crossing the street.
- POke-te (ポケ手): this word is a Toyota acronym made with ポケット(poketto = pocket) and 手(te = hand). It it not known outside Toyota.
- KEitai den-wa (携帯電話): Kei-tai = mobile, den-wa = phone. - TEsuri (手すり): handrails. Hold the handrails in the stairs. - NA (斜め横断 NAname Oudan): Naname = diagonally, Oudan =
crossing a way. Meaning: do not cross the way diagonally. - SHIsa koshou: (指差呼称): pointing and calling.
shi = finger, sa = pointing, koshou = calling. This word is used only by people with manufacturing background in Japan, but is widely used outside Toyota.
hiyari hatto (ヒヤリハット): safety improvement, analyzing near misses. kiken yochi(危険予知): training (KYT). yarikiri (やりきり: systematic yokoten until all done.
6. Linked to continuous improvement (kaizen): hansei (反省): reflection, after each project or task, as part of PDCA (“C”). kaikaku(改革) or kakushin (革新) radical kaizen. jishuken (自主検): best practice sharing, gathering teams with similar works. henkaten (変化点): changing point, supports quality by managing changes. nemawashi (根回し): consensus building. 7. Linked to Visualization (mieruka): obeya (大部屋): ”big room” or visualization room:
the room where all information about a project is visualized A3: usage of A3 documents to summarize a project, a problem solving, etc. ringi (りんぎ or 稟議): visualization on an A3 representing a project agreement
after consensus building (nemawashi).
213
8. Linked to monozukuri: SMED (シングル段取り): Single Minute Exchange of Dies
in order to achieve levelling (heijunka) of the production, it was necessary to reduce dramatically the time needed to exchange the dies, from hours to less than ten minutes. Shigeo Shingo supported Taiichi Ōno to achieve this, a good example of target setting without knowing yet how to achieve.
yosedome寄せ止め: suppression of machines, production lines, servers, etc. after optimization. yamazumi (山積み or 山積): mountain chart to show the usage of resources
over time. gentan-i (原単位): basic KPI, like the cost of an e-mail per person per month minotake (comparison to a benchmark, like for headcount) keshikomi (ケシコミ or 消し込み):
systematic checklist of items for project completion. kukuri (くくり or 括り):
grouping of machines to optimize production. karakuri (からくり or カラクリ)
mechanical device using gravity instead of electricity. kodawari (こだわり or コダワリ): focus point.
example: the kodawari of Toyota is TPS. teitei (定定) synchronization, tei = stable. chaku-chaku (着々): well prepared standardization, step by step. sarasara (さらさら or サラサラ):
said of a dolly to bring parts to production, smooth and safe. mizusumashi (水すまし): water spider. It stands for ‘a worker who picks and
delivers parts from stores to processes.’ The name came from the movement of the worker, which is busy to go around many places, looks like a water spider. There are also mizusumashi devices (dollies).
tsurube (つるべ ): “water bucket”, to connect two asynchronous processes temotoka (手もと化 or手許化): being close to the hand.
within own understanding, at hand – used in production for ensuring the workers have all necessary tools at hand.
hikiate (引当): bill of materials. jundate (順建て、順立て): building the car order.
hinban (品番): part number in 10 digits. buishuyakuka (部位集約化): module management. soui-kufu (創意工夫): suggestion system.
214
INDEX
5S, 25, 31, 65, 99, 185, 193, 198, 210
A3, 29, 58, 69, 79, 80, 90, 129, 130, 134,
212
andon, 11, 57, 82, 87, 193, 196
coaching kata, 21, 58, 61, 122, 211
Customer First, 11, 23, 30, 57, 59, 60, 61,
62, 63, 64, 65, 67, 70, 78, 82, 83, 87, 97,
100, 110, 154, 186, 201, 211
ERH
European Regional Hoshin, 149, 151
European Regional Hoshin, 147, 149
five why, 75
genba, 21, 24, 25, 61, 67, 186, 201, 211
hansei, 106, 123, 125, 137, 186, 212
heijunka, 23, 58, 66, 199, 206, 213
hitozukuri, 20, 58, 61, 62, 67, 72, 82, 85,
110, 154, 162, 188, 198, 203, 211
hoshin, 6, 11, 13, 14, 15, 29, 33, 57, 64, 67,
70, 113, 125, 126, 127, 128, 130, 131,
132, 133, 134, 136, 137, 138, 139, 140,
141, 142, 143, 144, 145, 146, 147, 148,
149, 151, 152, 153, 154, 155, 156, 158,
161, 162, 163, 164, 165, 185, 200, 219,
220, 221, 223, 224, 226
hoshin kanri, 13, 33, 57, 64, 67, 70, 125,
126, 127, 128, 130, 131, 132, 133, 134,
136, 137, 138, 141, 163, 165, 185, 200
improvement kata, 21, 61, 211
jidoka, 13, 40, 57, 58, 60, 63, 64, 66, 68, 74,
75, 76, 77, 82, 86, 87, 97, 102, 110, 137,
164, 185, 190, 195, 196, 197, 211
jikotei kanketsu, 81, 97
Just in Time, 11, 13, 40, 57, 58, 60, 63, 64,
65, 68, 73, 82, 85, 86, 97, 100, 101, 104,
110, 137, 154, 164, 185, 189, 205, 206,
211
kaizen, 11, 21, 22, 59, 60, 61, 63, 64, 66, 68,
69, 76, 77, 78, 79, 80, 82, 86, 88, 89, 94,
97, 100, 103, 111, 154, 155, 156, 161,
162, 164, 168, 185, 192, 198, 200, 207,
210, 211, 212
kanban, 8, 25, 92, 93, 178, 185, 205
kata, 11, 19, 21, 22, 44, 57, 198, 211
mieruka, 11, 29, 60, 61, 63, 69, 79, 80, 82,
89, 111, 154, 193, 212
monozukuri, 20, 29, 58, 60, 61, 63, 69, 80,
82, 88, 93, 111, 188, 194, 209, 213
muda, 58, 66, 74, 98, 199
mura, 58, 66, 169, 171, 199
muri, 58, 66, 98, 199
nemawashi, 8, 58, 69, 123, 124, 125, 126,
127, 129, 130, 131, 132, 134, 135, 136,
137, 138, 155, 161, 200, 212, 219, 221,
222, 223
obeya, 24, 29, 76, 79
PDCA, 8, 58, 69, 80, 82, 89, 90, 106, 123,
144, 155, 181, 185, 192, 198, 208, 212
pokayoke, 11, 57, 65, 191, 197
215
poketenashi, 59, 212
Respect for people, 68, 76, 202
safety, 11, 13, 41, 59, 63, 68, 76, 77, 82, 87,
110, 111, 179, 191, 210, 212
sensei, 3, 23, 58, 123, 188, 198, 211
shusa, 64, 209
Stakeholder Satisfaction, 70, 82, 84, 110,
187
standardization, 24, 59, 61, 64, 66, 69, 77,
79, 82, 88, 111, 154, 192, 207, 210, 213
Stop in Time, 13, 40, 57, 58, 59, 63, 64, 66,
74, 75, 77, 82, 86, 97, 102, 110, 137, 164,
190, 211, Voir jidoka
waste, 13, 19, 20, 22, 23, 24, 27, 30, 57, 58,
62, 64, 66, 67, 74, 85, 86, 98, 111, 185,
189, 199
waste (muda), 74

217
Appendix 2 –
Second experiment programs

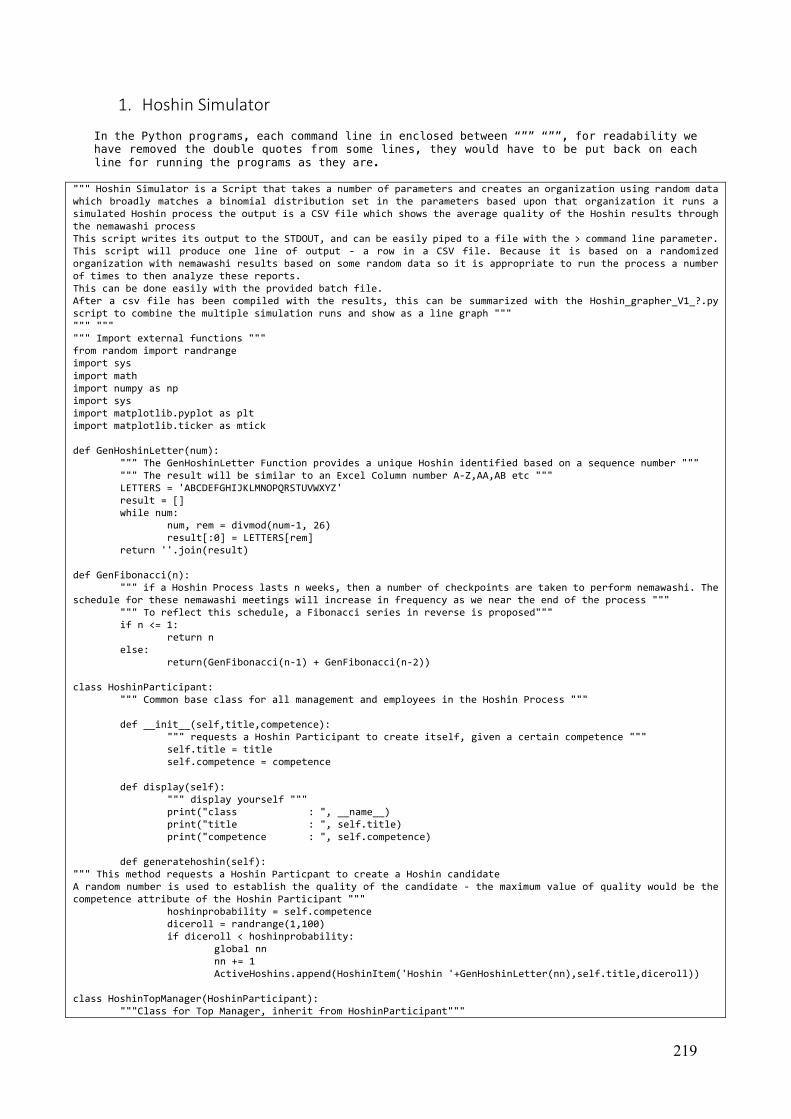
219
1. HoshinSimulator
In the Python programs, each command line in enclosed between “”” “””, for readability we have removed the double quotes from some lines, they would have to be put back on each line for running the programs as they are.
""" Hoshin Simulator is a Script that takes a number of parameters and creates an organization using random data which broadly matches a binomial distribution set in the parameters based upon that organization it runs a simulated Hoshin process the output is a CSV file which shows the average quality of the Hoshin results through the nemawashi process This script writes its output to the STDOUT, and can be easily piped to a file with the > command line parameter. This script will produce one line of output - a row in a CSV file. Because it is based on a randomized organization with nemawashi results based on some random data so it is appropriate to run the process a number of times to then analyze these reports. This can be done easily with the provided batch file. After a csv file has been compiled with the results, this can be summarized with the Hoshin_grapher_V1_?.py script to combine the multiple simulation runs and show as a line graph """ """ """ """ Import external functions """ from random import randrange import sys import math import numpy as np import sys import matplotlib.pyplot as plt import matplotlib.ticker as mtick def GenHoshinLetter(num): """ The GenHoshinLetter Function provides a unique Hoshin identified based on a sequence number """ """ The result will be similar to an Excel Column number A-Z,AA,AB etc """ LETTERS = 'ABCDEFGHIJKLMNOPQRSTUVWXYZ' result = [] while num: num, rem = divmod(num-1, 26) result[:0] = LETTERS[rem] return ''.join(result) def GenFibonacci(n): """ if a Hoshin Process lasts n weeks, then a number of checkpoints are taken to perform nemawashi. The schedule for these nemawashi meetings will increase in frequency as we near the end of the process """ """ To reflect this schedule, a Fibonacci series in reverse is proposed""" if n <= 1: return n else: return(GenFibonacci(n-1) + GenFibonacci(n-2)) class HoshinParticipant: """ Common base class for all management and employees in the Hoshin Process """ def __init__(self,title,competence): """ requests a Hoshin Participant to create itself, given a certain competence """ self.title = title self.competence = competence def display(self): """ display yourself """ print("class : ", __name__) print("title : ", self.title) print("competence : ", self.competence) def generatehoshin(self): """ This method requests a Hoshin Particpant to create a Hoshin candidate A random number is used to establish the quality of the candidate - the maximum value of quality would be the competence attribute of the Hoshin Participant """ hoshinprobability = self.competence diceroll = randrange(1,100) if diceroll < hoshinprobability: global nn nn += 1 ActiveHoshins.append(HoshinItem('Hoshin '+GenHoshinLetter(nn),self.title,diceroll)) class HoshinTopManager(HoshinParticipant): """Class for Top Manager, inherit from HoshinParticipant"""
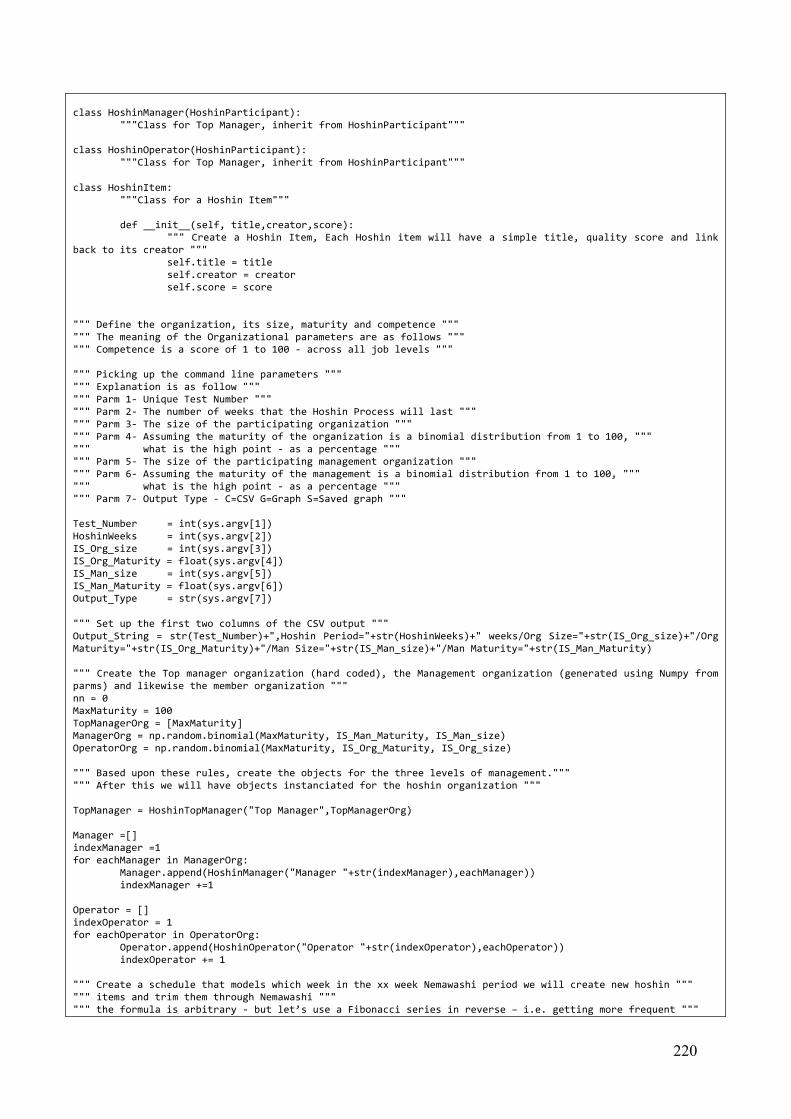
220
class HoshinManager(HoshinParticipant): """Class for Top Manager, inherit from HoshinParticipant""" class HoshinOperator(HoshinParticipant): """Class for Top Manager, inherit from HoshinParticipant""" class HoshinItem: """Class for a Hoshin Item""" def __init__(self, title,creator,score): """ Create a Hoshin Item, Each Hoshin item will have a simple title, quality score and link back to its creator """ self.title = title self.creator = creator self.score = score """ Define the organization, its size, maturity and competence """ """ The meaning of the Organizational parameters are as follows """ """ Competence is a score of 1 to 100 - across all job levels """ """ Picking up the command line parameters """ """ Explanation is as follow """ """ Parm 1- Unique Test Number """ """ Parm 2- The number of weeks that the Hoshin Process will last """ """ Parm 3- The size of the participating organization """ """ Parm 4- Assuming the maturity of the organization is a binomial distribution from 1 to 100, """ """ what is the high point - as a percentage """ """ Parm 5- The size of the participating management organization """ """ Parm 6- Assuming the maturity of the management is a binomial distribution from 1 to 100, """ """ what is the high point - as a percentage """ """ Parm 7- Output Type - C=CSV G=Graph S=Saved graph """ Test_Number = int(sys.argv[1]) HoshinWeeks = int(sys.argv[2]) IS_Org_size = int(sys.argv[3]) IS_Org_Maturity = float(sys.argv[4]) IS_Man_size = int(sys.argv[5]) IS_Man_Maturity = float(sys.argv[6]) Output_Type = str(sys.argv[7]) """ Set up the first two columns of the CSV output """ Output_String = str(Test_Number)+",Hoshin Period="+str(HoshinWeeks)+" weeks/Org Size="+str(IS_Org_size)+"/Org Maturity="+str(IS_Org_Maturity)+"/Man Size="+str(IS_Man_size)+"/Man Maturity="+str(IS_Man_Maturity) """ Create the Top manager organization (hard coded), the Management organization (generated using Numpy from parms) and likewise the member organization """ nn = 0 MaxMaturity = 100 TopManagerOrg = [MaxMaturity] ManagerOrg = np.random.binomial(MaxMaturity, IS_Man_Maturity, IS_Man_size) OperatorOrg = np.random.binomial(MaxMaturity, IS_Org_Maturity, IS_Org_size) """ Based upon these rules, create the objects for the three levels of management.""" """ After this we will have objects instanciated for the hoshin organization """ TopManager = HoshinTopManager("Top Manager",TopManagerOrg) Manager =[] indexManager =1 for eachManager in ManagerOrg: Manager.append(HoshinManager("Manager "+str(indexManager),eachManager)) indexManager +=1 Operator = [] indexOperator = 1 for eachOperator in OperatorOrg: Operator.append(HoshinOperator("Operator "+str(indexOperator),eachOperator)) indexOperator += 1 """ Create a schedule that models which week in the xx week Nemawashi period we will create new hoshin """ """ items and trim them through Nemawashi """ """ the formula is arbitrary - but let’s use a Fibonacci series in reverse – i.e. getting more frequent """
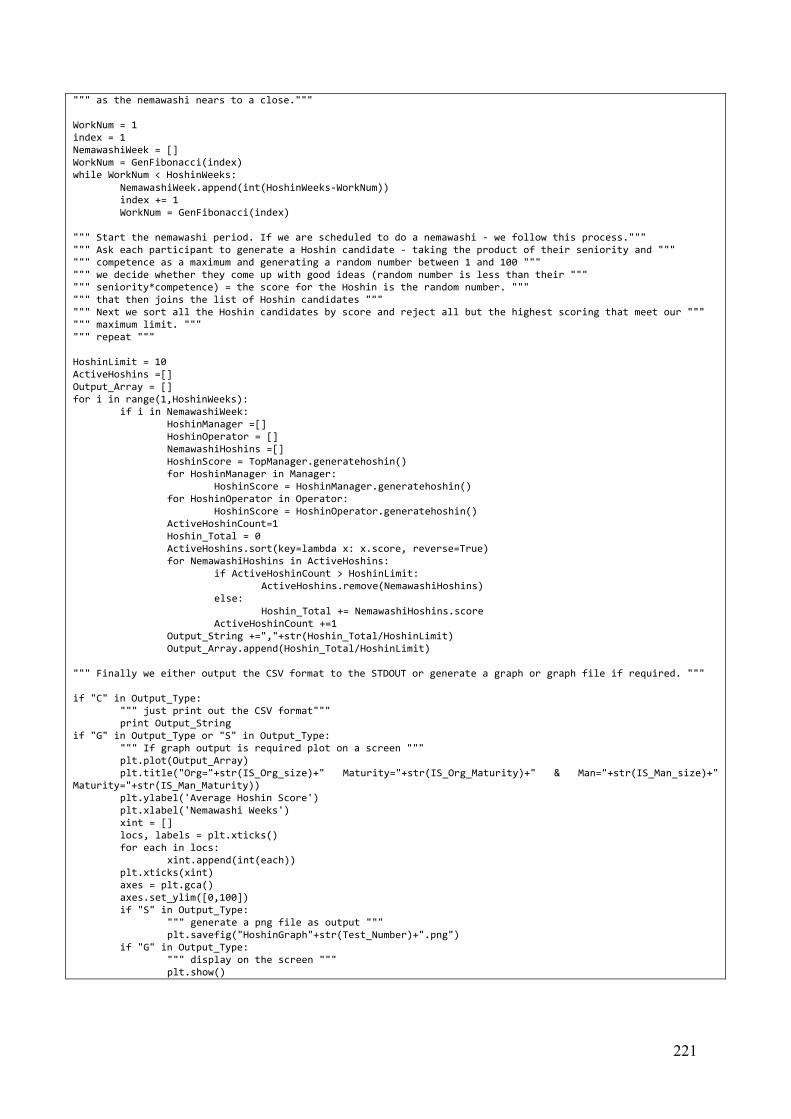
221
""" as the nemawashi nears to a close.""" WorkNum = 1 index = 1 NemawashiWeek = [] WorkNum = GenFibonacci(index) while WorkNum < HoshinWeeks: NemawashiWeek.append(int(HoshinWeeks-WorkNum)) index += 1 WorkNum = GenFibonacci(index) """ Start the nemawashi period. If we are scheduled to do a nemawashi - we follow this process.""" """ Ask each participant to generate a Hoshin candidate - taking the product of their seniority and """ """ competence as a maximum and generating a random number between 1 and 100 """ """ we decide whether they come up with good ideas (random number is less than their """ """ seniority*competence) = the score for the Hoshin is the random number. """ """ that then joins the list of Hoshin candidates """ """ Next we sort all the Hoshin candidates by score and reject all but the highest scoring that meet our """ """ maximum limit. """ """ repeat """ HoshinLimit = 10 ActiveHoshins =[] Output_Array = [] for i in range(1,HoshinWeeks): if i in NemawashiWeek: HoshinManager =[] HoshinOperator = [] NemawashiHoshins =[] HoshinScore = TopManager.generatehoshin() for HoshinManager in Manager: HoshinScore = HoshinManager.generatehoshin() for HoshinOperator in Operator: HoshinScore = HoshinOperator.generatehoshin() ActiveHoshinCount=1 Hoshin_Total = 0 ActiveHoshins.sort(key=lambda x: x.score, reverse=True) for NemawashiHoshins in ActiveHoshins: if ActiveHoshinCount > HoshinLimit: ActiveHoshins.remove(NemawashiHoshins) else: Hoshin_Total += NemawashiHoshins.score ActiveHoshinCount +=1 Output_String +=","+str(Hoshin_Total/HoshinLimit) Output_Array.append(Hoshin_Total/HoshinLimit) """ Finally we either output the CSV format to the STDOUT or generate a graph or graph file if required. """ if "C" in Output_Type: """ just print out the CSV format""" print Output_String if "G" in Output_Type or "S" in Output_Type: """ If graph output is required plot on a screen """ plt.plot(Output_Array) plt.title("Org="+str(IS_Org_size)+" Maturity="+str(IS_Org_Maturity)+" & Man="+str(IS_Man_size)+" Maturity="+str(IS_Man_Maturity)) plt.ylabel('Average Hoshin Score') plt.xlabel('Nemawashi Weeks') xint = [] locs, labels = plt.xticks() for each in locs: xint.append(int(each)) plt.xticks(xint) axes = plt.gca() axes.set_ylim([0,100]) if "S" in Output_Type: """ generate a png file as output """ plt.savefig("HoshinGraph"+str(Test_Number)+".png") if "G" in Output_Type: """ display on the screen """ plt.show()
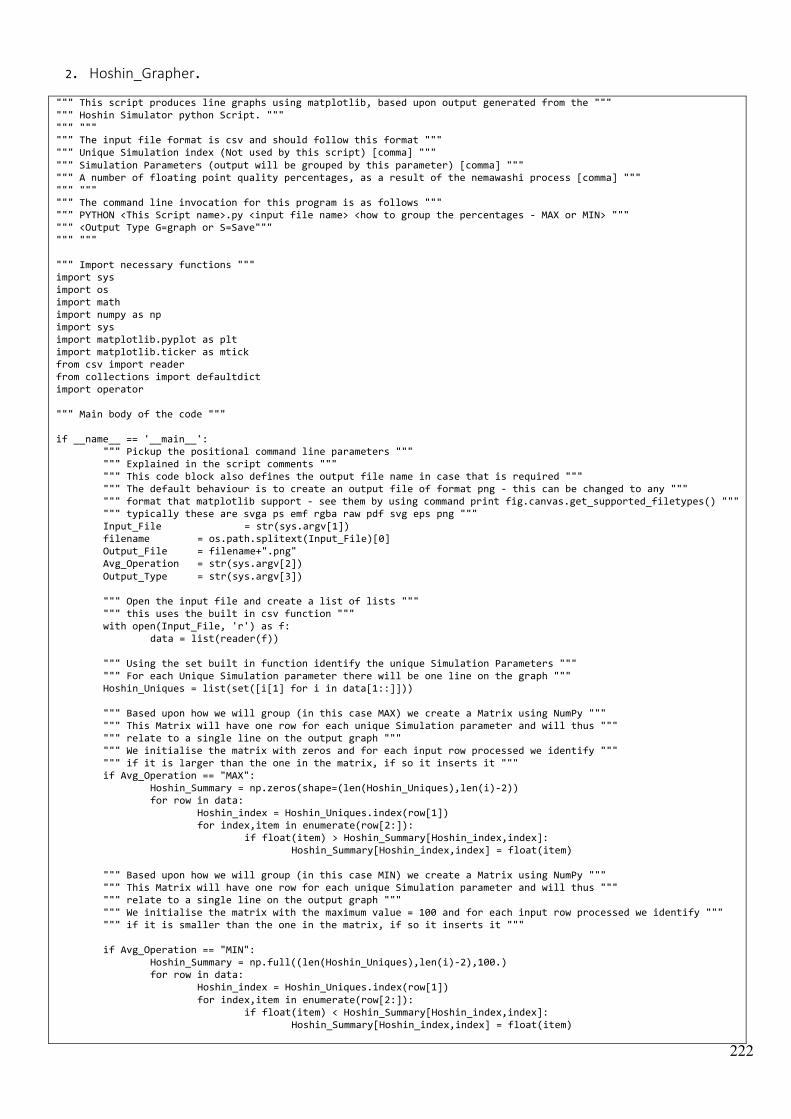
222
2. Hoshin_Grapher.
""" This script produces line graphs using matplotlib, based upon output generated from the """ """ Hoshin Simulator python Script. """ """ """ """ The input file format is csv and should follow this format """ """ Unique Simulation index (Not used by this script) [comma] """ """ Simulation Parameters (output will be grouped by this parameter) [comma] """ """ A number of floating point quality percentages, as a result of the nemawashi process [comma] """ """ """ """ The command line invocation for this program is as follows """ """ PYTHON <This Script name>.py <input file name> <how to group the percentages - MAX or MIN> """ """ <Output Type G=graph or S=Save""" """ """ """ Import necessary functions """ import sys import os import math import numpy as np import sys import matplotlib.pyplot as plt import matplotlib.ticker as mtick from csv import reader from collections import defaultdict import operator """ Main body of the code """ if __name__ == '__main__': """ Pickup the positional command line parameters """ """ Explained in the script comments """ """ This code block also defines the output file name in case that is required """ """ The default behaviour is to create an output file of format png - this can be changed to any """ """ format that matplotlib support - see them by using command print fig.canvas.get_supported_filetypes() """ """ typically these are svga ps emf rgba raw pdf svg eps png """ Input_File = str(sys.argv[1]) filename = os.path.splitext(Input_File)[0] Output_File = filename+".png" Avg_Operation = str(sys.argv[2]) Output_Type = str(sys.argv[3]) """ Open the input file and create a list of lists """ """ this uses the built in csv function """ with open(Input_File, 'r') as f: data = list(reader(f)) """ Using the set built in function identify the unique Simulation Parameters """ """ For each Unique Simulation parameter there will be one line on the graph """ Hoshin_Uniques = list(set([i[1] for i in data[1::]])) """ Based upon how we will group (in this case MAX) we create a Matrix using NumPy """ """ This Matrix will have one row for each unique Simulation parameter and will thus """ """ relate to a single line on the output graph """ """ We initialise the matrix with zeros and for each input row processed we identify """ """ if it is larger than the one in the matrix, if so it inserts it """ if Avg_Operation == "MAX": Hoshin_Summary = np.zeros(shape=(len(Hoshin_Uniques),len(i)-2)) for row in data: Hoshin_index = Hoshin_Uniques.index(row[1]) for index,item in enumerate(row[2:]): if float(item) > Hoshin_Summary[Hoshin_index,index]: Hoshin_Summary[Hoshin_index,index] = float(item) """ Based upon how we will group (in this case MIN) we create a Matrix using NumPy """ """ This Matrix will have one row for each unique Simulation parameter and will thus """ """ relate to a single line on the output graph """ """ We initialise the matrix with the maximum value = 100 and for each input row processed we identify """ """ if it is smaller than the one in the matrix, if so it inserts it """ if Avg_Operation == "MIN": Hoshin_Summary = np.full((len(Hoshin_Uniques),len(i)-2),100.) for row in data: Hoshin_index = Hoshin_Uniques.index(row[1]) for index,item in enumerate(row[2:]): if float(item) < Hoshin_Summary[Hoshin_index,index]: Hoshin_Summary[Hoshin_index,index] = float(item)
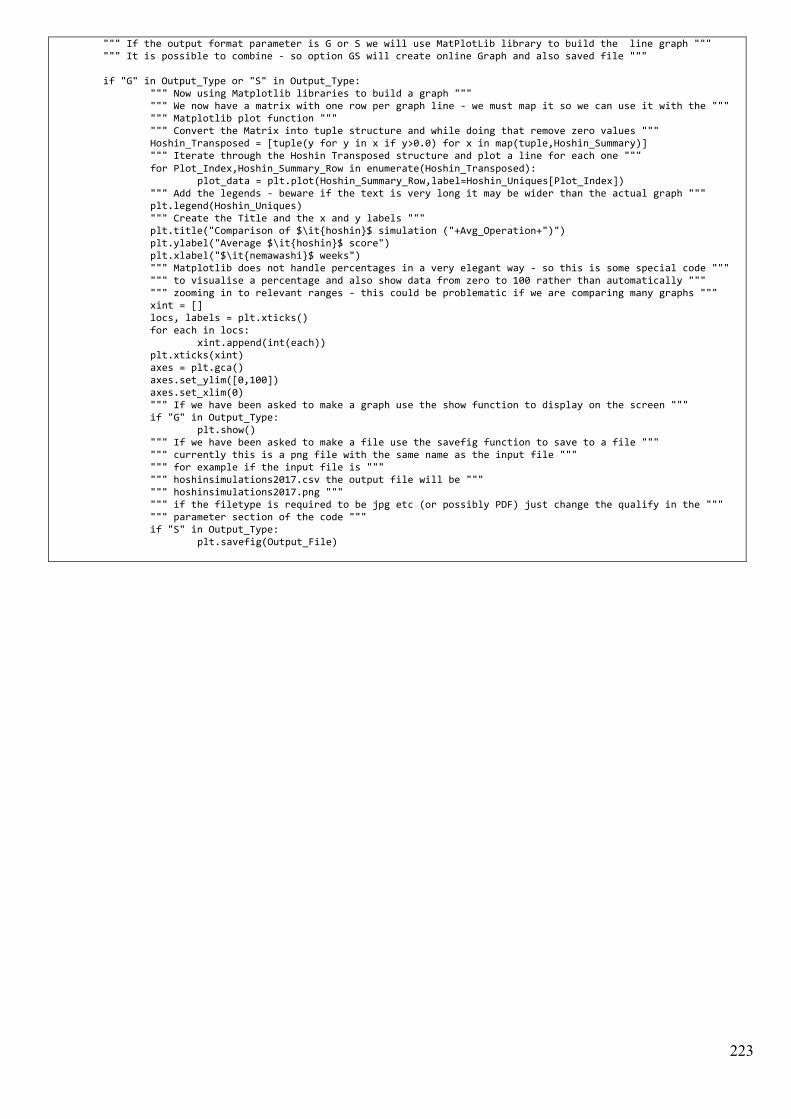
223
""" If the output format parameter is G or S we will use MatPlotLib library to build the line graph """ """ It is possible to combine - so option GS will create online Graph and also saved file """ if "G" in Output_Type or "S" in Output_Type: """ Now using Matplotlib libraries to build a graph """ """ We now have a matrix with one row per graph line - we must map it so we can use it with the """ """ Matplotlib plot function """ """ Convert the Matrix into tuple structure and while doing that remove zero values """ Hoshin_Transposed = [tuple(y for y in x if y>0.0) for x in map(tuple,Hoshin_Summary)] """ Iterate through the Hoshin Transposed structure and plot a line for each one """ for Plot_Index,Hoshin_Summary_Row in enumerate(Hoshin_Transposed): plot_data = plt.plot(Hoshin_Summary_Row,label=Hoshin_Uniques[Plot_Index]) """ Add the legends - beware if the text is very long it may be wider than the actual graph """ plt.legend(Hoshin_Uniques) """ Create the Title and the x and y labels """ plt.title("Comparison of $\it{hoshin}$ simulation ("+Avg_Operation+")") plt.ylabel("Average $\it{hoshin}$ score") plt.xlabel("$\it{nemawashi}$ weeks") """ Matplotlib does not handle percentages in a very elegant way - so this is some special code """ """ to visualise a percentage and also show data from zero to 100 rather than automatically """ """ zooming in to relevant ranges - this could be problematic if we are comparing many graphs """ xint = [] locs, labels = plt.xticks() for each in locs: xint.append(int(each)) plt.xticks(xint) axes = plt.gca() axes.set_ylim([0,100]) axes.set_xlim(0) """ If we have been asked to make a graph use the show function to display on the screen """ if "G" in Output_Type: plt.show() """ If we have been asked to make a file use the savefig function to save to a file """ """ currently this is a png file with the same name as the input file """ """ for example if the input file is """ """ hoshinsimulations2017.csv the output file will be """ """ hoshinsimulations2017.png """ """ if the filetype is required to be jpg etc (or possibly PDF) just change the qualify in the """ """ parameter section of the code """ if "S" in Output_Type: plt.savefig(Output_File)
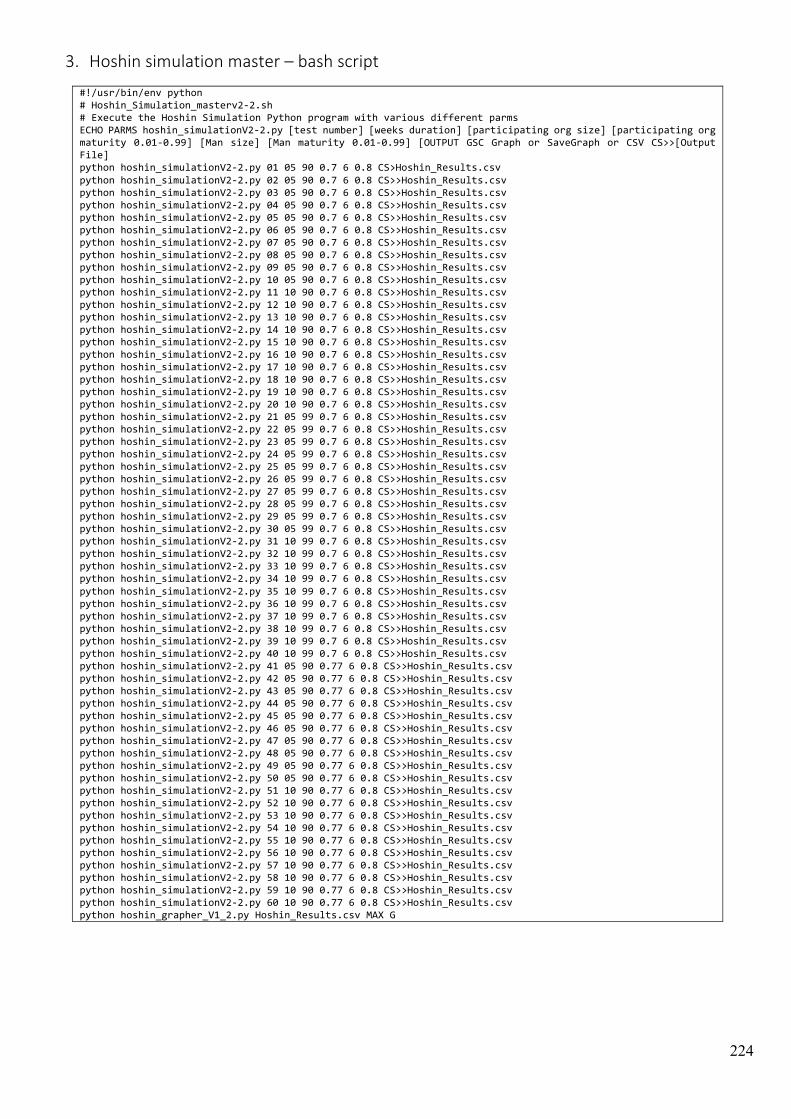
224
3. Hoshinsimulationmaster–bashscript
#!/usr/bin/env python # Hoshin_Simulation_masterv2-2.sh # Execute the Hoshin Simulation Python program with various different parms ECHO PARMS hoshin_simulationV2-2.py [test number] [weeks duration] [participating org size] [participating org maturity 0.01-0.99] [Man size] [Man maturity 0.01-0.99] [OUTPUT GSC Graph or SaveGraph or CSV CS>>[Output File] python hoshin_simulationV2-2.py 01 05 90 0.7 6 0.8 CS>Hoshin_Results.csv python hoshin_simulationV2-2.py 02 05 90 0.7 6 0.8 CS>>Hoshin_Results.csv python hoshin_simulationV2-2.py 03 05 90 0.7 6 0.8 CS>>Hoshin_Results.csv python hoshin_simulationV2-2.py 04 05 90 0.7 6 0.8 CS>>Hoshin_Results.csv python hoshin_simulationV2-2.py 05 05 90 0.7 6 0.8 CS>>Hoshin_Results.csv python hoshin_simulationV2-2.py 06 05 90 0.7 6 0.8 CS>>Hoshin_Results.csv python hoshin_simulationV2-2.py 07 05 90 0.7 6 0.8 CS>>Hoshin_Results.csv python hoshin_simulationV2-2.py 08 05 90 0.7 6 0.8 CS>>Hoshin_Results.csv python hoshin_simulationV2-2.py 09 05 90 0.7 6 0.8 CS>>Hoshin_Results.csv python hoshin_simulationV2-2.py 10 05 90 0.7 6 0.8 CS>>Hoshin_Results.csv python hoshin_simulationV2-2.py 11 10 90 0.7 6 0.8 CS>>Hoshin_Results.csv python hoshin_simulationV2-2.py 12 10 90 0.7 6 0.8 CS>>Hoshin_Results.csv python hoshin_simulationV2-2.py 13 10 90 0.7 6 0.8 CS>>Hoshin_Results.csv python hoshin_simulationV2-2.py 14 10 90 0.7 6 0.8 CS>>Hoshin_Results.csv python hoshin_simulationV2-2.py 15 10 90 0.7 6 0.8 CS>>Hoshin_Results.csv python hoshin_simulationV2-2.py 16 10 90 0.7 6 0.8 CS>>Hoshin_Results.csv python hoshin_simulationV2-2.py 17 10 90 0.7 6 0.8 CS>>Hoshin_Results.csv python hoshin_simulationV2-2.py 18 10 90 0.7 6 0.8 CS>>Hoshin_Results.csv python hoshin_simulationV2-2.py 19 10 90 0.7 6 0.8 CS>>Hoshin_Results.csv python hoshin_simulationV2-2.py 20 10 90 0.7 6 0.8 CS>>Hoshin_Results.csv python hoshin_simulationV2-2.py 21 05 99 0.7 6 0.8 CS>>Hoshin_Results.csv python hoshin_simulationV2-2.py 22 05 99 0.7 6 0.8 CS>>Hoshin_Results.csv python hoshin_simulationV2-2.py 23 05 99 0.7 6 0.8 CS>>Hoshin_Results.csv python hoshin_simulationV2-2.py 24 05 99 0.7 6 0.8 CS>>Hoshin_Results.csv python hoshin_simulationV2-2.py 25 05 99 0.7 6 0.8 CS>>Hoshin_Results.csv python hoshin_simulationV2-2.py 26 05 99 0.7 6 0.8 CS>>Hoshin_Results.csv python hoshin_simulationV2-2.py 27 05 99 0.7 6 0.8 CS>>Hoshin_Results.csv python hoshin_simulationV2-2.py 28 05 99 0.7 6 0.8 CS>>Hoshin_Results.csv python hoshin_simulationV2-2.py 29 05 99 0.7 6 0.8 CS>>Hoshin_Results.csv python hoshin_simulationV2-2.py 30 05 99 0.7 6 0.8 CS>>Hoshin_Results.csv python hoshin_simulationV2-2.py 31 10 99 0.7 6 0.8 CS>>Hoshin_Results.csv python hoshin_simulationV2-2.py 32 10 99 0.7 6 0.8 CS>>Hoshin_Results.csv python hoshin_simulationV2-2.py 33 10 99 0.7 6 0.8 CS>>Hoshin_Results.csv python hoshin_simulationV2-2.py 34 10 99 0.7 6 0.8 CS>>Hoshin_Results.csv python hoshin_simulationV2-2.py 35 10 99 0.7 6 0.8 CS>>Hoshin_Results.csv python hoshin_simulationV2-2.py 36 10 99 0.7 6 0.8 CS>>Hoshin_Results.csv python hoshin_simulationV2-2.py 37 10 99 0.7 6 0.8 CS>>Hoshin_Results.csv python hoshin_simulationV2-2.py 38 10 99 0.7 6 0.8 CS>>Hoshin_Results.csv python hoshin_simulationV2-2.py 39 10 99 0.7 6 0.8 CS>>Hoshin_Results.csv python hoshin_simulationV2-2.py 40 10 99 0.7 6 0.8 CS>>Hoshin_Results.csv python hoshin_simulationV2-2.py 41 05 90 0.77 6 0.8 CS>>Hoshin_Results.csv python hoshin_simulationV2-2.py 42 05 90 0.77 6 0.8 CS>>Hoshin_Results.csv python hoshin_simulationV2-2.py 43 05 90 0.77 6 0.8 CS>>Hoshin_Results.csv python hoshin_simulationV2-2.py 44 05 90 0.77 6 0.8 CS>>Hoshin_Results.csv python hoshin_simulationV2-2.py 45 05 90 0.77 6 0.8 CS>>Hoshin_Results.csv python hoshin_simulationV2-2.py 46 05 90 0.77 6 0.8 CS>>Hoshin_Results.csv python hoshin_simulationV2-2.py 47 05 90 0.77 6 0.8 CS>>Hoshin_Results.csv python hoshin_simulationV2-2.py 48 05 90 0.77 6 0.8 CS>>Hoshin_Results.csv python hoshin_simulationV2-2.py 49 05 90 0.77 6 0.8 CS>>Hoshin_Results.csv python hoshin_simulationV2-2.py 50 05 90 0.77 6 0.8 CS>>Hoshin_Results.csv python hoshin_simulationV2-2.py 51 10 90 0.77 6 0.8 CS>>Hoshin_Results.csv python hoshin_simulationV2-2.py 52 10 90 0.77 6 0.8 CS>>Hoshin_Results.csv python hoshin_simulationV2-2.py 53 10 90 0.77 6 0.8 CS>>Hoshin_Results.csv python hoshin_simulationV2-2.py 54 10 90 0.77 6 0.8 CS>>Hoshin_Results.csv python hoshin_simulationV2-2.py 55 10 90 0.77 6 0.8 CS>>Hoshin_Results.csv python hoshin_simulationV2-2.py 56 10 90 0.77 6 0.8 CS>>Hoshin_Results.csv python hoshin_simulationV2-2.py 57 10 90 0.77 6 0.8 CS>>Hoshin_Results.csv python hoshin_simulationV2-2.py 58 10 90 0.77 6 0.8 CS>>Hoshin_Results.csv python hoshin_simulationV2-2.py 59 10 90 0.77 6 0.8 CS>>Hoshin_Results.csv python hoshin_simulationV2-2.py 60 10 90 0.77 6 0.8 CS>>Hoshin_Results.csv python hoshin_grapher_V1_2.py Hoshin_Results.csv MAX G

226
Appendix 3 –
Summary in French

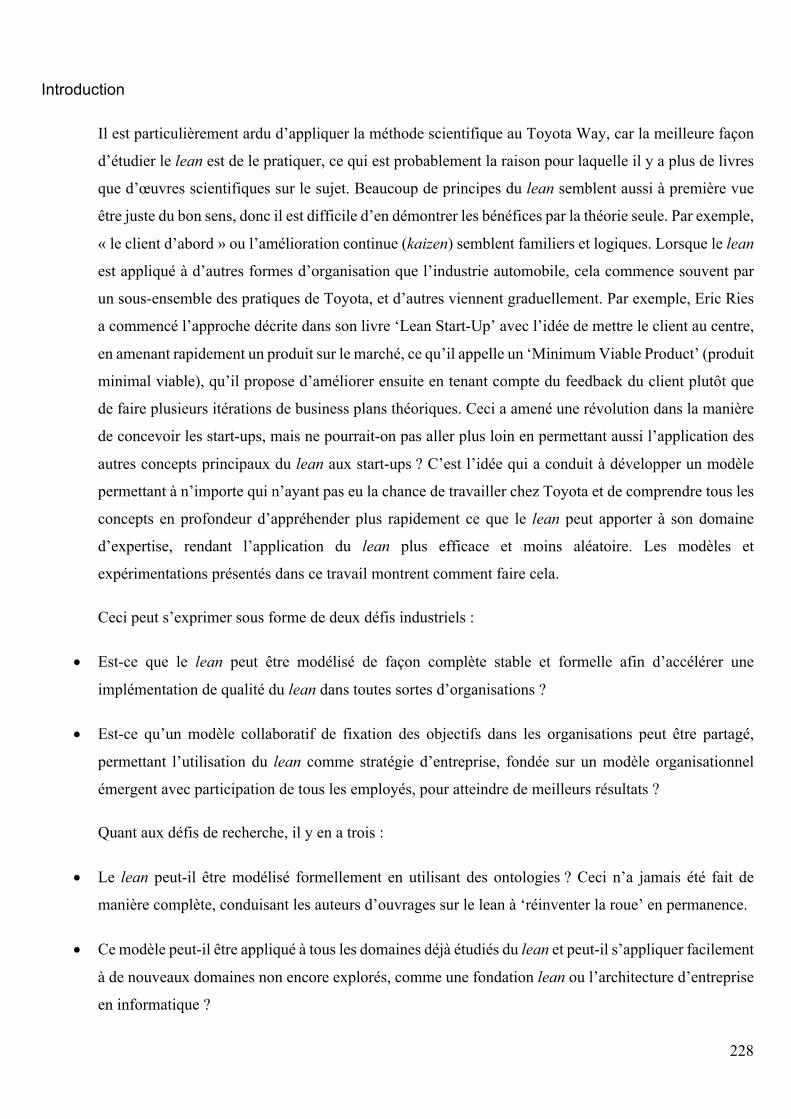
228
Introduction
Il est particulièrement ardu d’appliquer la méthode scientifique au Toyota Way, car la meilleure façon
d’étudier le lean est de le pratiquer, ce qui est probablement la raison pour laquelle il y a plus de livres
que d’œuvres scientifiques sur le sujet. Beaucoup de principes du lean semblent aussi à première vue
être juste du bon sens, donc il est difficile d’en démontrer les bénéfices par la théorie seule. Par exemple,
« le client d’abord » ou l’amélioration continue (kaizen) semblent familiers et logiques. Lorsque le lean
est appliqué à d’autres formes d’organisation que l’industrie automobile, cela commence souvent par
un sous-ensemble des pratiques de Toyota, et d’autres viennent graduellement. Par exemple, Eric Ries
a commencé l’approche décrite dans son livre ‘Lean Start-Up’ avec l’idée de mettre le client au centre,
en amenant rapidement un produit sur le marché, ce qu’il appelle un ‘Minimum Viable Product’ (produit
minimal viable), qu’il propose d’améliorer ensuite en tenant compte du feedback du client plutôt que
de faire plusieurs itérations de business plans théoriques. Ceci a amené une révolution dans la manière
de concevoir les start-ups, mais ne pourrait-on pas aller plus loin en permettant aussi l’application des
autres concepts principaux du lean aux start-ups ? C’est l’idée qui a conduit à développer un modèle
permettant à n’importe qui n’ayant pas eu la chance de travailler chez Toyota et de comprendre tous les
concepts en profondeur d’appréhender plus rapidement ce que le lean peut apporter à son domaine
d’expertise, rendant l’application du lean plus efficace et moins aléatoire. Les modèles et
expérimentations présentés dans ce travail montrent comment faire cela.
Ceci peut s’exprimer sous forme de deux défis industriels :
• Est-ce que le lean peut être modélisé de façon complète stable et formelle afin d’accélérer une
implémentation de qualité du lean dans toutes sortes d’organisations ?
• Est-ce qu’un modèle collaboratif de fixation des objectifs dans les organisations peut être partagé,
permettant l’utilisation du lean comme stratégie d’entreprise, fondée sur un modèle organisationnel
émergent avec participation de tous les employés, pour atteindre de meilleurs résultats ?
Quant aux défis de recherche, il y en a trois :
• Le lean peut-il être modélisé formellement en utilisant des ontologies ? Ceci n’a jamais été fait de
manière complète, conduisant les auteurs d’ouvrages sur le lean à ‘réinventer la roue’ en permanence.
• Ce modèle peut-il être appliqué à tous les domaines déjà étudiés du lean et peut-il s’appliquer facilement
à de nouveaux domaines non encore explorés, comme une fondation lean ou l’architecture d’entreprise
en informatique ?
229
• Le lean présente-t-il les propriétés des systèmes complexes ? Le processus de fixation des objectifs
(hoshin kanri) est choisi pour son application des agents de haut en bas de de bas en haut dans la hiérarchie
d’entreprise, typique des systèmes complexes. La comparaison novatrice entre le lean et le système
immunitaire renforce la compréhension du lean comme système complexe.
Etat de l’art du lean
L’histoire du système de production Toyota et du lean est expliquée, et la littérature sur le lean est
passée en revue, notamment les ouvrages de la dernière décennie qui ont étendu le lean à des domaines
nouveaux. Le lean est expliqué en général par une approche pratique, idéalement sur les sites de
production. Une approche très populaire explique le lean ou le système de production Toyota (TPS) en
utilisant une ‘maison du TPS’ avec deux piliers, le juste à temps et l’arrêt à temps (jidoka). Le juste à
temps gouverne le flux tiré à partir de la demande du client ainsi que l’élimination des gaspillages dans
chaque processus. Mais avant d’établir le juste à temps, l’arrêt à temps (jidoka) est nécessaire : chaque
flux doit être arrêté lorsqu’un problème est rencontré. L’homme, qui est maintenant libéré de la machine
par automatisation et arrêt à temps, peut s’occuper de plusieurs machines. Dans le cas du métier à tisser
automatique type G de Sakichi Toyoda, ce concept a permis de passer d’une à trente machines par
opérateur. Ensuite, les fondations de la maison sont expliquées avec les concepts de base (comme la
sécurité ou l’amélioration continue) et le toit montre la finalité de satisfaction des parties prenantes.
Cette approche est très utile pour la pédagogie du lean, mais ne permet pas facilement d’expliquer tous
les termes du lean (il y en a plus d’une centaine). Elle n’est pas non plus unique, car différents auteurs
placent le même concept à différents endroits de la maison et les termes aux mêmes sont aussi liés les
uns aux autres de manières différentes. Ceci conduit à l’utilisation d’ontologies pour décrire les concepts
et leurs relations et du modèle MERC (Métadonnées, Expérience, Règles et Connaissance) pour
représenter la connaissance d’une manière structurée.
Etat de l’art des systèmes complexes
Dans ce chapitre, la nouvelle science des systèmes complexes est introduite dans son contexte historique,
en détaillant les propriétés de systèmes complexes pertinentes pour la modélisation de systèmes naturels
et artificiels. En particulier, la manière dont des règles simples peuvent définir des comportement
complexes est présentée, avec les approches de modélisation des systèmes complexes. Le système
immunitaire est introduit comme exemple de système complexe, qui sera comparé avec l’organisation
lean.
Un système complexe consiste en un grand nombre d’agents interconnectés qui, pris ensemble, montrent
un comportement coordonné sans contrôle centralisé. C’est-à-dire qu’un système complexe montre des
propriétés qu’on appelle émergentes qui viennent de l’interaction entre les différents agents, mais ne
résultent pas de leurs propriétés intrinsèques. Par exemple, l’eau a des propriétés que les molécules
230
d’eau n’ont pas, et les êtres humains ensemble peuvent réaliser des choses que les individus ne
pourraient pas réaliser seuls. Le mot ‘complexe’ ne veut pas dire la même chose que ‘compliqué’. Un
puzzle peut être compliqué, mais il n’est pas complexe car il n’y a qu’un seul état à atteindre. Holland,
Miller et Page et Mittleton-Kelly établissent que les SCA (systèmes complexes adaptatifs) sont
caractérisés par les propriétés suivantes :
• Emergence :
Le tout est plus que la somme des parties. Les agents produisent ensemble des résultats qui excèdent
ce qu’ils pourraient réaliser individuellement.
• Immergence :
L’organisation dans son ensemble influence le comportement des agents au niveau local.
• Co-évolution :
Les agents évoluent de concert. Des décisions prises par une équipe vont avoir une influence sur une
autre équipe et vice-versa. Ceci conduit à une évolution directe (management-opérateurs) et indirect
(entre équipes d’agents).
• Connectivité :
Les entités sont interconnectées.
• Contrôle distribué :
Le contrôle est distribué vers le niveau le plus bas possible (le plus près de l’action), où les problèmes
sont gérés le plus localement possible par des agents qui comprennent la situation sur le terrain.
• Loin de l’équilibre :
Un système sans influences externes tend vers l’équilibre. Ce n’est pas le cas lorsqu’on observe des
organisations qui évoluent constamment sous l’influence de conditions externes, par exemple en créant
de nouvelles règles (un phénomène appelé autopoïèse).
• Non-linéarité :
Il y a une forte dépendance vis-à-vis des conditions initiales d’où l’importance de démarrer des
processus avec des paramètres considérés avec soin après réflexion sur le cycle précédent.
• Etat de paradoxe:
Ceci se dit lorsque différents éléments du système sont apparemment opposés les uns aux autres. Des
propriétés ago-antagonistes sont la clef pour comprendre le comportement complexe de systèmes
humains comme les organisations lean. Par exemple, le juste à temps demande un flux continu, mais le
‘stop à temps’ (jidoka) arrête le flux aussitôt qu’un problème est rencontré.
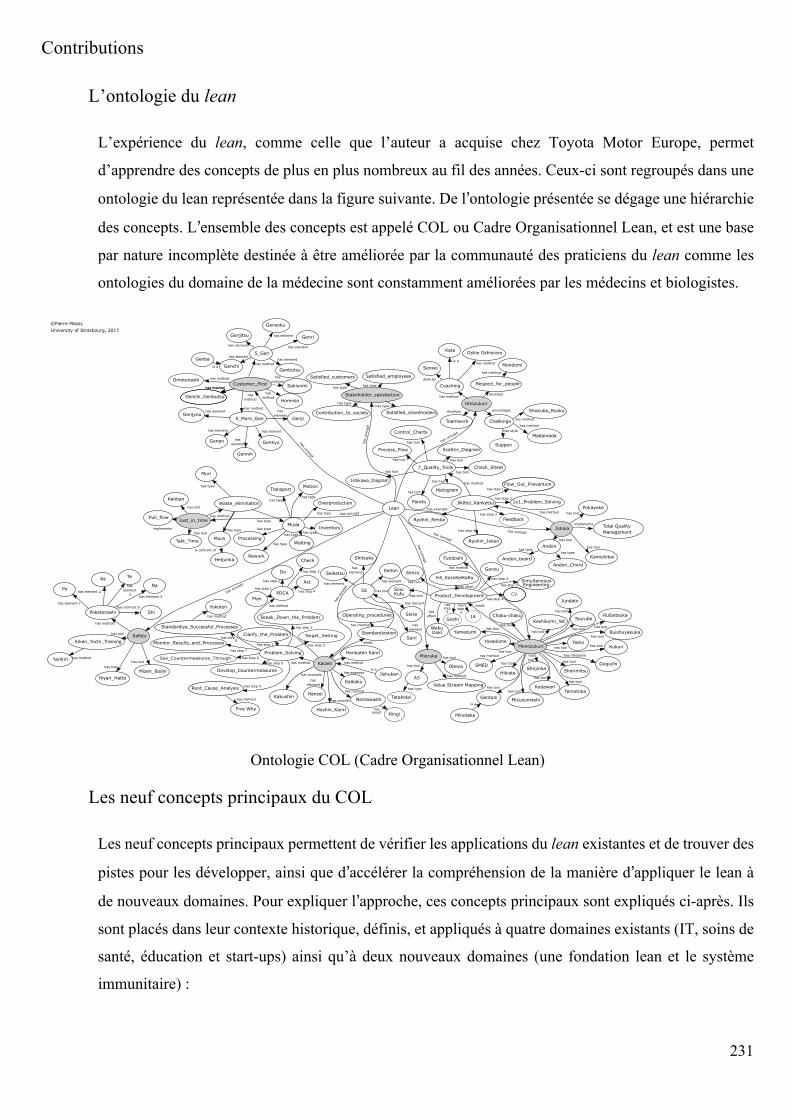
231
Contributions
L’ontologie du lean
L’expérience du lean, comme celle que l’auteur a acquise chez Toyota Motor Europe, permet
d’apprendre des concepts de plus en plus nombreux au fil des années. Ceux-ci sont regroupés dans une
ontologie du lean représentée dans la figure suivante. De l’ontologie présentée se dégage une hiérarchie
des concepts. L’ensemble des concepts est appelé COL ou Cadre Organisationnel Lean, et est une base
par nature incomplète destinée à être améliorée par la communauté des praticiens du lean comme les
ontologies du domaine de la médecine sont constamment améliorées par les médecins et biologistes.
Ontologie COL (Cadre Organisationnel Lean)
Les neuf concepts principaux du COL
Les neuf concepts principaux permettent de vérifier les applications du lean existantes et de trouver des
pistes pour les développer, ainsi que d’accélérer la compréhension de la manière d’appliquer le lean à
de nouveaux domaines. Pour expliquer l’approche, ces concepts principaux sont expliqués ci-après. Ils
sont placés dans leur contexte historique, définis, et appliqués à quatre domaines existants (IT, soins de
santé, éducation et start-ups) ainsi qu’à deux nouveaux domaines (une fondation lean et le système
immunitaire) :
Customer_First
Genchi_Genbutsu
has method
2_Gen
has method
2_More_Gen
has method
Horenso
has
methodStakeholder_satisfaction
Satisfied_shareholders
has type
Satisfied_customers
has type
Satisfied_employees
has type
Contribution_to_society
has type Hitozukuri
Coaching
has method
Challenge
encourages
Teamwork
develops
Respect_for_people
develops
Just_in_time
Kanban
has tool
Pull_flow
implements
Takt_Time
has tool
Waste_elimination
has method
Jidoka
Jikōtei_Kanketsu
has method
Andon
has tool
Pokayokehas tool
Kamishibai
has tool
Total Quality
Management
implements
SafetyKiken_Yochi_Training
has tool
Mizen_Boshi
has tool
Hiyari_Hatto
has tool
Poketenashi
has method
Kaizen
Henkaten Kanri
has method
Standardization
needs
Hoshin_Kanri
has process
Kaikaku
has example
Kakushin
has example
Hansei
has
element
Problem_Solving
has method
Jishuken
Tatakidai
is a
PDCA
has method
Mieruka
A,
has tool Obeya
has tool
Monozukuri
Shorimitsu
has tool
Gentani
has tool
SMED
has method
Kukurihas toolTeitei
has tool
has milestone
Keshikomi_list
has tool
Mizusumashi
has tool
Yamazumihas tool
Temotoka
has tool
Yosedome
has tool
Kodawarihas tool
Chaku-chaku
has tool
Buishuyakukahas tool
Jundate
has tool
Shojinka
has
tool
Hikiate
has tool
Tsurube
has tool
Product_Development
needs
Lean
hasconcept
hasconcept
has concept
has concept
has concept
has concept
hasconcept
hasconcept
has concept
Genchi
has element
Genbutsu
has element
Genri
has element
©Pierre Masai3
University of Strasbourg3 ©jL1Gensoku
has elementGenjitsu
has element
Genba
is a
Genpo
has element
Genkyu
has element
Genji
has
element
Gennin
has
element
Genjyouhas element
Kata
is a
Sensei
done by
Shokuba_Ryoku
has method
Mendomi
has method
Value Stream Mapping
Muri
has type
Mura
has type
Mudahas type
Heijunka
is contrary of
Waiting
has type
Overproduction
has type
Rework
has type
Motion
has type
Processing
has type Inventoryhas type
Transport
has type
Feedback
Flow_Out_Prevention
Ryohin_Joken
has step ,
LxL_Problem_Solvinghas step ©
has step U
has step L
Ryohin_Renka
has example
1_Quality_Tools
has method
Pareto
has tool
Ishikawa_Diagram
has tool
Control_Charts
has tool
Scatter_Diagram
has tool
Check_Sheethas tool
Process_Flow
has tool
Histogram
has tool
Andon_Chord
has type
Andon_board
has type
Yarikiri has method
Po
has element L
Te
has
element
,
Ke
Na
has element U
Shihas element 2
Operating_procedures
has method
2S has tool
Seiri
has
element
haseffect
Seiton
has element
Seiso
has element
Seiketsu
has element
Shitsuke
has
element
Clarify_the_Problem
has step L
Standardize_Successful_Processes
Root_Cause_Analysis has step U
Target_Setting
has step ,
Break_Down_the_Problem
has step ©
Monitor_Results_and_Processes
Develop_Countermeasures
has step 2
See_Countermeasures_Through
Five Why
Yokoten
Plan
has step L
Do
has step © Act
has step U
Check
has step ,
Minotake
is a
CV
GenzuSenzu
has step U
Fundoshi
has method
SouiKufu has tool
KU_KozoKeiKaKu
has stepL
LAGoshi
has tool SimultaneousEngineeringhas step ,
has type
Goguchi
has step ©
has method
Omotenashi has method
hasstep2
has element ©
has method
has step 1
has step 0
has step7
has method
Sakiyomi
has
method
Madamada
Suppon
has method
has style
Oshie Oshierare
has method
Nemawashi
has method
Ringihasresult
has method
Ruibetsuka
has tool
hasstep0
WakuDoki
has
method
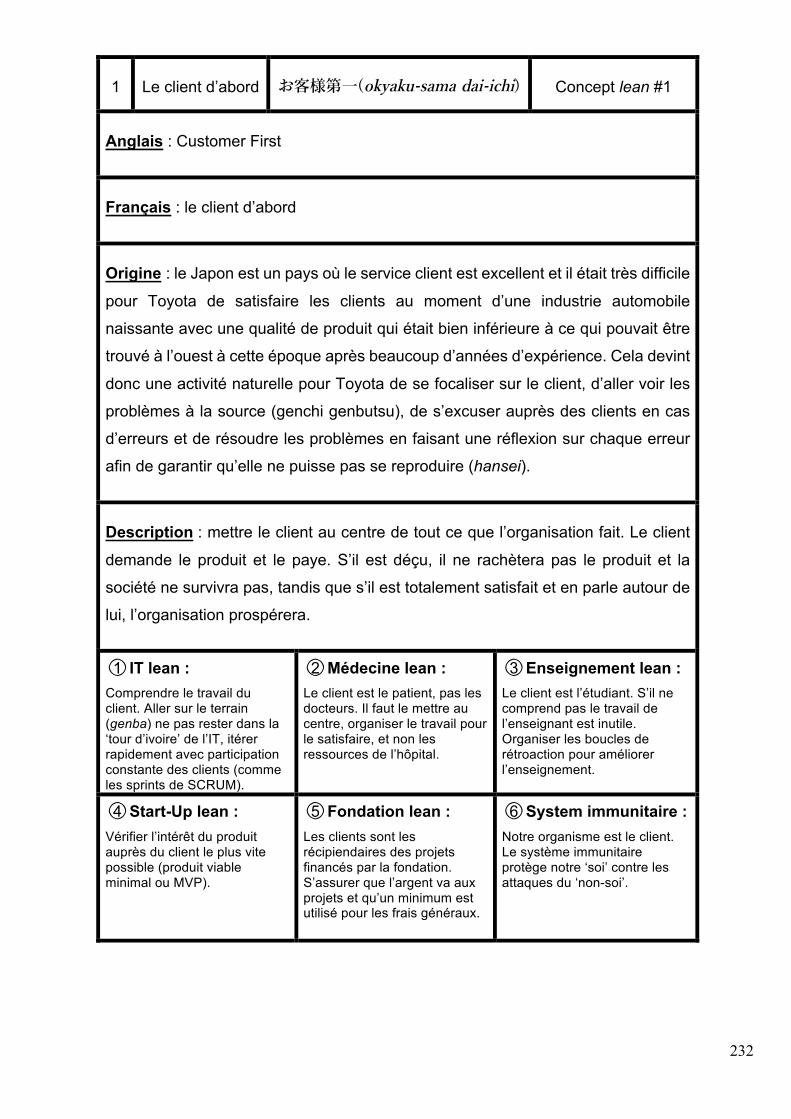
232
1 Le client d’abord お客様第⼀(okyaku-sama dai-ichi) Concept lean #1
Anglais : Customer First
Français : le client d’abord
Origine : le Japon est un pays où le service client est excellent et il était très difficile
pour Toyota de satisfaire les clients au moment d’une industrie automobile
naissante avec une qualité de produit qui était bien inférieure à ce qui pouvait être
trouvé à l’ouest à cette époque après beaucoup d’années d’expérience. Cela devint
donc une activité naturelle pour Toyota de se focaliser sur le client, d’aller voir les
problèmes à la source (genchi genbutsu), de s’excuser auprès des clients en cas
d’erreurs et de résoudre les problèmes en faisant une réflexion sur chaque erreur
afin de garantir qu’elle ne puisse pas se reproduire (hansei).
Description : mettre le client au centre de tout ce que l’organisation fait. Le client
demande le produit et le paye. S’il est déçu, il ne rachètera pas le produit et la
société ne survivra pas, tandis que s’il est totalement satisfait et en parle autour de
lui, l’organisation prospérera.
○1 IT lean : Comprendre le travail du client. Aller sur le terrain (genba) ne pas rester dans la ‘tour d’ivoire’ de l’IT, itérer rapidement avec participation constante des clients (comme les sprints de SCRUM).
○2 Médecine lean : Le client est le patient, pas les docteurs. Il faut le mettre au centre, organiser le travail pour le satisfaire, et non les ressources de l’hôpital.
○3 Enseignement lean : Le client est l’étudiant. S’il ne comprend pas le travail de l’enseignant est inutile. Organiser les boucles de rétroaction pour améliorer l’enseignement.
○4 Start-Up lean : Vérifier l’intérêt du produit auprès du client le plus vite possible (produit viable minimal ou MVP).
○5 Fondation lean : Les clients sont les récipiendaires des projets financés par la fondation. S’assurer que l’argent va aux projets et qu’un minimum est utilisé pour les frais généraux.
○6 System immunitaire : Notre organisme est le client. Le système immunitaire protège notre ‘soi’ contre les attaques du ‘non-soi’.
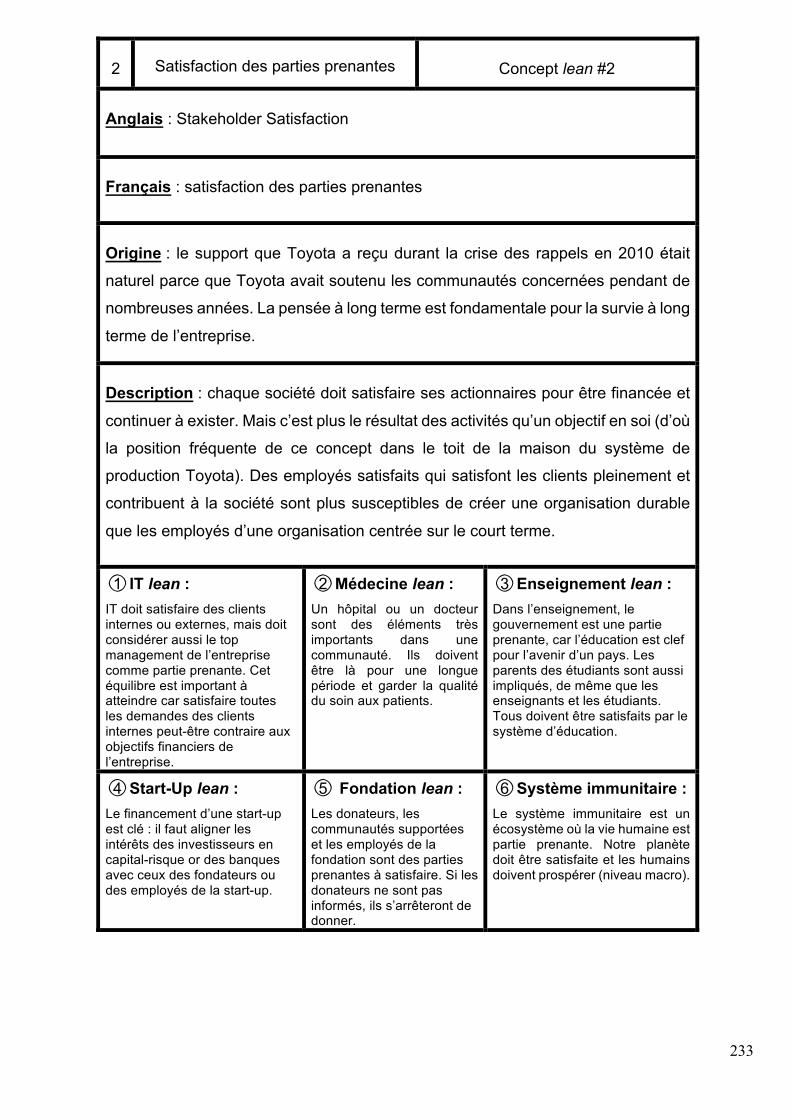
233
2 Satisfaction des parties prenantes Concept lean #2
Anglais : Stakeholder Satisfaction
Français : satisfaction des parties prenantes
Origine : le support que Toyota a reçu durant la crise des rappels en 2010 était
naturel parce que Toyota avait soutenu les communautés concernées pendant de
nombreuses années. La pensée à long terme est fondamentale pour la survie à long
terme de l’entreprise.
Description : chaque société doit satisfaire ses actionnaires pour être financée et
continuer à exister. Mais c’est plus le résultat des activités qu’un objectif en soi (d’où
la position fréquente de ce concept dans le toit de la maison du système de
production Toyota). Des employés satisfaits qui satisfont les clients pleinement et
contribuent à la société sont plus susceptibles de créer une organisation durable
que les employés d’une organisation centrée sur le court terme.
○1 IT lean : IT doit satisfaire des clients internes ou externes, mais doit considérer aussi le top management de l’entreprise comme partie prenante. Cet équilibre est important à atteindre car satisfaire toutes les demandes des clients internes peut-être contraire aux objectifs financiers de l’entreprise.
○2 Médecine lean : Un hôpital ou un docteur sont des éléments très importants dans une communauté. Ils doivent être là pour une longue période et garder la qualité du soin aux patients.
○3 Enseignement lean : Dans l’enseignement, le gouvernement est une partie prenante, car l’éducation est clef pour l’avenir d’un pays. Les parents des étudiants sont aussi impliqués, de même que les enseignants et les étudiants. Tous doivent être satisfaits par le système d’éducation.
○4 Start-Up lean : Le financement d’une start-up est clé : il faut aligner les intérêts des investisseurs en capital-risque or des banques avec ceux des fondateurs ou des employés de la start-up.
○5 Fondation lean : Les donateurs, les communautés supportées et les employés de la fondation sont des parties prenantes à satisfaire. Si les donateurs ne sont pas informés, ils s’arrêteront de donner.
○6 Système immunitaire : Le système immunitaire est un écosystème où la vie humaine est partie prenante. Notre planète doit être satisfaite et les humains doivent prospérer (niveau macro).
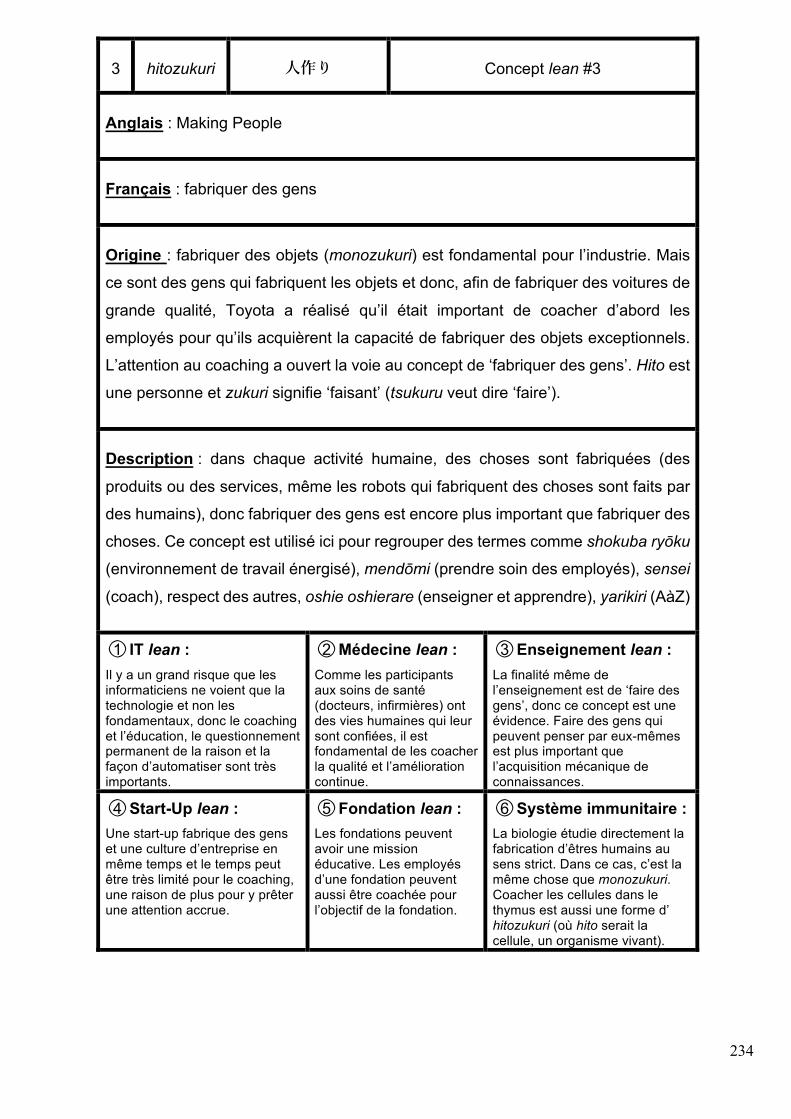
234
3 hitozukuri ⼈作り Concept lean #3
Anglais : Making People
Français : fabriquer des gens
Origine : fabriquer des objets (monozukuri) est fondamental pour l’industrie. Mais
ce sont des gens qui fabriquent les objets et donc, afin de fabriquer des voitures de
grande qualité, Toyota a réalisé qu’il était important de coacher d’abord les
employés pour qu’ils acquièrent la capacité de fabriquer des objets exceptionnels.
L’attention au coaching a ouvert la voie au concept de ‘fabriquer des gens’. Hito est
une personne et zukuri signifie ‘faisant’ (tsukuru veut dire ‘faire’).
Description : dans chaque activité humaine, des choses sont fabriquées (des
produits ou des services, même les robots qui fabriquent des choses sont faits par
des humains), donc fabriquer des gens est encore plus important que fabriquer des
choses. Ce concept est utilisé ici pour regrouper des termes comme shokuba ryōku
(environnement de travail énergisé), mendōmi (prendre soin des employés), sensei
(coach), respect des autres, oshie oshierare (enseigner et apprendre), yarikiri (AàZ)
○1 IT lean : Il y a un grand risque que les informaticiens ne voient que la technologie et non les fondamentaux, donc le coaching et l’éducation, le questionnement permanent de la raison et la façon d’automatiser sont très importants.
○2 Médecine lean : Comme les participants aux soins de santé (docteurs, infirmières) ont des vies humaines qui leur sont confiées, il est fondamental de les coacher la qualité et l’amélioration continue.
○3 Enseignement lean : La finalité même de l’enseignement est de ‘faire des gens’, donc ce concept est une évidence. Faire des gens qui peuvent penser par eux-mêmes est plus important que l’acquisition mécanique de connaissances.
○4 Start-Up lean : Une start-up fabrique des gens et une culture d’entreprise en même temps et le temps peut être très limité pour le coaching, une raison de plus pour y prêter une attention accrue.
○5 Fondation lean : Les fondations peuvent avoir une mission éducative. Les employés d’une fondation peuvent aussi être coachée pour l’objectif de la fondation.
○6 Système immunitaire : La biologie étudie directement la fabrication d’êtres humains au sens strict. Dans ce cas, c’est la même chose que monozukuri. Coacher les cellules dans le thymus est aussi une forme d’ hitozukuri (où hito serait la cellule, un organisme vivant).
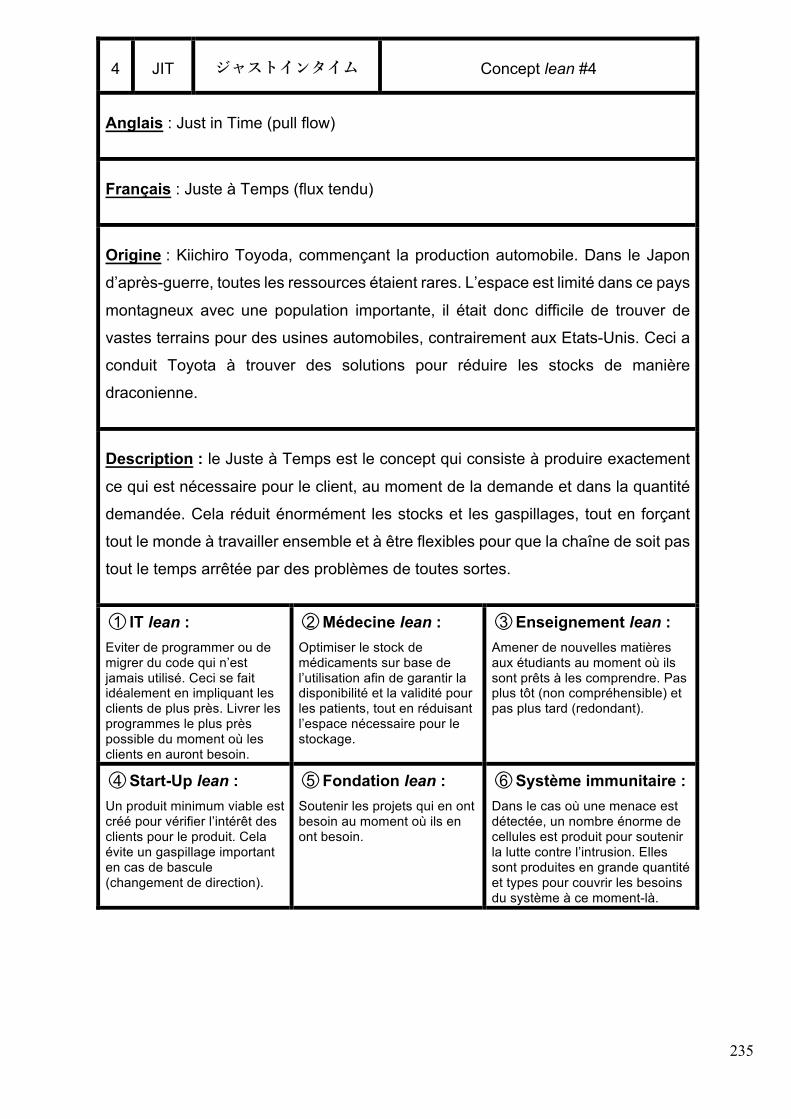
235
4 JIT ジャストインタイム Concept lean #4
Anglais : Just in Time (pull flow)
Français : Juste à Temps (flux tendu)
Origine : Kiichiro Toyoda, commençant la production automobile. Dans le Japon
d’après-guerre, toutes les ressources étaient rares. L’espace est limité dans ce pays
montagneux avec une population importante, il était donc difficile de trouver de
vastes terrains pour des usines automobiles, contrairement aux Etats-Unis. Ceci a
conduit Toyota à trouver des solutions pour réduire les stocks de manière
draconienne.
Description : le Juste à Temps est le concept qui consiste à produire exactement
ce qui est nécessaire pour le client, au moment de la demande et dans la quantité
demandée. Cela réduit énormément les stocks et les gaspillages, tout en forçant
tout le monde à travailler ensemble et à être flexibles pour que la chaîne de soit pas
tout le temps arrêtée par des problèmes de toutes sortes.
○1 IT lean : Eviter de programmer ou de migrer du code qui n’est jamais utilisé. Ceci se fait idéalement en impliquant les clients de plus près. Livrer les programmes le plus près possible du moment où les clients en auront besoin.
○2 Médecine lean : Optimiser le stock de médicaments sur base de l’utilisation afin de garantir la disponibilité et la validité pour les patients, tout en réduisant l’espace nécessaire pour le stockage.
○3 Enseignement lean : Amener de nouvelles matières aux étudiants au moment où ils sont prêts à les comprendre. Pas plus tôt (non compréhensible) et pas plus tard (redondant).
○4 Start-Up lean : Un produit minimum viable est créé pour vérifier l’intérêt des clients pour le produit. Cela évite un gaspillage important en cas de bascule (changement de direction).
○5 Fondation lean : Soutenir les projets qui en ont besoin au moment où ils en ont besoin.
○6 Système immunitaire : Dans le cas où une menace est détectée, un nombre énorme de cellules est produit pour soutenir la lutte contre l’intrusion. Elles sont produites en grande quantité et types pour couvrir les besoins du système à ce moment-là.
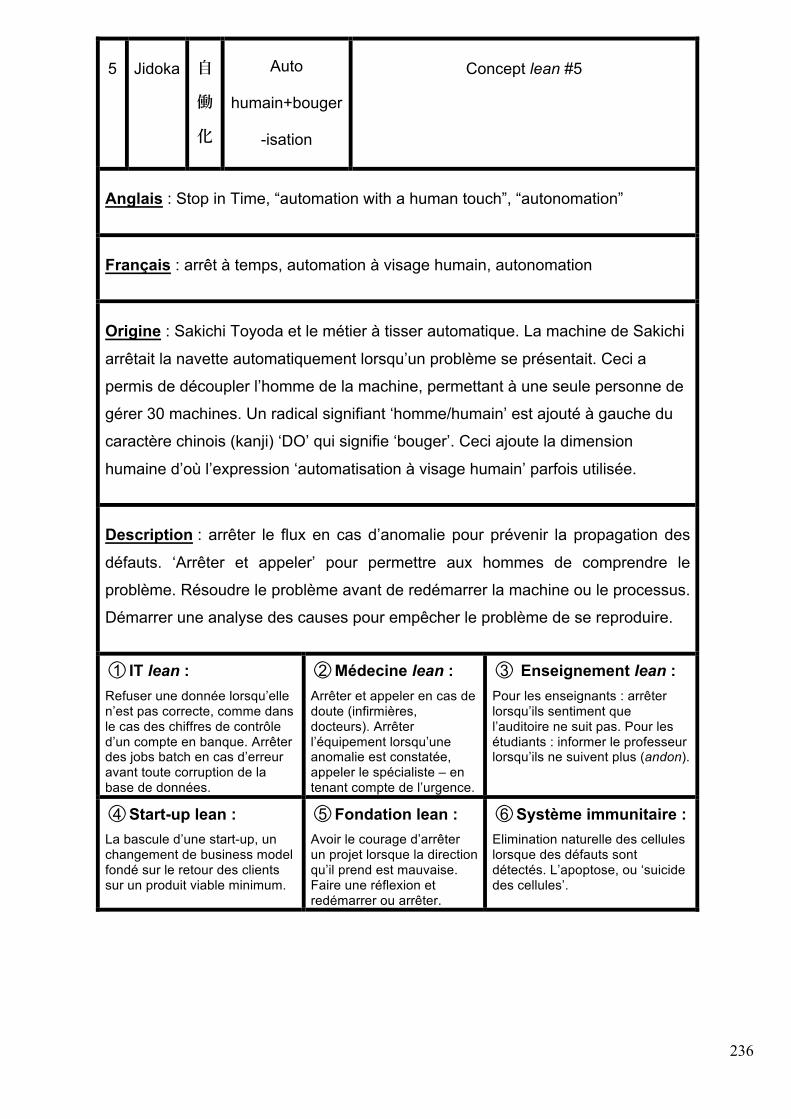
236
5 Jidoka ⾃
働
化
Auto
humain+bouger
-isation
Concept lean #5
Anglais : Stop in Time, “automation with a human touch”, “autonomation”
Français : arrêt à temps, automation à visage humain, autonomation
Origine : Sakichi Toyoda et le métier à tisser automatique. La machine de Sakichi
arrêtait la navette automatiquement lorsqu’un problème se présentait. Ceci a
permis de découpler l’homme de la machine, permettant à une seule personne de
gérer 30 machines. Un radical signifiant ‘homme/humain’ est ajouté à gauche du
caractère chinois (kanji) ‘DO’ qui signifie ‘bouger’. Ceci ajoute la dimension
humaine d’où l’expression ‘automatisation à visage humain’ parfois utilisée.
Description : arrêter le flux en cas d’anomalie pour prévenir la propagation des
défauts. ‘Arrêter et appeler’ pour permettre aux hommes de comprendre le
problème. Résoudre le problème avant de redémarrer la machine ou le processus.
Démarrer une analyse des causes pour empêcher le problème de se reproduire.
○1 IT lean : Refuser une donnée lorsqu’elle n’est pas correcte, comme dans le cas des chiffres de contrôle d’un compte en banque. Arrêter des jobs batch en cas d’erreur avant toute corruption de la base de données.
○2 Médecine lean : Arrêter et appeler en cas de doute (infirmières, docteurs). Arrêter l’équipement lorsqu’une anomalie est constatée, appeler le spécialiste – en tenant compte de l’urgence.
○3 Enseignement lean : Pour les enseignants : arrêter lorsqu’ils sentiment que l’auditoire ne suit pas. Pour les étudiants : informer le professeur lorsqu’ils ne suivent plus (andon).
○4 Start-up lean : La bascule d’une start-up, un changement de business model fondé sur le retour des clients sur un produit viable minimum.
○5 Fondation lean : Avoir le courage d’arrêter un projet lorsque la direction qu’il prend est mauvaise. Faire une réflexion et redémarrer ou arrêter.
○6 Système immunitaire : Elimination naturelle des cellules lorsque des défauts sont détectés. L’apoptose, ou ‘suicide des cellules’.

237
6 Safety 安全 (anzen) Concept lean #6
Anglais : Safety
Français : sécurité (là où l’anglais a deux mots, ‘Safety’ et ‘Security’, le français
utilise le seul mot ‘sécurité’, lien plus naturel avec la cyber-sécurité.
Origine : une usine est un lieu plein de risques. Il y a de nombreux risques lors de
leur construction ainsi que lors de leur opération. Si les employés ne sont pas en
sécurité ou ne se sentent pas en sécurité, ils ne pourront pas créer de bon produits
ou services pour les clients. L’organisation a une responsabilité à garder ses
employés en sécurité et la réduction des coûts, la qualité ou une charge de travail
élevée ne peuvent jamais être une excuse pour sacrifier la santé et la sécurité. C’est
pourquoi ‘la sécurité d’abord’ est un prérequis pour ‘le client d’abord’.
Description : go through the safety gate, prerequisite for all work (Eiji Toyoda)
○1 IT lean : Prévention de chocs électriques dans un centre de gestion de données, ou les précautions lors de manipulation de machines lourdes. Ce concept s’étend également à la cyber-sécurité.
○2 Médecine lean : Les programmes mettant en jeu la sécurité des patients doivent être testés beaucoup plus en détail. Des systèmes pokayoke peuvent sauver des vies, ils sont donc critiques en médecine.
○3 Enseignement lean : La sécurité des étudiants confiés au système éducatif est fondamentale pour toutes les parties prenantes. L’éducation à la sécurité est elle aussi indispensable.
○4 Start-up lean : Comme les start-ups n’ont pas de règles en place dès le premier jour, il est d’autant plus important de commencer par la sécurité.
○5 Fondation lean : Sécurité pour chaque projet financé par la fondation et pour les employés de la fondation.
○6 Système immunitaire : La raison d’être du système immunitaire est de contribuer à la sécurité de l’être humain devant les menaces externes.
Illustration : centre de recherche et de
développement de Toyota Motor Europe à
Zaventem, Belgique : entrée des employés
sur le campus. Sur l’autre côté de la porte, il
est écrit ‘DRIVE SAFELY’.
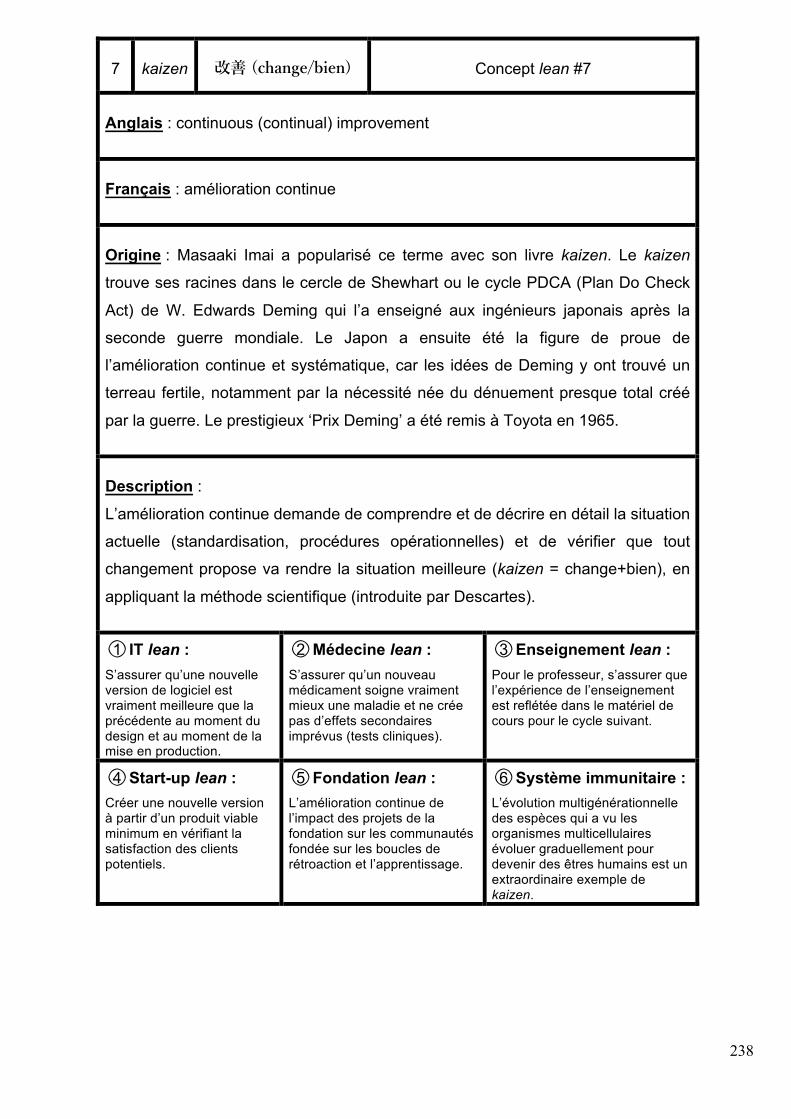
238
7 kaizen 改善 (change/bien) Concept lean #7
Anglais : continuous (continual) improvement
Français : amélioration continue
Origine : Masaaki Imai a popularisé ce terme avec son livre kaizen. Le kaizen
trouve ses racines dans le cercle de Shewhart ou le cycle PDCA (Plan Do Check
Act) de W. Edwards Deming qui l’a enseigné aux ingénieurs japonais après la
seconde guerre mondiale. Le Japon a ensuite été la figure de proue de
l’amélioration continue et systématique, car les idées de Deming y ont trouvé un
terreau fertile, notamment par la nécessité née du dénuement presque total créé
par la guerre. Le prestigieux ‘Prix Deming’ a été remis à Toyota en 1965.
Description :
L’amélioration continue demande de comprendre et de décrire en détail la situation
actuelle (standardisation, procédures opérationnelles) et de vérifier que tout
changement propose va rendre la situation meilleure (kaizen = change+bien), en
appliquant la méthode scientifique (introduite par Descartes).
○1 IT lean : S’assurer qu’une nouvelle version de logiciel est vraiment meilleure que la précédente au moment du design et au moment de la mise en production.
○2 Médecine lean : S’assurer qu’un nouveau médicament soigne vraiment mieux une maladie et ne crée pas d’effets secondaires imprévus (tests cliniques).
○3 Enseignement lean : Pour le professeur, s’assurer que l’expérience de l’enseignement est reflétée dans le matériel de cours pour le cycle suivant.
○4 Start-up lean : Créer une nouvelle version à partir d’un produit viable minimum en vérifiant la satisfaction des clients potentiels.
○5 Fondation lean : L’amélioration continue de l’impact des projets de la fondation sur les communautés fondée sur les boucles de rétroaction et l’apprentissage.
○6 Système immunitaire : L’évolution multigénérationnelle des espèces qui a vu les organismes multicellulaires évoluer graduellement pour devenir des êtres humains est un extraordinaire exemple de kaizen.
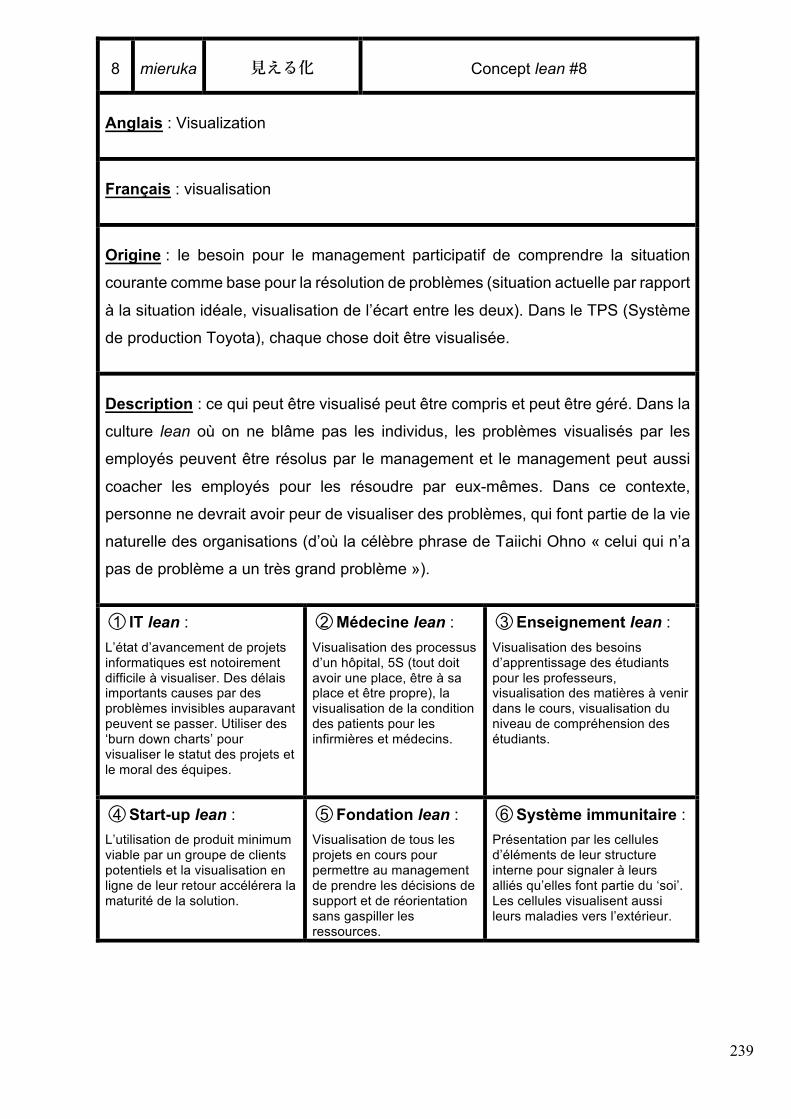
239
8 mieruka ⾒える化 Concept lean #8
Anglais : Visualization
Français : visualisation
Origine : le besoin pour le management participatif de comprendre la situation
courante comme base pour la résolution de problèmes (situation actuelle par rapport
à la situation idéale, visualisation de l’écart entre les deux). Dans le TPS (Système
de production Toyota), chaque chose doit être visualisée.
Description : ce qui peut être visualisé peut être compris et peut être géré. Dans la
culture lean où on ne blâme pas les individus, les problèmes visualisés par les
employés peuvent être résolus par le management et le management peut aussi
coacher les employés pour les résoudre par eux-mêmes. Dans ce contexte,
personne ne devrait avoir peur de visualiser des problèmes, qui font partie de la vie
naturelle des organisations (d’où la célèbre phrase de Taiichi Ohno « celui qui n’a
pas de problème a un très grand problème »).
○1 IT lean : L’état d’avancement de projets informatiques est notoirement difficile à visualiser. Des délais importants causes par des problèmes invisibles auparavant peuvent se passer. Utiliser des ‘burn down charts’ pour visualiser le statut des projets et le moral des équipes.
○2 Médecine lean : Visualisation des processus d’un hôpital, 5S (tout doit avoir une place, être à sa place et être propre), la visualisation de la condition des patients pour les infirmières et médecins.
○3 Enseignement lean : Visualisation des besoins d’apprentissage des étudiants pour les professeurs, visualisation des matières à venir dans le cours, visualisation du niveau de compréhension des étudiants.
○4 Start-up lean : L’utilisation de produit minimum viable par un groupe de clients potentiels et la visualisation en ligne de leur retour accélérera la maturité de la solution.
○5 Fondation lean : Visualisation de tous les projets en cours pour permettre au management de prendre les décisions de support et de réorientation sans gaspiller les ressources.
○6 Système immunitaire : Présentation par les cellules d’éléments de leur structure interne pour signaler à leurs alliés qu’elles font partie du ‘soi’. Les cellules visualisent aussi leurs maladies vers l’extérieur.
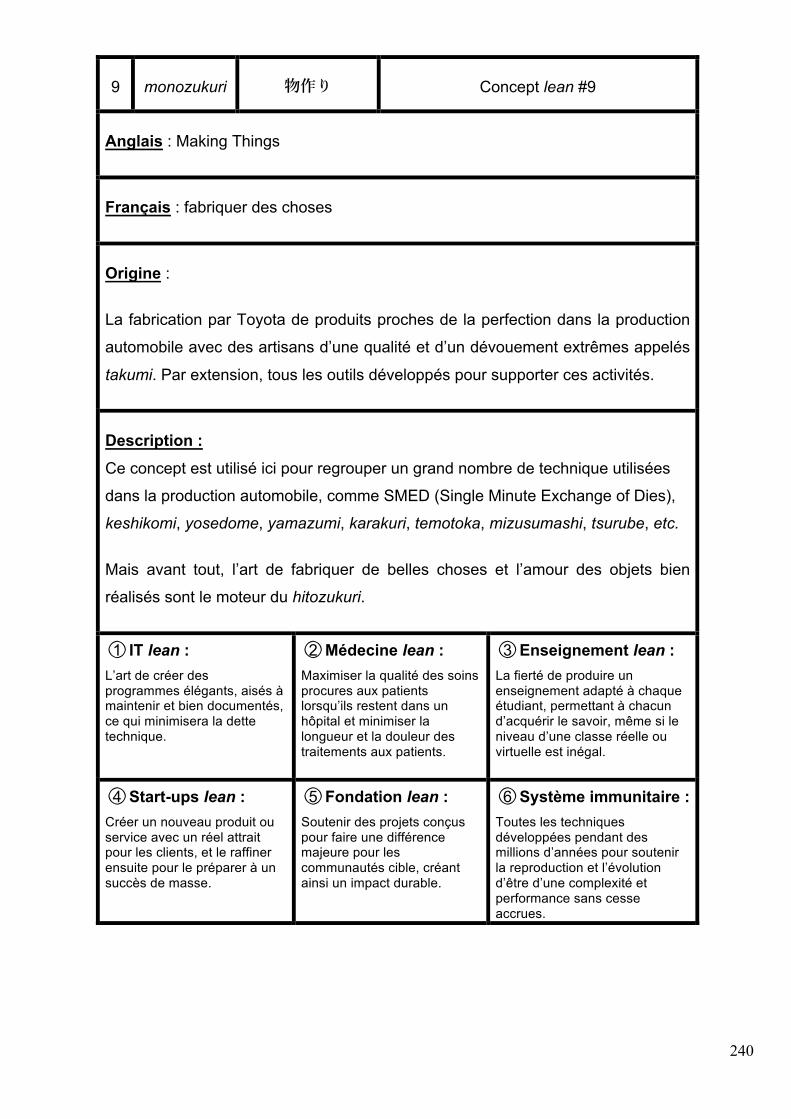
240
9 monozukuri 物作り Concept lean #9
Anglais : Making Things
Français : fabriquer des choses
Origine :
La fabrication par Toyota de produits proches de la perfection dans la production
automobile avec des artisans d’une qualité et d’un dévouement extrêmes appelés
takumi. Par extension, tous les outils développés pour supporter ces activités.
Description : Ce concept est utilisé ici pour regrouper un grand nombre de technique utilisées
dans la production automobile, comme SMED (Single Minute Exchange of Dies),
keshikomi, yosedome, yamazumi, karakuri, temotoka, mizusumashi, tsurube, etc.
Mais avant tout, l’art de fabriquer de belles choses et l’amour des objets bien
réalisés sont le moteur du hitozukuri.
○1 IT lean : L’art de créer des programmes élégants, aisés à maintenir et bien documentés, ce qui minimisera la dette technique.
○2 Médecine lean : Maximiser la qualité des soins procures aux patients lorsqu’ils restent dans un hôpital et minimiser la longueur et la douleur des traitements aux patients.
○3 Enseignement lean : La fierté de produire un enseignement adapté à chaque étudiant, permettant à chacun d’acquérir le savoir, même si le niveau d’une classe réelle ou virtuelle est inégal.
○4 Start-ups lean : Créer un nouveau produit ou service avec un réel attrait pour les clients, et le raffiner ensuite pour le préparer à un succès de masse.
○5 Fondation lean : Soutenir des projets conçus pour faire une différence majeure pour les communautés cible, créant ainsi un impact durable.
○6 Système immunitaire : Toutes les techniques développées pendant des millions d’années pour soutenir la reproduction et l’évolution d’être d’une complexité et performance sans cesse accrues.
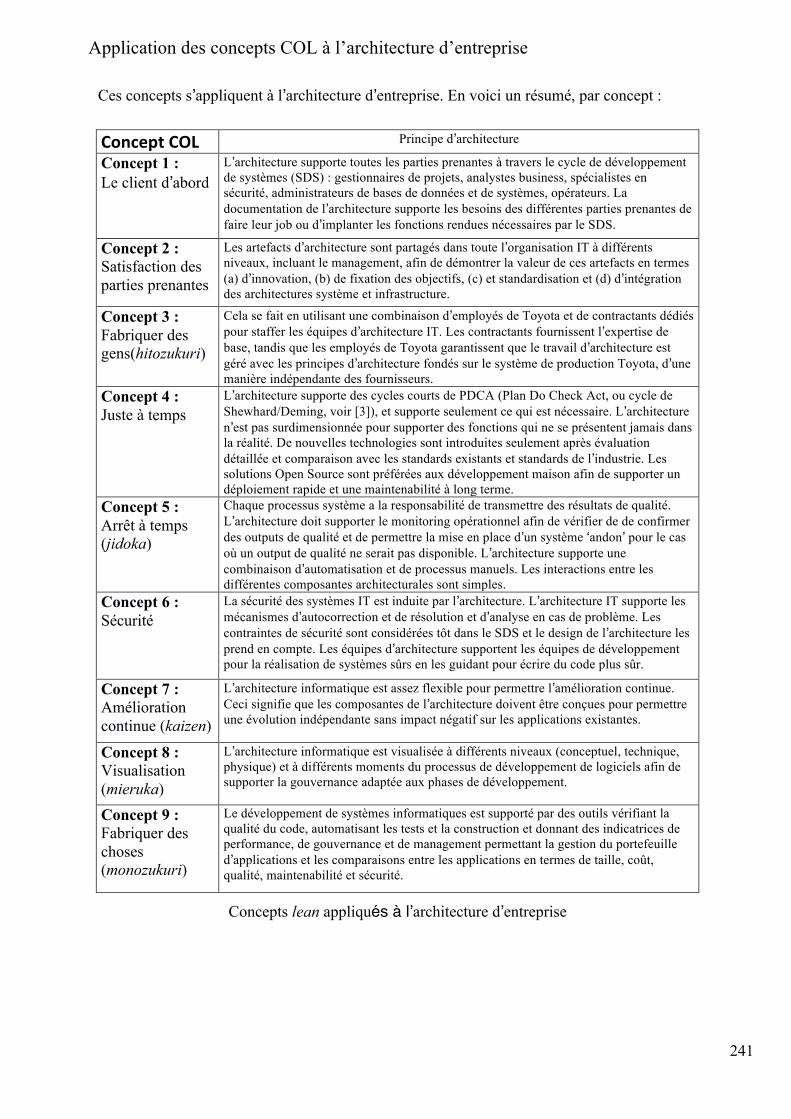
241
Application des concepts COL à l’architecture d’entreprise
Ces concepts s’appliquent à l’architecture d’entreprise. En voici un résumé, par concept :
ConceptCOL Principe d’architecture
Concept 1 : Le client d’abord
L’architecture supporte toutes les parties prenantes à travers le cycle de développement de systèmes (SDS) : gestionnaires de projets, analystes business, spécialistes en sécurité, administrateurs de bases de données et de systèmes, opérateurs. La documentation de l’architecture supporte les besoins des différentes parties prenantes de faire leur job ou d’implanter les fonctions rendues nécessaires par le SDS.
Concept 2 : Satisfaction des parties prenantes
Les artefacts d’architecture sont partagés dans toute l’organisation IT à différents niveaux, incluant le management, afin de démontrer la valeur de ces artefacts en termes (a) d’innovation, (b) de fixation des objectifs, (c) et standardisation et (d) d’intégration des architectures système et infrastructure.
Concept 3 : Fabriquer des gens(hitozukuri)
Cela se fait en utilisant une combinaison d’employés de Toyota et de contractants dédiés pour staffer les équipes d’architecture IT. Les contractants fournissent l’expertise de base, tandis que les employés de Toyota garantissent que le travail d’architecture est géré avec les principes d’architecture fondés sur le système de production Toyota, d’une manière indépendante des fournisseurs.
Concept 4 : Juste à temps
L’architecture supporte des cycles courts de PDCA (Plan Do Check Act, ou cycle de Shewhard/Deming, voir [3]), et supporte seulement ce qui est nécessaire. L’architecture n’est pas surdimensionnée pour supporter des fonctions qui ne se présentent jamais dans la réalité. De nouvelles technologies sont introduites seulement après évaluation détaillée et comparaison avec les standards existants et standards de l’industrie. Les solutions Open Source sont préférées aux développement maison afin de supporter un déploiement rapide et une maintenabilité à long terme.
Concept 5 : Arrêt à temps (jidoka)
Chaque processus système a la responsabilité de transmettre des résultats de qualité. L’architecture doit supporter le monitoring opérationnel afin de vérifier de de confirmer des outputs de qualité et de permettre la mise en place d’un système ‘andon’ pour le cas où un output de qualité ne serait pas disponible. L’architecture supporte une combinaison d’automatisation et de processus manuels. Les interactions entre les différentes composantes architecturales sont simples.
Concept 6 : Sécurité
La sécurité des systèmes IT est induite par l’architecture. L’architecture IT supporte les mécanismes d’autocorrection et de résolution et d’analyse en cas de problème. Les contraintes de sécurité sont considérées tôt dans le SDS et le design de l’architecture les prend en compte. Les équipes d’architecture supportent les équipes de développement pour la réalisation de systèmes sûrs en les guidant pour écrire du code plus sûr.
Concept 7 : Amélioration continue (kaizen)
L’architecture informatique est assez flexible pour permettre l’amélioration continue. Ceci signifie que les composantes de l’architecture doivent être conçues pour permettre une évolution indépendante sans impact négatif sur les applications existantes.
Concept 8 : Visualisation (mieruka)
L’architecture informatique est visualisée à différents niveaux (conceptuel, technique, physique) et à différents moments du processus de développement de logiciels afin de supporter la gouvernance adaptée aux phases de développement.
Concept 9 : Fabriquer des choses (monozukuri)
Le développement de systèmes informatiques est supporté par des outils vérifiant la qualité du code, automatisant les tests et la construction et donnant des indicatrices de performance, de gouvernance et de management permettant la gestion du portefeuille d’applications et les comparaisons entre les applications en termes de taille, coût, qualité, maintenabilité et sécurité.
Concepts lean appliqués à l’architecture d’entreprise
242
Le lean et le système immunitaire
Le travail dans l’équipe CSTB (systèmes complexes et bio-informatique translationnelle) a rendu
possible l’interaction avec les biologistes. Ceci a montré à quel point les notions décrivant la vie des
organisations et celle des êtres humains se rejoignent.
Le travail présenté dans cette section est basé sur un article en préparation avec Véronique Thomas-
Vaslin, chercheur et immunologiste impliquée dans la caractérisation et la modélisation de
l’organisation et du vieillissement du système immunitaire. Ceci est construit sur des publications
précédentes expliquant la complexité du système immunitaire guidant la réflexion sur la comparaison
entre l’organisation lean et les figures qui la représentent dans le temps et dans l’espace. Cela explique
aussi les défis pour comprendre l’organisation et la modéliser. Cette section visualise la comparaison
entre ces concepts au niveau méta, puis aux niveaux macroscopique et microscopique. Alors que les
cellules humaines se régénèrent en permanence, elles ont un processus de vieillissement qui empêche
que ce phénomène ne continue éternellement. Il peut également être observé que les sociétés ont un
phénomène similaire qui se produit, avec l’arrivée de nouveaux employés. De même, les sociétés
vieillissent et deviennent finalement non pertinentes quand le monde a trop changé. Si la durée de vie
moyenne des êtres humains et des entreprises est comparée, on voit qu’elles sont similaires, environ 75
ans. Les organisations lean mettent l’accent sur le coaching des employés et leur donnent le pouvoir de
venir avec leurs propres idées en utilisant un processus strict de sélection. Ceci les rend plus résilientes
comparées aux organisations top-down qui dépendent trop d’un leader particulier. Les figures …
représentent le système immunitaire et l’organisation lean. Leur ressemblance est frappante.
Le lean dans le contexte culturel
Il est expliqué ici comment le lean peut être appliqué à différents environnements culturels, un facteur
clef de succès pour les implantations lean et donc une dimension importante à utiliser dans la
modélisation du lean. Les découvertes d’un anthropologue (Geert Hofstede) et d’un professeur d’école
de commerce (Erin Meyer) sont à la base de la création d’une série d’ontologies imbriquées qui montrent
comment la connaissance culturelle peut être comprise et modélisée. Lorsque ceci est terminé, la
connaissance particulière du lean peut être adaptée à l’information culturelle. Ceci est montré avec des
exemples et du pseudocode. Afin d’illustrer les concepts proposés ici, une expérimentation est proposée,
prenant le processus de hoshin kanri décrit plus haut, et y ajoutant la dimensions culturelle et
contextuelle. Ceci permet d’enrichir les modèles de connaissance et de règles du lean avec l’expérience
et la méta-connaissance venant du contexte culturel. Clarifier le vocabulaire et formaliser les
interactions qui étaient auparavant imprécises a donné une base solide pour les travaux futurs.
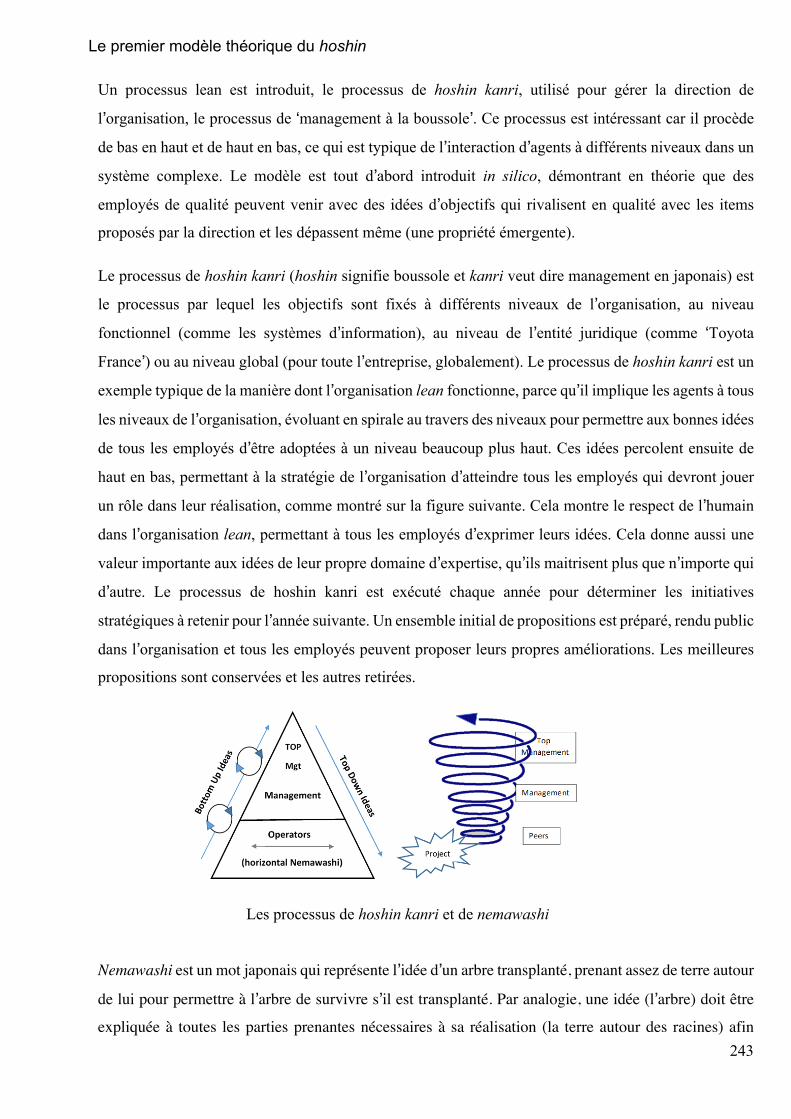
243
Le premier modèle théorique du hoshin
Un processus lean est introduit, le processus de hoshin kanri, utilisé pour gérer la direction de
l’organisation, le processus de ‘management à la boussole’. Ce processus est intéressant car il procède
de bas en haut et de haut en bas, ce qui est typique de l’interaction d’agents à différents niveaux dans un
système complexe. Le modèle est tout d’abord introduit in silico, démontrant en théorie que des
employés de qualité peuvent venir avec des idées d’objectifs qui rivalisent en qualité avec les items
proposés par la direction et les dépassent même (une propriété émergente).
Le processus de hoshin kanri (hoshin signifie boussole et kanri veut dire management en japonais) est
le processus par lequel les objectifs sont fixés à différents niveaux de l’organisation, au niveau
fonctionnel (comme les systèmes d’information), au niveau de l’entité juridique (comme ‘Toyota
France’) ou au niveau global (pour toute l’entreprise, globalement). Le processus de hoshin kanri est un
exemple typique de la manière dont l’organisation lean fonctionne, parce qu’il implique les agents à tous
les niveaux de l’organisation, évoluant en spirale au travers des niveaux pour permettre aux bonnes idées
de tous les employés d’être adoptées à un niveau beaucoup plus haut. Ces idées percolent ensuite de
haut en bas, permettant à la stratégie de l’organisation d’atteindre tous les employés qui devront jouer
un rôle dans leur réalisation, comme montré sur la figure suivante. Cela montre le respect de l’humain
dans l’organisation lean, permettant à tous les employés d’exprimer leurs idées. Cela donne aussi une
valeur importante aux idées de leur propre domaine d’expertise, qu’ils maitrisent plus que n’importe qui
d’autre. Le processus de hoshin kanri est exécuté chaque année pour déterminer les initiatives
stratégiques à retenir pour l’année suivante. Un ensemble initial de propositions est préparé, rendu public
dans l’organisation et tous les employés peuvent proposer leurs propres améliorations. Les meilleures
propositions sont conservées et les autres retirées.
Les processus de hoshin kanri et de nemawashi
Nemawashi est un mot japonais qui représente l’idée d’un arbre transplanté, prenant assez de terre autour
de lui pour permettre à l’arbre de survivre s’il est transplanté. Par analogie, une idée (l’arbre) doit être
expliquée à toutes les parties prenantes nécessaires à sa réalisation (la terre autour des racines) afin
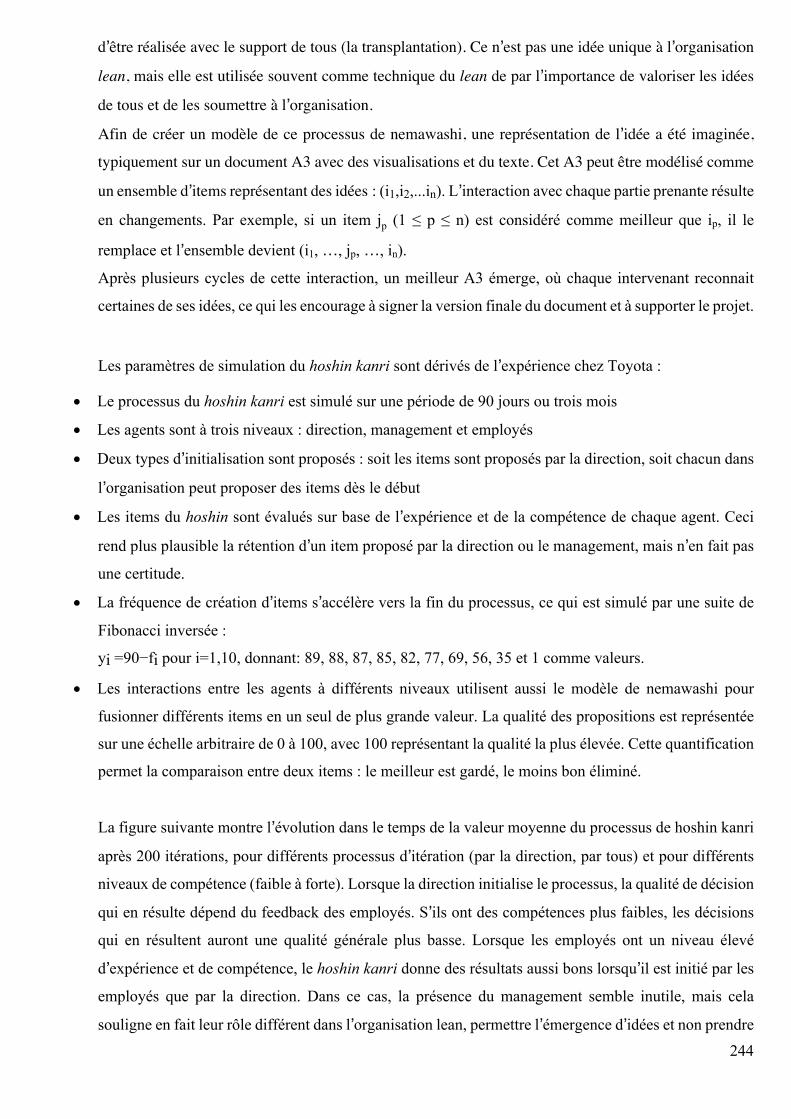
244
d’être réalisée avec le support de tous (la transplantation). Ce n’est pas une idée unique à l’organisation
lean, mais elle est utilisée souvent comme technique du lean de par l’importance de valoriser les idées
de tous et de les soumettre à l’organisation.
Afin de créer un modèle de ce processus de nemawashi, une représentation de l’idée a été imaginée,
typiquement sur un document A3 avec des visualisations et du texte. Cet A3 peut être modélisé comme
un ensemble d’items représentant des idées : (i1,i2,...in). L’interaction avec chaque partie prenante résulte
en changements. Par exemple, si un item jp (1 ≤ p ≤ n) est considéré comme meilleur que ip, il le
remplace et l’ensemble devient (i1, …, jp, …, in).
Après plusieurs cycles de cette interaction, un meilleur A3 émerge, où chaque intervenant reconnait
certaines de ses idées, ce qui les encourage à signer la version finale du document et à supporter le projet.
Les paramètres de simulation du hoshin kanri sont dérivés de l’expérience chez Toyota :
• Le processus du hoshin kanri est simulé sur une période de 90 jours ou trois mois
• Les agents sont à trois niveaux : direction, management et employés
• Deux types d’initialisation sont proposés : soit les items sont proposés par la direction, soit chacun dans
l’organisation peut proposer des items dès le début
• Les items du hoshin sont évalués sur base de l’expérience et de la compétence de chaque agent. Ceci
rend plus plausible la rétention d’un item proposé par la direction ou le management, mais n’en fait pas
une certitude.
• La fréquence de création d’items s’accélère vers la fin du processus, ce qui est simulé par une suite de
Fibonacci inversée :
yi =90−fi pour i=1,10, donnant: 89, 88, 87, 85, 82, 77, 69, 56, 35 et 1 comme valeurs.
• Les interactions entre les agents à différents niveaux utilisent aussi le modèle de nemawashi pour
fusionner différents items en un seul de plus grande valeur. La qualité des propositions est représentée
sur une échelle arbitraire de 0 à 100, avec 100 représentant la qualité la plus élevée. Cette quantification
permet la comparaison entre deux items : le meilleur est gardé, le moins bon éliminé.
La figure suivante montre l’évolution dans le temps de la valeur moyenne du processus de hoshin kanri
après 200 itérations, pour différents processus d’itération (par la direction, par tous) et pour différents
niveaux de compétence (faible à forte). Lorsque la direction initialise le processus, la qualité de décision
qui en résulte dépend du feedback des employés. S’ils ont des compétences plus faibles, les décisions
qui en résultent auront une qualité générale plus basse. Lorsque les employés ont un niveau élevé
d’expérience et de compétence, le hoshin kanri donne des résultats aussi bons lorsqu’il est initié par les
employés que par la direction. Dans ce cas, la présence du management semble inutile, mais cela
souligne en fait leur rôle différent dans l’organisation lean, permettre l’émergence d’idées et non prendre
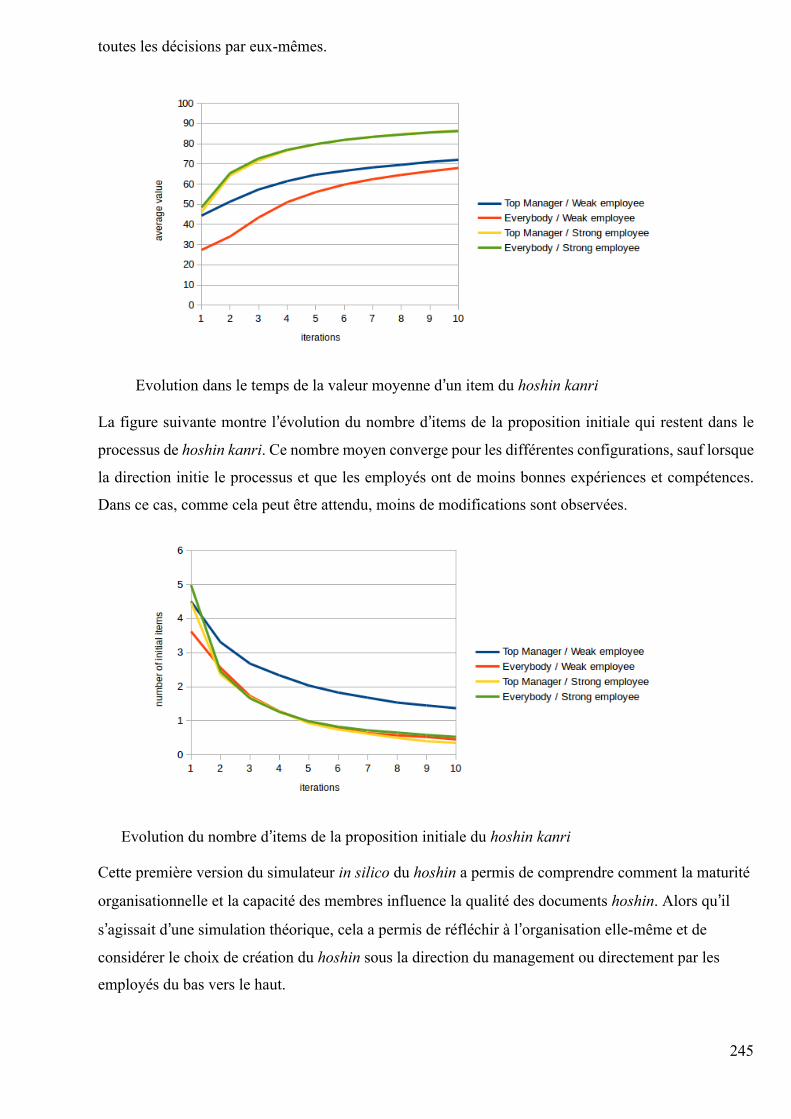
245
toutes les décisions par eux-mêmes.
Evolution dans le temps de la valeur moyenne d’un item du hoshin kanri
La figure suivante montre l’évolution du nombre d’items de la proposition initiale qui restent dans le
processus de hoshin kanri. Ce nombre moyen converge pour les différentes configurations, sauf lorsque
la direction initie le processus et que les employés ont de moins bonnes expériences et compétences.
Dans ce cas, comme cela peut être attendu, moins de modifications sont observées.
Evolution du nombre d’items de la proposition initiale du hoshin kanri
Cette première version du simulateur in silico du hoshin a permis de comprendre comment la maturité
organisationnelle et la capacité des membres influence la qualité des documents hoshin. Alors qu’il
s’agissait d’une simulation théorique, cela a permis de réfléchir à l’organisation elle-même et de
considérer le choix de création du hoshin sous la direction du management ou directement par les
employés du bas vers le haut.
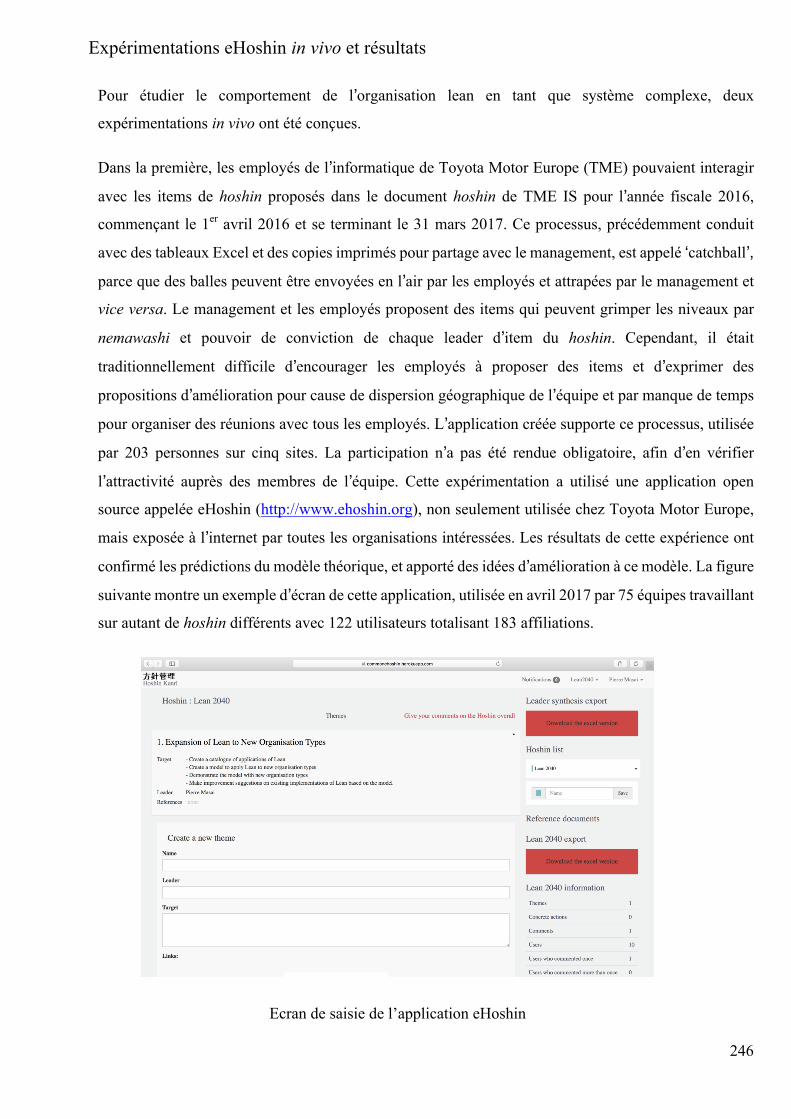
246
Expérimentations eHoshin in vivo et résultats
Pour étudier le comportement de l’organisation lean en tant que système complexe, deux
expérimentations in vivo ont été conçues.
Dans la première, les employés de l’informatique de Toyota Motor Europe (TME) pouvaient interagir
avec les items de hoshin proposés dans le document hoshin de TME IS pour l’année fiscale 2016,
commençant le 1er avril 2016 et se terminant le 31 mars 2017. Ce processus, précédemment conduit
avec des tableaux Excel et des copies imprimés pour partage avec le management, est appelé ‘catchball’,
parce que des balles peuvent être envoyées en l’air par les employés et attrapées par le management et
vice versa. Le management et les employés proposent des items qui peuvent grimper les niveaux par
nemawashi et pouvoir de conviction de chaque leader d’item du hoshin. Cependant, il était
traditionnellement difficile d’encourager les employés à proposer des items et d’exprimer des
propositions d’amélioration pour cause de dispersion géographique de l’équipe et par manque de temps
pour organiser des réunions avec tous les employés. L’application créée supporte ce processus, utilisée
par 203 personnes sur cinq sites. La participation n’a pas été rendue obligatoire, afin d’en vérifier
l’attractivité auprès des membres de l’équipe. Cette expérimentation a utilisé une application open
source appelée eHoshin (http://www.ehoshin.org), non seulement utilisée chez Toyota Motor Europe,
mais exposée à l’internet par toutes les organisations intéressées. Les résultats de cette expérience ont
confirmé les prédictions du modèle théorique, et apporté des idées d’amélioration à ce modèle. La figure
suivante montre un exemple d’écran de cette application, utilisée en avril 2017 par 75 équipes travaillant
sur autant de hoshin différents avec 122 utilisateurs totalisant 183 affiliations.
Ecran de saisie de l’application eHoshin
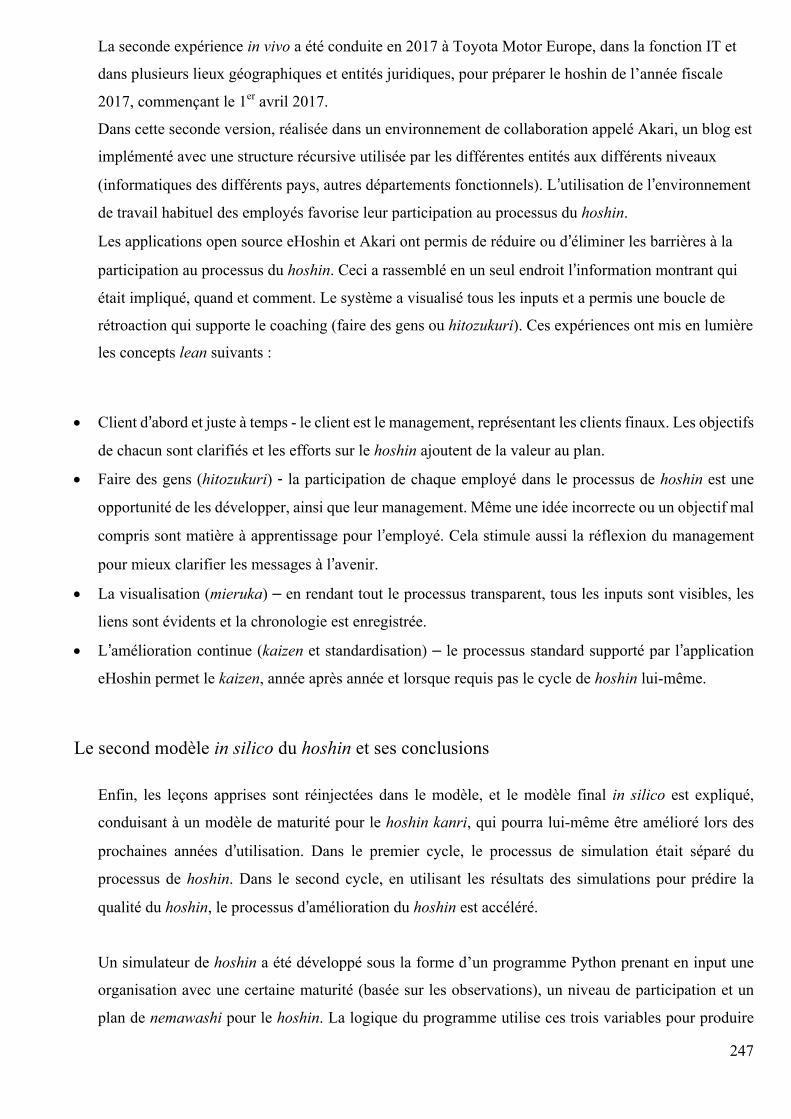
247
La seconde expérience in vivo a été conduite en 2017 à Toyota Motor Europe, dans la fonction IT et
dans plusieurs lieux géographiques et entités juridiques, pour préparer le hoshin de l’année fiscale
2017, commençant le 1er avril 2017.
Dans cette seconde version, réalisée dans un environnement de collaboration appelé Akari, un blog est
implémenté avec une structure récursive utilisée par les différentes entités aux différents niveaux
(informatiques des différents pays, autres départements fonctionnels). L’utilisation de l’environnement
de travail habituel des employés favorise leur participation au processus du hoshin.
Les applications open source eHoshin et Akari ont permis de réduire ou d’éliminer les barrières à la
participation au processus du hoshin. Ceci a rassemblé en un seul endroit l’information montrant qui
était impliqué, quand et comment. Le système a visualisé tous les inputs et a permis une boucle de
rétroaction qui supporte le coaching (faire des gens ou hitozukuri). Ces expériences ont mis en lumière
les concepts lean suivants :
• Client d’abord et juste à temps - le client est le management, représentant les clients finaux. Les objectifs
de chacun sont clarifiés et les efforts sur le hoshin ajoutent de la valeur au plan.
• Faire des gens (hitozukuri) - la participation de chaque employé dans le processus de hoshin est une
opportunité de les développer, ainsi que leur management. Même une idée incorrecte ou un objectif mal
compris sont matière à apprentissage pour l’employé. Cela stimule aussi la réflexion du management
pour mieux clarifier les messages à l’avenir.
• La visualisation (mieruka) – en rendant tout le processus transparent, tous les inputs sont visibles, les
liens sont évidents et la chronologie est enregistrée.
• L’amélioration continue (kaizen et standardisation) – le processus standard supporté par l’application
eHoshin permet le kaizen, année après année et lorsque requis pas le cycle de hoshin lui-même.
Le second modèle in silico du hoshin et ses conclusions
Enfin, les leçons apprises sont réinjectées dans le modèle, et le modèle final in silico est expliqué,
conduisant à un modèle de maturité pour le hoshin kanri, qui pourra lui-même être amélioré lors des
prochaines années d’utilisation. Dans le premier cycle, le processus de simulation était séparé du
processus de hoshin. Dans le second cycle, en utilisant les résultats des simulations pour prédire la
qualité du hoshin, le processus d’amélioration du hoshin est accéléré.
Un simulateur de hoshin a été développé sous la forme d’un programme Python prenant en input une
organisation avec une certaine maturité (basée sur les observations), un niveau de participation et un
plan de nemawashi pour le hoshin. La logique du programme utilise ces trois variables pour produire
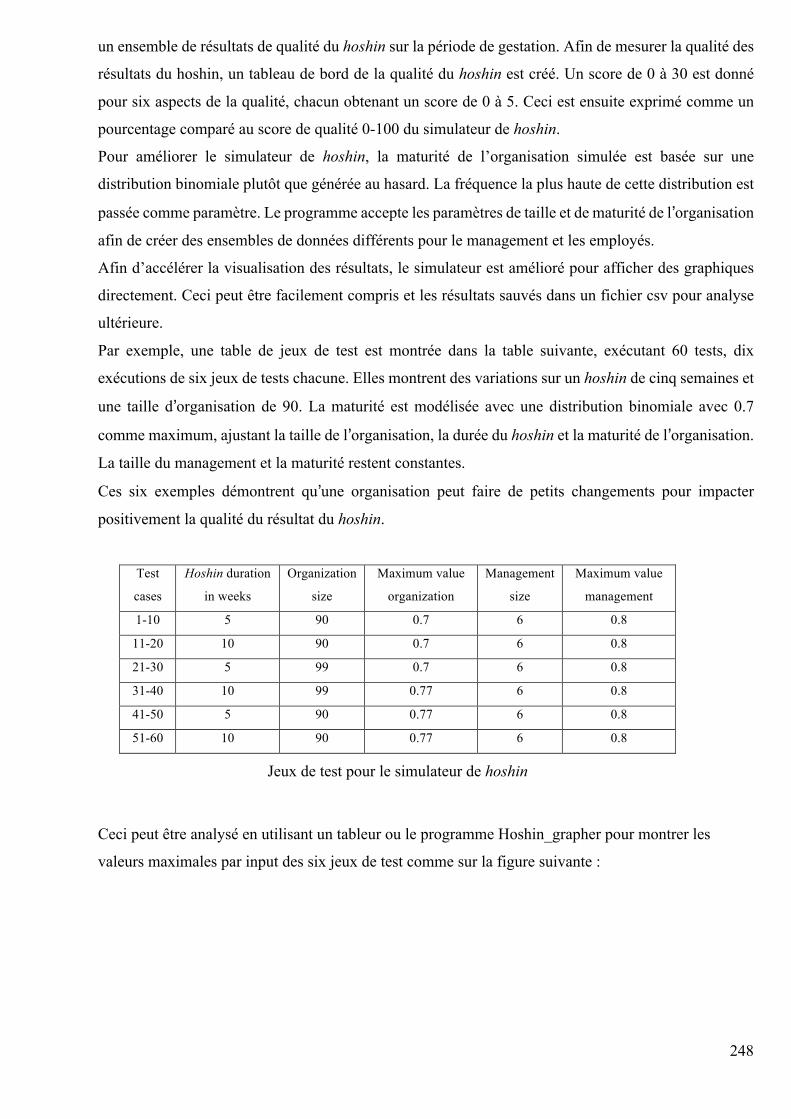
248
un ensemble de résultats de qualité du hoshin sur la période de gestation. Afin de mesurer la qualité des
résultats du hoshin, un tableau de bord de la qualité du hoshin est créé. Un score de 0 à 30 est donné
pour six aspects de la qualité, chacun obtenant un score de 0 à 5. Ceci est ensuite exprimé comme un
pourcentage comparé au score de qualité 0-100 du simulateur de hoshin.
Pour améliorer le simulateur de hoshin, la maturité de l’organisation simulée est basée sur une
distribution binomiale plutôt que générée au hasard. La fréquence la plus haute de cette distribution est
passée comme paramètre. Le programme accepte les paramètres de taille et de maturité de l’organisation
afin de créer des ensembles de données différents pour le management et les employés.
Afin d’accélérer la visualisation des résultats, le simulateur est amélioré pour afficher des graphiques
directement. Ceci peut être facilement compris et les résultats sauvés dans un fichier csv pour analyse
ultérieure.
Par exemple, une table de jeux de test est montrée dans la table suivante, exécutant 60 tests, dix
exécutions de six jeux de tests chacune. Elles montrent des variations sur un hoshin de cinq semaines et
une taille d’organisation de 90. La maturité est modélisée avec une distribution binomiale avec 0.7
comme maximum, ajustant la taille de l’organisation, la durée du hoshin et la maturité de l’organisation.
La taille du management et la maturité restent constantes.
Ces six exemples démontrent qu’une organisation peut faire de petits changements pour impacter
positivement la qualité du résultat du hoshin.
Test
cases
Hoshin duration
in weeks
Organization
size
Maximum value
organization
Management
size
Maximum value
management
1-10 5 90 0.7 6 0.8
11-20 10 90 0.7 6 0.8
21-30 5 99 0.7 6 0.8
31-40 10 99 0.77 6 0.8
41-50 5 90 0.77 6 0.8
51-60 10 90 0.77 6 0.8
Jeux de test pour le simulateur de hoshin
Ceci peut être analysé en utilisant un tableur ou le programme Hoshin_grapher pour montrer les
valeurs maximales par input des six jeux de test comme sur la figure suivante :
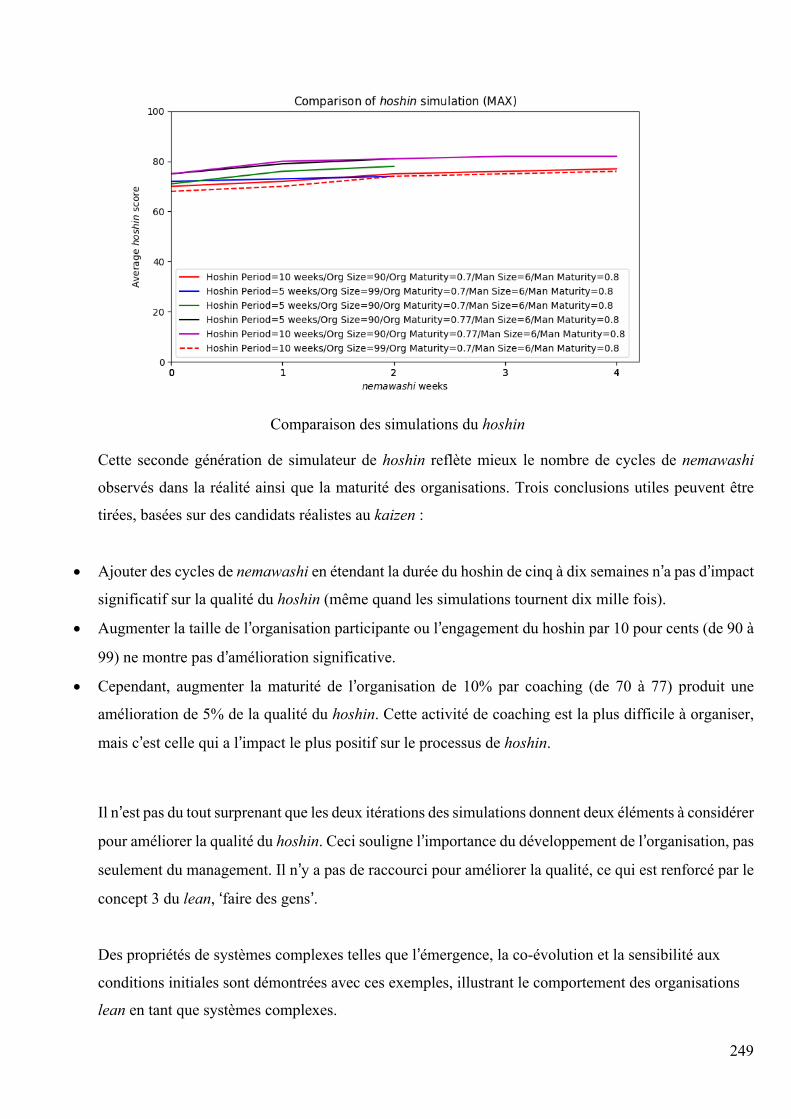
249
Comparaison des simulations du hoshin
Cette seconde génération de simulateur de hoshin reflète mieux le nombre de cycles de nemawashi
observés dans la réalité ainsi que la maturité des organisations. Trois conclusions utiles peuvent être
tirées, basées sur des candidats réalistes au kaizen :
• Ajouter des cycles de nemawashi en étendant la durée du hoshin de cinq à dix semaines n’a pas d’impact
significatif sur la qualité du hoshin (même quand les simulations tournent dix mille fois).
• Augmenter la taille de l’organisation participante ou l’engagement du hoshin par 10 pour cents (de 90 à
99) ne montre pas d’amélioration significative.
• Cependant, augmenter la maturité de l’organisation de 10% par coaching (de 70 à 77) produit une
amélioration de 5% de la qualité du hoshin. Cette activité de coaching est la plus difficile à organiser,
mais c’est celle qui a l’impact le plus positif sur le processus de hoshin.
Il n’est pas du tout surprenant que les deux itérations des simulations donnent deux éléments à considérer
pour améliorer la qualité du hoshin. Ceci souligne l’importance du développement de l’organisation, pas
seulement du management. Il n’y a pas de raccourci pour améliorer la qualité, ce qui est renforcé par le
concept 3 du lean, ‘faire des gens’.
Des propriétés de systèmes complexes telles que l’émergence, la co-évolution et la sensibilité aux
conditions initiales sont démontrées avec ces exemples, illustrant le comportement des organisations
lean en tant que systèmes complexes.
250
Résumé en français Dans cette thèse, après avoir expliqué l'historique et les concepts principaux de l’organisation lean dans différents contextes, le monde des systèmes complexes est exploré, puis il est montré pourquoi le lean est lui-même un système complexe. Un modèle novateur du lean est proposé sous forme d'ontologie, le Cadre Organisationnel Lean (COL), qui peut être appliqué à toutes les formes d’organisations. Le COL est testé avec celles qui ont déjà été explorées, proposant ainsi des pistes d’amélioration (lean pour la fabrication, pour l’IT, pour les soins de santé, pour les services publics, pour les organisations non gouvernementales, pour les start-ups et pour l’enseignement). Il peut également être appliqué à de nouveaux domaines d’activités avec l’aide d’experts dans ces domaines, une approche montrée avec les exemples nouveaux d’une fondation lean et de l’architecture d’entreprise lean, mais aussi en comparant l’organisation lean au système immunitaire, un exemple bien connu de système complexe. Ensuite, un modèle de processus lean est proposé, présentant les propriétés émergentes d’un système complexe, le hoshin kanri (gestion des objectifs de l’organisation), y compris dans sa dimension culturelle. Les résultats de son expérimentation pratique avec l’application eHoshin sont discutés et un premier prototype en open source est présenté, déjà utilisé à ce jour par une centaine d’organisations dans le monde. Une seconde expérimentation plus robuste dans l’industrie (Toyota, dans plusieurs fonctions et entités juridiques) est exposée. Le modèle théorique est enfin amélioré sur base des résultats obtenus. En annexe, les concepts du lean sont expliqués avec leur application à six domaines de connaissance différents et les programmes de simulations sont listés. La troisième annexe contient en résumé plus complet en français.
Mots clés : lean, système de production Toyota, systèmes complexes, modélisation
Summary in English In this thesis, after explaining the history and main concepts of the lean organization in various contexts, the world of complex systems is explored, then it is shown why the lean organization is itself a Complex System. A novel model of lean is proposed as an ontology, the Lean Organization Framework (LOF), which can be applied to all forms of organizations. The LOF is tested with those already explored (Lean Manufacturing, Lean IT, Lean Healthcare, Lean Government, Lean NGO, Lean Start-Up, Lean Education) and proposes ways to enhance them. It can also be applied to new domains with the help of subject matter experts, an approach that is checked with the novel cases of a Lean Foundation and Lean Enterprise Architecture (Lean EA), but also with the comparison of the lean organization with the immune system, a well-known Complex System example. Then, a model of lean process presenting the emergent properties of a Complex System is proposed: the hoshin kanri, or management of the organization objectives, including the cultural dimension. The results of its practical implementation with the eHoshin application are discussed and a first open source prototype already used by around one hundred organizations in the world is explained. A second, more robust implementation in the industry is presented (at Toyota, extended to several departments and legal entities). Finally, the theoretical model is improved based on the experimentation results. In the appendices, the lean concepts are explained with their application to six domains of knowledge, the simulation programs are listed and a more complete French language summary is given.
Keywords: lean, Complex Systems, Toyota Production System, Modeling
Related Documents


