Modeling the Electrochemical Hydrogen Oxidation and Evolution Reactions on the Basis of Density Functional Theory Calculations Egill Sku ´ lason, †,‡ Vladimir Tripkovic, † Mårten E. Bjo ¨rketun, † Sigrı ´dur Gudmundsdo ´ttir, ‡ Gustav Karlberg, † Jan Rossmeisl, † Thomas Bligaard, † Hannes Jo ´nsson, §,| and Jens K. Nørskov* ,†,|,⊥ Center for Atomic-scale Materials Design, Department of Physics, Building 311, Technical UniVersity of Denmark, DK-2800 Lyngby, Denmark, Science Institute, VR-III, UniVersity of Iceland, IS-107 ReykjaVik, Iceland, Faculty of Science, VR-III, UniVersity of Iceland, IS-107 ReykjaVik, Iceland, Center for Interface Science and Catalysis, SLAC National Accelerator Laboratory, 2575 Sand Hill Road, Menlo Park, California 94025, and Department of Chemical Engineering, Stanford UniVersity, Stanford, California 94305 ReceiVed: May 27, 2010; ReVised Manuscript ReceiVed: August 20, 2010 Density functional theory calculations have been performed for the three elementary steps;Tafel, Heyrovsky, and Volmer;involved in the hydrogen oxidation reaction (HOR) and its reverse, the hydrogen evolution reaction (HER). For the Pt(111) surface a detailed model consisting of a negatively charged Pt(111) slab and solvated protons in up to three water bilayers is considered and reaction energies and activation barriers are determined by using a newly developed computational scheme where the potential can be kept constant during a charge transfer reaction. We determine the rate limiting reaction on Pt(111) to be Tafel-Volmer for HOR and Volmer-Tafel for HER. Calculated rates agree well with experimental data. Both the H adsorption energy and the energy barrier for the Tafel reaction are then calculated for a range of metal electrodes, including Au, Ag, Cu, Pt, Pd, Ni, Ir, Rh, Co, Ru, Re, W, Mo, and Nb, different facets, and step of surfaces. We compare the results for different facets of the Pt electrode to experimental data. Our results suggest that the most important parameter for describing the HOR or the HER activity of an electrode is its binding free energy of H. We present a detailed kinetic model based entirely on the DFT reactions and show that the exchange current follows a volcano curve when plotted against the H adsorption free energy in excellent agreement with experimental data. 1. Introduction Any hydrogen-based energy conversion scenario relies on effective and cheap catalysts for oxidation and reduction of hydrogen. 1 Platinum-based catalysts are effective and stable for both hydrogen oxidation reaction (HOR) and hydrogen evolution reaction (HER) under acidic conditions as it is found in a polymer electrolyte fuel cell or electrolyzer. However, since Pt is rare and expensive there is a need for the development of electrodes made of cheaper materials. To be able to design new electrodes for the hydrogen evolution or oxidation reactions, it may well prove essential to acquire insight into their mechanism at the atomic level. 2-7 It is generally accepted that the overall HOR/HER reaction H 2 T 2(H + + e - ), taking place at an electrode in contact with an electrolyte, involves three elementary reactions. In the first step, H 2 is dissociated and H adsorbed. This is accomplished either by the Tafel reaction H 2 f 2H* (H* denotes hydrogen adsorbed on the surface) or by the Heyrovsky reaction H 2 f H* + H + + e - . The adsorbed H is then discharged, following the Volmer route H* f H + + e - . Despite intensive research efforts it is still unclear which of the two pathways, Tafel-Volmer or Heyrovsky-Volmer, dominates under different conditions even on the most studied electrode material, Pt. The Volmer reaction is usually considered fast 3 but the literature contains conflicting reports about the other two reactions. From some experimental studies it has been inferred that the Tafel reaction is the predominant mechanism and rate-limiting step on Pt(110) 2 and different facets of Pt. 4-6 This was recently supported by first principles calculations at the Pt(110)/water interface. 8 At the same time, other investigations report the Heyrovsky reaction to be the rate-determining step;both on Pt(100) 2 and on polycrystalline Pt. 7 In simulations a similar conclusion has been obtained for a single Pt atom 9 and on a diamond electrode. 10 The picture is equally confusing on the Pt(111) electrode surface. 2,11 The current view appears to be that different metal facets open up different reaction mechanisms for HOR and HER. Other studies, based on modeling the kinetics of HOR on Pt electrodes over the entire relevant potential region, conclude that the Volmer-Tafel pathway is dominating at low overpo- tentials whereas the Volmer-Heyrovsky route becomes impor- tant at high overpotentials. 12 Most experimental insight about the mechanism has been inferred from rate measurements. Such a procedure will typically not provide conclusive evidence for a mechanism, since the measured rate depends on several elementary steps. Quantum chemical calculations can serve as a valuable complement. The calculations can be used to model electrochemical systems and have the potential to provide unique molecular-level information about processes at the interface. However, due to the complex environment it has only recently been possible to model electrochemical systems with first-principles methods. 8-11,13-22 * To whom correspondence should be addressed. E-mail: norskov@ stanford.edu. † Technical University of Denmark. ‡ Science Institute, University of Iceland. § Faculty of Science, University of Iceland. | SLAC National Accelerator Laboratory. ⊥ Stanford University. J. Phys. Chem. C 2010, 114, 18182–18197 18182 10.1021/jp1048887 2010 American Chemical Society Published on Web 10/05/2010

Welcome message from author
This document is posted to help you gain knowledge. Please leave a comment to let me know what you think about it! Share it to your friends and learn new things together.
Transcript

Modeling the Electrochemical Hydrogen Oxidation and Evolution Reactions on the Basis ofDensity Functional Theory Calculations
Egill Skulason,†,‡ Vladimir Tripkovic,† Mårten E. Bjorketun,† Sigrıdur Gudmundsdottir,‡
Gustav Karlberg,† Jan Rossmeisl,† Thomas Bligaard,† Hannes Jonsson,§,| andJens K. Nørskov*,†,|,⊥
Center for Atomic-scale Materials Design, Department of Physics, Building 311, Technical UniVersity of Denmark,DK-2800 Lyngby, Denmark, Science Institute, VR-III, UniVersity of Iceland, IS-107 ReykjaVik, Iceland, Faculty ofScience, VR-III, UniVersity of Iceland, IS-107 ReykjaVik, Iceland, Center for Interface Science and Catalysis, SLACNational Accelerator Laboratory, 2575 Sand Hill Road, Menlo Park, California 94025, and Department of ChemicalEngineering, Stanford UniVersity, Stanford, California 94305
ReceiVed: May 27, 2010; ReVised Manuscript ReceiVed: August 20, 2010
Density functional theory calculations have been performed for the three elementary steps;Tafel, Heyrovsky,and Volmer;involved in the hydrogen oxidation reaction (HOR) and its reverse, the hydrogen evolutionreaction (HER). For the Pt(111) surface a detailed model consisting of a negatively charged Pt(111) slab andsolvated protons in up to three water bilayers is considered and reaction energies and activation barriers aredetermined by using a newly developed computational scheme where the potential can be kept constant duringa charge transfer reaction. We determine the rate limiting reaction on Pt(111) to be Tafel-Volmer for HORand Volmer-Tafel for HER. Calculated rates agree well with experimental data. Both the H adsorption energyand the energy barrier for the Tafel reaction are then calculated for a range of metal electrodes, including Au,Ag, Cu, Pt, Pd, Ni, Ir, Rh, Co, Ru, Re, W, Mo, and Nb, different facets, and step of surfaces. We comparethe results for different facets of the Pt electrode to experimental data. Our results suggest that the mostimportant parameter for describing the HOR or the HER activity of an electrode is its binding free energy ofH. We present a detailed kinetic model based entirely on the DFT reactions and show that the exchangecurrent follows a volcano curve when plotted against the H adsorption free energy in excellent agreementwith experimental data.
1. Introduction
Any hydrogen-based energy conversion scenario relies oneffective and cheap catalysts for oxidation and reduction ofhydrogen.1 Platinum-based catalysts are effective and stable forboth hydrogen oxidation reaction (HOR) and hydrogen evolutionreaction (HER) under acidic conditions as it is found in apolymer electrolyte fuel cell or electrolyzer. However, since Ptis rare and expensive there is a need for the development ofelectrodes made of cheaper materials. To be able to design newelectrodes for the hydrogen evolution or oxidation reactions, itmay well prove essential to acquire insight into their mechanismat the atomic level.2-7
It is generally accepted that the overall HOR/HER reactionH2 T 2(H+ + e-), taking place at an electrode in contact withan electrolyte, involves three elementary reactions. In the firststep, H2 is dissociated and H adsorbed. This is accomplishedeither by the Tafel reaction H2 f 2H* (H* denotes hydrogenadsorbed on the surface) or by the Heyrovsky reaction H2 fH* + H+ + e-. The adsorbed H is then discharged, followingthe Volmer route H* f H+ + e-. Despite intensive researchefforts it is still unclear which of the two pathways, Tafel-Volmeror Heyrovsky-Volmer, dominates under different conditions
even on the most studied electrode material, Pt. The Volmerreaction is usually considered fast3 but the literature containsconflicting reports about the other two reactions. From someexperimental studies it has been inferred that the Tafel reactionis the predominant mechanism and rate-limiting step on Pt(110)2
and different facets of Pt.4-6 This was recently supported byfirst principles calculations at the Pt(110)/water interface.8 Atthe same time, other investigations report the Heyrovsky reactionto be the rate-determining step;both on Pt(100)2 and onpolycrystalline Pt.7 In simulations a similar conclusion has beenobtained for a single Pt atom9 and on a diamond electrode.10
The picture is equally confusing on the Pt(111) electrodesurface.2,11 The current view appears to be that different metalfacets open up different reaction mechanisms for HOR and HER.Other studies, based on modeling the kinetics of HOR on Ptelectrodes over the entire relevant potential region, concludethat the Volmer-Tafel pathway is dominating at low overpo-tentials whereas the Volmer-Heyrovsky route becomes impor-tant at high overpotentials.12
Most experimental insight about the mechanism has beeninferred from rate measurements. Such a procedure will typicallynot provide conclusive evidence for a mechanism, since themeasured rate depends on several elementary steps. Quantumchemical calculations can serve as a valuable complement. Thecalculations can be used to model electrochemical systems andhave the potential to provide unique molecular-level informationabout processes at the interface. However, due to the complexenvironment it has only recently been possible to modelelectrochemical systems with first-principles methods.8-11,13-22
* To whom correspondence should be addressed. E-mail: [email protected].
† Technical University of Denmark.‡ Science Institute, University of Iceland.§ Faculty of Science, University of Iceland.| SLAC National Accelerator Laboratory.⊥ Stanford University.
J. Phys. Chem. C 2010, 114, 18182–1819718182
10.1021/jp1048887 2010 American Chemical SocietyPublished on Web 10/05/2010

Recently we introduced a general density functional theory(DFT) based model of the electrochemical half-cell that capturesmany of the features of the electrical double layer.11 The atomicsetup consists of a metal slab, hydrogen atoms (or other atomicspecies if required) adsorbed on the metal surface, and anelectrolyte represented by water layers outside the surface. Theelectrical double layer is formed by adding extra hydrogen atomsto the water layer. The hydrogen atom spontaneously separatesinto a proton becoming solvated in the water and an electronending up at the surface of the metal slab. We can vary thesurface charge, and hence the potential, by changing theconcentration of protons (hydronium ions) in the electrolyte.This is completely analogous to the experimental situation wherethe electrochemical double layer is set up by an equal numberof electrons and counterions. It avoids the introduction ofartificial counter-charge smeared out all over space18 or locatedfar from the surface.19 The down side of our approach is thatwe need to treat large surface unit cells in order to vary thecharge or potential semicontinuously.
A further challenge arises when studying chemical reactionsinvolving charge transfer, as is the case for the Heyrovsky andVolmer reactions. In a real system, where the area of theinterface can be considered infinite on an atomic scale, theelectrode potential will stay fixed during single charge transferreactions. However, since the simulation unit cells used in thecalculations are relatively small, the charge, and hence thepotential, will vary considerably along the reaction path.Sometimes this introduces large errors in the calculated reactionenergies and activation barriers. To avoid this artifact, werecently devised a scheme that enables calculation of activationand reaction energies in the limit where the bias is constantduring the reaction.21 Since this scheme has been employedthroughout this work a short review of the main ideas behind itwill be given below.
In the present work, we study the HOR and HER in detailby means of first-principles DFT. Since the Pt(111) electrodeis the most studied electrode for HOR and HER we first applyour detailed solid-liquid interface model to study the elementarysteps over Pt(111). We conclude the Tafel reaction to be therate-limiting reaction step, and a detailed analysis of the kineticsis carried out for that reaction. We study the structure-dependence of the reaction by comparing the calculated rateover Pt(111) to those of Pt(100) and Pt(110). We then determinethe H adsorption energy at varying H coverage on variouselectrode materials, including different transition metals andvarious surface structures. Finally, we use the energy profilesas input to a kinetic model of the HOR/HER current. Thisenables direct comparison with experimental data.
2. Method
2.1. Calculation Details. The electronic structure calculationshave been carried out with self-consistent DFT in a plane-wavepseudopotential implementation, with 26 Ry (354 eV) cutofffor both the plane waves and the densities.23-25 Most calculationswere performed with the DACAPO code, using the RPBEexchange-correlation functional.26,27 However, the Pt(100) andthe Pt(110) surfaces were treated by using the VASP code28,29
and the revPBE functional. A few test calculations wereperformed to compare the two xc-functionals and the reactionenergy differences were less than 0.07 eV in all cases. Allactivation barriers have been calculated with the nudged elasticband (NEB) method.30,31
To model the proton/electron transfer reactions;Volmer andHeyrovsky reactions;we have used the double layer model
described in more detail below in Section 2.2. To keep thepotential constant during charge transfer we apply an extrapola-tion scheme,21 which is also explained in some detail later inthis section. Since these barrier calculations are quite time-consuming, we have only performed the full extrapolationscheme on Pt(111) for the Volmer and Heyrovsky reactions.We have also performed such calculations of both the reactionsover Ru(0001), Pd(111), and Au(111) for a few differentpotentials and in general they agree well with the Pt calculations.In all these barrier calculations the slabs have been modeledwith 3 metal layers, but the surface dimensions have been varied:(3 × 2), (3 × 4), (6 × 2), (6 × 3), (6 × 4), and (6 × 8) repeatedunit cells have been employed, with (4 × 6), (4 × 3), (2 × 6),(2 × 4), (2 × 3), and (2 × 1) k-point sampling, respectively.The two bottom layers of the slabs were fixed at the respectiveRPBE lattice constants, while the remaining atoms were allowedto adjust until the magnitude of all residual forces was less than0.01 eV/Å.
For the Tafel reaction and H adsorption it has been shownthat the reaction energies and activation energies are almostunaffected by water, electric potentials, and electric fields.11,32
This is not surprising since there is no electron transfer to andfrom the electrode during this reaction (2H* f H2) and thedipole of the adsorbed H is small in the direction perpendicularto the surface. Hence these effects can be neglected and only asurface slab and adsorbed hydrogen have to be included in theatomic model. This makes the problem computationally muchless demanding. We can thus afford calculating the Tafelreaction and H adsorption energies as a function of H coveragefor a large set of close-packed FCC, HCP, and BCC surfacesand also for other facets and steps. In these calculations theclose-packed surfaces are modeled with three layers where thetwo bottom layers are kept fixed while the top layer is allowedto relax with the adsorbed hydrogen atoms. Pt(100) is modeledby using four layers, where the two bottom layers are fixed whilethe two top layers are relaxed with the hydrogen atoms. A testcalculation is carried out for the Pt(100) surface having threelayers instead of four layers, where the two bottom layers arefixed and the top layer is relaxed with the hydrogen atom. Hbinds slightly stronger to four Pt layers than to three Pt layers,or by less than 0.04 eV. The close-packed surfaces are typicallymodeled with (2 × 2) unit cells and (4 × 4) k-points but in afew cases we have increased the unit cells to (3 × 2), (4 × 4),and (6 × 4) in order to represent coverages close to an importantdiscontinuity in the adsorption energy, appearing at 1 ML Hcoverage. This point will be clarified later in Sections 2.4 and3.4.1. The (211) steps have three close-packed layers underneaththe step and a (2 × 3) unit cell with (4 × 4) k-point sampling.The Pt(110) surface is modeled with 8 Pt layers in total with a(3 × 4) unit cell and (4 × 4) k-point sampling.
2.2. Model of the Electrochemical Double Layer. A typicalsetup of the calculation is illustrated in Figure 1. When addingan additional H atom into the first water layer, the electron fromthis H atom spontaneously enters the metal slab and a solvatedhydronium ion (H3O+) is formed. In Figure 1 the charge iso-surfaces are plotted when having a solvated proton in the firstwater bilayer out of three water bilayers in total. The iso-surfacesare constructed by calculating the charge density differences ofthe whole system (FPt+e-+water+H+(r)) and two uncharged refer-ence systems, when having the Pt slab and neutral water aboveit in one supercell (FPt+water(r)) and the additional H atom inanother cell (FH(r)):
Modeling H Oxidation and Evolution Reactions J. Phys. Chem. C, Vol. 114, No. 42, 2010 18183

Figure 1 shows that the positive charge is localized in thefirst water bilayer and does not spread out to the water above.In other words, the positive charge is solvated in a two-dimensional plane at the solid-liquid interface. This indicatesthat we can solvate the proton by only using one water bilayerabove the slab.
In Figure 2 the charge iso-surfaces are plotted at severalproton concentrations/electrode potentials. Here, we use a singlewater bilayer above a Pt(111) slab. The positive (blue) chargeis quite localized around the H3O+ complex but some positivecharge is associated with the three water molecules in thesolvation cell. The solvation shell is in-between the Zundelstructure33,34 where the proton is shared between two watermolecules forming an H5O2
+ complex, and the Eigen structure35,36
where the hydronium ion is hydrogen bonded to three watermolecules, forming an H9O4
+ complex. Here the solvationstructure is two-dimensional in the vicinity of the surface,whereas the solvation shells are three-dimensional in bulkwater.37
We note that the negative charge (purple) of the additionalelectrons on the surface is rather localized underneath the protoninvolving of the order 6-9 Pt atoms. This suggests that modelsthat describe the double-layer as homogeneous along the surfacemay not include all relevant electrostatic effects in the calcula-tion. There are, however, a number of situations where sucheffects are of minor importance.
Each proton concentration corresponds to a certain electrodepotential (U) versus the normal hydrogen electrode (NHE). TheU values are varying here from negative to positive values. Thelink to an absolute U scale will be discussed in the following.
In ref 21 we introduced a direct link between the thermody-namic definition of the NHE electrode and the calculated work
function (WF). Hence, we have an internal definition of theabsolute potential scale for the solid/liquid interface as it ischarged with protons and electrons. The total free energy orthe integral free energy, Gint, is calculated per surface metalatom (or surface area) relative to H2 in the gas phase:
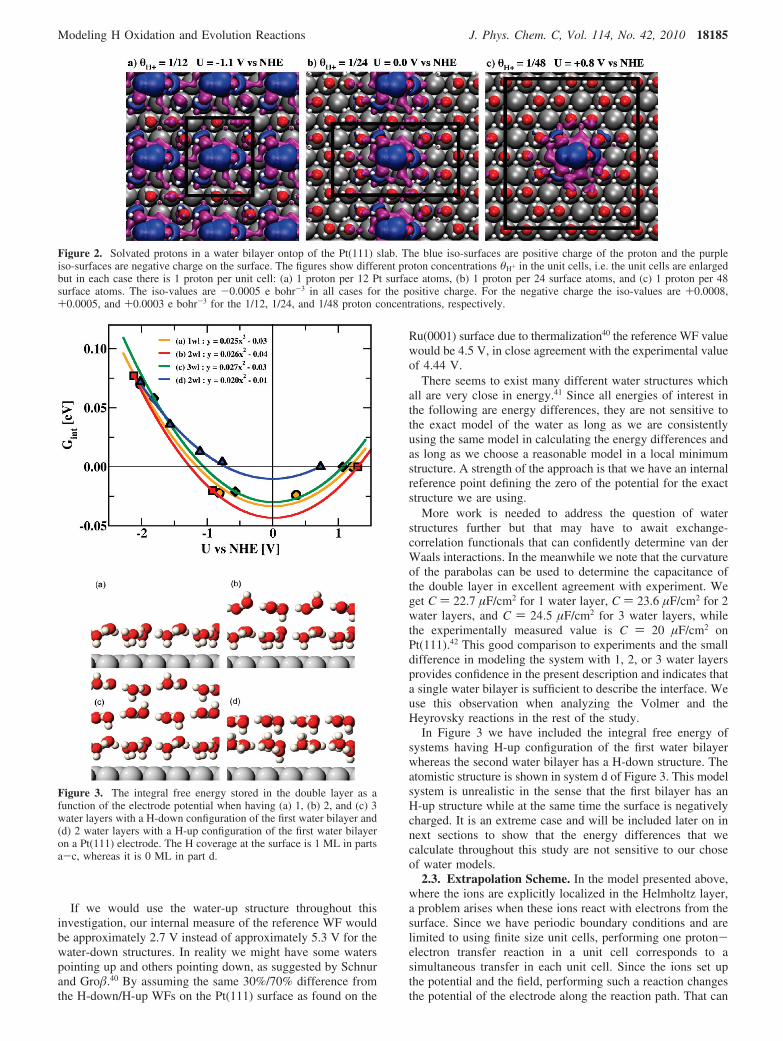
where N is the number of surface metal atoms in the surfaceunit cell and n is the number of protons in the double layer(per super cell). In Figure 3 we have calculated the integralfree energy of the charged double layer including 1, 2, and 3water bilayers, see the atomistic structures in systems a, b, andc of Figure 3, respectively. The variation in the WF (U scale)comes from variations of the proton/electron concentration. Thereference WF values we need to shift the parabolic functionsin order to have the minimum in free energy at U ) 0 V vsNHE are very similar for the different water layer systems: 5.28V for 1 and 3 water layers and 5.13 for the 2 water layers. Theexperimental value of the WF of the NHE compared to vacuumis usually measured to be 4.44 ( 0.02 V38 while a value of4.85 V has also been reported.39
It should be noted that when considering more than one waterbilayer we have altered the orientations of the water moleculesin the second and third layers in order to avoid building up netdipoles from the water network. The first water bilayer has anH-down structure in systems a-c in Figure 3 where structuresb and c have no net dipoles in the remaining layers. System dhas an H-up structure of the first water bilayer but that systemwill be discussed at a later point in this section. Since we areusing an atomistic model of the water at the interface, thereference value in our internal measure cannot be compareddirectly with the experimental value, obtained at real conditionsand at room temperature. In reality the water structure will bethermally distorted and not having every other water moleculeof the first water layer pointing the O-H bond toward thesurface as structures a-c in Figure 3.
Schnur and Gro� have recently studied the metal-waterinterface with ab initio molecular dynamic simulations at roomtemperature.40 There it is shown explicitly that the first waterlayer is neither purely a H-down structure nor a H-up structure,but a mixture of them both. The WF of the thermalizedmetal-water interface is also found to be somewhere in betweenthe WF of the H-down and the H-up structures.
We calculate the WF of a Pt(111) slab having one water layerto be 6.7 V for the water-down structure while it is 4.1 V withthe water-up structure. This 2.6 V difference between the twowater structures on Pt(111) is to be compared with a value ofaround 2.2 V difference for the same systems in the calculationsby Schnur and Gro�.40 Similar differences in WF are found forthese two water layer models for all other metals considered inthat study.
The WF’s time evolution is reported only for the Ru(0001)-water system.40 At time zero, the difference in WF betweenH-up and H-down is around 2.5 V. After 6 ps simulation timethe WF of these two systems have reached the same value,which is around 30% from the H-down WF value and 70%from the H-up value. That means that at room temperature, theneutral water layer and its WF is somewhere in between theH-down and the H-up structure, where presumably more waterdipoles are pointing toward the surface than from it. It shouldbe noted that there is only a single water layer included in thestudy by Schnur and Gro� and these results could change whenmore water layers are included.
Figure 1. (a) Top view and (b) side view of a solvated proton in 3water layers ontop of a Pt(111) electrode. The blue iso-surfaces (iso-value: -0.0018 e bohr-3) are regions of positive charge around theproton solvated in the water. The purple iso-surfaces (iso-value:+0.0012 e bohr-3) on the Pt surface are regions of negative charge atthe electrode surface. In this case the proton concentration is very high(1 proton per 6 surface atoms).
Fdifference(r) ) FPt+e-+water+H+(r) - FPt+water(r) - FH(r)(1)
Gint ) (G(N, n) - G(N, 0) - nµH2/2)/N (2)
18184 J. Phys. Chem. C, Vol. 114, No. 42, 2010 Skulason et al.
If we would use the water-up structure throughout thisinvestigation, our internal measure of the reference WF wouldbe approximately 2.7 V instead of approximately 5.3 V for thewater-down structures. In reality we might have some waterspointing up and others pointing down, as suggested by Schnurand Gro�.40 By assuming the same 30%/70% difference fromthe H-down/H-up WFs on the Pt(111) surface as found on the
Ru(0001) surface due to thermalization40 the reference WF valuewould be 4.5 V, in close agreement with the experimental valueof 4.44 V.
There seems to exist many different water structures whichall are very close in energy.41 Since all energies of interest inthe following are energy differences, they are not sensitive tothe exact model of the water as long as we are consistentlyusing the same model in calculating the energy differences andas long as we choose a reasonable model in a local minimumstructure. A strength of the approach is that we have an internalreference point defining the zero of the potential for the exactstructure we are using.
More work is needed to address the question of waterstructures further but that may have to await exchange-correlation functionals that can confidently determine van derWaals interactions. In the meanwhile we note that the curvatureof the parabolas can be used to determine the capacitance ofthe double layer in excellent agreement with experiment. Weget C ) 22.7 µF/cm2 for 1 water layer, C ) 23.6 µF/cm2 for 2water layers, and C ) 24.5 µF/cm2 for 3 water layers, whilethe experimentally measured value is C ) 20 µF/cm2 onPt(111).42 This good comparison to experiments and the smalldifference in modeling the system with 1, 2, or 3 water layersprovides confidence in the present description and indicates thata single water bilayer is sufficient to describe the interface. Weuse this observation when analyzing the Volmer and theHeyrovsky reactions in the rest of the study.
In Figure 3 we have included the integral free energy ofsystems having H-up configuration of the first water bilayerwhereas the second water bilayer has a H-down structure. Theatomistic structure is shown in system d of Figure 3. This modelsystem is unrealistic in the sense that the first bilayer has anH-up structure while at the same time the surface is negativelycharged. It is an extreme case and will be included later on innext sections to show that the energy differences that wecalculate throughout this study are not sensitive to our choseof water models.
2.3. Extrapolation Scheme. In the model presented above,where the ions are explicitly localized in the Helmholtz layer,a problem arises when these ions react with electrons from thesurface. Since we have periodic boundary conditions and arelimited to using finite size unit cells, performing one proton-electron transfer reaction in a unit cell corresponds to asimultaneous transfer in each unit cell. Since the ions set upthe potential and the field, performing such a reaction changesthe potential of the electrode along the reaction path. That can
Figure 2. Solvated protons in a water bilayer ontop of the Pt(111) slab. The blue iso-surfaces are positive charge of the proton and the purpleiso-surfaces are negative charge on the surface. The figures show different proton concentrations θH+ in the unit cells, i.e. the unit cells are enlargedbut in each case there is 1 proton per unit cell: (a) 1 proton per 12 Pt surface atoms, (b) 1 proton per 24 surface atoms, and (c) 1 proton per 48surface atoms. The iso-values are -0.0005 e bohr-3 in all cases for the positive charge. For the negative charge the iso-values are +0.0008,+0.0005, and +0.0003 e bohr-3 for the 1/12, 1/24, and 1/48 proton concentrations, respectively.
Figure 3. The integral free energy stored in the double layer as afunction of the electrode potential when having (a) 1, (b) 2, and (c) 3water layers with a H-down configuration of the first water bilayer and(d) 2 water layers with a H-up configuration of the first water bilayeron a Pt(111) electrode. The H coverage at the surface is 1 ML in partsa-c, whereas it is 0 ML in part d.
Modeling H Oxidation and Evolution Reactions J. Phys. Chem. C, Vol. 114, No. 42, 2010 18185

affect the energetics considerably. This problem is most severefor the smallest unit cells we consider here in which the biascan change by up to 3.5 V for the Heyrovsky reaction.
The approach we take to circumvent this problem is referredto as “the extrapolation scheme” and has been explained in detailelsewhere.21 When calculating reaction energies and activationenergies for a charge transfer reaction such as the Heyrovskyor the Volmer reactions, we calculate the energies for severaldifferent unit cell sizes. We extrapolate the results to the limitof an infinitely large unit cell or equivalently to the limit wherethe change in potential, ∆U, during the reaction approaches zero.That mimics the situation in a real electrochemical system. Thisis explained in detail below.
The Heyrovsky reaction for the HOR direction is shown asan example, but the approach can be used for any kind of chargetransfer surface reaction. We extrapolate to ∆U ) 0, where ∆Uis the difference of the initial state’s (IS) and final state’s (FS)work functions (WF). The variation in ∆U is obtained by usingunit cells of different sizes, N, with a number of charges, n,determined so that the surface concentration of charge, θ )n/N, is fixed.
In Figure 4a the calculated reaction energy, ∆E ) EFS - EIS,for HOR is plotted as a function of ∆U for different values ofthe surface charge density, θ, or equivalently potentials in theFS when ∆U < 0 and IS when ∆U > 0. The differences inenergies are always presented for the same reaction direction,here for the HOR direction. The differences in WF are calculatedwith respect to the state we are extrapolating to. Take forexample the data set for θ ) 1/6 (filled squares) where both ofthe FSs are the same, having 2 protons in a (6 × 2) cell and 4protons in a (6 × 4) cell. The IS (having H2 in the gas phase),however, do not have the same proton concentration, 1/12 and3/24, respectively. In this case we calculate ∆U ) WFFS -WFIS, since both systems have the same FS proton concentration,1/6. If we now extrapolate these data points to ∆U ) 0 we are
in fact extrapolating to the FS proton concentration. This limitdescribes the situation where the IS and FS would have thesame proton concentration.
If we now take exactly the opposite example, where weextrapolate to θ ) 0 (open triangles), all the IS have no protonsin the water bilayer. The FS for the HOR direction all have 1proton in (6 × 4), (3 × 4), and (3 × 2) unit cells. This differencein concentration results in the change in WFs. In this case, sincewe are extrapolating to θ ) 0 of the IS, ∆U is calculated asWFIS - WFFS.
As can be seen, we always subtract the WF of the states thatare not having the same proton concentration from the WF ofthe states that have the same proton concentration. For thereaction energy versus ∆U this only results in a sign change of∆U. We will, however, see that this formalism is important touse in the right way when doing extrapolations for the activationenergies since the difference between the WF of the TS is notthe same if we calculate it relative to the WFIS or the WFFS,since the WFTS is not necessarily exactly in the middle betweenthe WF of the IS and FS.
When plotting the reaction energy as a function of thedifference in potential as explained above an approximatelylinear dependence is observed and we propose that by extrapo-lating the result to ∆U ) 0 we obtain a good approximation tothe true value of the reaction energy in an infinite unit cell.The slope of this line should be 1/2, since we are transferringone charge in a capacitor.21 This is exactly what we find inFigure 4a. The lines are fitted to the calculated data using aslope of 1/2.
The same approach can be used to estimate the activationenergy of HOR via the Heyrovsky reaction, see Figure 4b. Thecalculations are again done in unit cells of varying surface area.The activation energy is obtained via the NEB method and isalways calculated for the HOR direction in this example, Ea )ETS - EIS, where E is the total energy. The differences in
Figure 4. The reaction energy (a and c) and the activation energy (b and d) for the hydrogen oxidation reaction via the Heyrovsky reaction (a andb) and the Volmer reaction (c and d) on a Pt(111) electrode vs the change in electrode potential ∆U for those reactions. Each set of data pointsconnected by a line corresponds to a fixed concentration of protons and hence a fixed potential. The crossing with ∆U ) 0 signifies the reactionenergy or the activation energy for the Heyrovsky or the Volmer reaction when the bias does not change during the reaction. All the data pointsare calculated with model system shown in structure a of Figure 3, except for the blue circles where structure d of Figure 3 was used. �2 )0.00-0.07 for all lines except for the blue circles; �2 ) 0.20 in panel a and �2 ) 0.13 in panel c.
18186 J. Phys. Chem. C, Vol. 114, No. 42, 2010 Skulason et al.
potentials, ∆U, are calculated in a similar way as for the reactionenergy, where we take the WF of the state we are extrapolatingto and we subtract the WF of the TS from that. In the case ofθ ) 1/6 we subtract the WF of the TS from the WF of the FS;∆U ) WFFS - WFTS, where the FS have θ ) 1/6.
As before, a similar procedure is used when extrapolating toθ ) 0 where all the IS have no protons in the water bilayer.∆U is now WFIS - WFTS. In Figure 4b we have also in somecases interpolated from both negative and positive regions,where we have used a mixture of the two ∆U values explainedabove. In this case we always interpolate to the same protonconcentration, where in some cases it is in the IS whereas inothers it is in the FS. The data points are now both on the leftside and the right side of ∆U ) 0, and we draw a straight linein between and read off the intercept at ∆U ) 0. For Ea wehave not determined the slope of the ∆U dependence a priori.
The same approach can now be applied to the Volmerreaction. The extrapolated and the interpolated values (inter-cepts) are the reaction and activation energies when the biasdoes not change during the discharge reaction H* f H+ + e-.These are shown in Figure 4, parts c and d, respectively.
Let us now consider the HOR direction. Figure 4a containsthe reaction energy of the Heyrovsky reaction, H2 f H+ + e-
+ H*, while Figure 4c contains the reaction energy of theVolmer reaction, H+ + e- + H*f 2H+ + 2e-, both at severalelectrode potentials. If the Heyrovsky reaction is added to theVolmer reaction (at some fixed electrode potential) we obtainthe overall HOR, H2f 2H+ + 2e-, at several discrete electrodepotentials. The reaction energy values are converted into reactionfree energy values by including appropriate values for the ZPEsand vibrational entropy, which will be discussed in more detailin Section 2.4. The free energy of the overall HOR should beequal to two times the electrode potential, ∆GHOR ) -2U, sincetwo electrons are involved in this overall reaction. See ref 43and section 2.4, eq 8, and section 3.1.4 below for more details.Notice that the effect of the H* adsorption energy of theindividual reactions cancels out when the two reactions areadded together. This is indeed what is observed in Figure 5where the free energy ∆Gextrapolation ) ∆GHeyrovsky + ∆GVolmer isplotted as a function of the free energy coming from the Udeduced from the work function, ∆GWF ) -(UHeyrovsky +
UVolmer), for systems having the same proton concentrations andhence similar electrode potentials.
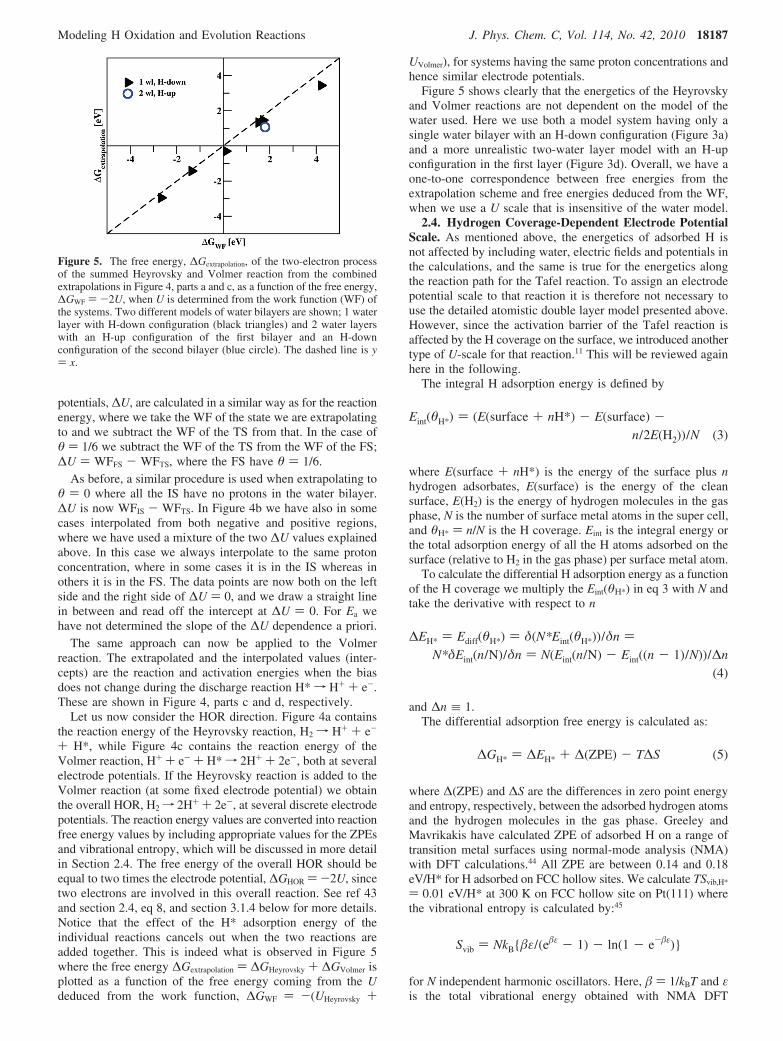
Figure 5 shows clearly that the energetics of the Heyrovskyand Volmer reactions are not dependent on the model of thewater used. Here we use both a model system having only asingle water bilayer with an H-down configuration (Figure 3a)and a more unrealistic two-water layer model with an H-upconfiguration in the first layer (Figure 3d). Overall, we have aone-to-one correspondence between free energies from theextrapolation scheme and free energies deduced from the WF,when we use a U scale that is insensitive of the water model.
2.4. Hydrogen Coverage-Dependent Electrode PotentialScale. As mentioned above, the energetics of adsorbed H isnot affected by including water, electric fields and potentials inthe calculations, and the same is true for the energetics alongthe reaction path for the Tafel reaction. To assign an electrodepotential scale to that reaction it is therefore not necessary touse the detailed atomistic double layer model presented above.However, since the activation barrier of the Tafel reaction isaffected by the H coverage on the surface, we introduced anothertype of U-scale for that reaction.11 This will be reviewed againhere in the following.
The integral H adsorption energy is defined by
where E(surface + nH*) is the energy of the surface plus nhydrogen adsorbates, E(surface) is the energy of the cleansurface, E(H2) is the energy of hydrogen molecules in the gasphase, N is the number of surface metal atoms in the super cell,and θΗ* ) n/N is the H coverage. Eint is the integral energy orthe total adsorption energy of all the H atoms adsorbed on thesurface (relative to H2 in the gas phase) per surface metal atom.
To calculate the differential H adsorption energy as a functionof the H coverage we multiply the Eint(θΗ*) in eq 3 with N andtake the derivative with respect to n
and ∆n ≡ 1.The differential adsorption free energy is calculated as:
where ∆(ZPE) and ∆S are the differences in zero point energyand entropy, respectively, between the adsorbed hydrogen atomsand the hydrogen molecules in the gas phase. Greeley andMavrikakis have calculated ZPE of adsorbed H on a range oftransition metal surfaces using normal-mode analysis (NMA)with DFT calculations.44 All ZPE are between 0.14 and 0.18eV/H* for H adsorbed on FCC hollow sites. We calculate TSvib,H*
) 0.01 eV/H* at 300 K on FCC hollow site on Pt(111) wherethe vibrational entropy is calculated by:45
for N independent harmonic oscillators. Here, � ) 1/kBT and εis the total vibrational energy obtained with NMA DFT
Figure 5. The free energy, ∆Gextrapolation, of the two-electron processof the summed Heyrovsky and Volmer reaction from the combinedextrapolations in Figure 4, parts a and c, as a function of the free energy,∆GWF ) -2U, when U is determined from the work function (WF) ofthe systems. Two different models of water bilayers are shown; 1 waterlayer with H-down configuration (black triangles) and 2 water layerswith an H-up configuration of the first bilayer and an H-downconfiguration of the second bilayer (blue circle). The dashed line is y) x.
Eint(θH*) ) (E(surface + nH*) - E(surface) -n/2E(H2))/N (3)
∆EH* ) Ediff(θH*) ) δ(N*Eint(θH*))/δn )N*δEint(n/N)/δn ) N(Eint(n/N) - Eint((n - 1)/N))/∆n
(4)
∆GH* ) ∆EH* + ∆(ZPE) - T∆S (5)
Svib ) NkB{�ε/(e�ε - 1) - ln(1 - e-�ε)}
Modeling H Oxidation and Evolution Reactions J. Phys. Chem. C, Vol. 114, No. 42, 2010 18187
calculations. The ZPE of 0.27 eV/H2 and TS of 0.41 eV/H2 at300 K of H2 in the gas phase are taken from standard moleculartables.46 Adding these values together, using eq 5, we get 0.22eV/H* that we need to add to the electronic energy to get thefree energy. Here we use a value of ZPEH* ) 0.16 eV/H*, inbetween the ZPEH* ) 0.14-0.18 eV/H* from Greeley andMavrikakis.
We also need to include the configuration part of the entropyof the adsorbed H*.11,32 The differential configurational entropy,dSconfig/dθΗ*, is estimated by
(for 0 < θH < 1) which previously has been found to comparewell with Monte Carlo simulations.32
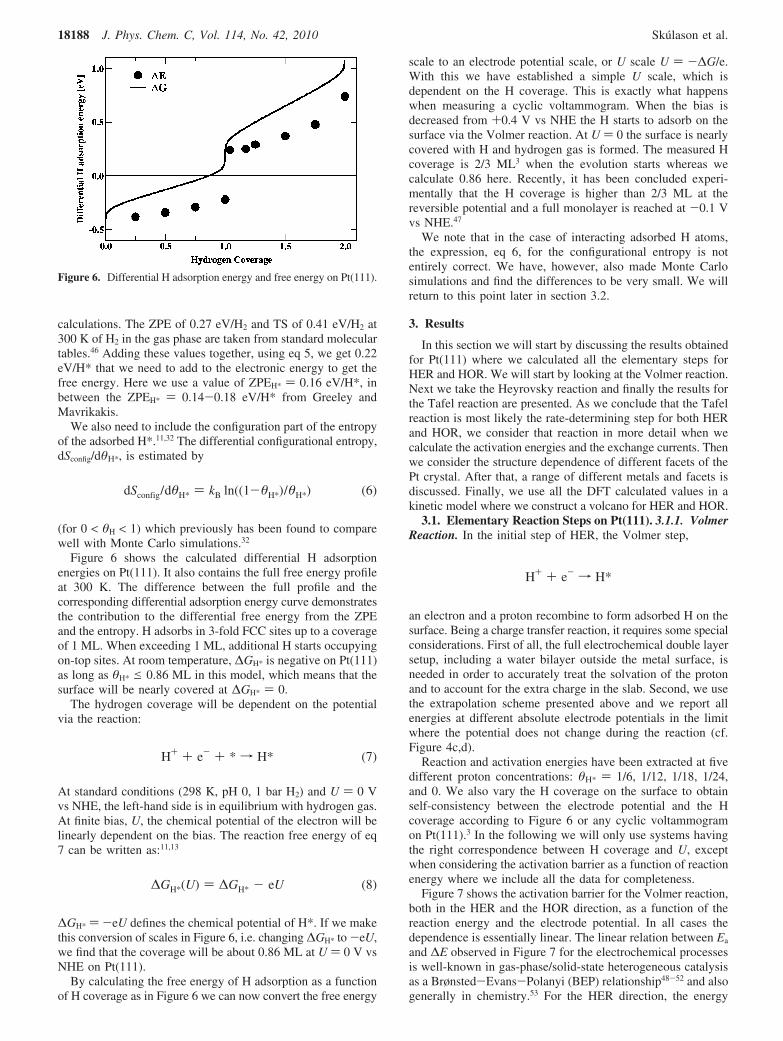
Figure 6 shows the calculated differential H adsorptionenergies on Pt(111). It also contains the full free energy profileat 300 K. The difference between the full profile and thecorresponding differential adsorption energy curve demonstratesthe contribution to the differential free energy from the ZPEand the entropy. H adsorbs in 3-fold FCC sites up to a coverageof 1 ML. When exceeding 1 ML, additional H starts occupyingon-top sites. At room temperature, ∆GH* is negative on Pt(111)as long as θH* e 0.86 ML in this model, which means that thesurface will be nearly covered at ∆GH* ) 0.
The hydrogen coverage will be dependent on the potentialvia the reaction:
At standard conditions (298 K, pH 0, 1 bar H2) and U ) 0 Vvs NHE, the left-hand side is in equilibrium with hydrogen gas.At finite bias, U, the chemical potential of the electron will belinearly dependent on the bias. The reaction free energy of eq7 can be written as:11,13
∆GH* ) -eU defines the chemical potential of H*. If we makethis conversion of scales in Figure 6, i.e. changing ∆GH* to -eU,we find that the coverage will be about 0.86 ML at U ) 0 V vsNHE on Pt(111).
By calculating the free energy of H adsorption as a functionof H coverage as in Figure 6 we can now convert the free energy
scale to an electrode potential scale, or U scale U ) -∆G/e.With this we have established a simple U scale, which isdependent on the H coverage. This is exactly what happenswhen measuring a cyclic voltammogram. When the bias isdecreased from +0.4 V vs NHE the H starts to adsorb on thesurface via the Volmer reaction. At U ) 0 the surface is nearlycovered with H and hydrogen gas is formed. The measured Hcoverage is 2/3 ML3 when the evolution starts whereas wecalculate 0.86 here. Recently, it has been concluded experi-mentally that the H coverage is higher than 2/3 ML at thereversible potential and a full monolayer is reached at -0.1 Vvs NHE.47
We note that in the case of interacting adsorbed H atoms,the expression, eq 6, for the configurational entropy is notentirely correct. We have, however, also made Monte Carlosimulations and find the differences to be very small. We willreturn to this point later in section 3.2.
3. Results
In this section we will start by discussing the results obtainedfor Pt(111) where we calculated all the elementary steps forHER and HOR. We will start by looking at the Volmer reaction.Next we take the Heyrovsky reaction and finally the results forthe Tafel reaction are presented. As we conclude that the Tafelreaction is most likely the rate-determining step for both HERand HOR, we consider that reaction in more detail when wecalculate the activation energies and the exchange currents. Thenwe consider the structure dependence of different facets of thePt crystal. After that, a range of different metals and facets isdiscussed. Finally, we use all the DFT calculated values in akinetic model where we construct a volcano for HER and HOR.
3.1. Elementary Reaction Steps on Pt(111). 3.1.1. VolmerReaction. In the initial step of HER, the Volmer step,
an electron and a proton recombine to form adsorbed H on thesurface. Being a charge transfer reaction, it requires some specialconsiderations. First of all, the full electrochemical double layersetup, including a water bilayer outside the metal surface, isneeded in order to accurately treat the solvation of the protonand to account for the extra charge in the slab. Second, we usethe extrapolation scheme presented above and we report allenergies at different absolute electrode potentials in the limitwhere the potential does not change during the reaction (cf.Figure 4c,d).
Reaction and activation energies have been extracted at fivedifferent proton concentrations: θΗ* ) 1/6, 1/12, 1/18, 1/24,and 0. We also vary the H coverage on the surface to obtainself-consistency between the electrode potential and the Hcoverage according to Figure 6 or any cyclic voltammogramon Pt(111).3 In the following we will only use systems havingthe right correspondence between H coverage and U, exceptwhen considering the activation barrier as a function of reactionenergy where we include all the data for completeness.
Figure 7 shows the activation barrier for the Volmer reaction,both in the HER and the HOR direction, as a function of thereaction energy and the electrode potential. In all cases thedependence is essentially linear. The linear relation between Ea
and ∆E observed in Figure 7 for the electrochemical processesis well-known in gas-phase/solid-state heterogeneous catalysisas a Brønsted-Evans-Polanyi (BEP) relationship48-52 and alsogenerally in chemistry.53 For the HER direction, the energy
Figure 6. Differential H adsorption energy and free energy on Pt(111).
dSconfig/dθH* ) kB ln((1-θH*)/θH*) (6)
H+ + e- + * f H* (7)
∆GH*(U) ) ∆GH* - eU (8)
H+ + e- f H*
18188 J. Phys. Chem. C, Vol. 114, No. 42, 2010 Skulason et al.

barrier is 0.44 eV at ∆E ) 0 and 0.69 eV at U ) 0 V vs NHE.For HOR direction, the energy barrier is also 0.44 eV at ∆E )0 and 0.46 eV at U ) 0 V vs NHE. The 0.23 eV differencebetween the barrier heights for HER and HOR at U ) 0 V(equilibrium) is due to the difference in the reaction energiesfor those two reactions.
If we assume a normal prefactor, 1013 site-1 s-1, for theVolmer reaction, as we obtained from our calculations for theHeyrovsky reaction,11 the rate of the Volmer reaction will bevery high around U ) 0, in agreement with experiments.2 Wewill show later that other elementary steps in the HER/HORhave larger barriers at U ) 0, and conclude from our first-principles calculations that the Volmer reaction can be treatedas being in equilibrium at room temperature during HER/HORand the coverage of H on the surface is given by the chemicalpotential of hydrogen, or the electrode potential.
3.1.2. HeyroWsky Reaction. In the final step of the HER, twopossibilities for desorbing H2 are available: the Tafel reactionor the Heyrovsky reaction. We start with the Heyrovsky reaction:
where a solvated proton from the electrolyte reacts with anadsorbed H and an electron from the surface to form the H2
molecule. Since this is also a charge transfer reaction, anaccurate analysis of the energetics requires the double layermodel and the extrapolation scheme previously applied to theVolmer reaction. Using the information obtained in Figure 4a,bwhen both the reaction energies and activation energies havebeen extrapolated to ∆U ) 0, we can now plot the extrapolatedactivation energies against the extrapolated reaction energiesas shown in Figure 8 for HER and HOR, respectively, onPt(111). The proton concentration, θH+, in the water bilayer hasbeen varied and so has the H coverage on the surface, fromhaving slightly more than 1 ML on the surface to having verylow coverage (or 1 H* in a super cell). The relation between
the activation energy and the reaction energy is clearly linearwith an intercept at ∆E ) 0 of 1.03 eV for both reactions. Theintercept is slightly higher here than what we reported in ref11, where it was 0.86 eV. Besides the fact that we are includingmore variation in proton concentration and especially the Hcoverage, we have applied the extrapolation scheme so boththe activation barriers and the reaction energies are extrapolatedto ∆U ) 0. Another important difference is that now all theactivation barriers are calculated via the NEB method whereaswe made a less detailed approximation for the TS in the earlierwork.
In Figure 8 (right) we include the activation barriers for HERand HOR versus the electrode potential, obtained from the WFof the systems and with our internal measure of the electrodepotential as discussed in section 2.2. As for the Volmer reactionabove we attempt to have a H coverage on the surface that isconsistent with the potential. Here we have obtained a semi-quantitative agreement between the H coverage and the potentialwith both experimental CVs3 and our theoretical CVs.32 Theactivation barrier for HOR is around 0.8 eV at U ) 0 V vsNHE, whereas it is around 1.4 eV at U ) 0 for HER. As forthe Volmer reaction, the difference between the HER and theHOR barriers is coming from the reaction energies. Our analysisindicates that the Heyrovsky reaction should be very slow onthe Pt(111) surface at U ) 0 V. At extremely high overpoten-tials, around -1 V for HER and +0.5 V for HOR, the barrierfor the Heyrovsky reaction becomes much lower or around 0.3eV. The size of the overpotential seems to be somewhat greaterhere than in the study by Wang et al.12 in which they concludethat the Volmer-Heyrovsky route becomes important for HORat around +0.25 V vs NHE. These results are in qualitativeagreement though.
3.1.3. Tafel Reaction. The other possible elementary stepfor evolving H2 in HER (or dissociating H2 in HOR) is the Tafelreaction:
Figure 7. Activation barriers, Ea, for the Volmer step in (a and c) the HER (H+ + e-f H*) and (b and d) the HOR (H*f H+ + e-) as a functionof (a and b) the reaction energy, ∆E, and (c and d) the electrode potential, U vs NHE, on the Pt(111) electrode. �2 ) 0.03 (a), 0.03 (b), 0.00 (c),and 0.01 (d).
H* + H+ + e-f H2
Modeling H Oxidation and Evolution Reactions J. Phys. Chem. C, Vol. 114, No. 42, 2010 18189

Since the Tafel reaction is a homolytic reaction (a Langmuir-Hinshelwood type reaction) it is not necessary to explicitlyinclude water, ions, electric potentials, or electric fields11 in orderto describe it in an electrochemical environment. It should benoted that Gohda et al. calculated a 0.17 eV increase inactivation energy when including water in the simulations ofthe Tafel reaction in the HOR direction54 whereas we findnegligible difference for the Tafel reaction in the HER direc-tion.11 This increase in barrier height when including water isnot coming from the weak water-induced modification of theelectronic structure of Pt(111). It is due to the interaction of H2
with the water when H2 propagates through the water layer.54
The effect of water on the energetics of HER and HOR is thusa surface-independent parameter.
Avoiding inclusion of water simplifies the DFT calculationsenormously as only a surface slab and adsorbed hydrogen haveto be included in the model. However, as mentioned above, thecoverage is a function of the potential and the coverage willaffect the Tafel reaction. In this indirect way the electrochemicalpotential is playing a role.
In Figure 9a we have plotted the activation energies, Ea,against the reaction energies, ∆E, in both the HER and the HORdirections on Pt(111). The variation in both Ea and ∆E is dueto differences in H coverage. Ea and ∆E are linearly correlated,following the BEP relationship. The slope is 0.45 for HER and0.55 for HOR and the intercept is 0.55 eV for both directions.This is a considerably lower activation energy than obtainedfor the Heyrovsky reaction at ∆E ) 0, where it is 1.03 eV.This strongly indicates that the Tafel reaction is much fasterthan the Heyrovsky and the predominant mechanism on Pt(111).
Using Figure 6, and eq 8 the H adsorption free energy scalecan be converted into a potential scale vs NHE as shown inFigure 9b. It is seen that for the U-values of interest whenconsidering HER, i.e., just below 0 V vs NHE, the activationbarriers are around 0.85 eV. Figure 9b shows the correspondingbarriers for the Tafel reaction in the HOR direction. At positivepotentials the activation barriers are low, 0.2-0.3 eV, whereas
getting closer to U ) 0 V the barriers start to increase and arearound 0.4-0.6 eV. This is due to the fact that in the smallunit cells (2 × 2) we are using, all those calculations have onlyone empty site on the surface and when dissociating H2, theon-top sites become occupied which are high in energy, as wesaw in Figure 6 above 1 ML. If we now introduce a dimervacancy in a bigger unit cell (4 × 4) where we have an initialH coverage of 14/16 ML and we dissociate H2 to end up with1 ML on the surface, the barrier decreases at U ) 0 V to 0.4eV (open square in Figure 9b). One could actually have a triplevacancy and get even lower barriers according to studies onthe Pd(111) surface55-57 but the probability of creating emptysites and the aggregation energy would affect the total rate inthe end. We will analyze this further in the next section.
The barriers for the Tafel reaction for HER around 0.85 eVand HOR around 0.4 eV at U ) 0 V are considerably lowerthan the ones for the Heyrovsky reaction at U ) 0 V (1.4 eVfor HER and 0.8 eV for HOR). The barrier for the Tafel reactionis also lower than the Heyrovsky reaction barrier for the wholepotential region from -1 to +0.5 V. At these extremes inpotentials, the barriers for the Heyrovsky and Tafel reactionsbecome, however, somewhat similar in size.
The activation barrier of 0.85 eV for the Tafel reaction inthe HER direction is higher than the one for the Volmer step atU ) 0 V (0.69 eV for HER). The barriers for the Tafel and theVolmer reactions are, however, similar in the HOR direction,0.4 and 0.46 eV, respectively. Our results indicate that theVolmer-Tafel route is the predominant mechanism for bothHER and HOR on Pt(111) at U ) 0 V. Thus, we can focus onthe Tafel reaction when analyzing the kinetics further and whenconsidering other metal surfaces, facets, and steps. Before weanalyze the Tafel reaction in detail we construct a free energydiagram of all the elementary steps in the next section.
3.1.4. Standard Free Energy Diagram. To construct anoverall picture of the energetics of the three elementary reactionsteps;Volmer, Heyrovsky, and Tafel;a standard free energydiagram (FED) is constructed in Figure 10. We define this as astandard free energy since there is no configurational part of
Figure 8. Activation barrier for (a and c) the HER and (b and d) the HOR on Pt(111) via the Heyrovsky reaction as a function of (a and b) thereaction energy, ∆E, and (c and d) the electrode potential, U vs NHE. �2 ) 0.15 (a), 0.16 (b), 0.13 (c), and 0.05 (d).
2H* T H2 + 2*
18190 J. Phys. Chem. C, Vol. 114, No. 42, 2010 Skulason et al.

the entropy included. Hence all the free energy states in Figure10 are at a fixed H* coverage. For the Volmer and theHeyrovsky steps we have picked out the three systems closestto zero electrode potential from Figure 5. It should be notedthat here the analysis becomes more transparent if we addtogether the reaction free energies of the Volmer and Heyrovskysteps. It is equivalent to adding the negative of the two individualelectrode potentials, since the H* energy cancels out. It isobvious from Figure 10 that while the Heyrovsky state (1H+ +1e- + H*) changes by 1U plus the H adsorption energy, theVolmer state (2H+ + 2e-) changes by 2U from the H2 state.These explicit DFT calculations show how the chemicalpotential, µ, is related to the electric potential, U, via thefollowing simple equation: µ ) -eU, where e is the transferredcharge. It is noted here that if the configurational part of theentropy had been included, all the free energy levels would bein equilibrium, and have the same free energy value.
In Figure 10a the extrapolated activation free energy barriersfor the Volmer and the Heyrovsky reactions, obtained fromFigure 4d,b, are also included. (The ZPE of the TS structure iscalculated via NMA DFT calculations to be 0.20 eV for theVolmer TS and 0.26 eV for the Heyrovsky TS. The entropyterms have been neglected as explained elsewhere.21) It isevident while the activation barriers are quite low for the Volmerreaction they are very high for the Heyrovsky reaction. Forcomparison the activation free energy barriers of the Volmer-Tafel route have been included in Figure 10b. The barrier forthe Tafel reaction is approximately half as high as the barrierfor the Heyrovsky reaction, whereas it is only slightly higherthan the barrier for the Volmer reaction. Thereby, we concludethat the Volmer step is the fastest step of these elementary stepsand the Tafel step is the rate-determining step.
3.2. Detailed Analysis on the Kinetics of the Tafel Reac-tion on Pt(111). The calculations we have performed for theactivation energy as a function of H coverage for the Tafel
reaction on Pt(111) can be considered as the mean field solutionto the problem. Here we will present more elaborate analysisof the kinetics of HER and HOR on Pt(111). Instead of assigningeach activation barrier to a given H coverage, we will associatean activation barrier to each configuration described by thenumber of H nearest neighbors (NN). In Table 1 we show thebarriers and reaction energies for HER and HOR from Figure9a as a function of the NN configuration. We use the conventionthat NN is for the FS for HOR and hence for the IS for HER.These are the states determining the actual heights of thebarriers. We have chosen to only consider data for 1 ML Hcoverage or less, since we will mainly be interested in potentialaround U ) 0 V vs NHE where the coverage on Pt(111) doesnot exceed 1 ML, cf. Figure 6.
In Figure 11 we have calculated the probability of having agiven nearest neighbor (NN) configuration at certain H cover-ages from 0 to 1 ML, both with an interacting lattice modelusing Metropolis Monte Carlo (MC) simulations and analyticallywith a noninteracting lattice model. For the MC simulation ahexagonal FCC(111) surface is modeled with a simple lattice
Figure 9. Activation barrier, Ea, for HER and HOR on Pt(111) via the Tafel reaction as a function of (a) the reaction energy, ∆E, and (b) theelectrode potential, U. �2 ) 0.02 for both HER and HOR in part a.
Figure 10. Standard free energy diagram for the Volmer-Heyrovsky route (a) and Volmer-Tafel route (b) on Pt(111). The electric potential, U,deduced from the WF is given for each free energy level.
TABLE 1: Tafel (HER/HOR) Activation Energies, Ea, andReaction Energies, dE, at Different Nearest-Neighbor (NN)Configurationsa
HOR FS nn/HER IS nn EaHOR dEHOR Ea
HER
0 0.14 -0.72 0.861 0.14 -0.72 0.862 0.23 -0.64 0.873(*) 0.25 -0.60 0.854(*) 0.27 -0.56 0.835 0.30 -0.51 0.816 0.39 -0.41 0.80
a All energies are in eV/H2. For the NN configuration marked (*)a linear interpolation has been taken for the Ea and dE from NN )2 and 5.
Modeling H Oxidation and Evolution Reactions J. Phys. Chem. C, Vol. 114, No. 42, 2010 18191

model where each H in the FCC site can interact with up to 6nearest neighbors. The analytical hexagonal lattice model isnoninteracting and is given by the binomial coefficients
As can be seen from Figure 11, the MC simulation (includinginteractions) does not deviate much from the noninteractinganalytical model. We therefore use the analytical model in thefollowing analysis since it is more transparent.
The Tafel HER rate is given by θ2 times a sum over weighted(with Pi(θ) in eq 9) rate constants kT,i
HER ) ν * exp(-Ea,iHER/kBT).
We use the approximate attempt frequency, ν ) 1013 site-1 s-1,as the prefactor, which we found to agree well with the measuredabsolute rate for HER when used together with our calculatedactivation barriers.11 The activation energies Ea,i
HER are given inTable 1. We get the rate equation
With the expression for Pi(θ) in eq 9 inserted into eq 10 weend up with the following expression for the Tafel HER rate:
The corresponding expression for the HOR rate can be writtenas
where ∆S/kB ) -15.86 f exp(∆S/kB) ) 1.3 × 10⁻⁷ is theentropic barrier or loss of entropy when H2 comes from the gasphase and dissociates on the surface, -Τ∆S ) 0.41 eV atstandard conditions.
For a given H coverage we calculate the rate of both the HERand the HOR using eqs 11 and 12. In Figure 12 the result isshown as a function of the H coverage at 300 K. At equilibrium,the rates for HER and HOR are the same and there is no netflow of current. This corresponds to U ) 0 V vs NHE atstandard conditions and where the H coverage is 0.87 ML. Thiscan be compared to the value 0.86 ML obtained with anotherapproach in Figure 6.
At equilibrium, the exchange rate is 0.21 site-1 s-1 at 300 K.By changing units we get i0 ) 5.1 × 10⁻⁵ A cm-2 for theexchange current density. This is to be compared with theexperimental value for the exchange current density on Pt(111)at 303 K, i0 ) 4.5 × 10⁻⁴ A cm-2.2
Here we show that our calculated barrier for the Tafel reactiongives a similar rate as experiments on the same surface.However, experimentally the activation barrier obtained fromArrhenius type analysis is around 0.2 eV for HER and HORon Pt(111).2 This corresponds to a prefactor on the order of 103
site-1 s-1, or 10 orders of magnitude lower than a normalprefactor. We are presently not able to explain these experi-mental data.
3.3. Structure Dependence over Pt(111), Pt(100), andPt(110). In the following section we discuss the HER and HORrates for different facets of Pt and compare it with experimentsby Markovic et al.2 First we study the heat of adsorption vscoverage. Then we compare the calculated rates obtained solelyfrom the Tafel activation barriers with the measured ones. We
Figure 12. Total Tafel HER and HOR rates at 300 K, plotted vs theH coverage.
Figure 11. Probability of having a given nearest neighbor (NN)configuration at varying H coverage, calculated with (a) MetropolisMonte Carlo and (b) analytically.
Pi(θ) ) (6i )θi(1 - θ)6-i (9)
rTHER(θ) ) θ2 ∑
i)0
6
Pi(θ)kT,iHER (10)
rTHER(θ) - V∑
i)0
6 (6i )θi+2(1 - θ)6-i exp(-Ea,i
HER/kBT)
(11)
rTHER(θ) ) V exp(∆S/kB)∑
i)0
6 (6i )θi(1 - θ)8-i exp(-Ea,i
HER/kBT)
(12)
18192 J. Phys. Chem. C, Vol. 114, No. 42, 2010 Skulason et al.
will assume that the Volmer reaction is in equilibrium on allfacets as generally found in experiments.3 We will assume thatthe Heyrovsky pathway is not active on any of these surfacessince our calculations on the Pt(111) electrode show that it isso far from active that the relatively small difference that wefind in energetics between the different facets cannot changethat picture.
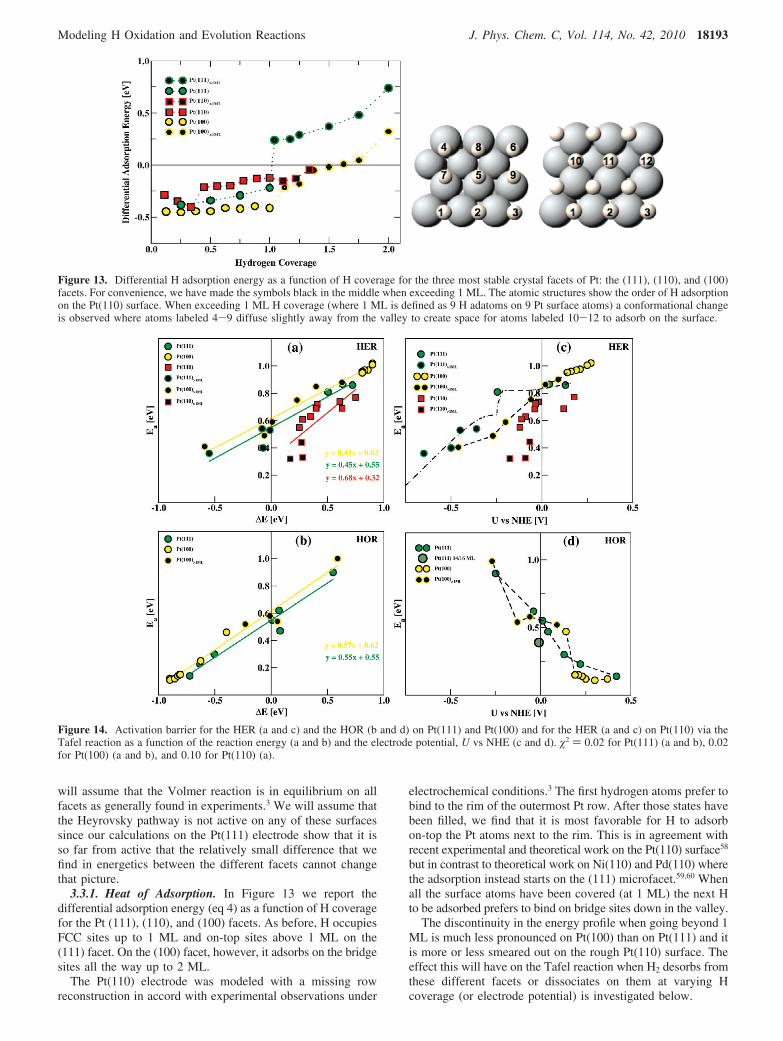
3.3.1. Heat of Adsorption. In Figure 13 we report thedifferential adsorption energy (eq 4) as a function of H coveragefor the Pt (111), (110), and (100) facets. As before, H occupiesFCC sites up to 1 ML and on-top sites above 1 ML on the(111) facet. On the (100) facet, however, it adsorbs on the bridgesites all the way up to 2 ML.
The Pt(110) electrode was modeled with a missing rowreconstruction in accord with experimental observations under
electrochemical conditions.3 The first hydrogen atoms prefer tobind to the rim of the outermost Pt row. After those states havebeen filled, we find that it is most favorable for H to adsorbon-top the Pt atoms next to the rim. This is in agreement withrecent experimental and theoretical work on the Pt(110) surface58
but in contrast to theoretical work on Ni(110) and Pd(110) wherethe adsorption instead starts on the (111) microfacet.59,60 Whenall the surface atoms have been covered (at 1 ML) the next Hto be adsorbed prefers to bind on bridge sites down in the valley.
The discontinuity in the energy profile when going beyond 1ML is much less pronounced on Pt(100) than on Pt(111) and itis more or less smeared out on the rough Pt(110) surface. Theeffect this will have on the Tafel reaction when H2 desorbs fromthese different facets or dissociates on them at varying Hcoverage (or electrode potential) is investigated below.
Figure 13. Differential H adsorption energy as a function of H coverage for the three most stable crystal facets of Pt: the (111), (110), and (100)facets. For convenience, we have made the symbols black in the middle when exceeding 1 ML. The atomic structures show the order of H adsorptionon the Pt(110) surface. When exceeding 1 ML H coverage (where 1 ML is defined as 9 H adatoms on 9 Pt surface atoms) a conformational changeis observed where atoms labeled 4-9 diffuse slightly away from the valley to create space for atoms labeled 10-12 to adsorb on the surface.
Figure 14. Activation barrier for the HER (a and c) and the HOR (b and d) on Pt(111) and Pt(100) and for the HER (a and c) on Pt(110) via theTafel reaction as a function of the reaction energy (a and b) and the electrode potential, U vs NHE (c and d). �2 ) 0.02 for Pt(111) (a and b), 0.02for Pt(100) (a and b), and 0.10 for Pt(110) (a).
Modeling H Oxidation and Evolution Reactions J. Phys. Chem. C, Vol. 114, No. 42, 2010 18193

3.3.2. Tafel Reaction. In Figure 14 we have calculatedactivation barriers for HER and HOR via the Tafel reaction onPt(111) and Pt(100) and for HER on Pt(110). We vary the Hcoverage, which gives us both variations in the reaction energyand in the electrode potential. We assume that the prefactorsare the same for all the facets. That allows us to compare ourcalculated rates to the measured rates for these facets whichwe do because the measured activation barriers coming fromthe Arrhenius analysis are all around 0.1-0.2 eV for thesefacets,2 or much lower than our HER barriers (around 0.8 eV)at U ) 0.
In the following we will calculate the HER rates for thedifferent facets at U ) 0 V vs NHE. The HER barriers on the(111) and (100) are both around 0.85 eV at U ) 0 V, whereasthe barrier on the (110) facet is around 0.74 eV at U ) 0 V.Since for these facets every activation barrier is calculated foronly one particular H coverage, we use our elaborate analysisfrom section 3.2 for the Pt(111) facet as a starting point whencomparing the facets. Since Pt(111) and Pt(100) have the sameactivation barriers at U ) 0 (Figure 14c) the Pt(100) facet hasthe same exchange current as Pt(111), or i0 ) 5.1 × 10⁻⁵ Acm-2 (calculated in section 3.2). This is in agreement with themeasured ones, 6.0 × 10⁻⁴ A cm-2 for Pt(100) and 4.5 × 10⁻⁴
A cm-2 for Pt(111), at 303 K.2 From the difference in activationbarriers between Pt(111) and Pt(110) we calculate i0 ) 3.7 ×10⁻³ A cm-2 for Pt(110) in good agreement with the measuredone, 9.8 × 10⁻⁴ A cm-2, on Pt(110).2
We see similar structure dependence on the rates as Markovicet al.2 and our absolute values are in quite good agreement with
their measured ones. However, our activation barriers do notagree with the experimental ones obtained via Arrheniusanalysis. We calculate around 0.74-0.85 eV at U ) 0 Vwhereas their values are around 0.1-0.2 eV.
3.4. Heat of Adsorption on Other Electrodes. In thissection we will consider other metals, both in their close-packedstructures and other facets and steps. This includes Au, Ag, Cu,Pt, Pd, Ni, Ir, Rh, Co, Ru, Re, W, Mo, and Nb. First we calculatethe H adsorption energy and free energy on these different metalsurfaces. Then we calculate the rate of the Tafel reaction onthe complete range of surfaces.
3.4.1. Close-Packed Surfaces. Figure 15a shows the calcu-lated differential H adsorption energies for a range of close-packed transition metals. In Figure 15b the free energy profile,calculated via eq 5, at 300 K for Ni, Au, Ru, Cu, and Pt isshown. On the close-packed surfaces, H is adsorbed in 3-foldFCC sites up to a coverage of 1 ML. When exceeding 1 ML,additional H starts occupying on-top sites and there is adiscontinuity in the energy profile. At room temperature, ∆GH*
is negative on the more reactive metals (Nb, W, Mo, Ni, Re,and Co) as long as θH*e 1 ML, which means that these surfaceswill be fully covered. On the less reactive metals, like Pt, theH coverage is on the other hand a bit less than 1 ML when∆GH* ) 0. Finally, the H coverage on the inert metals (Cu,Ag, and Au) is very small at room temperature since ∆GH* > 0for all except the lowest coverage.
If we make the conversion of scales, i.e. changing ∆GH* to-eU, we find that the coverage will be about 1 ML at U ) 0V vs NHE on the most reactive metals, but very low on the
Figure 15. (a) Differential energy of H adsorption on close-packed metals. (b) Differential free energy of H adsorption on a few closed-packedmetals.
Figure 16. Differential energy of H adsorption on open surfaces. The atomic structures show Pt(100) and Mo(100) surfaces with 1 and 2 ML ofH adatoms, respectively.
18194 J. Phys. Chem. C, Vol. 114, No. 42, 2010 Skulason et al.

noble metals: Cu, Ag, and Au. For the noble metals a substantialnegative bias is required in order to adsorb any appreciableamounts of H. We further notice that a coverage exceeding 1ML could in principle be achieved on the reactive metals bydecreasing U to approximately -0.5 to -0.8 V vs NHE.However, before that coverage is reached hydrogen moleculesstart forming on the surface via the Tafel reaction.
3.4.2. More Open Facets and Steps. Since polycrystallinesurfaces and nanoparticles consist of different types of flatsurfaces as well as steps, kinks, and other defects, it is interestingto calculate the heat of adsorption for more open facets thanthe close-packed ones. Here we have considered the FCCPt(100) facet and the BCC W(100) and Mo(100) facets. Anumber of different adsorption sites are considered and thebridge sites are found to be the most stable ones. Since we havetwo bridge sites for each metal atom, we can fill the surfacewith bridge sites up to 2 ML. We discussed the Pt(100) resultsabove in connection with Figure 13.
In Figure 16 we have included a line indicating U ) 0 V vsNHE by applying eq 8 at standard conditions. The Pt(100)surface is able to adsorb slightly more than 1 ML according tothis simple model. The more reactive Mo(100) and W(100)surfaces can both adsorb considerable more H on the surfacethan the Pt(100) surface. The Mo(100) surface will adsorb 2ML of H at U ) 0 V or fill all the bridge sites. Occupying the4-fold site above 2 ML would require around -0.25 V inoverpotential. A similar situation is on the W(100) as on theMo(100), besides that at 2 ML, H adsorbs much stronger on Wthan on Mo. It should be noted that quite strong reconstructionoccurred on the W(100) surface when adsorbing 0.75 and 1ML.
To model the effect of the low-coordinated defect sites on areal catalyst, the (211) stepped surface is used. In Figure 17 we
have calculated the H adsorption energy at different H coverageon a number of (211) metals. We have divided it into two setsof figures, where on the left we group Pd(211), Ni(211), andCo(211) together and on the right Pt(211), Ir(211), Re(211),and Rh(211). The metals are divided in the two groups basedon the order in which the H atoms adsorb on the surface.
The general trend for all the metals is similar, however. Thefirst H adsorb around the step, whereas the next H binds to theterrace. Around 1 ML (where 1 ML is defined here as 1 H per1 surface metal atom), the next H binds to a new site aroundthe (bottom of the) step. On these surfaces there is more spaceand more possibility of new adsorption sites, which leads tomuch smoother and more continuous adsorption curve behaviorthan at the close-packed surfaces, where filling up all the 3-foldsites means that only the on-top sites are available above 1 ML.
If we compare Pd(211) and Pt(211) the first H adsorbs on a3-fold hollow site above the step on Pd(211) whereas the firstH binds to the bridge site on the Pt(211) step. The tendency tooccupy a 3-fold site is larger on Pd than on Pt where bridge to3-fold energy differences are small, and H therefore easilymoves to the bridge site to take full advantage of the high lyingd-states at the step.
In Figure 17 a line for U ) 0 V has been added as for the(100) metals in Figure 16. For most of the metals the steps havebeen occupied initially and the terrace has been filled with H atU ) 0. This means that at U ) 0, the close-packed structure isa sufficient model to capture the trends between the metals aswe will discuss in the following section 3.5. This means thatthe activation barrier at the close-packed surface is whatdetermines the HER reactivity of, e.g., a polycrystalline metal.
3.5. Trends in Exchange Currents for Different Metals:The Volcano Plot. The ability of a given metal to catalyze theHER (or HOR) is usually measured by the exchange current
Figure 17. Differential energy of H adsorption on stepped surfaces. The atomic structures above show the order of H adsorption.
Modeling H Oxidation and Evolution Reactions J. Phys. Chem. C, Vol. 114, No. 42, 2010 18195

density, which is the rate of hydrogen evolution (or oxidation)per surface area at the potential where the reaction is atequilibrium (U ) 0 V vs NHE at standard conditions). Differentmaterials exhibit widely different exchange current densities.For over 50 years, it has been well established that if theexchange current density of the HER is plotted against someexperimental measure of the metal hydrogen bond energy, avolcano-shaped curve is obtained.61-65
Recently, a simple and fast systematic approach that usesadsorption free energies calculated using DFT was introduced.14
When the measured exchange currents of various metals wereplotted against the calculated binding, the apex of the volcanoappeared close to ∆GH* ) 0. Reference 14 also introduced asimple kinetic model of the exchange current, which reproducedthe experimental data surprisingly well. Except for one freeparameter, adjusting the overall magnitude of the volcano, theonly input to this model was the calculated ∆GH*.
Here we employ a considerably more advanced kinetic modelwhere all the parameters are obtained from the first-principlecalculations presented in this work, i.e., no fitting parameterhas been used. We assume the Volmer reaction to be inequilibrium as above. We discard the Heyrovsky reaction sinceit was concluded above that it is very slow on the Pt(111)electrode. The kinetics of the rate-limiting step found in thispaper, the Tafel reaction, is used to get the overall magnitudeand shape of the volcano plot, whereas in the simple kineticmodel14 the magnitude was modeled with a free adjustableparameter since there no activation barriers were included. Theshape of the simple kinetic model was captured in ref 14 byassuming that the transfer coefficient is equal to one in the rateexpressions. In the present study the activation barrier and itsdependency on the reaction energy has been included, whichdescribes the absolute rate and trends of the experimentsextremely well, as discussed below.
In Figure 18 the experimentally measured exchange currentdensity (same as in ref 14) is plotted against the H adsorptionfree energy, obtained with DFT calculations. For the metals onthe left side of ∆G ) 0 we include high coverage (1 ML) sincethese metals will be filled with H at U ) 0. For the metals onthe right side, Cu, Au, and Ag, we use low H coverage (0.25ML) in accordance with Figure 15b. In the volcano of ref 14all ∆GH* were calculated at low H coverage (0.25 ML). Here,
the data points fall nicely on a volcano-shaped curve as expected.The metals on the left side of the volcano may be oxidized(indicated by a dashed line). This means that presumably theseare metal oxides and not the pure metals in these particularexperiments. However, when the measured exchange currenton these metal oxides is plotted as a function of the H bindingfree energy of the pure metal, it falls directly on the volcano,predicted from the present more advanced kinetic model.
To model this, we calculate the exchange current from eq11. We assume that we can describe the variation in Ea with aBEP relation for Pt(111) from Figure 9a. The kinetic modelagrees well with the experimental data and captures both theshape of the volcano and the absolute magnitude, although thelatter is probably fortuitous given the accuracy of our calcula-tions. We also note that in the detailed analysis of the Tafelreaction on Pt(111) in section 3.2 our calculated current wasabout an order of magnitude lower than what we have here.This is because for the construction of the volcano we use aBEP line for Pt(111) including H coverage above 1 ML in orderto span more of the energy landscape. In section 3.2, however,we only included H coverage of 1 ML and less.
The good agreement throughout the metal series indicatesthat the Tafel barrier is the predominant and rate-limiting stepon all metal electrodes.
4. Conclusions
Density functional theory results have been presented for thehydrogen oxidation reaction (HOR) and the hydrogen evolutionreaction (HER) on a large number of transition metals withdifferent surface structures.
On the basis of the calculated barriers, the BEP relationshipsfor the three elementary mechanisms (Tafel, Heyrovsky, andVolmer) involved in the overall HOR and HER have beenestablished. It is found that the predominant reaction mechanismon the Pt(111) electrode is the Tafel reaction. We calculate abarrier of around 0.85 eV at U ) 0 V vs NHE, which is not inagreement with the experimental one of 0.2 eV. The exchangecurrent we calculate from this barrier is, however, in perfectagreement with the same experiment.
We studied the structure dependence of different facets of Ptfor the Tafel reaction. Our calculated rates are in good agreementwith the rates observed experimentally for the same facets.
To gain further insight into the kinetics of the Tafel reaction,we considered different metals, different facets, and steps.Generally, the energetics follow a BEP relation that includesthe Pt(111) data. Furthermore, the HER exchange current(current in the HER direction at U ) 0 V vs NHE) has beenevaluated for a range of hydrogen adsorption free energies, usinga kinetic model that takes the full free energy landscape as input.The agreement with experimental data is excellent.
Acknowledgment. CAMD is funded by the LundbeckFoundation. The Catalysis for Sustainable Energy initiative isfunded by the Danish Ministry of Science, Technology andInnovation. This work was supported by the Danish Center forScientific Computing, the Danish Council for Technology andInnovation’s FTP program, the Strategic ElectrochemistryResearch Center, the Danish Research Councils (STVF), TheDepartment of Energy, Basic Energy Sciences, the EU throughthe FC-Anode network, STREP no. NMP-2007-032175, and theMC-RTN network ‘Hydrogen’ and the Icelandic ScienceFoundation.
References and Notes(1) Hydrogen as a Future Energy Carrier; Zuttel, A., Borgschulte, A.,
Schlapback, L., Eds.; Wiley-VCH: Weinheim, Germany, 2008.
Figure 18. A volcano plot. The data points are measured exchangecurrent density plotted versus the calculated free energy of H adsorptionat U ) 0 V. The metals on the left side of the volcano have high Hcoverage (1 ML) and the metals on the right side low H coverage (0.25ML). The line is a prediction by a kinetic model in which all inputparameters are taken from DFT calculations. The dashed line indicatesthat the metals which bind H stronger than 0.2 eV/H usually form oxidesat U ) 0 V. The open circles are (111) data whereas the filled circlesare polycrystalline.
18196 J. Phys. Chem. C, Vol. 114, No. 42, 2010 Skulason et al.

(2) Markovic, N. M.; Grgur, B. N.; Ross, P. N. J. Phys. Chem. B 1997,101, 5405.
(3) Markovic, N. M.; Ross, P. N., Jr. Surf. Sci. Rep. 2002, 45, 117.(4) Kunimatsu, K.; Senzaki, T.; Tsushima, M.; Osawa, M. Chem. Phys.
Lett. 2005, 401, 451.(5) Conway, B. E.; Jerkiewicz, G. Electrochim. Acta 2000, 45, 4075.(6) Barber, J.; Morin, S.; Conway, B. E. J. Electroanal. Chem. 1998,
446, 125.(7) Tavares, M. C.; Machado, S. A. S.; Mazo, L. H. Electrochim. Acta
2001, 46, 4359.(8) Santana, J. A.; Mateo, J. J.; Ishikawa, Y. J. Phys. Chem. C 2010,
114, 4995.(9) Cai, Y.; Anderson, A. B. J. Phys. Chem. B 2004, 108, 9829.
(10) Cai, Y.; Anderson, A. B.; Angus, J. C.; Kostadinov, L. N.Electrochem. Solid-State Lett. 2005, 8, E62.
(11) Skulason, E.; Karlberg, G. S.; Rossmeisl, J.; Bligaard, T.; Greeley,J.; Jonsson, H.; Nørskov, J. K. Phys. Chem. Chem. Phys. 2007, 9, 3241.
(12) Wang, J. X.; Springer, T. E.; Adzic, R. R. J. Electrochem. Soc.2006, 153, A1732.
(13) Rossmeisl, J.; Nørskov, J. K.; Taylor, C. D.; Janik, M. J.; Neurock,M. J. Phys. Chem. B 2006, 110, 21833.
(14) Nørskov, J. K.; Bligaard, T.; Logadottir, A.; Kitchin, J. R.; Chen,J. G.; Pandelov, S.; Stimming, U. J. Electrochem. Soc. 2005, 152, J23.
(15) Shubina, T. E.; Koper, M. T. M. Electrochem. Commun. 2006, 8,703.
(16) Vassilev, P.; van Santen, R. A.; Koper, M. T. M. J. Chem. Phys.2005, 122, 054701.
(17) Roudgar, A.; Gro�, A. Chem. Phys. Lett. 2005, 409, 157.(18) Filhol, J. S.; Neurock, M. Angew. Chem., Int. Ed. 2006, 45, 402.(19) Otani, M.; Sugino, O. Phys. ReV. B 2006, 73, 115407.(20) Sugino, O.; Hamada, I.; Otani, M.; Morikawa, Y.; Ikeshoji, T.;
Okamoto, Y. Surf. Sci. 2007, 601, 5237.(21) Rossmeisl, J.; Skulason, E.; Bjorketun, M. E.; Tripkovic, V.;
Nørskov, J. K. Chem. Phys. Lett. 2008, 466, 68.(22) Jinnouchi, R.; Anderson, A. B. J. Phys. Chem. C 2008, 112, 8747.(23) Payne, M. C.; Teter, M. P.; Allan, D. C.; Arias, T. A.; Joannopoulos,
J. D. ReV. Mod. Phys. 1992, 64, 1045.(24) Kresse, G.; Furtmuller, J. Comput. Mater. Sci. 1996, 6, 15.(25) Vanderbilt, D. Phys. ReV. B 1990, 41, 7892.(26) Dacapo pseudopotential code, URL: https://wiki.fysik.dtu.dk/dacapo,
Center for Atomic-scale Materials Design (CAMD), Technical Universityof Denmark, Lyngby.
(27) Hammer, B.; Hansen, L. B.; Nørskov, J. K. Phys. ReV. B 1999, 59,7413.
(28) Kresse, G.; Hafner, J. Phys. ReV. B 1993, 48, 13115.(29) Kresse, G.; Furthmuller, J. Phys. ReV. B 1996, 54, 11169.(30) Jonsson, H.; Mills, G.; Jacobsen, K. W. In Classical and Quantum
Dynamics in Condensed Phase Simulations; Berne, B. J., Ciccotti, G., Coker,D. F., Eds.; World Scientific: Singapore, 1998.
(31) Henkelman, G.; Jonsson, H. J. Chem. Phys. 2000, 113, 9978.(32) Karlberg, G. S.; Jaramillo, T. F.; Skulason, E.; Rossmeisl, J.;
Bligaard, T.; Nørskov, J. K. Phys. ReV. Lett. 2007, 99, 126101.(33) Zundel, G.; Metzger, H. Z. Phys. Chem. (N.F.) 1968, 58, 225.
(34) Zundel, G. In The Hydrogen Bond-Recent DeVelopments in Theoryand Experiments. II. Structure and Spectroscopy; Schuster, P., Zundel, G.,Sandorfy, C., Eds.; North-Holland: Amsterdam, The Netherlands, 1976;pp 683-766.
(35) Wicke, E.; Eigen, M.; Ackermann, Th. Z. Phys. Chem. (N.F.) 1954,1, 340.
(36) Eigen, M. Angew. Chem., Int. Ed. 1964, 3, 1.(37) Marx, D.; Tuckerman, M. E.; Hutter, J.; Parrinello, M. Nature 1999,
397, 601.(38) Randles, J. E. B. Trans. Faraday Soc. 1956, 52, 1573.(39) Kotz, E. R.; Neff, H.; Muller, K. J. Electroanal. Chem. 1986, 215,
331.(40) Schnur, S.; Gro�, A. New J. Phys. 2009, 409, 157.(41) Haq, S.; Clay, C.; Darling, G. R.; Zimbitas, G.; Hodgson, A. Phys.
ReV. B 2006, 73, 115414.(42) Pajkossy, T.; Kolb, D. M. Electrochim. Acta 2001, 46, 3063.(43) Nørskov, J. K.; Rossmeisl, J.; Logadottir, A.; Lindqvist, L.; Kitchin,
J. R.; Bligaard, T.; Jonsson, H. J. Phys. Chem. B 2004, 108, 17886.(44) Greeley, J.; Mavrikakis, M. J. Phys. Chem. B 2005, 109, 3460.(45) Atkins, P. W., Physical Chemistry, 6th ed.; Oxford University Press:
Oxford, UK, 1998; p 582.(46) Atkins, P. W. Physical Chemistry, 6th ed.; Oxford University Press:
Oxford, UK, 1998; pp 485, 925, and 942.(47) Strmcnik, D.; van der Vliet, D.; Stamenkovic, V.; Markovic, N. M.
Electrochem. Commun. 2008, 10, 1602.(48) Nørskov, J. K.; Bligaard, T.; Logadottir, A.; Bahn, S.; Bollinger,
M.; Hansen, L. B.; Bengaard, H.; Hammer, B.; Sljivancanin, Z.; Mavrikakis,M.; Xu, Y.; Dahl, S.; Jacobsen, C. J. H. J. Catal. 2002, 209, 275.
(49) Pallasana, V.; Neurock, M. J. Catal. 2000, 191, 301.(50) Liu, Z. P.; Hu, P. J. Chem. Phys. 2001, 114, 8244.(51) Logadottir, A.; Rod, T. H.; Nørskov, J. K.; Hammer, B.; Dahl, S.;
Jacobsen, C. J. H. J. Catal. 2001, 197, 229.(52) Ferrin, P.; Simonetti, D.; Kandoi, S.; Kunkes, E.; Dumesic, J. A.;
Nørskov, J. K.; Mavrikakis, M. J. Am. Chem. Soc. 2009, 131, 5809.(53) Hammett, L. P.; Paul, M. A. J. Am. Chem. Soc. 1934, 56, 830.(54) Gohda, Y.; Schnur, S.; Gro�, A. Faraday Discuss. 2008, 140, 233.(55) Mitsui, T.; Rose, M. K.; Fomin, E.; Ogletree, D. F.; Salmeron, M.
Nature 2003, 422, 705.(56) Lopez, N.; Lodziana, Z.; Illas, F.; Salmeron, M. Phys. ReV. Lett.
2004, 93, 146103.(57) Gro�, A.; Dianat, A. Phys. ReV. Lett. 2007, 98, 206107.(58) Minca, M.; Penner, S.; Loerting, T.; Menzel, A.; Bertel, E.; Zucca,
R.; Redinger, J. Top. Catal. 2007, 46, 161.(59) Kresse, G.; Hafner, J. Surf. Sci. 2000, 459, 287.(60) Dong, W.; Ledentu, V.; Sautet, P.; Eichler, E.; Hafner, J. Surf. Sci.
1998, 411, 123.(61) Gerischer, H. Z. Phys. Chem. (N.F.) 1956, 8, 137.(62) Parsons, R. Trans. Faraday Soc. 1958, 54, 1053.(63) Krishtalik, L. AdV. Electrochem. Electrochem. Eng. 1970, 7, 283.(64) Trasatti, S. J. Electroanal. Chem. Interfacial Electrochem. 1972,
39, 163.(65) Trasatti, S. AdV. Electrochem. Electrochem. Eng. 1977, 10, 213.
JP1048887
Modeling H Oxidation and Evolution Reactions J. Phys. Chem. C, Vol. 114, No. 42, 2010 18197
Related Documents