Modeling the Electric Potential across Neuronal Membranes: The Effect of Fixed Charges on Spinal Ganglion Neurons and Neuroblastoma Cells Thiago M. Pinto 1,2 *, Roseli S. Wedemann 1 , Ce ´ lia M. Cortez 1 1 Instituto de Matema ´tica e Estatı ´stica, Universidade do Estado do Rio de Janeiro, Rio de Janeiro, Brazil, 2 Departamento de Fı ´sica, Faculdade de Filosofia, Cie ˆ ncias e Letras de Ribeira ˜o Preto, Universidade de Sao Paulo, Ribeirao Preto, Brazil ˜ ˜ Abstract We present a model for the electric potential profile across the membranes of neuronal cells. We considered the resting and action potential states, and analyzed the influence of fixed charges of the membrane on its electric potential, based on experimental values of membrane properties of the spinal ganglion neuron and the neuroblastoma cell. The spinal ganglion neuron represents a healthy neuron, and the neuroblastoma cell, which is tumorous, represents a pathological neuron. We numerically solved the non-linear Poisson-Boltzmann equation for the regions of the membrane model we have adopted, by considering the densities of charges dissolved in an electrolytic solution and fixed on both glycocalyx and cytoplasmic proteins. Our model predicts that there is a difference in the behavior of the electric potential profiles of the two types of cells, in response to changes in charge concentrations in the membrane. Our results also describe an insensitivity of the neuroblastoma cell membrane, as observed in some biological experiments. This electrical property may be responsible for the low pharmacological response of the neuroblastoma to certain chemotherapeutic treatments. Citation: Pinto TM, Wedemann RS, Cortez CM (2014) Modeling the Electric Potential across Neuronal Membranes: The Effect of Fixed Charges on Spinal Ganglion Neurons and Neuroblastoma Cells. PLoS ONE 9(5): e96194. doi:10.1371/journal.pone.0096194 Editor: David J. Schulz, University of Missouri, United States of America Received January 2, 2014; Accepted April 4, 2014; Published May 6, 2014 Copyright: ß 2014 Pinto et al. This is an open-access article distributed under the terms of the Creative Commons Attribution License, which permits unrestricted use, distribution, and reproduction in any medium, provided the original author and source are credited. Funding: The authors acknowledge support from the Brazilian National Council for Scientific and Technological Development (CNPq), the Rio de Janeiro State Research Foundation (FAPERJ), the Sa ˜o Paulo Research Foundation (FAPESP), and the Brazilian agency which funds graduate studies (CAPES). The funders had no role in study design, data collection and analysis, decision to publish, or preparation of the manuscript. Competing Interests: The authors have declared that no competing interests exist. * E-mail: [email protected] Introduction Electrostatic forces affect the passive and active transport of charged particles through biological membranes. The flow rate of ions through the membrane depends on the strength of the intramembranous electric field. These forces also affect the robustness of some ligands of the membrane [1]. In this work, we study the influence of surface electric charges on the stability of the cell membrane in the condition of equilibrium, by modeling the electric potential profile. The profile describes the behavior of the potential along the axis perpendicular to the cell membrane, from the outer bulk region to the inner cytoplasmic region [2–5]. We do not consider here dynamical phenomena in the structure of the membrane, and treat only the electrostatic situation, which occurs once the system has reached equilibrium. We refer the reader to studies such as [6,7] that treat dynamical, nonequilib- rium phenomena, like the molecular dynamics of ion channels associated with transmembrane ion transport, using the Poisson- Nersnt-Planck theory [6] and the Poisson-Boltzmann-Nernst- Planck model [7]. The electric potential on a cell surface is determined as the difference of potential between the membrane-solution interface and the bulk region [1]. It has been shown that the electrophoretic behavior of neuroblastoma cells provides information about their surface charges, in different phases of the cellular cycle [8–10]. These experiments show that membrane anionic groups are mainly responsible for the surface charges of murine neuroblas- toma cells [10]. It is known that neuroblastoma cells, like all other cancerous cells, multiply quickly. Alterations of the dynamics of cellular multiplication compromise the synthesis and structure of components of the membrane, with possible degradation of these components, promoting deformations of the structure and composition of the plasma membrane [11]. We show a detailed and revised description of the model more briefly presented by Cortez and collaborators in [3–5], which was originally used to simulate the squid giant axon. This model is based on the statistical mechanical theory of electrolyte solutions and electric double layers [12–15]. We then present a study that applies this model in a novel way to the neurons of mammals (mice) [16,17], in order to investigate the alterations of the electric potential and therefore, the capability of transmitting electric signals in the membrane of cancerous neurons. Here, the spinal ganglion neuron denotes a healthy neuron, and the neuroblastoma cell represents a tumorous neuron. With simulations of this model, we compare the effects of charges fixed onto the inner surface of the membrane and those associated with cytoplasmic proteins, on the electric potential on the surfaces of the membranes of both types of cells, considering both natural states of neurons, the resting and the action potential (AP) states. The AP state refers to the state of the neuron in which it has been stimulated enough, so that its physico-chemical conditions are such that the transmem- brane potential reaches the maximum value of the AP. The temporal evolution of the transmembrane potential was not PLOS ONE | www.plosone.org 1 May 2014 | Volume 9 | Issue 5 | e96194 Sao Paulo, ˜

Welcome message from author
This document is posted to help you gain knowledge. Please leave a comment to let me know what you think about it! Share it to your friends and learn new things together.
Transcript

Modeling the Electric Potential across NeuronalMembranes: The Effect of Fixed Charges on SpinalGanglion Neurons and Neuroblastoma CellsThiago M. Pinto1,2*, Roseli S. Wedemann1, Celia M. Cortez1
1 Instituto de Matematica e Estatıstica, Universidade do Estado do Rio de Janeiro, Rio de Janeiro, Brazil, 2 Departamento de Fısica, Faculdade de Filosofia, Ciencias e Letras
de Ribeirao Preto, Universidade de Sao Paulo, Ribeirao Preto, Brazil˜ ˜
Abstract
We present a model for the electric potential profile across the membranes of neuronal cells. We considered the resting andaction potential states, and analyzed the influence of fixed charges of the membrane on its electric potential, based onexperimental values of membrane properties of the spinal ganglion neuron and the neuroblastoma cell. The spinal ganglionneuron represents a healthy neuron, and the neuroblastoma cell, which is tumorous, represents a pathological neuron. Wenumerically solved the non-linear Poisson-Boltzmann equation for the regions of the membrane model we have adopted,by considering the densities of charges dissolved in an electrolytic solution and fixed on both glycocalyx and cytoplasmicproteins. Our model predicts that there is a difference in the behavior of the electric potential profiles of the two types ofcells, in response to changes in charge concentrations in the membrane. Our results also describe an insensitivity of theneuroblastoma cell membrane, as observed in some biological experiments. This electrical property may be responsible forthe low pharmacological response of the neuroblastoma to certain chemotherapeutic treatments.
Citation: Pinto TM, Wedemann RS, Cortez CM (2014) Modeling the Electric Potential across Neuronal Membranes: The Effect of Fixed Charges on Spinal GanglionNeurons and Neuroblastoma Cells. PLoS ONE 9(5): e96194. doi:10.1371/journal.pone.0096194
Editor: David J. Schulz, University of Missouri, United States of America
Received January 2, 2014; Accepted April 4, 2014; Published May 6, 2014
Copyright: � 2014 Pinto et al. This is an open-access article distributed under the terms of the Creative Commons Attribution License, which permitsunrestricted use, distribution, and reproduction in any medium, provided the original author and source are credited.
Funding: The authors acknowledge support from the Brazilian National Council for Scientific and Technological Development (CNPq), the Rio de Janeiro StateResearch Foundation (FAPERJ), the Sao Paulo Research Foundation (FAPESP), and the Brazilian agency which funds graduate studies (CAPES). The funders had norole in study design, data collection and analysis, decision to publish, or preparation of the manuscript.
Competing Interests: The authors have declared that no competing interests exist.
* E-mail: [email protected]
Introduction
Electrostatic forces affect the passive and active transport of
charged particles through biological membranes. The flow rate of
ions through the membrane depends on the strength of the
intramembranous electric field. These forces also affect the
robustness of some ligands of the membrane [1]. In this work,
we study the influence of surface electric charges on the stability of
the cell membrane in the condition of equilibrium, by modeling
the electric potential profile. The profile describes the behavior of
the potential along the axis perpendicular to the cell membrane,
from the outer bulk region to the inner cytoplasmic region [2–5].
We do not consider here dynamical phenomena in the structure of
the membrane, and treat only the electrostatic situation, which
occurs once the system has reached equilibrium. We refer the
reader to studies such as [6,7] that treat dynamical, nonequilib-
rium phenomena, like the molecular dynamics of ion channels
associated with transmembrane ion transport, using the Poisson-
Nersnt-Planck theory [6] and the Poisson-Boltzmann-Nernst-
Planck model [7].
The electric potential on a cell surface is determined as the
difference of potential between the membrane-solution interface
and the bulk region [1]. It has been shown that the electrophoretic
behavior of neuroblastoma cells provides information about their
surface charges, in different phases of the cellular cycle [8–10].
These experiments show that membrane anionic groups are
mainly responsible for the surface charges of murine neuroblas-
toma cells [10]. It is known that neuroblastoma cells, like all other
cancerous cells, multiply quickly. Alterations of the dynamics of
cellular multiplication compromise the synthesis and structure of
components of the membrane, with possible degradation of these
components, promoting deformations of the structure and
composition of the plasma membrane [11].
We show a detailed and revised description of the model more
briefly presented by Cortez and collaborators in [3–5], which was
originally used to simulate the squid giant axon. This model is
based on the statistical mechanical theory of electrolyte solutions
and electric double layers [12–15]. We then present a study that
applies this model in a novel way to the neurons of mammals
(mice) [16,17], in order to investigate the alterations of the electric
potential and therefore, the capability of transmitting electric
signals in the membrane of cancerous neurons. Here, the spinal
ganglion neuron denotes a healthy neuron, and the neuroblastoma
cell represents a tumorous neuron. With simulations of this model,
we compare the effects of charges fixed onto the inner surface of
the membrane and those associated with cytoplasmic proteins, on
the electric potential on the surfaces of the membranes of both
types of cells, considering both natural states of neurons, the
resting and the action potential (AP) states. The AP state refers to
the state of the neuron in which it has been stimulated enough, so
that its physico-chemical conditions are such that the transmem-
brane potential reaches the maximum value of the AP. The
temporal evolution of the transmembrane potential was not
PLOS ONE | www.plosone.org 1 May 2014 | Volume 9 | Issue 5 | e96194
Sao Paulo,˜

considered. We also calculated the potential profile across the
membrane, including data from electrophoretic experiments in
our model.
Methods
Cortez and collaborators have proposed in [4] an axon
membrane model, to study how charges fixed onto the inner
surface of the membrane and those associated with cytoplasmic
proteins influence the electric potential of the squid axon
membrane. In their work, the effects of divalent ions were
included, with a numerical solution of the model equations. In the
present study, we apply this model to healthy and cancerous
mammalian neurons, to understand electrical characteristics of the
membranes of these cells. We present the formal derivation of the
complete model here, since it was not shown in [3,4] and because
we have found mistakes in some of the equations presented in [4].
We also describe, in Section Surface Potentials, a method for
calculating electric potentials on the interfaces of the neuronal
membrane, which was not discussed in previous work. We thus
present here a more detailed and revised description of the theory
and mathematical model of the electric potential across neuronal
membranes in equilibrium, which was originally discussed in [4].
In the neuronal membrane model we have adopted, shown in
Fig. (1), four different regions are presented: extracellular,
glycocalyx, bilayer and cytoplasm. The bilayer thickness is h and
the width of the glycocalyx is hg. Surface potentials are represented
as wSegfor the potential on the surface Seg, between the
extracellular and glycocalyx regions, wSgbis the potential on the
surface Sgb, between the glycocalyx and the bilayer, and wSbcis the
potential on the surface Sbc, between the bilayer and cytoplasm.
We denote by w{? and wz? the potentials at {?, in the
electrolytic extracellular phase, and at z?, in the bulk
cytoplasmic region, respectively.
The Electric Potential in the Membrane RegionsTo determine the potential profile across the membrane, we
first consider the Poisson equation [3,4,15],
+2wi(x,y,z)~{4pri(z)
Ei
,
for i [ fext,g,b,cg,ð1Þ
where wi(x,y,z) is the electric potential in any region i; i~ext for
the outer electrolytic region; i~g for the glycocalyx; i~b for the
bilayer; and i~c for the cytoplasm. The volumetric charge density
due to the electrolytes in solution of area i is ri(z), and Ei is the
dielectric constant in region i. There is no charge in the bilayer
(i~b), due to its hydrophobic property, and thus rb(z)~0.
We consider the further boundary conditions to calculate the
constants of integration:
1. When z tends to an extreme value, z?{? (in region ext) or
z?z? (in the cytoplasm), the electric potential tends to
limiting values represented by w{? and wz?, respectively.
Ionic concentrations assume limiting values in the bulk regions,
limz?{?
gc,ext(z)~gc,{? and limz?z?
gc,c(z)~gc,z?, respectively,
where c represents an ion, such as Naz, Kz, or Cl{.
2. When z~{hg{h=2 and z~+h=2, we consider the continu-
ity of the electric potentials, wSeg, wSgb
and wSbc, respectively.
3. There is a discontinuity of the electric field vector on the
surfaces between regions.
The Effect of Fixed Charges. When we include the effect of
fixed charges in the model, Poisson Eq. (1) becomes
+2wi(x,y,z)~{4p(ri(z)zrfi)
Ei
, ð2Þ
where rfi is the density of charges fixed onto proteins of area i
(rfext~0, for the outer electrolytic region, rfg for the glycocalyx,
and rfc for the cytoplasm).
The volumetric charge density ri(z) is the sum of the charge
densities of positive and negative ions in the solution [3]
ri(z)~Xcz
eVczgcz,i(z)zXc{
eVc{gc{,i(z), ð3Þ
where cz represents a positive ion, and c{, a negative ion. The
molar density for an ion c (ionic concentration) in region i is gc,i(z),
and Vc is the valency of ion c. For example, VCa2z~2 and
VCl{~{1. The absolute value of the electron charge is e. Due to
the electroneutrality condition, we can write
ðri(z)dz~0,
within the boundaries of each region.
In our model, we suppose that the surfaces are infinite in the xand y directions, perpendicular to z, and that the distribution of
charges in these directions is homogeneous. Considering this, and
substituting Eq. (3) in Eq. (2), we obtain
d2wi(z)
dz2~{
4p
Ei
Xcz
eVczgcz ,i(z)z
0@ X
c{eVc{gc{,i(z)
!zai, ð4Þ
where
ai~{4prfi
Ei
: ð5Þ
To determine gc,i(z), we use the equation for the electrochemical
potential, due to an ionic solute in a diluted solution [3,4]
mc,i(z)~m0c,i(P,T)zKTln(gc,i(z))zeVcwi(z), ð6Þ
where K is Boltzmann’s constant, T is the temperature, m0c,i(P,T)
is the standard chemical potential, dependent on pressure and
temperature, KTln(gc,i(z)) is a term that expresses the influence of
the ionic concentration gc,i(z), and eVcwi(z) is the contribution of
the electric potential.
Applying the ~++ operator in Eq. (6) and again considering the
homogeneous distribution of charges in the directions perpendic-
ular to z, we verify that
dmc,i(z)
dz~
dm0c,i(P,T)
dzzKT
d
dzln(gc,i(z))zeVc
dwi(z)
dz: ð7Þ
Considering that there is a condition of Boltzmann equilibrium in
the aqueous environments adjacent to the bilayer,dmc,i(z)
dz~0 and
dm0c,i P,Tð Þ
dz~0, and Eq. (7) becomes
Modeling the Electric Potential across Membranes
PLOS ONE | www.plosone.org 2 May 2014 | Volume 9 | Issue 5 | e96194

0~KTd
dzln(gc,i(z))zeVc
dwi(z)
dz: ð8Þ
The integration of Eq. (8) from z in one of the three regions,
extracellular, glycocalyx and cytoplasm, to a limiting boundary
region, for which we have experimentally measured quantities,
considering the electrolytes distributed over the adjacency of the
bilayer gives
ðgc,i,l
gc,i (z)
KTd
dgc,i
ln(gc,i(z))dgc,i~{
ðwi,l
wi (z)
eVcdwi(z)
dwi
dwi, ð9Þ
where wi,l and gc,i,l are limiting values of the electric potential and
the ionic concentration of c, respectively, in region i. The solution
of Eq. (9) results in
gc,i(z)~gc,i,l exp
{eVcDwi (z)KT
� �, ð10Þ
where
Dwi(z)~wi(z){wi,l : ð11Þ
The molar density for a positive c ion is thus given by
gcz ,i(z)~gcz ,i,l exp
{eZcz
Dwi (z)
KT
� �, ð12Þ
and for a negative c ion
gc{,i(z)~gc{ ,i,l exp
eZc{Dwi (z)
KT
� �, ð13Þ
where
Zc~jVcj: ð14Þ
Equations (12) and (13) are the Boltzmann distribution of charges
due to the presence of positive and negative c ions [15],
respectively, in the phases adjacent to the bilayer. Substituting
Eqs. (12) and (13) in Eq. (4), we obtain
d2wi(z)
dz2~{
4p
Ei
|
Xcz
eZczgcz,i,l exp
{eZcz
Dwi (z)
KT
� �0B@ {
Xc{
eZc{gc{,i,l exp
eZc{Dwi (z)
KT
� �1CAzai:
ð15Þ
In the bulk regions, we can consider the electroneutrality condition
Xcz
eZczgcz ,i,l~Xc{
eZc{gc{ ,i,l , ð16Þ
and, in a first approximation, we assume a symmetric electrolyte to
simplify our calculations, so that
gcz ,i,l~gc{,i,l~gc,i,l : ð17Þ
We have taken the boundary values from experimental measure-
ments in the bulk regions and on surface Seg, so that wext,l~w{?,
wc,l~wz?, and wg,l~wSeg. For the ionic concentrations,
gc,ext,l~gc,{?, gc,c,l~gc,z?, and gc,g,l~gc,g({hg{h=2).
Throughout, we denote by wSijthe electric potential on surface
Sij between regions i and j.
Figure 1. Model for a neuronal membrane. Different regions are presented, with the corresponding symbols for the potentials on the surfacesdividing regions. Symbols are explained in the text. Minus signs illustrate negative fixed charges on proteins.doi:10.1371/journal.pone.0096194.g001
Modeling the Electric Potential across Membranes
PLOS ONE | www.plosone.org 3 May 2014 | Volume 9 | Issue 5 | e96194

We can now use Eq. (17) to rewrite Eq. (15) as
d2wi(z)
dz2~{
Xc
4peZcgc,i,l
Ei
| exp
{eZcDwi (z)KT
� �{ exp
eZcDwi (z)KT
� �0B@
1CAzai:
ð18Þ
If we consider that
exp
{eZcDwi (z)KT
� �{ exp
eZcDwi (z)KT
� �~{2 sinh
eZcDwi(z)
KT
� �, ð19Þ
we can write Eq. (18) as
d2wi(z)
dz2~X
c
8peZcgc,i,l
Ei
sinheZcDwi(z)
KT
� �� �zai: ð20Þ
Our model only considers mono (Z1~1) and divalent (Z2~2) ions
[4]. We thus limit the c sum to
d2wi(z)
dz2~
8peg1,i,l
Ei
� �sinh
eDwi(z)
KT
� �
z16peg2,i,l
Ei
� �sinh
2eDwi(z)
KT
� �zai:
ð21Þ
To simplify further calculations, we denote
Ai~8peg1,i,l
Ei
, Bi~16peg2,i,l
Ei
,b~e
KT, ð22Þ
and Eq. (21) may be expressed as
d2wi(z)
dz2~Ai sinh bDwi(z)ð ÞzBi sinh 2bDwi(z)ð Þzai: ð23Þ
Considering that
sinh 2bDwi(z)ð Þ~2 sinh bDwi(z)ð Þ cosh bDwi(z)ð Þ, ð24Þ
Eq. (23) can be rewritten as
d2wi(z)
dz2~Ai sinh bDwi(z)ð Þ
z2Bi sinh bDwi(z)ð Þ cosh bDwi(z)ð Þzai:
ð25Þ
Multiplying Eq. (25) by
2dwi~2dwi(z)
dzdz, ð26Þ
and integrating, we have
ð2
d2wi(z)
dz2
dwi(z)
dzdz~
ð2Ai sinh bDwi(z)ð Þdwi
z
ð4Bi sinh bDwi(z)ð Þ cosh bDwi(z)ð Þdwi
z
ð2aidwi,
ð27Þ
whose solution is
dwi(z)
dz
� �2
~2Ai cosh bDwi(z)ð Þ
bz
2Bi cosh2 bDwi(z)ð Þb
z2aiwi(z)zWi,
ð28Þ
where Wi is a constant of integration for region i.
To further simplify the symbolic representation of the equations,
considering Eqs. (5) and (22), we denote
Qmi~2Ai, Qdi
~2Bi, and ,
gi~2ai,ð29Þ
where Qmiand Qdi
express the influence of boundary value
concentrations of monovalent and divalent ions, respectively, in
each region i. Eq. (28) is thus expressed as
dwi(z)
dz
� �2
~Qmi
cosh bDwi(z)ð Þb
zQdi
cosh2 bDwi(z)ð Þb
zgiwi(z)zWi:
ð30Þ
We can rewrite Eq. (30) as
dwi(z)
dz~
ffiffiffiffiffiffiffiffiffiffiffiffiffiffiffiffiffiffiffiffiffiffiffiffiffiffiffiffiffiffiffiffiffiffiffiffiffiffiji(z)zgiwi(z)zWi
p, ð31Þ
where
ji(z)~Qmi
cosh bDwi(z)ð Þb
zQdi
cosh2 bDwi(z)ð Þb
: ð32Þ
Equation (31) is the Poisson-Boltzmann equation for the electric
potential in any region i.Solution of the Poisson-Boltzmann Equation for the
Extracellular Region. i~extð ÞIn the extracellular region, the effect of fixed charges is
negligible (rfext~0 and gext~0), and the solution of Eq. (31)
therefore only considers the electrolytic charges. Moreover, the
electric potential in z~{? is constant and we can write
dwext(z)
dz D(z~{?)~0: ð33Þ
In order to use Eq. (31) to calculate the potential in the
extracellular region, we must find the value of Wext. We thus
consider an imaginary surface S{?, perpendicular to the z{axis,
at z1%({hg{h=2), where rfext~0. We then integrate Eq. (31)
from another position z2vz1 to z1. Since both z1 and z2 are in the
{? region, w{?~wext(z1)~wext(z2)~wS{? , and
Dwext(z2)~wext(z2){wS{?~0. We can then substitute Eq. (33)
Modeling the Electric Potential across Membranes
PLOS ONE | www.plosone.org 4 May 2014 | Volume 9 | Issue 5 | e96194

and Dwext(z2)~0 in Eq. (31), to calculate Wext as
0~Qmext
bcosh 0ð Þz Qdext
bcosh2 0ð ÞzWext, ð34Þ
and
Wext~{Qmext{Qdext
b: ð35Þ
We then substitute Eq. (35) in Eq. (31) to obtain the differential
equation for wext(z), for any position zv({hg{h=2), in the
extracellular region
dwext(z)
dz~
ffiffiffiffiffiffiffiffiffiffiffiffiffiffiffiffiffiffiffiffiffiffiffiffiffiffiffiffiffiffilext(z)zsext(z)
p, ð36Þ
where
lext(z)~Qmext cosh bDwext(z)ð Þ{1½ �
b,
sext(z)~Qdext cosh2 bDwext(z)ð Þ{1
b
,
and , Dwext(z)~wext(z){w{?:
ð37Þ
Equation (36) can be simplified to
dwext(z)
dz~
ffiffiffiffiffiffiffiffiffiffiffiffiffiffiffiffiffiffiffiffiffiffiffiffiffiffiffiffiffiffiffixext(z)zvext(z)
p, ð38Þ
where
xext(z)~2
Qmext sinh2 b
2Dwext(z)
� �b
,
and ,
vext(z)~Qdext sinh2 bDwext(z)ð Þ
b:
ð39Þ
Solution of the Poisson-Boltzmann Equation for the
Cytoplasmic Region. i~cð ÞBecause, in the cytoplasmic re-
gion, the potential in z~z? is also constant,
dwc(z)
dz D(z~z?)~0: ð40Þ
As we did for the extracellular region, to calculate the potential in
the cytoplasmic region using Eq. (31), we must first find the value
of Wc. We thus consider an imaginary surface Sz?, perpendic-
ular to the z{axis, at z3&(h=2). We then integrate Eq. (31) from
another position z4wz3 to z3. As both z3 and z4 are in the z?region, wz?~wc(z3)~wc(z4)~wSz? , and
Dwc(z4)~wc(z4){wSz?~0. We thus substitute Eq. (40) and
Dwc(z4)~0 in Eq. (31), to obtain Wc as
0~Qmc
bcosh 0ð Þz Qdc
bcosh2 0ð Þzgcwz?zWc: ð41Þ
The constant of integration Wc is
Wc~{Qmc{Qdc
b{gcwz?: ð42Þ
We then substitute Eq. (42) in Eq. (31) to obtain the differential
equation for wc(z), for any zw(h=2), in the cytoplasmic region
dwc(z)
dz~
ffiffiffiffiffiffiffiffiffiffiffiffiffiffiffiffiffiffiffiffiffiffiffiffiffiffiffiffiffiffiffiffiffiffiffiffiffiffiffiffiffiffiffiffiffiffilc(z)zsc(z)zgcDwc(z)
p, ð43Þ
where
lc(z)~Qmc cosh bDwc(z)ð Þ{1½ �
b,
sc(z)~Qdc cosh2 bDwc(z)ð Þ{1
b,
and , Dwc(z)~wc(z){wz?:
ð44Þ
Equation (43) can be simplified to
dwc(z)
dz~
ffiffiffiffiffiffiffiffiffiffiffiffiffiffiffiffiffiffiffiffiffiffiffiffiffiffiffiffiffiffiffiffiffiffiffiffiffiffiffiffiffiffiffiffiffiffiffixc(z)zvc(z)zgcDwc(z)
p, ð45Þ
where
xc(z)~2
Qmc sinh2 b
2Dwc(z)
� �b
, and ,
vc(z)~Qdc sinh2 bDwc(z)ð Þ
b:
ð46Þ
Solution of the Poisson-Boltzmann Equation for the
Glycocalyx Region. i~gð ÞWe consider that the potential wSeg
on the surface Seg satisfies
dwg(z)
dz D(z~{hg{h=2)zz~~EEgjSeg
, ð47Þ
where zz is the unit vector in the z direction, and ~EEkjSijis the
electric field in region k, ~EEk(zij), at zij , the position of surface Sij
between regions i and j, e.g., ~EEgjSeg~~EEg({hg{h=2) is the
electric field in the glycocalyx region at the position of surface Seg.
We have previously stated that the boundary condition for ionic
concentrations in the glycocalyx is defined as
gc,g,l~gc,g({hg{h=2). In order to obtain gc,g({hg{h=2) from
the experimentally measured gc,{?, we would need to apply Eqs.
(12) and (13). This would result in four values of gc,g({hg{h=2)
(for positive and negative, monovalent and divalent ions). In this
case, the symmetric electrolytes assumption (Eq. (17)) would not
hold, and the mathematical formalism leading to Eq. (31) would
not apply. Nevertheless, in Eq. (15), the difference in the
contributions of the terms involving gc,g,l for the different ions is
small compared to the value of the ai term, which is a few order of
magnitude larger. We thus assume that gc,g({hg{h=2)~gc,{?,
for monovalent and divalent ions.
In order to use Eq. (31) to calculate the potential in the
glycocalyx region, we need to find the value of Wg. We thus solve
Modeling the Electric Potential across Membranes
PLOS ONE | www.plosone.org 5 May 2014 | Volume 9 | Issue 5 | e96194

Eq. (31) at z~{hg{h=2, on the surface Seg, and take
wg({hg{h=2)~wSeg, and
Dwg({hg{h=2)~wg({hg{h=2){wSeg~0. We can then substi-
tute Eq. (47) and Dwg({hg{h=2)~0 in Eq. (31), to calculate Wg
as
~EEgjSeg
� �2
~Qmg
bcosh (0)z
Qdg
bcosh2 (0)zggwSeg
zWg: ð48Þ
The constant of integration Wg, for the glycocalyx region, is
therefore
Wg~ ~EEgjSeg
� �2
{QmgzQdg
b
� �{ggwSeg
: ð49Þ
We then substitute Eq. (49) in Eq. (31) to obtain the differential
equation for wg(z), for any position ({hg{h=2)vzv({h=2), in
the glycocalyx region
dwg(z)
dz~
ffiffiffiffiffiffiffiffiffiffiffiffiffiffiffiffiffiffiffiffiffiffiffiffiffiffiffiffiffiffiffiffiffiffiffiffiffiffiffiffiffiffiffiffiffiffiffiffiffiffiffiffiffiffiffiffiffiffiffiffiffiffiffiffiffilg(z)zsg(z)zggDwg(z)z~EEgj2Seg
q, ð50Þ
where
lg(z)~Qmg cosh bDwg(z)
� �{1
b
,
sg(z)~Qdg cosh2 bDwg(z)
� �{1
b
,
and , Dwg(z)~wg(z){wSeg:
ð51Þ
Equation (50) can be further simplified to
dwg(z)
dz~
ffiffiffiffiffiffiffiffiffiffiffiffiffiffiffiffiffiffiffiffiffiffiffiffiffiffiffiffiffiffiffiffiffiffiffiffiffiffiffiffiffiffiffiffiffiffiffiffiffiffiffiffiffiffiffiffiffiffiffiffiffiffiffiffiffixg(z)zvg(z)zggDwg(z)z~EEgj2Seg
q, ð52Þ
where
xg(z)~2
Qmg sinh2 b
2Dwg(z)
� �b
, and ,
vg(z)~Qdg sinh2 bDwg(z)
� �b
:
ð53Þ
Solution of the Poisson-Boltzmann Equation for the
Bilayer. i~bð ÞAs mentioned earlier, because the bilayer is
highly hydrophobic, rb(z)~0, and therefore Eq. (2) assumes the
form
+2wb(x,y,z)~0, ð54Þ
and its solution is a family of linear functions. The electric field
within the bilayer (see Eq. (59)), ~EEb, can thus be expressed as
~EEb~wSgb
{wSbc
hzz: ð55Þ
Surface PotentialsIn order to solve the differential Eqs. (38), (45) and (52) for the
extracellular, cytoplasmic and glycocalyx regions of the neuronal
membrane, respectively, we must know the values of the surface
potentials wSeg, wSgb
and wSbc. Although membrane surface
potentials in cells cannot be measured experimentally, it is possible
to obtain analytical predictions for the values of wSeg, wSgb
and wSbc,
from basic electrostatic relations, as we will now show.
Considering the surface densities of electric charges, Gauss’ law,
and the discontinuity of the electric field vector on the surfaces Seg,
Sgb and Sbc, we obtain
Eg~EEgjSeg
{Eext~EEextjSeg
~4pQSeg zz, ð56Þ
Eb~EEbjSgb
{Eg~EEgjSgb
~4pQSgbzz, and , ð57Þ
Ec~EEcjSbc
{Eb~EEbjSbc
~4pQSbczz, ð58Þ
respectively, where ~EEbjSgb~~EEbjSbc
~~EEb (see Eq. (55)). In the
above, QSeg , QSgband QSbc
stand for the charge density on the
Seg, Sgb and Sbc surfaces, respectively.
As
~EEi~{~++wi(z)~{dwi(z)
dzzz, ð59Þ
in order to determine the discontinuity of the electric field vector
on the surfaces Seg, Sgb and Sbc, we substitute Eq. (59) in Eqs. (56),
(57) and (58), and obtain
~EEgjSeg~
4pQSeg {Eextdwext(z)
dzj(z~{hg{h=2)
Eg
zz, ð60Þ
~EEb~4pQSgb
{Egdwg(z)
dzj(z~{h=2)
Eb
zz, and , ð61Þ
~EEb~{4pQSbc
{Ecdwc(z)
dzj(z~h=2)
Eb
zz: ð62Þ
As we have previously obtained the expression that determines the
electric field within the bilayer, ~EEb, we substitute Eq. (55) into Eqs.
(61) and (62), and obtain
Modeling the Electric Potential across Membranes
PLOS ONE | www.plosone.org 6 May 2014 | Volume 9 | Issue 5 | e96194

wSbc~wSgb
{h
Eb
4pQSgb{Eg
dwg(z)
dzj(z~{h=2)
� �, ð63Þ
wSgb~wSbc
{h
Eb
4pQSbczEc
dwc(z)
dzj(z~h=2)
� �, ð64Þ
respectively.
Substituting Eqs. (52) and (60) in Eq. (63), we determine the
expression to calculate the surface potential wSbc
wSbc~wSgb
{4pQSgb
h
Eb
zEgh
Eb
ffiffiffiap
, ð65Þ
where
a~xg({h=2)zvg({h=2)zggDwg({h=2)z
4pQSeg {Eextdwext(z)
dzj(z~{hg{h=2)
Eg
!2 ð66Þ
and here, Dwg({h=2)~wSgb{wSeg
. In the same manner,
substituting Eq. (45) in Eq. (64), we determine the expression to
calculate the surface potential wSgb
wSgb~wSbc
{4pQSbc
h
Eb
{Ech
Eb
ffiffiffikp
, ð67Þ
where
k~xc(h=2)zvc(h=2)zgcDwc(h=2), ð68Þ
and here, Dwc(h=2)~wSbc{wz?.
The electric potential on the surface Seg, wSeg, is determined
from electrophoretic experiments [9,16,17] and the Helmholtz-
Smoluchowski equation [3]
m~Eifi
4pni
, ð69Þ
where m is the electrophoretic mobility, fi~wSeg{w{? is the zeta
potential, and ni is the viscosity of region i. As, in our model, we
define the potential w{?~0, the surface potential wSegis
wSeg~
4pnim
Ei
: ð70Þ
Model Calculations for Spinal Ganglion Neurons andNeuroblastoma Cells
We have used data obtained from experimental observations
[9,16,17] for values of parameters, in order to solve the first order
ordinary differential equations, obtained from the Poisson-
Boltzmann Eq. (31), for the different regions of the membrane.
Some experimental values were obtained from electrophoretic
experiments. Since each kind of cell presents a specific electro-
phoretic mobility, the values of some parameters are different for
the spinal ganglion neuron and the neuroblastoma cell, in our
calculations. Tables (1) and (2) show all experimental values of the
parameters used to solve the equations for the ganglion and the
neuroblastoma. The difference wz?{w{? is called the trans-
membrane potential and is denoted as wR in the resting state, and
wA in the AP state. We have defined w{?~0 in our calculations,
Table 1. Values of simulation parameters for both the spinal ganglion neuron and the neuroblastoma cell.
Parameter Symbol Value Value in CGS References
Dielectric constant in region b Eb 2 2 [3,4]
Dielectric constant in region i (i~ext,g,c) Ei 81 81 [4]
Glycocalyx width hg 2.5 nm 2:50|10{7 cm [4,9,16]
Bilayer thickness h 7.5 nm 7:50|10{7 cm [3,4,9,16]
Concentration of monovalent ions in bulk extracellular region g1,{? 0.154 M 9:27|1019 cm{3 [16,17,29,30]
Concentration of monovalent ions on Seg g1,Seg0.154 M 9:27|1019 cm{3 [16,17,29,30]
Concentration of divalent ions in bulk extracellular region g2,{? 0.002 M 1:20|1018 cm{3 [16,17,29,30]
Concentration of divalent ions on Seg g2,Seg0.002 M 1:20|1018 cm{3 [16,17,29,30]
Concentration of monovalent ions in bulk cytoplasmic region g1,z? 0.154 M 9:27|1019 cm{3 [29–31]
Concentration of divalent ions in bulk cytoplasmic region g2,z? 0.0004 M 2:41|1017 cm{3 [29,30]
Potential in {?, the extracellular region w{? 0 mV 0 statV [3,4]
Temperature T 310 K 310 K [4]
Boltzmann’s constant K 1:38|10{23 J/K 1:38|10{16 erg/K [32]
Absolute value of electron charge e 1:60|10{19 C 4:80|10{10 statC [32]
Viscosity of region i ni 0.1 Pa:s 1 P [3]
1CGS is the centimeter-gram-second system of units.doi:10.1371/journal.pone.0096194.t001
Modeling the Electric Potential across Membranes
PLOS ONE | www.plosone.org 7 May 2014 | Volume 9 | Issue 5 | e96194

so that wR~wz? in the resting state, and wA~wz? in the AP
state. We have thus examined the influence of parameters that
represent electrical properties of the membrane, on the resting and
AP states, and analyzed the differences between the healthy spinal
ganglion neuron and the neuroblastoma cell.
We implemented an approximate heuristic for finding roots of
functions, to calculate wSgband wSbc
from Eqs. (65) and (67), which
is specified in the next subsection. As mentioned earlier, the
potential wSegwas calculated with Eq. (70), from data obtained
from electrophoretic experiments.
As we included the density of charges fixed onto proteins within
the membrane regions in the Poisson Eq. (1), we obtained a non-
linear Poisson-Boltzmann Eq. (31), whose analytical solution has
not been found. We therefore calculated values of the potential
profiles with Eqs. (38), (45) and (52) numerically, using the Runge-
Kutta method. The model simulation code is available on GitHub
at https://github.com/pintotm/PLoSOne2014.
Roots of the System of Non-linear Equations. Because
there is no experimental method to directly measure values of the
surface potentials wSgband wSbc
, we use Eqs. (65) and (67) that form
a system of non-linear equations with two variables, wSgband wSbc
,
to determine these values. Some research work [3,4,9,16,17]
indicates that the values of these potentials in real cells are in a
limited region of the wSgb|wSbc
plane. This means that we are
looking for one of the roots of Eqs. (65) and (67), in a known
region.
We can write the system of Eqs. (65) and (67) as
wSgb~G wSbc
� �wSbc
~F wSgb
� �:
ð71Þ
Our simple method for finding the roots of this system consists in
the steps described in Algorithm_Roots. At the resting state,
min~{250 mV and max~{50 mV, while, at the AP state,
min~10 mV and max~100 mV.
Algorithm. Algorithm Roots
Step 0: dwmin= 1024 mV
Step 1: Choose an initial value for wSbc
in min , wSbc, max
Step 2: dw = 20 mV
Step 3: While dw . dwmin
do
begin
wSab= G(wSbc
)
w�Sbc= F(wSab
)
If DwSbc{w2�Sbc
D , dw then
dw = DwSbc{w2�Sbc
DwSbc
= w2�Sbc
else
return to Step 1
end if
end WhileAlgorithm for determining wSgb
and wSbc, for the spinal
ganglion neuron and the neuroblastoma cell. With the
wSbcvalue found with this procedure, we use Eq. (67) to obtain the
corresponding wSgbvalue. The surface potentials wSgb
and wSbcfor
the spinal ganglion neuron and the neuroblastoma cell, whose
values are shown in the following section, were obtained with
Algorithm_Roots.
Results
The hydrophilic heads of the phospholipids that form the
surfaces of the bilayer are negatively charged or polarized, and
attribute a fixed charge density to surfaces Sgb and Sbc. In the
situation of electrostatic equilibrium, which we are analyzing, both
bilayer surfaces, Sgb and Sbc, are surrounded by a ‘‘diffuse electric
layer’’ formed by the motion of free ions in the fluid ionic solution,
under the influence of electric attraction and thermal motion [12–
15].
It is known that the inner surface charge density (jQSbcj) of the
membrane is significantly higher than the outer surface density,
due to the presence of negatively charged heads of phospholipids
on the inner surface (phosphatidylserine), while on the outer
surface the presence of neutral phospholipids dominates [18].
Moreover, the net charges fixed onto cytoplasmic proteins (jrfcj)are considered to be higher than the fixed net charges distributed
in the glycocalyx region [19–21].
With our mathematical model, we first investigate the effect of
QSbcand rfc on the electric potential on the surfaces of the
neuronal membranes of the spinal ganglion and the neuroblasto-
ma. However, there is little information in the literature, regarding
experimentally obtained quantities related to electric charges fixed
within biological membranes. This is mainly due to the difficulties
involved in obtaining the experimental measurements of these
quantities. We therefore examine the behavior of the potentials
wSgband wSbc
for a range of values of the ratios QSbc=QSeg
and
rfc=rfg, given known experimental values of QSegand rfg, i.e. QSbc
and rfc are multiples of QSegand rfg, respectively. We note that
both glycocalyx and cytoplasm and their surfaces are negatively
charged, so that QSegv0, QSbc
v0, rfgv0 and rfcv0.
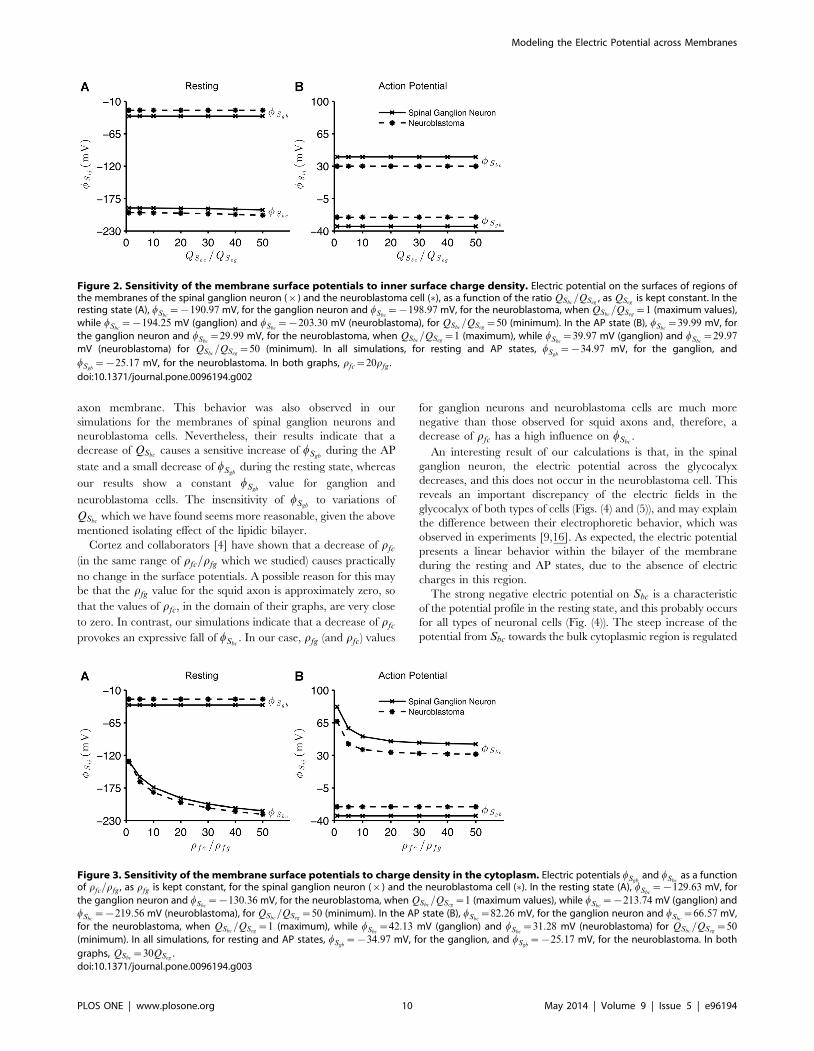
Figure (2) shows the behavior of wSgband wSbc
as we increase the
negative charge on Sbc, i.e. as we decrease QSbc. We notice that for
both the resting and AP states, a decrease of QSbchas almost no
effect on the surface potentials of both neuronal membranes.
These variations in QSbconly determine a small gradual decay of
wSbcduring the resting state of the cells. The resting and AP states
were specified by boundary conditions, i.e. specific parametric
values applied to the model. Values for wSgband wSbc
are different
between these types of cells, due to their specific membrane
properties. We also observe that wSgbremains constant at {34:97
mV and {25:17 mV, respectively for the spinal ganglion and
neuroblastoma cells, when they switch from the resting to AP
states, and vice versa. Moreover, during the AP state, wSbcassumes
values near the transmembrane potentials (Fig. (2B)).
We also examine the electric potential on the surfaces of the
membranes of the healthy and the cancerous cells, in response to
variations in the density of charges fixed onto proteins of the
cytoplasm. Figure (3) presents the resulting wSgband wSbc
as we
increase this density of negative charges in the cytoplasm, i.e. as we
decrease rfc. For both the resting and AP states, wSgbremains
constant when values of rfc vary. However, a decrease in rfc
causes a substantial fall of wSbc, for both types of cells, at resting
and AP states. At the AP state, qSbcpresents a quick drop when
rfc=rfgv20 and tends to an asymptotic value, for decreasing
values of rfc, for both types of cells.
Besides investigating the effect of fixed charges on the potential
on the surfaces of these membranes, we study how the electric
potential profile changes across the membranes of spinal ganglion
neurons and neuroblastoma cells, for the resting and AP states.
Although the values of QSbcand rfc are not known, jQSbc
j and jrfcjare much larger than the corresponding charges in the outer
Modeling the Electric Potential across Membranes
PLOS ONE | www.plosone.org 8 May 2014 | Volume 9 | Issue 5 | e96194

regions. We thus chose fixed values of QSbc~30QSeg
and
rfc~20rfg (which are the same fixed values in Figs. (3) and (2),
respectively) to calculate the potential profile in Fig. (4), for the
resting state and in Fig. (5), during the AP state. For both natural
states of these cells, we verify an accentuated decrease of the
potential along the z axis, from the extracellular region to the
surface of the glycocalyx. This decay is slightly more substantial for
the neuroblastoma than for the spinal ganglion neuron, although
the shapes of both curves are very similar.
In the spinal ganglion neuron, the potential maintains a
substantial drop across the glycocalyx. Interestingly, this phenom-
enon does not occur for the cancerous cells, whose electric
potential remains almost unchanged in this region. We observe
linear variations of the potential across the bilayer of these cells, for
both resting and AP states. During rest, the electric potential
assumes much lower values on Sbc than the asymptotic value in
the bulk cytoplasmic region, while during the AP state, these
values are similar. Before reaching the transmembrane potential
value, the intracellular potential exponentially increases from the
inner surface of the membrane to the bulk cytoplasmic region,
during the resting condition, while during the AP state, we see no
alteration in the electric potential in the cytoplasm, for both cells.
Discussion
There are other membrane phenomena due to electric charge
effects that we have not considered in our model, such as the
electric pump current [22]. We have not included these
phenomena here as they seem to be negligible, in a first
approximation, to the determination of the electric surface
potentials. For example, Jackle [22] states that ‘‘the net electric
pump current is not a relevant parameter in the casual theory of
the resting potential’’.
Experiments have revealed important discrepancies in the
electrical properties of spinal ganglion neurons and neuroblastoma
cells [9,16]. These differences are reflected in the parameter values
we used in our simulations, as shown in Table (2). We notice that
the values for the electrophoretic mobility, and the charge densities
in the glycocalyx and on Seg are much more negative for the
neuroblastoma than for the ganglion. Because neuroblastoma cells
contain a higher amount of negative rfg, QSegand m compared
with ganglion neurons, we indeed expected to obtain lower wSeg
and wSbcvalues for the neuroblastoma in our simulations.
Our simulations also demonstrate that variations in the electric
charges fixed onto the inner surface of the membrane have a small
effect on the electric potential of the surfaces that compose the
neuronal membranes (Fig. (2)). We observe only a gentle gradual
drop in wSbcof the spinal ganglion and the neuroblastoma cells
during the resting state, as charges fixed on Sbc decrease (more
negative values). However, our model shows that decreasing the
density of charges fixed onto proteins of the cytoplasm (increasing
jrfcj and rfc=rfg) results in a substantial decay of wSbc, in both cells
(Fig. (3)).
Nonetheless, variations of intracellular charges fixed on the
membrane and on the cytoplasmic proteins have no effect on the
potential on Sgb (Figs. (2) and (3)). This is related to the fact that
the membrane plays a role in electrically isolating the intracellular
and extracellular regions, due to the absence of charges within the
lipidic bilayer (see Eq. (54)).
The results we obtained for the spinal ganglion neurons and the
neuroblastoma cells are generally similar to those obtained for the
squid axon membrane in [4]. These authors showed that a
decrease of QSbcprovokes a gentle decrease of wSbc
of the squid
Ta
ble
2.
Par
ame
ter
valu
es
spe
cifi
cto
the
spin
alg
ang
lion
ne
uro
n(l
eft
)an
dto
the
ne
uro
bla
sto
ma
cell
(rig
ht)
.
Pa
ram
ete
rS
ym
bo
lS
pin
al
Ga
ng
lio
nN
eu
ron
Ne
uro
bla
sto
ma
Va
lue
Va
lue
inC
GS
Re
fere
nce
Va
lue
Va
lue
inC
GS
Re
fere
nce
Fixe
dch
arg
ed
en
sity
ing
lyco
caly
xr
fg{
0:1
2e=
nm
3{
5:7
6|
10
10
statC=
cm3
[16
]{
0:2
e=n
m3
{9:6
1|
10
10
statC=
cm3
[9]
Ch
arg
ed
en
sity
on
Seg
QS
eg{
0:0
12
e=n
m2
{5:7
6|
10
2st
atC=
cm2
[16
]{
0:0
2e=
nm
2{
9:6
1|
10
2
statC=
cm2
[9]
Ch
arg
ed
en
sity
on
Sgb
QS
gb
{1=
1000
e=A
2{
4:8
0|
10
3st
atC=
cm2
[33
]{
1=
38
5e=
A2
{1:2
5|
10
4
statC=
cm2
[33
]
Ele
ctri
cp
ote
nti
alo
nS
egw
Seg
{19:5
2m
V{
6:5
1|
10
{5
stat
VEq
.(7
0)
{2
5:1
0m
V{
8:3
7|
10
{5
stat
VEq
.(7
0)
Re
stin
gtr
ansm
em
bra
ne
po
ten
tial
wR
{6
9m
V{
2:3
0|
10
{4
stat
V[1
6,3
4]
{6
4m
V{
2:1
3|
10
{4
stat
V[1
0]
Act
ion
tran
sme
mb
ran
ep
ote
nti
alw
A4
0m
V1:3
3|
10
{4
stat
V[3
5]
30
mV
1:0
0|
10
{4
stat
V[3
6]
Ele
ctro
ph
ore
tic
mo
bili
tym
{1:4
0m
m:c
m=
V:s
{4:2
0|
10
{4
cm2=st
atV:s
[9,1
6]
{1:8
0m
m:c
m=
V:s
{5:4
0|
10
{4
cm2=
statV:s
[9]
do
i:10
.13
71
/jo
urn
al.p
on
e.0
09
61
94
.t0
02
Modeling the Electric Potential across Membranes
PLOS ONE | www.plosone.org 9 May 2014 | Volume 9 | Issue 5 | e96194
axon membrane. This behavior was also observed in our
simulations for the membranes of spinal ganglion neurons and
neuroblastoma cells. Nevertheless, their results indicate that a
decrease of QSbccauses a sensitive increase of wSgb
during the AP
state and a small decrease of wSgbduring the resting state, whereas
our results show a constant wSgbvalue for ganglion and
neuroblastoma cells. The insensitivity of wSgbto variations of
QSbcwhich we have found seems more reasonable, given the above
mentioned isolating effect of the lipidic bilayer.
Cortez and collaborators [4] have shown that a decrease of rfc
(in the same range of rfc=rfg which we studied) causes practically
no change in the surface potentials. A possible reason for this may
be that the rfg value for the squid axon is approximately zero, so
that the values of rfc, in the domain of their graphs, are very close
to zero. In contrast, our simulations indicate that a decrease of rfc
provokes an expressive fall of wSbc. In our case, rfg (and rfc) values
for ganglion neurons and neuroblastoma cells are much more
negative than those observed for squid axons and, therefore, a
decrease of rfc has a high influence on wSbc.
An interesting result of our calculations is that, in the spinal
ganglion neuron, the electric potential across the glycocalyx
decreases, and this does not occur in the neuroblastoma cell. This
reveals an important discrepancy of the electric fields in the
glycocalyx of both types of cells (Figs. (4) and (5)), and may explain
the difference between their electrophoretic behavior, which was
observed in experiments [9,16]. As expected, the electric potential
presents a linear behavior within the bilayer of the membrane
during the resting and AP states, due to the absence of electric
charges in this region.
The strong negative electric potential on Sbc is a characteristic
of the potential profile in the resting state, and this probably occurs
for all types of neuronal cells (Fig. (4)). The steep increase of the
potential from Sbc towards the bulk cytoplasmic region is regulated
Figure 2. Sensitivity of the membrane surface potentials to inner surface charge density. Electric potential on the surfaces of regions ofthe membranes of the spinal ganglion neuron (|) and the neuroblastoma cell (�), as a function of the ratio QSbc
=QSeg, as QSeg
is kept constant. In theresting state (A), wSbc
~{190:97 mV, for the ganglion neuron and wSbc~{198:97 mV, for the neuroblastoma, when QSbc
=QSeg~1 (maximum values),
while wSbc~{194:25 mV (ganglion) and wSbc
~{203:30 mV (neuroblastoma), for QSbc=QSeg
~50 (minimum). In the AP state (B), wSbc~39:99 mV, for
the ganglion neuron and wSbc~29:99 mV, for the neuroblastoma, when QSbc
=QSeg~1 (maximum), while wSbc
~39:97 mV (ganglion) and wSbc~29:97
mV (neuroblastoma) for QSbc=QSeg
~50 (minimum). In all simulations, for resting and AP states, wSgb~{34:97 mV, for the ganglion, and
wSgb~{25:17 mV, for the neuroblastoma. In both graphs, rfc~20rfg .
doi:10.1371/journal.pone.0096194.g002
Figure 3. Sensitivity of the membrane surface potentials to charge density in the cytoplasm. Electric potentials wSgband wSbc
as a functionof rfc=rfg , as rfg is kept constant, for the spinal ganglion neuron (|) and the neuroblastoma cell (�). In the resting state (A), wSbc
~{129:63 mV, for
the ganglion neuron and wSbc~{130:36 mV, for the neuroblastoma, when QSbc
=QSeg~1 (maximum values), while wSbc
~{213:74 mV (ganglion) andwSbc
~{219:56 mV (neuroblastoma), for QSbc=QSeg
~50 (minimum). In the AP state (B), wSbc~82:26 mV, for the ganglion neuron and wSbc
~66:57 mV,for the neuroblastoma, when QSbc
=QSeg~1 (maximum), while wSbc
~42:13 mV (ganglion) and wSbc~31:28 mV (neuroblastoma) for QSbc
=QSeg~50
(minimum). In all simulations, for resting and AP states, wSgb~{34:97 mV, for the ganglion, and wSgb
~{25:17 mV, for the neuroblastoma. In both
graphs, QSbc~30QSeg
.doi:10.1371/journal.pone.0096194.g003
Modeling the Electric Potential across Membranes
PLOS ONE | www.plosone.org 10 May 2014 | Volume 9 | Issue 5 | e96194

by the negative charges spatially distributed in the cytoplasm.
Even though the net value of charges of proteins is predominantly
negative in the cytoplasm, our simulations indicate that the
contribution of these charges to the intracellular potential profile is
much smaller than the effect of charges fixed on Sbc. This is shown
by the curvature of the potential in the cytoplasmic region.
The neuroblastoma cells, like all cancerous cells, multiply
quickly. Alterations of the dynamics of cellular multiplication
mediate changes in the synthesis, structure and degradation of the
membrane components [11], which result in deformations on the
structure and composition of the surfaces of membranes [23].
These deformations provoke changes in the composition of electric
charges on the membrane. Our results indicate that the alteration
of these charges and of those within the cells may influence the
behavior of the potential on the inner surface of the neuroblastoma
cells.
Experimental observations have suggested that the resting state
and the generation of action potentials in human neuroblastoma
cells depend on the degree of the morphological differentiation of
the cell. Some of these cells are relatively non-excitable [24,25].
Kuramoto et al. [26] stimulated the growth of SK-N-SH human
neuroblastoma cells under standard culture conditions. These
cancerous cells remained morphologically undifferentiated, par-
tially responded to injections of pulses of electric current, and
presented deficiency of the depolarizing component of the
mechanism that generates the action potential. We included these
findings in our simulations, and Fig. (5) is consistent with the fact
that the depolarization of the electric potential in the neuroblas-
toma, during generation of the action potential, is less intense than
in the healthy spinal ganglion neuron. The neuroblastoma should
thus generate a lower firing rate in response to its input excitation,
and this may affect the transmission of signals through networks of
these neurons and their functions of storage and communication of
information.
Mironov and Dolgaya [17] have suggested that the outer
electric charges for the neuroblastoma cells and erythrocytes are
similar, but the spinal ganglion neurons strongly differ from these
cells. Therefore, the molecular structure (and the resulting
constitution of charges) on the outer surface of the membrane of
the neuroblastoma cells would be similar to the erythrocytes, and
may be constituted by ^ 40% of peripheral proteins and ^ 60%
of gangliosides. Our results illustrate that the drop of the potential
across the glycocalyx for the neuroblastoma cell is much smaller
than for the spinal ganglion neuron, during both resting and AP
states. This corroborates previous studies which show a smaller
decay of the potential for the erythrocyte in the glycocalyx than for
the neuron [2,4,5]. The different behavior of the potential across
the glycocalyx, for the neuroblastoma and the spinal ganglion
neuron, should indicate important differences among these cells, of
the properties that enable the transmission of electric signals
through the membrane. This occurs due to the fact that different
molecular structures of these membranes interact differently with
(i) the outer electric field, which is responsible for the orientation of
the charged particles that are closer to the membrane, and (ii) the
potential on the outer surface of the membrane. The nature of
these interactions are crucial for many cell processes, such as the
beginning of the process of triggering of the action potential, which
depends on the opening of specific Naz channels.
Our results may also contribute to understanding the resistance
of the neuroblastoma to certain chemotherapeutic treatments
[27,28]. The smaller change of the potential, in response to
changes in properties of cellular cultures (pH values, for instance)
and to the amount of fixed charges present in the membrane due
to alterations in its composition and structure, may be an electric
property responsible for the low pharmacological response.
Author Contributions
Conceived and designed the experiments: TMP RSW CMC. Performed
the experiments: TMP. Analyzed the data: TMP RSW CMC. Contributed
reagents/materials/analysis tools: TMP RSW CMC. Wrote the paper:
TMP RSW CMC.
Figure 4. Electric potential across the membranes of spinalganglion neurons and neuroblastoma cells, during restingstate. Solutions of Eq. (52) with boundary wSeg
, and Eq. (45) withboundary wz? = wR result respectively in wSgb
~{34:97 mV and
wSbc~{192:22 mV, for the spinal ganglion neuron (solid), and for the
neuroblastoma cell (dashed) in wSgb~{25:17 mV and wSbc
~{200:66 mV.
For all simulations, QSbc~30QSeg
and rfc~20rfg .
doi:10.1371/journal.pone.0096194.g004
Figure 5. Electric potential across the membranes of spinalganglion neurons and neuroblastoma cells, during AP state.Solutions of Eq. (52) with boundary wSeg
, and Eq. (45) with boundarywz? = wA result respectively in wSgb
~{34:97 mV and wSbc~39:99 mV,
for the spinal ganglion neuron (solid), and for the neuroblastoma cell(dashed) in wSgb
~{25:17 mV and wSbc~29:99 mV. For all simulations,
QSbc~30QSeg
and rfc~20rfg .
doi:10.1371/journal.pone.0096194.g005
Modeling the Electric Potential across Membranes
PLOS ONE | www.plosone.org 11 May 2014 | Volume 9 | Issue 5 | e96194
References
1. Iglic A, Brumen M, Svetina S (1997) Determination of the inner surface
potential of erythrocyte membrane. Bioelectroch Bioener 43: 97–107.2. Heinrich R, Gaestel M, Glaser R (1982) The electric potential profile across the
erythrocyte membrane. J Theor Biol 96: 211–231.3. Cortez C, Bisch P (1993) The effect of ionic strength and outer surface charge on
the membrane electric potential profile: a simple model for the erythrocyte
membrane. Bioelectroch Bioener 32: 305–315.4. Cortez C, Cruz F, Silva D, Costa L (2008) Inuence of fixed electric charges on
potential profile across the squid axon membrane. Physica B 403: 644–652.5. Cruz F, Vilhena F, Cortez C (2000) Solution of non-linear Poisson-Boltzmann
equation for erythrocyte membrane. Braz J Phys 30: 403–409.
6. Bolintineanu D, Sayyed-Ahmad A, Davis H, Kaznessis Y (2009) Poisson-Nernst-Planck models of nonequilibrium ion electrodiffusion through a protegrin
transmembrane pore. PLoS Comput Biol 5: e1000277.7. Zheng Q, Wei G (2011) Poisson-Boltzmann-Nernst-Planck model. J Chem Phys
134: 194101.8. Belan P, Dolgaya E, Mironov S, Tepikin A (1987) Relation between the surface
potential of mouse neuroblastoma clone c1300 cells and the phase of the cell
cycle. Neirofiziologiya 19: 130–133.9. Dolgaya E, Mironov S, Pogorelaya N (1985) Changes in surface charge of mouse
neuroblastoma cells during growth and morphological differentiation of the cellpopulation. Neirofiziologiya 17: 168–174.
10. Hernandez M, Kisaalita W, Farmer M (1996) Assessment of murine
neuroblastoma (N1E-115) resting membrane potential by confocal microscopy.J Fluoresc 6: 77–82.
11. Dehlinger P, Schimke R (1971) Size distribution of membrane proteins of ratliver and their relative rates of degradation. J Biol Chem 246: 2574–2583.
12. Gouy G (1910) Sur la constitution de la charge electrique a la surface d’unelectrolyte. Journal de Physique Theorique et Appliquee 9: 457–467.
13. Chapman D (1913) A contribution to the theory of electrocapillarity. Philos Mag
25: 475–481.14. Debye P, Huckel E (1923) The theory of electrolytes. I. Lowering of freezing
point and related phenomena. Physikalische Zeitschrift 24: 185–206.15. Verwey E, Overbeek J (1948) Theory of the stability of lyophobic colloids.
Amsterdam: Elsevier.
16. Dolgaya E, Mironov S (1984) Investigation of surface properties of rat spinalganglion neuron by microelectrophoresis. Neirofiziologiya 16: 176–182.
17. Mironov S, Dolgaya E (1985) Surface charge of mammalian neurones asrevealed by microelectrophoresis. J Membrane Biol 86: 197–202.
18. Raval P, Allan D (1984) Sickling of sickle erythrocytes does not alterphospholipid asymmetry. Biochem J 223: 555–557.
19. Cook G, Heard D, Seaman G (1960) A sialomucopeptide liberated by trypsin
from the human erythrocyte. Nature 188: 1011–1012.
20. Cook G (1968) Glycoproteins in membranes. Biol Rev Camb Philos Soc 43:
363–391.
21. Engelhardt H, Gaub H, Sackmann E (1984) Viscoelastic properties of
erythrocyte membranes in high-frequency electric fields. Nature 307: 378–380.
22. Jackle J (2007) The causal theory of the resting potential of cells. J Theor Biol
249: 445–463.
23. Schubert D, Humphreys S, de Vitry F, Jacob F (1971) Induced differentiation of
a neuroblastoma. Dev Biol 25: 514–546.
24. Gerard V, Rouzaire-Dubois B, Dilda P, Dubois J (1998) Alterations of ionic
membrane permeabilities in multidrug-resistant neuroblastoma x glioma hybrid
cells. J Exp Biol 201: 21–31.
25. Kuramoto T, Werrbach-Perez K, Perez-Polo J, Haber B (1981) Membrane
properties of a human neuroblastoma II: Effects of differentiation. J Neurosci
Res 6: 441–449.
26. Kuramoto T, Perez-Polo J, Haber B (1977) Membrane properties of a human
neuroblastoma. Neurosci Lett 4: 151–159.
27. Lindskog M, Spenger C, Jarvet J, Graslund A, Kogner P (2004) Predicting
resistance or response to chemotherapy by proton magnetic resonance
spectroscopy in neuroblastoma. J Natl Cancer Inst 96: 1457–1466.
28. Michaelis M, Cinatl J, Vogel J, Pouckova P, Driever P, et al. (2001) Treatment of
drug-resistant human neuroblastoma cells with cyclodextrin inclusion complexes
of aphidicolin. Anticancer Drugs 12: 467–473.
29. Clay J, Shrier A (2001) Action potentials occur spontaneously in squid giant
axons with moderately alkaline intracellular pH. Biol Bull 201: 186.
30. Inoue H (2002) Transport of 125I and 36Cl across an anion-exchange paper
membrane. Appl Radiat Isot 56: 659–665.
31. Rosenheck K (1998) Evaluation of the electrostatic field strength at the site of
exocytosis in adrenal chromaffin cells. Biophys J 75: 1237.
32. Walker J, Halliday D, Resnick R (2011) Fundamentals of Physics. NJ: Wiley:
Hoboken, sixth edition.
33. Becchetti A, Arcangeli A, Del Bene M, Olivotto M, Wanke E (1992) Intra and
extracellular surface charges near Ca2+ channels in neurons and neuroblastoma
cells. Biophys J 63: 954–965.
34. Rosenthal J, Bezanilla F (2002) A comparison of propagated action potentials
from tropical and temperate squid axons: different durations and conduction
velocities correlate with ionic conductance levels. J Exp Biol 205: 1819–1830.
35. Guyton A, Hall J (1997) Human physiology and mechanisms of disease.
Philadelphia: W.B. Saunders Co., sixth edition.
36. Tosetti P, Taglietti V, Toselli M (1999) Action-potential-like depolarizations
relieve opioid inhibition of N-type Ca2+ channels in NG108-15 cells. Pug Arch
Eur J Phy 437: 441–448.
Modeling the Electric Potential across Membranes
PLOS ONE | www.plosone.org 12 May 2014 | Volume 9 | Issue 5 | e96194
Related Documents