1 Modeling the Aquaculture Carrying Capacity Of Lake Toba, North Sumatra, Indonesia By Josh Oakley A MAJOR PAPER SUBMITTED IN PARTIAL FULLFILLMENT OF THE REQUIREMENTS FOR THE DEGREE OF MASTER OF ENVIRONMENTAL SCIENCE AND MANAGEMENT UNIVERSITY OF RHODE ISLAND MESM TRACK: Wetlands, Watersheds, and Ecosystem Science MESM MAJOR PAPER ADVISOR: Dr. Arthur J. Gold PROJECT ADVISOR: Dr. David Bengtson Funded by the Global Innovation Initiative

Welcome message from author
This document is posted to help you gain knowledge. Please leave a comment to let me know what you think about it! Share it to your friends and learn new things together.
Transcript

1
Modeling the Aquaculture Carrying Capacity Of Lake Toba,
North Sumatra, Indonesia By
Josh Oakley
A MAJOR PAPER SUBMITTED IN PARTIAL FULLFILLMENT OF THE REQUIREMENTS FOR THE DEGREE OF MASTER OF ENVIRONMENTAL
SCIENCE AND MANAGEMENT
UNIVERSITY OF RHODE ISLAND MESM TRACK: Wetlands, Watersheds, and Ecosystem Science
MESM MAJOR PAPER ADVISOR: Dr. Arthur J. Gold
PROJECT ADVISOR: Dr. David Bengtson Funded by the Global Innovation Initiative

2
Table of Contents:
List of Figures and Tables…………………………………………………………………………………….3
Introduction………………………………………………………………………………………………………..4
Purpose………………………………………………………………………………………………………………5
Estimating Carrying Capacity……………………………………………………………………………….6
Background: Setting, Aquaculture Practices and Water Quality of Lake Toba…………8
Estimating Carrying Capacity of Lake Toba: Approach………………………………………...14
Methods…………………………………………………………………………………………………………....20
Results……………………………………………………………………………………………………..............22
Discussion…………………………………………………………………………………………………….......33
References………………………………………………………………………………………………………...34

3
Figure 1. Map of Lake Toba basin…………………………………………………………………………………..…9
Figure 2. Aquaculture cage locations in Lake Toba………………………………………………..…………10
Figure 3. Haranggaol Bay and delineated sub-‐drainage basin
using Google Earth Pro………………………………………………………………………………......…..11
Figure 4. Administrative boundaries of Lake Toba basin……………………………………………....…14
Table 1. Example of Beveridge Model used in this study.…………………………………………………16
Figure 5. Lake Champlain map and zonation example………………………………………...……….......19
Figure 6. Land cover classification for Lake Toba basin……………………………………………………23
Figure 7. Charts of total permissible production results from altered
model inputs for whole lake approach resulting in Oligotrophic
waters (Total-‐P at 10ppb). …………………………………………………………………………………24
Table 2. Watershed-‐P input calculations for Whole Lake Model and Zoned Model…………….26
Figure 8. Charts of total permissible production results from altered
model inputs for whole lake approach resulting in Mesotrophic
waters (Total P at 15ppb). …………………………………………………………………………………27
Table 3. Range of total aquaculture permissible production (metric tons/yr)
for average key input values and various desired trophic states using
the Beveridge whole lake model. ……………………………………………………………………..…28
Table 4. Range of total aquaculture permissible production (metric tons/yr)
for optimal key input values and various desired trophic states using
the Beveridge whole lake model. ……………………………………………………………………..…28
Figure 9. Charts of total permissible production results from altered model
inputs for the zoned Harranggaol Bay approach resulting in
Oligotrophic waters (Total-‐P at 10ppb). ………………………………………………………..……30
Figure 10. Charts of total permissible production results from altered model
inputs for the zoned Harranggaol Bay approach resulting in
Mesotrophic waters (Total-‐P at 15ppb). ………………………………………………….…….31
Table 5. Range of total aquaculture permissible production (metric tons/yr)
for average key input values and various desired trophic states using
the Beveridge model for a zoned approach to Haranggaol bay. …………………………32
Table 6. Range of total aquaculture permissible production (metric tons/yr)
for average key input values and various desired trophic states using
the Beveridge model for a zoned approach to Haranggaol bay. …………………………32

4
Introduction:
Aquaculture is the fastest-‐growing food production sector in the world (FAO,
2012). Many developing countries, especially in Southeast Asia, are increasingly
reliant on this practice in order to meet the economic and dietary needs of a
growing population. Since aquaculture is heavily reliant on water resources, it often
competes with other water-‐dependent industries. This can lead to negative impacts
on industries such as capture fisheries, agriculture, and tourism. Additionally, the
use of environmental resources required for aquaculture can have cascading social
and economic implications. For these reasons, it is imperative that the carrying
capacities of the water bodies used are considered in order to ensure the
sustainability of aquaculture-‐based food production (Ross et al, 2013).
Although carrying capacity is often solely considered in terms of aquaculture
production, it has been further developed into categories in order to aid the
ecosystem approach to aquaculture introduced by the Food and Agriculture
Organization of the United Nations (FAO) in 2006. This approach aims to integrate
aquaculture within the natural ecosystem in order to promote the sustainable
development and resilience of social-‐ecological systems (FAO, 2010). The categories
of concern include the physical, production, social, and ecological based carrying
capacities (McKindsey et al, 2006). The issue of aquaculture carrying capacity is
presently a main concern throughout the Republic of Indonesia, where freshwater
aquaculture has experienced exponential growth throughout recent years (Abery et
al, 2005).
Lake Toba, with a surface area of 1,103 km2, and a maximum depth greater
than 500 m, is the largest lake in Indonesia, and the largest volcanic-‐crater lake in
the world (Chesner, 2011). It is located in the province of North Sumatra, 176 km
west of the capital city of Medan. With blue waters surrounded by mountainous
peaks over 2,000 meters above sea level, the lakes natural beauty is internationally
recognized. Home to the fascinating Batak culture, Lake Toba is one of Indonesia’s
popular tourist destinations, drawing frequent visitors from within the country as
well as global travelers. In addition to lake-‐based tourism, the natural resources of
the lake and its drainage basin sustain local livelihood by supporting rich
5
agricultural lands, industrial uses, and floating cage aquaculture operations
(Moedjodo et al, 2003). Despite it’s incredible size, the lakes water quality is
threatened by a number of activities throughout the drainage basin. Nutrient
loading and eutrophication are the main threats to the water body, and therefore
local livelihood. Since caged-‐fish production can contribute substantial amounts of
nutrients (Beveridge, 2008), there is a pressing need to determine the ecological
carrying capacity for aquaculture production in Lake Toba.
In June of 2014, three separate studies on aquaculture carrying capacity for
Lake Toba were presented at the Indonesian Institute of Sciences (LIPI) research
center in West Java. These studies were conducted separately by the LIPI Research
Center for Limnology, the Environmental Protection Agency of North Sumatra
Province (EPANS), and the Indonesian Center for Fisheries Management (CFM).
Each of these studies used similar modeling techniques focusing on the amount of
phosphorous entering the lake from cage operations. However, the input values to
the model and results from these studies varied, providing different acceptable
production levels for Lake Toba and thus confounding management decisions.
Purpose:
This report will generate a set of carrying capacity estimates for both the
entire lake, and a specific zone within the lake, based on a range of key input values
that have been found to vary in previous studies. More holistic estimates will also be
created by factoring in a range of potential watershed nutrient inputs from sources
such as domestic wastewater and agricultural runoff in addition to aquaculture.
Finally, this report will explore alternative approaches to estimating carrying
capacity using a zoned approach. Estimates for the carrying capacity of one specific
zone, Haranggaol Bay, will be produced in order to illustrate a “hot spot” approach
to water quality management.
In-‐depth analyses are performed on selected prior studies that have
estimated the aquaculture carrying capacity of Lake Toba. A literature review of
past approaches to similar environmental problems has been conducted to foster
recommendations for further studies. Special attention has been given to
approaches that recognize zonation within large lakes to reflect conditions that

6
might generate localized eutrophication. The intent of this report is to add value to
the body of work that has been developed, and to attain a more comprehensive
understanding of such a complex issue. When considering the critical role this lake
and catchment play in the livelihoods of local people, efforts to protect the natural
resources and associated industries must be thoroughly studied. The goal of this
study is to provide guidance on approaches that can foster sustainable aquaculture
production, while protecting the environment and continuing to attract tourism.
Estimating Carrying Capacity
To meet the growing demand for fish, in addition to business and
employment opportunities, freshwater aquaculture has expanded throughout
Indonesia over the last three decades. Due to this rapid expansion, some water
bodies have already exceeded their abilities to assimilate the wastes from
aquaculture production and sustain water quality. Wastes include benthic
deposition of uneaten feed and feces; these excess nutrients can accelerate the
process of eutrophication (Beveridge, 2008) deteriorating the water quality and
therefore the ability to produce fish.
The FAO Fisheries and Aquaculture Department introduced the Ecosystem
Approach to Aquaculture (EAA) as a strategy guided by three key principles (FAO,
2010):
• Aquaculture development and management should take account of the full range
of ecosystem functions and services, and should not threaten the sustained
delivery of these to society.
• Aquaculture should improve human well-‐being and equity for all relevant
stakeholders.
• Aquaculture should be developed in the context of other sectors, policies and
goals.
Carrying capacity is an integral part of the EAA, by helping determine the
upper limits of aquaculture production based on environmental limitations and
social acceptability. The main purpose is to determine the level of resource use that
can be sustained by the natural environment over the long term, while avoiding

7
“unacceptable change” to the functions of the ecosystem and social structures.
Assessment of carrying capacity is one of the most important tools for implementing
an EAA, and can be applied across a multitude of scales (Ross et al, 2013).
McKindsy et al. (2006) and Ross et al (2013) identified four separate types of
aquaculture carrying capacities. Physical capacity is the maximum amount of cages
that can physically fit in an area. Production refers to the maximum amount that
does not have unacceptable impacts on the farm(s). Social capacity refers to the
maximum amount of production that does not inhibit social uses of the water body.
Similarly, ecological capacity seeks the magnitude of production that can be
supported without unacceptable impacts on ecosystem functions. For example, fish
cage culture requires ecosystem services for the degradation of organic matter and
nutrients, which in turn affects the oxygen content necessary for fish development.
However, beyond a certain level of fish production, the natural system may no
longer be able to process the nutrients and provide the necessary oxygen.
Lake Toba’s current issue with aquaculture development is mainly
concerned with social and ecological carrying capacity. Due to the size of the water
body, and naturally limiting factors such as wind and wave exposure, physical and
production capacities are less of a concern. The social and ecological carrying
capacities are closely tied together due their interdependent relationship. Social
uses of the water body are directly affected by ecosystem functions, and these in
turn support a variety of stakeholders.
Lake Toba supports a range of interests including small local aquaculture
operations for both sale and consumption, large export oriented operations and all
of the associated employees, wild capture fisheries, tourism, agriculture, industrial
uses such as hydropower and pulp production, as well as cultural significance and
local residential use (Moedjodo et al, 2003). With such a diverse range of interests
being dependent on this water body, it is critical to determine and implement an
ecological, and therefore social, aquaculture carrying capacity.

8
Background: Setting, Aquaculture Practices and Water Quality of Lake Toba
The formation of Lake Toba is the result of globally significant volcanic
activity beginning about 70 million years ago (Chesner, 2012). Because of this the
lake is surrounded by precipitous cliffs reaching up to 1,200 m above the water. The
surface of the lake sits at 904 meters above sea level, while the waters have a
maximum depth of 505 meters (Moedjodo et al, 2003), placing it among the deepest
lakes in the world. The lake is oriented in a northwest to southeast direction, and is
87 km long and 27 km wide. The catchment area of Lake Toba covers 3,658 km2,
while the lakes surface makes up 1,103 km2 of that area, therefore 2,555 km2 of
surrounding land drains into the water body through 202 brooks and rivers
(Saragih and Sunito, 2001). This provides a drainage-‐area to lake-‐area ratio of
approximately 2:1. The lake has a single outlet in the southeast portion of the lake,
the Asahan River, which flows east to the Strait of Malacca. Due to the steep
surrounding topography, and the limited drainage of the catchment, the lake has a
retention time upwards of 81years (Moedjodo et al, 2003). Some argue that the
development of a hydroelectric dam at the mouth of the Asahan River has further
increased this rate (Lehmusluoto, 2000). This slow flushing rate is cause for concern
in regards to nutrient loading within the lake, because prolonged retention times
limit the flushing of nutrients from the lake ecosystem.

9
Figure 1. Map of Lake Toba basin
In the center of the lake lies one of the main tourist destinations, the large
peninsula with a thin attachment called Samosir Island. This island is approximately
the size of Singapore. Here, a number of ethnic Batak groups subsist primarily on
farming and fishing, while many tourist accommodations are situated on the eastern
peninsula of Tuk-‐Tuk among other small coastal towns. Much of this island has been
cleared for farmland, while small aquaculture operations take place along the
shores.
The tropical, yet cool, environment of this mountainous region combines
with fertile volcanic soils to yield highly productive agriculture. Rice paddy fields
are very common throughout the drainage basin, as well as fields of corn, onions,
chilies, and mangos. Cash crops are commonly grown on higher grounds throughout
the watershed. Coconuts, cloves, cinnamon, coffee, and cocoa are the primary source
of income for many families. The raising of livestock is also common throughout the
Aek Asahan
Sengai Renun
500
1000
1500
100
2000
500
1500
100
1500
1500
1500
1500
1500
100
2000
1500
1500
1000
2000
1000
1500
1000
1500
1500
1500
100
1000
1500
500
2000
1000
500
1000
1000
1500
1500
1500
1000
1000
500
1500
1500
1500
1500
1500
1000
Key
Drainage Basin
Rivers and Streams
Contours 100 M
1:500,000
±0 10 20 305
Kilometers
1 cm = 5 km
Lake Toba, Northern Sumatra, Indonesia
Author: Josh Oakley, URI MESM Prog. Date: 06/2014 Source: ESRI, ArcGIS Online, USGS
Catchment Area
(surrounding lake) = 3,658 SqKm
Lake Area = 1,103 SqKm
Drainage Basin, Elevation, Roads, & Rivers

10
basin, however it is not as extensive and is often done by families as an ancillary
part of their income (Moedjodo et al, 2003).
Floating cage aquaculture (‘karamba’ in the local language) in Lake Toba is
practiced both by local farmers and two main private enterprises, PT Aquafarm
Nusantara, and PT Suri Tani Pemuka that were set up by external investment
companies. Local farmers produce fish mainly for domestic markets or
consumption, while the external investment companies export most of their
produce. Due to the lakes huge size and expansive wind fetches, farm operations are
naturally limited to lake areas that are protected from high wind and wave exposure
to avoid conditions that can destroy cages. Additionally, the majority of local farms
are located close to shore for monitoring and security purposes (Figure 2).
Figure 2. Aquaculture cage locations in Lake Toba

11
Haranggaol Bay is a large cove located in the northeastern portion of Lake
Toba. This bay contains the largest concentration of aquaculture cages throughout
the lake, all of which are operated by local farmers. The waters in this bay have a
surface area of approximately 3 km2, based on the terminus of surrounding
headlands. The bay has a maximum depth upwards of 200 m. While an average
depth has not been officially calculated, this study uses an average depth of 150 m
based on visual observations of bathymetric maps (Chesner, 2012). The
surrounding mountains provide a sub-‐drainage basin for this bay with an area of
approximately 19 km2 based on measurements made with Google Earth Pro (Figure
3).
Figure 3. Haranggaol Bay and delineated sub-‐drainage basin using Google Earth Pro
Aquaculture in Lake Toba began with carp production three decades ago
with the help of URI researcher Richard Pollnac (Pollnac and Sihombing, 1996).
Today the predominant species produced is Oreochromis niloticus (Nile tilapia).
While carp, catfish, and a few other species are also produced in the lake, tilapia
represents the largest proportion of production, and the main source of profit

12
throughout the lake. Therefore, the carrying capacity calculations in this study were
based on figures for Nile tilapia.
Production units are referred to as cages, which vary in size and construction
throughout the lake. Typically, cages will have a rectangular shape and will be made
with metal frames. Wood and bamboo are also used for construction, however these
require more frequent replacement, whereas a metal frame can last as long as 10
years. Units are often joined in groups of two or four in order to better endure wind
and wave damage.
Feed types and practices also vary throughout the lake. Typically a sinking
pellet feed is used, which is often less expensive than a floating pellet feed. Each feed
type has a varying amount of phosphorus, an essential nutrient for fish
development, but also a contributor to lake eutrophication. Feeding regimes are for
the most part unregulated and spontaneous, with workers dropping handfuls of
feed into each cage unit throughout the day. In cases where the efficiency of feed
types and practices are considered, a food conversion ratio (FCR) is developed. This
is the amount of feed it takes to produce one ton of harvested fish. Ideally, farmers
would want the lowest possible FCR of approximately 1:1. However, due to varying
practices throughout the lake, a broad range of FCR’s have been found to exist. This
study will use the average FCR’s, and phosphorous contents of feed, found through
farmer surveys.
While little data are available on current aquaculture production rates,
recent estimates have been made from lake surveys conducted by Dimitar Taskov
and Irina Timonina of the University of Stirling. This work is yet to be published,
however, previously published data from Anon (2014), Unger (2014), and
Indonesian statistics (BPS, 2013) were considered in addition to their calculations.
Their estimate of total production for aquaculture in Lake Toba is 76,284 metric
tons/yr. Production from Haranggaol Bay alone is approximately 27,000 tons/yr,
representing more than 1/3rd of the entire lake production.
Several authors have described the deteriorating ecological state of Lake
Toba over the last few decades (Saragih and Sunito, 2001; Lehmusluoto, 2000;
Lukman, 2014, Anon, 2014). Decreasing water quality, as evidenced by declining

13
Secchi-‐depth readings, and an increase in the abundance of water hyacinth
throughout the lake indicate an excess of nutrients. Some tourists even complain of
itchy skin after swimming. Questions surround the role of aquaculture wastes as the
driver of eutrophication (Anon, 2014). This linkage has been documented in smaller
lacustrine (i.e., lake) systems due to the excessive phosphorous (P) added to the
water through sinking-‐pellet fish feed and feces (Pollnac and Sihombing, 1992). The
increased phosphorus inputs accelerate algae growth, and subsequent death due to
the short life span, which can lead to rapidly deteriorating water quality and large
fish mortality rates from the consumption of dissolved oxygen due to the
decomposition and decay of algae in the water.
A number of land use practices throughout the drainage basin also threaten
the water quality of Lake Toba through excessive nutrient contributions. Many of
the farmers use fertilizers and pesticides on their crops, some of which make their
way into the lake. Nutrient-‐rich wastes from livestock also enter the lake through
overland runoff. One of the more significant concerns throughout the watershed is
the lack of wastewater management (Lehmusluoto, 2000). Many of the small
villages discharge domestic sewage directly into streams and rivers that feed into
the lake (Saragih and Sunito, 2001), while some use outdated cesspools and storage
tanks that may also leach into the lake via groundwater.
The management of these issues is complicated by the political dynamics of
such a large lacustrine system. The watershed embraces seven different
governmental districts (“Kabupatens”), each having a number of sub-‐districts
(“kecamatans”). Each of these administrations (Figure 4) governs varying portions
of the watershed. Kabupaten Toba Samosir, with its twelve Kecamatans, is
responsible for the largest portion of the watershed, approximately 64% (Moedjodo,
2003). With varying populations, land use types, and levels of aquaculture
throughout the lake, the management of environmental issues is further
complicated by the multitude of administrations. Addressing such issues will
require strategic planning, clear communication, and the delegation of appropriate
levels of responsibility for each Kabupaten.

14
Figure 4. Administrative boundaries of Lake Toba basin
Estimating Carrying Capacity of Lake Toba:
Approach:
A number of modeling approaches are used to address the ecological
carrying capacity of aquaculture. In situations without extensive water quality data
estimates geared towards local needs can be determined through systems modeling
of inputs and fates of major limiting nutrients. Being a freshwater lake, phosphorous
(P) is assumed to be the limiting nutrient of concern. A mass balance approach can
be used to estimate total aquacultural wastes lost to the lake environment Using
data on P-‐content of feeds, food conversion ratios (FCR), and carcass P-‐content, it is
possible to estimate the total-‐P loadings to the lake per metric ton of caged fish
production (Beveridge, 2008). The number of acceptable cages can then be
calculated based on desired water quality standards (expressed as a specific in-‐lake
concentration of P), or the desired trophic status, which can vary based on local
goals. With the goal of sustaining tourism in the region, the desired trophic state
standard for Lake Toba is set as oligotrophic. Oligotrophic waters have high clarity,

15
infrequent or a comlete absence of algal blooms and sustain well oxygenated
conditions throughout much of the lake environment.
The rationale behind this mass balance model approach is based on the
assumptions that algal densities are negatively correlated with water quality,
particularly dissolved oxygen (DO) levels, and therefore the growth and survival of
fish. P is assumed to be the limiting nutrient that controls phytoplankton (i.e., algae
within the water column) abundance in freshwater environments (Beveridge,
2008). A challenge with aquaculture is that P is an essential element required for
fish growth and bone development, which is typically derived from dietary sources.
Despite P requirements being species-‐specific, most diets for fish culture contain a
surplus that can enter the lake and potentially change water quality.
The Beveridge model for intensive cage aquaculture used in this study, and
the prior Lake Toba carrying capacity studies (LIPI, EPANS, CFM, 2014), ultimately
stem from one of the most widely used empirical models developed to predict the
response of aquatic ecosystems to increases in P loadings, that of Dillon & Rigler
(1974). This is a modification of Vollenweider’s original model (Vollenweider,
1968), which states that the total-‐P concentration in a water body is determined by
the P loading, the lakes area and mean depth, the flushing rate, and the fraction of P
lost to the sediment.
The key inputs required for this model to be used for aquaculture include the
food conversion ratio (FCR), and the total-‐P percentage of the feed used. The
product of these provides the amount of total-‐P required to produce one metric ton
of fish. From this value, the percentage of P retained by the fish (species-‐specific) is
subtracted to provide the amount of total-‐P lost to the environment per ton of fish
produced. Next, the permissible change in total-‐P concentration for the entire water
body is determined by subtracting the lake’s initial P concentration from the desired
concentration after aquaculture production. This figure is based on Carlson’s trophic
index, where less than 10 parts per billion (ppb or mg m3) is considered the upper
limit to sustain oligotrophic conditions. The permissible loading from fish is then
determined by multiplying the change in P by the lakes depth and the flushing rate,
then dividing this by 1-‐R (the coefficient for P lost to sediment). This figure is then
16
multiplied by the lake surface area and divided by the total-‐P lost to the
environment per ton of fish produced. The final result is the permissible amount of
fish production in metric tons per year.
Table 1. Example of Beveridge Model used in this study.
This model, however, does not typically account for nutrient contributions
from the watershed. Yet this can be accomplished by factoring in estimated
watershed-‐P inputs into the permissible change in total-‐P for the water body
(EPANS, 2014). By subtracting both the initial-‐P level and the watershed-‐P inputs
from the desired-‐P level after aquaculture, a lower, but more accurate estimate of
the carrying capacity of aquaculture production will be generated.
In this study, watershed P inputs will include estimated domestic wastewater
contributions, as well as figures for agriculture, livestock, and other land use
contributions found in one of the previous studies (EPANS, 2014). Domestic

17
wastewater will be calculated by first estimating the population living within the
drainage basin, since all of the surrounding regencies extend far beyond the
watershed boundary. Population is then multiplied by a total-‐P loading factor and
by a runoff coefficient to more accurately represent the portion of wastewater
entering the lake. The World Health Organization suggests that the composition of
untreated domestic wastewater includes a total-‐P production of between 1 and 3
grams per capita per day (WHO, 1997). Since the majority of wastewater in the Lake
Toba watershed is untreated, or inadequately treated, this study will estimate
wastewater at both 2 and 3 g/cap/day in order to examine the results from a range
of possible contributions. A runoff coefficient of 0.5 will be used to represent the
multi-‐unit, detached, residential environment (EPANS, 2014). The sum of domestic
wastewater and land use inputs (i.e., loading as mass/time) are then divided by the
volume of lake (volume/time) to generate an estimate of lake P concentrations from
the watershed inputs. This approach assumes that the water retention time is
corresponding to the time unit of the loading estimate.
This approach includes two major assumptions that could influence the
effects of watershed loading on lake trophic status. First, only a portion of the
watershed P load is likely to be bioavailable to primary producers (Seitzinger,
2005). Thus, the effects of watershed P loading on chlorophyll a levels are likely to
be overestimated. In contrast, the approach obtains concentrations based solely on
annual loading and lake volume and ignores the actual retention time. With the long
retention time of Lake Toba, any P loading can accumulate within the water column
and thus the resulting lake P concentrations are likely to be underestimated.
Previous studies have approached aquaculture carrying capacity by using the
Beveridge model to address the entire water body as one homogenous unit.
However, when dealing with a large lacustrine system with a diverse coastline and
bathymetry; local winds, currents, circulation, and turnover rates may play an
important role in the fate of lake nutrients. Therefore, trophic status can vary
throughout the lake and its many bays. The spatial heterogeneity can result in
localized “hot spots” where P concentrations are more elevated than the majority of
the lake and thus are more likely to generate algal blooms than predicted by whole

18
lake analyses. For Lake Toba, this consideration could drastically alter the actual
ecological carrying capacity of aquaculture. Since the majority of cages are naturally
limited to small bays, some of these areas may have already reached or surpassed
their ecological carrying capacity. For these reasons, a zoned approach to
eutrophication management may be more applicable to a lake of this size.
Zoned approaches to managing eutrophication have been used on Lake
Champlain, in the U.S.A. and Canada. Lake Champlain is a 170km-‐long natural lake
shared by the U.S.A. states of New York, Vermont, and the Canadian Province of
Quebec. This lake is rich in historic value and serves mainly as a source of recreation
and as a water supply. The lake has a surface area of 1,130km2 and is made up of
numerous bays and open water segments. A variety of trophic conditions exist
throughout the lake, with much of the open and deeper areas in the low-‐
mesotrophic to oligotrophic range, while eutrophic conditions exist in shallower
locations such as St. Albans Bay (Smeltzer and Quinn, 1996). Since the watershed
includes almost half the state of Vermont, and large areas of northeastern New York
and southern Quebec, a large variety of point and non-‐point sources are responsible
for nutrient inputs. In 1996, a phosphorous budget and mass balance model was
developed for Lake Champlain in order to identify necessary load reductions
required to attain total-‐P concentration criteria established in water quality
agreements.

19
Figure 5. Lake Champlain map and zonation example
Due to the size and diversity of the lake and its watershed, the criterion for
in-‐lake total-‐P was developed for 13 segments (i.e., zones) of Lake Champlain
(Smeltzer and Quinn, 1996). Extensive water quality sampling for each of these
zones was used to support the development of a zoned approach to whole-‐lake mass
balance modeling. By modeling each zone individually (Figure 5), necessary load
reductions were identified for each sub-‐watershed in order to meet the established
criteria for the segment, and ultimately the entire water body. Agreements on
desired in-‐lake water quality goals could then be made between the various
government jurisdictions, and responsibilities divided appropriately. The
implementation of point and nonpoint source controls resulted in a P load reduction
of 20% between 1991 and 1995 (Lake Champlain Management Conference, 1996).

20
Similarly, Lake Toba has a variety of point and nonpoint sources throughout
its expansive watershed, and respective sub-‐watersheds, that must be considered in
order to accurately estimate nutrient loading. These sources must be identified and
quantified before aquaculture wastes can be considered the primary source of
eutrophication. Therefore, a zoned approach to modeling may better represent the
loading occurring throughout the lakes many bays. By setting an appropriate
criterion for each zone, this approach could also aid the challenging task of dividing
responsibilities amongst the seven governmental districts (Kabupatens). As an
example, the aquaculture carrying capacity will be estimated for Lake Toba’s
Haranggaol Bay, where the highest concentration of aquaculture cages can be found.
Methods:
Qualitative methods:
In June of 2014, fieldwork was conducted throughout portions of the Lake
Toba basin. Informal surveys and interviews were conducted with local farmers and
hoteliers throughout the eastern portion of Samosir Island, as well as the towns of
Parapat, Haranggaol, and Tongging. GPS positions were collected and observations
on land use were noted.
Quantitative methods:
Some prior studies of aquaculture carrying capacity did not consider
watershed inputs. I therefore developed carrying capacity estimates with and
without watershed inputs. For carrying capacity analyses based on aquaculture as
the primary P input (not including watershed inputs). The key figures necessary to
model ecological carrying capacity of aquaculture production include the food
conversion ratio (FCR), the amount of phosphorous in the feed (P_food), lake depth
(z), lake area (A), lake volume (v), flushing rate (p), residence time, and the
permissible change to total in-‐lake phosphorous (Delta P), which is determined by
the difference between the maximum acceptable P level after aquaculture and the
initial/ ambient P level.
Previous studies that address Lake Toba’s ecological carrying capacity of
aquaculture used varying values for a number of these key inputs to the model.

21
Accordingly, the final results from these different studies also varied. Input
variations that exerted large influences on model outputs included lake depth, FCR,
P_food, and Delta P. In order to determine the effects of these inputs on the final
outcome, I used a range of each of these input values to examine the effects of
variation on model output estimates of carrying capacity. For these calculations, the
remaining variables were kept static at values similar to previous studies or at the
lake-‐wide average found from lake surveys conducted by Dimitar Taskov and Irina
Timonina of the University of Stirling (personal communication, unpublished data).
To examine watershed P loading, a land cover classification was conducted
using ERDAS IMAGINE 2014 Satellite imagery was acquired from USGS Earth
Explorer. Due to the size of the watershed, 2 remotely sensed images were required.
After a mosaic image was created, a supervised classification was developed in
order to determine the spectral bands that represent various land covers. GIS was
then used to clip the imagery by the watershed boundary and to calculate the total
percentages for each category.
Watershed population was calculated by first determining the sub-‐districts
(Kecamatans) of each district (Kabupaten) that fall within the watershed boundary.
Census data from 2012 was then acquired through Statistics Indonesia (Badan Pusat
Statistik (BPS)) for each Kecamatan. However, a number of these Kecamatans
extend well beyond the watershed boundary. For these instances, measurements
and estimates were made using GIS and Google Earth Pro. Populations for these
areas were then divided appropriately before a sum was determined.
With these estimates, two levels of domestic wastewater P loads were
calculated using WHO figures. After unit conversions, these were added to figures
for P contributions from livestock, agriculture, and other land uses found in the
study by the EPANS. These final values represent the total-‐P contributions from the
watershed at two levels to indicate a range of possibilities. Both figures were used in
the calculations of carrying capacity for the whole lake.
For the zoned approach, a number of figures needed to be determined before
the model could be run. GIS and Google Earth Pro were used to delineate both the
lake surface and sub-‐watershed area for Haranggaol Bay. Average lake depth for this
22
bay was approximated using the raster-‐based bathymetric map developed by
Chesner (2011). Watershed contributions were determined in a similar manner as
described above, yet only the population of the surrounding Kecamatan was used
for domestic wastewater calculations. This Kecamatan, however, extended beyond
the delineated sub-‐watershed, so this population was halved in order to create a
conservative estimate. Only the lower wastewater factor of 2 g/p/d was used in
order to keep estimates conservative, the larger figure dramatically lowered the
total permissible production to the point where aquaculture production was
unattainable. A percentage of the land use inputs were used based on the proportion
of the entire watershed that the Haranggaol Bay drainage area occupies.
Results:
This land cover classification (figure 6) helps to understand the nature of the
watershed. A margin of error does exist due to the temporal resolution of the
satellite imagery. For more precise results, multiple images from a variety of
seasons should be classified and compared. However, for the purposes of this study,
the results are congruent with data from the EPANS as well as field observations. A
large potion of the watershed consists of agricultural lands, while developed areas
are concentrated near the shores of the lake.

23
Figure 6. Land cover classification for Lake Toba basin
0 10 20 305
Kilometers
Author: Josh Oakley, URI MESM Prog. Date 12/15/2014
Source: USGS Earth Explorer, ArcGIS Online
Key
Lake Toba
LAND_COVER
Agriculture
Clouds
Forest
ShrubVegMosaic
Urban Rocks and Soils
Water
Toba Rivers
Ü
Results:
Urban Rocks and Soils = 04%
Forests = 24%
Shrub/Vegetation = 27%
Agriculture = 45%
Land Cover Within Lake Toba Watershed,
North Sumatra, Indonesia

24
The range in carrying capacity estimated generated by using a range of input
values for key variables demonstrates the importance of these inputs to the model
results. A clear relationship between change in carrying capacity and change in
input values exists for all of these variables (Figure 7). As lake depth increases, total
permissible production also increases. Conversely, as FCR and the P content of feed
increase, production decreases. The affects of watershed contributions are also
evident by the substantial reduction in total permissible production, especially in
the optimal portions of each variable.

25
Figure 7. Charts of total permissible production results from altered model inputs for whole
lake approach resulting in Oligotrophic waters (Total-‐P at 10ppb).
As the permissible change to total in-‐lake phosphorus is altered, and
therefore the resulting trophic status following aquaculture, this reveals a
substantial impact on total permissible production. An increase by 5 mg/m3 (or
ppb) to the desired total-‐P level after aquaculture results in approximately double
the permissible production total. However, these increases to desired P levels
equate to rapidly deteriorating water quality, which would ultimately have negative
effects on aquaculture production.
The influence of watershed P contributions on aquaculture production
carrying capacity is very evident (Figure 7) with a whole lake model. Total
permissible production experienced a 36.6% reduction from the lower watershed
estimate (Table 2), and a 42.8% reduction after factoring in the higher watershed
estimate. The difference between results for aquaculture production alone and with
the higher watershed estimate ranged in reductions of approximately 3,000 tons/yr
for less desirable inputs, to almost 15,000 tons/yr for optimal inputs. The difference
represented by the range of watershed estimates is also significant for each variable.
Reductions to total permissible production from the two watershed estimates
ranged from approximately 500 tons/yr for less desirable variables to reductions
upwards of 2,000 tons/yr for optimal variables.

26
Table 2. Watershed-‐P input calculations for Whole Lake Model and Zoned Model
Similar patterns are evident when the model is run with the target trophic
status in the low-‐mesotrophic range of 15 mg/m3 (or ppb). Permissible production,
however, is more than doubled in all categories under these allowable water quality
standards (Figure 8). The influence of watershed inputs is parallel to the previous
model, despite the increase in acceptable nutrient levels. Each altered variable
experienced an 18.3% reduction from the lower watershed estimate, and a 21.4%
reduction from the higher watershed estimate. The results of these models indicate
the significant potential of watershed influences on aquaculture production, and
necessitate the need to more accurately quantify watershed P contributions.
For$Whole$Lake$Model:Sources$of$Watershed$Total6P$Inputs Amount ConversionDomestic)wastewater)(low)estimate1) 157.35)))))) ton/yr 157,350,000,000))))))) mg/yrLivestock 292.72)))))) ton/yr 292,720,000,000))))))) mg/yrLand)Use)(includes)agriculture) 19.10)))))))) ton/yr 19,100,000,000))))))))) mg/yr
Total)of)watershed)sources 469.17)))))) ton/yr 469,170,000,000))))))) mg/yrEstimate$of$Total6P$Inputs$from$Watershed$=
Total)/)Volume)of)Water)body)(256,200,000,000)m2) 1.83$$$$$$$$$$$$$$$$$$$$$$$$ mg/m3/yr
Sources$of$Watershed$Total6P$Inputs Amount ConversionDomestic)wastewater)(high)estimate2) 236.03&&&&&&& ton/yr 236,030,000,000))))))) mg/yrLivestock 292.72)))))) ton/yr 292,720,000,000))))))) mg/yrLand)Use)(includes)agriculture) 19.10)))))))) ton/yr 19,100,000,000))))))))) mg/yr
Total)of)watershed)sources 547.85)))))) ton/yr 547,850,000,000))))))) mg/yrEstimate$of$Total6P$Inputs$from$Watershed$=
Total)/)Volume)of)Water)body)(256,200,000,000)m2) 2.14$$$$$$$$$$$$$$$$$$$$$$$$ mg/m3/yr1.&Based&on&estimated&watershed&population&of&431,098&x&2g&of&P/&capita/&day2.&Based&on&estimated&watershed&population&of&431,098&x&3g&of&P/&capita/&day
For$Haranggaol$Bay$(zoned)$Model:Sources$of$Watershed$Total6P$Inputs Amount ConversionDomestic)wastewater)(low)estimate1) 0.91&&&&&&&&&&& ton/yr 912,500,000))))))))))))) mg/yrLivestock)x).0073* 2.14)))))))))) ton/yr 2,140,000,000)))))))))) mg/yrLand)Use)(includes)agriculture))x).0073* 0.14)))))))))) ton/yr 140,000,000))))))))))))) mg/yr
Total)of)watershed)sources 3.19)))))))))) ton/yr 3,192,500,000)))))))))) mg/yrEstimate$of$Total6P$Inputs$from$Watershed$=
Total)/)Volume)of)Water)body)(450,000,000)m2)** 7.09$$$$$$$$$$$$$$$$$$$$$$$$ mg/m3/yr1.&Based&on&estimated&sub.watershed&population&of&2,500&x&2g&of&P/&capita/&day*&Proportion&of&entire&watershed&that&Haranggaol&Bay&represents**Volume&based&on&an&average&depth&of&150m&and&surface&area&of&3,000,000

27
Figure 8. Charts of total permissible production results from altered model inputs for whole
lake approach resulting in Mesotrophic waters (Total P at 15ppb).

28
In order to show a range of possibilities based on the whole lake model, the
following tables were created using two main combinations associated with a
change to the desired in-‐lake total-‐P levels following aquaculture production. Table
3 shows the combination of average inputs found in previous studies, while table 4
combines all of the variables that result in optimal production. The results show a
range in the absolute total permissible production for the entire lake, based on
desired trophic status.
Table 3. Range of total aquaculture permissible production (metric tons/yr) for average key
input values and various desired trophic states using the Beveridge whole lake model.
Table 4. Range of total aquaculture permissible production (metric tons/yr) for optimal key
input values and various desired trophic states using the Beveridge whole lake model.
Desired'In*Lake'Total*P'Levels'(mg/m3'or'ppb)'After'Aquaculture
Desired'Total-P'level'after'aquaculture'production'(P_f)
10 15 25 50 50
Initial'Total-P'level'(P_i) 5 5 5 10 5Delta'P'(ΔP'='P_f'-'P_i) 5 10 20 40 45Trophic'status'after'production
Oligotrophic'waters
'Mesotrophic'waters'
'Mesotrophic'waters'
'Eutrophic'waters'
'Eutrophic'waters'
Total'Permissible'Production'Based'On'Average'Inputs1'(metric'tons/'yr)
Aquaculture'only 21,433'''''''''''' 42,867'''''''''''' 85,733'''''''''''' 171,466'''''''''' 192,899''''''''''
Aquaculture'and'Watershed'inputs'2
13,589'''''''''''' 35,022'''''''''''' 77,889'''''''''''' 163,622'''''''''' 185,055''''''''''
Aquaculture'and'Watershed'inputs'3
12,260'''''''''''' 33,693'''''''''''' 76,560'''''''''''' 162,293'''''''''' 183,726''''''''''
1"#"Average"imputs"based"on"previous"studies"by"EPANS"and"D."Taskov"&"I."Timonina2"#"Based"on"domestic"wastewater"rates"of"2g/p/d"and"EPANS"figures"for"land"use3"#"Based"on"domestic"wastewater"rates"of"3g/p/d"and"EPANS"figures"for"land"use
Desired'In*Lake'Total*P'Levels'(mg/m3'or'ppb)'After'Aquaculture
Desired'Total-P'level'after'aquaculture'production'(P_f)
10 15 25 50 50
Initial'Total-P'level'(P_i) 5 5 5 10 5Delta'P'(ΔP'='P_f'-'P_i) 5 10 20 40 45Trophic'status'after'production
Oligotrophic'waters
'Mesotrophic'waters'
'Mesotrophic'waters'
'Eutrophic'waters'
'Eutrophic'waters'
Total'Permissible'Production'Based'On'Optimal'Inputs1'(metric'tons/'yr)
Aquaculture'only 55,232'''''''''''' 110,464'''''''''' 220,928'''''''''' 441,855'''''''''' 497,087''''''''''
Aquaculture'and'Watershed'inputs'2 35,017'''''''''''' 90,249'''''''''''' 200,713'''''''''' 421,640'''''''''' 476,872''''''''''Aquaculture'and'Watershed'inputs'3 31,593'''''''''''' 86,825'''''''''''' 197,288'''''''''' 418,216'''''''''' 473,448''''''''''1"#"Optimal"imputs"based"on"previous"studies"by"EPANS"and"D."Taskov"&"I."Timonina2"#"Based"on"domestic"wastewater"rates"of"2g/p/d"and"EPANS"figures"for"land"use3"#"Based"on"domestic"wastewater"rates"of"3g/p/d"and"EPANS"figures"for"land"use
29
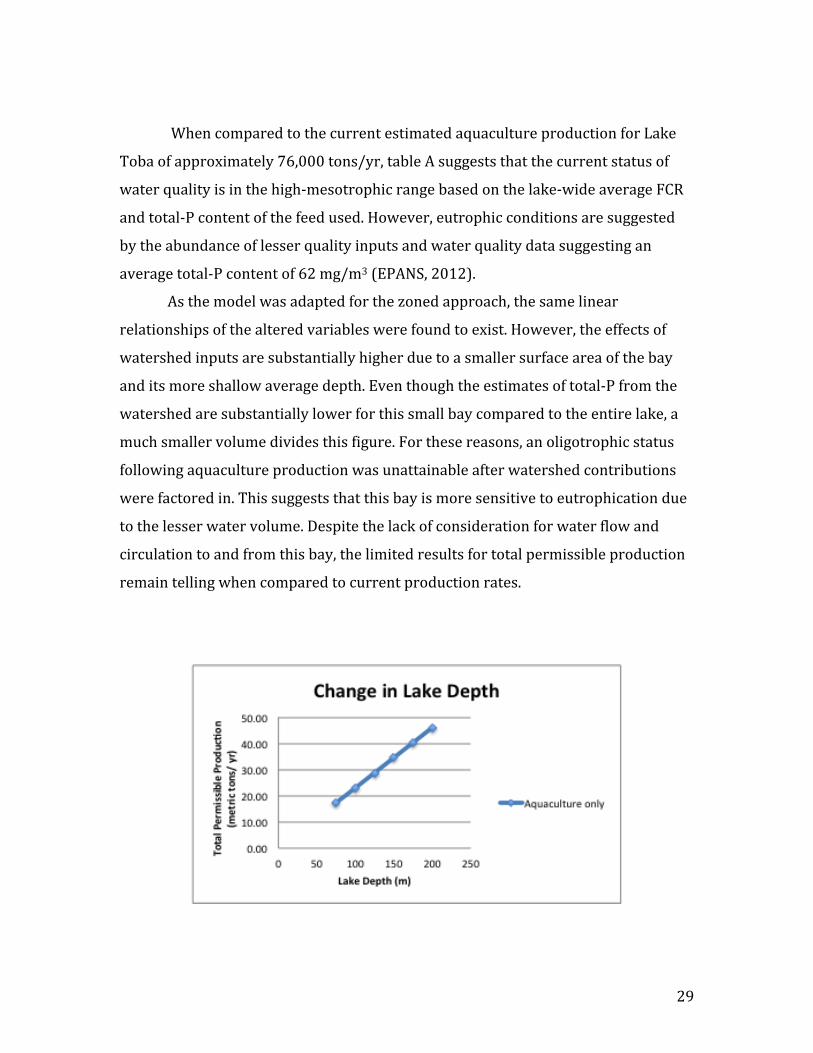
When compared to the current estimated aquaculture production for Lake
Toba of approximately 76,000 tons/yr, table A suggests that the current status of
water quality is in the high-‐mesotrophic range based on the lake-‐wide average FCR
and total-‐P content of the feed used. However, eutrophic conditions are suggested
by the abundance of lesser quality inputs and water quality data suggesting an
average total-‐P content of 62 mg/m3 (EPANS, 2012).
As the model was adapted for the zoned approach, the same linear
relationships of the altered variables were found to exist. However, the effects of
watershed inputs are substantially higher due to a smaller surface area of the bay
and its more shallow average depth. Even though the estimates of total-‐P from the
watershed are substantially lower for this small bay compared to the entire lake, a
much smaller volume divides this figure. For these reasons, an oligotrophic status
following aquaculture production was unattainable after watershed contributions
were factored in. This suggests that this bay is more sensitive to eutrophication due
to the lesser water volume. Despite the lack of consideration for water flow and
circulation to and from this bay, the limited results for total permissible production
remain telling when compared to current production rates.
30
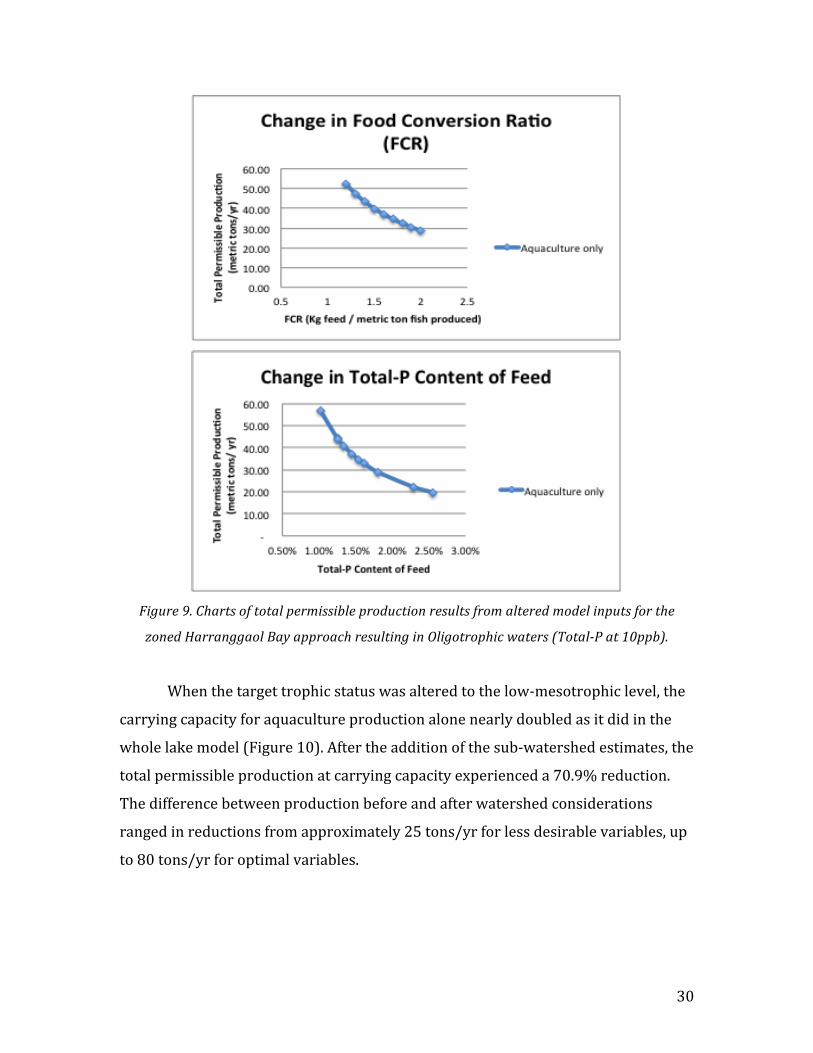
Figure 9. Charts of total permissible production results from altered model inputs for the
zoned Harranggaol Bay approach resulting in Oligotrophic waters (Total-‐P at 10ppb).
When the target trophic status was altered to the low-‐mesotrophic level, the
carrying capacity for aquaculture production alone nearly doubled as it did in the
whole lake model (Figure 10). After the addition of the sub-‐watershed estimates, the
total permissible production at carrying capacity experienced a 70.9% reduction.
The difference between production before and after watershed considerations
ranged in reductions from approximately 25 tons/yr for less desirable variables, up
to 80 tons/yr for optimal variables.

31
Figure 10. Charts of total permissible production results from altered model inputs for the
zoned Harranggaol Bay approach resulting in Mesotrophic waters (Total-‐P at 15ppb).

32
The combination tables also show extremely low totals for total permissible
production after watershed contributions are considered. These calculations
suggest that even if all of the optimal inputs are used, the best results would involve
low-‐mesotrophic waters and the permissible production of only 51.85 tons/yr.
Current production is estimated to be upwards of 27,000 tons/yr in this small bay,
while water quality data suggests hyper-‐eutrophic conditions with an average total-‐
P concentration of 110 mg/m3 (EPA, 2012). According to this basic mass-‐balance
model, without considering water circulation, these results place Haranggaol Bay
well beyond hyper-‐eutrophic status.
Table 5. Range of total aquaculture permissible production (metric tons/yr) for average key
input values and various desired trophic states using the Beveridge model for a zoned
approach to Haranggaol bay.
Table 6. Range of total aquaculture permissible production (metric tons/yr) for average key
input values and various desired trophic states using the Beveridge model for a zoned
approach to Haranggaol bay.
Desired'In*Lake'Total*P'Levels'(mg/m3'or'ppb)'After'AquacultureDesired'Total-P'level'after'aquaculture'production'(P_f) 10 15 25 50 50
Initial'Total-P'level'(P_i) 5 5 5 10 5Delta'P'(ΔP'='P_f'-'P_i) 5 10 20 40 45Trophic'status'after'production
Oligotrophic'waters
'Mesotrophic'waters'
'Mesotrophic'waters'
'Eutrophic'waters'
'Eutrophic'waters'
Total'Permissible'Production'Based'On'Average'Inputs1'(metric'tons/'yr)
Aquaculture'only 34.57&&&&&&&&&&&&&& 69.14&&&&&&&&&&&&&& 138.28&&&&&&&&&&&& 276.56&&&&&&&&&&&& 311.13&&&&&&&&&&&&
Aquaculture'and'Watershed'inputs'2
NOT&ATTAINABLE 20.12&&&&&&&&&&&&&& 89.26&&&&&&&&&&&&&& 227.54&&&&&&&&&&&& 262.11&&&&&&&&&&&&
1&5&Average&imputs&based&on&previous&studies&by&EPANS&and&D.&Taskov&&&I.&Timonina2"#"Based"on"domestic"wastewater"rates"of"2g/p/d"and"EPANS"figures"for"land"use
Desired'In*Lake'Total*P'Levels'(mg/m3'or'ppb)'After'AquacultureDesired'Total-P'level'after'aquaculture'production'(P_f) 10 15 25 50 50
Initial'Total-P'level'(P_i) 5 5 5 10 5Delta'P'(ΔP'='P_f'-'P_i) 5 10 20 40 45Trophic'status'after'production
Oligotrophic'waters
'Mesotrophic'waters'
'Mesotrophic'waters'
'Eutrophic'waters'
'Eutrophic'waters'
Total'Permissible'Production'Based'On'Optimum'Inputs1'(metric'tons/'yr)
Aquaculture'only 89.08 178.17 356.33 712.67 801.75
Aquaculture'and'Watershed'inputs'2
NOT$ATTAINABLE 51.85 230.01 586.35 675.43
1$+$Optimum$inputs$based$on$previous$studies$by$EPANS$and$D.$Taskov$&$I.$Timonina2"#"Based"on"domestic"wastewater"rates"of"2g/p/d"and"EPANS"figures"for"land"use

33
Discussion:
With aquaculture concentrated into select, more protected bays of Lake
Toba, the zoned approach to estimating ecological carrying capacity merits further
attention. However, due to the complexities of this large and deep lake, more
advanced full ecosystem models may be more applicable. In addition to insights
gained from the zoned approach, this study also provides valuable insight on the
importance of watershed considerations. Since the conservative watershed
estimates used in this study revealed such large impacts to overall estimates of the
carrying capacity for aquaculture production and lake eutrophication, it is evident
that these nutrient sources require attention. The watershed contributions of P pose
a genuine threat to water quality. Improving watershed management can result in a
higher carrying capacity for aquaculture production.
As populations continue to rise within the Lake Toba basin, the demand for
ecosystem goods and services will as well. In addition to an increase in the need for
sustenance, employment opportunities across many fields will continue to be
dependent on the lake. If the issue of ecological carrying capacity is not thoroughly
addressed, many lives will be affected. Therefore, further study is required
throughout the watershed. Water quality sampling should be increased throughout
the entire lake in order to accurately determine the current state. A thorough
inventory of land use practices should be conducted throughout the watershed. This
should include quantifying nutrient contributions from agricultural practices such
as the use of fertilizers and pesticides, as well as an inventory of livestock. Most
importantly, the issue of domestic wastewater should be a top priority for all of the
Kecamatans in the drainage basin. The development of treatment facilities should be
explored, as well as public outreach and education programs geared towards more
sustainable practices.
With such additional research, and the development of watershed scale
management practices amongst the various administrations, Lake Toba can
continue to support a variety of industries, while sustaining it’s natural resources
and the people who depend on them.
34
References Abery, N.W., Sukadi, F., Budhiman, A.A., Kartamihardja, E.S., Koeshendrajana, S., Budhiman and De Silva, S.S. 2005. Fisheries and cage culture of three reservoirs in west Java, Indonesia; a case study of ambitious development and resulting interactions. Fisheries Management and Ecology. 12. 315-‐330. Badan Lingkungan Hidup Provinsi Sumatera Utara (Environemental Protection Agency of North Sumatra (EPANS)). 2014. DAYA TAMPUNG BEBAN PENCEMARAN AIR DANAU TOBA. Presentation prepared for Lake Toba Conference, LIPI, Bogor, 17 June 2014. Beveridge, M.C.M. 2008. Cage aquaculture. John Wiley & Sons. 5: 152-‐186. Byron, C., Link, J., Costa-‐Pierce, B. & Bengtson, D. 2011. Modelling ecological carrying capacity of shellfish aquaculture in highly flushed temperate lagoons. Aquaculture. 314. 87–99. Chesner, C.A. 2011. The Toba caldera complex. Quaternary International. In press. Available at: http://www.geo.mtu.edu/~raman/papers2/Toba%20QI.pdf. Cuvin-‐Aralar, M.L., Gibbs, P., Palma, A., Andayog, A. and Noblefranca, L. 2010. Effect of different feeding management schemes on the aquaculture production of Nile tilapia (Oreochnomis niloticus) in Lake Bato, Camarines Sur, Philippines. Presentation given at Aquaculture 2010 conference, San Diego, CA. [online]. FAO. 2010. Aquaculture development. 4. Ecosystem approach to aquaculture. FAO Technical Guidelines for Responsible Fisheries No. 5, Suppl. 4. Rome. 53 pp. Available at: www.fao.org/docrep/013/i1750e/i1750e00.htm Ghebremichael, L. T., T. L. Veith, and M. C. Watzin. 2010. "Determination of critical source areas for phosphorus loss: Lake Champlain basin, Vermont." Trans. ASABE 53.5. 1595-‐1604. Kartamihardja, E. S. 2014. Estimasi Daya Dukung Perairan Danau Dan Waduk Untuk Pengembangan Budidaya Ikan Dalam KJA. Presentation prepared for Lake Toba Conference, LIPI, Bogor, 17 June 2014. Lehmusluoto, P. 2000. Lake Toba. The first sound science initiative to abate change in the lake environment. [online]. Available at: http://www.kolumbus.fi/pasi.lehmusluoto/247_toba_initiative.PDF. Lukman. 2014. PENELITIAN DANAU TOBA DAN ARAHAN DAYA DUKUNG UNTUK PENGEMBANGAN KARAMBA JARING APUNG. Presentation prepared for Lake Toba Conference, LIPI, Bogor, 17 June 2014.

35
McKindsey C.W., H. Thetmeyer, T. Landry and W. Silvert. 2006. Review of recent carrying capacity models for bivalve culture and recommendations for research and management. Aquaculture 261:451-‐462. Moedjodo, H,., Simanjuntak, P., Hehanussa, P. and Lufiandi. 2003. Lake Toba. Experience and lessons learned brief. [online]. Available at: http://www.worldlakes.org/uploads/Toba_12.07.03.pdf. Mustafa. Y.M, M.S.M Amin, T.S. Lee, and A.R.M Shariff. 2002. Evaluation of Land Development Impact on a Tropical Watershed Hydrology Using Remote Sensing and GIS. Journal of Spatial Hyrdrology. Vol. 5, No. 2. Pollnac, R.B. and Sihombing, S. 1996. Cages, controversies and conflict: carp culture in Lake Toba. pp.250-‐261. Ross, L.G., Telfer, T.C., Falconer, L., Soto, D., Aguilar-‐Manjarrez, J., Asmah, R., Bermúdez, J., Beveridge, M.C.M., Byron, C. J., Clément, A., Corner, R., Costa-‐Pierce, B.A., Cross, S., De Wit, M., Dong, S., Ferreira, J.G., Kapetsky, J.M., Karakassis, I., Leschen, W., Little, D., Lundebye, A.-‐K., Murray, F.J., Phillips, M., Ramos, L., Sadek, S., Scott, P.C., Valle-‐levinson, A., Waley, D., White, P.G. & Zhu, C. 2013. Carrying capacities and site selection within the ecosystem approach to aquaculture. In L.G. Ross, T.C. Telfer, L. Falconer, D. Soto & J. Aguilar-‐Manjarrez, eds. Site selection and carrying capacities for inland and coastal aquaculture, pp. 19–46. FAO/Institute of Aquaculture, University of Stirling, Expert Workshop, 6–8 December 2010. Stirling, the United Kingdom of Great Britain and Northern Ireland. FAO Fisheries and Aquaculture Proceedings No. 21. Rome, FAO. 282 pp. Saragih, B. and Sunito, S. 2001. Lake Toba: Need for an integrated management system. Lakes and Reservoirs: Research and Management. 6: 247-‐251. Seitzinger, S.P., Harrison J.A., Dumont E, Beusen A.H.W, and Bouwman, A.F. 2005. “Sources and delivery of carbon, nitrogen, and phosphorus to the coastal zone: An overview of Global Nutrient Export from Watersheds (NEWS) models and their application.” Global Biogeochemical Cycles. Vol 19. Smeltzer, Eric, and Scott Quinn. 1996. "A phosphorus budget, model, and load reduction strategy for Lake Champlain." Lake and Reservoir Management 12.3. 381-‐393. World Health Organization (WHO), United Nations Environment Prgogramme, S.Veenstra, G.J. Alaerts and M. Bijlsma. 1997. Water Pollution Control – A Guide to the Use of Water Quality Management.
Related Documents