UNIVERSITY OF CALIFORNIA Santa Barbara Modeling Solution Growth of Inorganic Crystals A Dissertation submitted in partial satisfaction of the requirements for the degree of Doctor of Philosophy in Chemical Engineering by Preshit Dandekar Committee in Charge: Professor Michael F. Doherty, Chair Professor Bradley F. Chmelka Professor Baron Peters Professor Ram Seshadri September 2014

Welcome message from author
This document is posted to help you gain knowledge. Please leave a comment to let me know what you think about it! Share it to your friends and learn new things together.
Transcript
UNIVERSITY OF CALIFORNIASanta Barbara
Modeling Solution Growth of Inorganic Crystals
A Dissertation submitted in partial satisfaction
of the requirements for the degree of
Doctor of Philosophy
in
Chemical Engineering
by
Preshit Dandekar
Committee in Charge:
Professor Michael F. Doherty, Chair
Professor Bradley F. Chmelka
Professor Baron Peters
Professor Ram Seshadri
September 2014
The Dissertation ofPreshit Dandekar is approved:
Professor Bradley F. Chmelka
Professor Baron Peters
Professor Ram Seshadri
Professor Michael F. Doherty, Committee Chair
August 2014
Modeling Solution Growth of Inorganic Crystals
Copyright © 2014
by
Preshit Dandekar
iii
To my parents, Prakash and Deepa Dandekar
iv
Acknowledgements
There are several people who made significant contributions to my pursuit of a doctoral
degree, and I thank all of them. Regrettably, only some of them are mentioned here.
To quote Warren Buffet - “I won the fetus lottery”. My parents Deepa and Prakash,
who are engineers themselves, instilled in me a scientific mind, and persevered through-
out my childhood to teach me the importance of hard work and humility. My brother
Pranav has been a great source of encouragement and intellectual support, always asking
me the tough questions. My uncle Hemant helped me prioritize academics during my
undergraduate education, and was instrumental in me developing pride and fondness for
the chemical engineering discipline.
My advisor Mike Doherty has been a great source of knowledge as well as wisdom.
He has been the perfect guide, stepping out to give me the time and the freedom to
pursue a research problem, and coming back into the thick of things whenever his help
was needed. Through his senior design class, he helped sustain my dream of being a
good chemical engineer. I am infinitely grateful and proud to have worked with him for
these five years. I must thank my committee members, who provided valuable comments
and suggestions that helped me better shape the course of my doctoral research. I want
to thank all my co-workers within the Doherty group, specifically, Drs. Mike Lovette,
Zubin Kuvadia, Seung Ha Kim and Thomas Vetter, for their help and support in some
of my projects. Working with such incredibly intelligent and fun-loving people has been
a great learning experience.
v
Meeting my wife Vedavati was certainly the best thing that happened to me in Santa
Barbara. Though not from an engineering background, she has shown tremendous pa-
tience in listening to all my work stories/ideas. I cannot thank her enough for her love,
emotional support and understanding.
vi
Curriculum Vitæ
Preshit Dandekar
Education
Ph.D. Chemical Engineering, University of California Santa Barbara 2014
B.Tech. & M.Tech. Chemical Engineering, Silver medal recipient for graduating top ofthe class, Indian Institute of Technology Bombay, India 2009
Publications
Preshit Dandekar and Michael F. Doherty, “Prediction of Growth Morphology of Arag-onite Crystals using Spiral Growth Model”, (manuscript in preparation).
Preshit Dandekar and Michael F. Doherty, “A Mechanistic Growth Model for InorganicCrystals: Solid-State Interactions”, AIChE J., 2014, (in press).
Preshit Dandekar and Michael F. Doherty, “A Mechanistic Growth Model for InorganicCrystals: Growth Mechanism”, AIChE J., 2014, (in press).
Shailendra Bordawekar, Zubin B. Kuvadia, Preshit Dandekar, Samrat Mukherjee andMichael F. Doherty, “Interesting Morphological Behavior of Organic Salt CholineFenofibrate: Effect of Supersaturation and Polymeric Impurity”, Cryst. GrowthDes., 2014, 14, 3800-3812.
Preshit Dandekar and Michael F. Doherty, “Imaging Crystallization”, Science, 2014,344, 705–706.
Seung Ha Kim, Preshit Dandekar, Michael A. Lovette and Michael F. Doherty, “KinkRate Model for the General Case of Organic Molecular Crystals”, Cryst. GrowthDes., 2014, 14, 2460–2467.
Preshit Dandekar, Zubin B. Kuvadia and Michael F. Doherty, “Engineering CrystalMorphology”, Annu. Rev. Mater. Res., 2013, 43, 359–386.
Preshit Dandekar, Chandra Venkataraman and Anurag Mehra, “Pulmonary Targetingof Nanoparticle Drug Matrices”, J. Aerosol Med. Pulm. D., 2010, 23, 343–353.
Conference Presentations
Preshit Dandekar and Michael F. Doherty, “A Mechanistic Model for Crystal Growthof Calcite”, AIChE Annual Meeting, San Francisco, November 2013.
Preshit Dandekar, “Engineering Growth Shapes of Inorganic Crystals”, 6th AnnualAmgen-Clorox Graduate Student Symposium, Department of Chemical Engineer-ing, University of California Santa Barbara, October 2013.
vii
Preshit Dandekar and Michael F. Doherty, “Growth, Dissolution and Stabilization ofPolar Oxide Surfaces”, AIChE Annual Meeting, Pittsburgh, November 2012.
Michael F. Doherty and Preshit Dandekar, “Molecular Design Rules for Blast-ResistantHoneycomb Structures”, European Conference on Composite Materials (ECCM15),Venice Italy, June 2012.
Preshit Dandekar and Michael F. Doherty, “A Mechanistic Growth Model for IonicCrystals”, AIChE Annual Meeting, Minneapolis, October 2011.
Awards and Honors
Dow Discovery Fellowship supported by The Dow Chemical Co. for pursuing funda-mental research in Chemical Engineering, 2012-14.
Best Poster, 4th Annual Amgen-Clorox Graduate Student Symposium, 2011.
Outstanding Teaching Assistant Award, Dept. of Chemical Engineering, UCSB, 2011.
Institute Academic Prize for best annual performance in the Department of ChemicalEngineering, IIT Bombay, 2007-2008.
viii
Abstract
Modeling Solution Growth of Inorganic Crystals
Preshit Dandekar
Crystallization of inorganic solids from solution is of interest in several areas such as
biomineralization, carbon sequestration, catalysis, photovoltaics, etc. The end-use func-
tionality in some of the industrial applications is determined by the growth morphology
of the inorganic crystals. A mechanistic understanding of the growth process will enable
the design of functionally desirable inorganic crystalline solids.
The kinetics of crystal growth is governed primarily by the intermolecular interac-
tions between the growth units on crystal surfaces and across the solid-solution interface.
Therefore, this modeling effort is focused on the solid-state as well as the solution phase
chemistry. The challenges associated with the solid-state chemistry of inorganic crys-
tals, including long-range electrostatic interactions, stoichiometry, electronic structure of
surface growth units, etc., were resolved within an easy-to-implement framework. The
importance of the solution structure information (from experiments or molecular simu-
lations) has been highlighted appropriately.
This dissertation presents a spiral growth model that predicts the morphology of
solution grown crystals (e.g., CaCO3) at ambient conditions. The model also provides
quantitative insights into the kinetics of hydrothermal synthesis of inorganic oxides, such
as TiO2 and ZnO, using the periodic bond chain (PBC) theory.
ix
This mechanistic model could be extended to identify suitable growth modifiers for
a wide range of inorganic crystals such as salts and oxides. The ultimate goal is to
develop a predictive tool that helps engineer the synthesis of inorganic solids with desired
functionality.
x
Contents
Acknowledegments v
Vitæ vii
Abstract ix
List of Figures xiv
List of Tables xxi
1 Introduction 11.1 Motivation . . . . . . . . . . . . . . . . . . . . . . . . . . . . . . . . . . . 11.2 Background . . . . . . . . . . . . . . . . . . . . . . . . . . . . . . . . . . 31.3 Mechanistic Growth Models . . . . . . . . . . . . . . . . . . . . . . . . . 91.4 Dissertation Outline . . . . . . . . . . . . . . . . . . . . . . . . . . . . . 15
Bibliography 17
2 Solid-State Interactions in Inorganic Crystals 202.1 Introduction . . . . . . . . . . . . . . . . . . . . . . . . . . . . . . . . . . 202.2 Periodic Bond Chains (PBCs) in Inorganic Crystals . . . . . . . . . . . . 22
2.2.1 Building Unit of the PBC . . . . . . . . . . . . . . . . . . . . . . 242.2.2 Step Edges from Building Units and PBCs . . . . . . . . . . . . . 282.2.3 PBCs in Bulk Calcite . . . . . . . . . . . . . . . . . . . . . . . . . 31
2.3 Surface Effects on Solid-State Interactions . . . . . . . . . . . . . . . . . 382.3.1 Bond Valence Model . . . . . . . . . . . . . . . . . . . . . . . . . 402.3.2 PBC Energies on (1014) Surface of Calcite . . . . . . . . . . . . . 48
2.4 Kink Site Energies . . . . . . . . . . . . . . . . . . . . . . . . . . . . . . 492.4.1 Space Partitioning . . . . . . . . . . . . . . . . . . . . . . . . . . 502.4.2 Kink Site Energies on (1014) Surface of Calcite . . . . . . . . . . 56
2.5 Discussion . . . . . . . . . . . . . . . . . . . . . . . . . . . . . . . . . . . 58
xi
2.6 Conclusions . . . . . . . . . . . . . . . . . . . . . . . . . . . . . . . . . . 60
Bibliography 62
3 Spiral Growth of Inorganic Crystals 673.1 Introduction . . . . . . . . . . . . . . . . . . . . . . . . . . . . . . . . . . 673.2 Growth Mechanism . . . . . . . . . . . . . . . . . . . . . . . . . . . . . . 703.3 Kink Density Calculation . . . . . . . . . . . . . . . . . . . . . . . . . . . 733.4 Kink Rate for Inorganic Crystals . . . . . . . . . . . . . . . . . . . . . . 77
3.4.1 New Kink Rate Model . . . . . . . . . . . . . . . . . . . . . . . . 783.4.2 Expressions for Attachment and Detachment Fluxes . . . . . . . . 82
3.5 Step Velocity Predictions on (1014) Surface of Calcite . . . . . . . . . . . 913.6 Critical Length of a Spiral Edge . . . . . . . . . . . . . . . . . . . . . . . 97
3.6.1 Morphology of Calcite Crystals . . . . . . . . . . . . . . . . . . . 1033.7 Conclusions . . . . . . . . . . . . . . . . . . . . . . . . . . . . . . . . . . 104
Bibliography 106
4 Crystal Growth and Morphology Prediction of Aragonite 1114.1 Introduction . . . . . . . . . . . . . . . . . . . . . . . . . . . . . . . . . . 1114.2 Periodic Bond Chains in Aragonite Crystals . . . . . . . . . . . . . . . . 1124.3 Step Velocity of Edges with Multiple Structures . . . . . . . . . . . . . . 1214.4 Space Partitioning in Aragonite Crystals . . . . . . . . . . . . . . . . . . 1264.5 Spiral Growth Calculations . . . . . . . . . . . . . . . . . . . . . . . . . . 1314.6 Conclusions . . . . . . . . . . . . . . . . . . . . . . . . . . . . . . . . . . 135
Bibliography 137
5 Crystal Growth of Anatase from Hydrothermal Synthesis 1395.1 Introduction . . . . . . . . . . . . . . . . . . . . . . . . . . . . . . . . . . 139
5.1.1 Growth Unit for Anatase Crystal Growth . . . . . . . . . . . . . . 1405.2 Periodic Bond Chains in Anatase Crystals . . . . . . . . . . . . . . . . . 1415.3 Hydrothermal Synthesis . . . . . . . . . . . . . . . . . . . . . . . . . . . 147
5.3.1 Synthesis Procedure . . . . . . . . . . . . . . . . . . . . . . . . . 1485.3.2 Characterization . . . . . . . . . . . . . . . . . . . . . . . . . . . 149
5.4 Discussion . . . . . . . . . . . . . . . . . . . . . . . . . . . . . . . . . . . 1535.5 Conclusions . . . . . . . . . . . . . . . . . . . . . . . . . . . . . . . . . . 156
Bibliography 158
6 Stabilization and Growth of Polar Crystal Surfaces 1616.1 Introduction . . . . . . . . . . . . . . . . . . . . . . . . . . . . . . . . . . 1616.2 Crystal Structure of Wurtzite Zinc Oxide . . . . . . . . . . . . . . . . . . 164
xii
6.3 Building Unit and PBCs in Zinc Oxide Crystals . . . . . . . . . . . . . . 1676.4 Stabilization of Polar {0002} ZnO surfaces . . . . . . . . . . . . . . . . . 1746.5 Conclusions . . . . . . . . . . . . . . . . . . . . . . . . . . . . . . . . . . 179
Bibliography 181
7 Conclusions and Future Work 1857.1 Overview and Summary . . . . . . . . . . . . . . . . . . . . . . . . . . . 1857.2 Directions for Future Work . . . . . . . . . . . . . . . . . . . . . . . . . . 187
7.2.1 Modeling . . . . . . . . . . . . . . . . . . . . . . . . . . . . . . . 1877.2.2 Experiments . . . . . . . . . . . . . . . . . . . . . . . . . . . . . . 192
Bibliography 194
Appendices 197
A Step-by-step Methodology for Crystal Morphology Prediction of Inor-ganic Solids 197
Bibliography 208
B Detailed Expression for the Kink Rate 209
Bibliography 214
C Time Scale Comparison between Edge Rearrangement and Kink In-corporation 215
Bibliography 220
D Modification of Surface Charges for Polarity Stabilization 221
Bibliography 226
E Force Field Parameters for Some Inorganic Crystals 227
Bibliography 229
xiii
List of Figures
1.1 (a) 3D model of Pd nanocrystals (golden) grown on a SrTiO3(001) sub-strate (green) in an ultrahigh vacuum environment. (b) shows the evo-lution of the height and length of the Pd nanocrystals. The dashed lineindicates the equilibrium shape while the different markers for the dat-apoints indicate different nucleation temperatures. Reprinted with per-mission from Silly et al [12]. Copyright ©2005, The American PhysicalSociety. . . . . . . . . . . . . . . . . . . . . . . . . . . . . . . . . . . . . 5
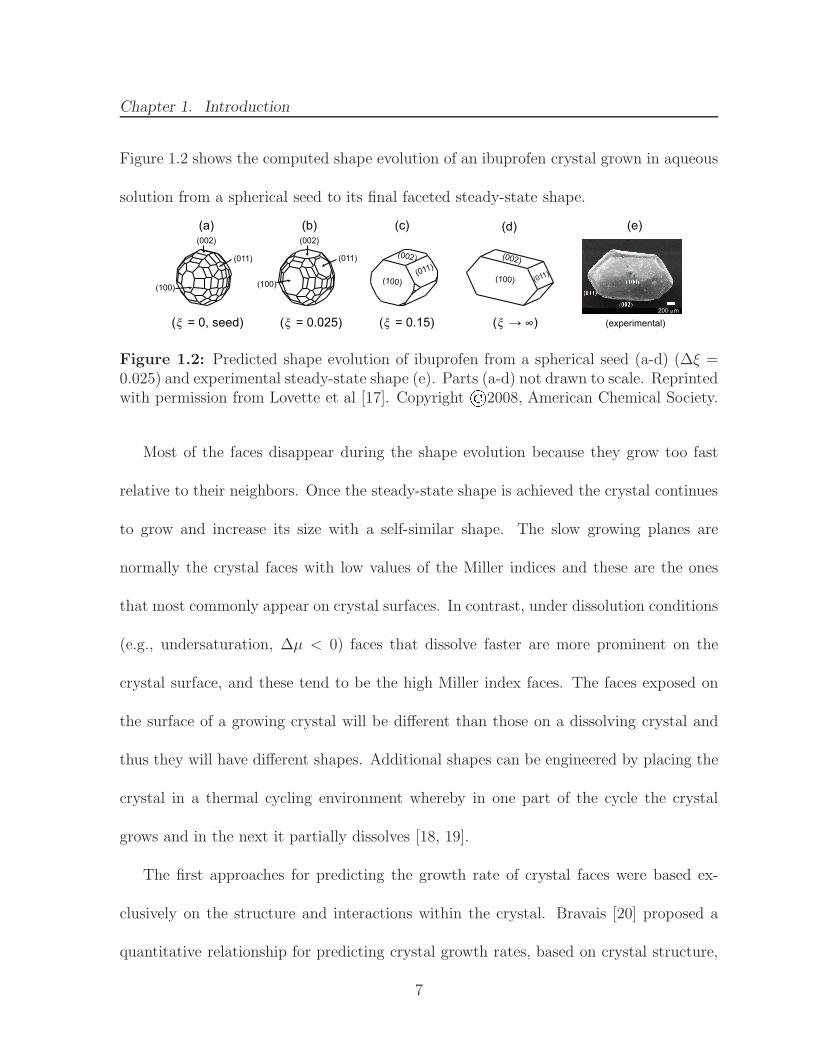
1.2 Predicted shape evolution of ibuprofen from a spherical seed (a-d) (∆ξ =0.025) and experimental steady-state shape (e). Parts (a-d) not drawnto scale. Reprinted with permission from Lovette et al [17]. Copyright©2008, American Chemical Society. . . . . . . . . . . . . . . . . . . . . 7
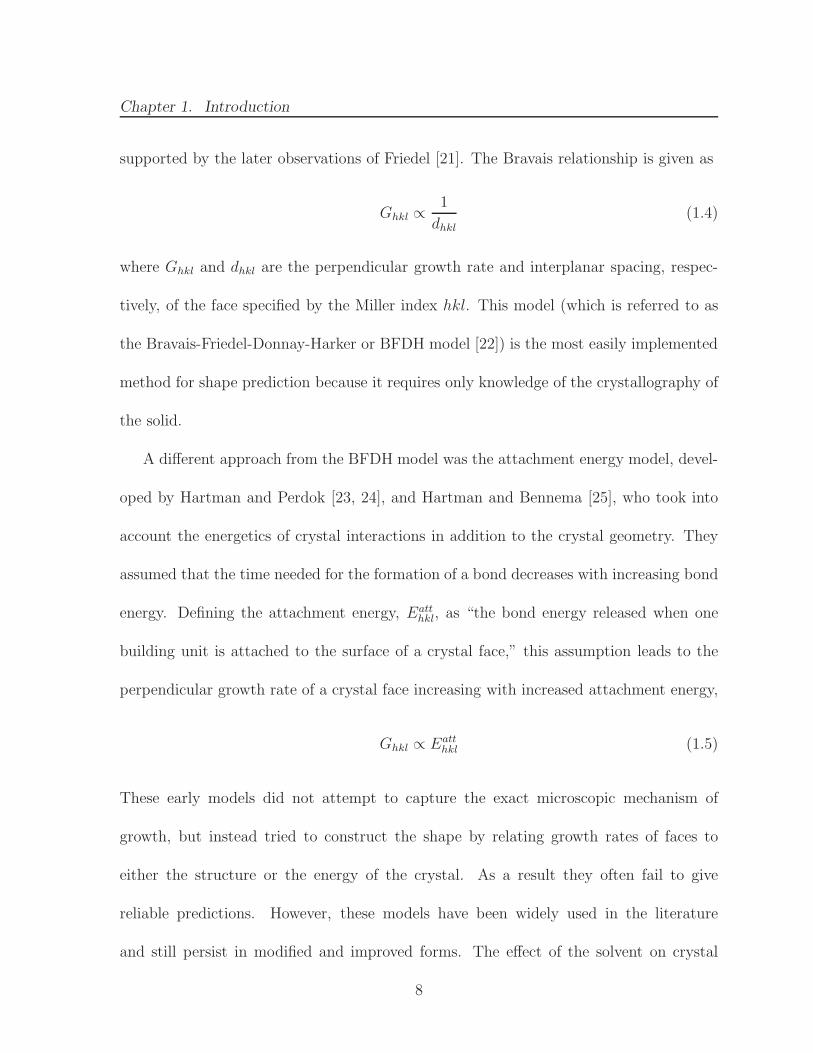
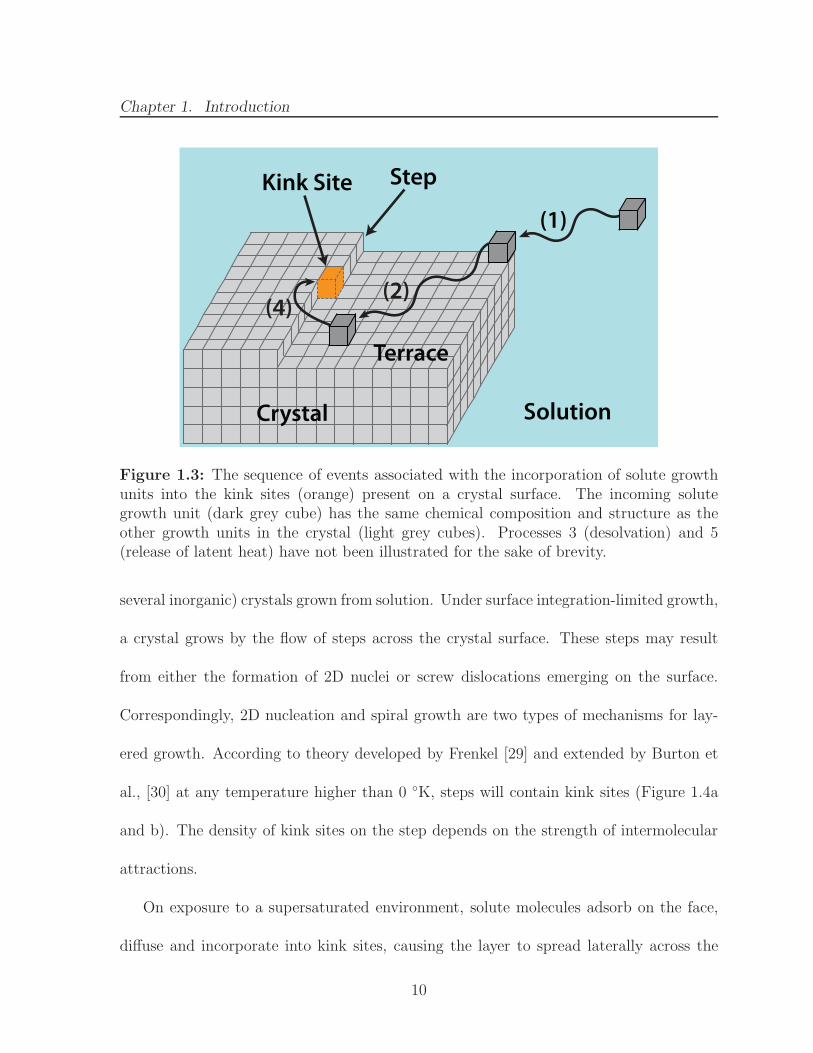
1.3 The sequence of events associated with the incorporation of solute growthunits into the kink sites (orange) present on a crystal surface. The incom-ing solute growth unit (dark grey cube) has the same chemical compositionand structure as the other growth units in the crystal (light grey cubes).Processes 3 (desolvation) and 5 (release of latent heat) have not beenillustrated for the sake of brevity. . . . . . . . . . . . . . . . . . . . . . . 10
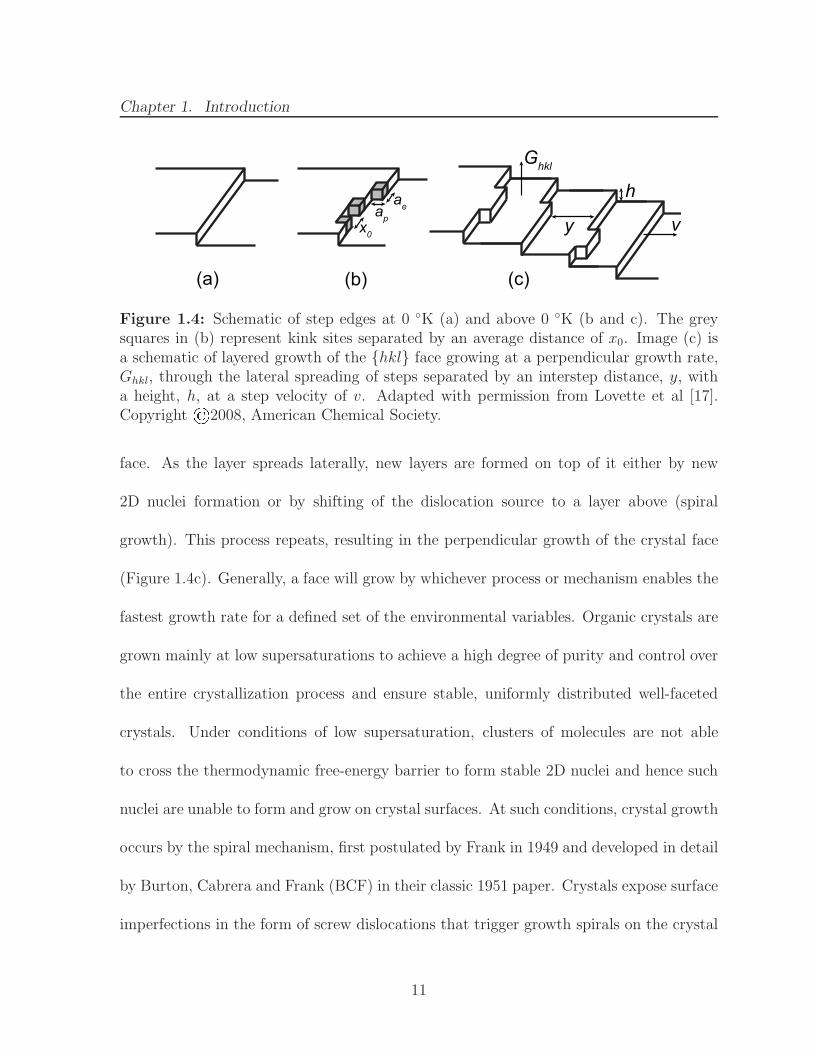
1.4 Schematic of step edges at 0 ◦K (a) and above 0 ◦K (b and c). The greysquares in (b) represent kink sites separated by an average distance of x0.Image (c) is a schematic of layered growth of the {hkl} face growing ata perpendicular growth rate, Ghkl, through the lateral spreading of stepsseparated by an interstep distance, y, with a height, h, at a step velocityof v. Adapted with permission from Lovette et al [17]. Copyright©2008,American Chemical Society. . . . . . . . . . . . . . . . . . . . . . . . . . 11
xiv
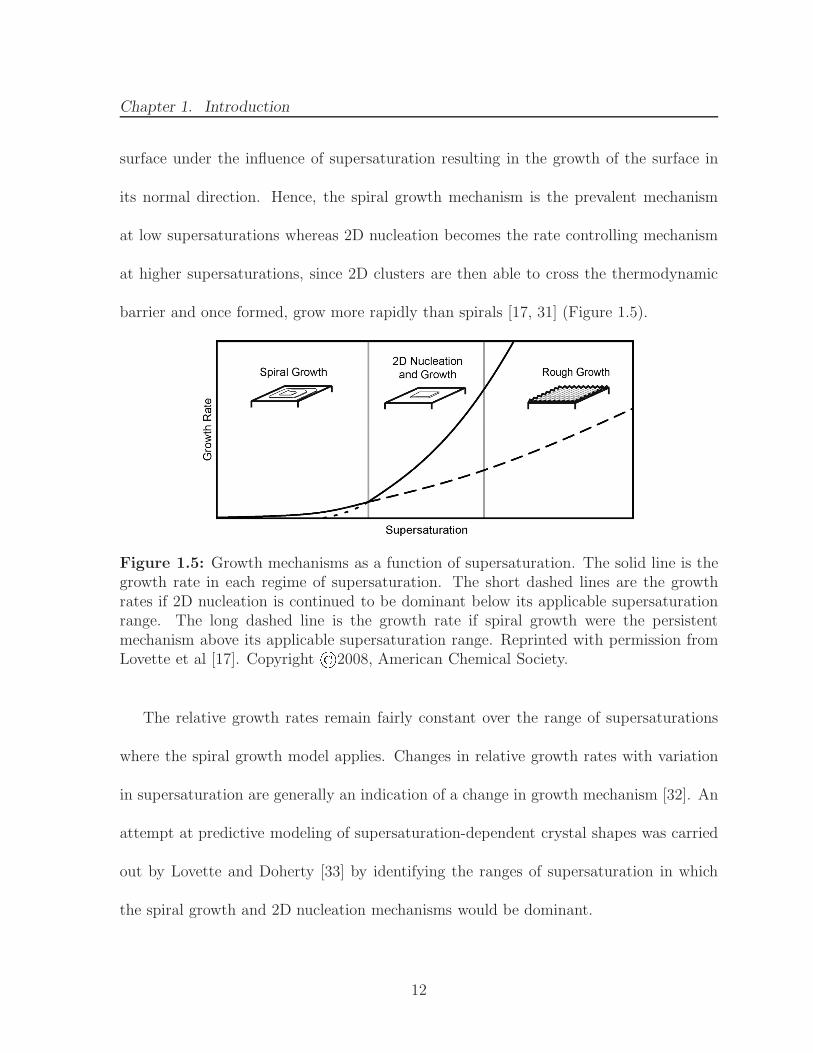
1.5 Growth mechanisms as a function of supersaturation. The solid line isthe growth rate in each regime of supersaturation. The short dashed linesare the growth rates if 2D nucleation is continued to be dominant belowits applicable supersaturation range. The long dashed line is the growthrate if spiral growth were the persistent mechanism above its applicablesupersaturation range. Reprinted with permission from Lovette et al [17].Copyright ©2008, American Chemical Society. . . . . . . . . . . . . . . 12
2.1 A view along the b axis of the barite (BaSO4) unit cell. The brokenblack rectangles show the building unit for PBCs in barite crystals. Thesolid black rectangle shows the edges of the unit cell. Barium atoms arerepresented by green spheres and sulfate growth unit by yellow (S) andred (O) capped sticks. Note that in this view, the fourth oxygen atomof the sulfate group overlaps with one of the other oxygen atoms and istherefore not visible. . . . . . . . . . . . . . . . . . . . . . . . . . . . . . 26
2.2 Crystal packing on the (210) barite surface. The broken black rectanglesform building units and the solid red rectangle shows the step edge alongthe [120] direction. The [120] step edge consists of half of the building unitarrangement while the other half forms part of another step edge parallelto the first one. . . . . . . . . . . . . . . . . . . . . . . . . . . . . . . . . 30
2.3 Calcite unit cell with the Ca atoms (green sphere) and CO3 groups (greyand red capped sticks). The contents of the asymmetric unit of the unitcell are labeled in cyan. . . . . . . . . . . . . . . . . . . . . . . . . . . . . 32
2.4 The two building units (enclosed within the broken black and blue rectan-gles) in calcite crystal and the arrangement of Ca2+ and CO2−
3 ions withineach building unit. The two building units are related to each other by a21 screw axis. . . . . . . . . . . . . . . . . . . . . . . . . . . . . . . . . . 33
2.5 The packing of a calcite unit cell with building units (enclosed withinbroken blue and black ellipses). . . . . . . . . . . . . . . . . . . . . . . . 33
2.6 Crystal packing on the (1014) surface of calcite. The broken black rect-angles form building units and the solid red parallelogram shows the stepedge along the [481] direction. The [481] step edge consists of half of thebuilding unit contents while the other half forms part of another step edgeparallel to the first one. . . . . . . . . . . . . . . . . . . . . . . . . . . . . 34
2.7 Step edges along various PBC directions on the (1014) surface of calcite.The ‘straight’ bond chains [441] and [481] are shown in solid red and bluelines, respectively. The ‘sawtooth’ bond chains [010] and [421] are shownin broken green and broken purple lines, respectively. . . . . . . . . . . . 35
2.8 AFM image of a growth spiral on the (1014) surface of calcite. The imagesize is 3×3µm. Adapted with permission from Davis et al. [29]. Copyright©2004, Mineralogical Society of America. . . . . . . . . . . . . . . . . . 38
xv
2.9 Side view of the [441] edge on the (1014) surface of calcite. The [441]+and [441]− edges have been shown in (a) and (b), respectively, with theangle between the edge and the terrace being obtuse for the former andacute for the latter edge. . . . . . . . . . . . . . . . . . . . . . . . . . . . 39
2.10 A representation of the electrostatic field in the (110) face of rutile (TiO2).The light lines represent the electrostatic field lines and the thick linesshow the zero-flux boundary that partitions space into bond regions.Adapted with permission from Preiser et al. [33]. Copyright ©1999, In-ternational Union of Crystallography. . . . . . . . . . . . . . . . . . . . . 42
2.11 A side view of the (1014) surface of calcite showing the two differentorientations of carbonate groups in the surface layer. The two orientationsare colored black and blue; the oxygen atoms (A, X and B) within eachgroup are also labeled. . . . . . . . . . . . . . . . . . . . . . . . . . . . . 47
2.12 Partition of 3D orthogonal space into octants (white and grey cubes),quadrants (blue squares) and axes (red lines). . . . . . . . . . . . . . . . 52
2.13 Classification of the 13 crystalline partitions around a kink site (whitecube) on the [100] edge of the (001) Kossel crystal surface. The partitionsare colored corresponding to their classification listed in Table 2.8. . . . . 52
2.14 A plan view of the (1014) surface of calcite showing the two orientationsa) E and b) W of Ca kink sites on the [481] obtuse edge. The kink siteCa atoms are enclosed within the red circles. . . . . . . . . . . . . . . . . 57
3.1 A representative rearrangement of a Ca and a CO3 growth unit (withinthe black circle) from a straight [481] edge on (1014) surface of calcite toform four kink sites (red circles). The water molecules surrounding theedge and kink sites have not been shown. . . . . . . . . . . . . . . . . . . 74
3.2 The two orientations (E and W ) of kink sites on the [481] edge on (1014)surface of calcite. . . . . . . . . . . . . . . . . . . . . . . . . . . . . . . . 76
3.3 Representative arrangement of multiple types of kink sites along the edgeof an AB-type ionic crystal surface. There are two types of A (cyan) andB (orange) kink sites each that are repeated by symmetry along the edge.The arrow indicates the direction of the growth of the step. . . . . . . . . 79
3.4 Transition between A and B kink sites based on the attachment or de-tachment of A and B growth units and the fluxes associated with thesetransitions. . . . . . . . . . . . . . . . . . . . . . . . . . . . . . . . . . . 80
3.5 Representative energy landscape during attachment and detachment fromkink sites. The reactant state is the growth unit attached in the kink site.The product state is the unattached kink site and fully solvated growthunit in the solution. k+ and k− are the rate constants for the attachmentand detachment processes, respectively. . . . . . . . . . . . . . . . . . . . 83
xvi
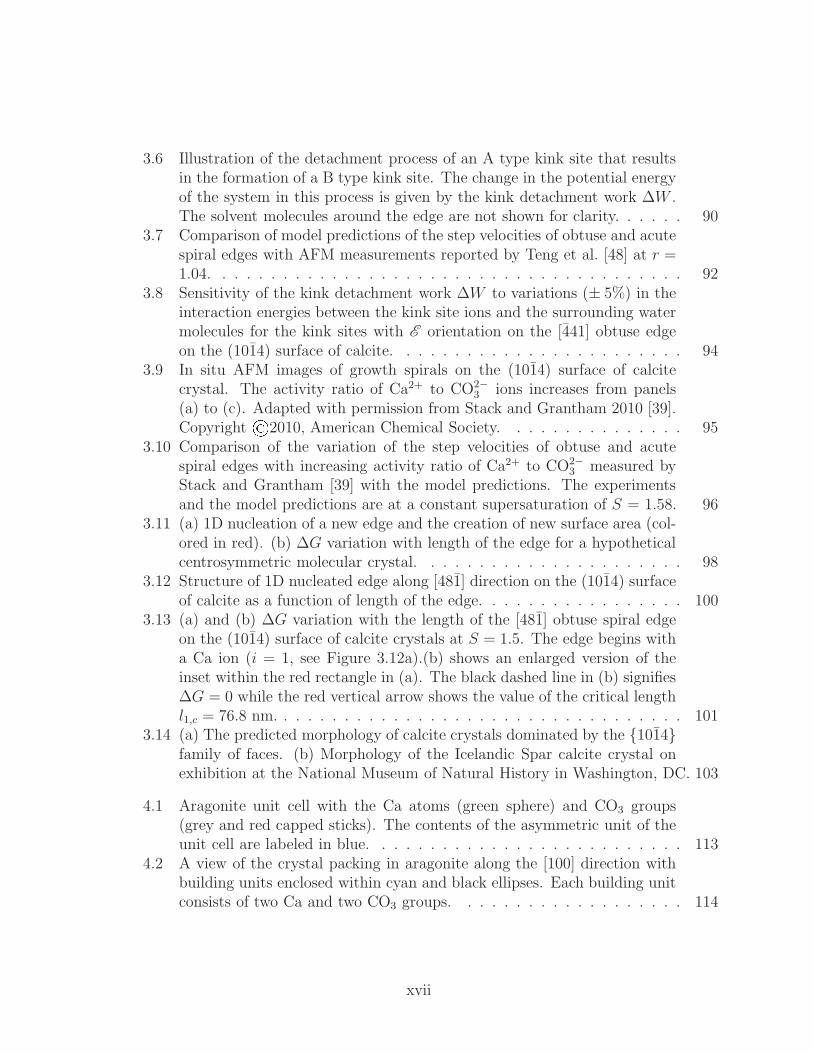
3.6 Illustration of the detachment process of an A type kink site that resultsin the formation of a B type kink site. The change in the potential energyof the system in this process is given by the kink detachment work ∆W .The solvent molecules around the edge are not shown for clarity. . . . . . 90
3.7 Comparison of model predictions of the step velocities of obtuse and acutespiral edges with AFM measurements reported by Teng et al. [48] at r =1.04. . . . . . . . . . . . . . . . . . . . . . . . . . . . . . . . . . . . . . . 92
3.8 Sensitivity of the kink detachment work ∆W to variations (± 5%) in theinteraction energies between the kink site ions and the surrounding watermolecules for the kink sites with E orientation on the [441] obtuse edgeon the (1014) surface of calcite. . . . . . . . . . . . . . . . . . . . . . . . 94
3.9 In situ AFM images of growth spirals on the (1014) surface of calcitecrystal. The activity ratio of Ca2+ to CO2−
3 ions increases from panels(a) to (c). Adapted with permission from Stack and Grantham 2010 [39].Copyright ©2010, American Chemical Society. . . . . . . . . . . . . . . 95
3.10 Comparison of the variation of the step velocities of obtuse and acutespiral edges with increasing activity ratio of Ca2+ to CO2−
3 measured byStack and Grantham [39] with the model predictions. The experimentsand the model predictions are at a constant supersaturation of S = 1.58. 96
3.11 (a) 1D nucleation of a new edge and the creation of new surface area (col-ored in red). (b) ∆G variation with length of the edge for a hypotheticalcentrosymmetric molecular crystal. . . . . . . . . . . . . . . . . . . . . . 98
3.12 Structure of 1D nucleated edge along [481] direction on the (1014) surfaceof calcite as a function of length of the edge. . . . . . . . . . . . . . . . . 100
3.13 (a) and (b) ∆G variation with the length of the [481] obtuse spiral edgeon the (1014) surface of calcite crystals at S = 1.5. The edge begins witha Ca ion (i = 1, see Figure 3.12a).(b) shows an enlarged version of theinset within the red rectangle in (a). The black dashed line in (b) signifies∆G = 0 while the red vertical arrow shows the value of the critical lengthl1,c = 76.8 nm. . . . . . . . . . . . . . . . . . . . . . . . . . . . . . . . . . 101
3.14 (a) The predicted morphology of calcite crystals dominated by the {1014}family of faces. (b) Morphology of the Icelandic Spar calcite crystal onexhibition at the National Museum of Natural History in Washington, DC. 103
4.1 Aragonite unit cell with the Ca atoms (green sphere) and CO3 groups(grey and red capped sticks). The contents of the asymmetric unit of theunit cell are labeled in blue. . . . . . . . . . . . . . . . . . . . . . . . . . 113
4.2 A view of the crystal packing in aragonite along the [100] direction withbuilding units enclosed within cyan and black ellipses. Each building unitconsists of two Ca and two CO3 groups. . . . . . . . . . . . . . . . . . . 114
xvii
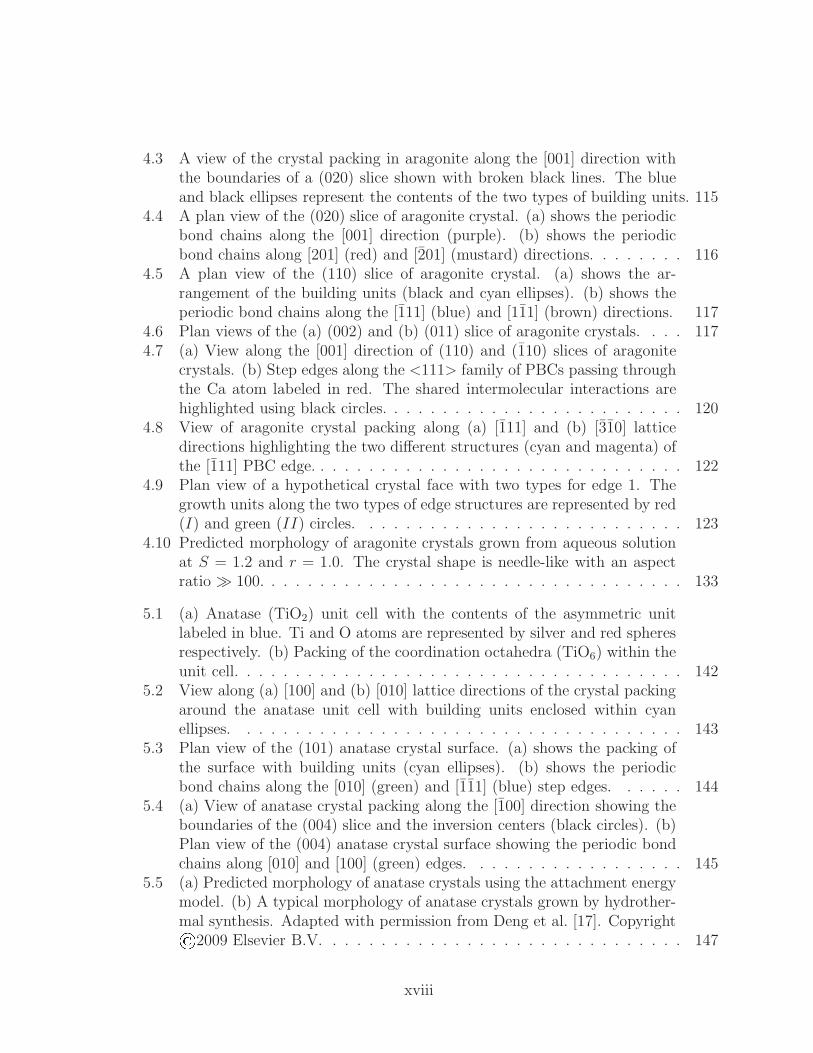
4.3 A view of the crystal packing in aragonite along the [001] direction withthe boundaries of a (020) slice shown with broken black lines. The blueand black ellipses represent the contents of the two types of building units. 115
4.4 A plan view of the (020) slice of aragonite crystal. (a) shows the periodicbond chains along the [001] direction (purple). (b) shows the periodicbond chains along [201] (red) and [201] (mustard) directions. . . . . . . . 116
4.5 A plan view of the (110) slice of aragonite crystal. (a) shows the ar-rangement of the building units (black and cyan ellipses). (b) shows theperiodic bond chains along the [111] (blue) and [111] (brown) directions. 117
4.6 Plan views of the (a) (002) and (b) (011) slice of aragonite crystals. . . . 1174.7 (a) View along the [001] direction of (110) and (110) slices of aragonite
crystals. (b) Step edges along the <111> family of PBCs passing throughthe Ca atom labeled in red. The shared intermolecular interactions arehighlighted using black circles. . . . . . . . . . . . . . . . . . . . . . . . . 120
4.8 View of aragonite crystal packing along (a) [111] and (b) [310] latticedirections highlighting the two different structures (cyan and magenta) ofthe [111] PBC edge. . . . . . . . . . . . . . . . . . . . . . . . . . . . . . . 122
4.9 Plan view of a hypothetical crystal face with two types for edge 1. Thegrowth units along the two types of edge structures are represented by red(I) and green (II) circles. . . . . . . . . . . . . . . . . . . . . . . . . . . 123
4.10 Predicted morphology of aragonite crystals grown from aqueous solutionat S = 1.2 and r = 1.0. The crystal shape is needle-like with an aspectratio ≫ 100. . . . . . . . . . . . . . . . . . . . . . . . . . . . . . . . . . . 133
5.1 (a) Anatase (TiO2) unit cell with the contents of the asymmetric unitlabeled in blue. Ti and O atoms are represented by silver and red spheresrespectively. (b) Packing of the coordination octahedra (TiO6) within theunit cell. . . . . . . . . . . . . . . . . . . . . . . . . . . . . . . . . . . . . 142
5.2 View along (a) [100] and (b) [010] lattice directions of the crystal packingaround the anatase unit cell with building units enclosed within cyanellipses. . . . . . . . . . . . . . . . . . . . . . . . . . . . . . . . . . . . . 143
5.3 Plan view of the (101) anatase crystal surface. (a) shows the packing ofthe surface with building units (cyan ellipses). (b) shows the periodicbond chains along the [010] (green) and [111] (blue) step edges. . . . . . 144
5.4 (a) View of anatase crystal packing along the [100] direction showing theboundaries of the (004) slice and the inversion centers (black circles). (b)Plan view of the (004) anatase crystal surface showing the periodic bondchains along [010] and [100] (green) edges. . . . . . . . . . . . . . . . . . 145
5.5 (a) Predicted morphology of anatase crystals using the attachment energymodel. (b) A typical morphology of anatase crystals grown by hydrother-mal synthesis. Adapted with permission from Deng et al. [17]. Copyright©2009 Elsevier B.V. . . . . . . . . . . . . . . . . . . . . . . . . . . . . . 147
xviii
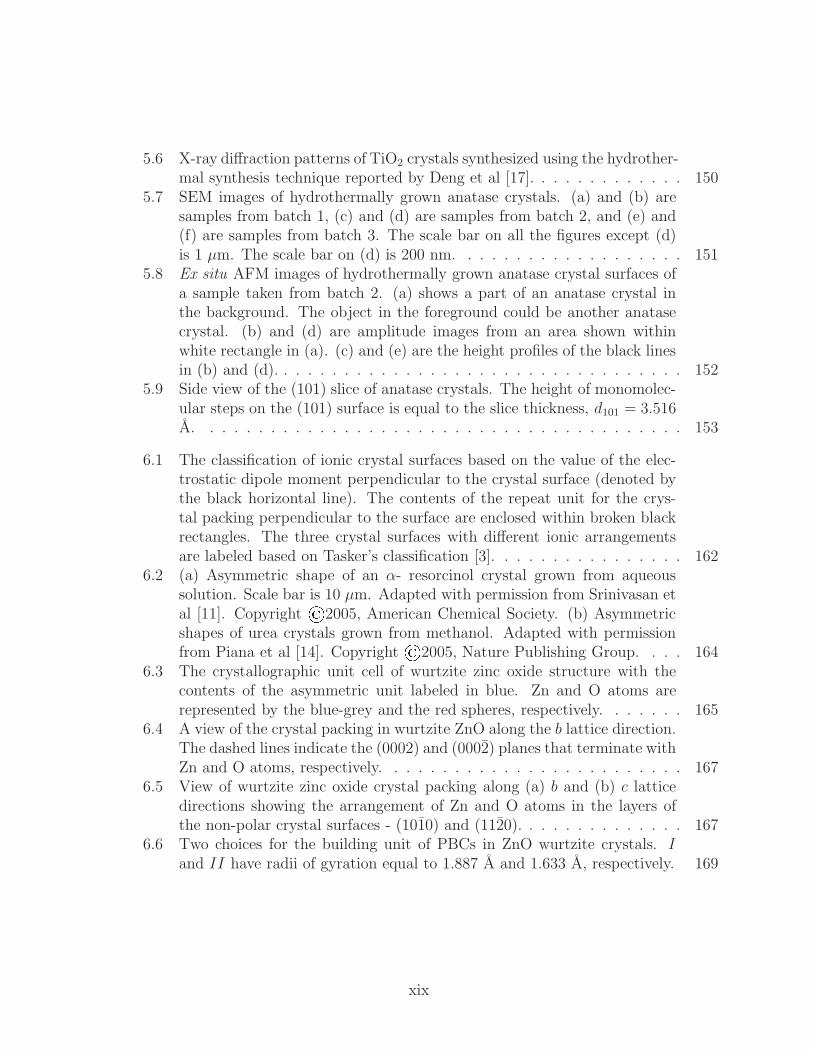
5.6 X-ray diffraction patterns of TiO2 crystals synthesized using the hydrother-mal synthesis technique reported by Deng et al [17]. . . . . . . . . . . . . 150
5.7 SEM images of hydrothermally grown anatase crystals. (a) and (b) aresamples from batch 1, (c) and (d) are samples from batch 2, and (e) and(f) are samples from batch 3. The scale bar on all the figures except (d)is 1 µm. The scale bar on (d) is 200 nm. . . . . . . . . . . . . . . . . . . 151
5.8 Ex situ AFM images of hydrothermally grown anatase crystal surfaces ofa sample taken from batch 2. (a) shows a part of an anatase crystal inthe background. The object in the foreground could be another anatasecrystal. (b) and (d) are amplitude images from an area shown withinwhite rectangle in (a). (c) and (e) are the height profiles of the black linesin (b) and (d). . . . . . . . . . . . . . . . . . . . . . . . . . . . . . . . . . 152
5.9 Side view of the (101) slice of anatase crystals. The height of monomolec-ular steps on the (101) surface is equal to the slice thickness, d101 = 3.516A. . . . . . . . . . . . . . . . . . . . . . . . . . . . . . . . . . . . . . . . 153
6.1 The classification of ionic crystal surfaces based on the value of the elec-trostatic dipole moment perpendicular to the crystal surface (denoted bythe black horizontal line). The contents of the repeat unit for the crys-tal packing perpendicular to the surface are enclosed within broken blackrectangles. The three crystal surfaces with different ionic arrangementsare labeled based on Tasker’s classification [3]. . . . . . . . . . . . . . . . 162
6.2 (a) Asymmetric shape of an α- resorcinol crystal grown from aqueoussolution. Scale bar is 10 µm. Adapted with permission from Srinivasan etal [11]. Copyright ©2005, American Chemical Society. (b) Asymmetricshapes of urea crystals grown from methanol. Adapted with permissionfrom Piana et al [14]. Copyright ©2005, Nature Publishing Group. . . . 164
6.3 The crystallographic unit cell of wurtzite zinc oxide structure with thecontents of the asymmetric unit labeled in blue. Zn and O atoms arerepresented by the blue-grey and the red spheres, respectively. . . . . . . 165
6.4 A view of the crystal packing in wurtzite ZnO along the b lattice direction.The dashed lines indicate the (0002) and (0002) planes that terminate withZn and O atoms, respectively. . . . . . . . . . . . . . . . . . . . . . . . . 167
6.5 View of wurtzite zinc oxide crystal packing along (a) b and (b) c latticedirections showing the arrangement of Zn and O atoms in the layers ofthe non-polar crystal surfaces - (1010) and (1120). . . . . . . . . . . . . . 167
6.6 Two choices for the building unit of PBCs in ZnO wurtzite crystals. Iand II have radii of gyration equal to 1.887 A and 1.633 A, respectively. 169
xix
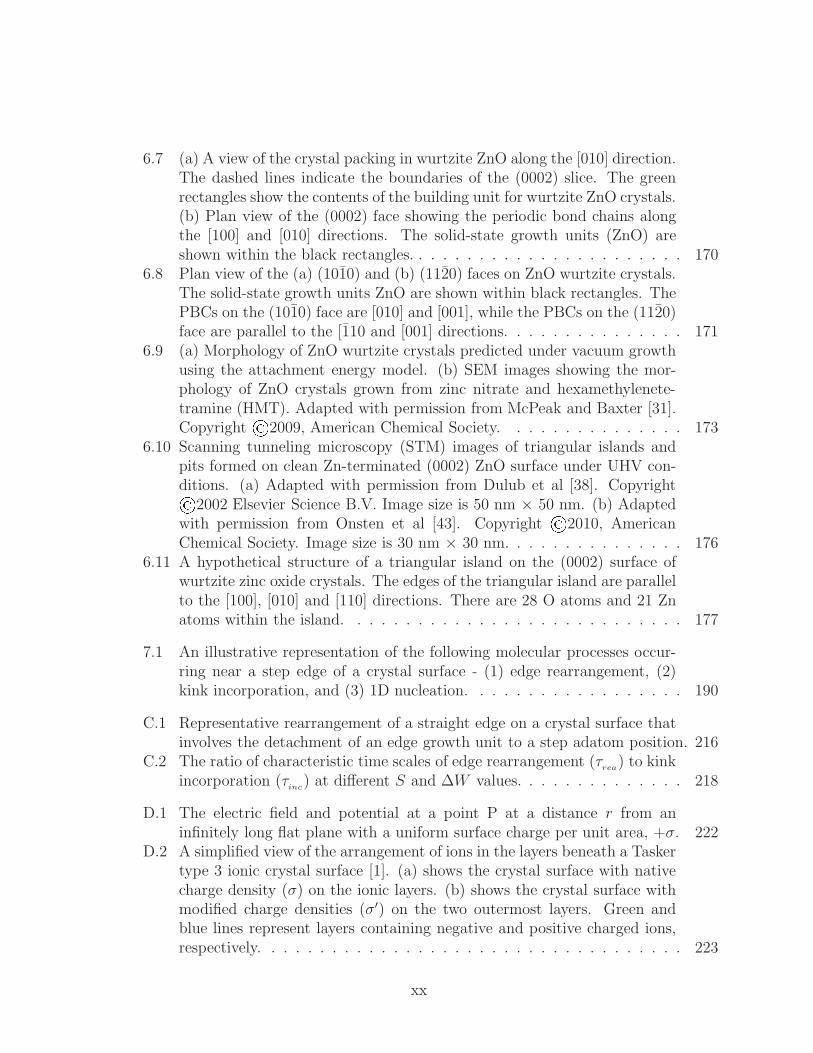
6.7 (a) A view of the crystal packing in wurtzite ZnO along the [010] direction.The dashed lines indicate the boundaries of the (0002) slice. The greenrectangles show the contents of the building unit for wurtzite ZnO crystals.(b) Plan view of the (0002) face showing the periodic bond chains alongthe [100] and [010] directions. The solid-state growth units (ZnO) areshown within the black rectangles. . . . . . . . . . . . . . . . . . . . . . . 170
6.8 Plan view of the (a) (1010) and (b) (1120) faces on ZnO wurtzite crystals.The solid-state growth units ZnO are shown within black rectangles. ThePBCs on the (1010) face are [010] and [001], while the PBCs on the (1120)face are parallel to the [110 and [001] directions. . . . . . . . . . . . . . . 171
6.9 (a) Morphology of ZnO wurtzite crystals predicted under vacuum growthusing the attachment energy model. (b) SEM images showing the mor-phology of ZnO crystals grown from zinc nitrate and hexamethylenete-tramine (HMT). Adapted with permission from McPeak and Baxter [31].Copyright ©2009, American Chemical Society. . . . . . . . . . . . . . . 173
6.10 Scanning tunneling microscopy (STM) images of triangular islands andpits formed on clean Zn-terminated (0002) ZnO surface under UHV con-ditions. (a) Adapted with permission from Dulub et al [38]. Copyright©2002 Elsevier Science B.V. Image size is 50 nm × 50 nm. (b) Adaptedwith permission from Onsten et al [43]. Copyright ©2010, AmericanChemical Society. Image size is 30 nm × 30 nm. . . . . . . . . . . . . . . 176
6.11 A hypothetical structure of a triangular island on the (0002) surface ofwurtzite zinc oxide crystals. The edges of the triangular island are parallelto the [100], [010] and [110] directions. There are 28 O atoms and 21 Znatoms within the island. . . . . . . . . . . . . . . . . . . . . . . . . . . . 177
7.1 An illustrative representation of the following molecular processes occur-ring near a step edge of a crystal surface - (1) edge rearrangement, (2)kink incorporation, and (3) 1D nucleation. . . . . . . . . . . . . . . . . . 190
C.1 Representative rearrangement of a straight edge on a crystal surface thatinvolves the detachment of an edge growth unit to a step adatom position. 216
C.2 The ratio of characteristic time scales of edge rearrangement (τrea) to kinkincorporation (τ
inc) at different S and ∆W values. . . . . . . . . . . . . . 218
D.1 The electric field and potential at a point P at a distance r from aninfinitely long flat plane with a uniform surface charge per unit area, +σ. 222
D.2 A simplified view of the arrangement of ions in the layers beneath a Taskertype 3 ionic crystal surface [1]. (a) shows the crystal surface with nativecharge density (σ) on the ionic layers. (b) shows the crystal surface withmodified charge densities (σ′) on the two outermost layers. Green andblue lines represent layers containing negative and positive charged ions,respectively. . . . . . . . . . . . . . . . . . . . . . . . . . . . . . . . . . . 223
xx
List of Tables
2.1 PBC interaction energies in bulk calcite crystal . . . . . . . . . . . . . . 362.2 Bond valence parameters and bond valences for the atom pairs in bulk
calcite . . . . . . . . . . . . . . . . . . . . . . . . . . . . . . . . . . . . . 452.3 Bond valence parameters and the bond valences for the O-H pairs in liquid
water . . . . . . . . . . . . . . . . . . . . . . . . . . . . . . . . . . . . . . 452.4 Partial charges of the calcium atoms in calcite at different lattice positions 462.5 Partial charges of the atoms of the carbonate growth unit in calcite at
various lattice positions . . . . . . . . . . . . . . . . . . . . . . . . . . . . 472.6 PBC interaction energies (EPBC) in kcal/mol along the spiral edges on
the (1014) surface of calcite crystal in contact with water . . . . . . . . . 482.7 List of octants, quadrants and axes in the 3D orthogonal coordinate sys-
tem with their mathematical notations . . . . . . . . . . . . . . . . . . . 512.8 Classification of the 13 crystalline partitions of space around a kink site
along the [100] edge on the (001) surface of a Kossel crystal . . . . . . . 532.9 Kink site potential energy (Ukink) in kcal/mol for the 32 kink sites on the
(1014) surface of calcite . . . . . . . . . . . . . . . . . . . . . . . . . . . 58
3.1 Density of kink sites (ρ) on the [481] spiral edges of (1014) face of calcite 763.2 Kink detachment work (∆W ) values in kcal/mol for the kink sites on the
[481] spiral edges of a (1014) face of calcite . . . . . . . . . . . . . . . . . 903.3 Critical lengths (lc) in nm of the [481] spiral edges on the (1014) face of
calcite crystals at S = 1.5 . . . . . . . . . . . . . . . . . . . . . . . . . . 101
4.1 Eatt and EPBC values for the F-faces on aragonite crystal surface . . . . 1214.2 The cardinal directions used for space partitioning on aragonite crystal
faces . . . . . . . . . . . . . . . . . . . . . . . . . . . . . . . . . . . . . . 1274.3 ∆W values (in kcal/mol) for the 112 types of kink sites on the spiral edges
of aragonite crystal surfaces . . . . . . . . . . . . . . . . . . . . . . . . . 1304.4 Results of spiral growth calculations on the edges of aragonite crystal
surfaces at S = 1.2, r = 1.0 . . . . . . . . . . . . . . . . . . . . . . . . . 132
xxi
5.1 EPBC values for the F-faces on the anatase crystal surface . . . . . . . . 146
6.1 EPBC values for the periodic bond chains on the ZnO wurtzite crystalsurfaces . . . . . . . . . . . . . . . . . . . . . . . . . . . . . . . . . . . . 173
E.1 Force field parameters for calcite and aragonite crystals [1] . . . . . . . . 227E.2 Force field parameters for anatase crystals [4] . . . . . . . . . . . . . . . 228E.3 Force field parameters for ZnO wurtzite crystals [5] . . . . . . . . . . . . 228
xxii
Chapter 1
Introduction
Reproduced in part with permission from: Dandekar, P.; Kuvadia, Z.B.; Doherty,
M.F. Engineering Crystal Morphology. Annual Reviews of Materials Research, 2013, 43,
359-386.
1.1 Motivation
Crystallization is both a widely observed natural phenomenon and a common indus-
trial process. It pervades several scientific disciplines from geology, atmospheric chem-
istry, marine biology to pharmaceutics, catalysis, electronics, etc. The versatility of
crystallization is evident from its use either as a separation technique to remove cer-
tain undesired crystalline impurities, or its application as a materials synthesis process
for high purity crystalline products. The total value of crystalline solids manufactured
worldwide is several trillion dollars per year. Therefore, systematic improvements in ei-
ther function or processing of these crystalline products have the potential for significant
beneficial impact.
1
Chapter 1. Introduction
The crystallization process and operating parameters govern several fundamental
properties of the resulting crystalline materials including chemical purity profile, poly-
morphic state, crystal size and shape distributions, etc. Crystal shape or morphology
significantly influences the end-use efficacy of solid products (e.g., bioavailability for
pharmaceutical compounds [1], reactivity for catalysts [2]), as well as the downstream
performance of the entire process (e.g., by affecting filtering and drying times [1]).
The desired morphology of a crystalline material is strongly dependent on its appli-
cation. A particular crystal shape may be desirable in one industrial process and may
be completely undesired in another. For example, nanowires or needle-like shaped ZnO
crystals significantly increase the absorption efficiency of dye-sensitized solar cells [3],
whereas needles of any crystalline active pharmaceutical product (API) are troublesome
in downstream processing [1] and should be avoided [4]. In other applications, the pre-
ferred shape is based upon a desired or undesired crystal face. For example, the {100}
family of faces of Ag nanocrystals exhibit higher catalytic activity for ethylene epox-
idation reactions than the {111} family [5], which is the more prominent face on the
equilibrium morphology [6].
Several design parameters such as the choice of solvent, temperature, pH, additives
or growth modifiers, etc., may govern the crystallization process and the end use perfor-
mance of the crystalline product. As a result, the experimental design space is very large,
so trial-and-error approaches may not be efficient for synthesis of crystalline materials
with desired functionality. To meet the challenge of scientifically engineering the shape
2
Chapter 1. Introduction
of crystalline solids, there have been significant theoretical efforts undertaken in recent
decades to model the growth process and to understand the underlying crystal growth
mechanisms. This doctoral dissertation was undertaken to understand the growth pro-
cess of inorganic crystals and to provide a predictive framework for designing inorganic
crystalline solid particles.
1.2 Background
In some situations, crystals will achieve their equilibrium shape (although this is
much less common than one might imagine). The equilibrium criteria for the shape of
interfaces dividing solid and fluid phases were first developed by Gibbs [7]. He showed
that the equilibrium shape of a solid crystal would be such that the total surface energy,
∑
i γiAi, be a minimum for a fixed crystal volume, where Ai is the area of face i and γi is
the surface energy per unit area of face i. Wulff later developed a geometric approach for
determining the shapes of faceted crystals (at constant temperature and pressure) with
anisotropic surface free energies that conforms to the criterion of Gibbs. This is known
as the Wulff construction [8, 9]. The Wulff construction is determined by connecting
the end points of vectors, each having a specific magnitude Hi and a common origin, to
planes that are perpendicular to each vector. The magnitude, Hi, is proportional to the
corresponding surface free energy, γi of the respective surface; thus the Wulff construction
3
Chapter 1. Introduction
has the form [10, 11]
γ1H1
=γ2H2
= · · · = γiHi
= · · · = γNHN
(1.1)
where N is the number of faces on the crystal surface. This equation is valid only at
equilibrium and defines the Gibbs-Wulff shape of the crystal. However, Gibbs had the
following footnoted remark about his equilibrium condition, “On the whole it seems
not improbable that the form of very minute crystals in equilibrium with solvents is
principally determined by the condition that (∑
i γiAi) shall be a minimum for the volume
of the crystal, but as they grow larger (in a solvent no more supersaturated than is
necessary to make them grow at all), the deposition of new matter on the different
surfaces will be determined more by the orientation of the surfaces and less by their size
and relations to the surrounding surfaces. As a final result, a large crystal, will generally
be bounded by those surfaces alone on which the deposit of new matter takes place least
readily. But the relative development of the different kinds of sides will not be such as
to make (∑
i γiAi) a minimum.” (Gibbs, Collected Works [7], pp. 325-326). In other
words, Gibbs expected that crystal surfaces would be dominated by the slow growing
faces and that the shapes of the resulting crystals would be their “growth shapes” not
their equilibrium shapes. It took until approximately 1960 to discover the corresponding
conditions for determining the growth shapes of crystals (Equation 1.2).
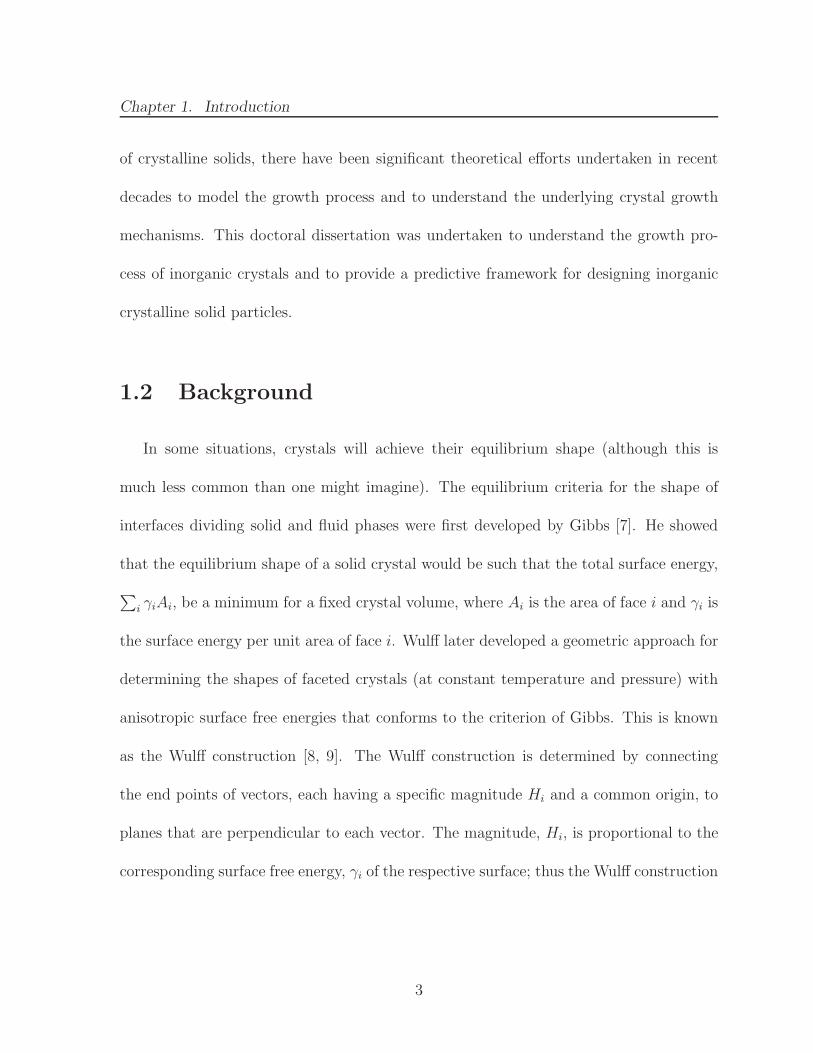
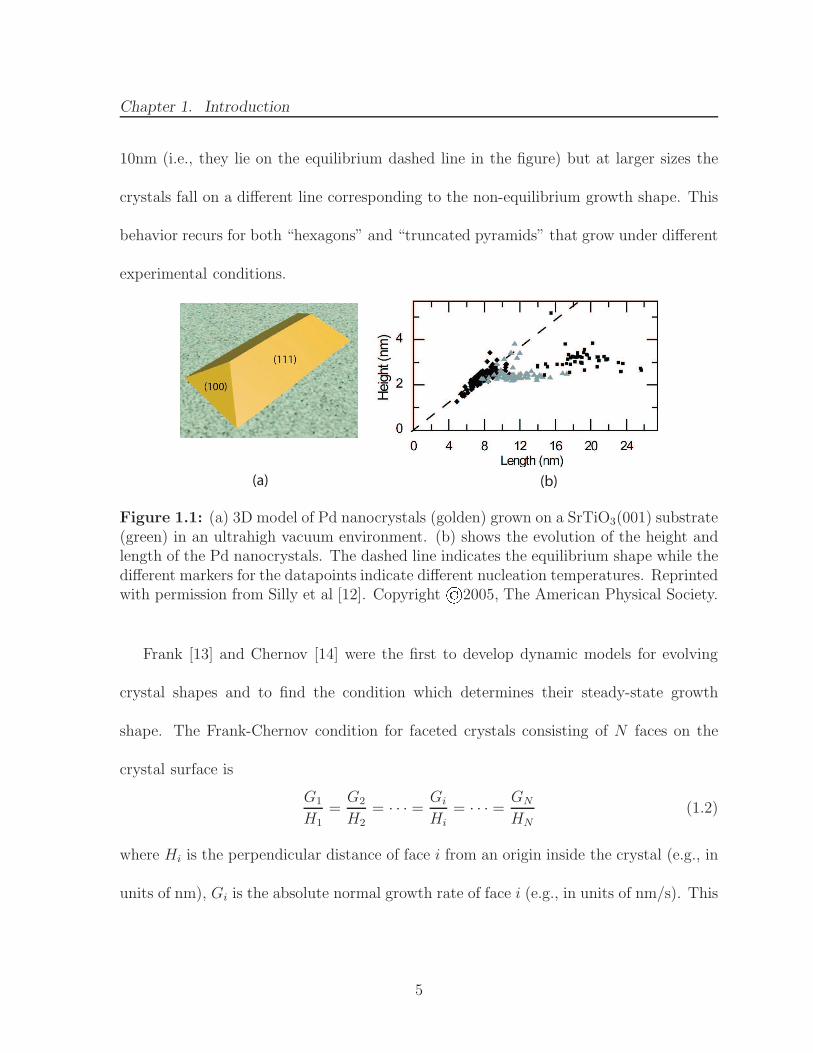
An impressive demonstration of Gibbs’ speculation was published by Silly et al. [12]
and is shown in Figure 1.1. The “hut-like” nanocrystals of palladium were grown on a
SrTiO3(001) substrate and achieved their equilibrium shape at sizes below approximately
4
Chapter 1. Introduction
10nm (i.e., they lie on the equilibrium dashed line in the figure) but at larger sizes the
crystals fall on a different line corresponding to the non-equilibrium growth shape. This
behavior recurs for both “hexagons” and “truncated pyramids” that grow under different
experimental conditions.
(a) (b)
Figure 1.1: (a) 3D model of Pd nanocrystals (golden) grown on a SrTiO3(001) substrate(green) in an ultrahigh vacuum environment. (b) shows the evolution of the height andlength of the Pd nanocrystals. The dashed line indicates the equilibrium shape while thedifferent markers for the datapoints indicate different nucleation temperatures. Reprintedwith permission from Silly et al [12]. Copyright©2005, The American Physical Society.
Frank [13] and Chernov [14] were the first to develop dynamic models for evolving
crystal shapes and to find the condition which determines their steady-state growth
shape. The Frank-Chernov condition for faceted crystals consisting of N faces on the
crystal surface is
G1
H1=
G2
H2= · · · = Gi
Hi= · · · = GN
HN(1.2)
where Hi is the perpendicular distance of face i from an origin inside the crystal (e.g., in
units of nm), Gi is the absolute normal growth rate of face i (e.g., in units of nm/s). This
5
Chapter 1. Introduction
is similar to the Wulff construction for equilibrium shapes but with the specific surface
energy (γ) of the face replaced by its normal growth rate (G).
Under growth conditions (e.g., positive supersaturation, usually measured in terms of
the chemical potential driving force represented by ∆µ > 0, where ∆µ is the difference
between the chemical potentials of the growth medium and the solute crystal) most
crystals spontaneously grow as faceted particles [15, 16]. Although the size of a growing
crystal does depend on the absolute values of the growth rate (G), the steady-state shape
of a growing crystal is determined only by the relative growth rates of the faces exposed
on the crystal surface. This is demonstrated by a simple rearrangement of Equation 1.2
as follows
R1
x1=
R2
x2= · · · = Ri
xi= · · · = RN−1
xN−1= 1 (1.3)
where Ri is the growth rate of face i relative to a reference face, Ri = Gi/Gref . Similarly,
xi is the perpendicular distance of face i from an origin normalized with the perpendicular
distance of the reference face from the origin, xi = Hi/Href . In Equation 1.3, face N is
assumed to be the reference face. In crystal growth models, the slowest growing face is
usually chosen as the reference face so that Rref = 1 and the other faces have a relative
growth rate ≥ 1.
The Frank-Chernov condition validates Gibbs’ assertion that the surface structure
of large crystals is dominated by the slow growing planes and that faster moving faces
“grow out” of the crystal surface and are not present on the steady-state growth shape.
6
Chapter 1. Introduction
Figure 1.2 shows the computed shape evolution of an ibuprofen crystal grown in aqueous
solution from a spherical seed to its final faceted steady-state shape.
(c)
(ξ = 0.15)
(d)
(ξ → ∞)200 µm
(experimental)
(e)(b)
(ξ = 0.025)
(100)
(002)
(011)
(a)
(ξ = 0, seed)
(100)
(011)
(002)
(100)(011)
(002) (002)
(011)(100)
Figure 1.2: Predicted shape evolution of ibuprofen from a spherical seed (a-d) (∆ξ =0.025) and experimental steady-state shape (e). Parts (a-d) not drawn to scale. Reprintedwith permission from Lovette et al [17]. Copyright ©2008, American Chemical Society.
Most of the faces disappear during the shape evolution because they grow too fast
relative to their neighbors. Once the steady-state shape is achieved the crystal continues
to grow and increase its size with a self-similar shape. The slow growing planes are
normally the crystal faces with low values of the Miller indices and these are the ones
that most commonly appear on crystal surfaces. In contrast, under dissolution conditions
(e.g., undersaturation, ∆µ < 0) faces that dissolve faster are more prominent on the
crystal surface, and these tend to be the high Miller index faces. The faces exposed on
the surface of a growing crystal will be different than those on a dissolving crystal and
thus they will have different shapes. Additional shapes can be engineered by placing the
crystal in a thermal cycling environment whereby in one part of the cycle the crystal
grows and in the next it partially dissolves [18, 19].
The first approaches for predicting the growth rate of crystal faces were based ex-
clusively on the structure and interactions within the crystal. Bravais [20] proposed a
quantitative relationship for predicting crystal growth rates, based on crystal structure,
7
Chapter 1. Introduction
supported by the later observations of Friedel [21]. The Bravais relationship is given as
Ghkl ∝1
dhkl(1.4)
where Ghkl and dhkl are the perpendicular growth rate and interplanar spacing, respec-
tively, of the face specified by the Miller index hkl. This model (which is referred to as
the Bravais-Friedel-Donnay-Harker or BFDH model [22]) is the most easily implemented
method for shape prediction because it requires only knowledge of the crystallography of
the solid.
A different approach from the BFDH model was the attachment energy model, devel-
oped by Hartman and Perdok [23, 24], and Hartman and Bennema [25], who took into
account the energetics of crystal interactions in addition to the crystal geometry. They
assumed that the time needed for the formation of a bond decreases with increasing bond
energy. Defining the attachment energy, Eatthkl, as “the bond energy released when one
building unit is attached to the surface of a crystal face,” this assumption leads to the
perpendicular growth rate of a crystal face increasing with increased attachment energy,
Ghkl ∝ Eatthkl (1.5)
These early models did not attempt to capture the exact microscopic mechanism of
growth, but instead tried to construct the shape by relating growth rates of faces to
either the structure or the energy of the crystal. As a result they often fail to give
reliable predictions. However, these models have been widely used in the literature
and still persist in modified and improved forms. The effect of the solvent on crystal
8
Chapter 1. Introduction
growth is accounted by a modified attachment energy model [26–28] that uses molecular
simulations to calculate an effective Eatthkl that includes the solid-solvent interactions on
the (hkl) crystal surface.
In order to account for growth behavior of crystals in different solvents, at various
supersaturations and in the presence of additives/imposters, it becomes essential to em-
brace high fidelity mechanistic models that are devised on sound microscopic principles
and as a result are more reliable and accurate.
1.3 Mechanistic Growth Models
Mechanistic growth models predict growth rates for crystal faces by kinetic consider-
ations of the sequence of events by which growth units incorporate into crystal lattices.
During growth of a crystal face from solution the following processes occur (Figure 1.3):
(1) Solute molecules are transported from the bulk solution towards the face by convec-
tion and diffusion (bulk transport).
(2) Solute molecules diffuse on the terrace of the crystal surface (surface diffusion).
(3) Solute molecules and kink sites shed their surrounding solvent molecules (desolvate).
(4) Solute molecules incorporate into kink sites (surface integration).
(5) The latent heat of crystallization is released and transported to the crystal and solu-
tion.
Surface integration of solute molecules onto the surface is the rate limiting step com-
pared to diffusion or bulk transport mechanisms for almost all molecular organic (and
9
Chapter 1. Introduction
Kink Site Step
Terrace
Solution
(1)
(2)(4)
Crystal
Figure 1.3: The sequence of events associated with the incorporation of solute growthunits into the kink sites (orange) present on a crystal surface. The incoming solutegrowth unit (dark grey cube) has the same chemical composition and structure as theother growth units in the crystal (light grey cubes). Processes 3 (desolvation) and 5(release of latent heat) have not been illustrated for the sake of brevity.
several inorganic) crystals grown from solution. Under surface integration-limited growth,
a crystal grows by the flow of steps across the crystal surface. These steps may result
from either the formation of 2D nuclei or screw dislocations emerging on the surface.
Correspondingly, 2D nucleation and spiral growth are two types of mechanisms for lay-
ered growth. According to theory developed by Frenkel [29] and extended by Burton et
al., [30] at any temperature higher than 0 ◦K, steps will contain kink sites (Figure 1.4a
and b). The density of kink sites on the step depends on the strength of intermolecular
attractions.
On exposure to a supersaturated environment, solute molecules adsorb on the face,
diffuse and incorporate into kink sites, causing the layer to spread laterally across the
10
Chapter 1. Introduction
Ghkl
y
h
va
p
ae
x0
(a) (b) (c)
Figure 1.4: Schematic of step edges at 0 ◦K (a) and above 0 ◦K (b and c). The greysquares in (b) represent kink sites separated by an average distance of x0. Image (c) isa schematic of layered growth of the {hkl} face growing at a perpendicular growth rate,Ghkl, through the lateral spreading of steps separated by an interstep distance, y, witha height, h, at a step velocity of v. Adapted with permission from Lovette et al [17].Copyright ©2008, American Chemical Society.
face. As the layer spreads laterally, new layers are formed on top of it either by new
2D nuclei formation or by shifting of the dislocation source to a layer above (spiral
growth). This process repeats, resulting in the perpendicular growth of the crystal face
(Figure 1.4c). Generally, a face will grow by whichever process or mechanism enables the
fastest growth rate for a defined set of the environmental variables. Organic crystals are
grown mainly at low supersaturations to achieve a high degree of purity and control over
the entire crystallization process and ensure stable, uniformly distributed well-faceted
crystals. Under conditions of low supersaturation, clusters of molecules are not able
to cross the thermodynamic free-energy barrier to form stable 2D nuclei and hence such
nuclei are unable to form and grow on crystal surfaces. At such conditions, crystal growth
occurs by the spiral mechanism, first postulated by Frank in 1949 and developed in detail
by Burton, Cabrera and Frank (BCF) in their classic 1951 paper. Crystals expose surface
imperfections in the form of screw dislocations that trigger growth spirals on the crystal
11
Chapter 1. Introduction
surface under the influence of supersaturation resulting in the growth of the surface in
its normal direction. Hence, the spiral growth mechanism is the prevalent mechanism
at low supersaturations whereas 2D nucleation becomes the rate controlling mechanism
at higher supersaturations, since 2D clusters are then able to cross the thermodynamic
barrier and once formed, grow more rapidly than spirals [17, 31] (Figure 1.5).
Figure 1.5: Growth mechanisms as a function of supersaturation. The solid line is thegrowth rate in each regime of supersaturation. The short dashed lines are the growthrates if 2D nucleation is continued to be dominant below its applicable supersaturationrange. The long dashed line is the growth rate if spiral growth were the persistentmechanism above its applicable supersaturation range. Reprinted with permission fromLovette et al [17]. Copyright ©2008, American Chemical Society.
The relative growth rates remain fairly constant over the range of supersaturations
where the spiral growth model applies. Changes in relative growth rates with variation
in supersaturation are generally an indication of a change in growth mechanism [32]. An
attempt at predictive modeling of supersaturation-dependent crystal shapes was carried
out by Lovette and Doherty [33] by identifying the ranges of supersaturation in which
the spiral growth and 2D nucleation mechanisms would be dominant.
12
Chapter 1. Introduction
According to the BCF model, the growth rate of a crystal face that is growing by the
spiral mechanism can be expressed as
G =hv
y(1.6)
where h is the height of the step, v is the step velocity and y is the interstep distance on
the particular face (Figure 1.4c). The BCF model describes the step fronts or edges that
form spirals as being composed of multiple kink sites, which are the favorable sites for the
incorporation of solute growth units, based on the bonding structure that they expose
to the incoming solute growth units from the solution. The step velocity is dependent
on the number density of kink sites on each step, which in turn is a function of the the
work required to form the kink sites from a straight step (this quantity is also known
as the kink energy). The step height is simply given by geometry (a factor or multiple
of interplanar spacing) whereas the interstep distance, y, is a function of energetics
and supersaturation. It has been established beyond doubt in the literature by several
theories and experiments that a step edge i begins to flow outwards, due to incorporation
of growth units into kink sites, with a constant step velocity vionly when a spiral edge
reaches a critical length li,c. This critical length depends on the energetic interactions
within the edge itself and on supersaturation. When the spiral side i moves, it exposes a
new edge i+1 which will start moving in its normal direction when it reaches its critical
length. The supplementary section of Rimer et al. [34] contains a video capture of an
actual growth spiral of L-cystine that can serve as a basic visualization of this growth
phenomenon.
13
Chapter 1. Introduction
Several notable modifications and extensions of the BCF model such as the work by
Chernov [35], and by the Doherty group [36] attempt to mechanistically predict crystal
morphologies. The traditional approach of assuming a Kossel crystal lattice, a simple
cubic lattice with all equal bonds, made it applicable to centrosymmetric molecules only.
Non-centrosymmetric molecules form complex intermolecular bonding structures which
pose a set of unique challenges such as multiple types of growth units and kink types
resulting in a non-isotropic driving force on edges in different directions. For about five
decades after the BCF model was published, the step velocity was always assumed to be
only a function of the number density of kink sites. In the last fifteen years, there have
been several important developments in the field of non-Kossel crystal growth. Zhang
and Nancollas worked on the step movement on the surface of AB-type ionic crystals [37].
For the first time they introduced the concept of kink rate to account for the non-isotropic
driving force and reasoned that the step velocity must be directly proportional to the
kink rate in addition to the kink density. Kink rate is the net rate of incorporation of
solute growth units into different types of kink sites on a particular edge [32, 35] and
is an essential calculation for acentric growth units. Chernov et al [38, 39] also derived
expressions for the step velocity of non-Kossel crystals, mainly addressing the surface
physics and extended the concept to a system with three types of kink sites in series.
Recently, Kuvadia and Doherty [32] developed a master equation that can be solved to
yield kink rate for any number of kink sites in series, thus extending the concept to all
organic molecular crystals.
14
Chapter 1. Introduction
Another key concept useful to understand crystal growth of real-complexity systems
is the theory of stable and unstable edges [32]. The non-centric nature of the bonding on
a crystal surface often results in a combination of stable and unstable edges. The concept
of unstable edges in some PBC directions also explains the asymmetric growth spirals
on surfaces that are a characteristic of non-centrosymmetric growth units. The layers
of unstable edges lead to a modified kink rate expression as described in the Kuvadia
and Doherty model. The entire approach gave excellent agreement of predicted crystal
shapes with experimental shapes for systems of real complexity such as paracetamol and
lovastatin.
1.4 Dissertation Outline
The remaining chapters of this dissertation provide a mechanistic framework for mod-
eling inorganic crystallization processes, and demonstrate how the understanding of the
solid-state interactions and the growth mechanism can be used to predict and modify
crystal shapes. The chapters of this dissertation were written separately and each chap-
ter can be approached on its own. However, if read together this dissertation aims to
provide a contiguous story demonstrating the various causalities present in ionic crystal
growth from solution.
In an attempt to introduce the concepts discussed throughout this dissertation in a
tractable manner, Chapter 2 provides a new method to model the solid-state interac-
tions of inorganic crystal growth. In Chapter 3, a spiral growth model is proposed that
15
Chapter 1. Introduction
utilizes the calculation of solid-solid and solid-solvent interaction energies that govern
the kinetics of surface integration-limited growth. Together, these two chapters provide
a first-principles methodology that can be applied to study crystal growth and predict
the steady-state morphology of solution grown inorganic crystals. These concepts were
applied to study the growth of calcite (CaCO3) crystals grown in an aqueous solution.
Aragonite is a metastable polymorph of calcium carbonate with lower lattice sym-
metry than calcite. Chapter 4 discusses a special case of the space partitioning method
developed in Chapter 2 for the calculation of kink site energetics of aragonite crystals.
The mechanistic concepts covered in Chapters 2 and 3 are used to predict the steady-state
morphology of aragonite crystals grown from water.
Several inorganic crystals such as CaCO3, BaSO4, KH2PO4, etc. are grown from
aqueous solution at room temperatures. However, many industrially relevant inorganic
crystals such as TiO2, ZnO, SiO2 (quartz), etc. have poor solubility in water at room
temperature. Hydrothermal processes are commonly used synthesis techniques for crystal
growth of such inorganic crystals. Chapter 5 presents both experimental and theoret-
ical efforts undertaken to study hydrothermal synthesis of anatase (TiO2). Chapter 6
discusses growth and stabilization of ZnO wurtzite, which is a polar crystal structure.
The mechanism(s) responsible for the stabilization of polar crystal surfaces have not
completely revealed their mystery yet.
Finally, Chapter 7 summarizes this dissertation and provides insights into relevant
avenues for future research.
16
Bibliography
[1] N. Variankaval, A. S. Cote, and M. F. Doherty. From form to function: Crystalliza-tion of active pharmaceutical ingredients. AIChE J., 54:1682–1688, 2008.
[2] H. G. Yang, C. H. Sun, S. Z. Qiao, J. Zou, G. Liu, S. C. Smith, H. M. Cheng, andG. Q. Lu. Anatase TiO2 single crystals with a large percentage of reactive facets.Nature, 453:638–641, 2008.
[3] M. Law, L. E. Greene, J. C. Johnson, R. Saykally, and P. Yang. Nanowire dye-sensitized solar cells. Nat. Mater., 4:455–459, 2005.
[4] M. A. Lovette and M. F. Doherty. Needle-shaped crystals: Causality and solventselection guidance based on periodic bond chains. Cryst. Growth Des., 13:3341–3352,2013.
[5] P. Christopher and S. Linic. Shape- and size-specific chemistry of Ag nanostructuresin catalytic ethylene epoxidation. ChemCatChem, 2:78–83, 2010.
[6] Y. Xia, Y. Xiong, B. Lim, and S. E. Skrabalak. Shape-controlled synthesis of metalnanocrystals: Simple chemistry meets complex physics? Angew. Chem. Int. Ed.,48:60–103, 2009.
[7] J. W. Gibbs. The Collected Works of J. Willard Gibbs. New Haven: Yale UniversityPress, 1957.
[8] G. Wulff. Zur frage der geschwindigkeit des wachsthums und der auflosung derkrystallflachen. Z. Kristallogr., 34:449, 1901.
[9] C. Herring. Some theorems on the free energies of crystal surfaces. Phys. Rev.,82:87–93, 1951.
[10] B. Mutaftschiev. Handbook of Crystal Growth, 1a Fundamentals–Thermodynamicsand Kinetics, chapter Nucleation Theory, pages 187–247. Amsterdam: North-Holland, 1993.
[11] R. Kern. Morphology of Crystals: Part A, chapter The Equilibrium Form of aCrystal, pages 77–206. Tokyo: Terra Scientific Publishing Company, 1987.
17
Bibliography
[12] F. Silly, A. C. Powell, M. G. Martin, and M. R. Castell. Growth shapes of supportedPd nanocrystals on SrTiO3(001). Phys. Rev. B, 72:165403, 2005.
[13] F. C. Frank. Growth and Perfection of Crystals, chapter On the Kinematic Theoryof Crystal Growth and Dissolution Processes, pages 411–419. New York: Wiley,1958.
[14] A. A. Chernov. The kinetics of the growth forms of crystals. Sov. Phys. Cryst.,7:728–730, 1963.
[15] G. Liu, K. Chen, H. Zhou, J. Tian, C. Pereira, and J. M. F. Ferreira. Fast shapeevolution of tin microcrystals in combustion synthesis. Cryst. Growth Des., 6:2404–2411, 2006.
[16] K. Jackson, D. Uhlmann, and J. Hunt. On the nature of crystal growth from themelt. J. Cryst. Growth, 1:1 – 36, 1967.
[17] M. A. Lovette, A. R. Browning, D. W. Griffin, J. P. Sizemore, R. C. Snyder, andM. F. Doherty. Crystal shape engineering. Ind. Eng. Chem. Res., 47:9812–9833,2008.
[18] R. C. Snyder and M. F. Doherty. Faceted crystal shape evolution during dissolutionor growth. AIChE J., 53:1337–1348, 2007.
[19] M. A. Lovette, M. Muratore, and M. F. Doherty. Crystal shape modification throughcycles of dissolution and growth: Attainable regions and experimental validation.AIChE J., 58:1465–1474, 2012.
[20] A. Bravais. Etudes Crystallographiques. Paris: Gauthier-Villars, 1866.
[21] M. G. Friedel. Etudes sur la loi de Bravais. Bull. Soc. Franc. Miner., 9:326, 1907.
[22] J. D. H. Donnay and D. Harker. A new law of crystal morphology extending thelaw of bravais. Amer. Min., 22:446, 1937.
[23] P. Hartman and W. G. Perdok. On the relations between structure and morphologyof crystals. I. Acta Crystallogr., 8:49–52, 1955.
[24] P. Hartman and W. G. Perdok. On the relations between structure and morphologyof crystals. II. Acta Crystallogr., 8:521–524, 1955.
[25] P. Hartman and P. Bennema. The attachment energy as a habit controlling factor: I. Theoretical considerations. J. Cryst. Growth, 49:145–156, 1980.
[26] J. J. Lu and J. Ulrich. An improved prediction model of morphological modificationsof organic crystals induced by additives. Cryst. Res. Technol., 38:63–73, 2003.
18
Bibliography
[27] R. B. Hammond, K. Pencheva, V. Ramachandran, and K. J. Roberts. Application ofgrid-based molecular methods for modeling solvent-dependent crystal growth mor-phology: Aspirin crystallized from aqueous ethanolic solution. Cryst. Growth Des.,7:1571–1574, 2007.
[28] J. Chen and B. L. Trout. Computer-aided solvent selection for improving the mor-phology of needle-like crystals: A case study of 2,6-dihydroxybenzoic acid. Cryst.Growth Des., 10:4379–4388, 2010.
[29] J. Frenkel. On the surface motion of particles in crystals and the natural roughnessof crystalline faces. J. Phys. U.S.S.R., 9:392, 1945.
[30] W. K. Burton, N. Cabrera, and F. C. Frank. The growth of crystals and the equi-librium structure of their surfaces. Phil. Trans. Roy. Soc. A, 243:299–358, 1951.
[31] M. Ohara and R. C. Reid. Modeling Crystal Growth Rates from Solution. NewJersey: Prentice-Hall, Inc., 1973.
[32] Z. B. Kuvadia and M. F. Doherty. Spiral growth model for faceted crystals ofnon-centrosymmetric organic molecules grown from solution. Cryst. Growth Des.,11:2780–2802, 2011.
[33] M. A. Lovette and M. F. Doherty. Predictive modeling of supersaturation-dependentcrystal shapes. Cryst. Growth Des., 12:656–669, 2012.
[34] J. D. Rimer, Z. An, Z. Zhu, M. H. Lee, D. S. Goldfarb, J. A. Wesson, and M. D.Ward. Crystal Growth Inhibitors for the Prevention of L-Cystine Kidney StonesThrough Molecular Design. Science, 330:337–341, 2010.
[35] A. A. Chernov. Modern Crystallography III. Crystal Growth. Berlin: Springer-Verlag, 1984.
[36] R. C. Snyder and M. F. Doherty. Predicting crystal growth by spiral motion. Proc.R. Soc. A, 465:1145–1171, 2009.
[37] J. Zhang and G. H. Nancollas. Kink density and rate of step movement duringgrowth and dissolution of an AB crystal in a nonstoichiometric solution. J. ColloidInterface Sci., 200:131 – 145, 1998.
[38] A. Chernov, L. Rashkovich, and P. Vekilov. Steps in solution growth: dynamics ofkinks, bunching and turbulence. J. Cryst. Growth, 275:1–18, 2005.
[39] L. Rashkovich, E. Petrova, T. Chernevich, O. Shustin, and A. Chernov. Non-kosselcrystals: Calcium and magnesium oxalates. Crystallogr. Rep., 50:S78–S81, 2005.
19
Chapter 2
Solid-State Interactions in InorganicCrystals
Reproduced in part with permission from: Dandekar, P.; Doherty, M.F. AMechanistic
Growth Model for Inorganic Crystals: Solid-State Interactions. AIChE Journal, 2014,
(in press).
2.1 Introduction
The steady-state morphology achieved by a growing crystal depends on the growth
kinetics of all the crystal faces [1, 2]. When the surface integration of growth units is
rate limiting, the crystal grows by the flow of steps across its surface. The growth units
attach into special sites, knows as kink sites, along these steps. A kink site on the crystal
surface is defined as the lattice position of a growth unit in which it is surrounded by
exactly half of the solid-state neighbors as in the bulk crystal (also known as the half-
crystal position) [3]. The rate of crystal growth is fundamentally linked to the work done
in adding a growth unit into the kink site [4]. Therefore, the solid-state interactions in
20
Chapter 2. Solid-State Interactions in Inorganic Crystals
the crystal must be studied in detail to create a mechanistic growth model for inorganic
crystals.
Inorganic crystals are often composed of highly electropositive and electronegative
atoms, so the solid-state intermolecular interactions are dominated by the electrostatic
interactions. Normally, the long-range electrostatic interactions within ionic crystals are
accounted for by using the Madelung constant, which is the ratio of the overall electro-
static interaction energy inside the bulk crystal relative to the nearest-neighbor electro-
static interaction energy [5, 6]. However, this approach only captures the interactions
in the bulk solid and does not consider the variation in the electronic structure at the
growth surfaces. The goal here is to develop an engineering model suitable for product
and process design that combines the concepts of bulk electrostatic interactions developed
by Madelung [5] and Ewald [6] with the effect of the surface structure on the electronic
properties of surface atoms of inorganic crystals. The partial charges of atoms in the bulk
crystal differ from those on the surface and both differ from the classical valence charge
or oxidation state. Quantum mechanical calculations and density functional theory can
be used to calculate accurately the partial charges of bulk atoms as well as the surface
atoms but it is impractical to perform these calculations on every face of every inorganic
crystal. We find that for crystal growth models, the alternative approach provided by
the bond valence model [7, 8] delivers sufficiently accurate values of the partial charges
of atoms on inorganic crystal surfaces without the need for electron density calculations.
21
Chapter 2. Solid-State Interactions in Inorganic Crystals
This chapter presents a general method to identify the lattice directions along the
strongest intermolecular interactions within inorganic crystals. Identifying these direc-
tions, also known as periodic bond chain (PBC) vectors [9], is key to predicting the
structure of the step edges and the shapes of growth spirals formed on crystal surfaces.
The PBC directions on the cleavage plane of the calcite polymorph of calcium carbon-
ate are identified, and the asymmetric shape of the growth spiral is attributed to the
asymmetric structure of the step edges on the (1014) calcite surface. The classical bond
valence theory based on Pauling’s rules for ionic bonding [10] is applied here to calcu-
late the partial charges of surface ions as a function of their atomic surroundings. The
potential energies of growth units situated in the kink sites along the edges of growth
spirals can be calculated for inorganic crystals using a space partitioning method. This
method, when applied to the kink sites on the (1014) surface of calcite crystals, shows
the quantitative basis for the asymmetry of the growth spirals and paves the way for a
general mechanistic growth model to predict the crystal growth rates and morphologies
of inorganic solids, including those with technological importance.
2.2 Periodic Bond Chains (PBCs) in Inorganic Crys-
tals
Hartman and Perdok [9] proposed the concept of periodic bond chains (PBCs) as the
key link between the solid-state interactions and the kinetics of crystal growth. PBCs are
22
Chapter 2. Solid-State Interactions in Inorganic Crystals
chains of strong intermolecular interactions between growth units along a lattice direction
which is called the PBC vector. These strong interactions are formed between the growth
units (molecules/ions) during the crystallization process and therefore exclude any intra-
growth-unit interactions. According to Hartman and Perdok [9, 11], periodic bond chains
must satisfy certain rules as listed below
1. A periodic bond chain must consist of uninterrupted chains of strong intermolecular
interactions so that the crystal would grow in the direction of the PBC.
2. There must be a fundamental arrangement of growth units within the chain, also
known as the structural period of the PBC, that is repeated by lattice translations
along the PBC vector to obtain the entire periodic bond chain.
3. An intermolecular interaction between a pair of growth units cannot be shared by
two PBCs in the same face of a crystal. An interaction may be shared between two
PBCs that are not within the same crystal face.
4. The arrangement of growth units along a PBC direction must have the same stoi-
chiometry as the overall stoichiometry of the crystal.
5. For non-polar crystal structures (wherein the net dipole moment of the crystallo-
graphic unit cell is zero), the component of the electrostatic dipole moment per-
pendicular to the PBC vector must be zero.
The perpendicular dipole moment property can be related to the stability of non-
polar crystal surfaces. Tasker proposed a stability criterion for ionic crystal surfaces
23
Chapter 2. Solid-State Interactions in Inorganic Crystals
based on the absence of a dipole moment perpendicular to the surface [12]. Since a
stable surface layer contains two or more PBCs, a net dipole moment perpendicular to
the PBC vector results in a nonzero dipole moment perpendicular to the surface and will
therefore destabilize the surface. Therefore, Tasker’s criterion and the PBC property are
self-consistent.
If there is a polar axis present in the unit cell, all the periodic bond chains in the
crystal may have a net perpendicular dipole moment that is parallel to the polar axis
direction. The surfaces of such crystals undergo reconstruction to stabilize the dipole
moment perpendicular to the surface and the growth mechanisms of these polar surfaces
are still debated [13, 14]. However, the growth of polar crystals is not considered in this
chapter.
2.2.1 Building Unit of the PBC
A systematic method to identify the PBCs in inorganic crystals must enforce the
Hartman-Perdok rules discussed above, including the stoichiometry and perpendicular
dipole moment properties. Inorganic crystals consist of ions as the growth units that
are individually non-stoichiometric. Therefore, the PBCs must consist of stoichiometric
groups of ions that are repeated throughout the crystal. We use the concept of a building
unit of the PBC that has been used earlier for studying the PBCs in calcite (CaCO3)
[15, 16]. The building unit of a PBC is defined as a stoichiometric arrangement of ions
such that its rotation and translation along the PBC vector direction will yield the entire
24
Chapter 2. Solid-State Interactions in Inorganic Crystals
bond chain. Thus, the dipole moment of the building unit must be zero if a single building
unit has to yield all the PBCs in the crystal while satisfying the perpendicular dipole
moment property for each individual PBC.
The building unit of a PBC must not be confused with the growth unit, the asym-
metric unit, or the crystallographic unit cell. The growth unit is the solute species that
is present in the growth environment (solution, vapor, etc.) and attaches into the kink
sites on the crystal surface. A growth unit may be a molecule (e.g., for a paracetamol
crystal), ion (e.g., for a calcium carbonate crystal) or a dimer (e.g., for an α-glycine
crystal). Therefore, a growth unit may not always be stoichiometric. A building unit
is the fundamental unit of the PBCs in inorganic crystals and will typically consist of
multiple growth units. Figure 2.1 shows the arrangement of Ba2+ and SO2−4 growth units
within the building unit, as well as in the crystallographic unit cell of barite (BaSO4).
The building unit for barite consists of two barium and two sulfate growth units and has
zero dipole moment. The unit cell consists of four barium and four sulfate growth units
while the asymmetric unit consists of one Ba, one S and three O atoms [17]. The con-
ventional notation for the ionic growth units with their oxidation states as superscripts
is written here with the understanding that these may not be the actual partial charges
of these ions. The calculation of the actual partial charges on the ionic growth units will
be discussed in the next section.
There may be several combinations of atoms (or ions) within a crystal structure that
satisfy the stoichiometry and zero dipole moment properties. A set of guidelines are listed
25
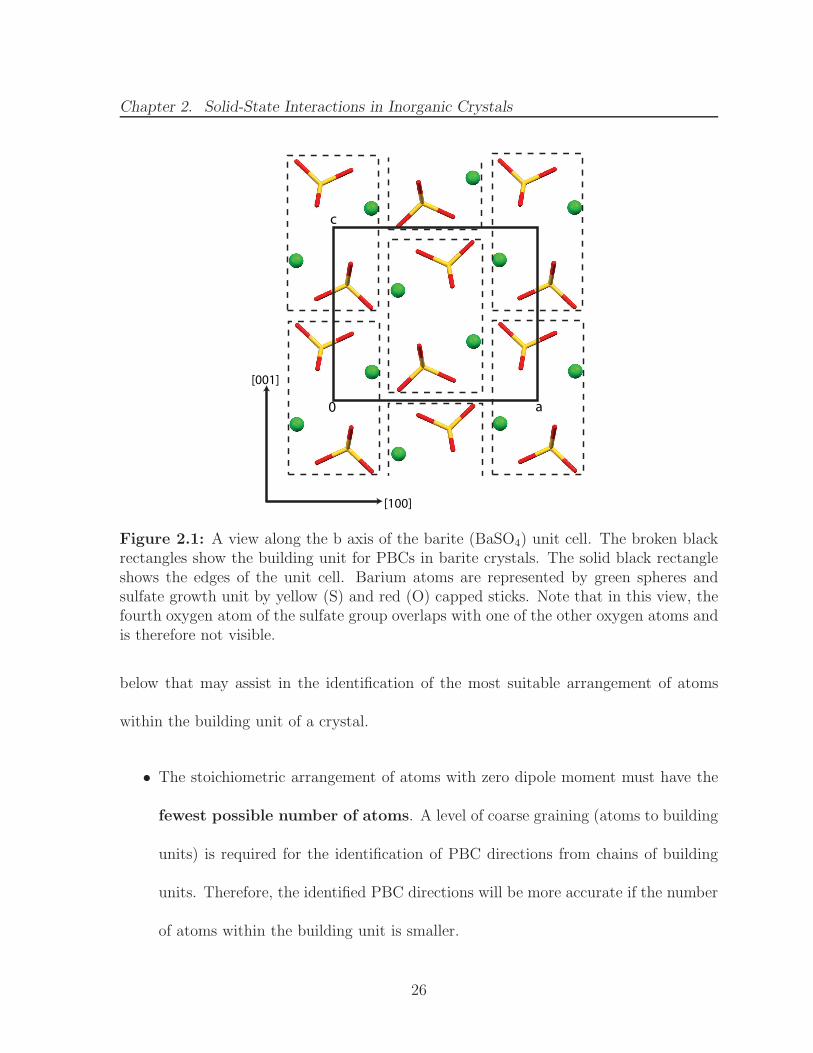
Chapter 2. Solid-State Interactions in Inorganic Crystals
[001]
0 a
c
[100]
Figure 2.1: A view along the b axis of the barite (BaSO4) unit cell. The broken blackrectangles show the building unit for PBCs in barite crystals. The solid black rectangleshows the edges of the unit cell. Barium atoms are represented by green spheres andsulfate growth unit by yellow (S) and red (O) capped sticks. Note that in this view, thefourth oxygen atom of the sulfate group overlaps with one of the other oxygen atoms andis therefore not visible.
below that may assist in the identification of the most suitable arrangement of atoms
within the building unit of a crystal.
• The stoichiometric arrangement of atoms with zero dipole moment must have the
fewest possible number of atoms. A level of coarse graining (atoms to building
units) is required for the identification of PBC directions from chains of building
units. Therefore, the identified PBC directions will be more accurate if the number
of atoms within the building unit is smaller.
26

Chapter 2. Solid-State Interactions in Inorganic Crystals
• Among all the candidate building units with same number of atoms, a building
unit with the smallest size or length is preferred. This follows from the same
argument about coarse graining. Radius of gyration may be a convenient measure
of the typical length scale of a building unit.
• All possible building units that are not related to each other by the symmetry
operators allowed within a particular space group are called independent building
units. Two building units (A and B) are symmetrically dependent if there exists a
symmetry operator (that belongs to the list of all allowed symmetry operators in
that space group), such that applying this operator on every atom within building
unit A yields the corresponding atom within building unit B. If no such symmetry
operation relates building units A and B, they are called independent building
units.
• The contents of the asymmetric unit of the space group can provide a useful check
for symmetry dependence between building units. The asymmetric unit is defined
as the set of atoms within the unit cell such that the application of all the symmetry
operators on these atoms yields all the other atoms within the unit cell. If all the
atoms within the asymmetric unit are contained inside a single building unit, then
by definition of the asymmetric unit, the lattice symmetry operators can be applied
on this particular building unit to obtain all other building units. Therefore, there
is only one independent building unit within the crystal structure.
27
Chapter 2. Solid-State Interactions in Inorganic Crystals
Once all the independent building units are identified based on the aforementioned
properties, the symmetry operators of the unit cell are used to pack the crystal with
building units. Uninterrupted chains joining these building units can be identified as the
PBC directions. Since the building unit is stoichiometric and has a zero dipole moment,
the PBCs thus formed will satisfy the Hartman-Perdok rules.
2.2.2 Step Edges from Building Units and PBCs
From a crystal growth perspective, the PBCs are important because the steps of
a growth spiral or 2D nucleus on the crystal surface are parallel to the PBC vectors.
Knowledge of all the PBC directions on any crystal surface will give the directions of the
edges of a growth spiral and help predict its shape. The building unit and its arrangement
along a PBC vector must eventually identify the structure of the step edges parallel to
that PBC vector.
A step edge is the fundamental feature of a growth step on a crystal surface. Above
absolute zero temperature, a straight step edge constantly rearranges under thermal
fluctuations to a more favorable configuration such that there is always a finite density of
kink sites along the step edge. A growth step moves by the incorporation of growth units
into these kink sites present along the edge. Thus, the thickness of a step edge in the
growth direction depends on the dimensions of the kink site which is usually 1 growth
unit in thickness.
28
Chapter 2. Solid-State Interactions in Inorganic Crystals
The arrangement of building units along the PBC direction may not give the exact
step edge structure since the building unit usually consists of more than one growth
unit. For example, Figure 2.2 shows that the arrangement of the building units along
the [120] direction on the (210) surface of barite does not give the structure of the actual
step edge that grows in the [001] direction. The arrangement of all the building units
along a specific PBC direction must be decomposed into individual growth units and an
arrangement of growth units along this specific PBC direction must be identified such
that three conditions are satisfied - the resulting arrangement must (a) be stoichiometric,
(b) have zero dipole moment perpendicular to the specific PBC vector and (c) have
dimensions ∼ 1 growth unit thickness in the direction of the step motion. Figure 2.2
shows that the step edge structure along the [120] edge can be constructed from half
of the contents of the arrangement of the building units along the [120] direction. A
similar decomposition of the arrangement of the building units must be done for every
PBC direction to correctly identify the structure of the step edge. In some cases, this
decomposition can be more complicated as the exact step edge structure may be formed
out of chains of building units along two different PBC directions. This will be shown
later in the chapter for the step edges on calcite surfaces.
Once the structure of the step edges along all the PBC directions is identified, the
interaction energy along these edges is calculated to obtain the energy required to create
kink sites from a straight step edge [18]. Electrostatic interactions dominate the lattice
energy of inorganic crystals so the contribution of the long-range interactions in the PBC
29
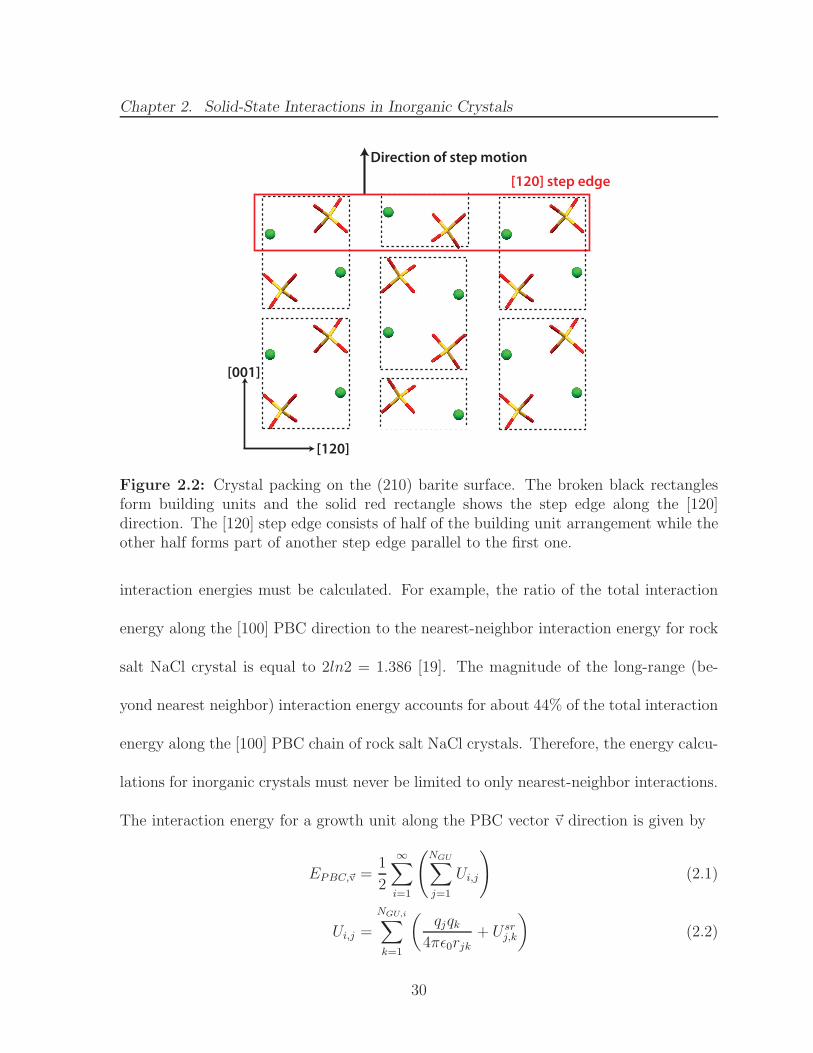
Chapter 2. Solid-State Interactions in Inorganic Crystals
Direction of step motion
[120] step edge
[120]
[001]
Figure 2.2: Crystal packing on the (210) barite surface. The broken black rectanglesform building units and the solid red rectangle shows the step edge along the [120]direction. The [120] step edge consists of half of the building unit arrangement while theother half forms part of another step edge parallel to the first one.
interaction energies must be calculated. For example, the ratio of the total interaction
energy along the [100] PBC direction to the nearest-neighbor interaction energy for rock
salt NaCl crystal is equal to 2ln2 = 1.386 [19]. The magnitude of the long-range (be-
yond nearest neighbor) interaction energy accounts for about 44% of the total interaction
energy along the [100] PBC chain of rock salt NaCl crystals. Therefore, the energy calcu-
lations for inorganic crystals must never be limited to only nearest-neighbor interactions.
The interaction energy for a growth unit along the PBC vector ~v direction is given by
EPBC,~v =1
2
∞∑
i=1
(
NGU∑
j=1
Ui,j
)
(2.1)
Ui,j =
NGU,i∑
k=1
(
qjqk4πǫ0rjk
+ Usrj,k
)
(2.2)
30
Chapter 2. Solid-State Interactions in Inorganic Crystals
where NGU is the number of atoms in the central growth unit, NGU,i is the number of
atoms in the growth unit i along the PBC vector ~v. Usr is the short-range interaction
energy. A Buckingham potential is used to model the short-range interactions for most
inorganic crystals [20, 21].
The framework developed here for identifying the building units, PBC directions and
step edge structures is completely general and can be applied to any inorganic crystal.
The model requires the crystallographic unit cell data, the partial charges on the atoms of
each growth unit in the bulk solid (obtained from quantum mechanical calculations), and
a suitable short-range intermolecular force field as inputs to identify the PBC directions
in the crystal and calculate the interaction energy EPBC along each PBC vector. We
discuss the PBCs on calcite (CaCO3) as an example in the following sections.
2.2.3 PBCs in Bulk Calcite
At ambient conditions, calcite is the most stable polymorph of crystalline calcium
carbonate. It is ubiquitous in nature in the form of sedimentary and metamorphic rocks,
cave formations, shells of marine organisms, etc. Crystal growth of calcite has been of
special interest from a biomineralization perspective [22]. Pure calcite crystals occur
in rhombohedral shape dominated by the {1014} family of cleavage planes [23]. Calcite
crystallizes in theR3c space group in the trigonal crystal system. The unit cell parameters
for calcite are a = b = 4.988 A, c = 17.061 A, α = β = 90◦, γ = 120◦ [24]. Figure 2.3
shows the calcite unit cell with the arrangement of the Ca and CO3 groups. The atoms
31
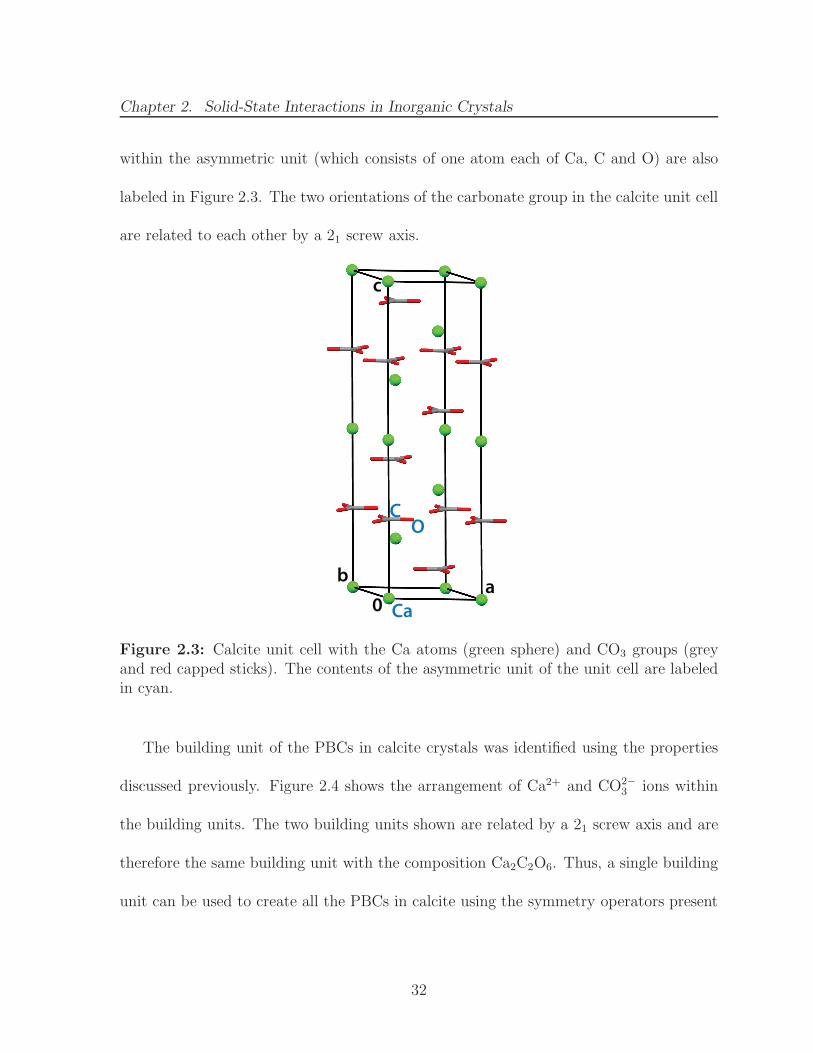
Chapter 2. Solid-State Interactions in Inorganic Crystals
within the asymmetric unit (which consists of one atom each of Ca, C and O) are also
labeled in Figure 2.3. The two orientations of the carbonate group in the calcite unit cell
are related to each other by a 21 screw axis.
ab
c
Ca
CO
0
Figure 2.3: Calcite unit cell with the Ca atoms (green sphere) and CO3 groups (greyand red capped sticks). The contents of the asymmetric unit of the unit cell are labeledin cyan.
The building unit of the PBCs in calcite crystals was identified using the properties
discussed previously. Figure 2.4 shows the arrangement of Ca2+ and CO2−3 ions within
the building units. The two building units shown are related by a 21 screw axis and are
therefore the same building unit with the composition Ca2C2O6. Thus, a single building
unit can be used to create all the PBCs in calcite using the symmetry operators present
32
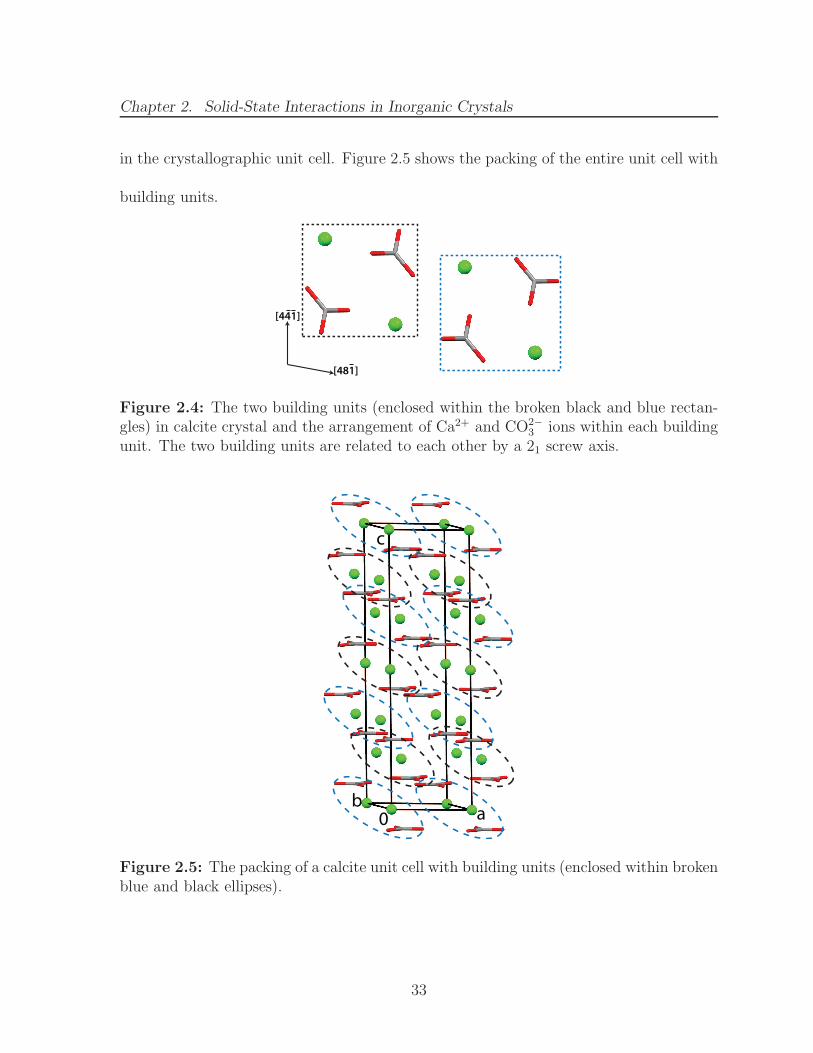
Chapter 2. Solid-State Interactions in Inorganic Crystals
in the crystallographic unit cell. Figure 2.5 shows the packing of the entire unit cell with
building units.
[441]
[481]
Figure 2.4: The two building units (enclosed within the broken black and blue rectan-gles) in calcite crystal and the arrangement of Ca2+ and CO2−
3 ions within each buildingunit. The two building units are related to each other by a 21 screw axis.
0b
a
c
Figure 2.5: The packing of a calcite unit cell with building units (enclosed within brokenblue and black ellipses).
33
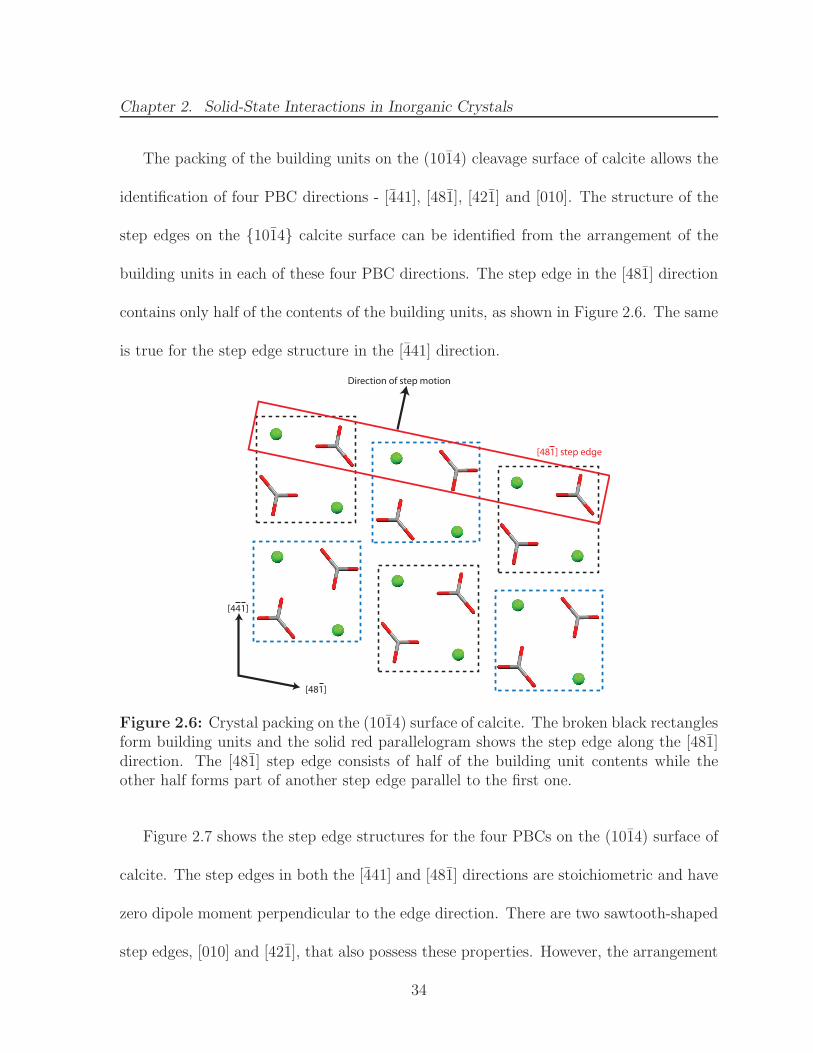
Chapter 2. Solid-State Interactions in Inorganic Crystals
The packing of the building units on the (1014) cleavage surface of calcite allows the
identification of four PBC directions - [441], [481], [421] and [010]. The structure of the
step edges on the {1014} calcite surface can be identified from the arrangement of the
building units in each of these four PBC directions. The step edge in the [481] direction
contains only half of the contents of the building units, as shown in Figure 2.6. The same
is true for the step edge structure in the [441] direction.
[481] step edge
[481]
[441]
Direction of step motion
Figure 2.6: Crystal packing on the (1014) surface of calcite. The broken black rectanglesform building units and the solid red parallelogram shows the step edge along the [481]direction. The [481] step edge consists of half of the building unit contents while theother half forms part of another step edge parallel to the first one.
Figure 2.7 shows the step edge structures for the four PBCs on the (1014) surface of
calcite. The step edges in both the [441] and [481] directions are stoichiometric and have
zero dipole moment perpendicular to the edge direction. There are two sawtooth-shaped
step edges, [010] and [421], that also possess these properties. However, the arrangement
34
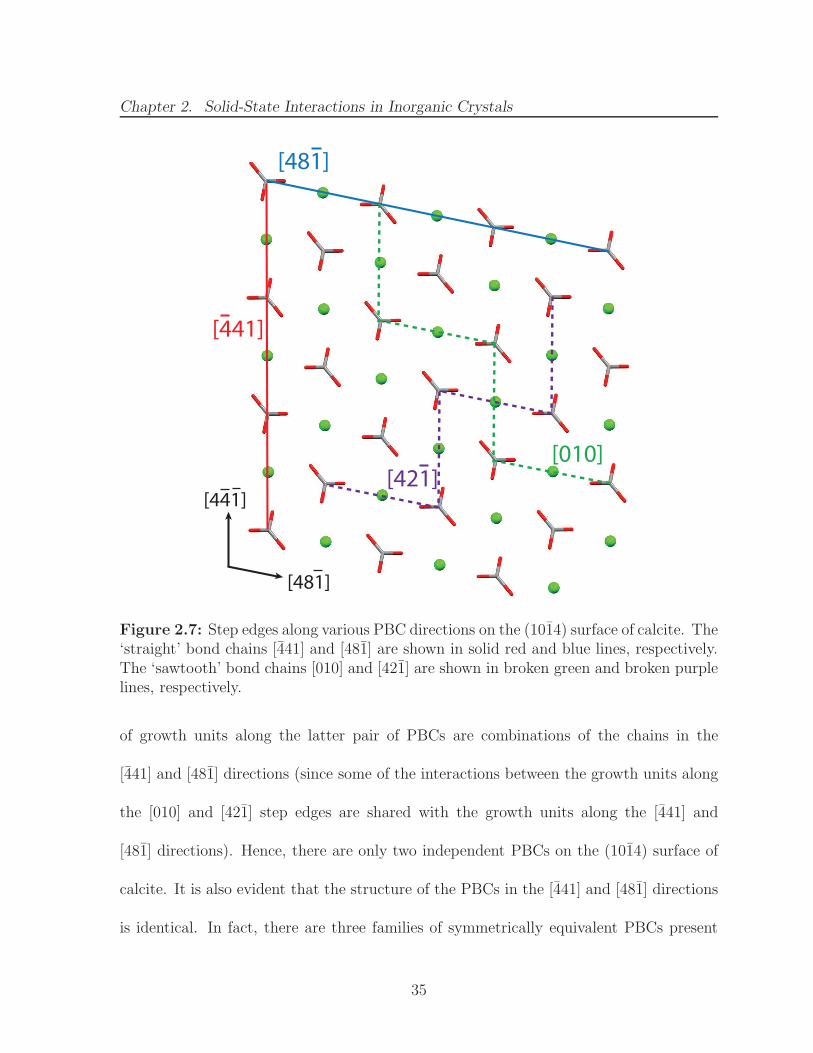
Chapter 2. Solid-State Interactions in Inorganic Crystals
[481]
[441]
[481]
[441]
[010][421]
Figure 2.7: Step edges along various PBC directions on the (1014) surface of calcite. The‘straight’ bond chains [441] and [481] are shown in solid red and blue lines, respectively.The ‘sawtooth’ bond chains [010] and [421] are shown in broken green and broken purplelines, respectively.
of growth units along the latter pair of PBCs are combinations of the chains in the
[441] and [481] directions (since some of the interactions between the growth units along
the [010] and [421] step edges are shared with the growth units along the [441] and
[481] directions). Hence, there are only two independent PBCs on the (1014) surface of
calcite. It is also evident that the structure of the PBCs in the [441] and [481] directions
is identical. In fact, there are three families of symmetrically equivalent PBCs present
35
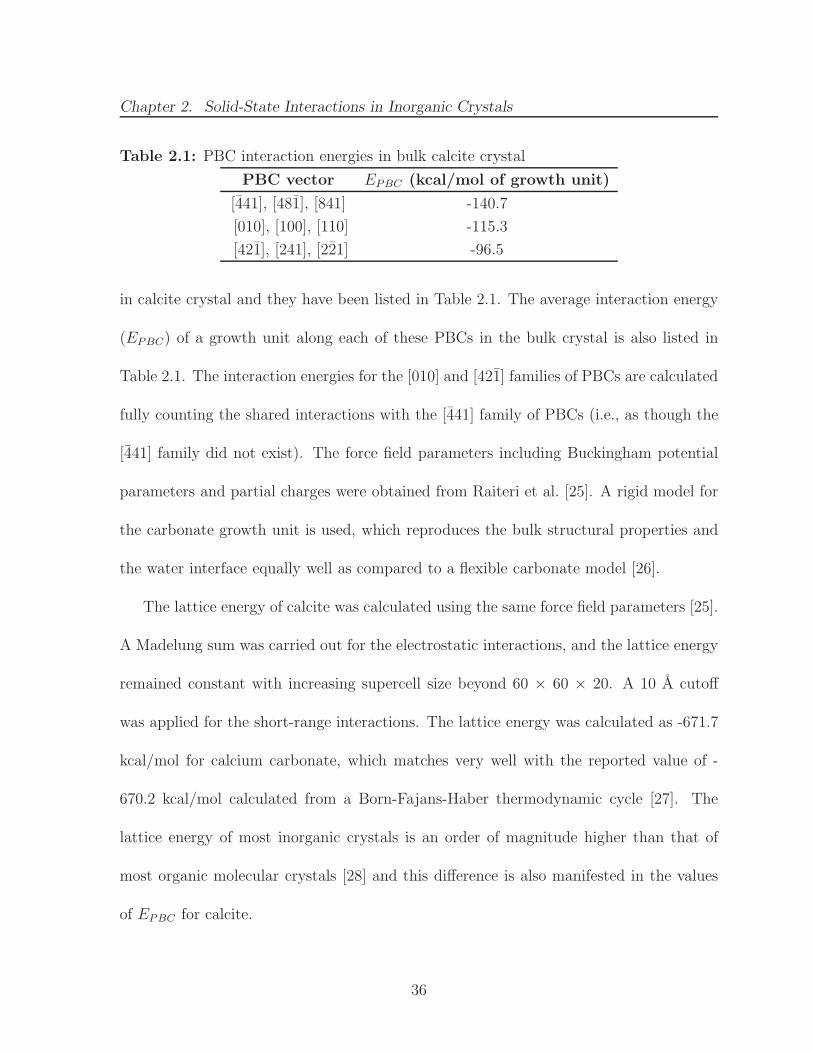
Chapter 2. Solid-State Interactions in Inorganic Crystals
Table 2.1: PBC interaction energies in bulk calcite crystal
PBC vector EPBC (kcal/mol of growth unit)
[441], [481], [841] -140.7
[010], [100], [110] -115.3
[421], [241], [221] -96.5
in calcite crystal and they have been listed in Table 2.1. The average interaction energy
(EPBC) of a growth unit along each of these PBCs in the bulk crystal is also listed in
Table 2.1. The interaction energies for the [010] and [421] families of PBCs are calculated
fully counting the shared interactions with the [441] family of PBCs (i.e., as though the
[441] family did not exist). The force field parameters including Buckingham potential
parameters and partial charges were obtained from Raiteri et al. [25]. A rigid model for
the carbonate growth unit is used, which reproduces the bulk structural properties and
the water interface equally well as compared to a flexible carbonate model [26].
The lattice energy of calcite was calculated using the same force field parameters [25].
A Madelung sum was carried out for the electrostatic interactions, and the lattice energy
remained constant with increasing supercell size beyond 60 × 60 × 20. A 10 A cutoff
was applied for the short-range interactions. The lattice energy was calculated as -671.7
kcal/mol for calcium carbonate, which matches very well with the reported value of -
670.2 kcal/mol calculated from a Born-Fajans-Haber thermodynamic cycle [27]. The
lattice energy of most inorganic crystals is an order of magnitude higher than that of
most organic molecular crystals [28] and this difference is also manifested in the values
of EPBC for calcite.
36
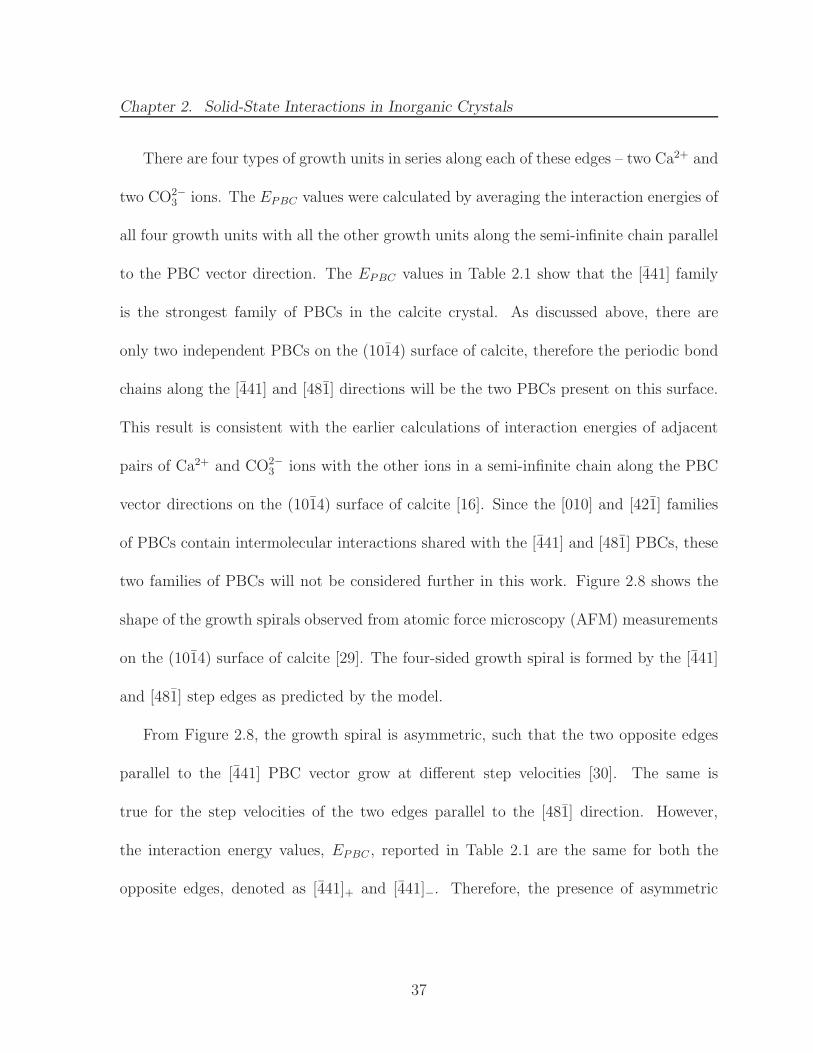
Chapter 2. Solid-State Interactions in Inorganic Crystals
There are four types of growth units in series along each of these edges – two Ca2+ and
two CO2−3 ions. The EPBC values were calculated by averaging the interaction energies of
all four growth units with all the other growth units along the semi-infinite chain parallel
to the PBC vector direction. The EPBC values in Table 2.1 show that the [441] family
is the strongest family of PBCs in the calcite crystal. As discussed above, there are
only two independent PBCs on the (1014) surface of calcite, therefore the periodic bond
chains along the [441] and [481] directions will be the two PBCs present on this surface.
This result is consistent with the earlier calculations of interaction energies of adjacent
pairs of Ca2+ and CO2−3 ions with the other ions in a semi-infinite chain along the PBC
vector directions on the (1014) surface of calcite [16]. Since the [010] and [421] families
of PBCs contain intermolecular interactions shared with the [441] and [481] PBCs, these
two families of PBCs will not be considered further in this work. Figure 2.8 shows the
shape of the growth spirals observed from atomic force microscopy (AFM) measurements
on the (1014) surface of calcite [29]. The four-sided growth spiral is formed by the [441]
and [481] step edges as predicted by the model.
From Figure 2.8, the growth spiral is asymmetric, such that the two opposite edges
parallel to the [441] PBC vector grow at different step velocities [30]. The same is
true for the step velocities of the two edges parallel to the [481] direction. However,
the interaction energy values, EPBC , reported in Table 2.1 are the same for both the
opposite edges, denoted as [441]+ and [441]−. Therefore, the presence of asymmetric
37
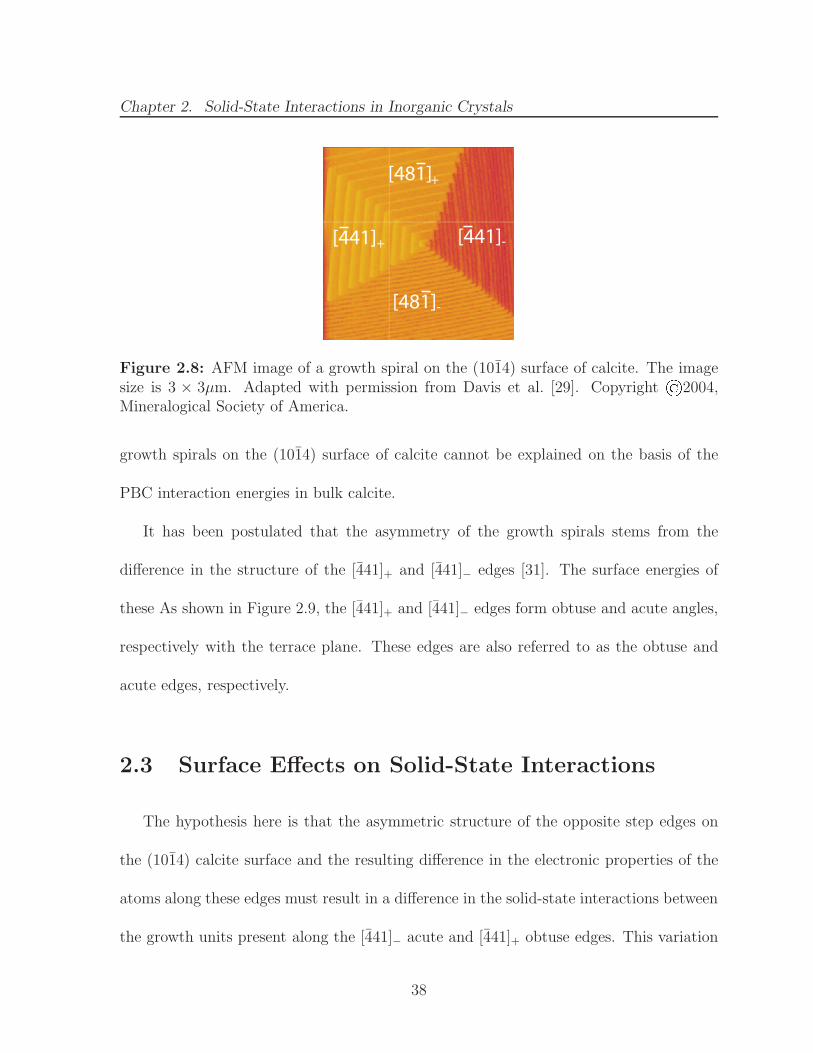
Chapter 2. Solid-State Interactions in Inorganic Crystals
[481]
[481]-
+
[441] [441]-+
Figure 2.8: AFM image of a growth spiral on the (1014) surface of calcite. The imagesize is 3 × 3µm. Adapted with permission from Davis et al. [29]. Copyright ©2004,Mineralogical Society of America.
growth spirals on the (1014) surface of calcite cannot be explained on the basis of the
PBC interaction energies in bulk calcite.
It has been postulated that the asymmetry of the growth spirals stems from the
difference in the structure of the [441]+ and [441]− edges [31]. The surface energies of
these As shown in Figure 2.9, the [441]+ and [441]− edges form obtuse and acute angles,
respectively with the terrace plane. These edges are also referred to as the obtuse and
acute edges, respectively.
2.3 Surface Effects on Solid-State Interactions
The hypothesis here is that the asymmetric structure of the opposite step edges on
the (1014) calcite surface and the resulting difference in the electronic properties of the
atoms along these edges must result in a difference in the solid-state interactions between
the growth units present along the [441]− acute and [441]+ obtuse edges. This variation
38
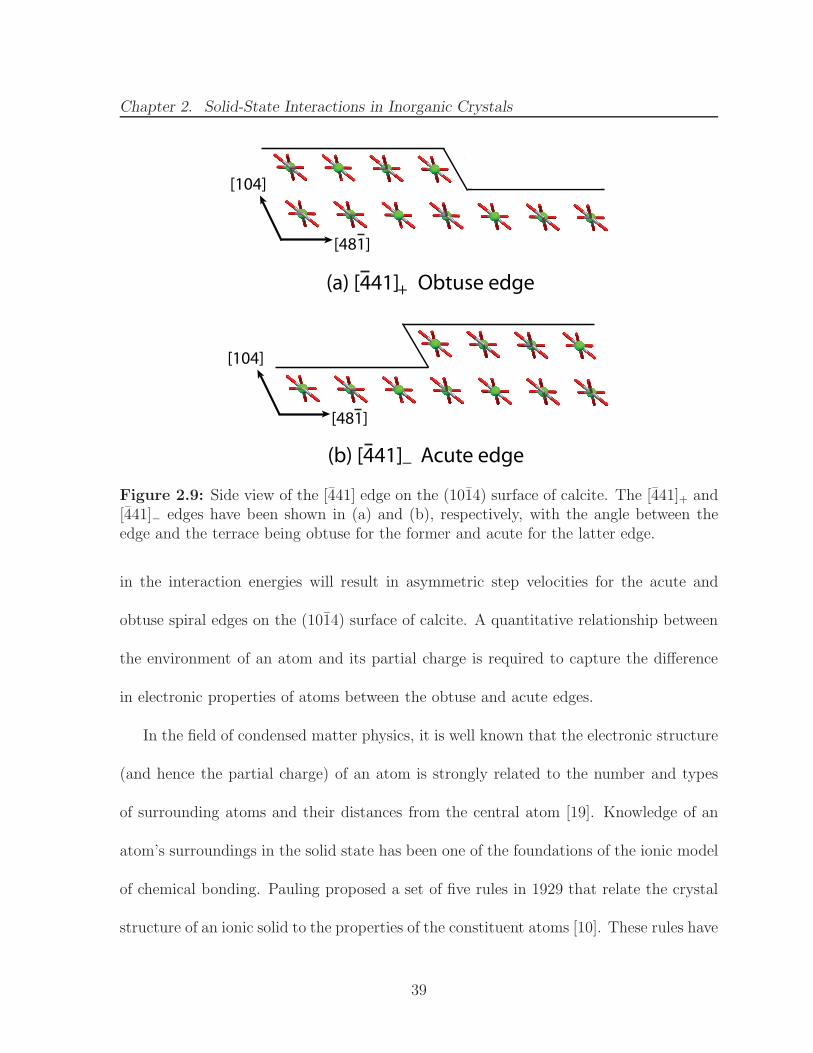
Chapter 2. Solid-State Interactions in Inorganic Crystals
(a) [441] Obtuse edge
(b) [441]_ Acute edge
[104]
[481]
+
[104]
[481]
Figure 2.9: Side view of the [441] edge on the (1014) surface of calcite. The [441]+ and[441]− edges have been shown in (a) and (b), respectively, with the angle between theedge and the terrace being obtuse for the former and acute for the latter edge.
in the interaction energies will result in asymmetric step velocities for the acute and
obtuse spiral edges on the (1014) surface of calcite. A quantitative relationship between
the environment of an atom and its partial charge is required to capture the difference
in electronic properties of atoms between the obtuse and acute edges.
In the field of condensed matter physics, it is well known that the electronic structure
(and hence the partial charge) of an atom is strongly related to the number and types
of surrounding atoms and their distances from the central atom [19]. Knowledge of an
atom’s surroundings in the solid state has been one of the foundations of the ionic model
of chemical bonding. Pauling proposed a set of five rules in 1929 that relate the crystal
structure of an ionic solid to the properties of the constituent atoms [10]. These rules have
39
Chapter 2. Solid-State Interactions in Inorganic Crystals
been used to predict the crystal structure of ionic solids if the ionic radii and coordination
numbers for the ions within the solid are known. One of the five rules relates the atomic
charge on an anion, qi, with the strength of the electrostatic bond Sij that the anion i
shares with its neighboring cation j in the solid [10].
qi = −CNi∑
j=1
(
qjCNj
)
= −CNi∑
j=1
Sij (2.3)
where CNi and CNj are the coordination numbers of the anion i and cation j, respec-
tively. qj is the charge on cation j, and Sij has units of electronic charge (Coulombs) and
is always positive. The negative sign is introduced in equation 2.3 only to ensure that
the charge qi on anion i is always negative. For any ion in general, the charge is given by
the summation of the bond strengths shared with its neighbors and the appropriate sign
is affixed to the value of the summation depending on whether the ion is less or more
electronegative than its neighbors (positive and negative signs, respectively).
Pauling’s definition of the bond strength S can be used to calculate the partial charge
of an ion only if the crystal structure has high symmetry such that all the bond strengths
that a cation shares with its neighboring anions are equal (e.g., all nearest anionic neigh-
bors are equidistant from the cation). This definition also does not account for the
asymmetry in electrostatic bond strengths resulting from the relaxation of surface layers.
2.3.1 Bond Valence Model
A realistic quantification of the bond strength between atoms in inorganic crystals
was made possible in the early 1970s when Donnay and Allmann proposed empirical
40
Chapter 2. Solid-State Interactions in Inorganic Crystals
relationships between the electrostatic bond strength s and the interionic distance [32].
Brown and Shannon [7] verified the generality of two Donnay and Allmann correlations
between the bond strength sij and the interatomic distance rij between atoms i and j
(sije
)
= exp
(
R0 − rijB
)
(2.4)
(sije
)
=
(
rijR0
)
−N
(2.5)
where R0, B and N are parameters for each (i, j) pair and e is the elementary charge.
These empirical correlations are robust such that the same parameter values work well
for any inorganic solid containing the same pair of atoms [8]. Although both the cor-
relations work well, equation 2.4 is preferred because it reflects the repulsive potential
between atoms and also because it is a well-behaved mathematical function at very small
interatomic distances. To avoid confusion with Pauling’s definition of bond strength, the
quantity sij calculated from equation 2.4 is termed the bond valence between atoms i and
j. This method is therefore called the bond valence model. Note that when all atomic
neighbors in the coordination shell have the same charge and are all equidistant from the
central ion, sij = Sij.
The physical significance of the bond valence model and its applicability to quantify
electrostatic interactions in inorganic solids has been studied in some detail [33]. The
electrostatic field lines between two atoms in any inorganic solid can be added up using
Gauss’ law to calculate the total electrostatic flux (normalized by the permittivity of
free space ǫo) between the two atoms. Figure 2.10 shows an example of the electrostatic
field lines in the (110) plane of rutile (TiO2). For most inorganic crystals, the root
41
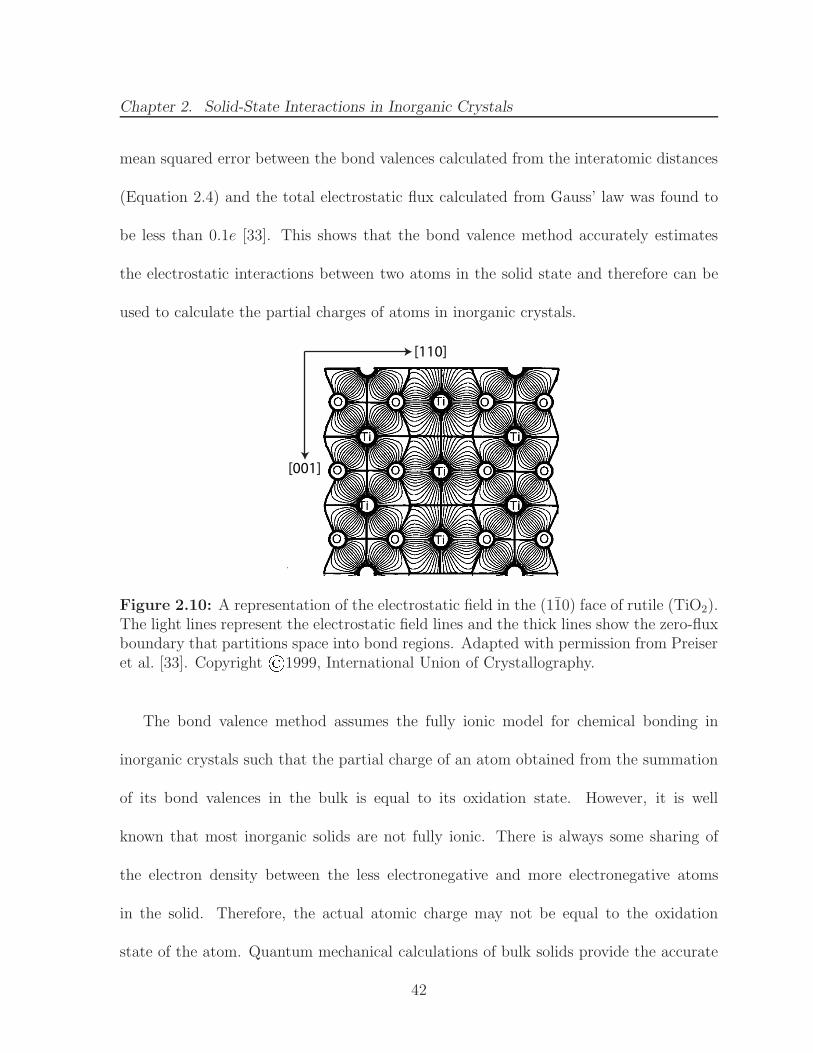
Chapter 2. Solid-State Interactions in Inorganic Crystals
mean squared error between the bond valences calculated from the interatomic distances
(Equation 2.4) and the total electrostatic flux calculated from Gauss’ law was found to
be less than 0.1e [33]. This shows that the bond valence method accurately estimates
the electrostatic interactions between two atoms in the solid state and therefore can be
used to calculate the partial charges of atoms in inorganic crystals.
[110]
[001]
Figure 2.10: A representation of the electrostatic field in the (110) face of rutile (TiO2).The light lines represent the electrostatic field lines and the thick lines show the zero-fluxboundary that partitions space into bond regions. Adapted with permission from Preiseret al. [33]. Copyright ©1999, International Union of Crystallography.
The bond valence method assumes the fully ionic model for chemical bonding in
inorganic crystals such that the partial charge of an atom obtained from the summation
of its bond valences in the bulk is equal to its oxidation state. However, it is well
known that most inorganic solids are not fully ionic. There is always some sharing of
the electron density between the less electronegative and more electronegative atoms
in the solid. Therefore, the actual atomic charge may not be equal to the oxidation
state of the atom. Quantum mechanical calculations of bulk solids provide the accurate
42
Chapter 2. Solid-State Interactions in Inorganic Crystals
electron density distribution within the solid. Mulliken population analysis [34] and
Bader charge partitioning [35] are two of the most widely used methods to partition the
electron density between the atomic nuclei so that each atom can be assigned a partial
charge. It is important to avoid the use of classical oxidation states on atoms in inorganic
crystals since those charges overestimate the lattice energies.
The bond valence model can still be used to calculate the partial charges of surface
atoms, provided the actual partial charges on the atoms in the bulk solid are known (e.g.,
from DFT calculations). The individual bond valences sij calculated from interatomic
distances (e.g., from equation 2.4) must be scaled by the ratio of actual charge qi,actual to
the oxidation state qi,OS of the atom i to give a normalized bond valence value s′ij given
by
s′ij = sij
(
qi,actualqi,OS
)
(2.6)
where qi,OS =
CNi∑
j=1
sij (i.e., equation 2.3) and qi,actual =
CNi∑
j=1
s′ij . The normalized bond
valence s′ij should be used to calculate the actual partial charge qi,surf of atom i on the
surface with coordination number CNi,surf as follows
qi,surf =
CNi,surf∑
j=1
s′ij (2.7)
Thus, the bond valence model can be used to calculate the actual partial charges on
the surface atoms of any inorganic crystal if the interatomic distances between the surface
atoms and their neighbors are known. Although this method may not be as accurate as
43
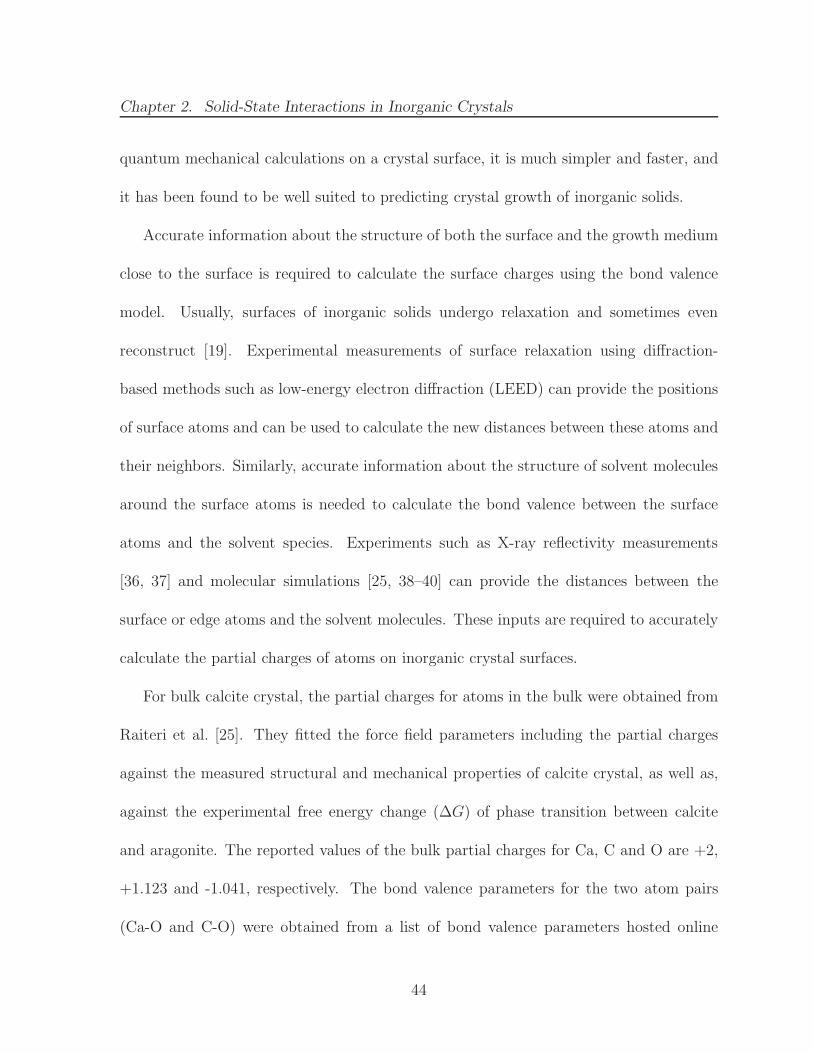
Chapter 2. Solid-State Interactions in Inorganic Crystals
quantum mechanical calculations on a crystal surface, it is much simpler and faster, and
it has been found to be well suited to predicting crystal growth of inorganic solids.
Accurate information about the structure of both the surface and the growth medium
close to the surface is required to calculate the surface charges using the bond valence
model. Usually, surfaces of inorganic solids undergo relaxation and sometimes even
reconstruct [19]. Experimental measurements of surface relaxation using diffraction-
based methods such as low-energy electron diffraction (LEED) can provide the positions
of surface atoms and can be used to calculate the new distances between these atoms and
their neighbors. Similarly, accurate information about the structure of solvent molecules
around the surface atoms is needed to calculate the bond valence between the surface
atoms and the solvent species. Experiments such as X-ray reflectivity measurements
[36, 37] and molecular simulations [25, 38–40] can provide the distances between the
surface or edge atoms and the solvent molecules. These inputs are required to accurately
calculate the partial charges of atoms on inorganic crystal surfaces.
For bulk calcite crystal, the partial charges for atoms in the bulk were obtained from
Raiteri et al. [25]. They fitted the force field parameters including the partial charges
against the measured structural and mechanical properties of calcite crystal, as well as,
against the experimental free energy change (∆G) of phase transition between calcite
and aragonite. The reported values of the bulk partial charges for Ca, C and O are +2,
+1.123 and -1.041, respectively. The bond valence parameters for the two atom pairs
(Ca-O and C-O) were obtained from a list of bond valence parameters hosted online
44
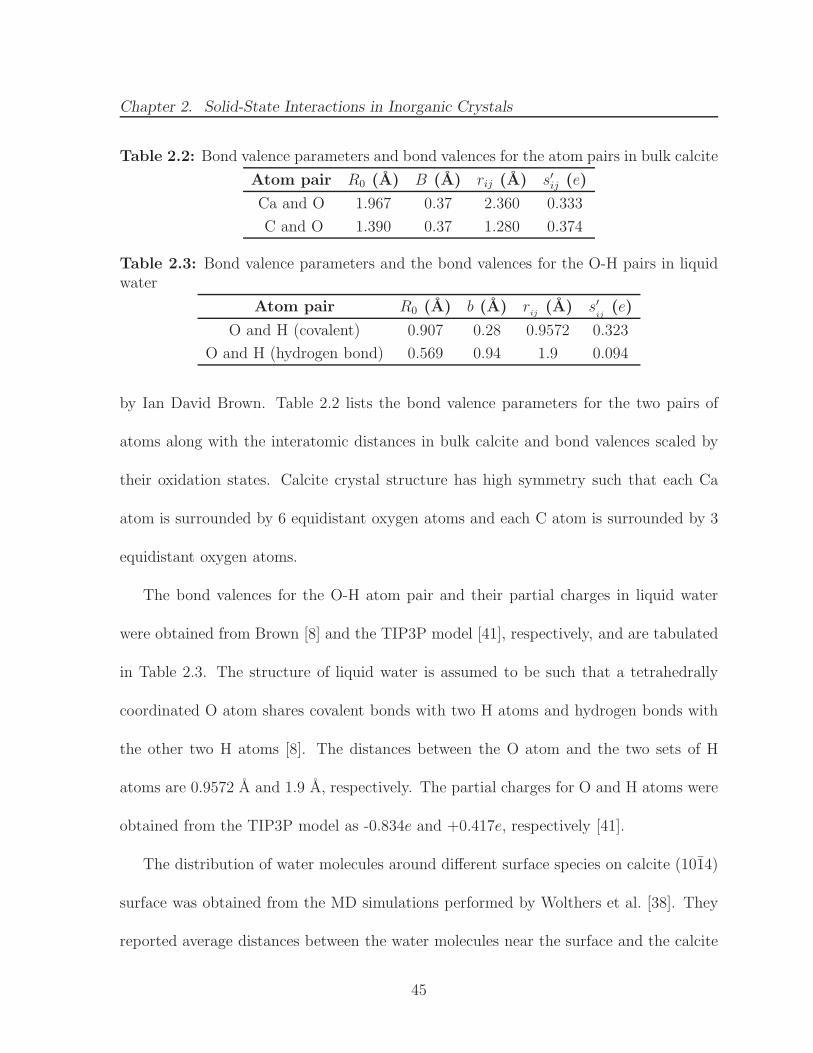
Chapter 2. Solid-State Interactions in Inorganic Crystals
Table 2.2: Bond valence parameters and bond valences for the atom pairs in bulk calcite
Atom pair R0 (A) B (A) rij (A) s′ij (e)
Ca and O 1.967 0.37 2.360 0.333
C and O 1.390 0.37 1.280 0.374
Table 2.3: Bond valence parameters and the bond valences for the O-H pairs in liquidwater
Atom pair R0 (A) b (A) rij(A) s′
ij(e)
O and H (covalent) 0.907 0.28 0.9572 0.323
O and H (hydrogen bond) 0.569 0.94 1.9 0.094
by Ian David Brown. Table 2.2 lists the bond valence parameters for the two pairs of
atoms along with the interatomic distances in bulk calcite and bond valences scaled by
their oxidation states. Calcite crystal structure has high symmetry such that each Ca
atom is surrounded by 6 equidistant oxygen atoms and each C atom is surrounded by 3
equidistant oxygen atoms.
The bond valences for the O-H atom pair and their partial charges in liquid water
were obtained from Brown [8] and the TIP3P model [41], respectively, and are tabulated
in Table 2.3. The structure of liquid water is assumed to be such that a tetrahedrally
coordinated O atom shares covalent bonds with two H atoms and hydrogen bonds with
the other two H atoms [8]. The distances between the O atom and the two sets of H
atoms are 0.9572 A and 1.9 A, respectively. The partial charges for O and H atoms were
obtained from the TIP3P model as -0.834e and +0.417e, respectively [41].
The distribution of water molecules around different surface species on calcite (1014)
surface was obtained from the MD simulations performed by Wolthers et al. [38]. They
reported average distances between the water molecules near the surface and the calcite
45
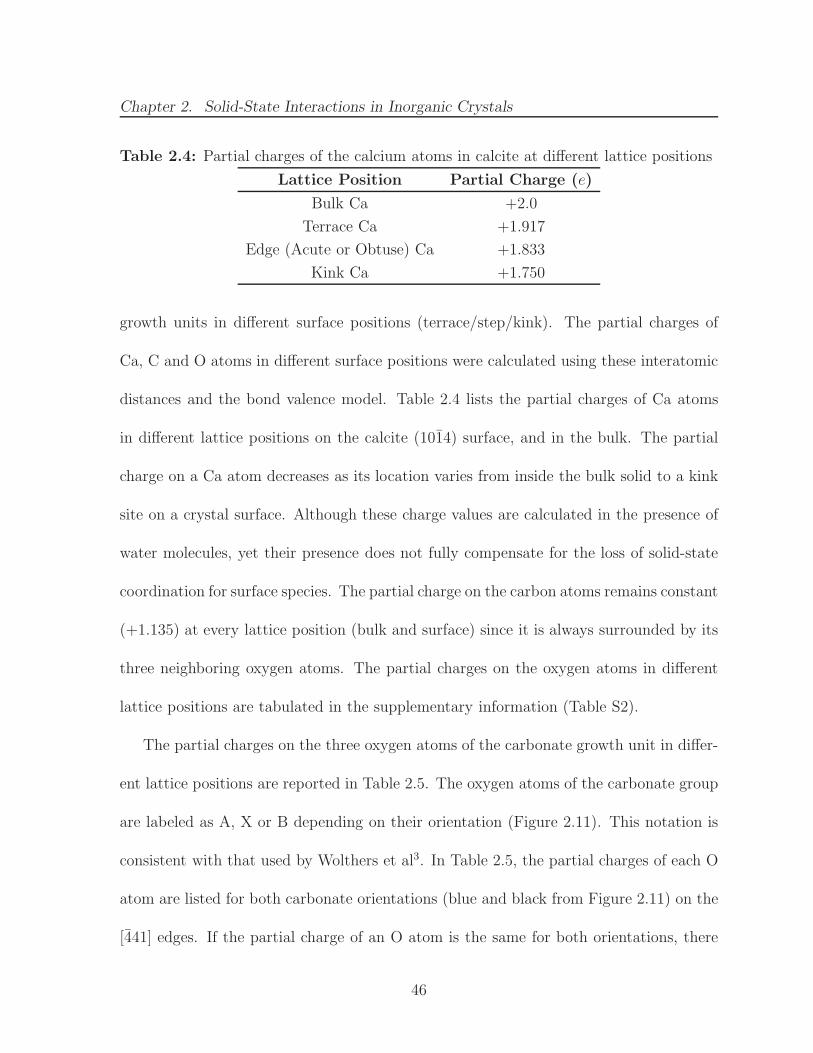
Chapter 2. Solid-State Interactions in Inorganic Crystals
Table 2.4: Partial charges of the calcium atoms in calcite at different lattice positions
Lattice Position Partial Charge (e)
Bulk Ca +2.0
Terrace Ca +1.917
Edge (Acute or Obtuse) Ca +1.833
Kink Ca +1.750
growth units in different surface positions (terrace/step/kink). The partial charges of
Ca, C and O atoms in different surface positions were calculated using these interatomic
distances and the bond valence model. Table 2.4 lists the partial charges of Ca atoms
in different lattice positions on the calcite (1014) surface, and in the bulk. The partial
charge on a Ca atom decreases as its location varies from inside the bulk solid to a kink
site on a crystal surface. Although these charge values are calculated in the presence of
water molecules, yet their presence does not fully compensate for the loss of solid-state
coordination for surface species. The partial charge on the carbon atoms remains constant
(+1.135) at every lattice position (bulk and surface) since it is always surrounded by its
three neighboring oxygen atoms. The partial charges on the oxygen atoms in different
lattice positions are tabulated in the supplementary information (Table S2).
The partial charges on the three oxygen atoms of the carbonate growth unit in differ-
ent lattice positions are reported in Table 2.5. The oxygen atoms of the carbonate group
are labeled as A, X or B depending on their orientation (Figure 2.11). This notation is
consistent with that used by Wolthers et al3. In Table 2.5, the partial charges of each O
atom are listed for both carbonate orientations (blue and black from Figure 2.11) on the
[441] edges. If the partial charge of an O atom is the same for both orientations, there
46
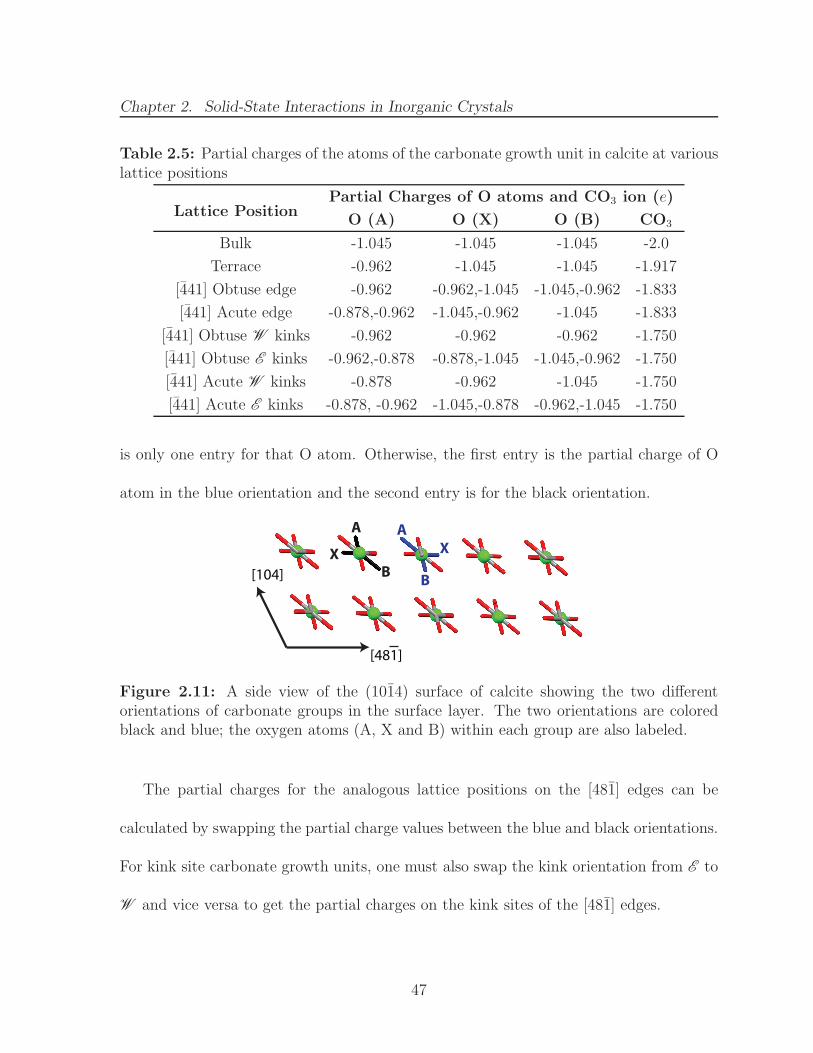
Chapter 2. Solid-State Interactions in Inorganic Crystals
Table 2.5: Partial charges of the atoms of the carbonate growth unit in calcite at variouslattice positions
Lattice PositionPartial Charges of O atoms and CO3 ion (e)
O (A) O (X) O (B) CO3
Bulk -1.045 -1.045 -1.045 -2.0
Terrace -0.962 -1.045 -1.045 -1.917
[441] Obtuse edge -0.962 -0.962,-1.045 -1.045,-0.962 -1.833
[441] Acute edge -0.878,-0.962 -1.045,-0.962 -1.045 -1.833
[441] Obtuse W kinks -0.962 -0.962 -0.962 -1.750
[441] Obtuse E kinks -0.962,-0.878 -0.878,-1.045 -1.045,-0.962 -1.750
[441] Acute W kinks -0.878 -0.962 -1.045 -1.750
[441] Acute E kinks -0.878, -0.962 -1.045,-0.878 -0.962,-1.045 -1.750
is only one entry for that O atom. Otherwise, the first entry is the partial charge of O
atom in the blue orientation and the second entry is for the black orientation.
[481]
[104]
A
X
B
A
BX
Figure 2.11: A side view of the (1014) surface of calcite showing the two differentorientations of carbonate groups in the surface layer. The two orientations are coloredblack and blue; the oxygen atoms (A, X and B) within each group are also labeled.
The partial charges for the analogous lattice positions on the [481] edges can be
calculated by swapping the partial charge values between the blue and black orientations.
For kink site carbonate growth units, one must also swap the kink orientation from E to
W and vice versa to get the partial charges on the kink sites of the [481] edges.
47
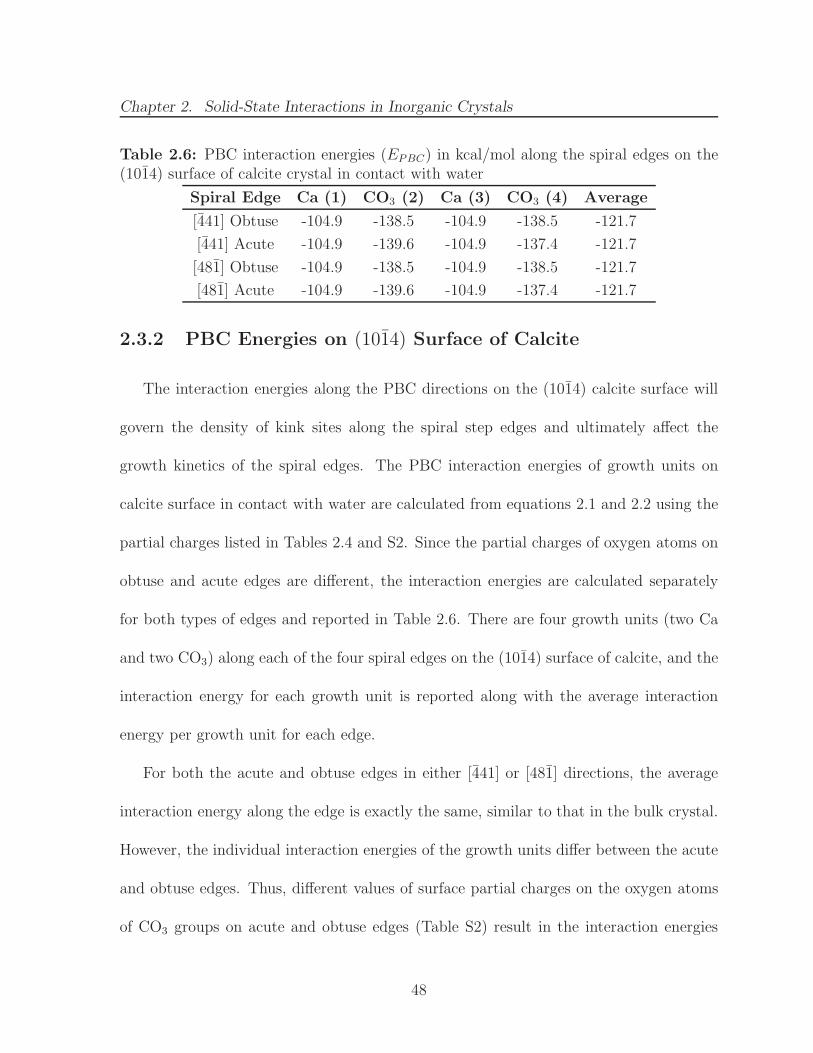
Chapter 2. Solid-State Interactions in Inorganic Crystals
Table 2.6: PBC interaction energies (EPBC) in kcal/mol along the spiral edges on the(1014) surface of calcite crystal in contact with water
Spiral Edge Ca (1) CO3 (2) Ca (3) CO3 (4) Average
[441] Obtuse -104.9 -138.5 -104.9 -138.5 -121.7
[441] Acute -104.9 -139.6 -104.9 -137.4 -121.7
[481] Obtuse -104.9 -138.5 -104.9 -138.5 -121.7
[481] Acute -104.9 -139.6 -104.9 -137.4 -121.7
2.3.2 PBC Energies on (1014) Surface of Calcite
The interaction energies along the PBC directions on the (1014) calcite surface will
govern the density of kink sites along the spiral step edges and ultimately affect the
growth kinetics of the spiral edges. The PBC interaction energies of growth units on
calcite surface in contact with water are calculated from equations 2.1 and 2.2 using the
partial charges listed in Tables 2.4 and S2. Since the partial charges of oxygen atoms on
obtuse and acute edges are different, the interaction energies are calculated separately
for both types of edges and reported in Table 2.6. There are four growth units (two Ca
and two CO3) along each of the four spiral edges on the (1014) surface of calcite, and the
interaction energy for each growth unit is reported along with the average interaction
energy per growth unit for each edge.
For both the acute and obtuse edges in either [441] or [481] directions, the average
interaction energy along the edge is exactly the same, similar to that in the bulk crystal.
However, the individual interaction energies of the growth units differ between the acute
and obtuse edges. Thus, different values of surface partial charges on the oxygen atoms
of CO3 groups on acute and obtuse edges (Table S2) result in the interaction energies
48
Chapter 2. Solid-State Interactions in Inorganic Crystals
being different on acute and obtuse edges for each of the four growth units. The value
of EPBC determines the work done to create kink sites from thermal rearrangement of
a straight step edge [42], therefore, the density of kink sites is expected to be different
on obtuse and acute edges. The step velocity of a growing spiral edge depends on the
density of kink sites along the edge [42] so this difference in EPBC partially explains the
asymmetric shape of growth spirals on the (1014) surface of calcite. The step velocity
also depends on the kinetics of incorporation into kink sites which is governed by the
energetics of the kink site growth units, as discussed in Chapter 3.
2.4 Kink Site Energies
The kinetics of crystal growth are governed by the energetics of the kink site position
on the crystal surface [3, 43]. The rate of attachment/detachment of growth units from
the kink sites depends on the work done to attach/detach a growth unit from the kink
site [4]. The work done in addition/removal of a growth unit to/from a kink site depends
on the potential energy of the growth unit in the kink site, which is determined by the
local structure of the crystalline solid as well as the growth medium. For organic crystals,
the potential energies of growth units in the kink site positions on the crystal surface can
be calculated by the addition of the nearest neighbor PBC interaction energies [42]. How-
ever, this method will not work for inorganic crystals since the electrostatic interactions
contribute almost entirely to the lattice energy and there are strong interactions from
non-nearest neighboring ions with like charge, which by definition cannot form PBCs.
49
Chapter 2. Solid-State Interactions in Inorganic Crystals
Therefore, such repulsive interactions are not accounted for when considering the PBC
interaction energies and summing up only the PBC interaction energies will overestimate
the magnitude of the potential energy of a kink site growth unit.
The potential energy of a growth unit in the kink site must be calculated by summing
up all the atom-atom interactions over the entire three dimensional crystal. However,
using a brute-force summation of the coulombic interactions will be computationally
prohibitive and will be repeated for every kink site along each edge on each crystal
face. The Ewald summation method [6, 44] has been applied to systems with uniform
geometries and charges [45, 46], but it cannot be applied here since the partial charges
on the atoms in the surface layer and along the step edge are different from the partial
charges on atoms in the bulk. Therefore, the concept of space partitioning is used to
calculate the kink site potential energies for inorganic crystals. The basic concept behind
this method has been used successfully in the literature to calculate the surface Madelung
constants for some inorganic crystals [47, 48].
2.4.1 Space Partitioning
Three dimensional space can be partitioned into three types of components - axes,
quadrants and octants, which are one, two and three dimensional objects, respectively.
Figure 2.12 shows the partitioning of the orthogonal coordinate system into these three
types of objects. The 26 partitions in the 3D orthogonal coordinate system and their
mathematical notations have been listed in Table 2.7.
50
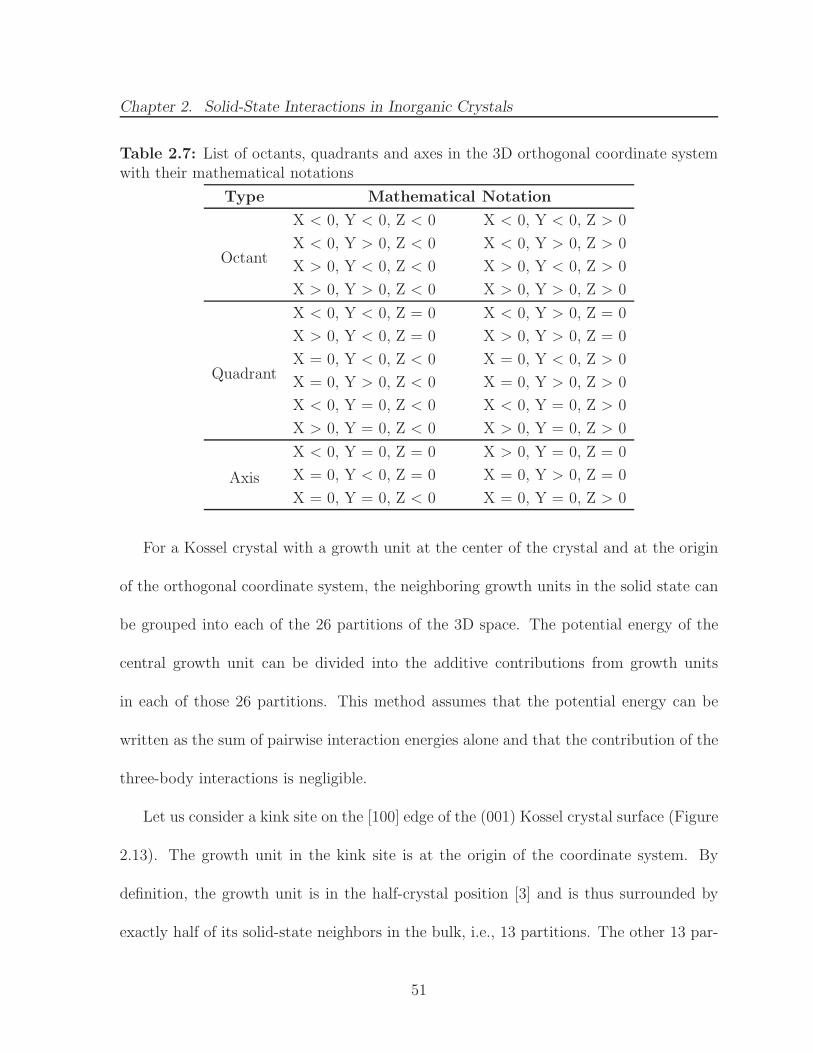
Chapter 2. Solid-State Interactions in Inorganic Crystals
Table 2.7: List of octants, quadrants and axes in the 3D orthogonal coordinate systemwith their mathematical notations
Type Mathematical Notation
Octant
X < 0, Y < 0, Z < 0 X < 0, Y < 0, Z > 0
X < 0, Y > 0, Z < 0 X < 0, Y > 0, Z > 0
X > 0, Y < 0, Z < 0 X > 0, Y < 0, Z > 0
X > 0, Y > 0, Z < 0 X > 0, Y > 0, Z > 0
Quadrant
X < 0, Y < 0, Z = 0 X < 0, Y > 0, Z = 0
X > 0, Y < 0, Z = 0 X > 0, Y > 0, Z = 0
X = 0, Y < 0, Z < 0 X = 0, Y < 0, Z > 0
X = 0, Y > 0, Z < 0 X = 0, Y > 0, Z > 0
X < 0, Y = 0, Z < 0 X < 0, Y = 0, Z > 0
X > 0, Y = 0, Z < 0 X > 0, Y = 0, Z > 0
Axis
X < 0, Y = 0, Z = 0 X > 0, Y = 0, Z = 0
X = 0, Y < 0, Z = 0 X = 0, Y > 0, Z = 0
X = 0, Y = 0, Z < 0 X = 0, Y = 0, Z > 0
For a Kossel crystal with a growth unit at the center of the crystal and at the origin
of the orthogonal coordinate system, the neighboring growth units in the solid state can
be grouped into each of the 26 partitions of the 3D space. The potential energy of the
central growth unit can be divided into the additive contributions from growth units
in each of those 26 partitions. This method assumes that the potential energy can be
written as the sum of pairwise interaction energies alone and that the contribution of the
three-body interactions is negligible.
Let us consider a kink site on the [100] edge of the (001) Kossel crystal surface (Figure
2.13). The growth unit in the kink site is at the origin of the coordinate system. By
definition, the growth unit is in the half-crystal position [3] and is thus surrounded by
exactly half of its solid-state neighbors in the bulk, i.e., 13 partitions. The other 13 par-
51
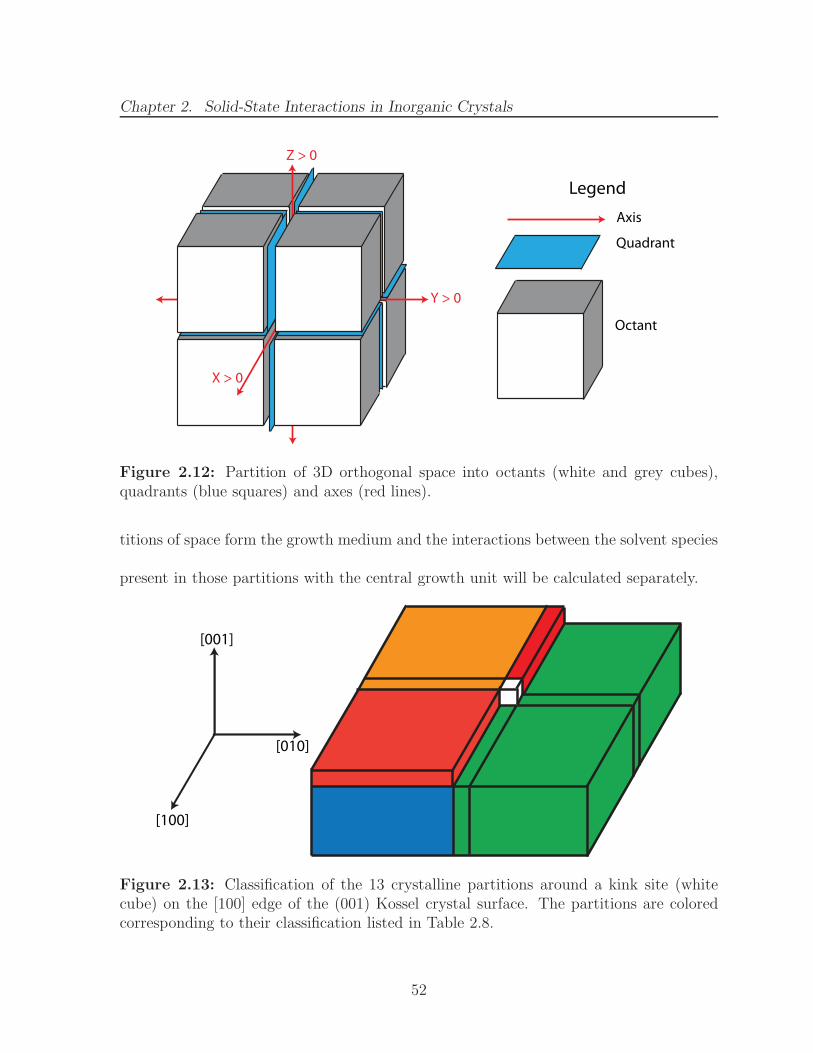
Chapter 2. Solid-State Interactions in Inorganic Crystals
Axis
Quadrant
Octant
X > 0
Z > 0
Y > 0
Legend
Figure 2.12: Partition of 3D orthogonal space into octants (white and grey cubes),quadrants (blue squares) and axes (red lines).
titions of space form the growth medium and the interactions between the solvent species
present in those partitions with the central growth unit will be calculated separately.
[001]
[010]
[100]
Figure 2.13: Classification of the 13 crystalline partitions around a kink site (whitecube) on the [100] edge of the (001) Kossel crystal surface. The partitions are coloredcorresponding to their classification listed in Table 2.8.
52
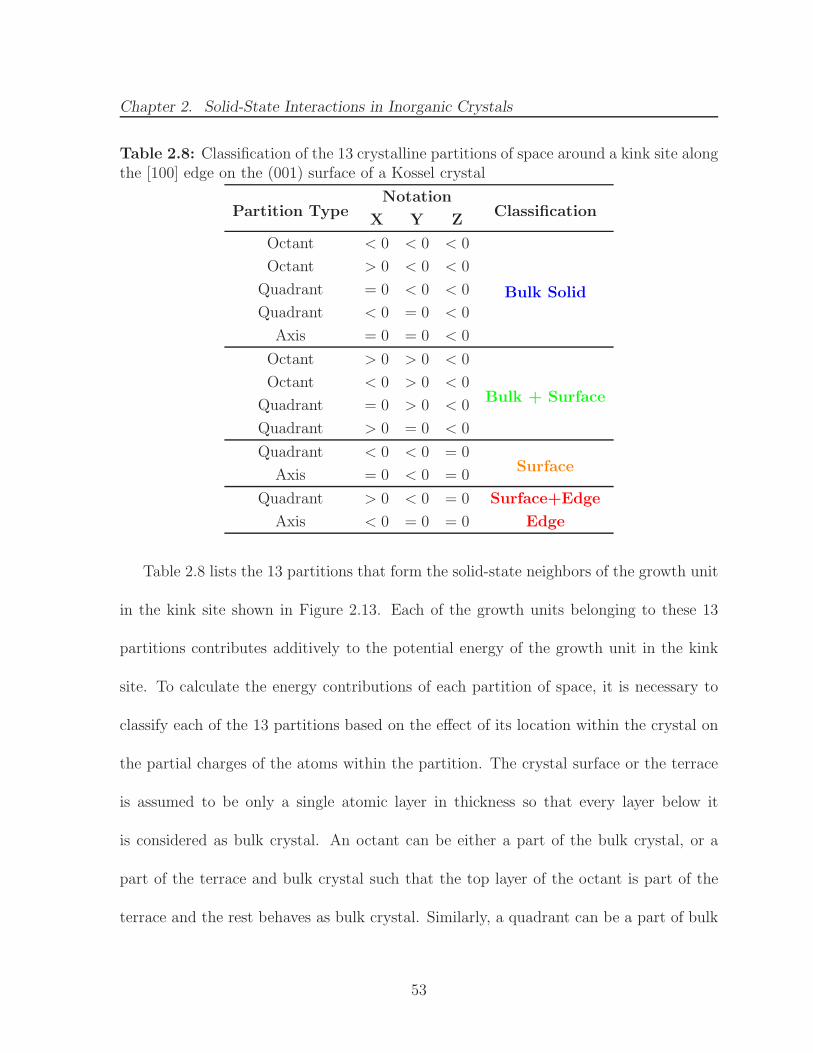
Chapter 2. Solid-State Interactions in Inorganic Crystals
Table 2.8: Classification of the 13 crystalline partitions of space around a kink site alongthe [100] edge on the (001) surface of a Kossel crystal
Partition TypeNotation
ClassificationX Y Z
Octant < 0 < 0 < 0
Bulk Solid
Octant > 0 < 0 < 0
Quadrant = 0 < 0 < 0
Quadrant < 0 = 0 < 0
Axis = 0 = 0 < 0
Octant > 0 > 0 < 0
Bulk + SurfaceOctant < 0 > 0 < 0
Quadrant = 0 > 0 < 0
Quadrant > 0 = 0 < 0
Quadrant < 0 < 0 = 0Surface
Axis = 0 < 0 = 0
Quadrant > 0 < 0 = 0 Surface+Edge
Axis < 0 = 0 = 0 Edge
Table 2.8 lists the 13 partitions that form the solid-state neighbors of the growth unit
in the kink site shown in Figure 2.13. Each of the growth units belonging to these 13
partitions contributes additively to the potential energy of the growth unit in the kink
site. To calculate the energy contributions of each partition of space, it is necessary to
classify each of the 13 partitions based on the effect of its location within the crystal on
the partial charges of the atoms within the partition. The crystal surface or the terrace
is assumed to be only a single atomic layer in thickness so that every layer below it
is considered as bulk crystal. An octant can be either a part of the bulk crystal, or a
part of the terrace and bulk crystal such that the top layer of the octant is part of the
terrace and the rest behaves as bulk crystal. Similarly, a quadrant can be a part of bulk
53
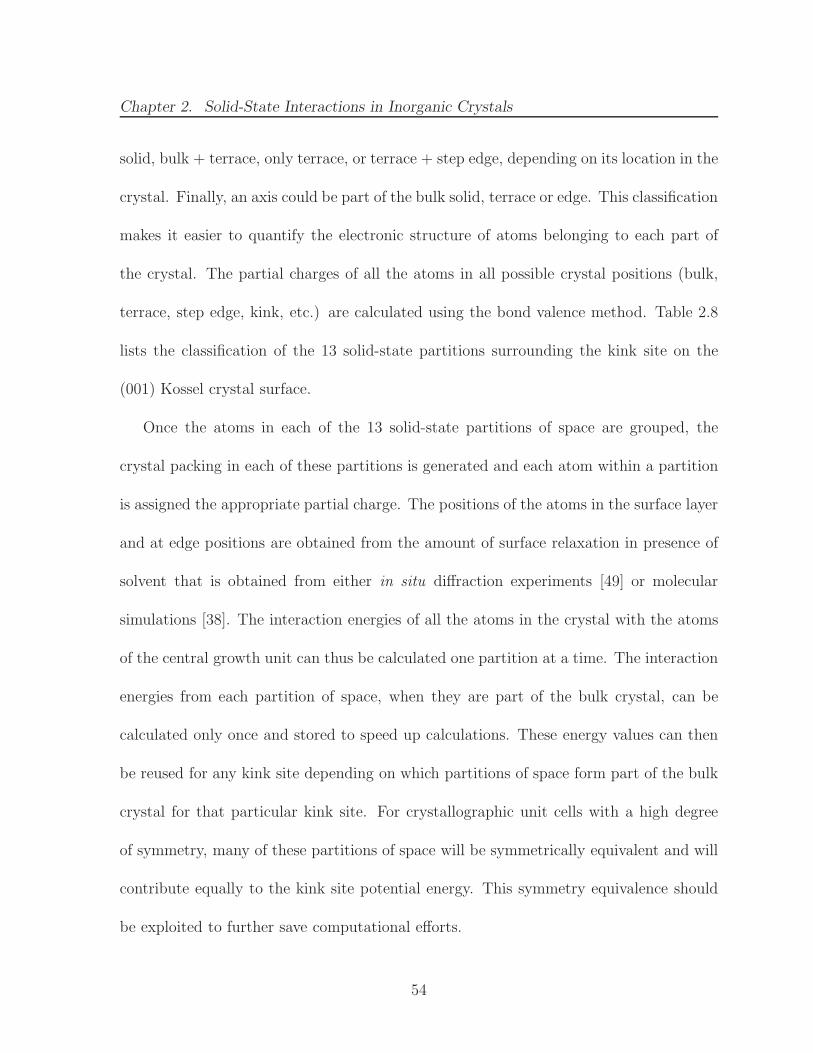
Chapter 2. Solid-State Interactions in Inorganic Crystals
solid, bulk + terrace, only terrace, or terrace + step edge, depending on its location in the
crystal. Finally, an axis could be part of the bulk solid, terrace or edge. This classification
makes it easier to quantify the electronic structure of atoms belonging to each part of
the crystal. The partial charges of all the atoms in all possible crystal positions (bulk,
terrace, step edge, kink, etc.) are calculated using the bond valence method. Table 2.8
lists the classification of the 13 solid-state partitions surrounding the kink site on the
(001) Kossel crystal surface.
Once the atoms in each of the 13 solid-state partitions of space are grouped, the
crystal packing in each of these partitions is generated and each atom within a partition
is assigned the appropriate partial charge. The positions of the atoms in the surface layer
and at edge positions are obtained from the amount of surface relaxation in presence of
solvent that is obtained from either in situ diffraction experiments [49] or molecular
simulations [38]. The interaction energies of all the atoms in the crystal with the atoms
of the central growth unit can thus be calculated one partition at a time. The interaction
energies from each partition of space, when they are part of the bulk crystal, can be
calculated only once and stored to speed up calculations. These energy values can then
be reused for any kink site depending on which partitions of space form part of the bulk
crystal for that particular kink site. For crystallographic unit cells with a high degree
of symmetry, many of these partitions of space will be symmetrically equivalent and will
contribute equally to the kink site potential energy. This symmetry equivalence should
be exploited to further save computational efforts.
54
Chapter 2. Solid-State Interactions in Inorganic Crystals
This analysis works well with minor modifications for a non-orthogonal crystal struc-
ture. The lattice spacing or the interaction energies along the three cardinal direc-
tions need not be symmetric. This method can be applied to any crystal structure once
the three strongest PBC directions are identified. Placing the three cardinal directions
(X, Y, Z in the Kossel crystal example) along the three strongest PBC directions of the
crystal will simplify the kink site energy calculations as the step edges of growth spirals
will be aligned with these cardinal directions. The classification of the 13 partitions of
space that form the crystal will thus be straightforward.
If there are some intermolecular interactions shared between two PBCs that are
present in two different F-faces, the choice of the cardinal directions may not be unique
for the entire crystal. For example, if the PBCs in X and Z directions share a common
bond, then the space partitioning for the face containing X and Y PBCs cannot be car-
ried out with Z as the third cardinal direction. In such cases, the three cardinal directions
are chosen separately for each F-face to ensure that a PBC with shared interactions is
not a part of the space partitioning analysis. Some of the PBCs in aragonite crystals
share some intermolecular interactions and Chapter 4 addresses the challenge of space
partitioning for such a crystal in detail.
The interactions between the species of the growth medium and the kink site growth
unit cannot be calculated using this space partitioning method. Since the growth medium
or solvent does not have a periodic structure, it is impossible to calculate the long-range
electrostatic interaction energies between kink site growth unit and the solvent molecules
55
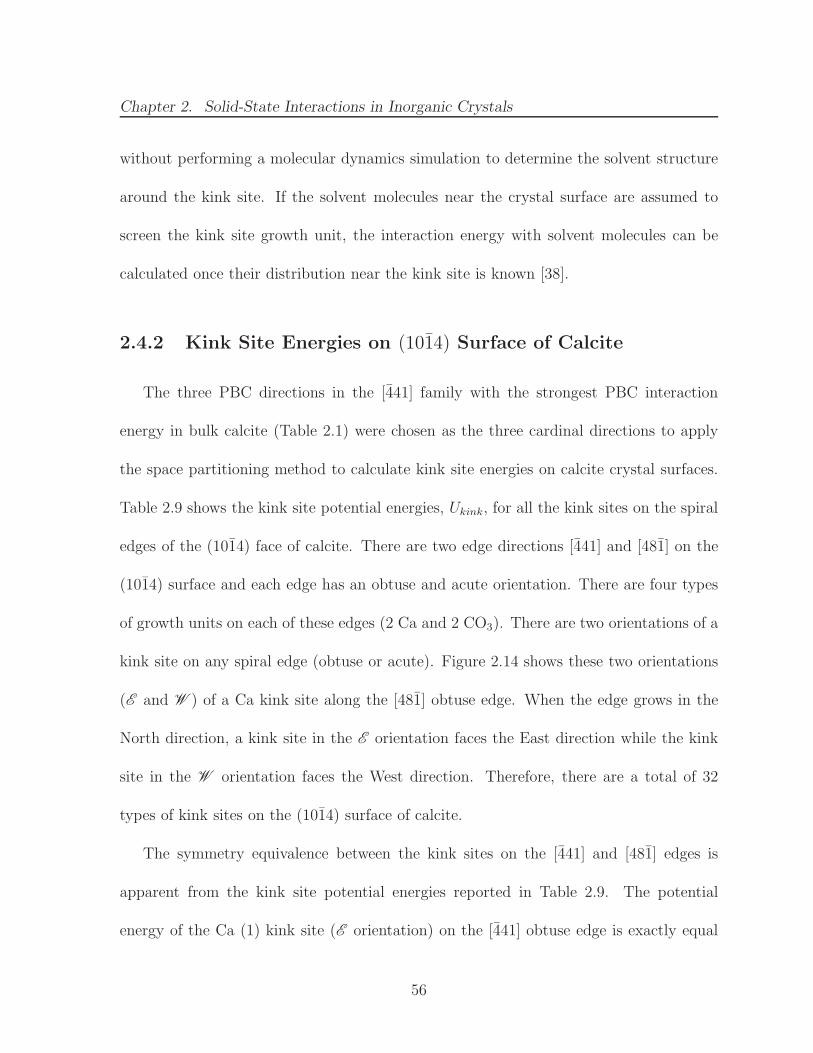
Chapter 2. Solid-State Interactions in Inorganic Crystals
without performing a molecular dynamics simulation to determine the solvent structure
around the kink site. If the solvent molecules near the crystal surface are assumed to
screen the kink site growth unit, the interaction energy with solvent molecules can be
calculated once their distribution near the kink site is known [38].
2.4.2 Kink Site Energies on (1014) Surface of Calcite
The three PBC directions in the [441] family with the strongest PBC interaction
energy in bulk calcite (Table 2.1) were chosen as the three cardinal directions to apply
the space partitioning method to calculate kink site energies on calcite crystal surfaces.
Table 2.9 shows the kink site potential energies, Ukink, for all the kink sites on the spiral
edges of the (1014) face of calcite. There are two edge directions [441] and [481] on the
(1014) surface and each edge has an obtuse and acute orientation. There are four types
of growth units on each of these edges (2 Ca and 2 CO3). There are two orientations of a
kink site on any spiral edge (obtuse or acute). Figure 2.14 shows these two orientations
(E and W ) of a Ca kink site along the [481] obtuse edge. When the edge grows in the
North direction, a kink site in the E orientation faces the East direction while the kink
site in the W orientation faces the West direction. Therefore, there are a total of 32
types of kink sites on the (1014) surface of calcite.
The symmetry equivalence between the kink sites on the [441] and [481] edges is
apparent from the kink site potential energies reported in Table 2.9. The potential
energy of the Ca (1) kink site (E orientation) on the [441] obtuse edge is exactly equal
56
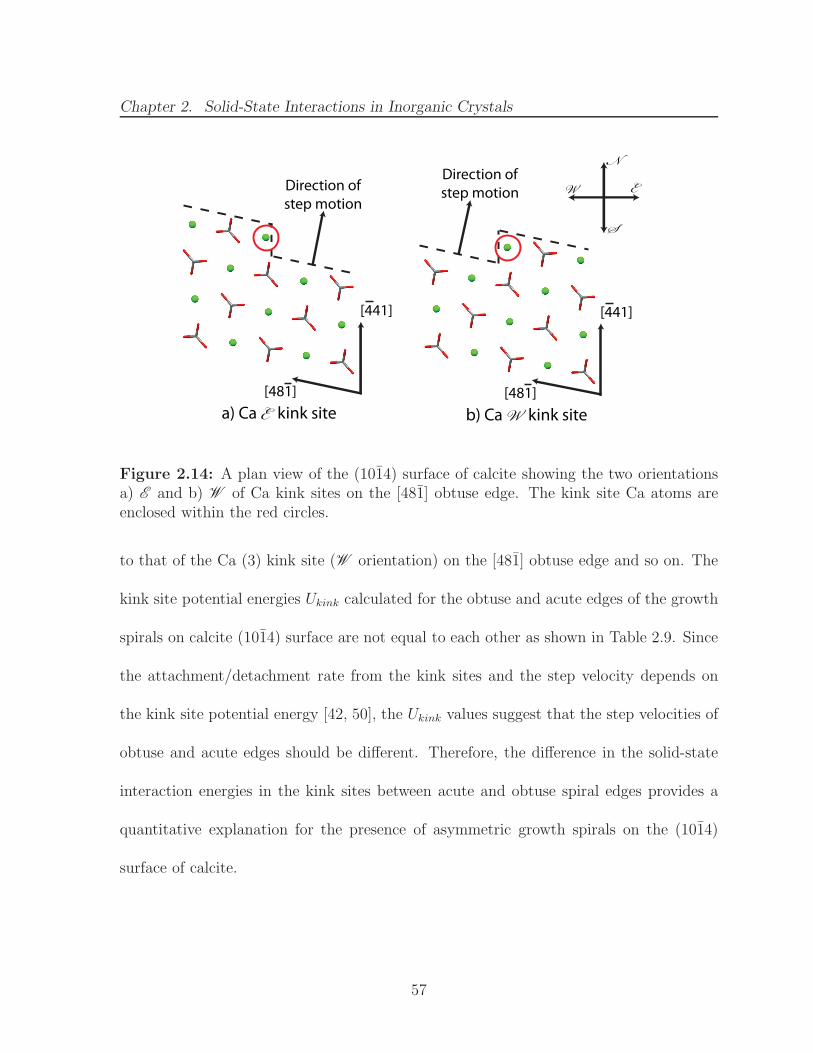
Chapter 2. Solid-State Interactions in Inorganic Crystals
a) Ca E kink site b) Ca W kink site
Direction of step motionDirection of
step motion
N
S
EW
[441]
[481]
[441]
[481]
Figure 2.14: A plan view of the (1014) surface of calcite showing the two orientationsa) E and b) W of Ca kink sites on the [481] obtuse edge. The kink site Ca atoms areenclosed within the red circles.
to that of the Ca (3) kink site (W orientation) on the [481] obtuse edge and so on. The
kink site potential energies Ukink calculated for the obtuse and acute edges of the growth
spirals on calcite (1014) surface are not equal to each other as shown in Table 2.9. Since
the attachment/detachment rate from the kink sites and the step velocity depends on
the kink site potential energy [42, 50], the Ukink values suggest that the step velocities of
obtuse and acute edges should be different. Therefore, the difference in the solid-state
interaction energies in the kink sites between acute and obtuse spiral edges provides a
quantitative explanation for the presence of asymmetric growth spirals on the (1014)
surface of calcite.
57
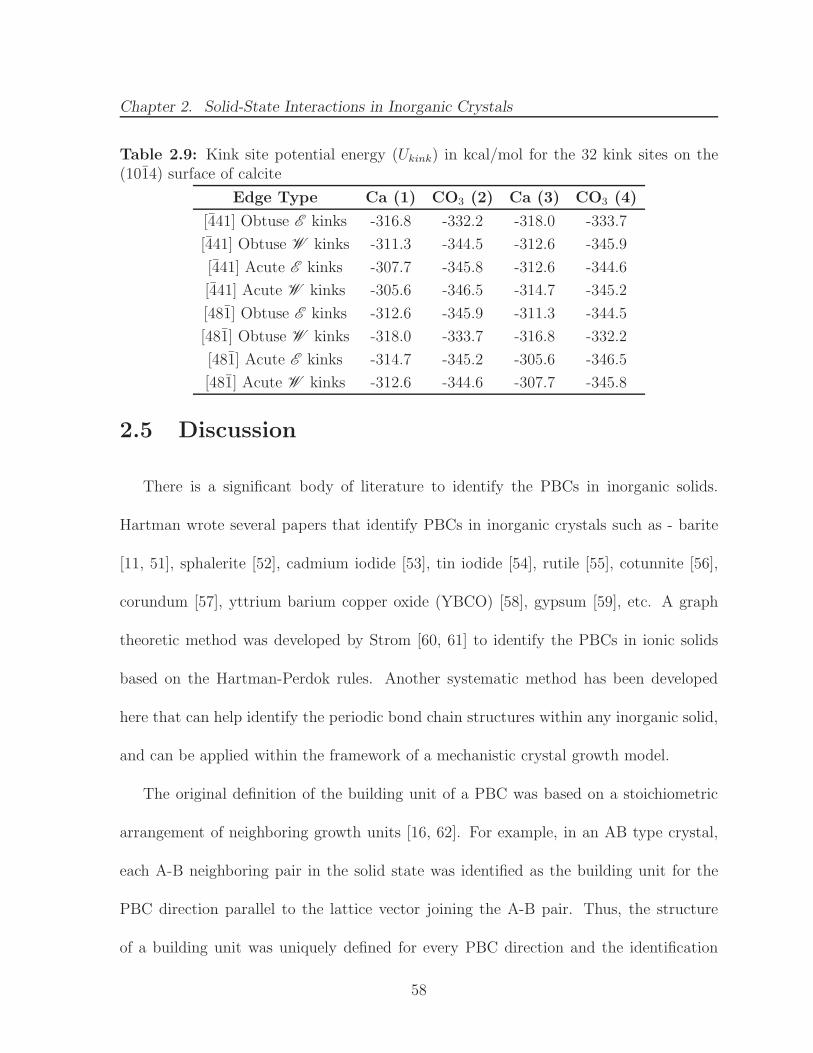
Chapter 2. Solid-State Interactions in Inorganic Crystals
Table 2.9: Kink site potential energy (Ukink) in kcal/mol for the 32 kink sites on the(1014) surface of calcite
Edge Type Ca (1) CO3 (2) Ca (3) CO3 (4)
[441] Obtuse E kinks -316.8 -332.2 -318.0 -333.7
[441] Obtuse W kinks -311.3 -344.5 -312.6 -345.9
[441] Acute E kinks -307.7 -345.8 -312.6 -344.6
[441] Acute W kinks -305.6 -346.5 -314.7 -345.2
[481] Obtuse E kinks -312.6 -345.9 -311.3 -344.5
[481] Obtuse W kinks -318.0 -333.7 -316.8 -332.2
[481] Acute E kinks -314.7 -345.2 -305.6 -346.5
[481] Acute W kinks -312.6 -344.6 -307.7 -345.8
2.5 Discussion
There is a significant body of literature to identify the PBCs in inorganic solids.
Hartman wrote several papers that identify PBCs in inorganic crystals such as - barite
[11, 51], sphalerite [52], cadmium iodide [53], tin iodide [54], rutile [55], cotunnite [56],
corundum [57], yttrium barium copper oxide (YBCO) [58], gypsum [59], etc. A graph
theoretic method was developed by Strom [60, 61] to identify the PBCs in ionic solids
based on the Hartman-Perdok rules. Another systematic method has been developed
here that can help identify the periodic bond chain structures within any inorganic solid,
and can be applied within the framework of a mechanistic crystal growth model.
The original definition of the building unit of a PBC was based on a stoichiometric
arrangement of neighboring growth units [16, 62]. For example, in an AB type crystal,
each A-B neighboring pair in the solid state was identified as the building unit for the
PBC direction parallel to the lattice vector joining the A-B pair. Thus, the structure
of a building unit was uniquely defined for every PBC direction and the identification
58
Chapter 2. Solid-State Interactions in Inorganic Crystals
of one building unit did not provide any information about either the structure of the
other building units, or the directions of other PBC vectors. An additional condition
is imposed on the structure of the building unit, that its dipole moment must be zero.
This condition results in a building unit structure that is identical for all the PBCs,
and therefore for the entire crystal. Thus, the identification of the PBC vectors in an
inorganic solid is reduced to the identification of a single building unit and then applying
the symmetry operators in the unit cell to obtain the crystal packing with building units.
The arrangement of building units along a PBC direction may not be equal to the actual
structure of the step edge. Therefore, the arrangement of building units along each PBC
vector must be decomposed into an arrangement of growth units that follows Hartman-
Perdok rules. The identification of PBCs in inorganic solids can now be carried out in a
systematic step-by-step methodology, which is discussed in Appendix A.
A more important aspect of our model is the practical implementation of quantum
mechanical concepts that govern the electronic properties of the growth units situated on
crystal surfaces. The importance of partial charges of surface atoms on thermodynamics
and kinetics of crystal growth has been known for some time. Polar morphologies of
sodium chlorate [63] and sodium periodate [64] have been explained, using the attach-
ment energy model, on the basis of different partial charges (calculated using quantum
mechanics) on the opposite crystal faces. Knowledge of the partial charges in bulk solid
combined with the bond valence model allows the calculation of partial charges in surface
positions with different solid-state coordination. The effect of the solvent molecules next
59
Chapter 2. Solid-State Interactions in Inorganic Crystals
to the crystal surface on the partial charges of surface atoms is also captured within the
bond valence framework. A space partitioning method allows easy calculation of kink site
potential energies while accounting for the different values of surface charges and all the
long-range interactions. This model provides a useful engineering solution to the problem
of identification of PBC directions on inorganic crystal surfaces and the calculation of
interaction energies on the surface that govern the kinetics of layered growth on these
crystal surfaces.
2.6 Conclusions
In this chapter, a generalized model capable of capturing the solid-state interactions
in inorganic crystals from a crystal growth perspective has been discussed. This approach
is based on identifying the directions of strongest intermolecular interactions within the
crystal while accounting for long-range electrostatic interactions and stoichiometry. The
model can help predict the shape of growth spirals formed on inorganic crystal surfaces
such as the calcite (1014) surface.
The growth kinetics of inorganic crystals depends on the coulombic interactions of the
growth units in the kink site positions on crystal surfaces. The change in the electronic
structure of surface atoms from those in the bulk has been captured using the bond
valence model and a systematic method is presented to calculate the partial charges of
atoms located in different lattice positions on inorganic crystal surfaces. The concept
of space partitioning was used to partition a growing crystal into parts that belong to
60
Chapter 2. Solid-State Interactions in Inorganic Crystals
the bulk crystal or terrace or step edge. This classification simplifies the calculation of
the potential energies of growth units in the kink site positions on an inorganic crystal
surface. The potential energy calculations for kink sites on the (1014) calcite surface
explains the asymmetric growth of the obtuse and acute edges. This framework lays
the foundation for a mechanistic crystal growth model that is capable of predicting the
shapes of solution grown inorganic crystals such as calcite, titanium dioxide, barite, etc,
which will be discussed in the next chapter.
61
Bibliography
[1] F. C. Frank. Growth and Perfection of Crystals, chapter On the Kinematic Theoryof Crystal Growth and Dissolution Processes, pages 411–419. New York: Wiley,1958.
[2] A. A. Chernov. The kinetics of the growth forms of crystals. Sov. Phys. Cryst.,7:728–730, 1963.
[3] I. N. Stranski. Zur theorie des kristallwachstums. Z. Phys. Chem., 136:259–278,1928.
[4] I. V. Markov. Crystal Growth for Beginners, Fundamentals of Nucleation, CrystalGrowth and Epitaxy. World Scientific: Singapore, 2003.
[5] E. Madelung. Das elektrische feld in systemen von regelmassig angeordneten punk-tladungen. Phys. Zs., 19:524–533, 1918.
[6] P. P. Ewald. Die berechnung optischer und elektrostatischer gitterpotentiale. Ann.Phys., 64:253, 1921.
[7] I. D. Brown and R. D. Shannon. Empirical bond-strength-bond-length curves foroxides. Acta. Crystallogr. A, 29:266–282, 1973.
[8] I. D. Brown. The Chemical Bond in Inorganic Chemsitry: The Bond Valence Model.Oxford University Press, 2002.
[9] P. Hartman and W. G. Perdok. On the relations between structure and morphologyof crystals. I. Acta Crystallogr., 8:49–52, 1955.
[10] L. Pauling. The principles determining the structure of complex ionic crystals. J.Am. Chem. Soc., 51:1010–1026, 1929.
[11] P. Hartman and W. G. Perdok. On the relations between structure and morphologyof crystals. II. Acta Crystallogr., 8:521–524, 1955.
[12] P. W. Tasker. The stability of ionic crystal surfaces. J. Phys. C Solid State, 12:4977,1979.
62
Bibliography
[13] C. Noguera. Polar oxide surfaces. J. Phys.: Condens. Matter, 12:R367, 2000.
[14] U. Diebold, S.-C. Li, and M. Schmid. Oxide surface science. Annu. Rev. Phys.Chem., 61:129–148, 2010.
[15] W. M. M. Heijnen. The morphology of gel grown calcite. N. Jb. Miner. Mh., 8:357–371, 1985.
[16] D. Aquilano, M. Calleri, E. Natoli, M. Rubbo, and G. Sgualdino. The {104} cleavagerhombohedron of calcite: theoretical equilibrium properties. Mater. Chem. Phys.,66:159 – 163, 2000.
[17] M. Miyaka, I. Minato, H. Morikawa, and S. Iwai. Crystal structures and sulphateforce constants of barite, celestite and anglesite. Am. Mineral., 63:506–510, 1978.
[18] W. K. Burton, N. Cabrera, and F. C. Frank. The growth of crystals and the equi-librium structure of their surfaces. Phil. Trans. Roy. Soc. A, 243:299–358, 1951.
[19] C. Kittel. Introduction to Solid State Physics. John Wiley & Sons, Inc.: Hoboken,NJ, 2005.
[20] C. R. A. Catlow, M. Dixon, and W. C. Mackrodt. Computer Simulation of Solids,chapter Interionic Potentials in Ionic Solids, pages 130–161. Springer-Verlag: Berlin,1982.
[21] J. D. Gale and A. L. Rohl. The general utility lattice program (GULP). Mol. Simul.,29:291–341, 2003.
[22] J. W. Morse, R. S. Arvidson, and A. Luttge. Calcium carbonate formation anddissolution. Chem. Rev., 107:342–381, 2007.
[23] Large crystal of Icelandic Spar (Calcite) on display at the National Museum ofNatural History Washington, DC, 2005.
[24] S. Markgraf and R. Reeder. High-temperature structure refinements of calcite andmagnesite. Am. Mineral., 70:590–600, 1985.
[25] P. Raiteri, J. D. Gale, D. Quigley, and P. M. Rodger. Derivation of an accurateforce-field for simulating the growth of calcium carbonate from aqueous solution: Anew model for the calcite-water interface. J. Phys. Chem. C, 114:5997–6010, 2010.
[26] P. Raiteri and J. D. Gale. Water is the key to nonclassical nucleation of amorphouscalcium carbonate. J. Am. Chem. Soc., 132:17623–17634, 2010.
[27] H. D. B. Jenkins, K. F. Pratt, and B. T. Smith. Lattice potential energies for calcite,aragonite and vaterite. J. Inorg. Nucl. Chem., 38:371–377, 1976.
63
Bibliography
[28] D. Winn and M. F. Doherty. Modeling crystal shapes of organic materials grownfrom solution. AIChE J., 46:1348–1367, 2000.
[29] K. J. Davis, P. M. Dove, L. E. Wasylenki, and J. J. De Yoreo. Morphologicalconsequences of differential Mg2+ incorporation at structurally distinct steps oncalcite. Am. Mineral., 89:714–720, 2004.
[30] H. H. Teng, P. M. Dove, C. A. Orme, and J. J. De Yoreo. Thermodynamics ofcalcite growth: Baseline for understanding biomineral formation. Science, 282:724–727, 1998.
[31] J. Paquette and R. J. Reeder. Relationship between surface structure, growth mecha-nism, and trace element incorporation in calcite. Geochim. Cosmochim. Acta, 59:735– 749, 1995.
[32] G. Donnay and R. Allmann. How to recognize O2−, OH−, and H2O in crystalstructures determined by X-rays. Am. Mineral., 55:1003–1015, 1970.
[33] C. Preiser, J. Losel, I. D. Brown, M. Kunz, and A. Skowron. Long-range coulombforces and localized bonds. Acta Crystallogr. B, 55:698–711, 1999.
[34] R. S. Mulliken. Electronic Population Analysis on LCAO[Single Bond]MO MolecularWave Functions. I. J. Chem. Phys., 23:1833–1840, 1955.
[35] W. Tang, E. Sanville, and G. Henkelman. A grid-based bader analysis algorithmwithout lattice bias. J. Phys.: Condens. Matter, 21:084204, 2009.
[36] P. Fenter and N. Sturchio. Calcite (104)-water interface structure, revisited.Geochim. Cosmochim. Acta, 97:58 – 69, 2012.
[37] P. Fenter, S. Kerisit, P. Raiteri, and J. D. Gale. Is the calcite-water interface under-stood? Direct comparisons of molecular dynamics simulations with specular x-rayreflectivity data. J. Phys. Chem. C, 117:5028–5042, 2013.
[38] M. Wolthers, D. Di Tommaso, Z. Du, and N. H. de Leeuw. Calcite surface structureand reactivity: Molecular dynamics simulations and macroscopic surface modellingof the calcite-water interface. Phys. Chem. Chem. Phys., 14:15145–15157, 2012.
[39] A. G. Stack, P. Raiteri, and J. D. Gale. Accurate rates of the complex mechanismsfor growth and dissolution of minerals using a combination of rare-event theories. J.Am. Chem. Soc., 134:11–14, 2012.
[40] M. Raju, S.-Y. Kim, A. C. T. van Duin, and K. A. Fichthorn. ReaxFF ReactiveForce Field Study of the Dissociation of Water on Titania Surfaces. J. Phys. Chem.C, 117:10558–10572, 2013.
64
Bibliography
[41] W. L. Jorgensen, J. Chandrasekhar, J. D. Madura, R. W. Impey, and M. L. Klein.Comparison of simple potential functions for simulating liquid water. J. Chem.Phys., 79:926–935, 1983.
[42] Z. B. Kuvadia and M. F. Doherty. Spiral growth model for faceted crystals ofnon-centrosymmetric organic molecules grown from solution. Cryst. Growth Des.,11:2780–2802, 2011.
[43] W. Kossel. Zur theorie des kristallwachstums. Nachur. Ges. Wiss. Gottingen,206:135–143, 1927.
[44] T. Darden, D. York, and L. Pedersen. Particle mesh ewald: An n [center − dot]log(n) method for ewald sums in large systems. J. Chem. Phys., 98:10089–10092,1993.
[45] D. Parry. The electrostatic potential in the surface region of an ionic crystal. Surf.Sci., 49:433 – 440, 1975.
[46] I.-C. Yeh and M. L. Berkowitz. Ewald summation for systems with slab geometry.J. Chem. Phys., 111:3155–3162, 1999.
[47] J. D. Levine and P. Mark. Theory and observation of intrinsic surface states on ioniccrystals. Phys. Rev., 144:751–763, 1966.
[48] E. Garrone, A. Zecchina, and F. S. Stone. An experimental and theoretical eval-uation of surface states in MgO and other alkaline earth oxides. Philos. Mag. B,42:683–703, 1980.
[49] F. Heberling, T. P. Trainor, J. Lutzenkirchen, P. Eng, M. A. Denecke, and D. Bos-bach. Structure and reactivity of the calcite-water interface. J. Colloid InterfaceSci., 354:843 – 857, 2011.
[50] S. H. Kim, P. Dandekar, M. A. Lovette, and M. F. Doherty. Kink rate model for thegeneral case of organic molecular crystals. Cryst. Growth Des., 14:2460–2467, 2014.
[51] P. Hartman and C. Strom. Structural morphology of crystals with the barite (BaSO4)structure: A revision and extension. J. Cryst. Growth, 97:502 – 512, 1989.
[52] P. Hartman. An approximate calculation of attachment energies for ionic crystals.Acta Crystallogr., 9:569–572, 1956.
[53] P. Hartman. The Madelung constants of slices and chains, with an application tothe CdI2 structure. Acta Crystallogr., 11:365–369, 1958.
[54] P. Hartman. Theoretical morphology of crystals with the SnI4 structure. J. Cryst.Growth, 2:385 – 394, 1968.
65
Bibliography
[55] P. Hartman. Crystal Growth: An Introduction, chapter Structure and Morphology,pages 367–402. Amsterdam: North-Holland, 1973.
[56] C. Woensdregt and P. Hartman. Structural morphology of cotunnite, PbCl2, lauri-onite, Pb(OH)Cl, and SbSI. J. Cryst. Growth, 87:561 – 566, 1988.
[57] P. Hartman. The effect of surface relaxation on crystal habit: Cases of corundum(α-Al2O3) and Hematite (α-Fe2O3). J. Cryst. Growth, 96(3):667 – 672, 1989.
[58] B. Sun, P. Hartman, C. Woensdregt, and H. Schmid. Structural morphology ofYBa2Cu3O7−x. J. Cryst. Growth, 100:605 – 614, 1990.
[59] W. Heijnen and P. Hartman. Structural morphology of gypsum (CaSO4.2H2O),brushite (CaHPO4.2H2O) and pharmacolite (CaHAsO4.2H2O). J. Cryst. Growth,108:290 – 300, 1991.
[60] C. S. Strom. Graph-theoretic construction of periodic bond chains I. General case.Z. Kristallogr., 153:99–113, 1980.
[61] C. S. Strom. Graph-theoretic construction of periodic bond chains II. Ionic case. Z.Kristallogr., 154:31–43, 1981.
[62] F. Abbona and D. Aquilano. Springer Handbook of Crystal Growth, chapter Mor-phology of Crystals Grown from Solutions, pages 53–92. Springer-Verlag: BerlinHeidelberg, 2010.
[63] G. Clydesdale, K. J. Roberts, G. B. Telfer, V. R. Saunders, D. Pugh, R. A. Jackson,and P. Meenan. Prediction of the polar morphology of sodium chlorate using asurface-specific attachment energy model. J. Phys. Chem. B, 102:7044–7049, 1998.
[64] L. J. Soltzberg and E. Madden. Crystal morphology prediction and morphologyvariation in NaIO4 and NaIO4.3H2O. Acta Crystallogr., B55:882–885, 1999.
66
Chapter 3
Spiral Growth of Inorganic Crystals
Reproduced in part with permission from: Dandekar, P.; Doherty, M.F. AMechanistic
Growth Model for Inorganic Crystals: Growth Mechanism. AIChE Journal, 2014, (in
press).
3.1 Introduction
In Chapter 2, a mechanistic framework was proposed to model the solid-state inter-
actions in inorganic crystals from a crystal growth and shape evolution point of view.
Modeling surface integration-limited crystal growth from solution requires understand-
ing the solid-state interactions as well as the surface growth mechanisms that govern the
growth process. The importance of the interactions between the crystal and the solvent
in modeling inorganic crystal growth from solution is highlighted by the comparable mag-
nitudes of the lattice energy and the hydration energy for most inorganic solids (both
energies have magnitudes typically > 100 kcal/mol). The lattice energy is dominated by
the interionic long-range electrostatic interactions in the solid state, while the hydration
67
Chapter 3. Spiral Growth of Inorganic Crystals
energy depends on the interactions between the solvated ions and the water molecules
present in the solvation shell. For example, the lattice dissociation enthalpy for cubic
NaCl crystal is 188.1 kcal/mol [1] while the combined hydration enthalpy for Na+ and
Cl− ions is -187.2 kcal/mol [2, 3]. As a result, the dissolution enthalpy for NaCl crystal in
aqueous solution is only 0.9 kcal/mol. Thus, the interactions of the surface growth units
with the solvent play a huge role in determining the kinetics of the individual processes
involved in growth on inorganic crystal surfaces.
Crystal growth of inorganic crystals, such as calcium carbonate, barium sulfate, potas-
sium dihydrogen phosphate (KDP), etc., from solution has been well studied experimen-
tally. The surface growth mechanisms, such as spiral growth and 2D nucleation, have
been experimentally observed using surface characterization techniques such as atomic
force microscopy (AFM) [4–8]. Other characterization techniques such as scanning tun-
neling microscopy (STM), low-energy electron diffraction (LEED), X-ray reflectivity mea-
surements, etc., also provide valuable information about the surface structure and help
elucidate the growth mechanism active on the crystal surface [9]. Crystal growth models
for inorganic solids that have been developed so far can be divided into two categories - (i)
those that study the solid-state interactions on a molecular scale and use the attachment
energy model to predict the crystal growth rate and steady-state morphology [10–13]
and (ii) those that develop a mechanistic growth model but use experimentally fitted
values for nearest-neighbor interactions [14, 15]. A mechanistic crystal growth model
that accounts for the solid-state electrostatic interactions as well as the solvent-solute in-
68
Chapter 3. Spiral Growth of Inorganic Crystals
teractions has not yet been developed for inorganic solids. Such a growth model will have
predictive capability on a macroscopic scale to prescribe more efficient crystal growth ex-
periments. The challenge here is to study both the solid-state interactions and the effect
of the solvent on the growth kinetics in a generalized manner so that the conclusions from
the model predictions can be applied to the crystal growth of a broad class of inorganic
crystal surfaces. A distinction is being made here between growth on non-polar crystal
surfaces and polar crystal surfaces. The stabilization and growth mechanisms on polar
inorganic crystal surfaces is not yet fully understood and will not be discussed here (The
reader is referred to review articles on polarity of oxide crystal surfaces by Diebold et
al. [16] and Goniakowski et al. [17]). The subject of this study is the growth mechanism
active on non-polar inorganic crystal surfaces that do not undergo significant surface
reconstruction to stabilize themselves.
In this chapter, a generalized methodology is presented to study the spiral growth
mechanism on inorganic crystal surfaces. The step velocities of spiral edges on an in-
organic crystal surface can be calculated using the kink rate and kink density models
discussed here. The density of kink sites along a spiral edge is calculated from the equi-
librium distribution of disturbances due to thermal roughening [18, 19]. The rate of
kink propagation on an ionic step edge is calculated using steady-state site balances with
appropriate expressions for the kink attachment and detachment fluxes that account for
solution composition and kink site interaction energies. This mechanistic growth model
is applied to the crystal growth on the {1014} family of faces on calcite (CaCO3) crystals.
69
Chapter 3. Spiral Growth of Inorganic Crystals
Calcite is the most stable and abundant polymorph of calcium carbonate and its crystal
growth is well studied from a biomineralization perspective [20]. The surface growth
mechanisms in the presence of impurities such as Mg2+, Sr2+, biomolecules, etc. that are
typically present in the marine ecosystem, are well studied experimentally [21–25]. This
model does well in predicting the shape of the growth spirals formed on calcite crystal
surfaces, but also the effect of the environmental composition on the step velocities of
the spiral edges on the (1014) calcite surface. The model can be applied to study crystal
growth, shape evolution and the steady-state shape achieved by typical inorganic salts
grown from aqueous solution.
3.2 Growth Mechanism
Growth of crystal surfaces occurs under non-equilibrium conditions when the chemical
potential of the growth medium (µm) is greater than the chemical potential of the bulk
crystal (µc). The difference (∆µ) between these chemical potentials is the driving force
for crystal growth.
∆µ = µm − µc (3.1)
When the rate of mass transfer between the bulk growth medium and the crystal
surface is much faster than the rate of incorporation of the growth units into the crystal
lattice, crystal surfaces grow by a layered growth mechanism. The crystal surface grows
by the attachment of growth units along steps present on the surface. These steps may
originate from either growth spirals or 2D nuclei present on the surface. At low super-
70
Chapter 3. Spiral Growth of Inorganic Crystals
saturation, the activation energy for the formation of 2D nuclei is very high, therefore,
the growth rate is dominated by the spiral growth mechanism [26, 27]. A crystal surface
contains screw dislocations that act as the source of atomic steps where growth units are
preferentially incorporated into the crystal. These steps spread across the surface due
to the attachment of growth units and result in a self-perpetuating growth of layers on
top of other layers that gives rise to growth hillocks with a spiral pattern [19, 28]. The
perpendicular growth rate Ghkl,s of a crystal face with Miller index {hkl}, growing by
the spiral growth mechanism, is related to the rotation time τs of the growth spiral as
follows [28]
Ghkl,s =
(
h
τs
)
hkl
(3.2)
τs =N∑
i=1
li+1,c sin(αi,i+1)
vi
(3.3)
where h is the height of the spiral edge, N is the number of edges in the growth spiral, li,c
is the critical length of spiral edge i, αi,i+1
is the angle between edges i and i+1 and viis
the step velocity of edge i. The critical length li,c of edge i is the minimum length below
which the edge does not grow [28]. Since a spiral edge moves by the incorporation of
growth units into the kink sites present along the edge, the growth kinetics of the crystal
surface depends on the rate of attachment of growth units into kink sites.
The step velocity of each spiral edge on every surface of the crystal must be calculated
to predict the growth rates and therefore the steady-state crystal morphology. The step
71
Chapter 3. Spiral Growth of Inorganic Crystals
velocity viof a spiral edge i is written as follows [14, 29]
vi= a
p,iρ
iu
i(3.4)
where ap,i
is the perpendicular distance between two rows of the spiral edge i (units
of A or nm), ρiis the density of kink sites along the edge i (dimensionless) and u
i
is the net rate of attachment of growth units into the kink sites (units of s−1). ap
depends on the crystallography and step structure while the kink density is given by
the thermodynamics of creating kink sites from a straight step edge [19]. Kink rate
u captures the kinetics of the crystal growth process and combines the rates of the
competing processes of attachment and detachment of growth units into and from the
kink sites, respectively. The density of kink sites along an edge and the net rate of
incorporation into the kink sites depend on the interaction energies of growth units along
the edge. Therefore, the first step in crystal growth modeling is the identification of the
Periodic Bond Chain (PBC) directions that are parallel to the strongest intermolecular
interactions between the growth units in the solid-state. A systematic method to identify
the PBC directions in inorganic crystals has been presented in Chapter 2. The interaction
energies of growth units present along the spiral edges are calculated while including the
surface effect on the partial charges of growth units and the long-range electrostatic
interactions. A general method that uses those interaction energies to calculate the
kink density and the kink rate for inorganic crystal growth is presented in the following
sections.
72
Chapter 3. Spiral Growth of Inorganic Crystals
3.3 Kink Density Calculation
The edges on a crystal surface undergo constant thermal fluctuation and are never
completely straight at any temperature T > 0 K [19]. These thermal fluctuations provide
a finite density of kink sites along the edge where growth units attach. The density of
these kink sites or the spacing between two successive kink sites along the edge partially
determines the net rate at which the step edge moves due to attachment of growth units
(see equation 3.4).
Using the statistical mechanics of fluctuations, Frenkel [18] and Burton et al. [19]
developed a method to calculate the density of kink sites along an edge. The probability
of finding a kink site along the edge depends on the energy required to rearrange two
adjacent growth units from a straight edge to form an edge with four kink sites [19]. If
the energy required per kink site for this rearrangement, called the kink energy, is of
the order of thermal energy (kBT ), the rearrangement occurs on a time scale faster than
the attachment/detachment of growth units into the kink sites [30]. Therefore, the edge
structure is always in quasi-equilibrium with respect to the growth medium and the kink
sites are Boltzmann distributed.
Kuvadia and Doherty proposed a systematic method to calculate the kink density on
step edges with multiple types of kink sites on organic crystal surfaces [29]. The probabil-
ity of observing any type of kink site can be computed by counting all the microstates of
edge rearrangements that expose that particular kink type and by calculating the energy
for each rearrangement.
73
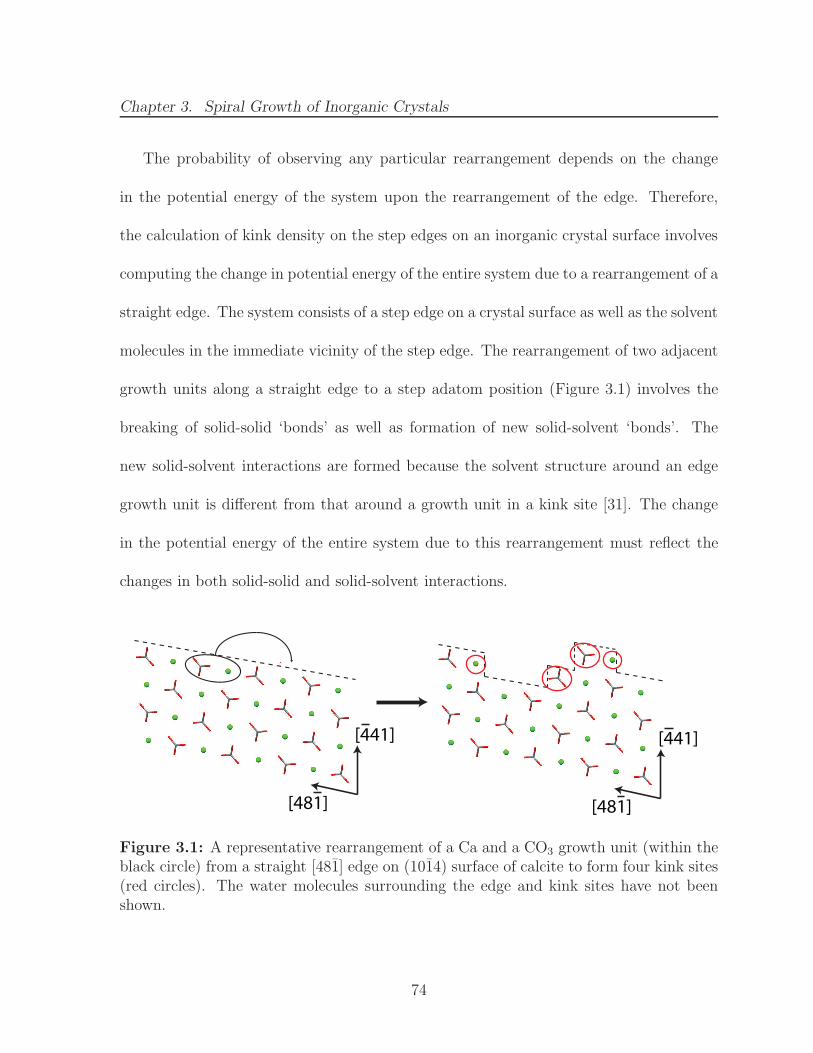
Chapter 3. Spiral Growth of Inorganic Crystals
The probability of observing any particular rearrangement depends on the change
in the potential energy of the system upon the rearrangement of the edge. Therefore,
the calculation of kink density on the step edges on an inorganic crystal surface involves
computing the change in potential energy of the entire system due to a rearrangement of a
straight edge. The system consists of a step edge on a crystal surface as well as the solvent
molecules in the immediate vicinity of the step edge. The rearrangement of two adjacent
growth units along a straight edge to a step adatom position (Figure 3.1) involves the
breaking of solid-solid ‘bonds’ as well as formation of new solid-solvent ‘bonds’. The
new solid-solvent interactions are formed because the solvent structure around an edge
growth unit is different from that around a growth unit in a kink site [31]. The change
in the potential energy of the entire system due to this rearrangement must reflect the
changes in both solid-solid and solid-solvent interactions.
[481]
[441]
[481]
[441]
Figure 3.1: A representative rearrangement of a Ca and a CO3 growth unit (within theblack circle) from a straight [481] edge on (1014) surface of calcite to form four kink sites(red circles). The water molecules surrounding the edge and kink sites have not beenshown.
74
Chapter 3. Spiral Growth of Inorganic Crystals
At higher supersaturation values (S > 1.2), the step rearrangement will compete
with kink incorporation attachment such that the step edge structure will no longer be
in quasi-equilibrium with the growth medium (see Appendix C). The density of kink sites
will then depend on the thermodynamics of edge rearrangement as well as the kinetics
of kink incorporation.
The kink densities on the spiral edges of the (1014) surface of calcite were calculated
using this method. As discussed previously, there are two spiral edges - [441] and [481] on
the (1014) surface of calcite. Each of these two edges has obtuse and acute orientations
depending on the angle that the step edge makes with the plane of the crystal surface.
It has been shown in Chapter 2 that either of the orientations on both [441] and [481]
edges are symmetrically equivalent so only the [481] edge is discussed henceforth (Figure
3.1).
The [481] edge has four growth units that repeat along the edge - two calcium and two
carbonate ions. The two carbonate growth units differ in their orientations, therefore,
the two calcium growth units situated between them have different interaction energies.
When considering the rearrangement of a straight [481] edge, there are four choices to
select a pair of adjacent growth units along the edge to be moved. Similarly, there are
four choices for the final positions of the earlier selected pair of growth units as step
adatoms. Therefore, there are 16 possible rearrangements on each obtuse and acute
orientation of the [481] edge. Also, each of the kink sites on the edge can have two
possible orientations - E and W . The E and W orientations of the kink sites correspond
75
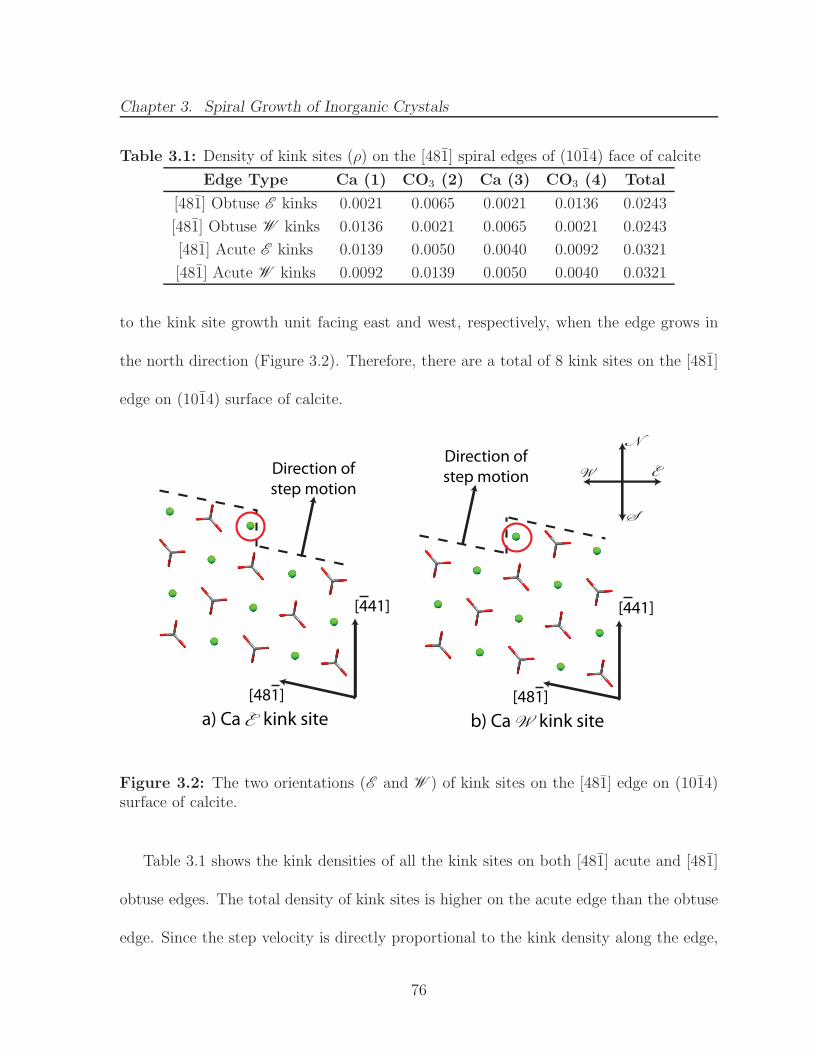
Chapter 3. Spiral Growth of Inorganic Crystals
Table 3.1: Density of kink sites (ρ) on the [481] spiral edges of (1014) face of calcite
Edge Type Ca (1) CO3 (2) Ca (3) CO3 (4) Total
[481] Obtuse E kinks 0.0021 0.0065 0.0021 0.0136 0.0243
[481] Obtuse W kinks 0.0136 0.0021 0.0065 0.0021 0.0243
[481] Acute E kinks 0.0139 0.0050 0.0040 0.0092 0.0321
[481] Acute W kinks 0.0092 0.0139 0.0050 0.0040 0.0321
to the kink site growth unit facing east and west, respectively, when the edge grows in
the north direction (Figure 3.2). Therefore, there are a total of 8 kink sites on the [481]
edge on (1014) surface of calcite.
a) Ca E kink site b) Ca W kink site
Direction of step motionDirection of
step motion
N
S
EW
[441]
[481]
[441]
[481]
Figure 3.2: The two orientations (E and W ) of kink sites on the [481] edge on (1014)surface of calcite.
Table 3.1 shows the kink densities of all the kink sites on both [481] acute and [481]
obtuse edges. The total density of kink sites is higher on the acute edge than the obtuse
edge. Since the step velocity is directly proportional to the kink density along the edge,
76
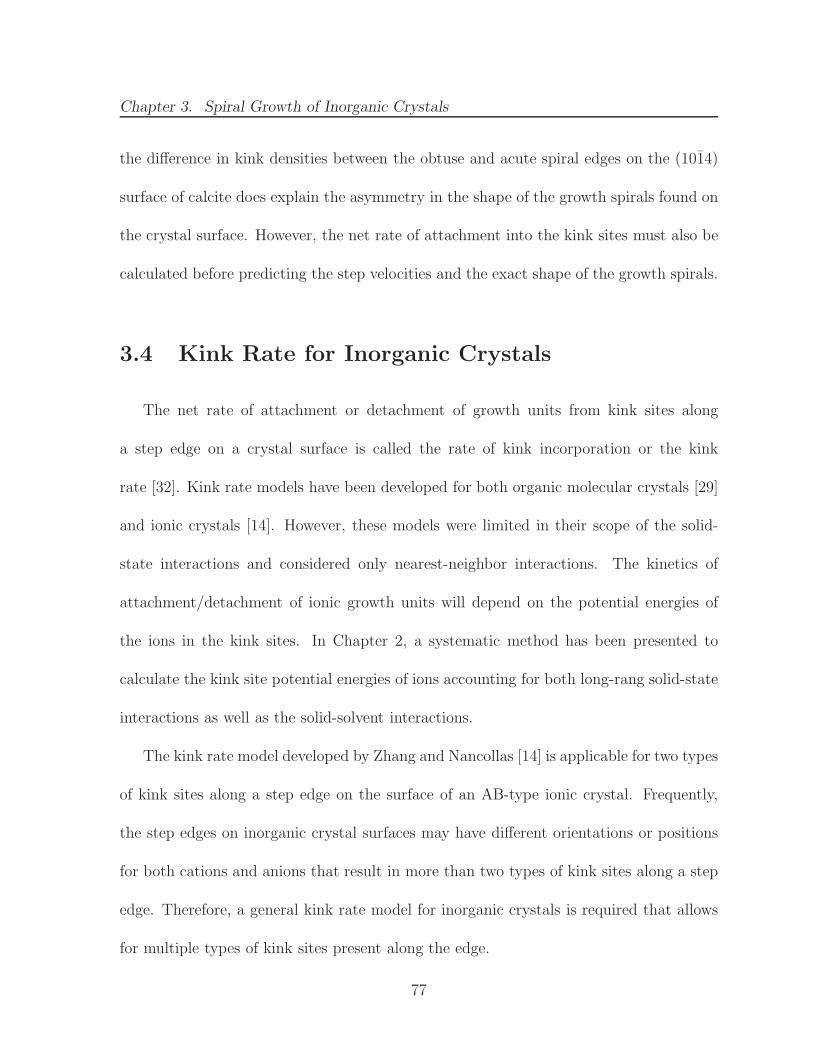
Chapter 3. Spiral Growth of Inorganic Crystals
the difference in kink densities between the obtuse and acute spiral edges on the (1014)
surface of calcite does explain the asymmetry in the shape of the growth spirals found on
the crystal surface. However, the net rate of attachment into the kink sites must also be
calculated before predicting the step velocities and the exact shape of the growth spirals.
3.4 Kink Rate for Inorganic Crystals
The net rate of attachment or detachment of growth units from kink sites along
a step edge on a crystal surface is called the rate of kink incorporation or the kink
rate [32]. Kink rate models have been developed for both organic molecular crystals [29]
and ionic crystals [14]. However, these models were limited in their scope of the solid-
state interactions and considered only nearest-neighbor interactions. The kinetics of
attachment/detachment of ionic growth units will depend on the potential energies of
the ions in the kink sites. In Chapter 2, a systematic method has been presented to
calculate the kink site potential energies of ions accounting for both long-rang solid-state
interactions as well as the solid-solvent interactions.
The kink rate model developed by Zhang and Nancollas [14] is applicable for two types
of kink sites along a step edge on the surface of an AB-type ionic crystal. Frequently,
the step edges on inorganic crystal surfaces may have different orientations or positions
for both cations and anions that result in more than two types of kink sites along a step
edge. Therefore, a general kink rate model for inorganic crystals is required that allows
for multiple types of kink sites present along the edge.
77
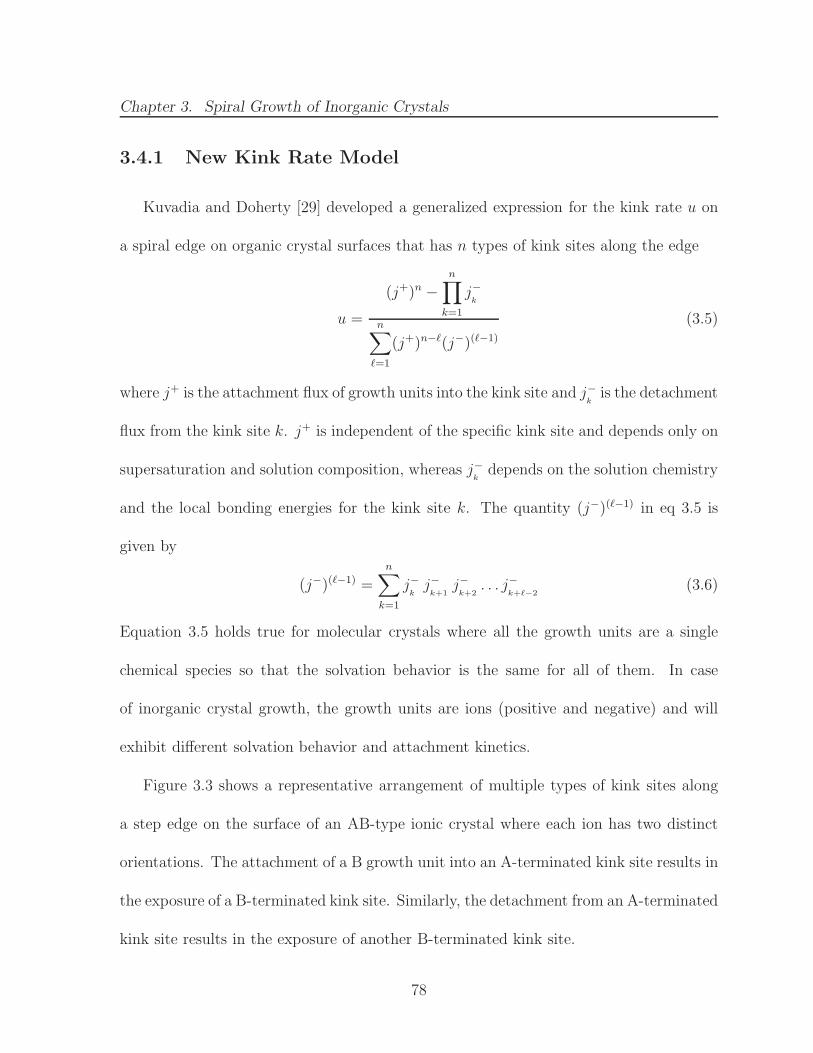
Chapter 3. Spiral Growth of Inorganic Crystals
3.4.1 New Kink Rate Model
Kuvadia and Doherty [29] developed a generalized expression for the kink rate u on
a spiral edge on organic crystal surfaces that has n types of kink sites along the edge
u =
(j+)n −n∏
k=1
j−k
n∑
ℓ=1
(j+)n−ℓ(j−)(ℓ−1)
(3.5)
where j+ is the attachment flux of growth units into the kink site and j−kis the detachment
flux from the kink site k. j+ is independent of the specific kink site and depends only on
supersaturation and solution composition, whereas j−kdepends on the solution chemistry
and the local bonding energies for the kink site k. The quantity (j−)(ℓ−1) in eq 3.5 is
given by
(j−)(ℓ−1) =n∑
k=1
j−kj−k+1
j−k+2
. . . j−k+ℓ−2
(3.6)
Equation 3.5 holds true for molecular crystals where all the growth units are a single
chemical species so that the solvation behavior is the same for all of them. In case
of inorganic crystal growth, the growth units are ions (positive and negative) and will
exhibit different solvation behavior and attachment kinetics.
Figure 3.3 shows a representative arrangement of multiple types of kink sites along
a step edge on the surface of an AB-type ionic crystal where each ion has two distinct
orientations. The attachment of a B growth unit into an A-terminated kink site results in
the exposure of a B-terminated kink site. Similarly, the detachment from an A-terminated
kink site results in the exposure of another B-terminated kink site.
78
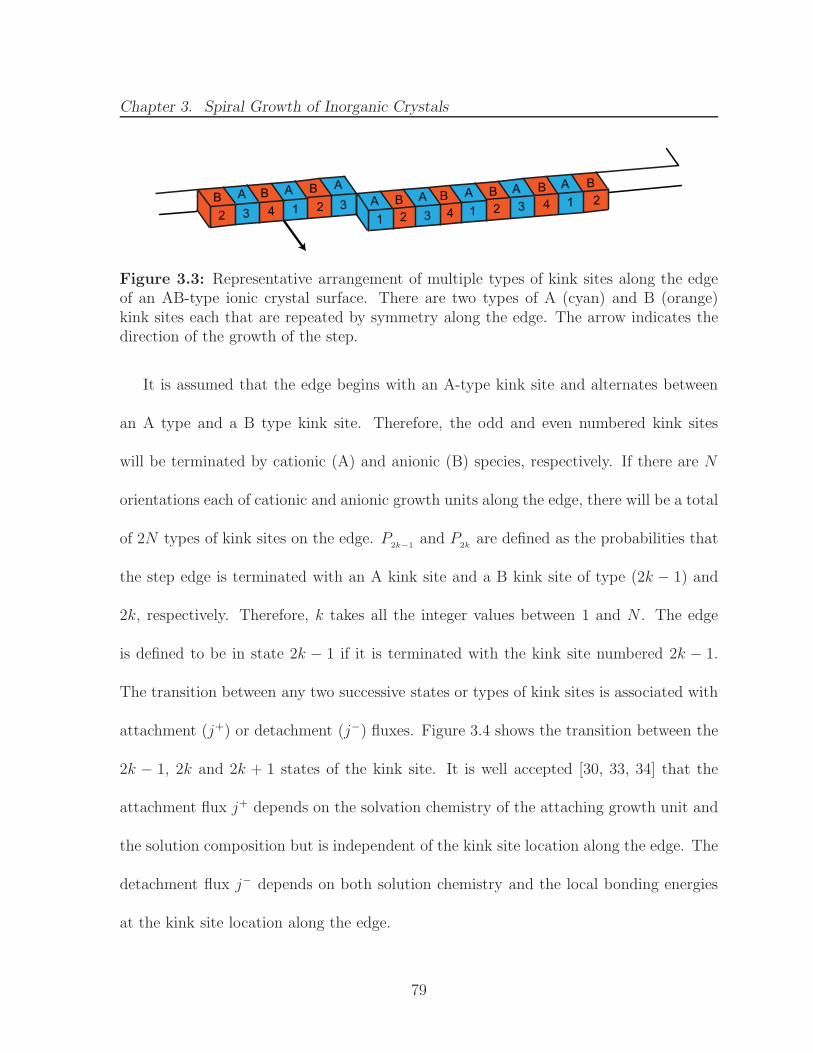
Chapter 3. Spiral Growth of Inorganic Crystals
11
13
333 1
22
2
224
44
A A A A AAAA B B B B BB B B
Figure 3.3: Representative arrangement of multiple types of kink sites along the edgeof an AB-type ionic crystal surface. There are two types of A (cyan) and B (orange)kink sites each that are repeated by symmetry along the edge. The arrow indicates thedirection of the growth of the step.
It is assumed that the edge begins with an A-type kink site and alternates between
an A type and a B type kink site. Therefore, the odd and even numbered kink sites
will be terminated by cationic (A) and anionic (B) species, respectively. If there are N
orientations each of cationic and anionic growth units along the edge, there will be a total
of 2N types of kink sites on the edge. P2k−1
and P2k
are defined as the probabilities that
the step edge is terminated with an A kink site and a B kink site of type (2k − 1) and
2k, respectively. Therefore, k takes all the integer values between 1 and N . The edge
is defined to be in state 2k − 1 if it is terminated with the kink site numbered 2k − 1.
The transition between any two successive states or types of kink sites is associated with
attachment (j+) or detachment (j−) fluxes. Figure 3.4 shows the transition between the
2k − 1, 2k and 2k + 1 states of the kink site. It is well accepted [30, 33, 34] that the
attachment flux j+ depends on the solvation chemistry of the attaching growth unit and
the solution composition but is independent of the kink site location along the edge. The
detachment flux j− depends on both solution chemistry and the local bonding energies
at the kink site location along the edge.
79
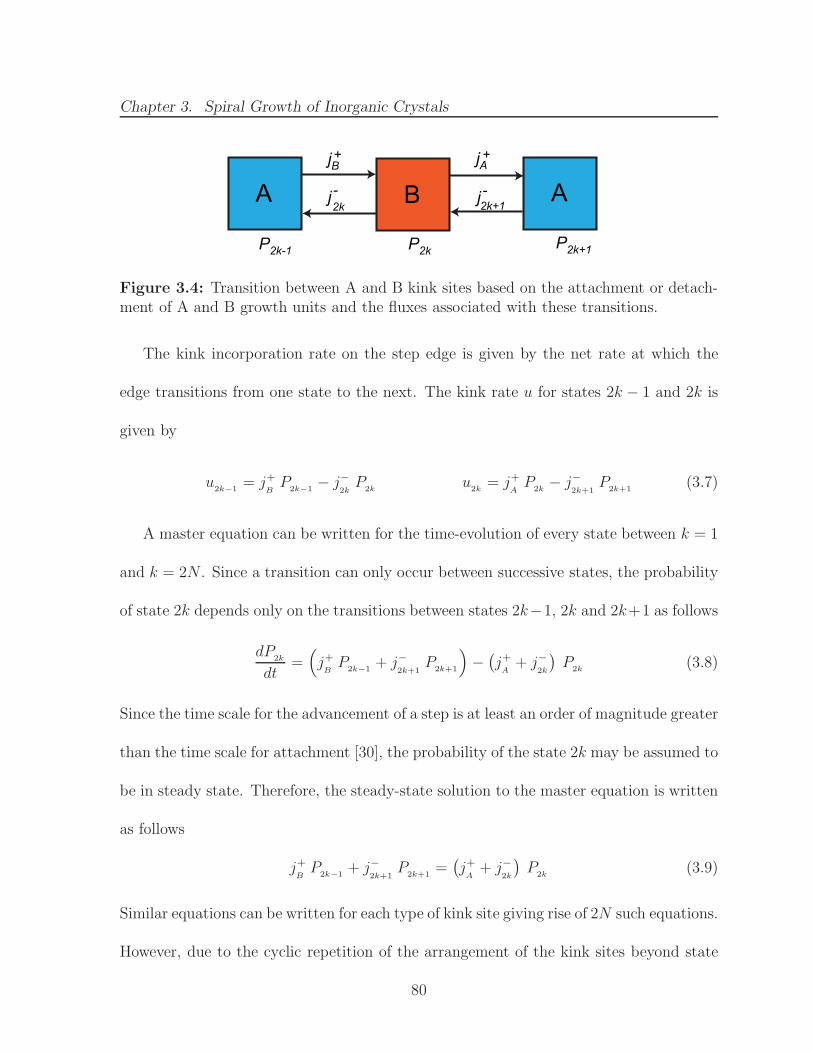
Chapter 3. Spiral Growth of Inorganic Crystals
P2k-1 P2kP2k+1
jB jA
j
-j
-A AB2k 2k+1
+ +
Figure 3.4: Transition between A and B kink sites based on the attachment or detach-ment of A and B growth units and the fluxes associated with these transitions.
The kink incorporation rate on the step edge is given by the net rate at which the
edge transitions from one state to the next. The kink rate u for states 2k − 1 and 2k is
given by
u2k−1
= j+BP
2k−1− j−
2kP
2ku
2k= j+
AP
2k− j−
2k+1P
2k+1(3.7)
A master equation can be written for the time-evolution of every state between k = 1
and k = 2N . Since a transition can only occur between successive states, the probability
of state 2k depends only on the transitions between states 2k−1, 2k and 2k+1 as follows
dP2k
dt=(
j+BP
2k−1+ j−
2k+1P
2k+1
)
−(
j+A+ j−
2k
)
P2k
(3.8)
Since the time scale for the advancement of a step is at least an order of magnitude greater
than the time scale for attachment [30], the probability of the state 2k may be assumed to
be in steady state. Therefore, the steady-state solution to the master equation is written
as follows
j+BP
2k−1+ j−
2k+1P
2k+1=(
j+A+ j−
2k
)
P2k
(3.9)
Similar equations can be written for each type of kink site giving rise of 2N such equations.
However, due to the cyclic repetition of the arrangement of the kink sites beyond state
80
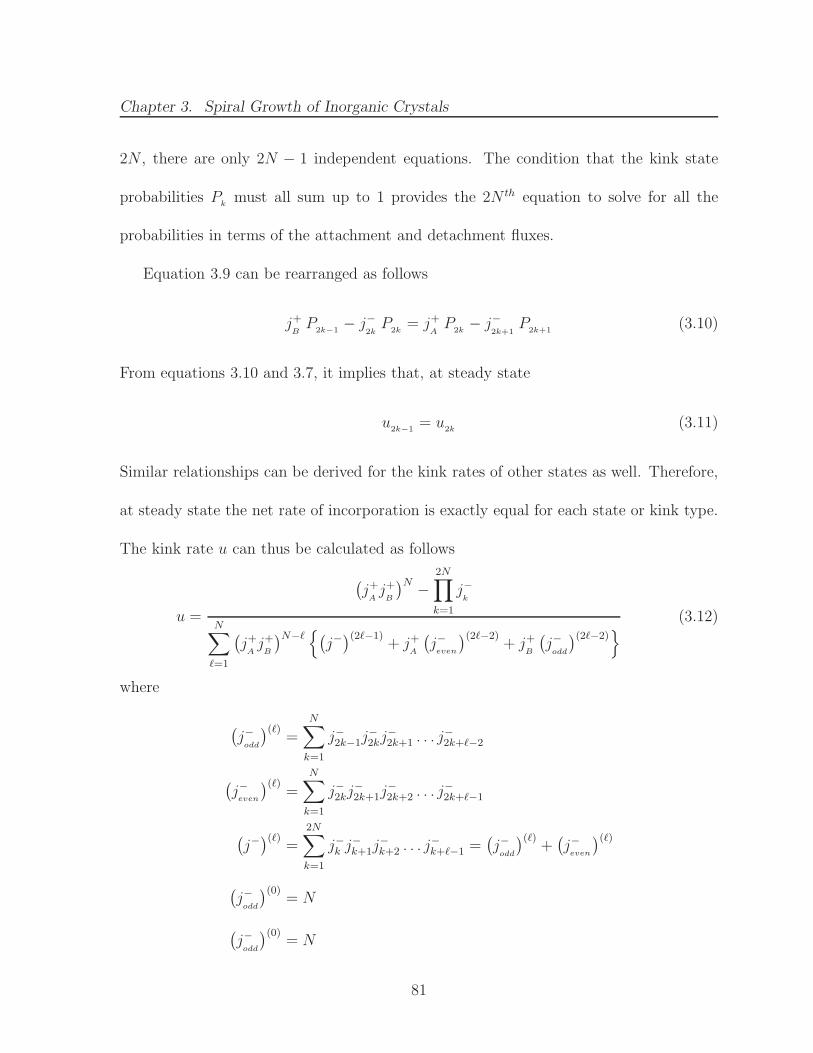
Chapter 3. Spiral Growth of Inorganic Crystals
2N , there are only 2N − 1 independent equations. The condition that the kink state
probabilities Pkmust all sum up to 1 provides the 2N th equation to solve for all the
probabilities in terms of the attachment and detachment fluxes.
Equation 3.9 can be rearranged as follows
j+BP
2k−1− j−
2kP
2k= j+
AP
2k− j−
2k+1P
2k+1(3.10)
From equations 3.10 and 3.7, it implies that, at steady state
u2k−1
= u2k
(3.11)
Similar relationships can be derived for the kink rates of other states as well. Therefore,
at steady state the net rate of incorporation is exactly equal for each state or kink type.
The kink rate u can thus be calculated as follows
u =
(
j+Aj+B
)N −2N∏
k=1
j−k
N∑
ℓ=1
(
j+Aj+B
)N−ℓ{
(
j−)(2ℓ−1)
+ j+A
(
j−even
)(2ℓ−2)+ j+
B
(
j−odd
)(2ℓ−2)}
(3.12)
where
(
j−odd
)(ℓ)=
N∑
k=1
j−2k−1j−
2kj−
2k+1 . . . j−
2k+ℓ−2
(
j−even
)(ℓ)=
N∑
k=1
j−2kj−
2k+1j−
2k+2 . . . j−
2k+ℓ−1
(
j−)(ℓ)
=2N∑
k=1
j−k j−
k+1j−
k+2 . . . j−
k+ℓ−1 =(
j−odd
)(ℓ)+(
j−even
)(ℓ)
(
j−odd
)(0)= N
(
j−odd
)(0)= N
81
Chapter 3. Spiral Growth of Inorganic Crystals
Equation 3.12 can be used to calculate the kink rate u on any edge on any crystal
surface, provided the attachment and detachment fluxes (j+ and j−, respectively) from
kink sites are known. The expressions for the kink state probabilities are discussed in
Appendix B. General expressions for these fluxes and a systematic method for their
calculation are discussed next.
3.4.2 Expressions for Attachment and Detachment Fluxes
Transition state theory (TST) [35] has been used here to calculate the kink site
attachment and detachment fluxes. The reaction coordinate is assumed to be the distance
from the kink site towards the solution so that the reactant state corresponds to the
growth unit docked in its kink site and the product state corresponds to the growth
unit fully solvated in bulk solution (Figure 3.5). The transition state corresponds to a
partially broken solvation shell that is also partially bonded to its neighbors around the
kink site. In this case, the attachment and detachment fluxes depend on the reverse and
forward “reaction rates”, respectively, as shown in eqs 3.13 and 3.14.
A generalized model for the attachment and detachment fluxes must account for the
presence of both cationic and anionic growth units in the solution. Additives, impurities,
counterions and antisolvents, etc. may also be present in the solution. These species can
be classified into three groups - (I) species that can incorporate into the crystal lattice
(e.g., chemically similar additives or growth modifiers such as Mg2+ ions in calcite), (II)
species that influence detachment of growth units from kink sites (e.g., antisolvent), and
82
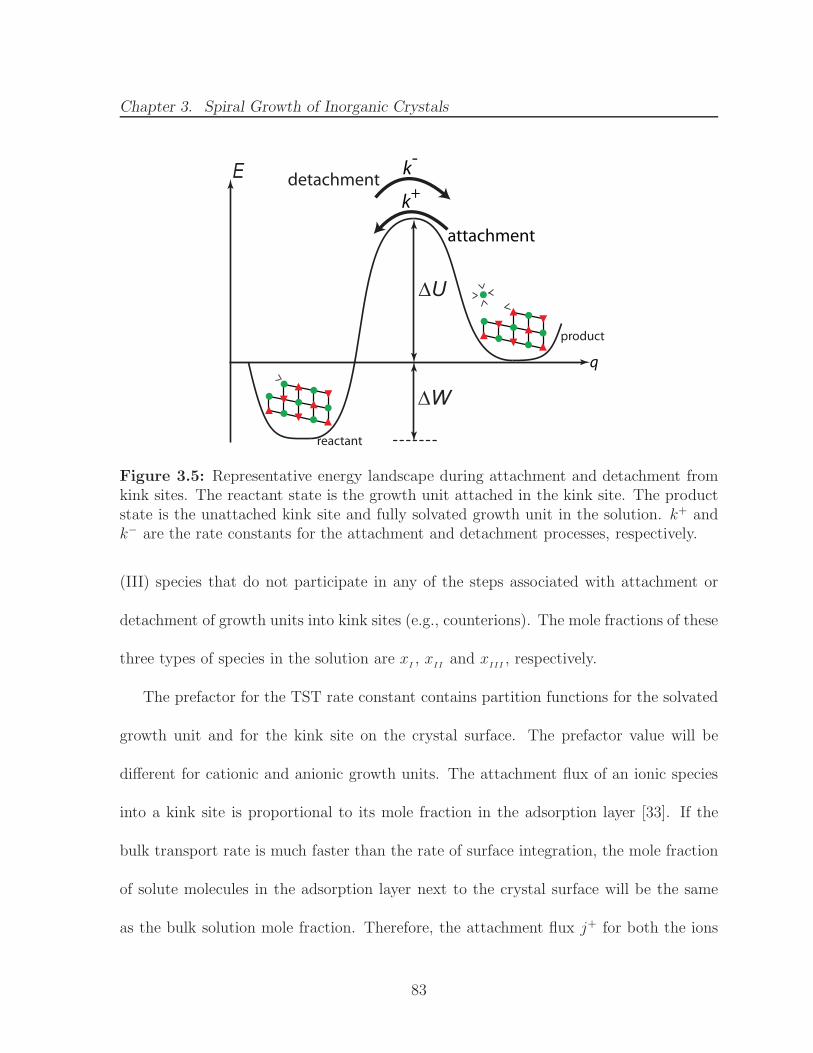
Chapter 3. Spiral Growth of Inorganic Crystals
∆U
E
∆W
attachment
reactant
product
q
detachmentk
-
k+
Figure 3.5: Representative energy landscape during attachment and detachment fromkink sites. The reactant state is the growth unit attached in the kink site. The productstate is the unattached kink site and fully solvated growth unit in the solution. k+ andk− are the rate constants for the attachment and detachment processes, respectively.
(III) species that do not participate in any of the steps associated with attachment or
detachment of growth units into kink sites (e.g., counterions). The mole fractions of these
three types of species in the solution are xI, x
IIand x
III, respectively.
The prefactor for the TST rate constant contains partition functions for the solvated
growth unit and for the kink site on the crystal surface. The prefactor value will be
different for cationic and anionic growth units. The attachment flux of an ionic species
into a kink site is proportional to its mole fraction in the adsorption layer [33]. If the
bulk transport rate is much faster than the rate of surface integration, the mole fraction
of solute molecules in the adsorption layer next to the crystal surface will be the same
as the bulk solution mole fraction. Therefore, the attachment flux j+ for both the ions
83
Chapter 3. Spiral Growth of Inorganic Crystals
is written as
j+A= ν
Aexp
(
−∆UA
kBT
)
xA= k+
Ax
A(3.13)
j+B= ν
Bexp
(
−∆UB
kBT
)
xB= k+
Bx
B
where νAand ν
Bare the vibrational frequencies of attachment and detachment attempts
that depend on the temperature and the partition functions of the solute, solvent and
the transition state solvated complex. These frequencies are assumed to be the same
everywhere on the crystal surface. The attachment energy barriers correspond to the
breaking of the solvation shell around the growth units so the barrier heights ∆UAand
∆UBwill be constant on all crystal faces. x
Aand x
Bare the respective mole fractions of
the cationic and anionic growth units in the solution. k+Aand k+
Bare the first order rate
constants for attachment of A and B ions, respectively, into kink sites.
The detachment flux for both types of growth units is proportional to the combined
mole fraction of solvent molecules and species of type II in the adsorption layer [33]. The
detachment flux j− for each of the kink sites is given by
j−2k−1
= (1− xA− x
B− x
I− x
III) ν
Aexp
(
−∆UA+∆W
2k−1
kBT
)
(3.14)
j−2k
= (1− xA− x
B− x
I− x
III) ν
Bexp
(
−∆UB+∆W
2k
kBT
)
k = 1, 2, 3 . . . , N
where ∆W2k−1
is the work required to remove the partially solvated growth unit from the
2k−1 kink site position to a fully solvated state in the bulk solution. ∆W2k−1
depends on
the interactions between the growth unit which is docked in the 2k− 1 kink site and the
crystal as well as its interactions with the solvent. For vapor grown crystals, ∆W2k−1
will
84
Chapter 3. Spiral Growth of Inorganic Crystals
be given by the sum of the solid broken bond energies at kink site 2k − 1. As discussed
earlier, j−2k−1
and j−2k
are the detachment fluxes for the 2k− 1 (cationic) and 2k (anionic)
kink sites, respectively. The expressions for the attachment and detachment fluxes from
eqs 3.13 and 3.14, respectively, can be put into eq 3.12 to calculate the kink propagation
rate at any step edge on an inorganic crystal surface. It is convenient to express the
mole fractions of A and B ions in the solution (xAand x
B, respectively) in terms of two
experimental parameters - supersaturation S, and ionic activity ratio r.
Supersaturation or saturation ratio S of the aqueous solution of a general electrolyte
AαBβis defined in terms of the difference between the chemical potentials of the solution
phase and the crystal as follows [14, 36, 37]
∆µ = (α + β)kBT lnS = kBT ln
(
aα
Aa
β
B
Ksp
)
(3.15)
whereKsp is the solubility product of AαBβsalt. For an AB type salt, the supersaturation
S is defined as
S =
(
aAa
B
Ksp
)1/2
=
(
(MγAx
A) (Mγ
Bx
B)
Ksp
)1/2
=
(
γAγ
Bx
Ax
B
Ksp/M2
)1/2
(3.16)
where γAand γ
Bare the activity coefficients, and M is the molarity of the solution.
For dilute aqueous solutions, M = 55.56 mol.L−1. A supersaturated solution is also
quantified by the saturation index (SI) in geochemistry literature [38]. In solution growth
literature [30, 37], the level of supersaturation is often written as σ = CCeq
− 1, where C
and Ceq are the solute concentrations in the supersaturated and saturated solutions,
respectively. The relationship between S, σ and saturation index SI for an AB type
85
Chapter 3. Spiral Growth of Inorganic Crystals
electrolyte is
σ = S − 1 =
(
aAa
B
Ksp
)1/2
− 1 (3.17)
SI = log
(
aAa
B
Ksp
)
= log S2 = log (1 + σ)2 (3.18)
S (from eq 3.16) will be used to quantify a supersaturated solution in this chapter. The
ionic activity ratio r is defined as
r =a
A
aB
=γ
Ax
A
γBx
B
(3.19)
The relationship between the mole fractions (xAand x
B), supersaturation S, and activity
ratio r (from eqs 3.16 and 3.19) is
xA=
S√r
γA
(
√
Ksp
M
)
xB=
S
γB
√r
(
√
Ksp
M
)
(3.20)
These two experimental parameters (S and r) can be independently manipulated during
the crystallization process. The more common experimental cases are when either the
supersaturation [39] or the ionic activity ratio is constant [40].
The condition of thermodynamic equilibrium provides a relationship between the
attachment and detachment fluxes. At equilibrium, the step velocity is zero so the kink
rate must be zero. It follows from eq 3.12 that at equilibrium,
(
j+A,eq
j+B,eq
)N
=
2N∏
k=1
j−k,eq
(3.21)
The equilibrium attachment and detachment fluxes are obtained by replacing xAand x
B
in eqs 3.13 and 3.14 by xA,eq
and xB,eq
, respectively. The expressions for j+eq and j−eq are
86
Chapter 3. Spiral Growth of Inorganic Crystals
substituted into eq 3.21, which results in
− 1
2N
2N∑
k=1
(
∆Wk
kBT
)
= ln
√
xA,eq
xB,eq
1− xA,eq
− xB,eq
− xI− x
III
(3.22)
The left-hand side of eq 3.22 contains quantities that are calculated from the intermolec-
ular interactions while the right-hand side contains quantities whose values are experi-
mentally obtained. Therefore, this equation can be used as a consistency check to verify
the calculations of the solid-state and solvent interaction energies, so that the calculated
values of ∆Wkfrom the model are consistent with the equilibrium mole fractions calcu-
lated from the experimentally obtained value of the solubility product Ksp (by putting
S = 1 in eq 3.20). If the two sides of eq 3.22 do not match, a local solubility product
K′
sp near the crystal surface can be calculated from the ∆Wk values as follows
K′
sp =
γAγ
BM2(
1− xI− x
III
)2
exp
{
− 1
N
2N∑
k=1
(
∆Wk
kBT
)
}
[
1 +
(
1 + reqγB/γ
A√
reqγB/γ
A
)
exp
{
− 1
2N
2N∑
k=1
(
∆Wk
kBT
)
}]2 (3.23)
where req is the value of the ionic activity ratio at equilibrium. If the crystallization
process occurs at constant ionic activity ratio, req = r and eq 3.23 can be used to
calculate the local solubility product and hence the equilibrium mole fractions of A and
B (from eq 3.20). However, if the crystallization process occurs at variable r, req may
be different from the variable values of r. In that case, eq 3.23 can be solved only if the
equilibrium mole fractions of A and B are very small (xA,eq
, xB,eq
≪ 1). Equation 3.23 is
then simplified as follows
K′
sp = γAγ
BM2(
1− xI− x
III
)2
exp
{
− 1
N
2N∑
k=1
(
∆Wk
kBT
)
}
(3.24)
87
Chapter 3. Spiral Growth of Inorganic Crystals
The solubility of several inorganic crystals, such as calcite, barite, rutile, KDP, etc.,
in water is very low [1, 41]. Therefore, the assumption that xA,eq
, xB,eq
≪ 1 is quite
reasonable for these crystals. For the sake of internal consistency, the value of K′
sp from
eq 3.24 is used instead of the experimental value (Ksp) in the subsequent equations.
The mole fractions of A and B in the supersaturated solution (xA
and xB) are thus
calculated by substituting Ksp with K′
sp in eq 3.20. The activity coefficients γAand γ
B
are calculated using Davies equation [42] that extends the Debye-Huckel theory to high
concentration electrolyte solutions. If the mole fraction of the counterions present in
the solution (xIII
) is much higher than xAand x
B, the activity coefficients are constant
between the saturated and supersaturated solution and do not depend on xAand x
B.
The attachment and detachment fluxes are written in terms of the supersaturation
S, ionic activity ratio r and the local solubility product K′
sp from eqs 3.13 and 3.14.
The calculation of the kink rate u from eq 3.12 requires that kink detachment work ∆W
values be known. The detailed expressions for j+, j− and u as functions of S, r and ∆W
are given in Appendix B.
The kink site potential energies calculated in Chapter 2 are used to calculate the kink
detachment work ∆W . The species involved in the detachment process are - the growth
unit about to be detached, the growth unit that forms the next kink site along the edge,
and the solvent molecules that solvate both these growth units. Therefore, calculation of
∆W involves computing the kink site energies of the two successive growth units along
the edge (Figure 3.6). The information on solvent structure around the kink site is used
88
Chapter 3. Spiral Growth of Inorganic Crystals
along with the space partitioning method to calculate the partial charges on the surface
ions and the potential energy of a growth unit in the kink site. Knowledge of the structure
of the solvent shell around a growth unit in bulk solution, including the number of solvent
molecules in the shell and their distances from the growth unit, is required to calculate
the potential energy of the solvated growth unit. The solvation information of Ca2+ and
CO32− ions for calcite crystal growth was obtained from molecular simulations [31, 43, 44].
The expression for ∆W in terms of the kink site potential energy Ukink and potential
energy of solvated ion Usolvated is given as follows
∆W2k−1 = UsolvatedA
+ Ukink2k
− Ukink2k−1
− Ustep2k
(3.25)
∆W2k = UsolvatedB
+ Ukink2k+1
− Ukink2k
− Ustep2k+1
(3.26)
where Ustep is the potential energy of an ion present along the step edge next to the kink
site growth unit. Ustep is calculated using the space partitioning method with the partial
charges for the atoms in the growth unit corresponding to that for a growth unit situated
along the step edge. Figure 3.6 illustrates the kink detachment process and the change
in the configuration of a B growth unit that lies next to the A type kink site along the
step edge and forms the new kink site (B type) after detachment of the A growth unit.
Table 3.2 shows the values of the kink detachment work (∆W ) for the kink sites
on the [481] spiral edges (acute and obtuse) on a calcite (1014) surface. As mentioned
earlier, the ∆W values are the same for the kink sites on the symmetrically equivalent
edges along the [441] direction.
89
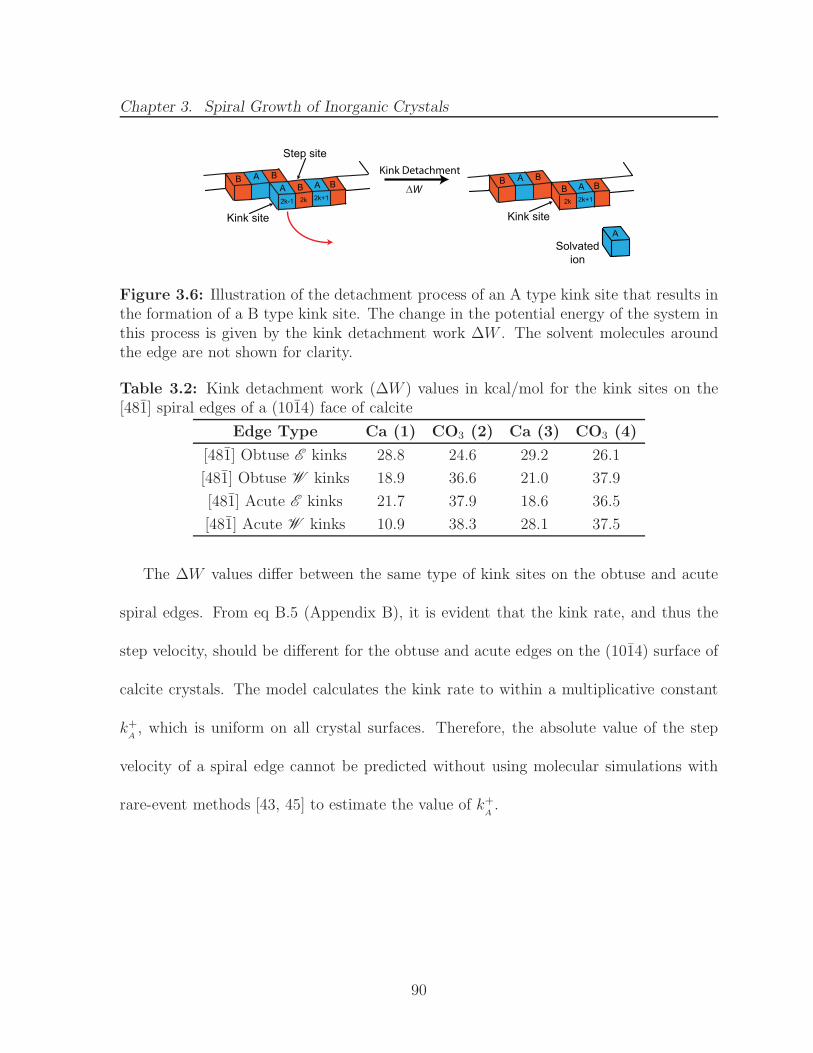
Chapter 3. Spiral Growth of Inorganic Crystals
A AA
B BB B
2k-1 2k 2k+1
Kink site
Step site
A
AA
B BB B
2k 2k+1
Kink site
Kink Detachment
Solvated
ion
∆W
Figure 3.6: Illustration of the detachment process of an A type kink site that results inthe formation of a B type kink site. The change in the potential energy of the system inthis process is given by the kink detachment work ∆W . The solvent molecules aroundthe edge are not shown for clarity.
Table 3.2: Kink detachment work (∆W ) values in kcal/mol for the kink sites on the[481] spiral edges of a (1014) face of calcite
Edge Type Ca (1) CO3 (2) Ca (3) CO3 (4)
[481] Obtuse E kinks 28.8 24.6 29.2 26.1
[481] Obtuse W kinks 18.9 36.6 21.0 37.9
[481] Acute E kinks 21.7 37.9 18.6 36.5
[481] Acute W kinks 10.9 38.3 28.1 37.5
The ∆W values differ between the same type of kink sites on the obtuse and acute
spiral edges. From eq B.5 (Appendix B), it is evident that the kink rate, and thus the
step velocity, should be different for the obtuse and acute edges on the (1014) surface of
calcite crystals. The model calculates the kink rate to within a multiplicative constant
k+A, which is uniform on all crystal surfaces. Therefore, the absolute value of the step
velocity of a spiral edge cannot be predicted without using molecular simulations with
rare-event methods [43, 45] to estimate the value of k+A.
90
Chapter 3. Spiral Growth of Inorganic Crystals
3.5 Step Velocity Predictions on (1014) Surface of
Calcite
The step velocity of spiral edges can be measured experimentally using Atomic Force
Microscopy (AFM). The step velocity of spiral edges on a (1014) surface of calcite have
been measured using in situ AFM under various experimental conditions [5, 39, 40, 46,
47]. De Yoreo and coworkers [7, 40, 48] measured the step velocities of the spiral edges for
a wide range of supersaturation (1.02 < S < 2.04), while keeping the ionic activity ratio
constant at r = 1.04. Figure 3.7 shows the comparison between the experimentally
measured step velocities reported by Teng et al. [48] and predicted values from the
model. The predicted step velocities were calculated assuming that no foreign species
were present in the solution. The calculated values of step velocities were scaled with the
experimental values at S = 1.40.
The model predictions for the step velocity of the obtuse edge match very well with
the experimentally measured values except for very high supersaturation (S ≥ 1.8). The
predictions of the spiral growth model are not reliable at such high supersaturation,
where growth by 2D nucleation was also observed in the AFM experiments [40].
Step velocity predictions of the acute edge do not capture the supersaturation trend
of the experimental measurements. Teng et al. observed a crossover between the step
velocities of obtuse and acute edges at S = 1.29 [48]. This crossover was explained by the
effect of ppm level impurities (e.g., Mg, SO4) present in the experimental reagents, on
91
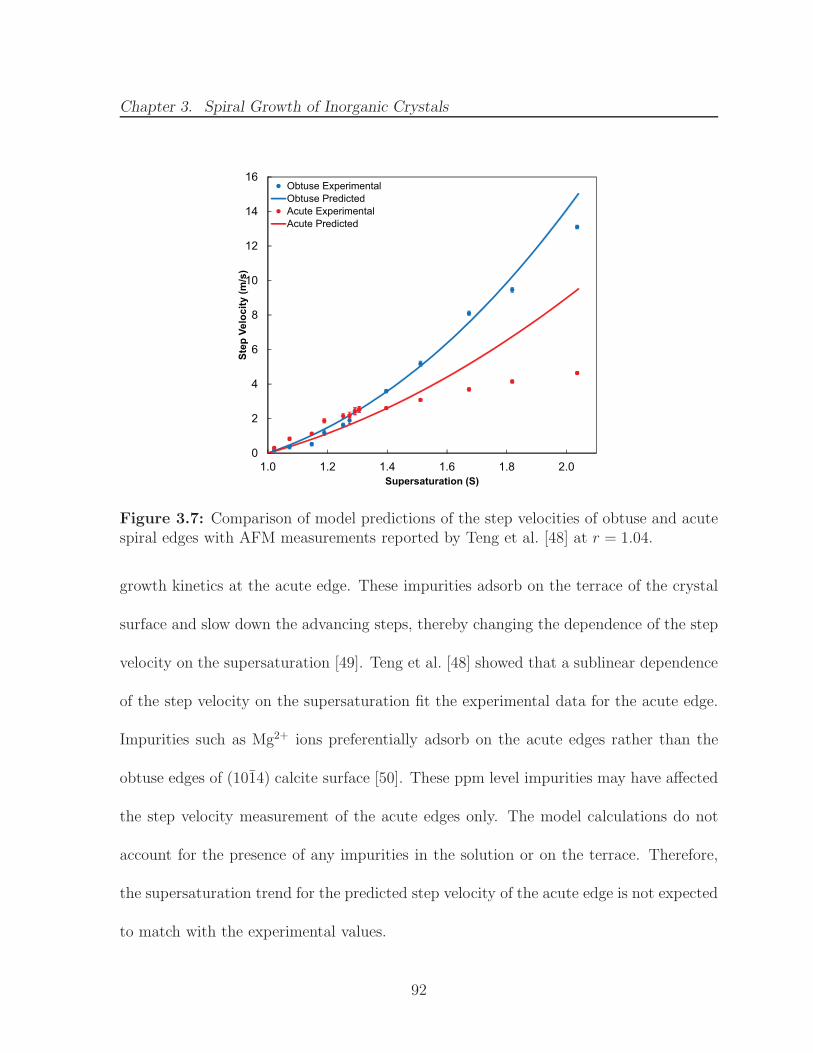
Chapter 3. Spiral Growth of Inorganic Crystals
0
2
4
6
8
10
12
14
16
1.0 1.2 1.4 1.6 1.8 2.0
Ste
p V
elo
cit
y (
m/s
)
Supersaturation (S)
Obtuse Experimental
Obtuse Predicted
Acute Experimental
Acute Predicted
Figure 3.7: Comparison of model predictions of the step velocities of obtuse and acutespiral edges with AFM measurements reported by Teng et al. [48] at r = 1.04.
growth kinetics at the acute edge. These impurities adsorb on the terrace of the crystal
surface and slow down the advancing steps, thereby changing the dependence of the step
velocity on the supersaturation [49]. Teng et al. [48] showed that a sublinear dependence
of the step velocity on the supersaturation fit the experimental data for the acute edge.
Impurities such as Mg2+ ions preferentially adsorb on the acute edges rather than the
obtuse edges of (1014) calcite surface [50]. These ppm level impurities may have affected
the step velocity measurement of the acute edges only. The model calculations do not
account for the presence of any impurities in the solution or on the terrace. Therefore,
the supersaturation trend for the predicted step velocity of the acute edge is not expected
to match with the experimental values.
92
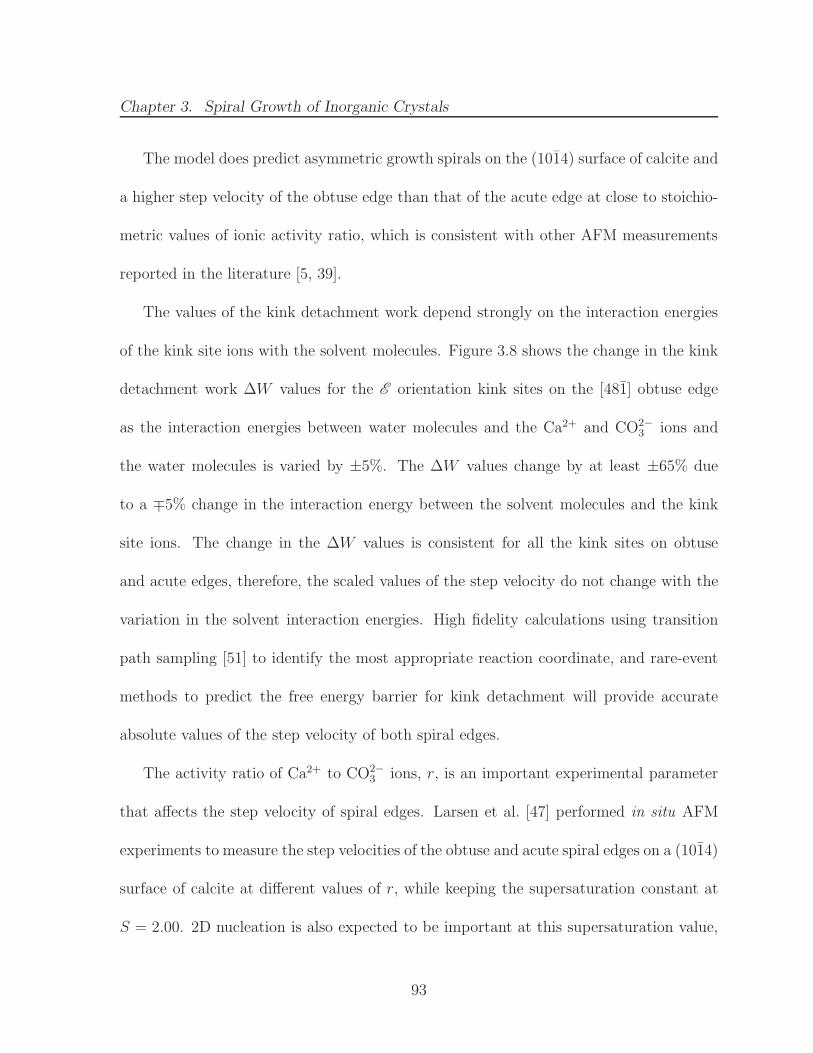
Chapter 3. Spiral Growth of Inorganic Crystals
The model does predict asymmetric growth spirals on the (1014) surface of calcite and
a higher step velocity of the obtuse edge than that of the acute edge at close to stoichio-
metric values of ionic activity ratio, which is consistent with other AFM measurements
reported in the literature [5, 39].
The values of the kink detachment work depend strongly on the interaction energies
of the kink site ions with the solvent molecules. Figure 3.8 shows the change in the kink
detachment work ∆W values for the E orientation kink sites on the [481] obtuse edge
as the interaction energies between water molecules and the Ca2+ and CO2−3 ions and
the water molecules is varied by ±5%. The ∆W values change by at least ±65% due
to a ∓5% change in the interaction energy between the solvent molecules and the kink
site ions. The change in the ∆W values is consistent for all the kink sites on obtuse
and acute edges, therefore, the scaled values of the step velocity do not change with the
variation in the solvent interaction energies. High fidelity calculations using transition
path sampling [51] to identify the most appropriate reaction coordinate, and rare-event
methods to predict the free energy barrier for kink detachment will provide accurate
absolute values of the step velocity of both spiral edges.
The activity ratio of Ca2+ to CO2−3 ions, r, is an important experimental parameter
that affects the step velocity of spiral edges. Larsen et al. [47] performed in situ AFM
experiments to measure the step velocities of the obtuse and acute spiral edges on a (1014)
surface of calcite at different values of r, while keeping the supersaturation constant at
S = 2.00. 2D nucleation is also expected to be important at this supersaturation value,
93
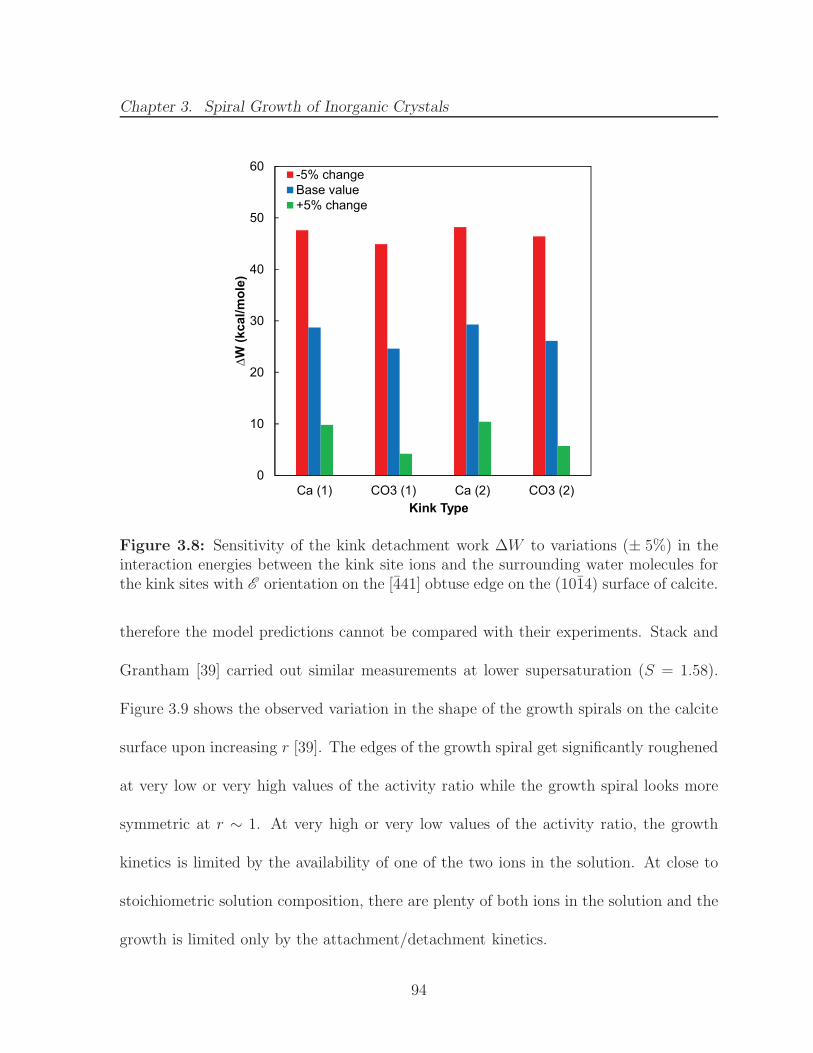
Chapter 3. Spiral Growth of Inorganic Crystals
0
10
20
30
40
50
60
Ca (1) CO3 (1) Ca (2) CO3 (2)
∆W
(k
ca
l/m
ole
)
Kink Type
-5% change
Base value
+5% change
Figure 3.8: Sensitivity of the kink detachment work ∆W to variations (± 5%) in theinteraction energies between the kink site ions and the surrounding water molecules forthe kink sites with E orientation on the [441] obtuse edge on the (1014) surface of calcite.
therefore the model predictions cannot be compared with their experiments. Stack and
Grantham [39] carried out similar measurements at lower supersaturation (S = 1.58).
Figure 3.9 shows the observed variation in the shape of the growth spirals on the calcite
surface upon increasing r [39]. The edges of the growth spiral get significantly roughened
at very low or very high values of the activity ratio while the growth spiral looks more
symmetric at r ∼ 1. At very high or very low values of the activity ratio, the growth
kinetics is limited by the availability of one of the two ions in the solution. At close to
stoichiometric solution composition, there are plenty of both ions in the solution and the
growth is limited only by the attachment/detachment kinetics.
94
Chapter 3. Spiral Growth of Inorganic Crystals
Increasing ionic activity ratio
Figure 3.9: In situ AFM images of growth spirals on the (1014) surface of calcite crystal.The activity ratio of Ca2+ to CO2−
3 ions increases from panels (a) to (c). Adapted withpermission from Stack and Grantham 2010 [39]. Copyright ©2010, American ChemicalSociety.
Figure 3.10 shows the comparison of the experimentally measured step velocities of
both obtuse and acute edges by Stack et al. [39] with the model predictions at different
values of r. The model only predicts relative step velocities and not absolute values,
therefore, the model predictions were scaled with an experimental value of step veloc-
ity. For obtuse edge, the experimental step velocity value at a value of r = 43.7 was
used, while for the acute edge, the step velocity at a value of r = 0.015 was used for
scaling. Although the model predictions do not match exactly with the experimental
step velocities for both edges, the model accurately captures the step velocity trend for
both the edges as the ionic activity ratio is varied. The model also correctly predicts
that the maximum step velocity for each of the edges does not occur exactly at r = 1,
which is the stoichiometric composition of the solution. Since the solvation behavior and
95
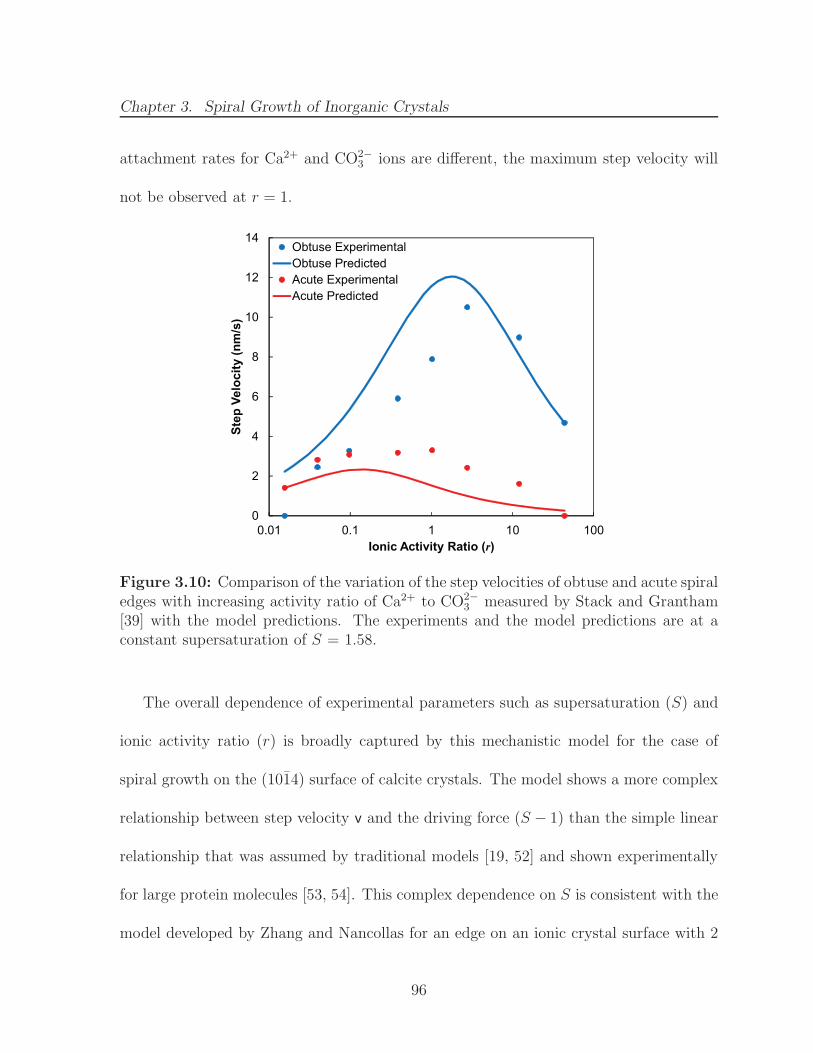
Chapter 3. Spiral Growth of Inorganic Crystals
attachment rates for Ca2+ and CO2−3 ions are different, the maximum step velocity will
not be observed at r = 1.
0
2
4
6
8
10
12
14
0.01 0.1 1 10 100
Ste
p V
elo
cit
y (
nm
/s)
Ionic Activity Ratio (r)
Obtuse Experimental
Obtuse Predicted
Acute Experimental
Acute Predicted
Figure 3.10: Comparison of the variation of the step velocities of obtuse and acute spiraledges with increasing activity ratio of Ca2+ to CO2−
3 measured by Stack and Grantham[39] with the model predictions. The experiments and the model predictions are at aconstant supersaturation of S = 1.58.
The overall dependence of experimental parameters such as supersaturation (S) and
ionic activity ratio (r) is broadly captured by this mechanistic model for the case of
spiral growth on the (1014) surface of calcite crystals. The model shows a more complex
relationship between step velocity v and the driving force (S − 1) than the simple linear
relationship that was assumed by traditional models [19, 52] and shown experimentally
for large protein molecules [53, 54]. This complex dependence on S is consistent with the
model developed by Zhang and Nancollas for an edge on an ionic crystal surface with 2
96
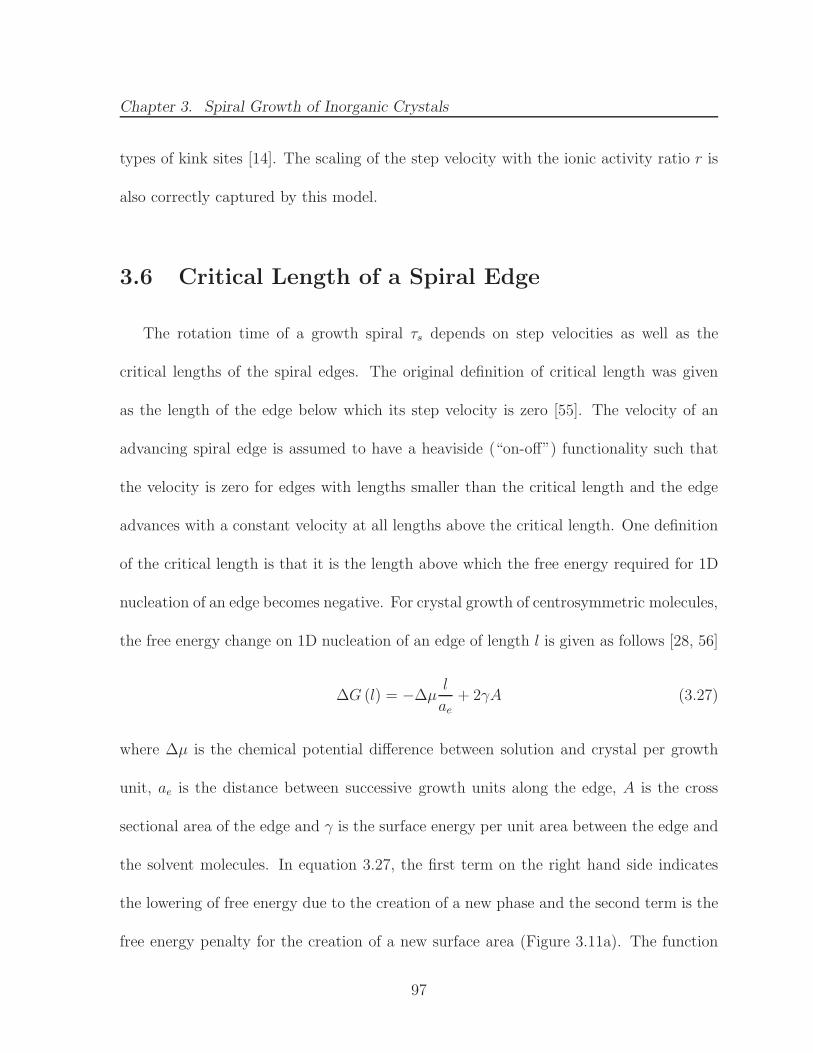
Chapter 3. Spiral Growth of Inorganic Crystals
types of kink sites [14]. The scaling of the step velocity with the ionic activity ratio r is
also correctly captured by this model.
3.6 Critical Length of a Spiral Edge
The rotation time of a growth spiral τs depends on step velocities as well as the
critical lengths of the spiral edges. The original definition of critical length was given
as the length of the edge below which its step velocity is zero [55]. The velocity of an
advancing spiral edge is assumed to have a heaviside (“on-off”) functionality such that
the velocity is zero for edges with lengths smaller than the critical length and the edge
advances with a constant velocity at all lengths above the critical length. One definition
of the critical length is that it is the length above which the free energy required for 1D
nucleation of an edge becomes negative. For crystal growth of centrosymmetric molecules,
the free energy change on 1D nucleation of an edge of length l is given as follows [28, 56]
∆G (l) = −∆µl
ae+ 2γA (3.27)
where ∆µ is the chemical potential difference between solution and crystal per growth
unit, ae is the distance between successive growth units along the edge, A is the cross
sectional area of the edge and γ is the surface energy per unit area between the edge and
the solvent molecules. In equation 3.27, the first term on the right hand side indicates
the lowering of free energy due to the creation of a new phase and the second term is the
free energy penalty for the creation of a new surface area (Figure 3.11a). The function
97
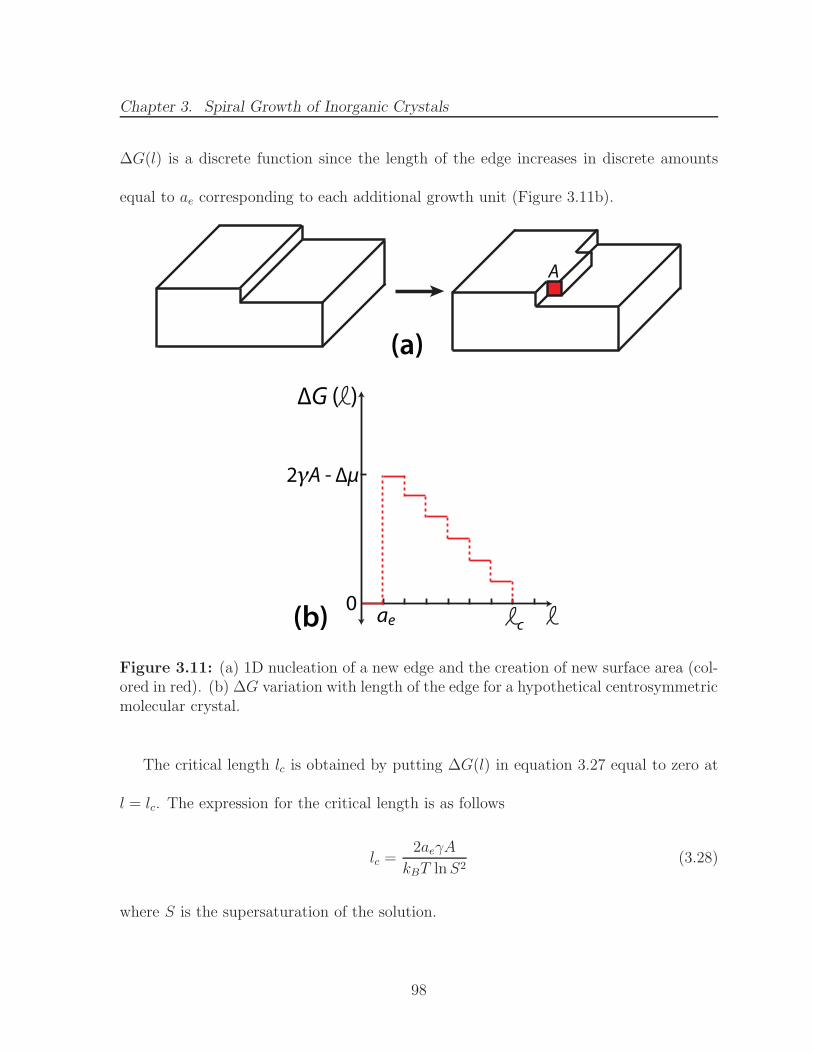
Chapter 3. Spiral Growth of Inorganic Crystals
∆G(l) is a discrete function since the length of the edge increases in discrete amounts
equal to ae corresponding to each additional growth unit (Figure 3.11b).
A
0
∆G ( )
ae
2γA - ∆μ
c
(a)
(b)
Figure 3.11: (a) 1D nucleation of a new edge and the creation of new surface area (col-ored in red). (b) ∆G variation with length of the edge for a hypothetical centrosymmetricmolecular crystal.
The critical length lc is obtained by putting ∆G(l) in equation 3.27 equal to zero at
l = lc. The expression for the critical length is as follows
lc =2aeγA
kBT lnS2(3.28)
where S is the supersaturation of the solution.
98
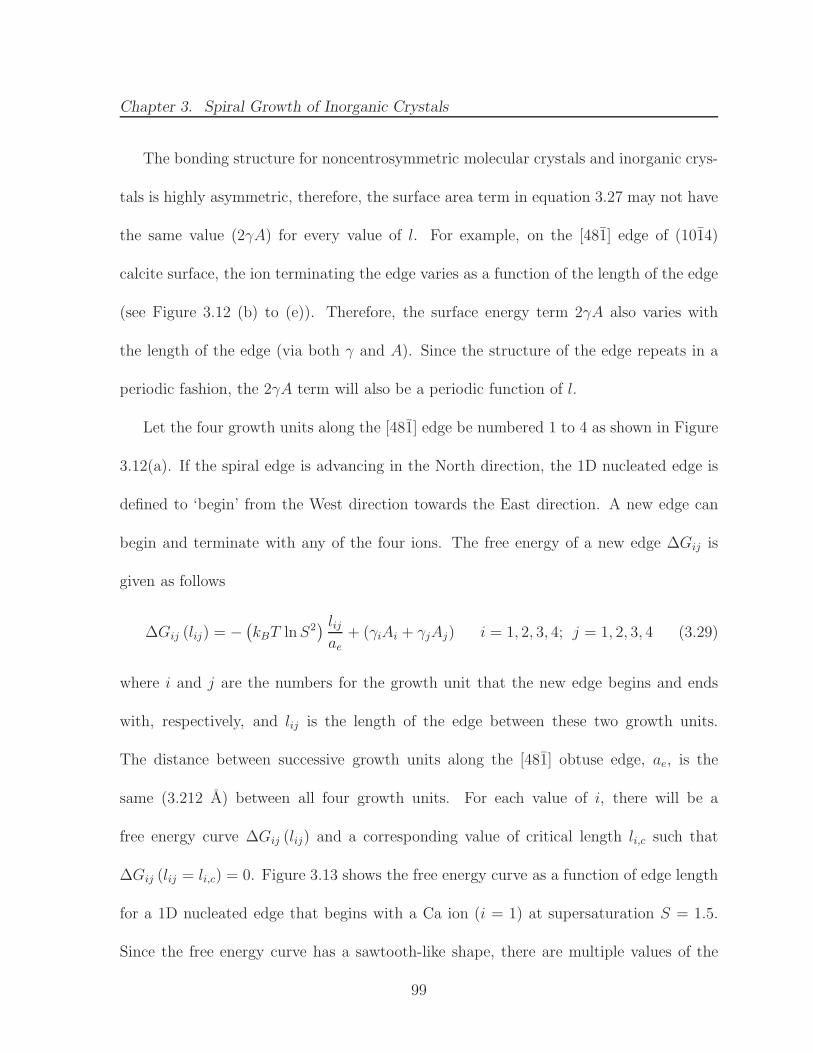
Chapter 3. Spiral Growth of Inorganic Crystals
The bonding structure for noncentrosymmetric molecular crystals and inorganic crys-
tals is highly asymmetric, therefore, the surface area term in equation 3.27 may not have
the same value (2γA) for every value of l. For example, on the [481] edge of (1014)
calcite surface, the ion terminating the edge varies as a function of the length of the edge
(see Figure 3.12 (b) to (e)). Therefore, the surface energy term 2γA also varies with
the length of the edge (via both γ and A). Since the structure of the edge repeats in a
periodic fashion, the 2γA term will also be a periodic function of l.
Let the four growth units along the [481] edge be numbered 1 to 4 as shown in Figure
3.12(a). If the spiral edge is advancing in the North direction, the 1D nucleated edge is
defined to ‘begin’ from the West direction towards the East direction. A new edge can
begin and terminate with any of the four ions. The free energy of a new edge ∆Gij is
given as follows
∆Gij (lij) = −(
kBT lnS2) lijae
+ (γiAi + γjAj) i = 1, 2, 3, 4; j = 1, 2, 3, 4 (3.29)
where i and j are the numbers for the growth unit that the new edge begins and ends
with, respectively, and lij is the length of the edge between these two growth units.
The distance between successive growth units along the [481] obtuse edge, ae, is the
same (3.212 A) between all four growth units. For each value of i, there will be a
free energy curve ∆Gij (lij) and a corresponding value of critical length li,c such that
∆Gij (lij = li,c) = 0. Figure 3.13 shows the free energy curve as a function of edge length
for a 1D nucleated edge that begins with a Ca ion (i = 1) at supersaturation S = 1.5.
Since the free energy curve has a sawtooth-like shape, there are multiple values of the
99
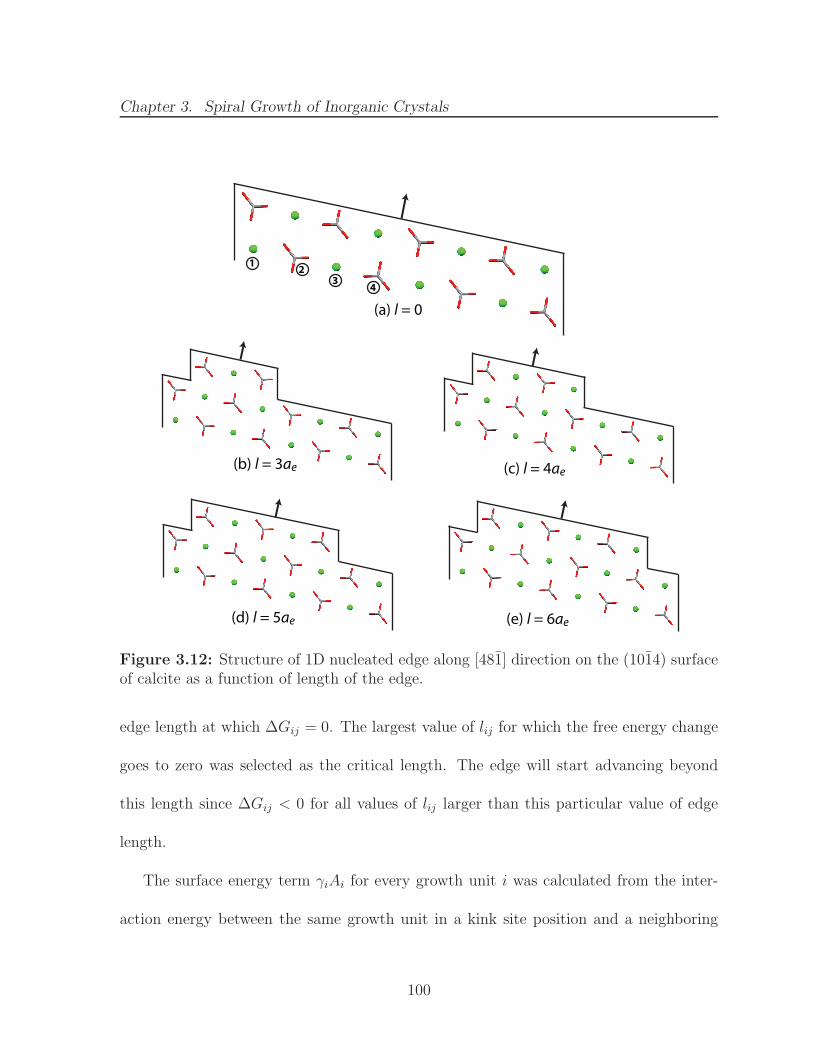
Chapter 3. Spiral Growth of Inorganic Crystals
(a) l = 0
(e) l = 6ae
(c) l = 4ae
(d) l = 5ae
(b) l = 3ae
12
34
Figure 3.12: Structure of 1D nucleated edge along [481] direction on the (1014) surfaceof calcite as a function of length of the edge.
edge length at which ∆Gij = 0. The largest value of lij for which the free energy change
goes to zero was selected as the critical length. The edge will start advancing beyond
this length since ∆Gij < 0 for all values of lij larger than this particular value of edge
length.
The surface energy term γiAi for every growth unit i was calculated from the inter-
action energy between the same growth unit in a kink site position and a neighboring
100
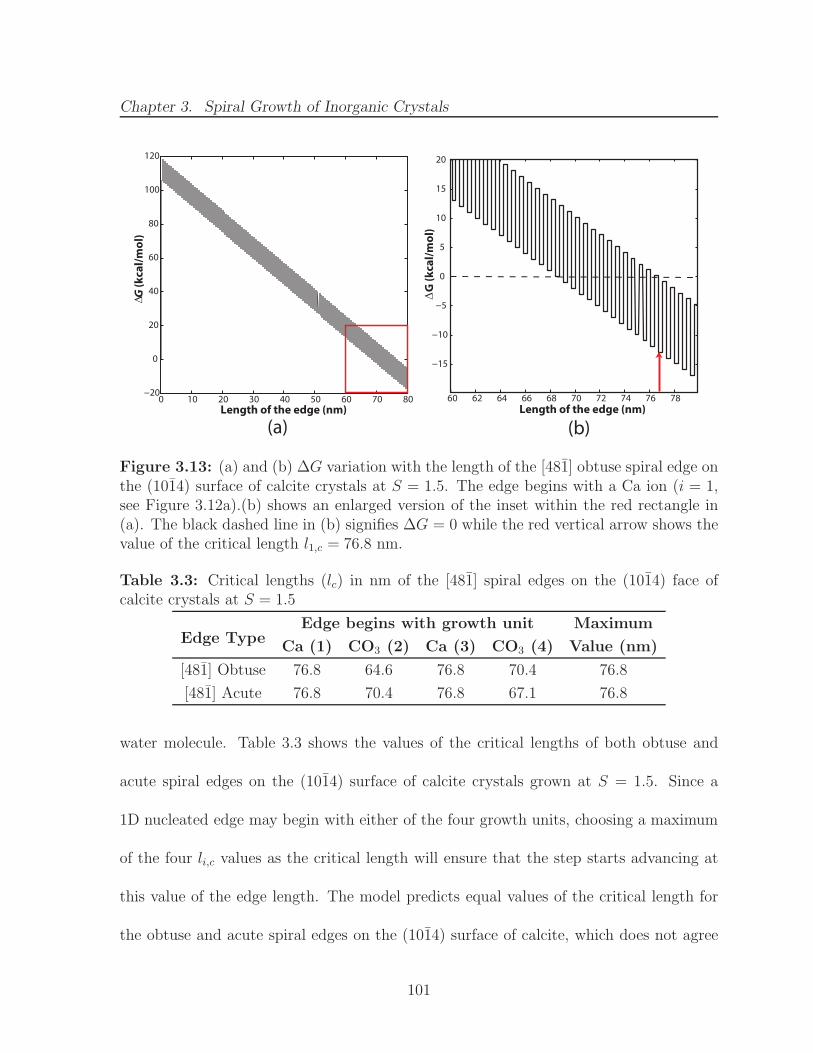
Chapter 3. Spiral Growth of Inorganic Crystals
0 10 20 30 40 50 60 70 80−20
0
20
40
60
80
100
120
Length of the edge (nm)
∆G
(k
cal/
mo
l)
(a)
60 62 64 66 68 70 72 74 76 78
−15
−10
−5
0
5
10
15
20
Length of the edge (nm)
∆G
(k
cal/
mo
l)(b)
Figure 3.13: (a) and (b) ∆G variation with the length of the [481] obtuse spiral edge onthe (1014) surface of calcite crystals at S = 1.5. The edge begins with a Ca ion (i = 1,see Figure 3.12a).(b) shows an enlarged version of the inset within the red rectangle in(a). The black dashed line in (b) signifies ∆G = 0 while the red vertical arrow shows thevalue of the critical length l1,c = 76.8 nm.
Table 3.3: Critical lengths (lc) in nm of the [481] spiral edges on the (1014) face ofcalcite crystals at S = 1.5
Edge TypeEdge begins with growth unit Maximum
Ca (1) CO3 (2) Ca (3) CO3 (4) Value (nm)
[481] Obtuse 76.8 64.6 76.8 70.4 76.8
[481] Acute 76.8 70.4 76.8 67.1 76.8
water molecule. Table 3.3 shows the values of the critical lengths of both obtuse and
acute spiral edges on the (1014) surface of calcite crystals grown at S = 1.5. Since a
1D nucleated edge may begin with either of the four growth units, choosing a maximum
of the four li,c values as the critical length will ensure that the step starts advancing at
this value of the edge length. The model predicts equal values of the critical length for
the obtuse and acute spiral edges on the (1014) surface of calcite, which does not agree
101
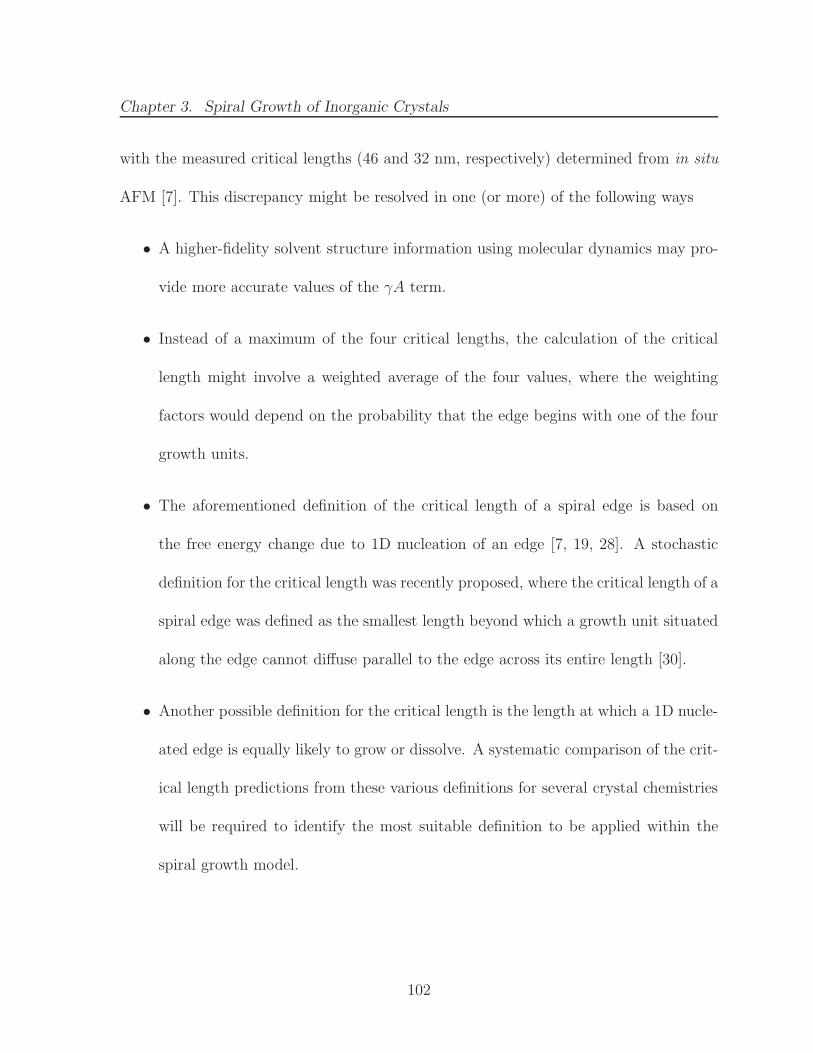
Chapter 3. Spiral Growth of Inorganic Crystals
with the measured critical lengths (46 and 32 nm, respectively) determined from in situ
AFM [7]. This discrepancy might be resolved in one (or more) of the following ways
• A higher-fidelity solvent structure information using molecular dynamics may pro-
vide more accurate values of the γA term.
• Instead of a maximum of the four critical lengths, the calculation of the critical
length might involve a weighted average of the four values, where the weighting
factors would depend on the probability that the edge begins with one of the four
growth units.
• The aforementioned definition of the critical length of a spiral edge is based on
the free energy change due to 1D nucleation of an edge [7, 19, 28]. A stochastic
definition for the critical length was recently proposed, where the critical length of a
spiral edge was defined as the smallest length beyond which a growth unit situated
along the edge cannot diffuse parallel to the edge across its entire length [30].
• Another possible definition for the critical length is the length at which a 1D nucle-
ated edge is equally likely to grow or dissolve. A systematic comparison of the crit-
ical length predictions from these various definitions for several crystal chemistries
will be required to identify the most suitable definition to be applied within the
spiral growth model.
102
Chapter 3. Spiral Growth of Inorganic Crystals
3.6.1 Morphology of Calcite Crystals
The growth rate of the (1014) calcite crystal face can be calculated by putting the
values of the step velocities and critical lengths of the obtuse and acute edges in the [441]
and [481] directions into eqs 3.3 and 3.2 to calculate τs and the relative growth rate G,
respectively. There is a single family of F faces present in calcite - {1014}. There are 6
faces in the {1014} family of F faces, each growing at the same perpendicular growth rate.
These six faces enclose the entire crystal resulting in a regular rhombohedron morphology
(Figure 3.14 as observed in the Icelandic Spar calcite crystals [57]).
(a) (b)
Figure 3.14: (a) The predicted morphology of calcite crystals dominated by the {1014}family of faces. (b) Morphology of the Icelandic Spar calcite crystal on exhibition at theNational Museum of Natural History in Washington, DC.
103
Chapter 3. Spiral Growth of Inorganic Crystals
3.7 Conclusions
A mechanistic growth model has been developed that can predict the relative growth
rate of a crystal face and the steady-state morphology of inorganic crystals grown from
solution. The model has been used to study the spiral growth mechanism which domi-
nates the surface growth at low supersaturation. A generalized framework was developed
to calculate the kink incorporation rate on every spiral edge on the face of an AB-type
ionic crystal, irrespective of the number of kink sites exposed along each edge. The
expressions for the attachment and detachment fluxes from the kink sites account for
the effect of the solution composition and the kink detachment work on the kinetics of
attachment and detachment processes.
The asymmetry in the step velocities on the obtuse and acute spiral edges on the
(1014) surface of calcite crystals is captured by the model. The difference in the elec-
tronic properties of the carbonate ions situated on these edges results in different kinetics
of attachment and detachment from the kink sites along the edge, which is reflected in
the kink detachment work (∆W ) values calculated for the obtuse and acute edges. The
model captures accurately the variation of the step velocity with supersaturation. The
predictions match closely with the experimentally measured step velocities for the obtuse
edge [48]. The ratio of the activities of Ca2+ to CO2−3 ions is also an important experi-
mental parameter with profound effect on the kinetics of step advancement of the spiral
edges on calcite (1014) surface. The model predicts the scaling of the step velocity with
the activity ratio and the deviation in the maxima for the step velocities of both obtuse
104
Chapter 3. Spiral Growth of Inorganic Crystals
and acute spiral edges from the stoichiometric solution composition. The model is well
suited to calculate relative step velocities of the spiral edges that can be used to predict
the relative growth rates and the steady-state morphology of inorganic crystals.
The interaction energies of the surface ions with solvent (water) significantly impact
the growth kinetics of inorganic crystal surfaces. This necessitates use of molecular
simulations or experiments that can accurately characterize the local solvent structure
and density around kink sites present on inorganic crystal surfaces. Molecular simulations
coupled with rare-event methods such as transition path sampling [51] and metadynamics
[58] are being used to map out the free energy landscape and to calculate the absolute
rates of attachment and detachment from kink sites on inorganic crystal surfaces [45].
These advances can be used to identify the exact rate determining step among the several
steps involved in the growth process on inorganic crystal surfaces and to refine the kinetic
expressions used in the mechanistic growth models to make them more accurate.
105
Bibliography
[1] W. M. Haynes, editor. CRC Handbook of Chemistry and Physics. CRC Press: BocaRaton, FL, 2013.
[2] J. Burgess. Metal Ions in Solution. Ellis Horwood: Chichester, UK, 1986.
[3] D. R. Rosseinsky. Electrode potentials and hydration energies. theories and corre-lations. Chem. Rev., 65:467–490, 1965.
[4] A. J. Gratz, S. Manne, and P. K. Hansma. Atomic force microscopy of atomic-scaleledges and etch pits formed during dissolution of quartz. Science, 251:1343–1346,1991.
[5] A. Gratz, P. Hillner, and P. Hansma. Step dynamics and spiral growth on calcite.Geochim. Cosmochim. Acta, 57:491 – 495, 1993.
[6] J. J. DeYoreo, T. A. Land, and B. Dair. Growth morphology of vicinal hillocks onthe {101} face of KH2PO4: From step-flow to layer-by-layer growth. Phys. Rev.Lett., 73:838–841, 1994.
[7] H. H. Teng, P. M. Dove, C. A. Orme, and J. J. De Yoreo. Thermodynamics ofcalcite growth: Baseline for understanding biomineral formation. Science, 282:724–727, 1998.
[8] C. M. Pina, U. Becker, P. Risthaus, D. Bosbach, and A. Putnis. Molecular-scalemechanisms of crystal growth in barite. Nature, 395:483–486, 1998.
[9] J. A. Venables. Atomic processes in crystal growth. Surf. Sci., 299/300:798 – 817,1994.
[10] P. Hartman. Crystal Growth: An Introduction, chapter Structure and Morphology,pages 367–402. Amsterdam: North-Holland, 1973.
[11] S. C. Parker, J. O. Titiloye, and G. W. Watson. Molecular modelling of carbonateminerals: studies of growth and morphology. Phil. Trans. R. Soc. A, 344:37–48,1993.
106
Bibliography
[12] L. J. Soltzberg, O. Carneiro, G. S. Joseph, Z. Khan, T. D. Meretsky, M. M. Ng, andS. A. Ofek. Prediction of Early- and Late-Growth Morphologies of Ionic Crystals.Acta Crystallogr. B, 54:384–390, 1998.
[13] C. Schmidt and J. Ulrich. Crystal habit prediction - including the liquid as well asthe solid side. Cryst. Res. Technol., 47:597–602, 2012.
[14] J. Zhang and G. H. Nancollas. Kink density and rate of step movement duringgrowth and dissolution of an AB crystal in a nonstoichiometric solution. J. ColloidInterface Sci., 200:131 – 145, 1998.
[15] D. J. DePaolo. Surface kinetic model for isotopic and trace element fractionationduring precipitation of calcite from aqueous solutions. Geochim. Cosmochim. Acta,75:1039 – 1056, 2011.
[16] U. Diebold, S.-C. Li, and M. Schmid. Oxide surface science. Annu. Rev. Phys.Chem., 61:129–148, 2010.
[17] J. Goniakowski, F. Finocchi, and C. Noguera. Polarity of oxide surfaces and nanos-tructures. Rep. Prog. Phys., 71:016501, 2008.
[18] J. Frenkel. On the surface motion of particles in crystals and the natural roughnessof crystalline faces. J. Phys. U.S.S.R., 9:392, 1945.
[19] W. K. Burton, N. Cabrera, and F. C. Frank. The growth of crystals and the equi-librium structure of their surfaces. Phil. Trans. Roy. Soc. A, 243:299–358, 1951.
[20] J. W. Morse, R. S. Arvidson, and A. Luttge. Calcium carbonate formation anddissolution. Chem. Rev., 107:342–381, 2007.
[21] K. J. Davis, P. M. Dove, and J. J. De Yoreo. The role of Mg2+ as an impurity incalcite growth. Science, 290:1134–1137, 2000.
[22] G. Fu, S. R. Qiu, C. A. Orme, D. E. Morse, and J. J. De Yoreo. Acceleration ofcalcite kinetics by abalone nacre proteins. Adv. Mater., 17:2678–2683, 2005.
[23] S. Elhadj, J. J. De Yoreo, J. R. Hoyer, and P. M. Dove. Role of molecular chargeand hydrophilicity in regulating the kinetics of crystal growth. Proc. Natl. Acad.Sci. U.S.A, 103:19237–19242, 2006.
[24] A. E. Stephenson, J. J. DeYoreo, L. Wu, K. J. Wu, J. Hoyer, and P. M. Dove.Peptides enhance magnesium signature in calcite: Insights into origins of vital effects.Science, 322:724–727, 2008.
107
Bibliography
[25] J. N. Bracco, M. C. Grantham, and A. G. Stack. Calcite Growth Rates As aFunction of Aqueous Calcium-to-Carbonate Ratio, Saturation Index, and InhibitorConcentration: Insight into the Mechanism of Reaction and Poisoning by Strontium.Cryst. Growth Des., 12:3540–3548, 2012.
[26] M. A. Lovette, A. R. Browning, D. W. Griffin, J. P. Sizemore, R. C. Snyder, andM. F. Doherty. Crystal shape engineering. Ind. Eng. Chem. Res., 47:9812–9833,2008.
[27] P. Dandekar, Z. B. Kuvadia, and M. F. Doherty. Engineering crystal morphology.Annu. Rev. Mater. Res., 43:359–386, 2013.
[28] R. C. Snyder and M. F. Doherty. Predicting crystal growth by spiral motion. Proc.R. Soc. A, 465:1145–1171, 2009.
[29] Z. B. Kuvadia and M. F. Doherty. Spiral growth model for faceted crystals ofnon-centrosymmetric organic molecules grown from solution. Cryst. Growth Des.,11:2780–2802, 2011.
[30] J. P. Sizemore and M. F. Doherty. A stochastic model for the critical length of aspiral edge. J. Cryst. Growth, 312:785–792, 2010.
[31] M. Wolthers, D. Di Tommaso, Z. Du, and N. H. de Leeuw. Calcite surface structureand reactivity: Molecular dynamics simulations and macroscopic surface modellingof the calcite-water interface. Phys. Chem. Chem. Phys., 14:15145–15157, 2012.
[32] J. Zhang and G. H. Nancollas. Kink densities along a crystal surface step at lowtemperatures and under nonequilibrium conditions. J. Cryst. Growth, 106:181–190,1990.
[33] I. V. Markov. Crystal Growth for Beginners, Fundamentals of Nucleation, CrystalGrowth and Epitaxy. World Scientific: Singapore, 2003.
[34] S. H. Kim, P. Dandekar, M. A. Lovette, and M. F. Doherty. Kink rate model for thegeneral case of organic molecular crystals. Cryst. Growth Des., 14:2460–2467, 2014.
[35] H. Eyring. The activated complex in chemical reactions. J. Chem. Phys., 3:107–115,1935.
[36] A. E. Nielsen. Theory of electrolyte crystal growth: The parabolic rate law. PureAppl. Chem., 53:2025–2039, 1981.
[37] J. Mullin. Crystallization. Butterworth-Heinemann: Oxford, UK, 2001.
[38] D. Langmuir. The geochemistry of some carbonate ground waters in central Penn-sylvania. Geochim. Cosmochim. Acta, 35:1023 – 1045, 1971.
108
Bibliography
[39] A. G. Stack and M. C. Grantham. Growth rate of calcite steps as a function ofaqueous calcium-to-carbonate ratio: Independent attachment and detachment ofcalcium and carbonate ions. Cryst. Growth Des., 10:1409–1413, 2010.
[40] H. H. Teng, P. M. Dove, and J. J. De Yoreo. Kinetics of calcite growth: surfaceprocesses and relationships to macroscopic rate laws. Geochim. Cosmochim. Acta,64:2255–2266, 2000.
[41] A. D. Visscher and J. Vanderdeelen. IUPAC-NIST Solubility Data Series. 95. Alka-line Earth Carbonates in Aqueous Systems. Part 2. Ca. J. Phys. Chem. Ref. Data,41:023105, 2012.
[42] C. W. Davies. Ion Association. Butterworths, 1962.
[43] S. Kerisit and S. C. Parker. Free energy of adsorption of water and metal ions onthe {1014} calcite surface. J. Am. Chem. Soc., 126:10152–10161, 2004.
[44] V. Vchirawongkwin, C. Kritayakornupong, A. Tongraar, and B. M. Rode. Symmetrybreaking and hydration structure of carbonate and nitrate in aqueous solutions: Astudy by ab initio quantum mechanical charge field molecular dynamics. J. Phys.Chem. B, 115:12527–12536, 2011.
[45] A. G. Stack, P. Raiteri, and J. D. Gale. Accurate rates of the complex mechanismsfor growth and dissolution of minerals using a combination of rare-event theories. J.Am. Chem. Soc., 134:11–14, 2012.
[46] Y. Liang, D. R. Baer, J. M. McCoy, and J. P. LaFemina. Interplay between stepvelocity and morphology during the dissolution of CaCO3 surface. J. Vac. Sci.Technol. A, 14:1368–1375, 1996.
[47] K. Larsen, K. Bechgaard, and S. L. S. Stipp. The effect of the Ca2+ to CO2−3 activity
ratio on spiral growth at the calcite {1014} surface. Geochom. Cosmochim. Acta,74:2099–2109, 2010.
[48] H. Teng, P. M. Dove, and J. J. DeYoreo. Reversed calcite morphologies induced bymicroscopic growth kinetics: insight into biomineralization. Geochim. Cosmochim.Acta, 63:2507–2512, 1999.
[49] V. V. Voronkov and L. N. Rashkovich. Influence of a mobile adsorbed impurity onthe motion of steps. Sov. Phys. Cryst., 37:289–295, 1992.
[50] K. J. Davis, P. M. Dove, L. E. Wasylenki, and J. J. De Yoreo. Morphologicalconsequences of differential Mg2+ incorporation at structurally distinct steps oncalcite. Am. Mineral., 89:714–720, 2004.
109
Bibliography
[51] B. Peters. Recent advances in transition path sampling: accurate reaction coordi-nates, likelihood maximisation and diffusive barrier-crossing dynamics. Mol. Simul.,36:1265–1281, 2010.
[52] A. A. Chernov. Modern Crystallography III. Crystal Growth. Berlin: Springer-Verlag, 1984.
[53] D. N. Petsev, K. Chen, O. Gliko, and P. G. Vekilov. Diffusion-limited kinetics ofthe solution-solid phase transition of molecular substances. Proc. Natl. Acad. Sci.USA, 100:792–796, 2003.
[54] P. G. Vekilov. What determines the rate of growth of crystals from solution? Cryst.Growth Des., 7:2796–2810, 2007.
[55] V. V. Voronkov. The movement of an elementary step by means of the formation ofone-dimensional nuclei. Sov. Phys. Cryst., 15:8–13, 1970.
[56] M. A. Lovette and M. F. Doherty. Reinterpreting edge energies calculated fromcrystal growth experiments. J. Cryst. Growth, 327:117–126, 2011.
[57] Large crystal of Icelandic Spar (Calcite) on display at the National Museum ofNatural History Washington, DC, 2005.
[58] A. Laio and M. Parrinello. Escaping free-energy minima. Proc. Natl. Acad. Sci.U.S.A, 99:12562–12566, 2002.
110
Chapter 4
Crystal Growth and MorphologyPrediction of Aragonite
4.1 Introduction
Calcium carbonate (CaCO3) occurs in nature in three different anhydrous polymor-
phic forms - calcite, aragonite and vaterite. Calcite is the thermodynamically stable
polymorph at room temperature and pressure. However, aragonite occurs naturally in
biological organisms found in marine and freshwater environment, such as mollusk shells.
The native crystal habit of aragonite is usually prismatic or acicular [1], but aragonite
crystals present in mollusk shells have a tabular habit with hexagonal plate-like shape [2].
Aragonite crystallization has been well studied in the biomineralization literature [3] to
understand the biological processes that create plate-like aragonite crystals that consti-
tute a high strength organic-inorganic composite material known as nacre [4].
Calcite is a high-symmetry crystal structure with a single family of F-faces, which
made the spiral growth model relatively easy to implement. Applying the model devel-
111
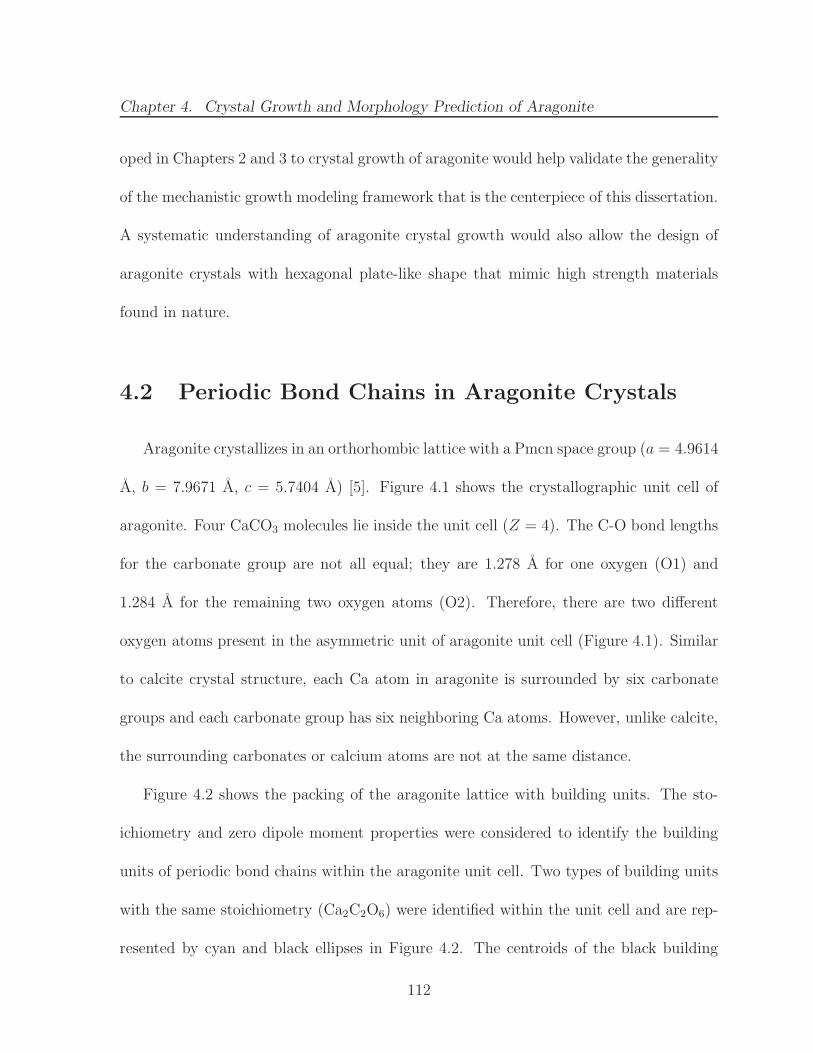
Chapter 4. Crystal Growth and Morphology Prediction of Aragonite
oped in Chapters 2 and 3 to crystal growth of aragonite would help validate the generality
of the mechanistic growth modeling framework that is the centerpiece of this dissertation.
A systematic understanding of aragonite crystal growth would also allow the design of
aragonite crystals with hexagonal plate-like shape that mimic high strength materials
found in nature.
4.2 Periodic Bond Chains in Aragonite Crystals
Aragonite crystallizes in an orthorhombic lattice with a Pmcn space group (a = 4.9614
A, b = 7.9671 A, c = 5.7404 A) [5]. Figure 4.1 shows the crystallographic unit cell of
aragonite. Four CaCO3 molecules lie inside the unit cell (Z = 4). The C-O bond lengths
for the carbonate group are not all equal; they are 1.278 A for one oxygen (O1) and
1.284 A for the remaining two oxygen atoms (O2). Therefore, there are two different
oxygen atoms present in the asymmetric unit of aragonite unit cell (Figure 4.1). Similar
to calcite crystal structure, each Ca atom in aragonite is surrounded by six carbonate
groups and each carbonate group has six neighboring Ca atoms. However, unlike calcite,
the surrounding carbonates or calcium atoms are not at the same distance.
Figure 4.2 shows the packing of the aragonite lattice with building units. The sto-
ichiometry and zero dipole moment properties were considered to identify the building
units of periodic bond chains within the aragonite unit cell. Two types of building units
with the same stoichiometry (Ca2C2O6) were identified within the unit cell and are rep-
resented by cyan and black ellipses in Figure 4.2. The centroids of the black building
112
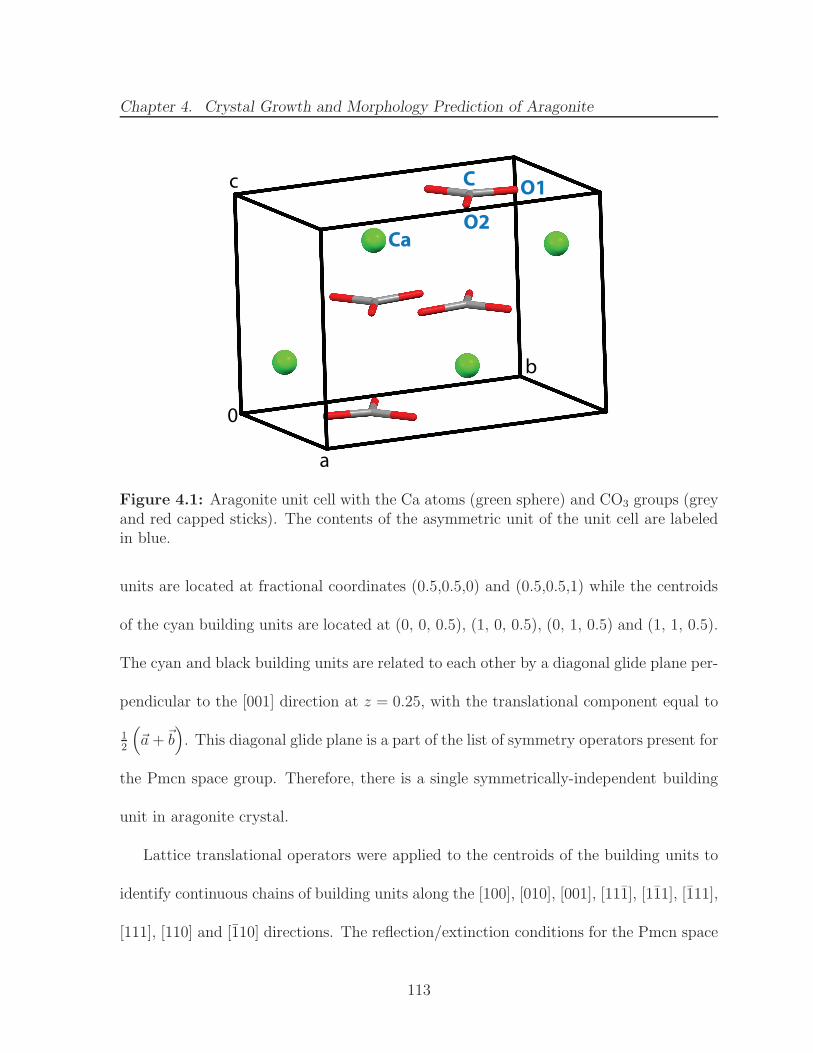
Chapter 4. Crystal Growth and Morphology Prediction of Aragonite
0
a
b
c
Ca
C O1
O2
Figure 4.1: Aragonite unit cell with the Ca atoms (green sphere) and CO3 groups (greyand red capped sticks). The contents of the asymmetric unit of the unit cell are labeledin blue.
units are located at fractional coordinates (0.5,0.5,0) and (0.5,0.5,1) while the centroids
of the cyan building units are located at (0, 0, 0.5), (1, 0, 0.5), (0, 1, 0.5) and (1, 1, 0.5).
The cyan and black building units are related to each other by a diagonal glide plane per-
pendicular to the [001] direction at z = 0.25, with the translational component equal to
12
(
~a +~b)
. This diagonal glide plane is a part of the list of symmetry operators present for
the Pmcn space group. Therefore, there is a single symmetrically-independent building
unit in aragonite crystal.
Lattice translational operators were applied to the centroids of the building units to
identify continuous chains of building units along the [100], [010], [001], [111], [111], [111],
[111], [110] and [110] directions. The reflection/extinction conditions for the Pmcn space
113
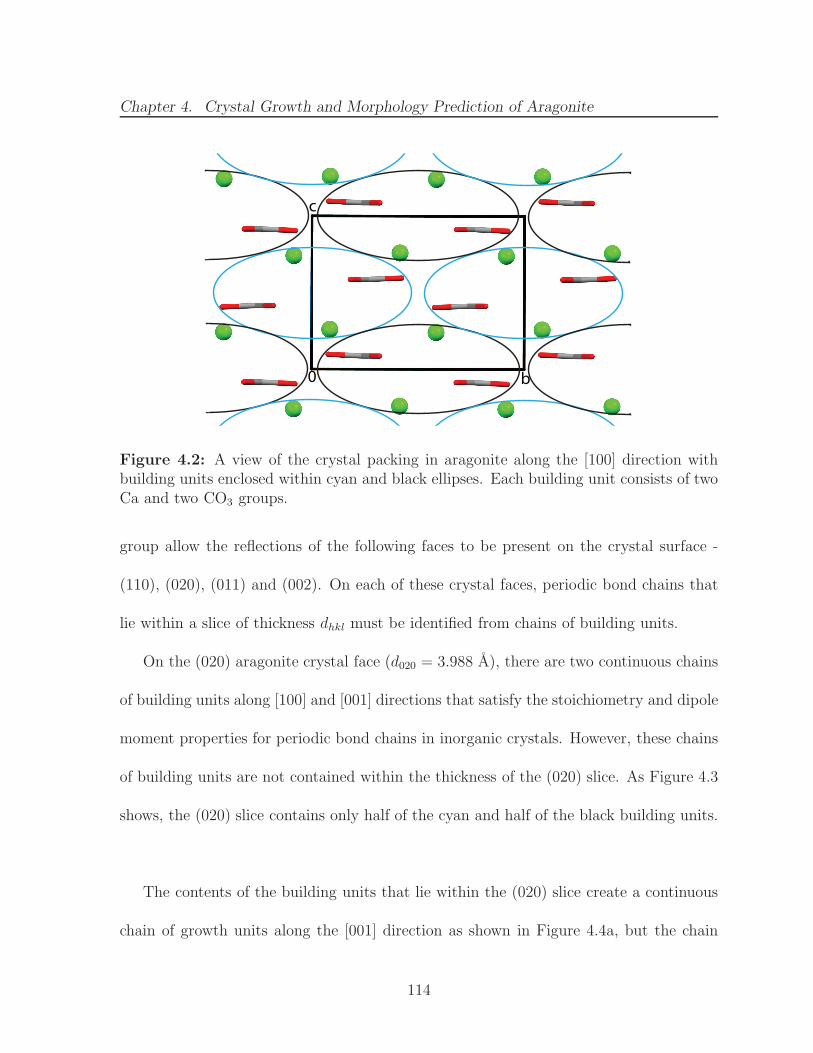
Chapter 4. Crystal Growth and Morphology Prediction of Aragonite
b
c
0
Figure 4.2: A view of the crystal packing in aragonite along the [100] direction withbuilding units enclosed within cyan and black ellipses. Each building unit consists of twoCa and two CO3 groups.
group allow the reflections of the following faces to be present on the crystal surface -
(110), (020), (011) and (002). On each of these crystal faces, periodic bond chains that
lie within a slice of thickness dhkl must be identified from chains of building units.
On the (020) aragonite crystal face (d020 = 3.988 A), there are two continuous chains
of building units along [100] and [001] directions that satisfy the stoichiometry and dipole
moment properties for periodic bond chains in inorganic crystals. However, these chains
of building units are not contained within the thickness of the (020) slice. As Figure 4.3
shows, the (020) slice contains only half of the cyan and half of the black building units.
The contents of the building units that lie within the (020) slice create a continuous
chain of growth units along the [001] direction as shown in Figure 4.4a, but the chain
114
Chapter 4. Crystal Growth and Morphology Prediction of Aragonite
0
b
a
d020
Figure 4.3: A view of the crystal packing in aragonite along the [001] direction with theboundaries of a (020) slice shown with broken black lines. The blue and black ellipsesrepresent the contents of the two types of building units.
of growth units in the [100] direction shares half of its interactions with the [001] PBC,
and is no longer continuous. If the arrangement of the growth units along [201] and [201]
directions were considered (Figure 4.4b), the step edges or chains of growth units formed
along these two directions are continuous, and they satisfy the stoichiometry and dipole
moment properties as well. Therefore, [201] and [201] were chosen as the periodic bond
chains in the (020) face of aragonite crystals.
The (110) crystal face (d110 = 4.213 A) contains [001], [110], [111] and [111] chains
of building units within the thickness of a single slice (Figure 4.5a). Similar to the
aforementioned case of the [100] PBC in (020) face, growth units in the (110) face do
form continuous chains along the [001] direction, but the chain in the [110] direction
is not continuous. However, the arrangement of growth units along [111] and [111] do
115
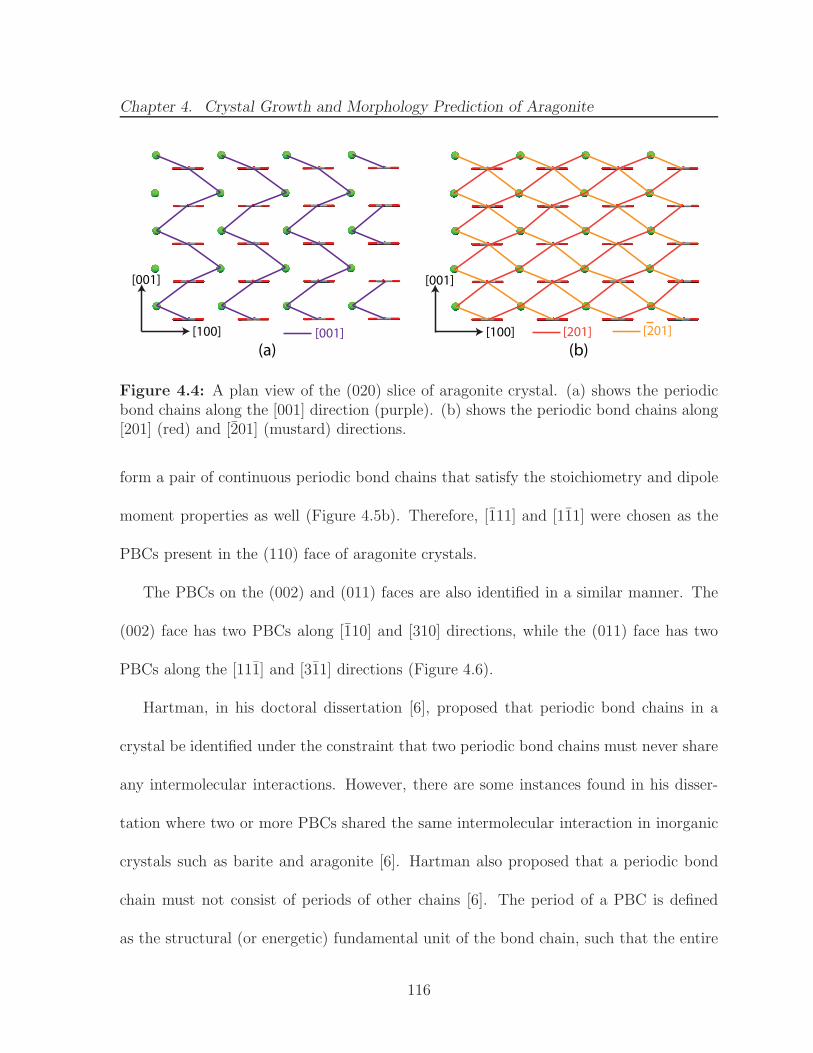
Chapter 4. Crystal Growth and Morphology Prediction of Aragonite
(a) (b)[100]
[001]
[001] [201] [201][100]
[001]
Figure 4.4: A plan view of the (020) slice of aragonite crystal. (a) shows the periodicbond chains along the [001] direction (purple). (b) shows the periodic bond chains along[201] (red) and [201] (mustard) directions.
form a pair of continuous periodic bond chains that satisfy the stoichiometry and dipole
moment properties as well (Figure 4.5b). Therefore, [111] and [111] were chosen as the
PBCs present in the (110) face of aragonite crystals.
The PBCs on the (002) and (011) faces are also identified in a similar manner. The
(002) face has two PBCs along [110] and [310] directions, while the (011) face has two
PBCs along the [111] and [311] directions (Figure 4.6).
Hartman, in his doctoral dissertation [6], proposed that periodic bond chains in a
crystal be identified under the constraint that two periodic bond chains must never share
any intermolecular interactions. However, there are some instances found in his disser-
tation where two or more PBCs shared the same intermolecular interaction in inorganic
crystals such as barite and aragonite [6]. Hartman also proposed that a periodic bond
chain must not consist of periods of other chains [6]. The period of a PBC is defined
as the structural (or energetic) fundamental unit of the bond chain, such that the entire
116
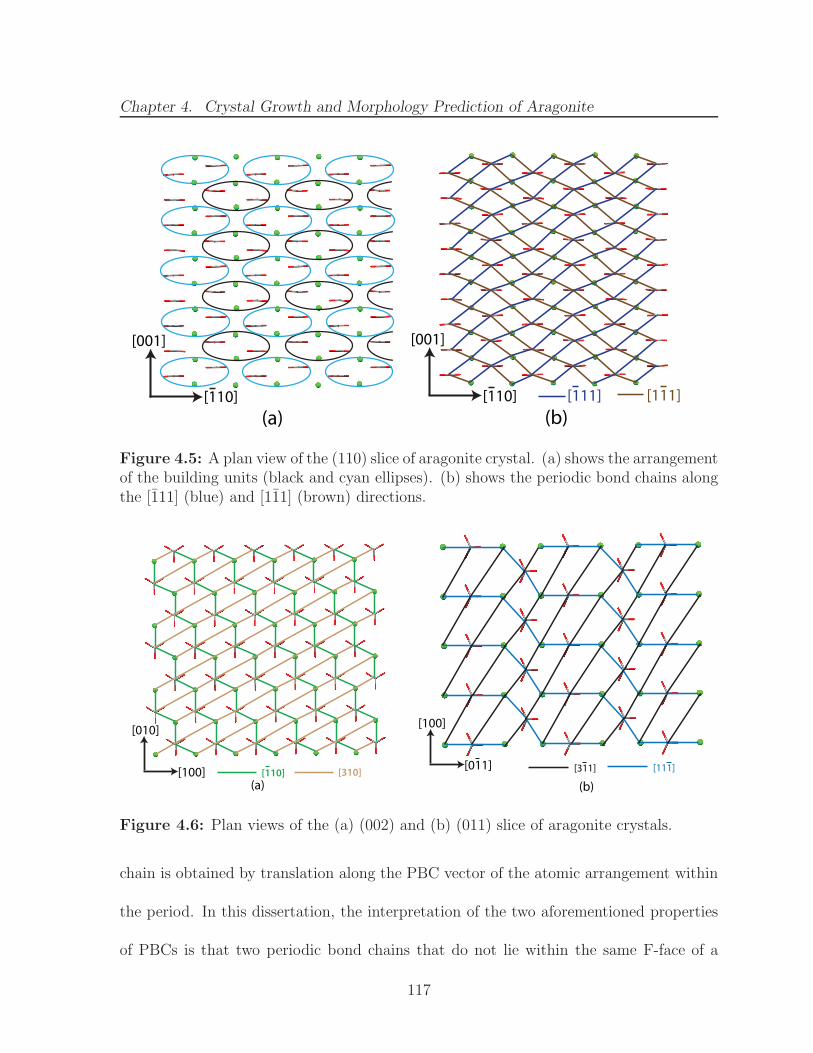
Chapter 4. Crystal Growth and Morphology Prediction of Aragonite
[110]
[001]
(a)[110]
[001]
(b)[111] [111]
Figure 4.5: A plan view of the (110) slice of aragonite crystal. (a) shows the arrangementof the building units (black and cyan ellipses). (b) shows the periodic bond chains alongthe [111] (blue) and [111] (brown) directions.
[110] [310] [311] [111]
(a) (b)[100]
[010]
[011]
[100]
Figure 4.6: Plan views of the (a) (002) and (b) (011) slice of aragonite crystals.
chain is obtained by translation along the PBC vector of the atomic arrangement within
the period. In this dissertation, the interpretation of the two aforementioned properties
of PBCs is that two periodic bond chains that do not lie within the same F-face of a
117
Chapter 4. Crystal Growth and Morphology Prediction of Aragonite
crystal, may share intermolecular interactions if the shared interactions do not form the
entire period of either PBCs. If two PBCs in the same crystal face were to share an
interaction, the two growth units that interact via the particular intermolecular inter-
action will be shared between two spiral edges on the crystal surface. As a result, one
of the edges may not grow, depending on the strength of the remaining intermolecular
interactions along the periods of the two edges. The edge with the higher strength of the
remaining interactions will grow preferentially, and the crystal face could behave as an
S-face.
In aragonite crystals, the chains of building units along the <111> family of directions
do not share any interactions, but the step edges formed along these directions do share
some interactions. Figure 4.7a shows a view of aragonite crystal along the [001] direction
with only the slices of (110) and (110) faces visible. The (110) crystal face contains
[111] and [111] PBCs while the (110) face contains [111] and [111] PBCs. Figure 4.7b
shows twice the length of the period of these four PBC directions passing through a
common Ca2+ ion. The Ca2+-CO2−3 interactions shared between the [111] & [111] edges,
and between the [111] & [111] edges are highlighted. There are no interactions shared
between the step edges that are present either on the (110) or the (110) faces.
The partial charges and Buckingham potential parameters for bulk aragonite crystal
were obtained from the force field reported by Raiteri et al. [7]. The original force field
was optimized for all crystalline phases of calcium carbonate [7], and the same potential
parameters were used to model calcite growth in Chapters 2 and 3. The force field
118
Chapter 4. Crystal Growth and Morphology Prediction of Aragonite
parameters accurately reproduced the crystal structure of calcite, with about 1.5% error
in the prediction of aragonite lattice parameters [7]. Specifically, the force field does not
account for the asymmetry of the carbonate group and the presence of two types of O
atoms (O1 and O2, Figure 4.1) in the crystal structure. Therefore, the partial charge
of the oxygen atoms in aragonite were recalculated using the bond valence model. The
normalized values of the bond valences between Ca-O and C-O atom pairs were calculated
from the partial charges of Ca (+2.0) and C (+1.123) atoms as reported by Raiteri et
al. [7]. The summation of the bond valences around O1 and O2 atoms in bulk aragonite
provided the values of their partial charges as -0.980 and -1.071, respectively. These
values were used for the partial charges of O1 and O2 oxygen atoms in this chapter.
The lattice energy of aragonite was calculated by building a supercell of size 60 ×
60× 60 along the three lattice directions and performing a Madelung-type summation of
the long-range electrostatic interactions. A 10 A cutoff was applied for the short-range
interactions. The calculated value of aragonite lattice energy is -644.0 kcal/mol which
matches well with the reported value of -651.4 kcal/mol calculated using the Born-Fajans-
Haber thermodynamic cycle [8]. Table 4.1 shows the values of the attachment energy
Eatt for the four F-faces on aragonite crystal surface.
The long-range interaction energies of growth units along a PBC direction (EPBC)
were calculated for each PBC that lies within an F-face on aragonite crystal surface.
These interaction energies were calculated with bulk partial charges for each atom present
along the periodic bond chain. Table 4.1 shows the EPBC values for the periodic bond
119
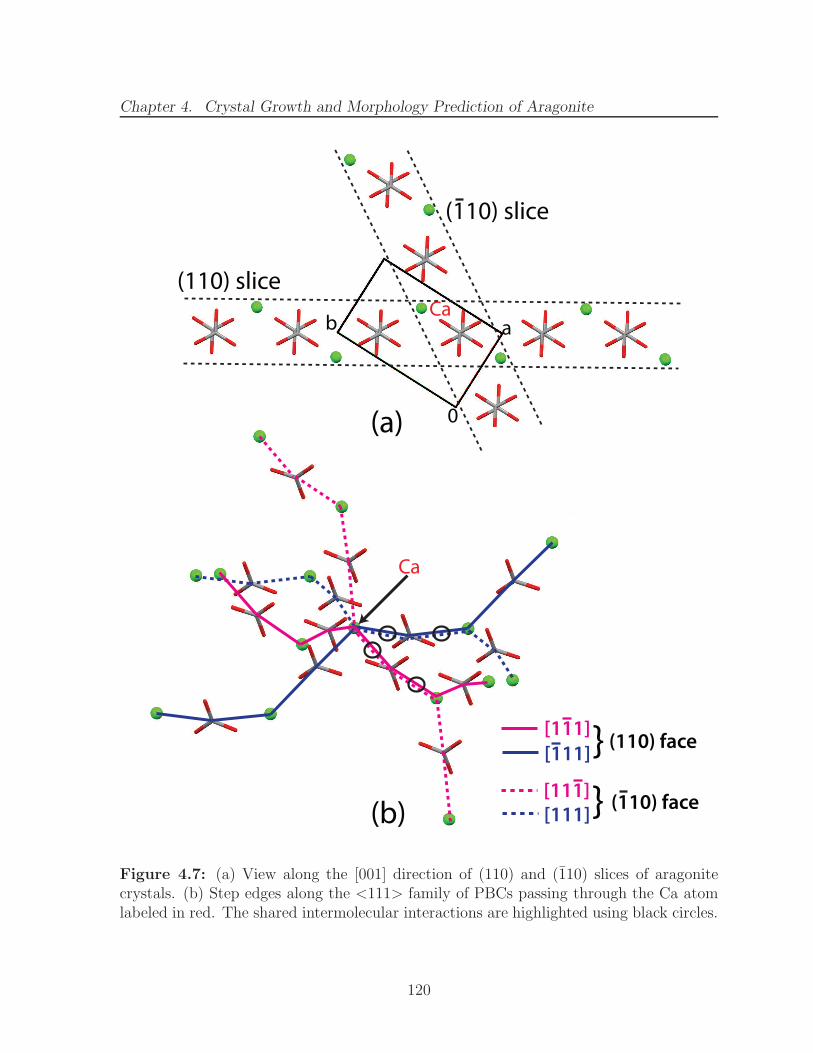
Chapter 4. Crystal Growth and Morphology Prediction of Aragonite
0
ab
(110) slice
(110) slice
(a)
Ca
[111]
[111]
[111]
[111]
Ca
(b)
(110) face
(110) face
}
}
Figure 4.7: (a) View along the [001] direction of (110) and (110) slices of aragonitecrystals. (b) Step edges along the <111> family of PBCs passing through the Ca atomlabeled in red. The shared intermolecular interactions are highlighted using black circles.
120
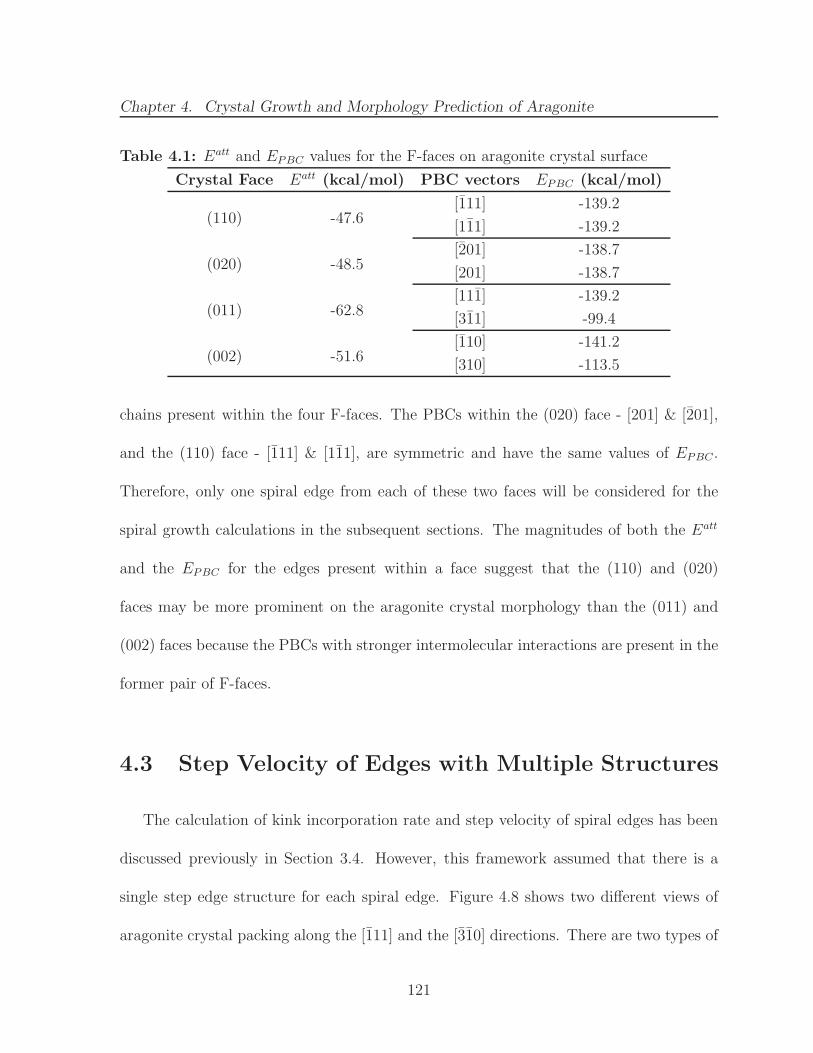
Chapter 4. Crystal Growth and Morphology Prediction of Aragonite
Table 4.1: Eatt and EPBC values for the F-faces on aragonite crystal surface
Crystal Face Eatt (kcal/mol) PBC vectors EPBC (kcal/mol)
(110) -47.6[111] -139.2
[111] -139.2
(020) -48.5[201] -138.7
[201] -138.7
(011) -62.8[111] -139.2
[311] -99.4
(002) -51.6[110] -141.2
[310] -113.5
chains present within the four F-faces. The PBCs within the (020) face - [201] & [201],
and the (110) face - [111] & [111], are symmetric and have the same values of EPBC .
Therefore, only one spiral edge from each of these two faces will be considered for the
spiral growth calculations in the subsequent sections. The magnitudes of both the Eatt
and the EPBC for the edges present within a face suggest that the (110) and (020)
faces may be more prominent on the aragonite crystal morphology than the (011) and
(002) faces because the PBCs with stronger intermolecular interactions are present in the
former pair of F-faces.
4.3 Step Velocity of Edges with Multiple Structures
The calculation of kink incorporation rate and step velocity of spiral edges has been
discussed previously in Section 3.4. However, this framework assumed that there is a
single step edge structure for each spiral edge. Figure 4.8 shows two different views of
aragonite crystal packing along the [111] and the [310] directions. There are two types of
121
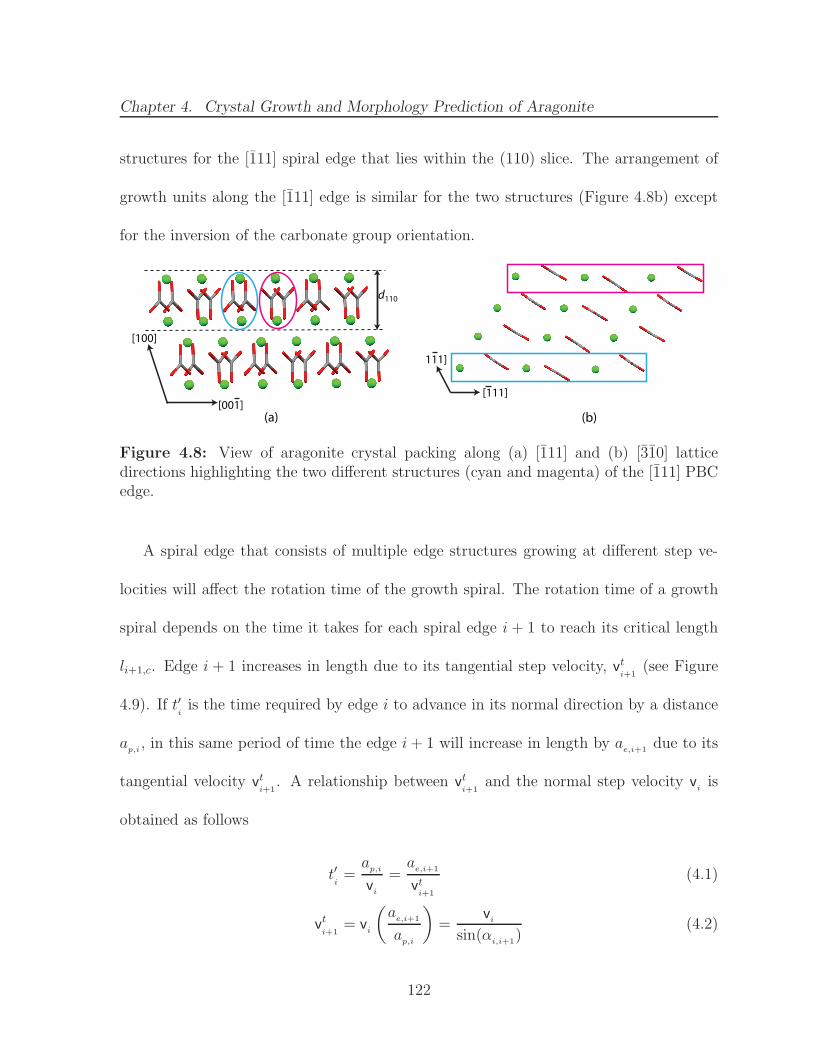
Chapter 4. Crystal Growth and Morphology Prediction of Aragonite
structures for the [111] spiral edge that lies within the (110) slice. The arrangement of
growth units along the [111] edge is similar for the two structures (Figure 4.8b) except
for the inversion of the carbonate group orientation.
[001]
[100]
[111]
[111]
(a) (b)
d110
Figure 4.8: View of aragonite crystal packing along (a) [111] and (b) [310] latticedirections highlighting the two different structures (cyan and magenta) of the [111] PBCedge.
A spiral edge that consists of multiple edge structures growing at different step ve-
locities will affect the rotation time of the growth spiral. The rotation time of a growth
spiral depends on the time it takes for each spiral edge i + 1 to reach its critical length
li+1,c. Edge i + 1 increases in length due to its tangential step velocity, vti+1
(see Figure
4.9). If t′iis the time required by edge i to advance in its normal direction by a distance
ap,i, in this same period of time the edge i+ 1 will increase in length by a
e,i+1due to its
tangential velocity vti+1
. A relationship between vti+1
and the normal step velocity viis
obtained as follows
t′i=
ap,i
vi
=a
e,i+1
vti+1
(4.1)
vti+1
= vi
(
ae,i+1
ap,i
)
=vi
sin(αi,i+1
)(4.2)
122
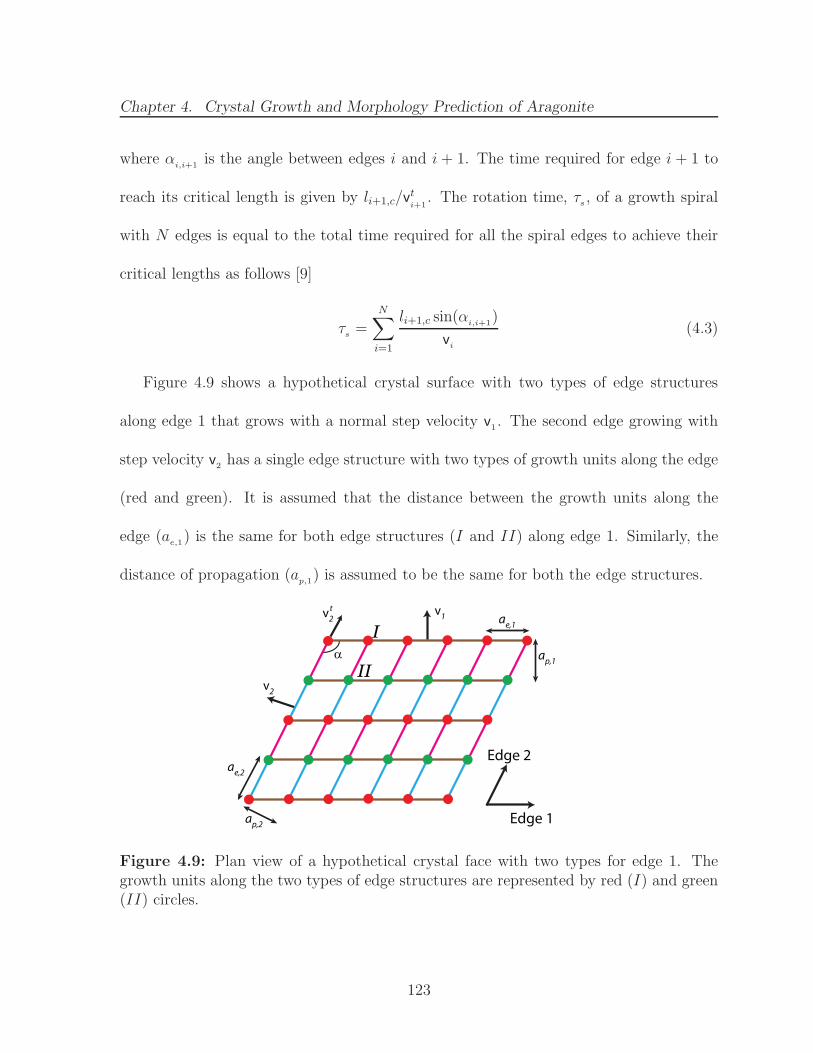
Chapter 4. Crystal Growth and Morphology Prediction of Aragonite
where αi,i+1
is the angle between edges i and i+ 1. The time required for edge i + 1 to
reach its critical length is given by li+1,c/vti+1
. The rotation time, τs , of a growth spiral
with N edges is equal to the total time required for all the spiral edges to achieve their
critical lengths as follows [9]
τs =
N∑
i=1
li+1,c sin(αi,i+1)
vi
(4.3)
Figure 4.9 shows a hypothetical crystal surface with two types of edge structures
along edge 1 that grows with a normal step velocity v1. The second edge growing with
step velocity v2has a single edge structure with two types of growth units along the edge
(red and green). It is assumed that the distance between the growth units along the
edge (ae,1) is the same for both edge structures (I and II) along edge 1. Similarly, the
distance of propagation (ap,1) is assumed to be the same for both the edge structures.
v1
v2
α
ae,1
ap,1
ae,2
ap,2 Edge 1
Edge 2
I
II
v2
t
Figure 4.9: Plan view of a hypothetical crystal face with two types for edge 1. Thegrowth units along the two types of edge structures are represented by red (I) and green(II) circles.
123
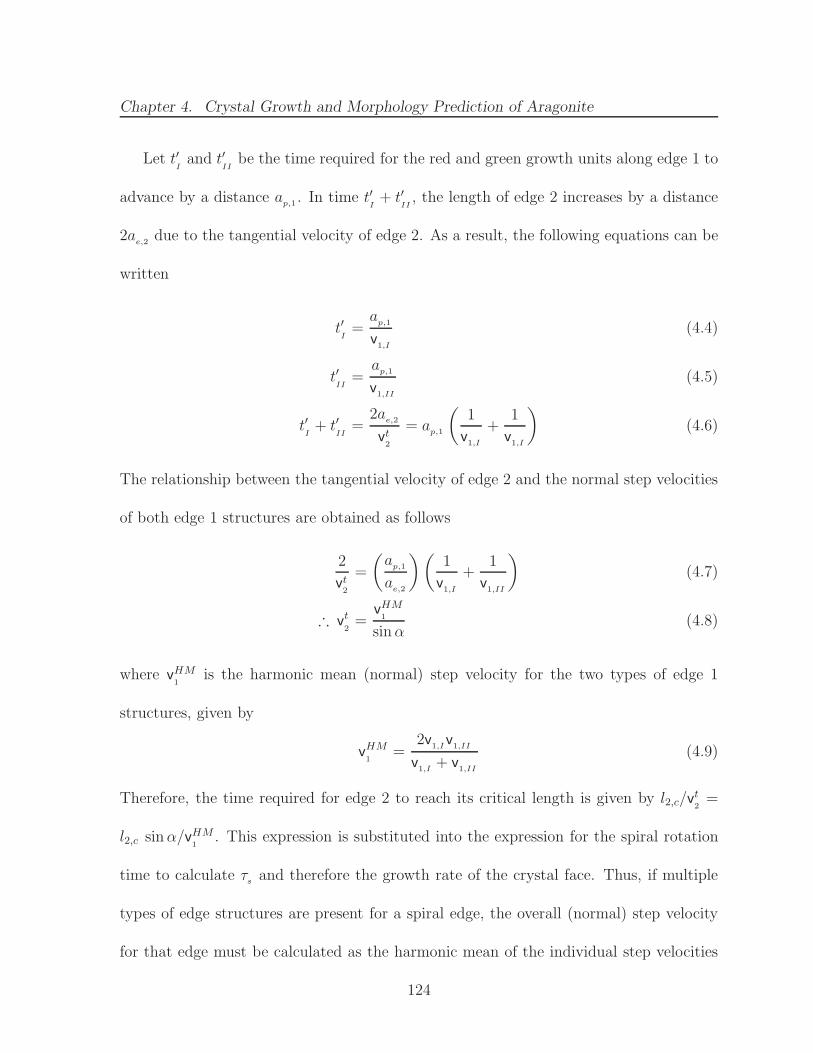
Chapter 4. Crystal Growth and Morphology Prediction of Aragonite
Let t′Iand t′
IIbe the time required for the red and green growth units along edge 1 to
advance by a distance ap,1 . In time t′I+ t′
II, the length of edge 2 increases by a distance
2ae,2
due to the tangential velocity of edge 2. As a result, the following equations can be
written
t′I=
ap,1
v1,I
(4.4)
t′II=
ap,1
v1,II
(4.5)
t′I+ t′
II=
2ae,2
vt2
= ap,1
(
1
v1,I
+1
v1,I
)
(4.6)
The relationship between the tangential velocity of edge 2 and the normal step velocities
of both edge 1 structures are obtained as follows
2
vt2
=
(
ap,1
ae,2
)(
1
v1,I
+1
v1,II
)
(4.7)
∴ vt2=
vHM1
sinα(4.8)
where vHM1
is the harmonic mean (normal) step velocity for the two types of edge 1
structures, given by
vHM1
=2v
1,Iv1,II
v1,I
+ v1,II
(4.9)
Therefore, the time required for edge 2 to reach its critical length is given by l2,c/vt2=
l2,c sinα/vHM1
. This expression is substituted into the expression for the spiral rotation
time to calculate τs and therefore the growth rate of the crystal face. Thus, if multiple
types of edge structures are present for a spiral edge, the overall (normal) step velocity
for that edge must be calculated as the harmonic mean of the individual step velocities
124
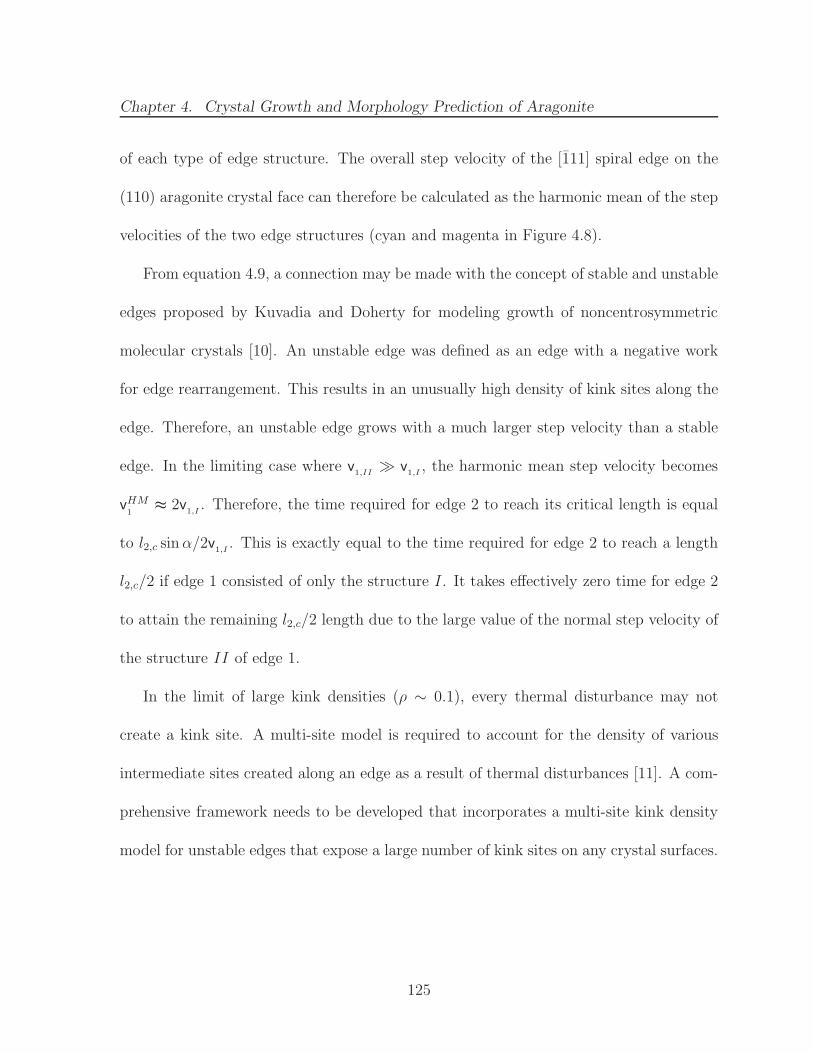
Chapter 4. Crystal Growth and Morphology Prediction of Aragonite
of each type of edge structure. The overall step velocity of the [111] spiral edge on the
(110) aragonite crystal face can therefore be calculated as the harmonic mean of the step
velocities of the two edge structures (cyan and magenta in Figure 4.8).
From equation 4.9, a connection may be made with the concept of stable and unstable
edges proposed by Kuvadia and Doherty for modeling growth of noncentrosymmetric
molecular crystals [10]. An unstable edge was defined as an edge with a negative work
for edge rearrangement. This results in an unusually high density of kink sites along the
edge. Therefore, an unstable edge grows with a much larger step velocity than a stable
edge. In the limiting case where v1,II
≫ v1,I, the harmonic mean step velocity becomes
vHM1
≈ 2v1,I. Therefore, the time required for edge 2 to reach its critical length is equal
to l2,c sinα/2v1,I. This is exactly equal to the time required for edge 2 to reach a length
l2,c/2 if edge 1 consisted of only the structure I. It takes effectively zero time for edge 2
to attain the remaining l2,c/2 length due to the large value of the normal step velocity of
the structure II of edge 1.
In the limit of large kink densities (ρ ∼ 0.1), every thermal disturbance may not
create a kink site. A multi-site model is required to account for the density of various
intermediate sites created along an edge as a result of thermal disturbances [11]. A com-
prehensive framework needs to be developed that incorporates a multi-site kink density
model for unstable edges that expose a large number of kink sites on any crystal surfaces.
125

Chapter 4. Crystal Growth and Morphology Prediction of Aragonite
4.4 Space Partitioning in Aragonite Crystals
The step velocity of a spiral edge on an inorganic crystal depends on the work required
to remove a kink site growth unit [10, 12]. The interaction energy between a kink site
growth unit and its neighbors (in both solid-state and solution) determines the kink
detachment work, ∆W . The calculation of the potential energy of kink site growth
units was carried out using the space partitioning method (see Section 2.4.1). The long-
range electrostatic interactions and the variation in the partial charges in various surface
coordinations is accurately captured by dividing up the three-dimensional space into
partitions within which all the chemically identical growth units have the same partial
charges.
The space partitioning method requires that a growth unit must always belong to only
one partition of space. As discussed in Section 4.2, some periodic bond chains in aragonite
crystals share certain intermolecular interactions. If an intermolecular interaction was
shared between two of the three cardinal directions, both the growth units between
which that particular interaction exists, will belong to more than one partitions of space.
Therefore, for crystals such as aragonite, the PBC directions that share interactions
cannot both be cardinal directions.
The (110) face of aragonite crystals contains two PBCs - [111] and [111], while the
(110) face contains PBCs along the [111] and [111] directions. The [111] and [111] PBC
directions share two intermolecular interactions (see Figure 4.7). If, for example, [111],
[111] and [111] were chosen as the cardinal directions, the space partitioning for the
126
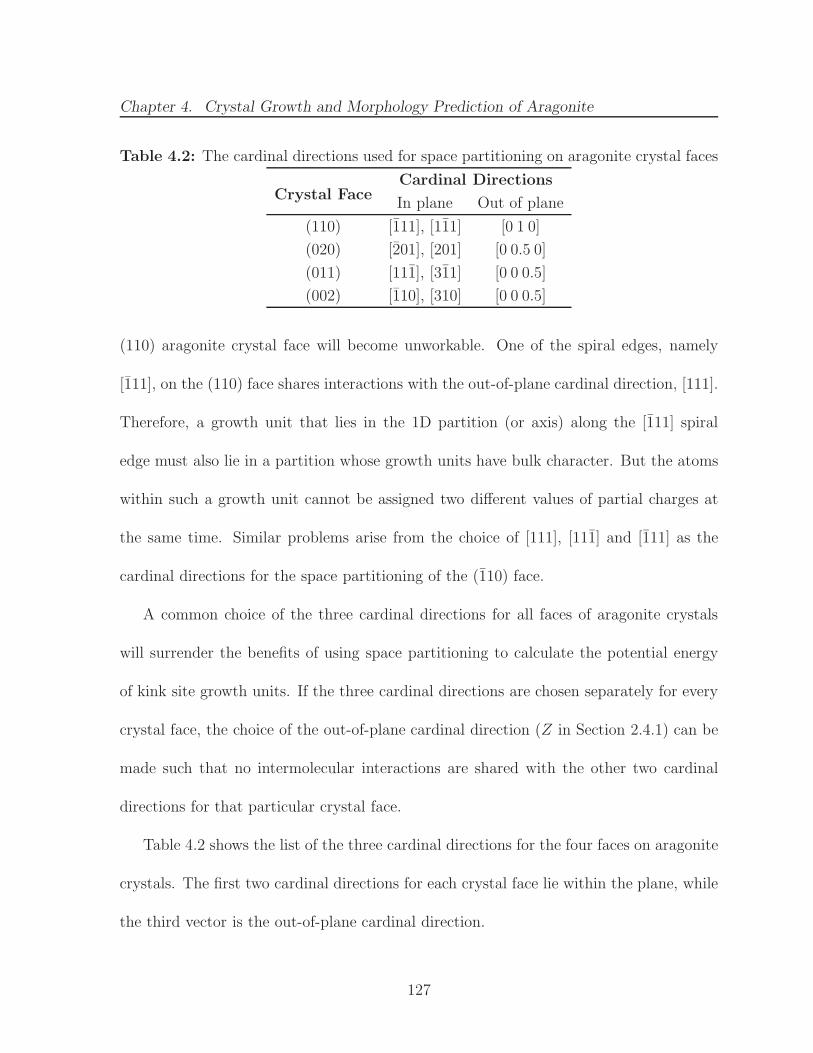
Chapter 4. Crystal Growth and Morphology Prediction of Aragonite
Table 4.2: The cardinal directions used for space partitioning on aragonite crystal faces
Crystal FaceCardinal Directions
In plane Out of plane
(110) [111], [111] [0 1 0]
(020) [201], [201] [0 0.5 0]
(011) [111], [311] [0 0 0.5]
(002) [110], [310] [0 0 0.5]
(110) aragonite crystal face will become unworkable. One of the spiral edges, namely
[111], on the (110) face shares interactions with the out-of-plane cardinal direction, [111].
Therefore, a growth unit that lies in the 1D partition (or axis) along the [111] spiral
edge must also lie in a partition whose growth units have bulk character. But the atoms
within such a growth unit cannot be assigned two different values of partial charges at
the same time. Similar problems arise from the choice of [111], [111] and [111] as the
cardinal directions for the space partitioning of the (110) face.
A common choice of the three cardinal directions for all faces of aragonite crystals
will surrender the benefits of using space partitioning to calculate the potential energy
of kink site growth units. If the three cardinal directions are chosen separately for every
crystal face, the choice of the out-of-plane cardinal direction (Z in Section 2.4.1) can be
made such that no intermolecular interactions are shared with the other two cardinal
directions for that particular crystal face.
Table 4.2 shows the list of the three cardinal directions for the four faces on aragonite
crystals. The first two cardinal directions for each crystal face lie within the plane, while
the third vector is the out-of-plane cardinal direction.
127
Chapter 4. Crystal Growth and Morphology Prediction of Aragonite
If the cardinal directions are chosen separately for every crystal face, there is no
requirement for the out-of-plane cardinal direction to satisfy the stoichiometry and dipole
moment properties of PBCs. The chain of bonds (or intermolecular interactions) between
the growth units along this direction must be continuous, but this chain need not be a
periodic bond chain. However, the two cardinal directions that lie within the crystal face
must be parallel to PBC directions and those chains must satisfy the stoichiometry, the
dipole moment, and the “no common bond” properties. In Table 4.2, only the [0 0.5 0]
cardinal direction for the (020) face forms a stoichiometric chain with zero dipole moment
perpendicular to the chain direction. The other three out-of-plane cardinal directions
listed in Table 4.2 are not stoichiometric.
The solvent structure information for aragonite crystal growth from aqueous solution
is not readily available in the literature. Ruiz-Hernandez et al. [13] performed molecular
dynamics simulation to quantify the incorporation of Mg2+ ions on aragonite crystal
surfaces. However, they report the radial distribution function of water molecules around
only Mg2+ ions incorporated within the crystal surface. Since the values of the distances
between surface Ca2+ and CO2−3 ions and the neighboring water molecules could not
be obtained for aragonite crystal surfaces, solvent structure data from crystal growth of
calcite was used. The solvation structure of the Ca2+ and CO2−3 ions in bulk water must
be exactly the same for both aragonite and calcite crystal growth. The average distance
between the aragonite surface growth units and nearest neighbor water molecules, i.e.,
an average of Ca-O(water) and O(carbonate)-H(water) distances, was estimated from
128
Chapter 4. Crystal Growth and Morphology Prediction of Aragonite
calcite molecular simulations [14] as 2.435 A. Since the values of these distances are not
available for every aragonite edge and kink site, those distances were assumed to be all
equal to 2.435 A.
The coordination of a Ca2+ ion or a carbonate O atom with its solid-state neighbors
decreases as the respective ions go from bulk crystalline sites to surface, edge or kink
sites. This change in the solid-state coordination was assumed to have a 1:1 correlation
with the number of solvent molecules that surround the ions in the surface layer, which
is consistent with molecular simulation data for some other inorganic crystals such as
calcite [14], barite [15], etc. Therefore, a Ca2+ site would coordinate with one additional
water molecule for the loss of every neighboring carbonate oxygen atom, and so on. The
partial charges of the calcium and carbonate ions in various surface sites were calculated
using the bond valence model [16, 17], while also accounting for the presence of the water
molecules surrounding the ions.
The potential energies of the growth units were calculated in kink site and step
positions for each spiral edge on the four crystal faces of aragonite crystals. The work
done for kink detachment, ∆W , was calculated from the potential energy and solvation
energy values using equation 3.26. Table 4.3 shows the ∆W values calculated for the
spiral edges on aragonite crystal surfaces. Each spiral edge contains four growth units in
series - two Ca2+ and two CO2−3 . The average ∆W for each spiral edge is also listed in
Table 4.3.
129
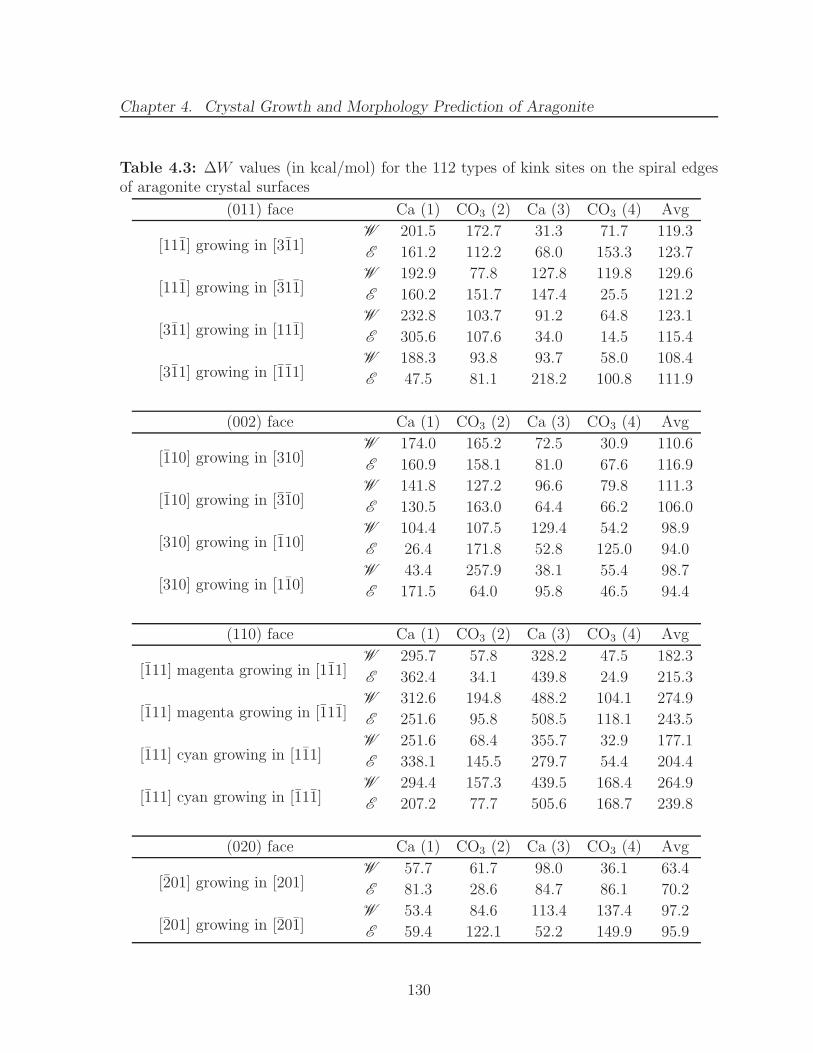
Chapter 4. Crystal Growth and Morphology Prediction of Aragonite
Table 4.3: ∆W values (in kcal/mol) for the 112 types of kink sites on the spiral edgesof aragonite crystal surfaces
(011) face Ca (1) CO3 (2) Ca (3) CO3 (4) Avg
[111] growing in [311]W 201.5 172.7 31.3 71.7 119.3
E 161.2 112.2 68.0 153.3 123.7
[111] growing in [311]W 192.9 77.8 127.8 119.8 129.6
E 160.2 151.7 147.4 25.5 121.2
[311] growing in [111]W 232.8 103.7 91.2 64.8 123.1
E 305.6 107.6 34.0 14.5 115.4
[311] growing in [111]W 188.3 93.8 93.7 58.0 108.4
E 47.5 81.1 218.2 100.8 111.9
(002) face Ca (1) CO3 (2) Ca (3) CO3 (4) Avg
[110] growing in [310]W 174.0 165.2 72.5 30.9 110.6
E 160.9 158.1 81.0 67.6 116.9
[110] growing in [310]W 141.8 127.2 96.6 79.8 111.3
E 130.5 163.0 64.4 66.2 106.0
[310] growing in [110]W 104.4 107.5 129.4 54.2 98.9
E 26.4 171.8 52.8 125.0 94.0
[310] growing in [110]W 43.4 257.9 38.1 55.4 98.7
E 171.5 64.0 95.8 46.5 94.4
(110) face Ca (1) CO3 (2) Ca (3) CO3 (4) Avg
[111] magenta growing in [111]W 295.7 57.8 328.2 47.5 182.3
E 362.4 34.1 439.8 24.9 215.3
[111] magenta growing in [111]W 312.6 194.8 488.2 104.1 274.9
E 251.6 95.8 508.5 118.1 243.5
[111] cyan growing in [111]W 251.6 68.4 355.7 32.9 177.1
E 338.1 145.5 279.7 54.4 204.4
[111] cyan growing in [111]W 294.4 157.3 439.5 168.4 264.9
E 207.2 77.7 505.6 168.7 239.8
(020) face Ca (1) CO3 (2) Ca (3) CO3 (4) Avg
[201] growing in [201]W 57.7 61.7 98.0 36.1 63.4
E 81.3 28.6 84.7 86.1 70.2
[201] growing in [201]W 53.4 84.6 113.4 137.4 97.2
E 59.4 122.1 52.2 149.9 95.9
130
Chapter 4. Crystal Growth and Morphology Prediction of Aragonite
The ∆W values for the kink sites along the two edge structures of [111] spiral edge
(cyan and magenta, Fig 4.8) on the (110) face are not equal for any of the four growth
units. Therefore, the two edge structures will have different values of the kink incorpo-
ration rate. The effective step velocity of the [111] edge is calculated using the harmonic
mean expression from equation 4.9. It must be noted that the kink density of the [111]
edge is calculated for both the edge structures together. Since the kink sites are formed
due to thermal rearrangement of a straight edge, the equilibrium structure of the edge
will be independent of the initial configuration of the straight edge. The equilibrium
structure of an edge is determined by free energy minimization alone and could expose
kink sites from both type of edge structures. Therefore, there is a single value of the kink
density on the [111] edge, which is calculated from the Boltzmann distribution of all the
microstates that expose kink sites belonging to the two types of edge structures (cyan
and magenta).
4.5 Spiral Growth Calculations
Crystal growth of aragonite grown from aqueous solution is studied using the spiral
growth model discussed in Chapters 2 and 3. The quantities required to predict the
relative growth rates and the steady-state morphology of aragonite crystals include the
density of kink sites along the spiral edges (ρ), the kink incorporation rate (u), and the
critical length of each spiral edge (lc). The details of the spiral growth calculations can
be found in Sections 3.3, 3.4,3.6 and 4.3.
131
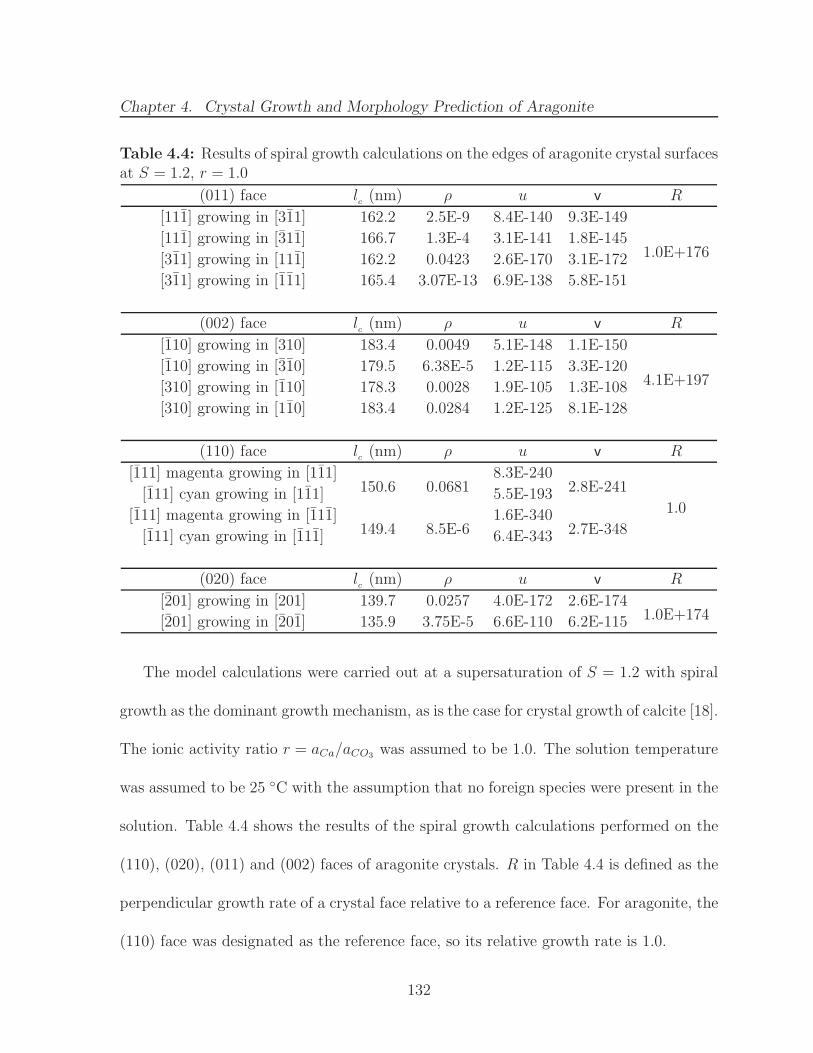
Chapter 4. Crystal Growth and Morphology Prediction of Aragonite
Table 4.4: Results of spiral growth calculations on the edges of aragonite crystal surfacesat S = 1.2, r = 1.0
(011) face lc (nm) ρ u v R
[111] growing in [311] 162.2 2.5E-9 8.4E-140 9.3E-149
1.0E+176[111] growing in [311] 166.7 1.3E-4 3.1E-141 1.8E-145
[311] growing in [111] 162.2 0.0423 2.6E-170 3.1E-172
[311] growing in [111] 165.4 3.07E-13 6.9E-138 5.8E-151
(002) face lc (nm) ρ u v R
[110] growing in [310] 183.4 0.0049 5.1E-148 1.1E-150
4.1E+197[110] growing in [310] 179.5 6.38E-5 1.2E-115 3.3E-120
[310] growing in [110] 178.3 0.0028 1.9E-105 1.3E-108
[310] growing in [110] 183.4 0.0284 1.2E-125 8.1E-128
(110) face lc (nm) ρ u v R
[111] magenta growing in [111]150.6 0.0681
8.3E-2402.8E-241
1.0[111] cyan growing in [111] 5.5E-193
[111] magenta growing in [111]149.4 8.5E-6
1.6E-3402.7E-348[111] cyan growing in [111] 6.4E-343
(020) face lc (nm) ρ u v R
[201] growing in [201] 139.7 0.0257 4.0E-172 2.6E-1741.0E+174[201] growing in [201] 135.9 3.75E-5 6.6E-110 6.2E-115
The model calculations were carried out at a supersaturation of S = 1.2 with spiral
growth as the dominant growth mechanism, as is the case for crystal growth of calcite [18].
The ionic activity ratio r = aCa/aCO3was assumed to be 1.0. The solution temperature
was assumed to be 25 ◦C with the assumption that no foreign species were present in the
solution. Table 4.4 shows the results of the spiral growth calculations performed on the
(110), (020), (011) and (002) faces of aragonite crystals. R in Table 4.4 is defined as the
perpendicular growth rate of a crystal face relative to a reference face. For aragonite, the
(110) face was designated as the reference face, so its relative growth rate is 1.0.
132
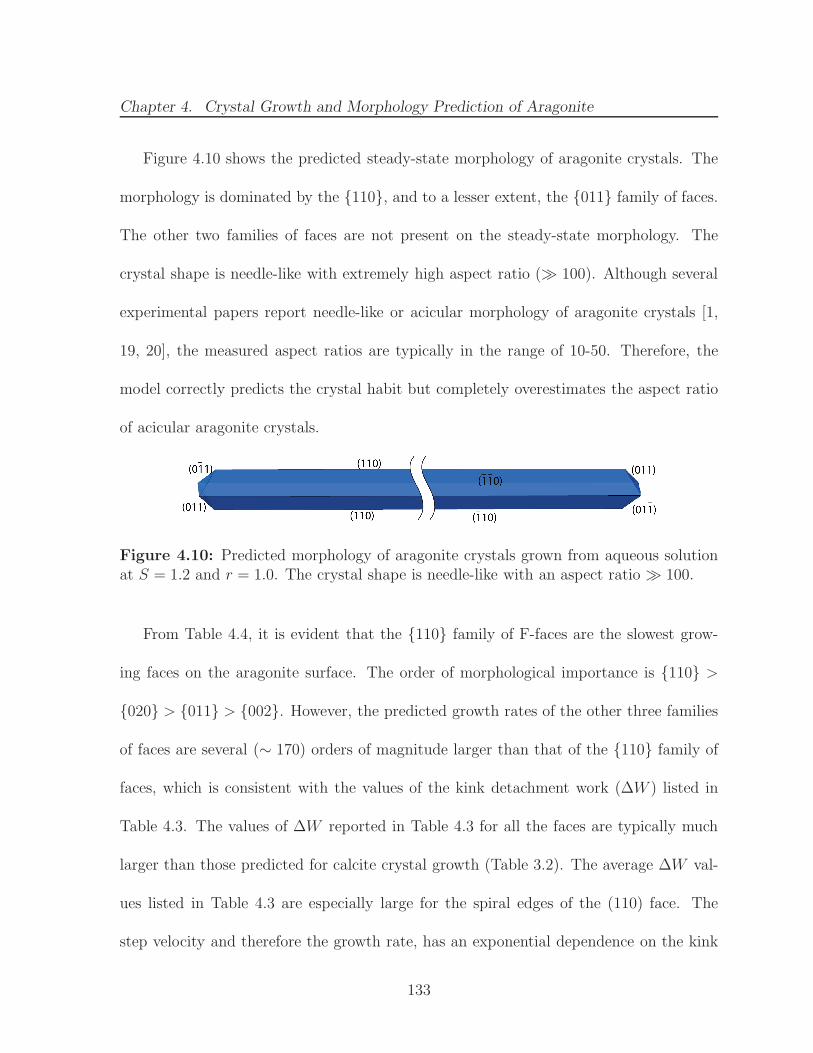
Chapter 4. Crystal Growth and Morphology Prediction of Aragonite
Figure 4.10 shows the predicted steady-state morphology of aragonite crystals. The
morphology is dominated by the {110}, and to a lesser extent, the {011} family of faces.
The other two families of faces are not present on the steady-state morphology. The
crystal shape is needle-like with extremely high aspect ratio (≫ 100). Although several
experimental papers report needle-like or acicular morphology of aragonite crystals [1,
19, 20], the measured aspect ratios are typically in the range of 10-50. Therefore, the
model correctly predicts the crystal habit but completely overestimates the aspect ratio
of acicular aragonite crystals.
Figure 4.10: Predicted morphology of aragonite crystals grown from aqueous solutionat S = 1.2 and r = 1.0. The crystal shape is needle-like with an aspect ratio ≫ 100.
From Table 4.4, it is evident that the {110} family of F-faces are the slowest grow-
ing faces on the aragonite surface. The order of morphological importance is {110} >
{020} > {011} > {002}. However, the predicted growth rates of the other three families
of faces are several (∼ 170) orders of magnitude larger than that of the {110} family of
faces, which is consistent with the values of the kink detachment work (∆W ) listed in
Table 4.3. The values of ∆W reported in Table 4.3 for all the faces are typically much
larger than those predicted for calcite crystal growth (Table 3.2). The average ∆W val-
ues listed in Table 4.3 are especially large for the spiral edges of the (110) face. The
step velocity and therefore the growth rate, has an exponential dependence on the kink
133
Chapter 4. Crystal Growth and Morphology Prediction of Aragonite
detachment work. As a result, a 100 kcal/mol difference in ∆W results in growth rates
that are about 70 orders of magnitude larger. Table 4.4 shows that the step velocities of
spiral edges within the same crystal face may also vary by several orders of magnitude.
Since the growth rate of a crystal face is dominated by the slowest growing spiral edge, an
exceptionally larger value of ∆W for one spiral edge (such as for the [111] edge growing
in the [111] direction on the (110) face) forces the crystal face to grow at a very slow
rate. This accounts for another 100 orders of magnitude difference between the growth
rates of the (110) face and the other crystal faces.
The spiral growth calculations are extremely sensitive to the accuracy in the estima-
tion of the kink detachment work. ∆W depends on the long-range electrostatic inter-
action energy between the kink site growth unit and its solid-state neighbors, which is
calculated using the space partitioning method. The partial charges of the growth units
in the surface layer are calculated using the bond valence model [17]. The interatomic
distances between the growth units in the surface layer affect the electrostatic interaction
energy of kink site growth units in two different ways – (i) as the interionic separation
distance in the denominator of the expression for columbic energy, and (ii) as the par-
tial charges (or summation of bond valences) that have an exponential dependence on
interatomic distance (equation 2.4).
Information about surface relaxation in the presence of water molecules will provide
the correct atomic positions of both solute and solvent species, and therefore, the correct
interatomic distances. No experimental or simulation studies were found in the litera-
134
Chapter 4. Crystal Growth and Morphology Prediction of Aragonite
ture that report values of surface relaxation and solvent structure near aragonite crystal
surfaces. Therefore, the solvent structure information for calcite growth was used here
to perform the calculations for aragonite crystal growth. Accurate structural informa-
tion of the crystal-solution interface is necessary to correctly predict the aspect ratios
of needle-like aragonite crystals. This model presents a systematic methodology that
correctly captures the overall crystal shape of aragonite crystals grown from aqueous
solution, despite the absence of solvent structure information. However, a more accurate
prediction of the relative growth rates requires complementary efforts to specify the struc-
ture of the crystal surface and its surroundings using molecular dynamics simulations or
measurement techniques such as neutron scattering, electron diffraction, etc.
4.6 Conclusions
The spiral growth model was applied to study aragonite crystal growth from aqueous
solutions. Lower symmetry of aragonite crystal structure (as compared to calcite) pre-
sented new challenges for the mechanistic modeling framework and helped make it more
general. A consequence of the sharing of intermolecular interactions between two PBCs
in a crystal is that, in the space partitioning method, the cardinal directions must be
chosen anew for each crystal face. With this modification, the space partitioning method
can still be applied to calculate the kink site potential energies and the kink detachment
work.
135
Chapter 4. Crystal Growth and Morphology Prediction of Aragonite
The spiral edges on the (110) face of aragonite exhibit multiple structures that have
different rates of kink incorporation. A suitable modification to the spiral growth model
has been proposed that accounts for multiple edge structures advancing at dissimilar
velocities. The harmonic mean of the step velocities of the various edge structures is
used as the overall step advancement rate in the expression for the spiral rotation time.
The spiral growth model correctly predicts needle-like shape for aragonite crystals,
but the aspect ratio of the needles is overestimated by several orders of magnitude. The
overestimation is caused by the absence of the correct solvent structure information that
results in the loss of accuracy in the calculation of the kink detachment work (∆W ).
Molecular simulations can provide more precise radial distribution functions for solvent
molecules near surface growth units on aragonite crystal surfaces. This will allow ac-
curate predictions of the crystal morphology as well as the shapes of growth spirals on
each crystal face. The latter predictions could be validated with in situ Atomic Force
Microscopy (AFM) measurement techniques that have been implemented to observe the
growth of some inorganic crystals such as calcite [21], zeolites [22], etc.
136
Bibliography
[1] L. Wang, I. Sondi, and E. Matijevic. Preparation of uniform needle-like aragoniteparticles by homogeneous precipitation. J. Colloid Interface Sci., 218:545–553, 1999.
[2] F. Nudelman, B. A. Gotliv, L. Addadi, and S. Weiner. Mollusk shell formation:Mapping the distribution of organic matrix components underlying a single arago-nitic tablet in nacre. J. Struct. Biol., 153:176 – 187, 2006.
[3] S. Weiner and L. Addadi. Crystallization pathways in biomineralization. Annu. Rev.Mater. Res., 41:21–40, 2011.
[4] A. P. Jackson, J. F. V. Vincent, and R. M. Turner. The mechanical design of nacre.Proc. R. Soc. Lond. B Biol. Sci., 234:415–440, 1988.
[5] J. P. R. De Villiers. Crystal structures of aragonite, strontianite, and witherite. Am.Mineral., 56:758–767, 1971.
[6] P. Hartman. Relations between Structure and Morphology of Crystals. PhD thesis,University of Groningen, 1953.
[7] P. Raiteri, J. D. Gale, D. Quigley, and P. M. Rodger. Derivation of an accurateforce-field for simulating the growth of calcium carbonate from aqueous solution: Anew model for the calcite-water interface. J. Phys. Chem. C, 114:5997–6010, 2010.
[8] H. D. B. Jenkins, K. F. Pratt, and B. T. Smith. Lattice potential energies for calcite,aragonite and vaterite. J. Inorg. Nucl. Chem., 38:371–377, 1976.
[9] R. C. Snyder and M. F. Doherty. Predicting crystal growth by spiral motion. Proc.R. Soc. A, 465:1145–1171, 2009.
[10] Z. B. Kuvadia and M. F. Doherty. Spiral growth model for faceted crystals ofnon-centrosymmetric organic molecules grown from solution. Cryst. Growth Des.,11:2780–2802, 2011.
[11] M. A. Lovette and M. F. Doherty. Multisite models to determine the distributionof kink sites adjacent to low-energy edges. Phys. Rev. E, 85:021604, 2012.
137
Bibliography
[12] P. Dandekar and M. F. Doherty. A mechanistic growth model for inorganic crystals:Growth mechanism. AIChE J., (in press), 2014.
[13] S. E. Ruiz-Hernandez, R. Grau-Crespo, N. Almora-Barrios, M. Wolthers, A. R.Ruiz-Salvador, N. Fernandez, and N. H. de Leeuw. Mg/Ca partitioning betweenaqueous solution and aragonite mineral: A molecular dynamics study. Chem. Eur.J., 18:9828–9833, 2012.
[14] M. Wolthers, D. Di Tommaso, Z. Du, and N. H. de Leeuw. Calcite surface structureand reactivity: Molecular dynamics simulations and macroscopic surface modellingof the calcite-water interface. Phys. Chem. Chem. Phys., 14:15145–15157, 2012.
[15] A. G. Stack. Molecular Dynamics Simulations of Solvation and Kink Site Formationat the {001} Barite-Water Interface. J. Phys. Chem. C, 113:2104–2110, 2009.
[16] I. D. Brown and R. D. Shannon. Empirical bond-strength-bond-length curves foroxides. Acta. Crystallogr. A, 29:266–282, 1973.
[17] I. D. Brown. The Chemical Bond in Inorganic Chemsitry: The Bond Valence Model.Oxford University Press, 2002.
[18] H. Teng, P. M. Dove, and J. J. DeYoreo. Reversed calcite morphologies induced bymicroscopic growth kinetics: insight into biomineralization. Geochim. Cosmochim.Acta, 63:2507–2512, 1999.
[19] Z. Hu and Y. Deng. Supersaturation control in aragonite synthesis using sparinglysoluble calcium sulfate as reactants. J. Colloid Interface Sci., 266:359–365, 2003.
[20] N. Koga, D. Kasahara, and T. Kimura. Aragonite crystal growth and solid-statearagonite-calcite transformation: A physico-geometrical relationship via thermal de-hydration of included water. Cryst. Growth Des., 13:2238–2246, 2013.
[21] H. H. Teng, P. M. Dove, C. A. Orme, and J. J. De Yoreo. Thermodynamics ofcalcite growth: Baseline for understanding biomineral formation. Science, 282:724–727, 1998.
[22] A. I. Lupulescu and J. D. Rimer. In situ imaging of silicalite-1 surface growth revealsthe mechanism of crystallization. Science, 344:729–732, 2014.
138
Chapter 5
Crystal Growth of Anatase fromHydrothermal Synthesis
5.1 Introduction
Titanium dioxide (TiO2) exists in nature in three polymorphic forms - rutile, anatase,
brookite. Rutile is the thermodynamically stable polymorph at room temperature and
pressure, and is widely used as a white pigment in paints and cosmetic products. Anatase
finds applications in areas such as photocatalysis [1] and dye-sensitized solar cells [2, 3].
The (001) crystal face of anatase shows higher catalytic activity towards water disso-
ciation than the (101) face [4]. Additives such as hydrofluoric acid have been used to
tailor the shapes of anatase crystals to maximize the surface area of the (001) face [5]. A
systematic understanding of the crystal growth process will allow design of functionally
desirable anatase crystals.
Titanium dioxide is sparingly soluble in water at room temperature and pressure,
therefore anatase crystals cannot be grown by traditional solution synthesis techniques.
139
Chapter 5. Crystal Growth of Anatase from Hydrothermal Synthesis
The solubility in water increases at higher temperatures, therefore, hydrothermal syn-
thesis techniques can be used to grow anatase crystals at high temperature (> 100◦C)
and high pressure (> 1 bar).
5.1.1 Growth Unit for Anatase Crystal Growth
In an aqueous solution, Ti4+ ions are octahedrally coordinated with H2O or OH−
species, depending on the pH of the solution [6]. It is well known that TiO6 octahedra
are the growth units in the hydrothermal synthesis of anatase crystals [7–9]. Depending
on the composition and pH of the solution, the oxygen atoms in the TiO6 octahedra
may form chemical bonds with hydrogen atoms or other species, and the actual chemical
composition of these octahedral growth units will vary. The TiO6 octahedral species are
referred to as the solution phase growth units in this chapter. A dehydration step, such as
the one shown below, may follow before these species incorporate into the stoichiometric
crystal lattice [9].
[Ti (OH)6]2− (aq) + crystal(s) ⇋ TiO2(s) + 2OH−(aq) + 2H2O(aq) (5.1)
The effect of the solution chemistry on crystal growth of anatase remains an area of
active research [10]. In a high-pH solution, the surface incorporated TiO2 species may
themselves be coordinated with OH− ions. Therefore, the dehydration step may not
yield stoichiometric and charge neutral species that have incorporated into the crystal
lattice [6]. However, to identify the periodic bond chains within the crystal under a
mechanistic growth modeling framework, it is assumed that the dehydration step is fast
140
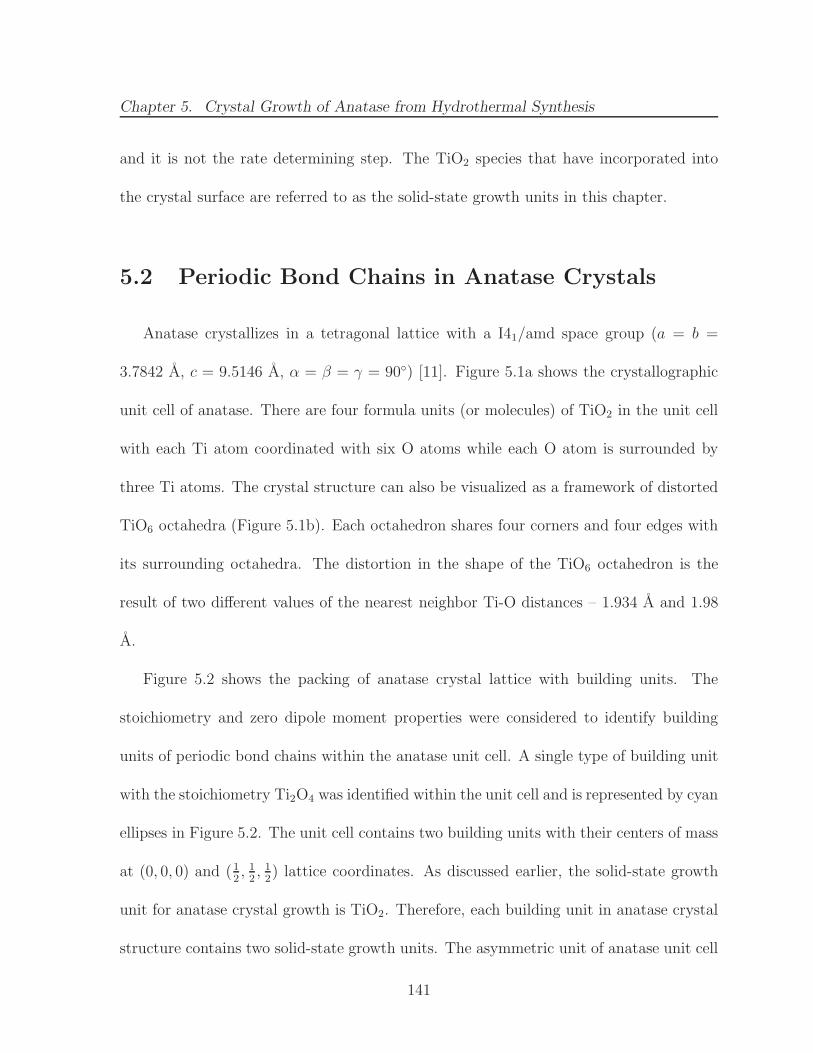
Chapter 5. Crystal Growth of Anatase from Hydrothermal Synthesis
and it is not the rate determining step. The TiO2 species that have incorporated into
the crystal surface are referred to as the solid-state growth units in this chapter.
5.2 Periodic Bond Chains in Anatase Crystals
Anatase crystallizes in a tetragonal lattice with a I41/amd space group (a = b =
3.7842 A, c = 9.5146 A, α = β = γ = 90◦) [11]. Figure 5.1a shows the crystallographic
unit cell of anatase. There are four formula units (or molecules) of TiO2 in the unit cell
with each Ti atom coordinated with six O atoms while each O atom is surrounded by
three Ti atoms. The crystal structure can also be visualized as a framework of distorted
TiO6 octahedra (Figure 5.1b). Each octahedron shares four corners and four edges with
its surrounding octahedra. The distortion in the shape of the TiO6 octahedron is the
result of two different values of the nearest neighbor Ti-O distances – 1.934 A and 1.98
A.
Figure 5.2 shows the packing of anatase crystal lattice with building units. The
stoichiometry and zero dipole moment properties were considered to identify building
units of periodic bond chains within the anatase unit cell. A single type of building unit
with the stoichiometry Ti2O4 was identified within the unit cell and is represented by cyan
ellipses in Figure 5.2. The unit cell contains two building units with their centers of mass
at (0, 0, 0) and (12, 12, 12) lattice coordinates. As discussed earlier, the solid-state growth
unit for anatase crystal growth is TiO2. Therefore, each building unit in anatase crystal
structure contains two solid-state growth units. The asymmetric unit of anatase unit cell
141
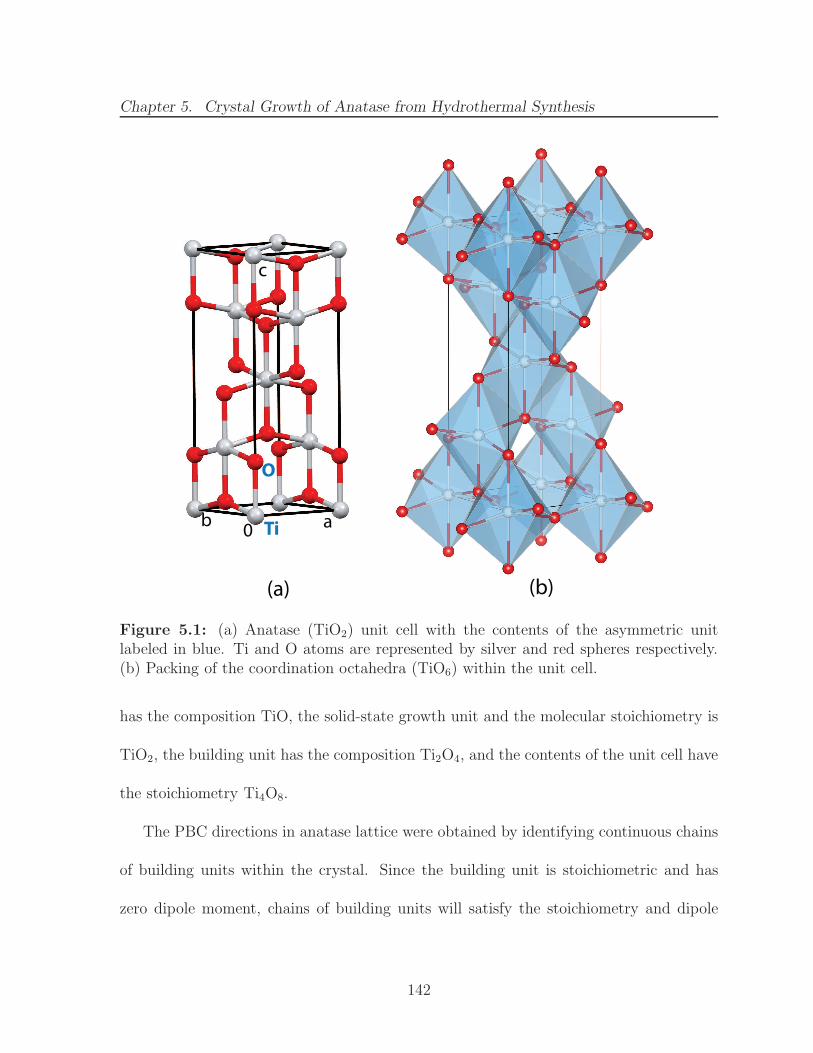
Chapter 5. Crystal Growth of Anatase from Hydrothermal Synthesis
0 ab
c
Ti
O
(a) (b)
Figure 5.1: (a) Anatase (TiO2) unit cell with the contents of the asymmetric unitlabeled in blue. Ti and O atoms are represented by silver and red spheres respectively.(b) Packing of the coordination octahedra (TiO6) within the unit cell.
has the composition TiO, the solid-state growth unit and the molecular stoichiometry is
TiO2, the building unit has the composition Ti2O4, and the contents of the unit cell have
the stoichiometry Ti4O8.
The PBC directions in anatase lattice were obtained by identifying continuous chains
of building units within the crystal. Since the building unit is stoichiometric and has
zero dipole moment, chains of building units will satisfy the stoichiometry and dipole
142
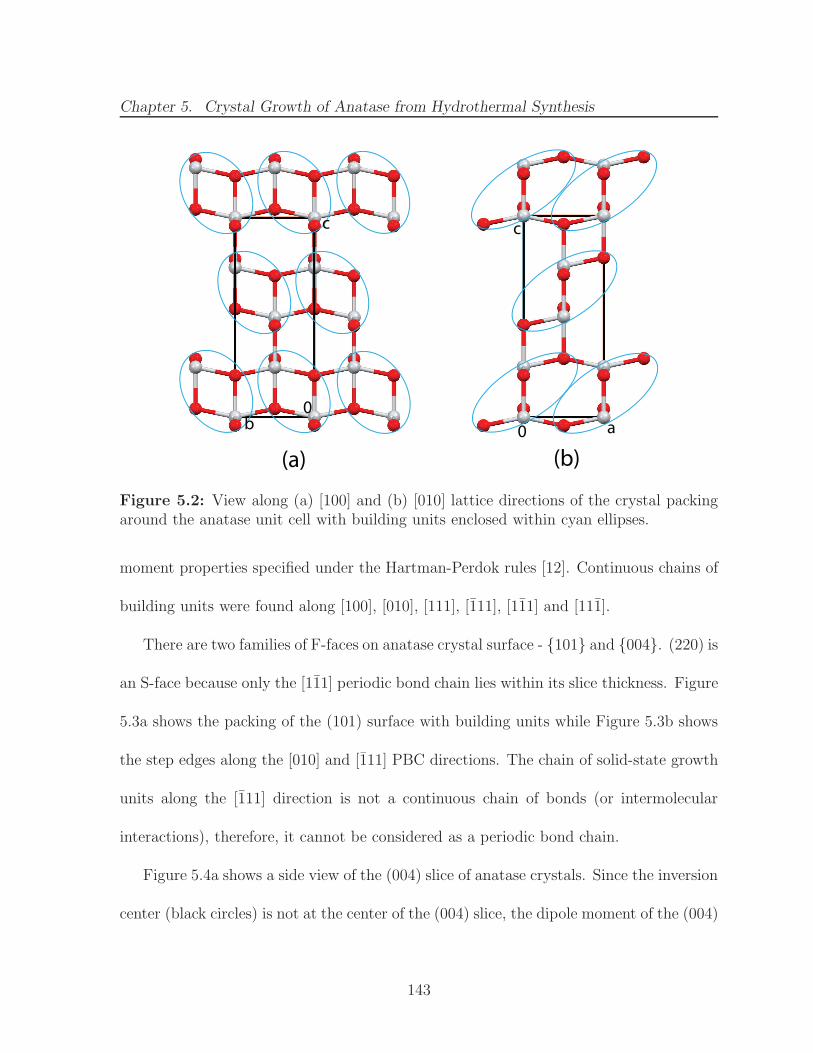
Chapter 5. Crystal Growth of Anatase from Hydrothermal Synthesis
(a) (b)
c
0b 0 a
c
Figure 5.2: View along (a) [100] and (b) [010] lattice directions of the crystal packingaround the anatase unit cell with building units enclosed within cyan ellipses.
moment properties specified under the Hartman-Perdok rules [12]. Continuous chains of
building units were found along [100], [010], [111], [111], [111] and [111].
There are two families of F-faces on anatase crystal surface - {101} and {004}. (220) is
an S-face because only the [111] periodic bond chain lies within its slice thickness. Figure
5.3a shows the packing of the (101) surface with building units while Figure 5.3b shows
the step edges along the [010] and [111] PBC directions. The chain of solid-state growth
units along the [111] direction is not a continuous chain of bonds (or intermolecular
interactions), therefore, it cannot be considered as a periodic bond chain.
Figure 5.4a shows a side view of the (004) slice of anatase crystals. Since the inversion
center (black circles) is not at the center of the (004) slice, the dipole moment of the (004)
143
Chapter 5. Crystal Growth of Anatase from Hydrothermal Synthesis
[010]
[111](a) (b)
Figure 5.3: Plan view of the (101) anatase crystal surface. (a) shows the packing of thesurface with building units (cyan ellipses). (b) shows the periodic bond chains along the[010] (green) and [111] (blue) step edges.
slice is not zero. The residual dipole moment lies along a direction parallel to the (004)
slice. The dipole moment of successive (004) layers are aligned in opposite directions,
therefore the slice thickness of 2 × d004 has a zero dipole moment. The definition of
unstable crystal surfaces proposed by Tasker [13] was based on the presence of a dipole
moment perpendicular to the crystal surface. Therefore, the (004) anatase crystal surface
is not unstable. However, the structure of the PBC edges within the (004) slice does differ
from that in other faces. Figure 5.4b shows the step edges present within the (004) surface
of anatase crystals. The two PBCs along the [100] and [010] directions are equivalent due
to the symmetry of the tetragonal lattice. However, the structure of the [010] edge in the
(004) face is different from that in the (101) face. The nearest neighbor Ti-O distances
144
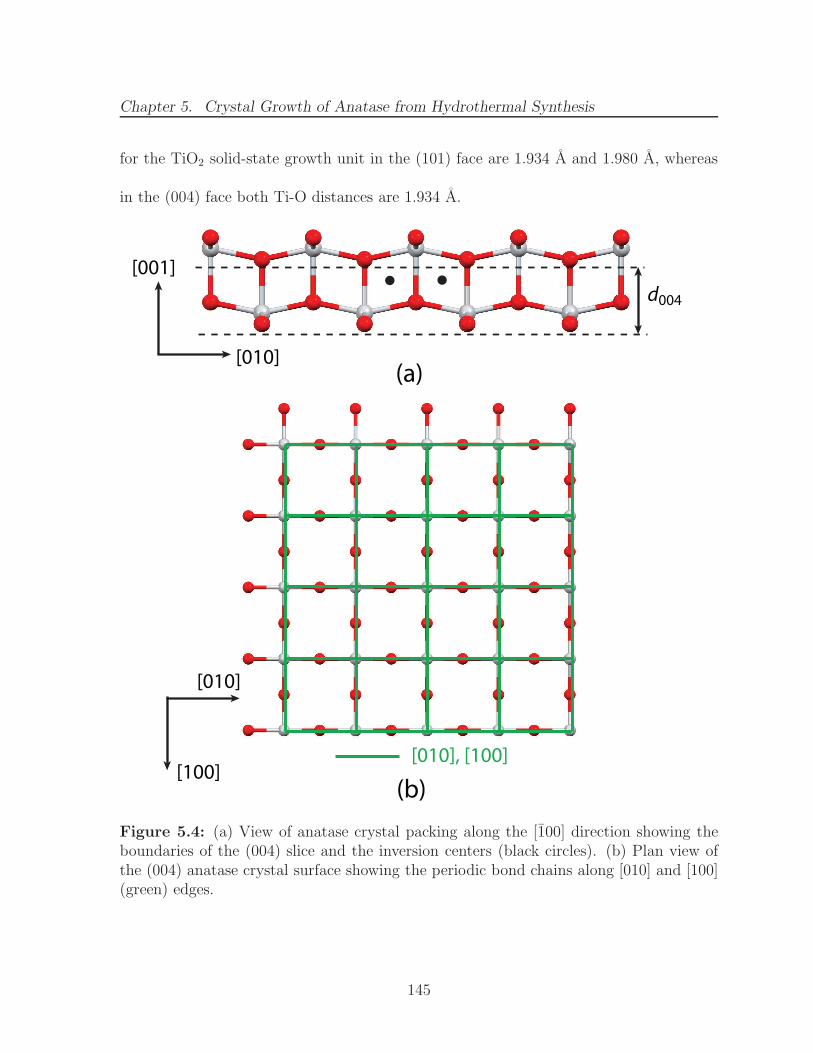
Chapter 5. Crystal Growth of Anatase from Hydrothermal Synthesis
for the TiO2 solid-state growth unit in the (101) face are 1.934 A and 1.980 A, whereas
in the (004) face both Ti-O distances are 1.934 A.
[010], [100]
d004
[010]
[001]
(a)
(b)
[010]
[100]
Figure 5.4: (a) View of anatase crystal packing along the [100] direction showing theboundaries of the (004) slice and the inversion centers (black circles). (b) Plan view ofthe (004) anatase crystal surface showing the periodic bond chains along [010] and [100](green) edges.
145
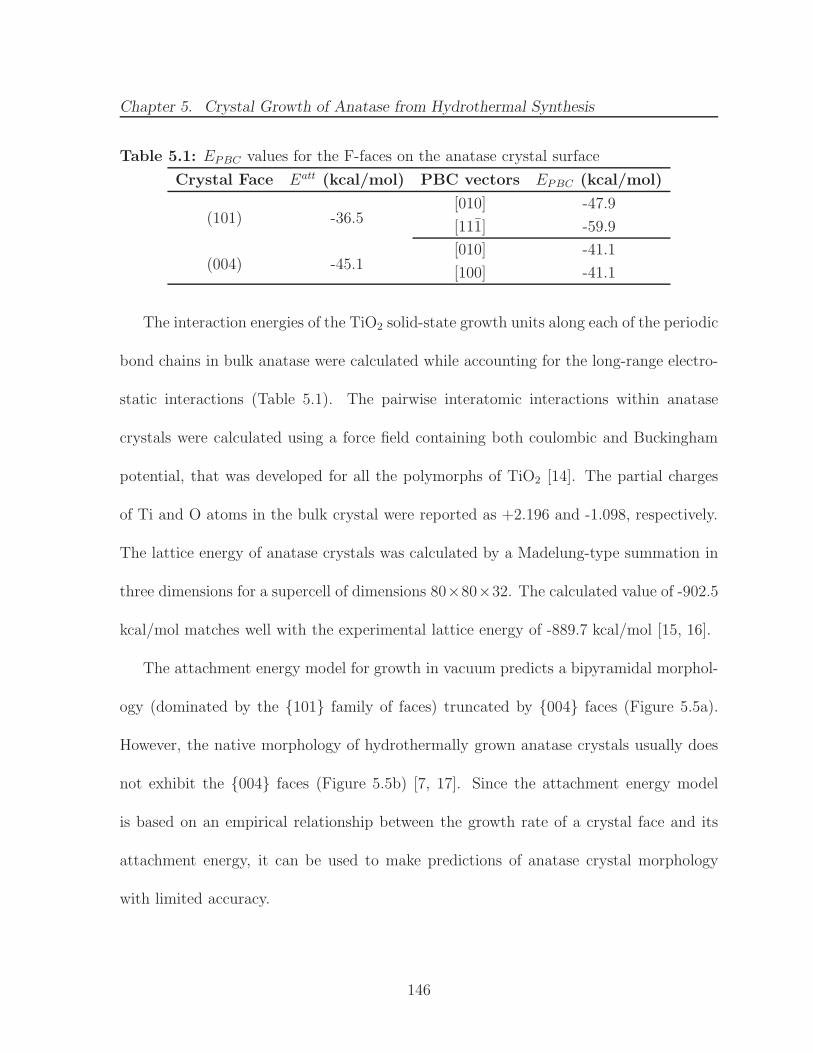
Chapter 5. Crystal Growth of Anatase from Hydrothermal Synthesis
Table 5.1: EPBC values for the F-faces on the anatase crystal surface
Crystal Face Eatt (kcal/mol) PBC vectors EPBC (kcal/mol)
(101) -36.5[010] -47.9
[111] -59.9
(004) -45.1[010] -41.1
[100] -41.1
The interaction energies of the TiO2 solid-state growth units along each of the periodic
bond chains in bulk anatase were calculated while accounting for the long-range electro-
static interactions (Table 5.1). The pairwise interatomic interactions within anatase
crystals were calculated using a force field containing both coulombic and Buckingham
potential, that was developed for all the polymorphs of TiO2 [14]. The partial charges
of Ti and O atoms in the bulk crystal were reported as +2.196 and -1.098, respectively.
The lattice energy of anatase crystals was calculated by a Madelung-type summation in
three dimensions for a supercell of dimensions 80×80×32. The calculated value of -902.5
kcal/mol matches well with the experimental lattice energy of -889.7 kcal/mol [15, 16].
The attachment energy model for growth in vacuum predicts a bipyramidal morphol-
ogy (dominated by the {101} family of faces) truncated by {004} faces (Figure 5.5a).
However, the native morphology of hydrothermally grown anatase crystals usually does
not exhibit the {004} faces (Figure 5.5b) [7, 17]. Since the attachment energy model
is based on an empirical relationship between the growth rate of a crystal face and its
attachment energy, it can be used to make predictions of anatase crystal morphology
with limited accuracy.
146
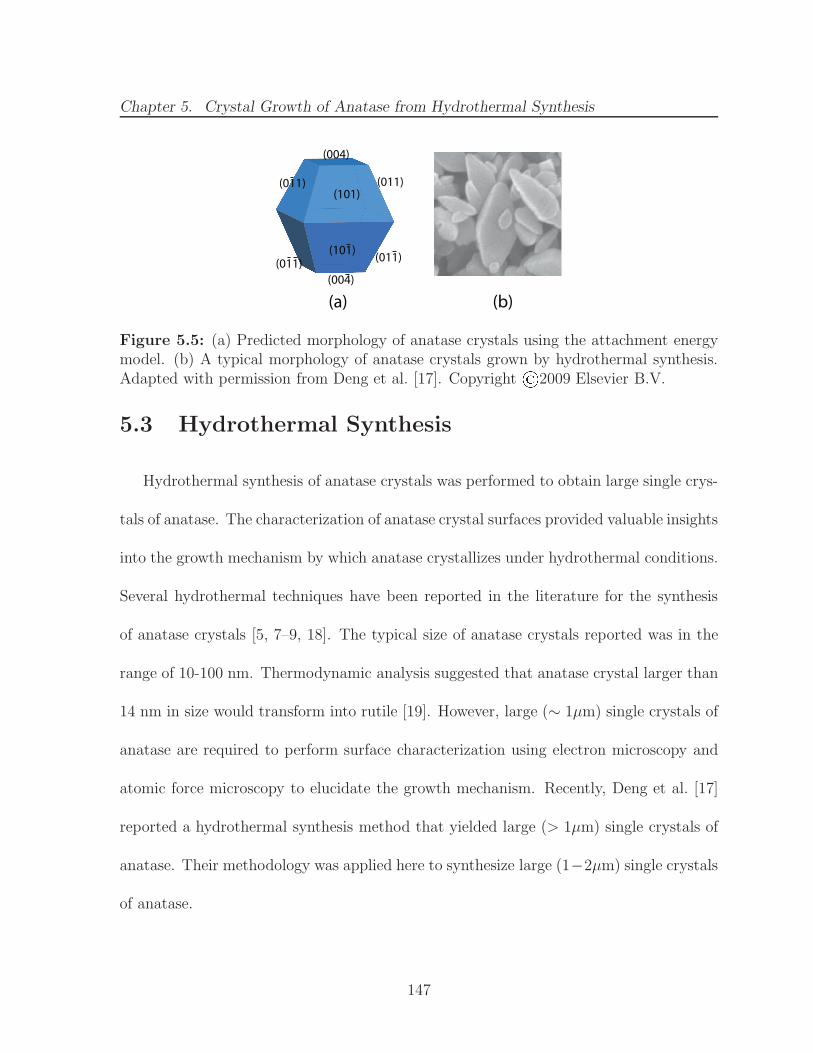
Chapter 5. Crystal Growth of Anatase from Hydrothermal Synthesis
(101)
(004)
(011)
(004)
(011)(101)
(011)
(011)
(a) (b)
Figure 5.5: (a) Predicted morphology of anatase crystals using the attachment energymodel. (b) A typical morphology of anatase crystals grown by hydrothermal synthesis.Adapted with permission from Deng et al. [17]. Copyright ©2009 Elsevier B.V.
5.3 Hydrothermal Synthesis
Hydrothermal synthesis of anatase crystals was performed to obtain large single crys-
tals of anatase. The characterization of anatase crystal surfaces provided valuable insights
into the growth mechanism by which anatase crystallizes under hydrothermal conditions.
Several hydrothermal techniques have been reported in the literature for the synthesis
of anatase crystals [5, 7–9, 18]. The typical size of anatase crystals reported was in the
range of 10-100 nm. Thermodynamic analysis suggested that anatase crystal larger than
14 nm in size would transform into rutile [19]. However, large (∼ 1µm) single crystals of
anatase are required to perform surface characterization using electron microscopy and
atomic force microscopy to elucidate the growth mechanism. Recently, Deng et al. [17]
reported a hydrothermal synthesis method that yielded large (> 1µm) single crystals of
anatase. Their methodology was applied here to synthesize large (1−2µm) single crystals
of anatase.
147
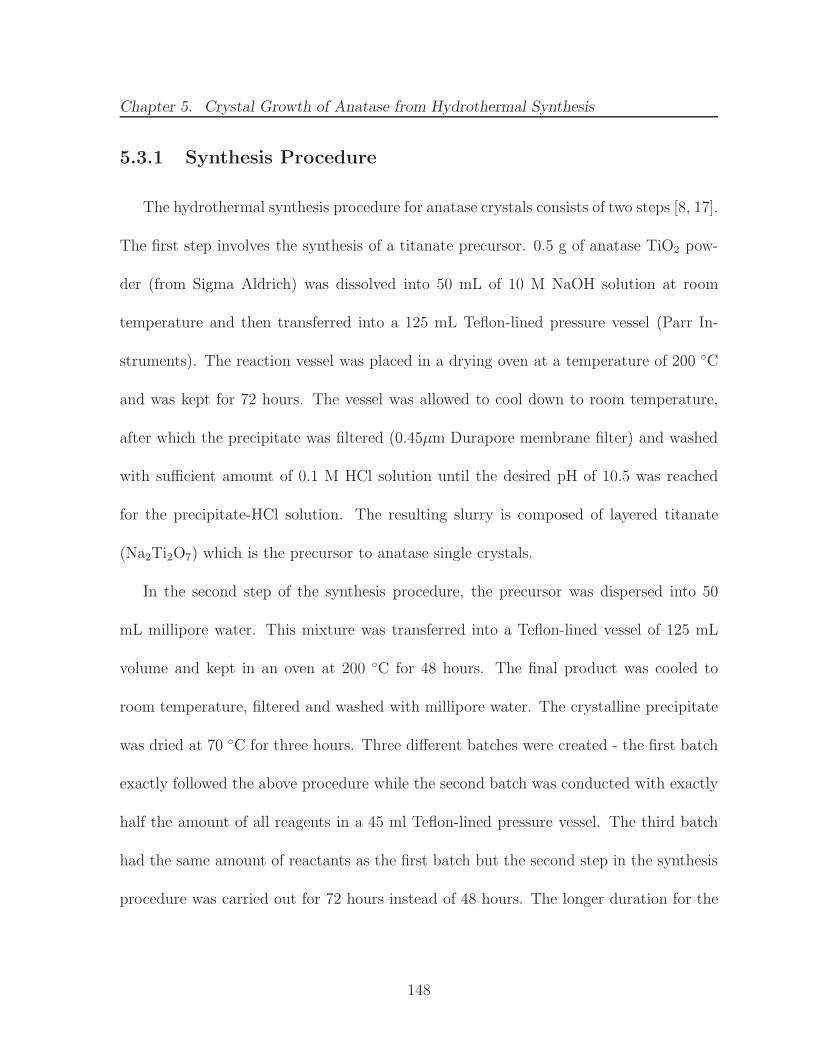
Chapter 5. Crystal Growth of Anatase from Hydrothermal Synthesis
5.3.1 Synthesis Procedure
The hydrothermal synthesis procedure for anatase crystals consists of two steps [8, 17].
The first step involves the synthesis of a titanate precursor. 0.5 g of anatase TiO2 pow-
der (from Sigma Aldrich) was dissolved into 50 mL of 10 M NaOH solution at room
temperature and then transferred into a 125 mL Teflon-lined pressure vessel (Parr In-
struments). The reaction vessel was placed in a drying oven at a temperature of 200 ◦C
and was kept for 72 hours. The vessel was allowed to cool down to room temperature,
after which the precipitate was filtered (0.45µm Durapore membrane filter) and washed
with sufficient amount of 0.1 M HCl solution until the desired pH of 10.5 was reached
for the precipitate-HCl solution. The resulting slurry is composed of layered titanate
(Na2Ti2O7) which is the precursor to anatase single crystals.
In the second step of the synthesis procedure, the precursor was dispersed into 50
mL millipore water. This mixture was transferred into a Teflon-lined vessel of 125 mL
volume and kept in an oven at 200 ◦C for 48 hours. The final product was cooled to
room temperature, filtered and washed with millipore water. The crystalline precipitate
was dried at 70 ◦C for three hours. Three different batches were created - the first batch
exactly followed the above procedure while the second batch was conducted with exactly
half the amount of all reagents in a 45 ml Teflon-lined pressure vessel. The third batch
had the same amount of reactants as the first batch but the second step in the synthesis
procedure was carried out for 72 hours instead of 48 hours. The longer duration for the
148
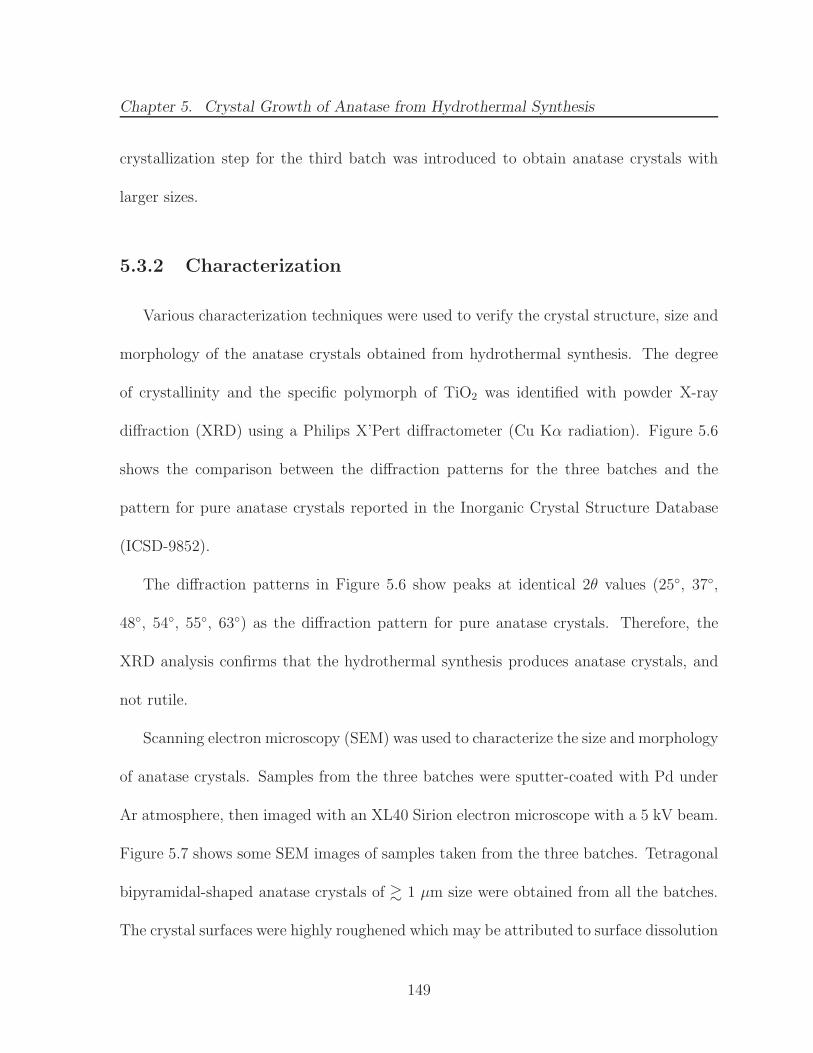
Chapter 5. Crystal Growth of Anatase from Hydrothermal Synthesis
crystallization step for the third batch was introduced to obtain anatase crystals with
larger sizes.
5.3.2 Characterization
Various characterization techniques were used to verify the crystal structure, size and
morphology of the anatase crystals obtained from hydrothermal synthesis. The degree
of crystallinity and the specific polymorph of TiO2 was identified with powder X-ray
diffraction (XRD) using a Philips X’Pert diffractometer (Cu Kα radiation). Figure 5.6
shows the comparison between the diffraction patterns for the three batches and the
pattern for pure anatase crystals reported in the Inorganic Crystal Structure Database
(ICSD-9852).
The diffraction patterns in Figure 5.6 show peaks at identical 2θ values (25◦, 37◦,
48◦, 54◦, 55◦, 63◦) as the diffraction pattern for pure anatase crystals. Therefore, the
XRD analysis confirms that the hydrothermal synthesis produces anatase crystals, and
not rutile.
Scanning electron microscopy (SEM) was used to characterize the size and morphology
of anatase crystals. Samples from the three batches were sputter-coated with Pd under
Ar atmosphere, then imaged with an XL40 Sirion electron microscope with a 5 kV beam.
Figure 5.7 shows some SEM images of samples taken from the three batches. Tetragonal
bipyramidal-shaped anatase crystals of & 1 µm size were obtained from all the batches.
The crystal surfaces were highly roughened which may be attributed to surface dissolution
149
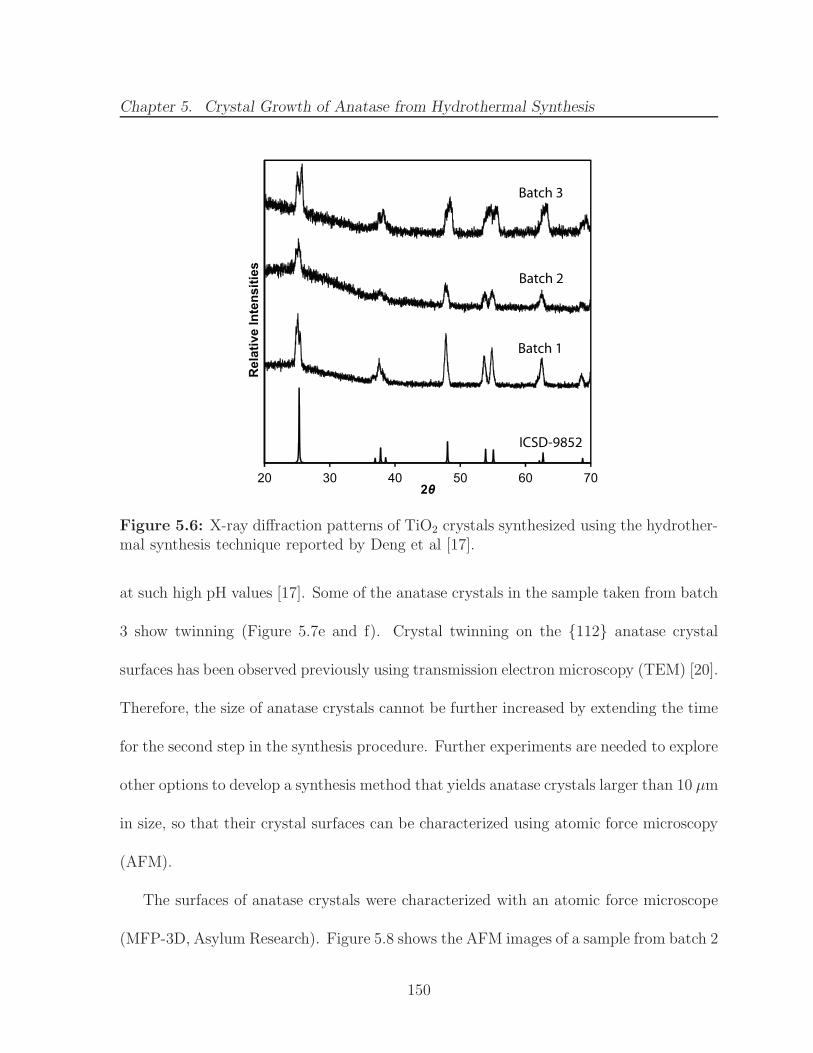
Chapter 5. Crystal Growth of Anatase from Hydrothermal Synthesis
20 30 40 50 60 70
Re
lati
ve
In
ten
sit
ies
2θ
ICSD-9852
Batch 1
Batch 2
Batch 3
Figure 5.6: X-ray diffraction patterns of TiO2 crystals synthesized using the hydrother-mal synthesis technique reported by Deng et al [17].
at such high pH values [17]. Some of the anatase crystals in the sample taken from batch
3 show twinning (Figure 5.7e and f). Crystal twinning on the {112} anatase crystal
surfaces has been observed previously using transmission electron microscopy (TEM) [20].
Therefore, the size of anatase crystals cannot be further increased by extending the time
for the second step in the synthesis procedure. Further experiments are needed to explore
other options to develop a synthesis method that yields anatase crystals larger than 10 µm
in size, so that their crystal surfaces can be characterized using atomic force microscopy
(AFM).
The surfaces of anatase crystals were characterized with an atomic force microscope
(MFP-3D, Asylum Research). Figure 5.8 shows the AFM images of a sample from batch 2
150
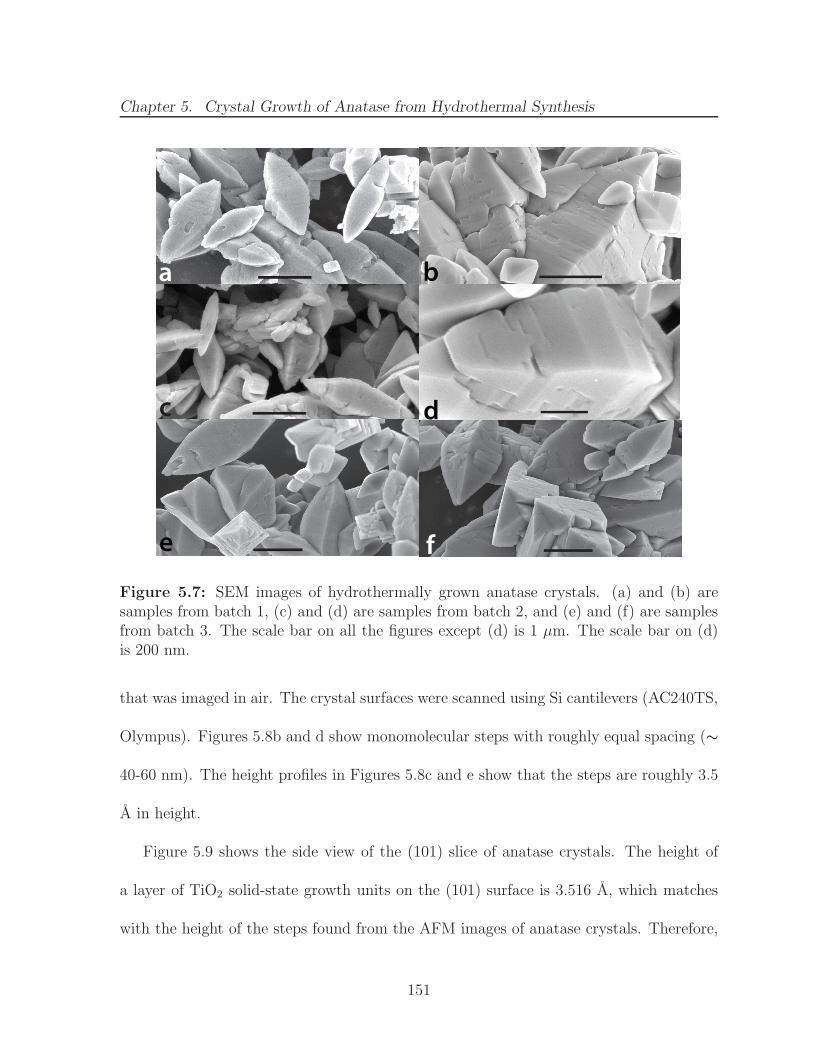
Chapter 5. Crystal Growth of Anatase from Hydrothermal Synthesis
a b
c d
e f
Figure 5.7: SEM images of hydrothermally grown anatase crystals. (a) and (b) aresamples from batch 1, (c) and (d) are samples from batch 2, and (e) and (f) are samplesfrom batch 3. The scale bar on all the figures except (d) is 1 µm. The scale bar on (d)is 200 nm.
that was imaged in air. The crystal surfaces were scanned using Si cantilevers (AC240TS,
Olympus). Figures 5.8b and d show monomolecular steps with roughly equal spacing (∼
40-60 nm). The height profiles in Figures 5.8c and e show that the steps are roughly 3.5
A in height.
Figure 5.9 shows the side view of the (101) slice of anatase crystals. The height of
a layer of TiO2 solid-state growth units on the (101) surface is 3.516 A, which matches
with the height of the steps found from the AFM images of anatase crystals. Therefore,
151
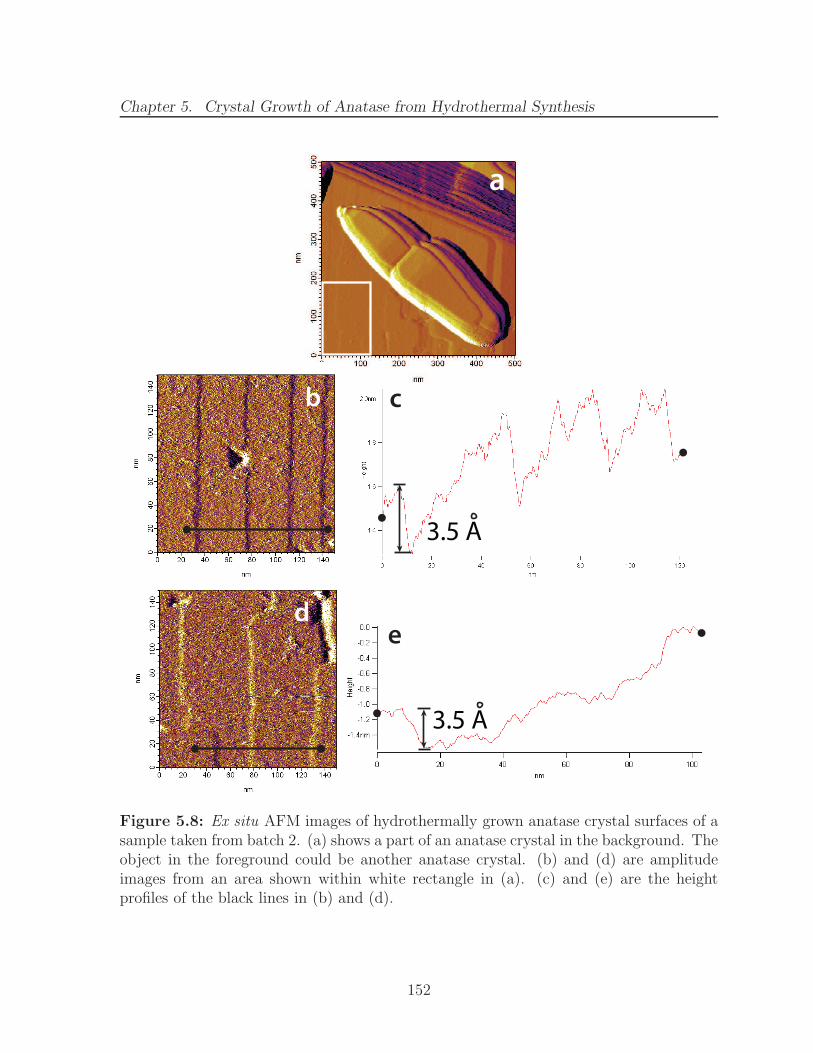
Chapter 5. Crystal Growth of Anatase from Hydrothermal Synthesis
a
b
d
c
e
3.5 A
3.5 A
Figure 5.8: Ex situ AFM images of hydrothermally grown anatase crystal surfaces of asample taken from batch 2. (a) shows a part of an anatase crystal in the background. Theobject in the foreground could be another anatase crystal. (b) and (d) are amplitudeimages from an area shown within white rectangle in (a). (c) and (e) are the heightprofiles of the black lines in (b) and (d).
152
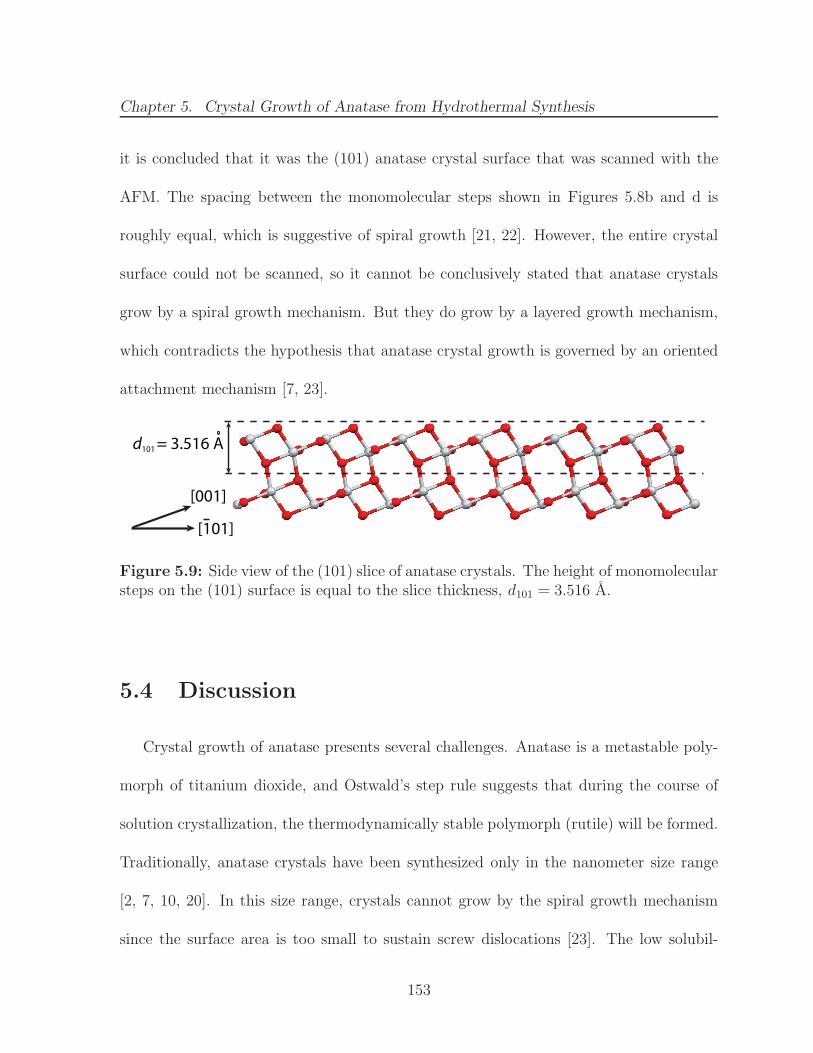
Chapter 5. Crystal Growth of Anatase from Hydrothermal Synthesis
it is concluded that it was the (101) anatase crystal surface that was scanned with the
AFM. The spacing between the monomolecular steps shown in Figures 5.8b and d is
roughly equal, which is suggestive of spiral growth [21, 22]. However, the entire crystal
surface could not be scanned, so it cannot be conclusively stated that anatase crystals
grow by a spiral growth mechanism. But they do grow by a layered growth mechanism,
which contradicts the hypothesis that anatase crystal growth is governed by an oriented
attachment mechanism [7, 23].
[101]
[001]
d101 = 3.516 A
Figure 5.9: Side view of the (101) slice of anatase crystals. The height of monomolecularsteps on the (101) surface is equal to the slice thickness, d101 = 3.516 A.
5.4 Discussion
Crystal growth of anatase presents several challenges. Anatase is a metastable poly-
morph of titanium dioxide, and Ostwald’s step rule suggests that during the course of
solution crystallization, the thermodynamically stable polymorph (rutile) will be formed.
Traditionally, anatase crystals have been synthesized only in the nanometer size range
[2, 7, 10, 20]. In this size range, crystals cannot grow by the spiral growth mechanism
since the surface area is too small to sustain screw dislocations [23]. The low solubil-
153
Chapter 5. Crystal Growth of Anatase from Hydrothermal Synthesis
ity of titanium dioxide in water necessitates the use of hydrothermal synthesis at high
temperatures and pressures. in situ AFM imaging of the crystal growth process pro-
vides valuable insight into the growth mechanism of certain inorganic crystals such as
calcite [21], barite [24], zeolites [25], etc. Due to the extreme conditions required for
anatase crystal growth, in situ imaging is currently a technological challenge.
The growth of faceted anatase nanocrystals has been proposed to proceed by a
non-classical growth mechanism, namely the oriented attachment mechanism, wherein
nanoparticles aggregate along specific crystallographic orientations [7]. The driving force
behind crystal growth by oriented attachment has been suggested to be interatomic
columbic interactions [26]. Penn and Banfield [7] showed using TEM that anatase
nanocrystals preferentially aggregated along the [001] direction than the [101] direction.
The periodic bond chain theory [12] can be applied to test this hypothesis. The PBC
interaction energy in inorganic crystals is dominated by the electrostatic interactions.
Table 5.1 shows that the periodic bond chains in the (004) surface of anatase crystals
have lower interaction energy than the ones in the (101) crystal surface. Specifically, the
[111] PBC lies within the (101) anatase face while it is nearly perpendicular to the (004)
face. Therefore, the electrostatic interaction energy perpendicular to the (004) surface,
or along the [001] direction, is higher than the interaction energy along the [101] direc-
tion. Therefore, the PBC theory is consistent with the hypothesis that the electrostatic
interactions are the driving force behind the oriented attachment growth mechanism [26].
154
Chapter 5. Crystal Growth of Anatase from Hydrothermal Synthesis
The presence of monomolecular steps on the {101} anatase crystal surface (Figure
5.8) is not consistent with the oriented attachment growth mechanism. The attachment
of anatase nanocrystals onto a larger crystal cannot result in monomolecular steps on the
crystal surface. A similar dilemma has been resolved recently in the field of zeolite crystal
growth. Lupulescu and Rimer performed in situ AFM imaging of real-time growth on a
zeolite crystal surface [25]. They observed the attachment of both monomer molecules
and nanocrystals on the zeolite surface, and concluded that the growth proceeds by
simultaneous deposition of both types of species. Such co-existence of the classical and
non-classical growth mechanisms could explain the presence of molecular steps on anatase
crystal surfaces and also be consistent with the oriented attachment growth mechanism.
However, conclusive evidence of the growth mechanism is contingent upon overcoming
the technology barrier associated with in situ AFM imaging of hydrothermal growth of
anatase crystals.
A mechanistic growth model could be applied to anatase crystal growth if layered
growth mechanisms (spiral growth or 2D nucleation) were assumed to be dominant on
anatase crystal surfaces. However, these calculations require accurate solvent structure
information from molecular simulations. Raju et al. [27] have recently developed a reac-
tive force field to study the dissociation of water on TiO2 surfaces. The number of water
molecules around growth units located in various surface sites and the distance between
the water molecules and the crystal surface would allow the calculation of the potential
energies of the surface growth units and the estimation of the growth kinetics on anatase
155
Chapter 5. Crystal Growth of Anatase from Hydrothermal Synthesis
crystal surfaces. An accurate growth model might also need to account for the kinetics
of the dehydration reaction that precedes the incorporation of the TiO6 solution phase
growth units into anatase crystal.
5.5 Conclusions
Hydrothermal synthesis of anatase crystals was performed to obtain large single crys-
tals of anatase. Surface characterization techniques such as SEM and AFM provided
some insight into the synthesis process and the growth mechanism. There may be a
thermodynamic limit to the size of anatase crystals that can be obtained by hydrother-
mal synthesis, beyond which either polymorph transformation or crystal twinning takes
place. Ex situ AFM images showed the presence of monomolecular steps on the (101)
surface of anatase, which suggests a classical layered growth mechanism.
The periodic bond chain theory predicts that the electrostatic interaction energy
along the [001] direction is higher than along the [101] direction. This is consistent with
the hypothesis that the electrostatic interactions are the driving force for the oriented
attachment mechanism, which is a non-classical growth mechanism.
The exact growth mechanism that governs anatase crystal growth may be a combina-
tion of classical and non-classical mechanisms, and could also be a function of the crystal
size [10]. The design of micrometer sized anatase crystals with higher proportion of the
catalytically active {001} faces [5] requires a better understanding of the growth process.
156
Chapter 5. Crystal Growth of Anatase from Hydrothermal Synthesis
Future efforts in both theoretical modeling and in situ AFM imaging should be geared
towards solving this mystery.
157
Bibliography
[1] A. Linsebigler, G. Lu, and J. T. Yates Jr. Photocatalysis on TiO2 surfaces: Princi-ples, mechanisms, and selected results. Chem. Rev., 95:735–758, 1995.
[2] A. Hagfeldt and M. Gratzel. Light-induced redox reactions in nanocrystalline sys-tems. Chem. Rev., 95:49–68, 1995.
[3] M. Gratzel. Photoelectrochemical cells. Nature, 414:338–344, 2001.
[4] X.-Q. Gong and A. Selloni. Reactivity of anatase TiO2 nanoparticles: The role ofthe minority (001) surface. J. Phys. Chem. B, 109:19560–19562, 2005.
[5] H. G. Yang, C. H. Sun, S. Z. Qiao, J. Zou, G. Liu, S. C. Smith, H. M. Cheng, andG. Q. Lu. Anatase TiO2 single crystals with a large percentage of reactive facets.Nature, 453:638–641, 2008.
[6] D. Bahnemann, A. Henglein, and L. Spanhel. Detection of the Intermediates ofColloidal TiO2-catalysed Photoreactions. Faraday Discuss. Chem. Soc., 78:151–163,1984.
[7] R. Penn and J. F. Banfield. Morphology development and crystal growth innanocrystalline aggregates under hydrothermal conditions: insights from titania.Geochim. Cosmochim. Acta, 63:1549–1557, 1999.
[8] J.-N. Nian and H. Teng. Hydrothermal synthesis of single-crystalline anatase TiO2
nanorods with nanotubes as the precursor. J. Phys. Chem. B, 110:4193–4198, 2006.
[9] N. M. Kinsinger, A. Wong, D. Li, F. Villalobos, and D. Kisailus. Nucleation andcrystal growth of nanocrystalline anatase and rutile phase TiO2 from a water-solubleprecursor. Cryst. Growth Des., 10:5254–5261, 2010.
[10] S. G. Kumar and K. S. R. K. Rao. Polymorphic phase transition among the titaniacrystal structures using a solution-based approach: from precursor chemistry tonucleation process. Nanoscale, (in press), 2014.
[11] M. Horn and C. Schwerdtfeger. Refinement of the structure of anatase at severaltemperatures. Z. Krist., 136:273–281, 1972.
158
Bibliography
[12] P. Hartman and W. G. Perdok. On the relations between structure and morphologyof crystals. I. Acta Crystallogr., 8:49–52, 1955.
[13] P. W. Tasker. The stability of ionic crystal surfaces. J. Phys. C Solid State, 12:4977,1979.
[14] P. M. Oliver, G. W. Watson, E. Toby Kelsey, and S. C. Parker. Atomistic simulationof the surface structure of the TiO2 polymorphs rutile and anatase. J. Mater. Chem.,7:563–568, 1997.
[15] L. Glasser. Lattice energies of crystals with multiple ions: A generalized Kapustinskiiequation. Inorg. Chem., 34:4935, 1995.
[16] H. Jenkins. Handbook of Chemistry and Physics, chapter Lattice Energies, page 27.CRC Press, 1992.
[17] Q. Deng, M. Wei, X. Ding, L. Jiang, K. Wei, and H. Zhou. Large single-crystalanatase TiO2 bipyramids. J. Cryst. Growth, 312:213–219, 2010.
[18] A. A. Gribb and J. F. Banfield. Particle size effects on transformation kinetics andphase stability in nanocrystalline TiO2. Am. Mineral., 82:717–728, 1997.
[19] H. Zhang and J. F. Banfield. Thermodynamic analysis of phase stability of nanocrys-talline titania. J. Mater. Chem., 8:2073–2076, 1998.
[20] R. L. Penn and J. F. Banfield. Oriented attachment and growth, twinning, polytyp-ism, and formation of metastable phases: Insights from nanocrystalline TiO2. Am.Mineral., 83:1077–1082, 1998.
[21] H. H. Teng, P. M. Dove, C. A. Orme, and J. J. De Yoreo. Thermodynamics ofcalcite growth: Baseline for understanding biomineral formation. Science, 282:724–727, 1998.
[22] P. Cubillas, M. A. Holden, and M. W. Anderson. Crystal growth studies on microp-orous zincophosphate-faujasite using atomic force microscopy. Cryst. Growth Des.,11:3163–3171, 2011.
[23] R. L. Penn and J. F. Banfield. Imperfect oriented attachment: Dislocation genera-tion in defect-free nanocrystals. Science, 281:969–971, 1998.
[24] C. M. Pina, U. Becker, P. Risthaus, D. Bosbach, and A. Putnis. Molecular-scalemechanisms of crystal growth in barite. Nature, 395:483–486, 1998.
[25] A. I. Lupulescu and J. D. Rimer. In situ imaging of silicalite-1 surface growth revealsthe mechanism of crystallization. Science, 344:729–732, 2014.
159
Bibliography
[26] H. Zhang and J. F. Banfield. Interatomic coulombic interactions as the driving forcefor oriented attachment. CrystEngComm, 16:1568–1578, 2014.
[27] M. Raju, S.-Y. Kim, A. C. T. van Duin, and K. A. Fichthorn. ReaxFF ReactiveForce Field Study of the Dissociation of Water on Titania Surfaces. J. Phys. Chem.C, 117:10558–10572, 2013.
160
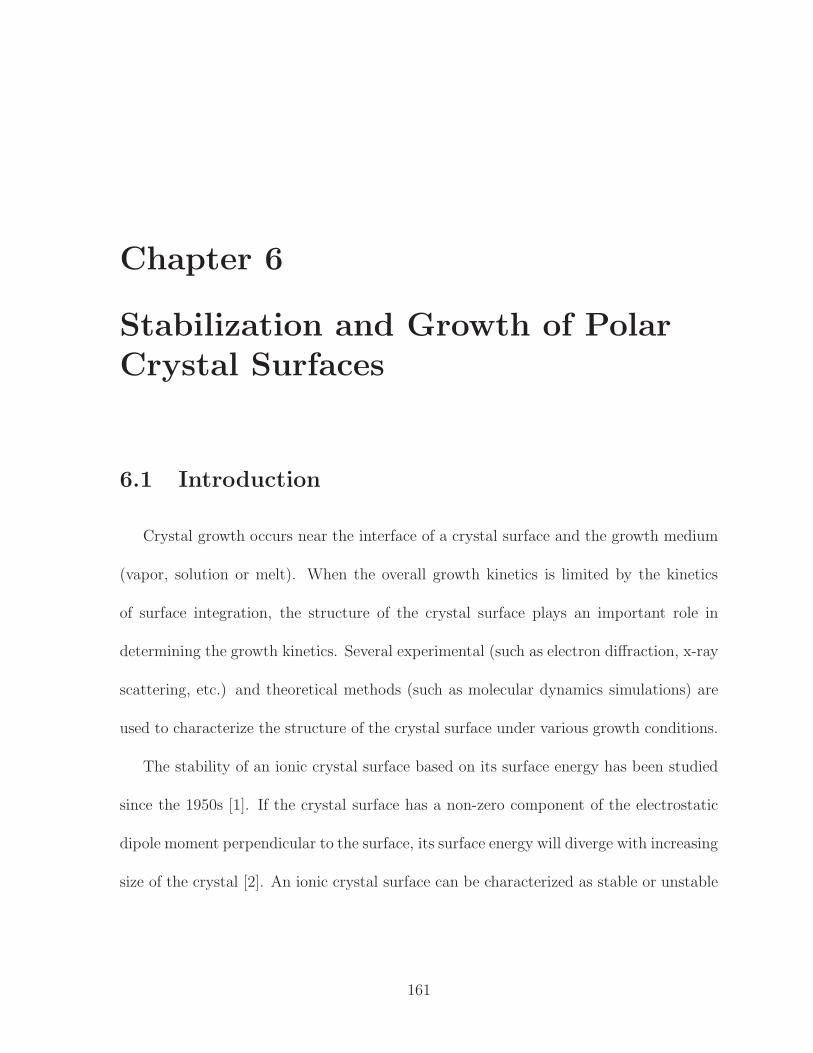
Chapter 6
Stabilization and Growth of PolarCrystal Surfaces
6.1 Introduction
Crystal growth occurs near the interface of a crystal surface and the growth medium
(vapor, solution or melt). When the overall growth kinetics is limited by the kinetics
of surface integration, the structure of the crystal surface plays an important role in
determining the growth kinetics. Several experimental (such as electron diffraction, x-ray
scattering, etc.) and theoretical methods (such as molecular dynamics simulations) are
used to characterize the structure of the crystal surface under various growth conditions.
The stability of an ionic crystal surface based on its surface energy has been studied
since the 1950s [1]. If the crystal surface has a non-zero component of the electrostatic
dipole moment perpendicular to the surface, its surface energy will diverge with increasing
size of the crystal [2]. An ionic crystal surface can be characterized as stable or unstable
161
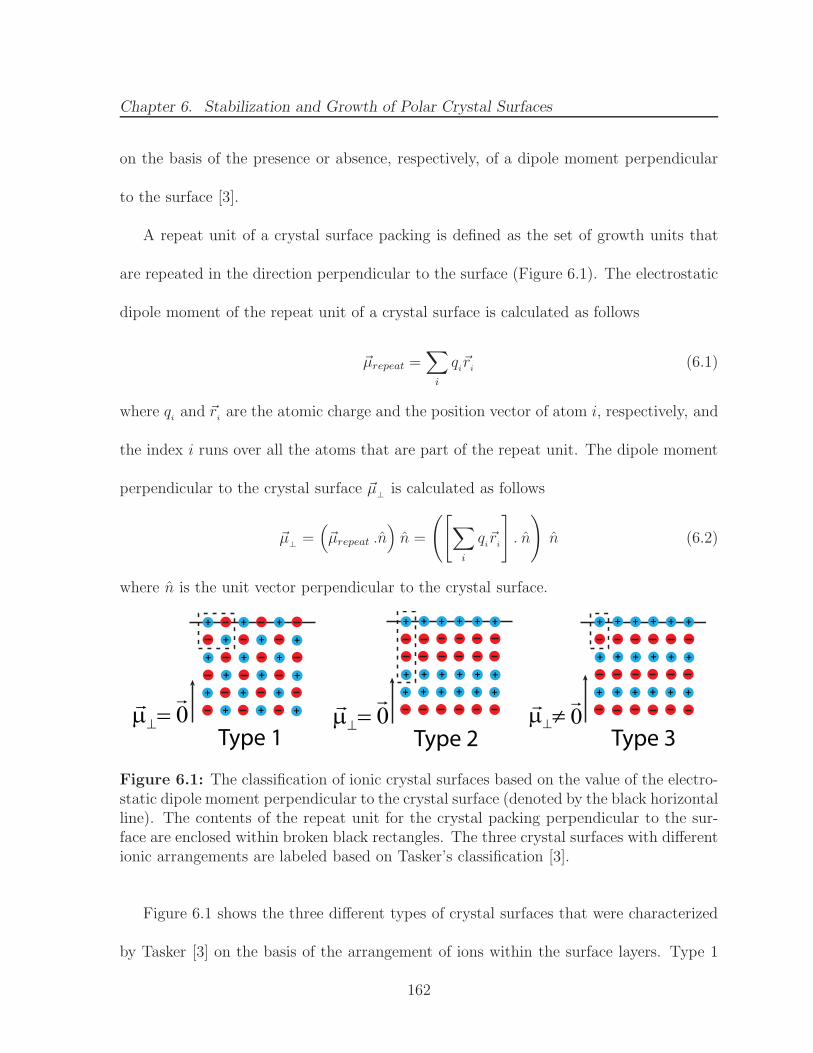
Chapter 6. Stabilization and Growth of Polar Crystal Surfaces
on the basis of the presence or absence, respectively, of a dipole moment perpendicular
to the surface [3].
A repeat unit of a crystal surface packing is defined as the set of growth units that
are repeated in the direction perpendicular to the surface (Figure 6.1). The electrostatic
dipole moment of the repeat unit of a crystal surface is calculated as follows
~µrepeat =∑
i
qi~ri
(6.1)
where qiand ~r
iare the atomic charge and the position vector of atom i, respectively, and
the index i runs over all the atoms that are part of the repeat unit. The dipole moment
perpendicular to the crystal surface ~µ⊥is calculated as follows
~µ⊥=(
~µrepeat .n)
n =
([
∑
i
qi~ri
]
. n
)
n (6.2)
where n is the unit vector perpendicular to the crystal surface.
+ + +
++ +
+ + +
++ +
+ + +
++ +
+ + + ++ +
+ + + ++ +
+ + + ++ +
+ + + ++ +
+ + + ++ +
+ + + ++ +
Type 1 Type 2 Type 30µ⊥≠r
r
0µ⊥=r
r
0µ⊥=r
r
Figure 6.1: The classification of ionic crystal surfaces based on the value of the electro-static dipole moment perpendicular to the crystal surface (denoted by the black horizontalline). The contents of the repeat unit for the crystal packing perpendicular to the sur-face are enclosed within broken black rectangles. The three crystal surfaces with differentionic arrangements are labeled based on Tasker’s classification [3].
Figure 6.1 shows the three different types of crystal surfaces that were characterized
by Tasker [3] on the basis of the arrangement of ions within the surface layers. Type 1
162
Chapter 6. Stabilization and Growth of Polar Crystal Surfaces
surfaces have both positive and negative ions within each layer, which is charge neutral.
The perpendicular component of the dipole moment, ~µ⊥, is zero for such crystal surfaces.
Examples of Tasker type 1 surfaces include (100) NaCl surface, (1014) calcite surface,
etc. Type 2 surfaces have either positive or negative ions within each layer. However, the
repeat unit of the stacking of these layers has a zero dipole moment perpendicular to the
surface (Figure 6.1). Examples of Tasker type 2 surfaces include (111) surface of fluorite
(CaF2), (002) aragonite surface, etc. Type 3 surfaces have alternate layers of positively
and negatively charged ions, resulting in a non-zero perpendicular dipole moment. Tasker
type 3 surfaces are polar crystal surfaces and are unstable in their native structure. These
surfaces undergo reconstruction to reduce the perpendicular dipole moment and stabilize
themselves. Quantum mechanical calculations have shown that various reconstructions
of the (111) NaCl surface yield structures with finite surface energy values [4, 5].
Polar crystal surfaces of inorganic oxides find relevance in areas such as catalysis
[6], semiconductors [7] and gas sensing systems [8]. The symmetrically related polar
crystal surfaces (hkl) and (hkl) grow at different rates, leading to asymmetric crystal
morphologies (Figure 6.2). The asymmetric growth of polar crystal surfaces of organic
molecular crystals such as urea [9, 10] and α-resorcinol [11–13] has also been studied
in some detail. However, the larger question about the stabilization and the growth
mechanisms of polar crystal surfaces remains unanswered. This chapter focuses on finding
an answer to the same question for the polar surfaces of wurtzite zinc oxide (ZnO)
crystals.
163
Chapter 6. Stabilization and Growth of Polar Crystal Surfaces
(a) (b)
Figure 6.2: (a) Asymmetric shape of an α- resorcinol crystal grown from aqueoussolution. Scale bar is 10 µm. Adapted with permission from Srinivasan et al [11].Copyright ©2005, American Chemical Society. (b) Asymmetric shapes of urea crystalsgrown from methanol. Adapted with permission from Piana et al [14]. Copyright©2005,Nature Publishing Group.
6.2 Crystal Structure of Wurtzite Zinc Oxide
Zinc oxide crystallizes in two different polymorphs that are commonly known by
their respective crystal structures - wurtzite and zinc blende. The wurtzite structure
of zinc oxide is more stable at ambient temperatures and pressures. It belongs to the
hexagonal lattice system and the P63mc space group (a = b = 3.2494 A, c = 5.2038 A,
α = β = 90◦, γ = 120◦) [15]. Figure 6.3 shows the unit cell of zinc oxide in the wurtzite
crystal structure. The unit cell contains two molecules of ZnO (Z = 2). Each Zn atom
is surrounded by four O atoms in a distorted tetrahedron (vice versa for the coordina-
tion around O atom). The nearest neighbor Zn-O interatomic distances 1.974 A and
164
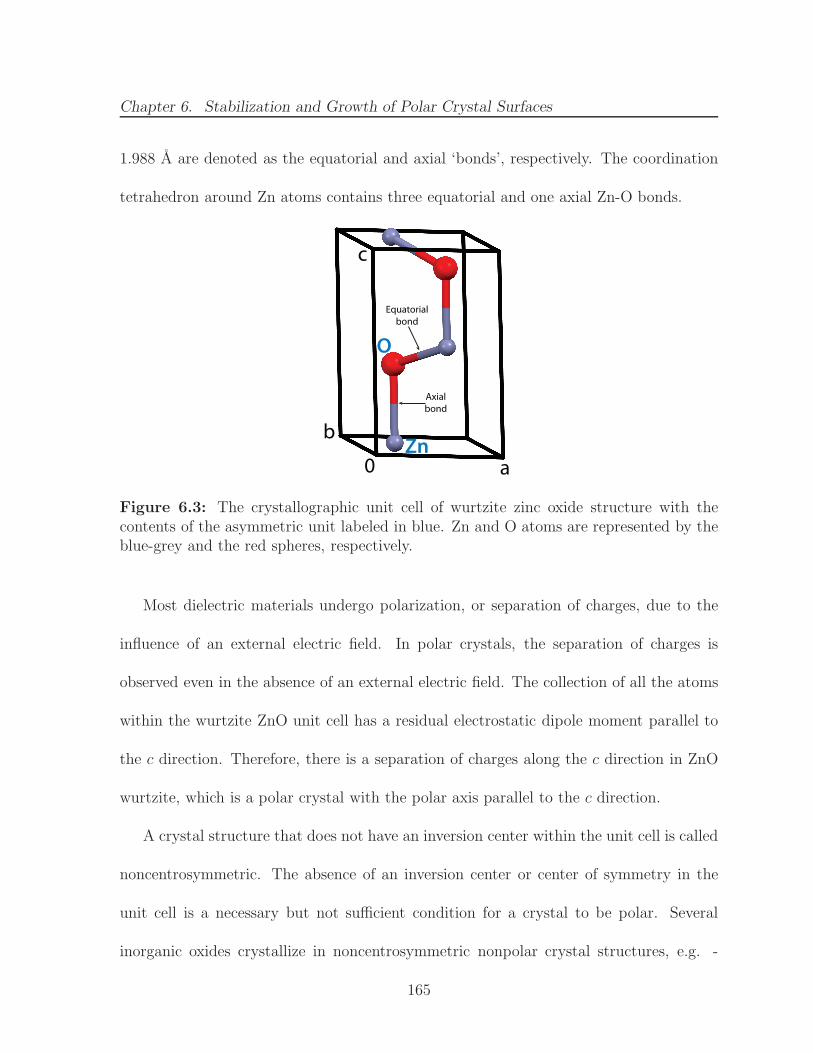
Chapter 6. Stabilization and Growth of Polar Crystal Surfaces
1.988 A are denoted as the equatorial and axial ‘bonds’, respectively. The coordination
tetrahedron around Zn atoms contains three equatorial and one axial Zn-O bonds.
0 a
b
c
Zn
O
Axial bond
Equatorial bond
Figure 6.3: The crystallographic unit cell of wurtzite zinc oxide structure with thecontents of the asymmetric unit labeled in blue. Zn and O atoms are represented by theblue-grey and the red spheres, respectively.
Most dielectric materials undergo polarization, or separation of charges, due to the
influence of an external electric field. In polar crystals, the separation of charges is
observed even in the absence of an external electric field. The collection of all the atoms
within the wurtzite ZnO unit cell has a residual electrostatic dipole moment parallel to
the c direction. Therefore, there is a separation of charges along the c direction in ZnO
wurtzite, which is a polar crystal with the polar axis parallel to the c direction.
A crystal structure that does not have an inversion center within the unit cell is called
noncentrosymmetric. The absence of an inversion center or center of symmetry in the
unit cell is a necessary but not sufficient condition for a crystal to be polar. Several
inorganic oxides crystallize in noncentrosymmetric nonpolar crystal structures, e.g. -
165
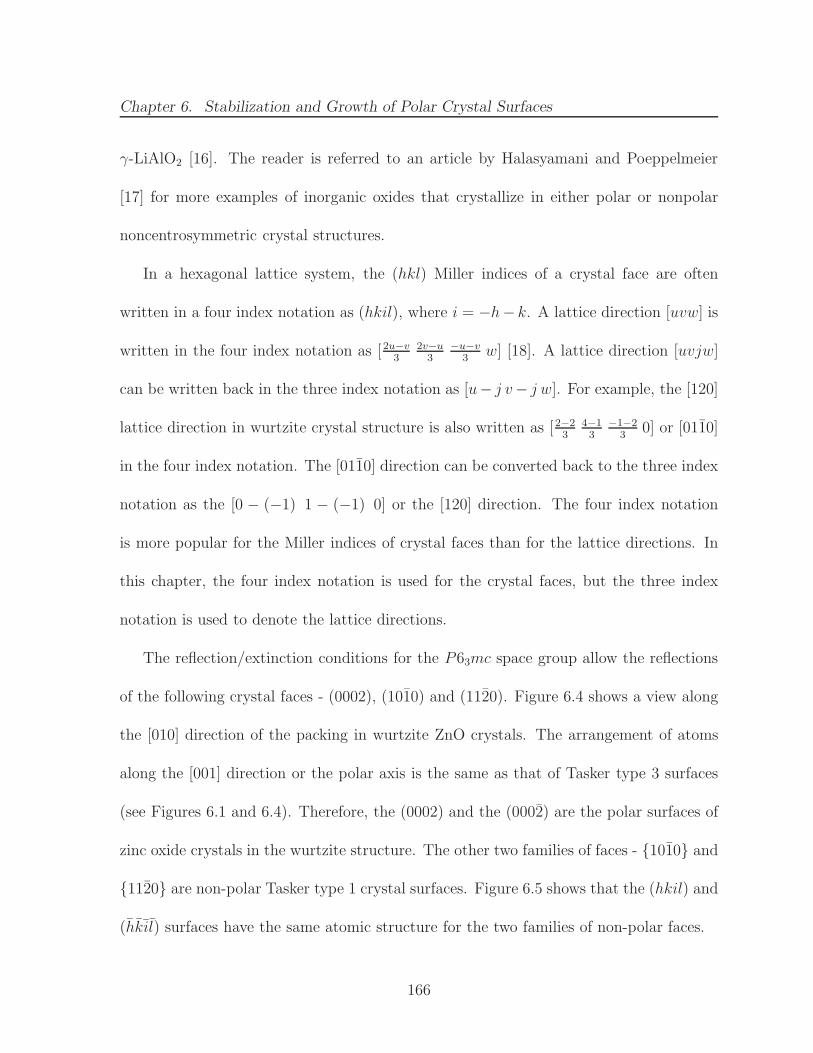
Chapter 6. Stabilization and Growth of Polar Crystal Surfaces
γ-LiAlO2 [16]. The reader is referred to an article by Halasyamani and Poeppelmeier
[17] for more examples of inorganic oxides that crystallize in either polar or nonpolar
noncentrosymmetric crystal structures.
In a hexagonal lattice system, the (hkl) Miller indices of a crystal face are often
written in a four index notation as (hkil), where i = −h− k. A lattice direction [uvw] is
written in the four index notation as [2u−v3
2v−u3
−u−v3
w] [18]. A lattice direction [uvjw]
can be written back in the three index notation as [u− j v− j w]. For example, the [120]
lattice direction in wurtzite crystal structure is also written as [2−23
4−13
−1−23
0] or [0110]
in the four index notation. The [0110] direction can be converted back to the three index
notation as the [0 − (−1) 1 − (−1) 0] or the [120] direction. The four index notation
is more popular for the Miller indices of crystal faces than for the lattice directions. In
this chapter, the four index notation is used for the crystal faces, but the three index
notation is used to denote the lattice directions.
The reflection/extinction conditions for the P63mc space group allow the reflections
of the following crystal faces - (0002), (1010) and (1120). Figure 6.4 shows a view along
the [010] direction of the packing in wurtzite ZnO crystals. The arrangement of atoms
along the [001] direction or the polar axis is the same as that of Tasker type 3 surfaces
(see Figures 6.1 and 6.4). Therefore, the (0002) and the (0002) are the polar surfaces of
zinc oxide crystals in the wurtzite structure. The other two families of faces - {1010} and
{1120} are non-polar Tasker type 1 crystal surfaces. Figure 6.5 shows that the (hkil) and
(hkil) surfaces have the same atomic structure for the two families of non-polar faces.
166
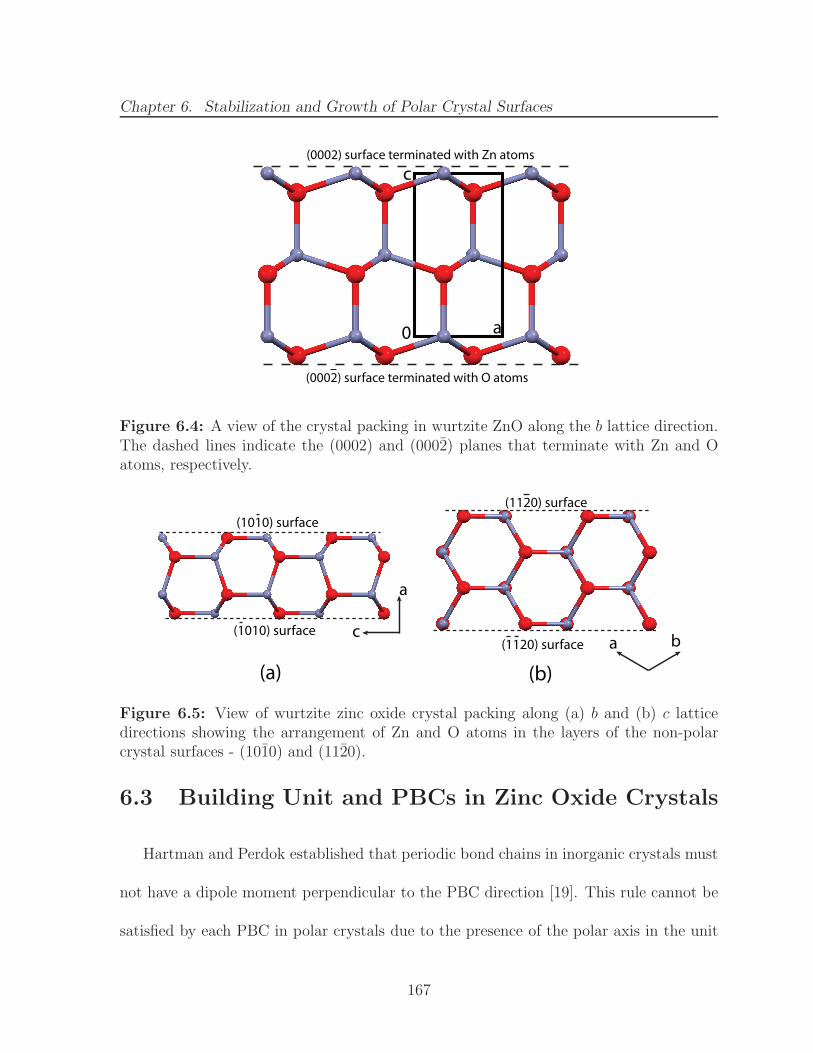
Chapter 6. Stabilization and Growth of Polar Crystal Surfaces
c(0002) surface terminated with Zn atoms
(0002) surface terminated with O atoms
a0
Figure 6.4: A view of the crystal packing in wurtzite ZnO along the b lattice direction.The dashed lines indicate the (0002) and (0002) planes that terminate with Zn and Oatoms, respectively.
a
c
(a)
a b
(b)
(1010) surface
(1010) surface
(1120) surface
(1120) surface
Figure 6.5: View of wurtzite zinc oxide crystal packing along (a) b and (b) c latticedirections showing the arrangement of Zn and O atoms in the layers of the non-polarcrystal surfaces - (1010) and (1120).
6.3 Building Unit and PBCs in Zinc Oxide Crystals
Hartman and Perdok established that periodic bond chains in inorganic crystals must
not have a dipole moment perpendicular to the PBC direction [19]. This rule cannot be
satisfied by each PBC in polar crystals due to the presence of the polar axis in the unit
167
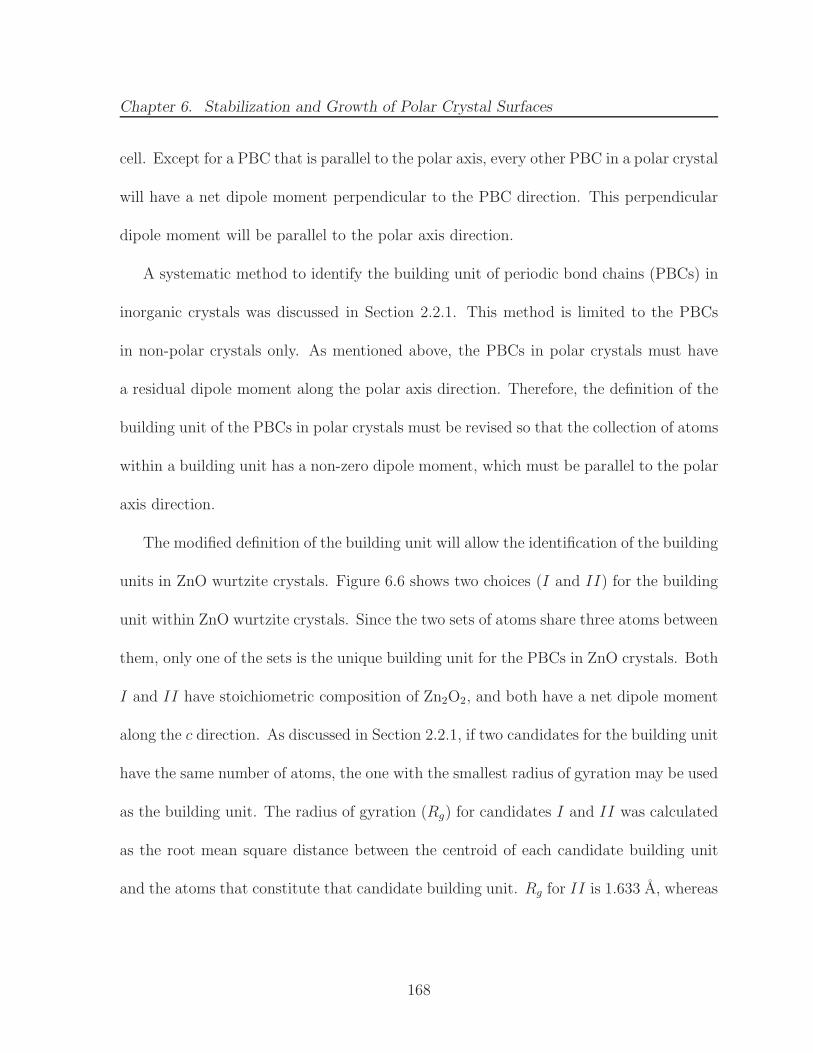
Chapter 6. Stabilization and Growth of Polar Crystal Surfaces
cell. Except for a PBC that is parallel to the polar axis, every other PBC in a polar crystal
will have a net dipole moment perpendicular to the PBC direction. This perpendicular
dipole moment will be parallel to the polar axis direction.
A systematic method to identify the building unit of periodic bond chains (PBCs) in
inorganic crystals was discussed in Section 2.2.1. This method is limited to the PBCs
in non-polar crystals only. As mentioned above, the PBCs in polar crystals must have
a residual dipole moment along the polar axis direction. Therefore, the definition of the
building unit of the PBCs in polar crystals must be revised so that the collection of atoms
within a building unit has a non-zero dipole moment, which must be parallel to the polar
axis direction.
The modified definition of the building unit will allow the identification of the building
units in ZnO wurtzite crystals. Figure 6.6 shows two choices (I and II) for the building
unit within ZnO wurtzite crystals. Since the two sets of atoms share three atoms between
them, only one of the sets is the unique building unit for the PBCs in ZnO crystals. Both
I and II have stoichiometric composition of Zn2O2, and both have a net dipole moment
along the c direction. As discussed in Section 2.2.1, if two candidates for the building unit
have the same number of atoms, the one with the smallest radius of gyration may be used
as the building unit. The radius of gyration (Rg) for candidates I and II was calculated
as the root mean square distance between the centroid of each candidate building unit
and the atoms that constitute that candidate building unit. Rg for II is 1.633 A, whereas
168
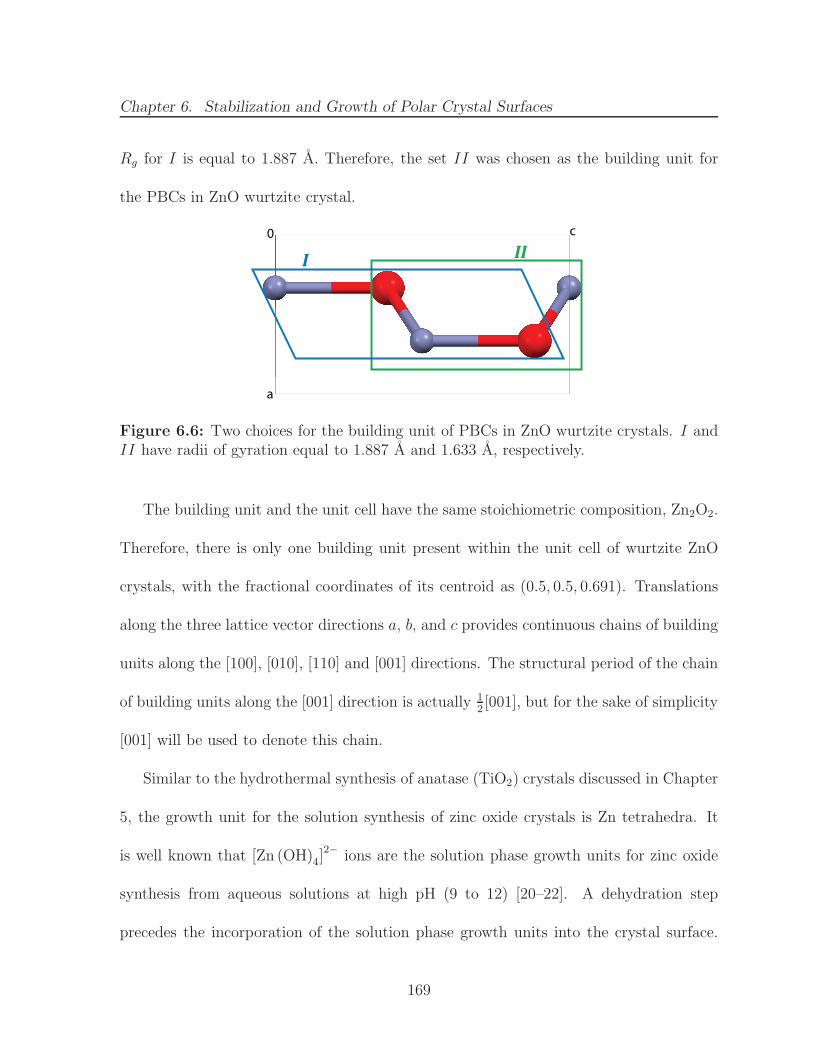
Chapter 6. Stabilization and Growth of Polar Crystal Surfaces
Rg for I is equal to 1.887 A. Therefore, the set II was chosen as the building unit for
the PBCs in ZnO wurtzite crystal.
0
a
c
III
Figure 6.6: Two choices for the building unit of PBCs in ZnO wurtzite crystals. I andII have radii of gyration equal to 1.887 A and 1.633 A, respectively.
The building unit and the unit cell have the same stoichiometric composition, Zn2O2.
Therefore, there is only one building unit present within the unit cell of wurtzite ZnO
crystals, with the fractional coordinates of its centroid as (0.5, 0.5, 0.691). Translations
along the three lattice vector directions a, b, and c provides continuous chains of building
units along the [100], [010], [110] and [001] directions. The structural period of the chain
of building units along the [001] direction is actually 12[001], but for the sake of simplicity
[001] will be used to denote this chain.
Similar to the hydrothermal synthesis of anatase (TiO2) crystals discussed in Chapter
5, the growth unit for the solution synthesis of zinc oxide crystals is Zn tetrahedra. It
is well known that [Zn (OH)4]2− ions are the solution phase growth units for zinc oxide
synthesis from aqueous solutions at high pH (9 to 12) [20–22]. A dehydration step
precedes the incorporation of the solution phase growth units into the crystal surface.
169
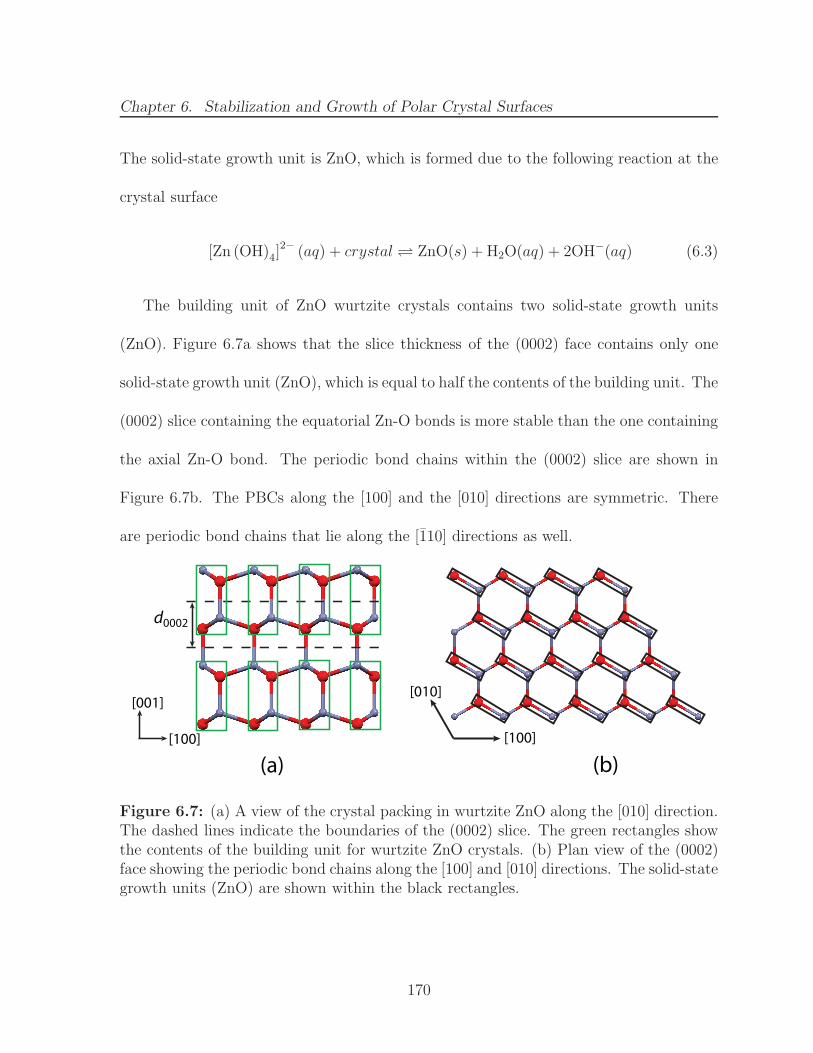
Chapter 6. Stabilization and Growth of Polar Crystal Surfaces
The solid-state growth unit is ZnO, which is formed due to the following reaction at the
crystal surface
[Zn (OH)4]2− (aq) + crystal ⇋ ZnO(s) + H2O(aq) + 2OH−(aq) (6.3)
The building unit of ZnO wurtzite crystals contains two solid-state growth units
(ZnO). Figure 6.7a shows that the slice thickness of the (0002) face contains only one
solid-state growth unit (ZnO), which is equal to half the contents of the building unit. The
(0002) slice containing the equatorial Zn-O bonds is more stable than the one containing
the axial Zn-O bond. The periodic bond chains within the (0002) slice are shown in
Figure 6.7b. The PBCs along the [100] and the [010] directions are symmetric. There
are periodic bond chains that lie along the [110] directions as well.
d0002
[100]
[001][010]
[100]
(a) (b)
Figure 6.7: (a) A view of the crystal packing in wurtzite ZnO along the [010] direction.The dashed lines indicate the boundaries of the (0002) slice. The green rectangles showthe contents of the building unit for wurtzite ZnO crystals. (b) Plan view of the (0002)face showing the periodic bond chains along the [100] and [010] directions. The solid-stategrowth units (ZnO) are shown within the black rectangles.
170
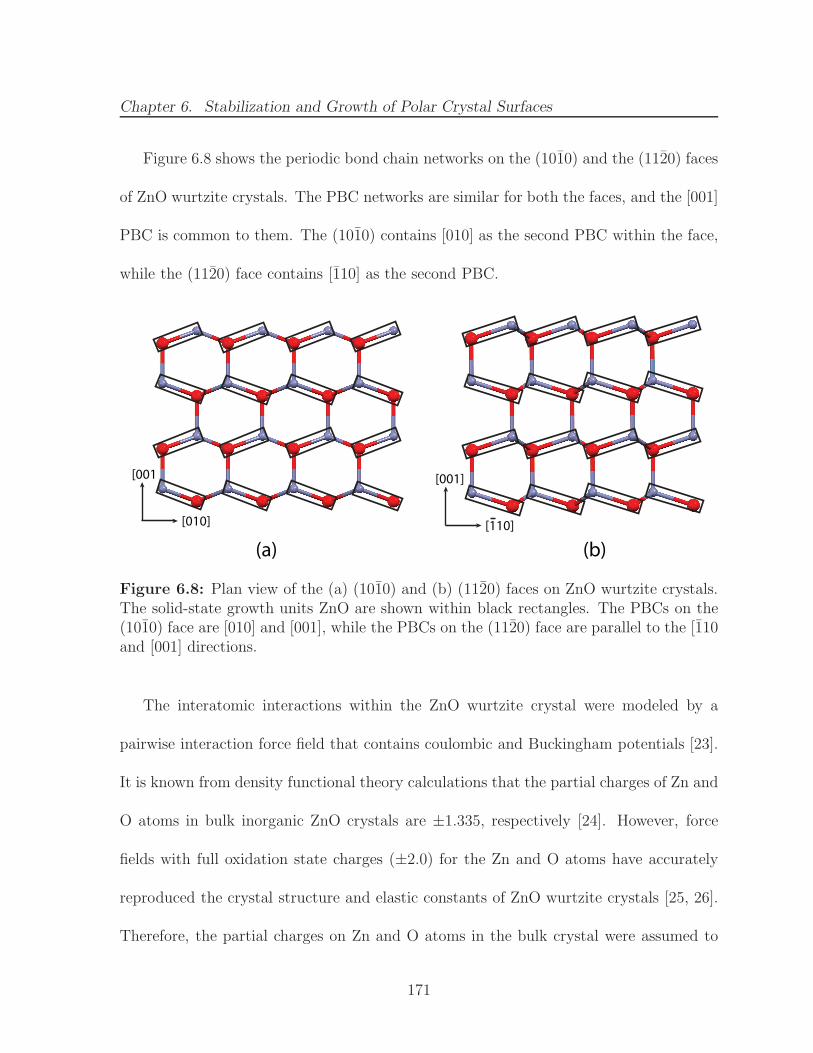
Chapter 6. Stabilization and Growth of Polar Crystal Surfaces
Figure 6.8 shows the periodic bond chain networks on the (1010) and the (1120) faces
of ZnO wurtzite crystals. The PBC networks are similar for both the faces, and the [001]
PBC is common to them. The (1010) contains [010] as the second PBC within the face,
while the (1120) face contains [110] as the second PBC.
[010]
[001]
(a) (b)[110]
[001]
Figure 6.8: Plan view of the (a) (1010) and (b) (1120) faces on ZnO wurtzite crystals.The solid-state growth units ZnO are shown within black rectangles. The PBCs on the(1010) face are [010] and [001], while the PBCs on the (1120) face are parallel to the [110and [001] directions.
The interatomic interactions within the ZnO wurtzite crystal were modeled by a
pairwise interaction force field that contains coulombic and Buckingham potentials [23].
It is known from density functional theory calculations that the partial charges of Zn and
O atoms in bulk inorganic ZnO crystals are ±1.335, respectively [24]. However, force
fields with full oxidation state charges (±2.0) for the Zn and O atoms have accurately
reproduced the crystal structure and elastic constants of ZnO wurtzite crystals [25, 26].
Therefore, the partial charges on Zn and O atoms in the bulk crystal were assumed to
171
Chapter 6. Stabilization and Growth of Polar Crystal Surfaces
be ±2.0 for the calculation of the interatomic interaction energies in this chapter. The
lattice energy was calculated using the Madelung summation method for a supercell of
size 40× 40× 100. The calculated value of -895.0 kcal/mol was within 5% of the lattice
energy value of -933.4 kcal/mol calculated from the Born-Haber-Fajans cycle [27].
The interaction energies of the solid-state ZnO growth units along the PBC directions
in wurtzite crystals were calculated while accounting for the long-range electrostatic
interactions (Table 6.1). The [001] PBC has the largest magnitude of intermolecular
interaction energy, which is also reflected in the high attachment energy value of the
(0002) face. The attachment energies reported in Table 6.1 are averaged between the
Eatthkl,+ and Eatt
hkl,− values. For a polar crystal surface such as the (0002) ZnO face, the
Eatthkl,+ and Eatt
hkl,− may not be equal to each other, and each of these two values diverge as
a function of the slice thickness. However, the average attachment energy of the (0002)
face converges to a value of -109.4 kcal/mol.
Figure 6.9a shows the predicted crystal morphology of ZnO wurtzite crystals using
the attachment energy model. The morphology prediction is for growth under vacuum
conditions without any solvent. The attachment energy model predicts rod-like crystals
oriented along the [001] direction with aspect ratio ∼ 5. The side faces are predicted to
belong to the {1120} family of faces. ZnO crystals have been grown, from both solution
and vapor, in the shape of long rods or nanowires [22, 28–31]. The attachment energy
model accurately predicts the crystal habit, but the predicted morphology is symmetric
along the [001] direction. Asymmetric crystal shapes with dissimilar growth rates along
172
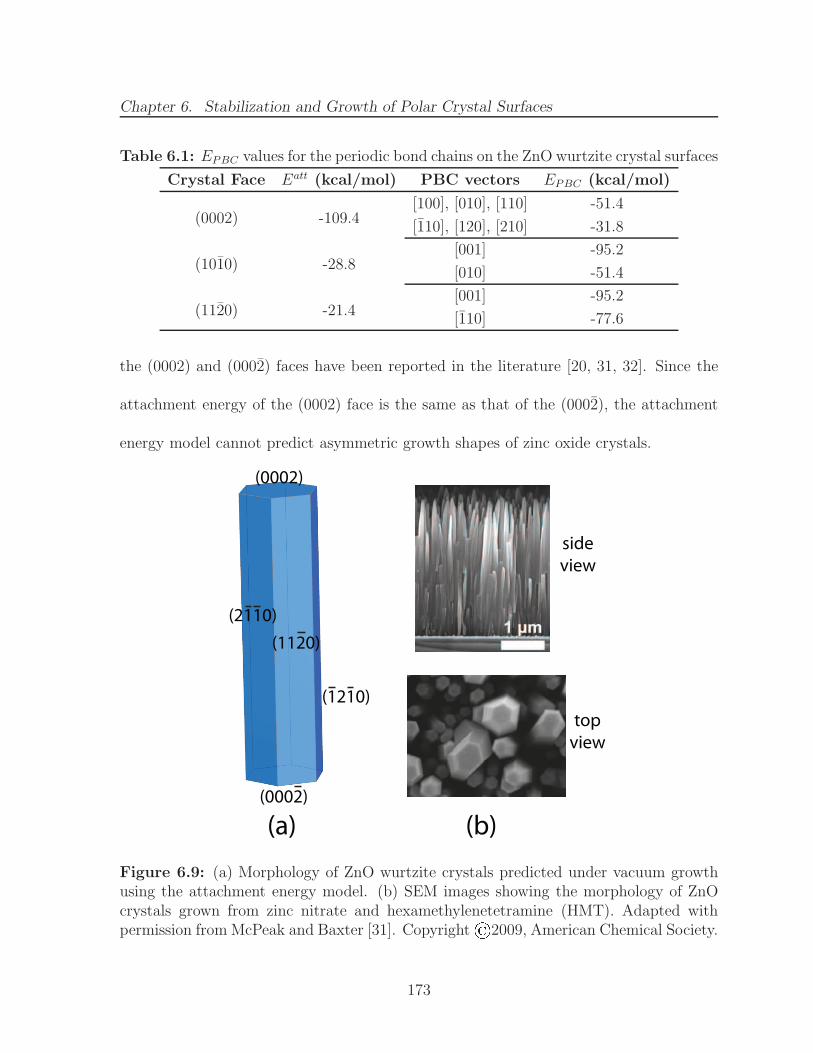
Chapter 6. Stabilization and Growth of Polar Crystal Surfaces
Table 6.1: EPBC values for the periodic bond chains on the ZnO wurtzite crystal surfaces
Crystal Face Eatt (kcal/mol) PBC vectors EPBC (kcal/mol)
(0002) -109.4[100], [010], [110] -51.4
[110], [120], [210] -31.8
(1010) -28.8[001] -95.2
[010] -51.4
(1120) -21.4[001] -95.2
[110] -77.6
the (0002) and (0002) faces have been reported in the literature [20, 31, 32]. Since the
attachment energy of the (0002) face is the same as that of the (0002), the attachment
energy model cannot predict asymmetric growth shapes of zinc oxide crystals.
(0002)
(0002)
(1120)
(1210)
(2110)
(a) (b)
side view
topview
Figure 6.9: (a) Morphology of ZnO wurtzite crystals predicted under vacuum growthusing the attachment energy model. (b) SEM images showing the morphology of ZnOcrystals grown from zinc nitrate and hexamethylenetetramine (HMT). Adapted withpermission from McPeak and Baxter [31]. Copyright©2009, American Chemical Society.
173
Chapter 6. Stabilization and Growth of Polar Crystal Surfaces
6.4 Stabilization of Polar {0002} ZnO surfaces
Figure 6.4 shows the stacking of atomic layers perpendicular to the polar axis direc-
tion, [001], in ZnO wurtzite crystals. Conventionally, the (0002) face is assumed to be
terminated by Zn atoms and the (0002) face is terminated by O atoms. Tasker type
3 surfaces could be stabilized by canceling out the dipole moment perpendicular to the
surface. Appendix D shows how the modification of the charges in the two outermost
layers of a crystal surface could stabilize the divergent electrostatic potential above a
type 3 crystal surface, and thereby stabilize the polar surface. For the (0002) surfaces of
ZnO crystals, the magnitude of the surface charge needs to be reduced by 24% to quench
the perpendicular dipole moment [33].
Several experimental and theoretical papers have been written that discuss the mech-
anism for the surface charge reduction on the polar ZnO crystal surfaces. There are
three principal mechanisms for the reduction of surface charges on {0002} faces of ZnO
wurtzite crystals
1. Creation of surface states and transfer of negative charge from the (0002) face tothe (0002) face
2. Removal of surface atoms
3. Adsorption of charged impurity or foreign species on the crystal surfaces
Mechanism 1 has been well studied from a theoretical standpoint using quantum
mechanics and density functional theory (DFT). Slabs of {0002} ZnO surfaces are allowed
to relax and the electronic structure of the atoms in the surface layers is quantified using
various functionals for the electron density. A charge transfer ranging in value from
174
Chapter 6. Stabilization and Growth of Polar Crystal Surfaces
0.17e to 0.3e was reported between the (0002) and the (0002) faces [34, 35], where e
is the magnitude of the charge on an electron. The amount of charge transfer between
the two polar surfaces was found to depend on the thickness of the {0002} slab that
was considered for the DFT calculations, and a residual perpendicular dipole moment
existed even after the charge transfer had taken place [36]. A transfer of charge from the
O-terminated (0002) surface to the Zn-terminated (0002) surface must result in surface
Zn atoms with lower charge density. The electronic structure of these surface Zn atoms
should resemble that of metallic Zn atoms. The evidence of metallic surface states was
not found in photoemission [37] and scanning tunneling spectroscopy [38] experiments
performed on the (0002) ZnO crystal surface. However, metallic surface states were found
on the (0002) surface from angle-resolved photoemission spectroscopy (ARPES) [39].
Conclusive evidence for charge transfer as the governing mechanism for the stabilization
of both polar crystal surfaces of ZnO wurtzite is yet to be found.
Mechanism 3 has been used to explain the stabilization of the polar surfaces of
ZnO crystals under oxygen and hydrogen-rich environments. X-ray photoelectron spec-
troscopy (XPS) measurements revealed that the Zn-terminated surface was stabilized by
the adsorption of hydroxyl (OH) species at high partial pressures of hydrogen gas [40, 41].
The amount of surface coverage of water was also found to govern the structure of the
Zn-terminated surface [42, 43]. On the O-terminated (0002) ZnO surface, XPS measure-
ments showed 0.5 monolayer coverage of H atoms to form hydroxyl species [44], which
175
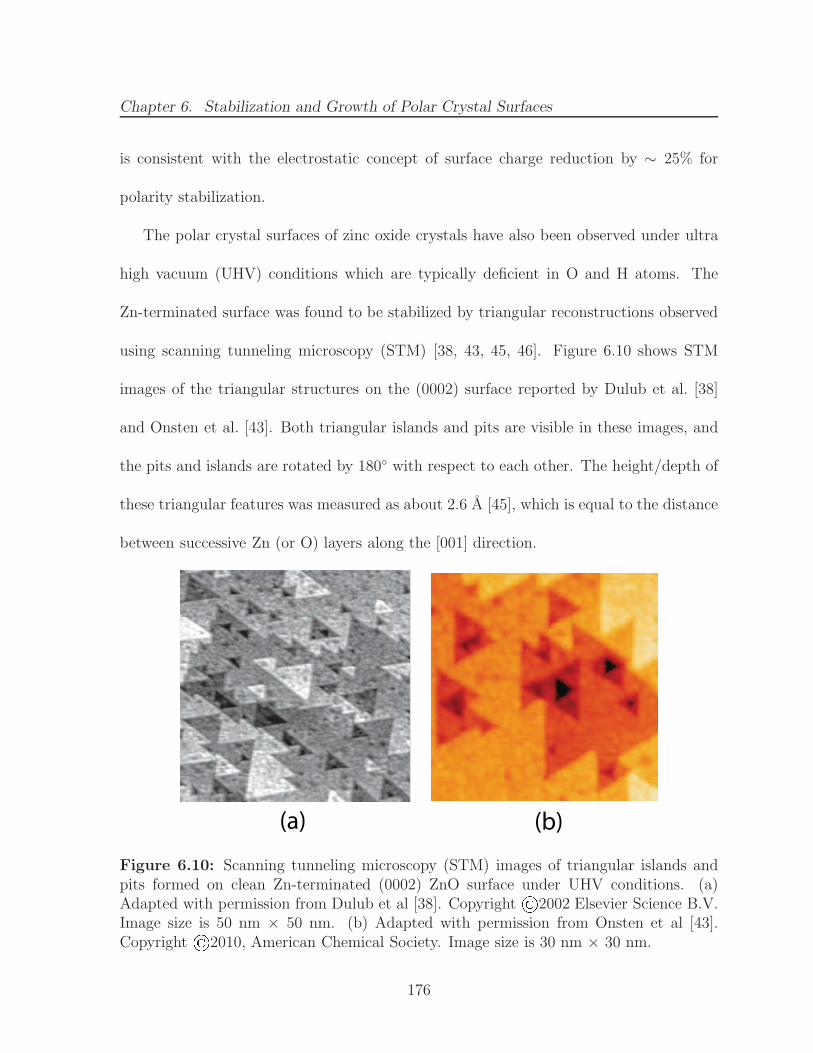
Chapter 6. Stabilization and Growth of Polar Crystal Surfaces
is consistent with the electrostatic concept of surface charge reduction by ∼ 25% for
polarity stabilization.
The polar crystal surfaces of zinc oxide crystals have also been observed under ultra
high vacuum (UHV) conditions which are typically deficient in O and H atoms. The
Zn-terminated surface was found to be stabilized by triangular reconstructions observed
using scanning tunneling microscopy (STM) [38, 43, 45, 46]. Figure 6.10 shows STM
images of the triangular structures on the (0002) surface reported by Dulub et al. [38]
and Onsten et al. [43]. Both triangular islands and pits are visible in these images, and
the pits and islands are rotated by 180◦ with respect to each other. The height/depth of
these triangular features was measured as about 2.6 A [45], which is equal to the distance
between successive Zn (or O) layers along the [001] direction.
(a) (b)
Figure 6.10: Scanning tunneling microscopy (STM) images of triangular islands andpits formed on clean Zn-terminated (0002) ZnO surface under UHV conditions. (a)Adapted with permission from Dulub et al [38]. Copyright©2002 Elsevier Science B.V.Image size is 50 nm × 50 nm. (b) Adapted with permission from Onsten et al [43].Copyright ©2010, American Chemical Society. Image size is 30 nm × 30 nm.
176
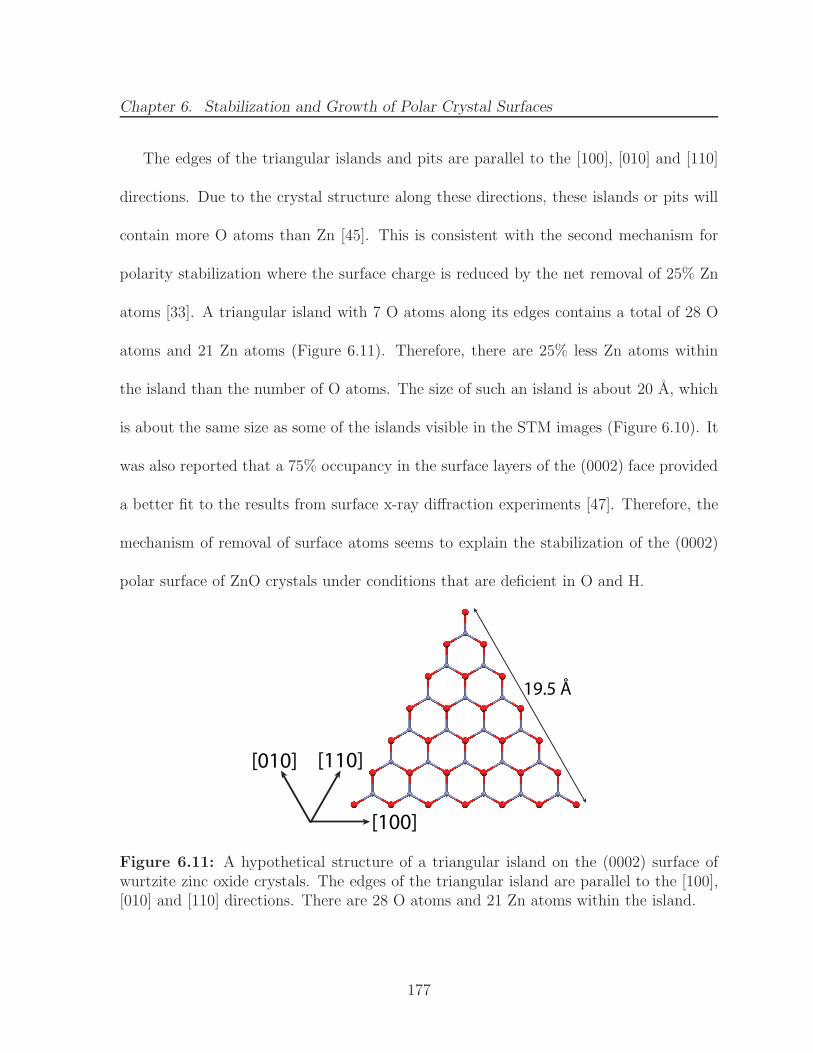
Chapter 6. Stabilization and Growth of Polar Crystal Surfaces
The edges of the triangular islands and pits are parallel to the [100], [010] and [110]
directions. Due to the crystal structure along these directions, these islands or pits will
contain more O atoms than Zn [45]. This is consistent with the second mechanism for
polarity stabilization where the surface charge is reduced by the net removal of 25% Zn
atoms [33]. A triangular island with 7 O atoms along its edges contains a total of 28 O
atoms and 21 Zn atoms (Figure 6.11). Therefore, there are 25% less Zn atoms within
the island than the number of O atoms. The size of such an island is about 20 A, which
is about the same size as some of the islands visible in the STM images (Figure 6.10). It
was also reported that a 75% occupancy in the surface layers of the (0002) face provided
a better fit to the results from surface x-ray diffraction experiments [47]. Therefore, the
mechanism of removal of surface atoms seems to explain the stabilization of the (0002)
polar surface of ZnO crystals under conditions that are deficient in O and H.
[100]
[010]
19.5 Å
[110]
Figure 6.11: A hypothetical structure of a triangular island on the (0002) surface ofwurtzite zinc oxide crystals. The edges of the triangular island are parallel to the [100],[010] and [110] directions. There are 28 O atoms and 21 Zn atoms within the island.
177
Chapter 6. Stabilization and Growth of Polar Crystal Surfaces
The STM measurements on the (0002) did not reveal any triangular islands or pits
that were deficient in O atoms, therefore, mechanism 2 (removal of surface atoms) may
not govern the stabilization of this polar surface. Large flat terraces interspersed with
steps of hexagonal symmetry were observed [38, 44]. The stabilization of the (0002) face
has been proposed to proceed by the adsorption of H atoms (mechanism 3) even under
UHV conditions [44].
DFT calculations have been performed to create phase diagrams for both polar sur-
faces as a function of the chemical potentials of O and H [42, 45, 48, 49]. At each
value of µOand µ
H, free energy minimization is carried out to predict the most probable
surface structure (triangular reconstructions, adsorption overlayer, etc.). These phase
diagrams agree well with experimental observations [42, 45], therefore, DFT could be
used to predict the surface structure that stabilizes a polar crystal surface. However, the
large amount of computational time required for these calculations to create such phase
diagrams make them a more suitable tool for ‘offline’ predictions.
A simpler thermodynamic model was sought to be developed that would predict
the free energy minimizing reconstruction of a polar crystal surface. Knowledge of the
periodic bond chain energies would allow the model to predict the surface reconstruction
with the lowest edge energy, for a fixed size of the islands/pits. The shape of these
reconstructions should be governed by the Wulff construction [50], with the edge energies
replacing the surface energies [51].
178
Chapter 6. Stabilization and Growth of Polar Crystal Surfaces
The periodic bond chain theory predicts that the Zn and O atoms in the (0002) slice
experience the strongest intermolecular interactions along the <100> family of PBCs,
which includes the [100], the [010] and the [110] directions (Table 6.1). The triangular
island shown in Figure 6.11 has edges parallel to the <100> family of PBCs. The edge
energy of such a triangular island depends on the EPBC values along the [110], the
[120] and the [210] directions. From Table 6.1, the EPBC value for the <110> family
of directions is much smaller than that of the other PBCs in the (002) face. The edge
energy, and therefore the free energy penalty for reconstruction, will be minimum for the
triangular island with edges parallel to the <100> family of directions. As a result, the
PBC theory predicts a Wulff-shape of the reconstruction islands that is consistent with
the shape of the triangular reconstructions observed from STM measurements [38, 43].
6.5 Conclusions
The stabilization of polar crystal surfaces is one of the most difficult problems in the
fields of surface science and crystal growth. The electrostatic argument for stabilization is
based on reducing the surface charge density on the outermost Zn and O layers by 24% to
get rid of the macroscopic dipole moment perpendicular to the {0002} surfaces. Several
stabilization mechanisms have been studied both theoretically and from an experimental
point of view. The removal of about 25% atoms in the surface layer may be the most
credible stabilization mechanism for pure ZnO crystal surfaces, although the evidence of
this mechanism stabilizing the O-terminated surface is not conclusive.
179
Chapter 6. Stabilization and Growth of Polar Crystal Surfaces
Surface reconstructions that relieve the perpendicular dipole moment by the formation
of triangular islands and pits with non-stoichiometric quantities of Zn and O atoms
have been reported from scanning tunneling microscopy experiments. The fundamentals
of a thermodynamic model have been discussed that predicts the shape of the surface
reconstructions on the basis of minimizing the edge energy of the islands and pits. The
periodic bond chain theory is consistent with the shape of the triangular reconstructions
observed from STM measurement and the edge directions that bound the islands and
pits.
A mechanistic growth model for zinc oxide wurtzite crystals requires an understand-
ing of the kinetics of the surface reconstruction process. In presence of water, the polar
surfaces are often reported to be covered by a hydroxyl (OH) overlayer [42–44]. There-
fore, the growth kinetics on the polar crystal surfaces of zinc oxide will be significantly
impacted by the structure and dynamics of this adsorption layer. Molecular dynamics
simulations could provide valuable quantitative information about the kinetics of adsorp-
tion and reconstruction. A comprehensive crystal growth model that accounts for the
dissociative adsorption of water molecules on the crystal surface and the surface recon-
struction to form non-stoichiometric islands/pits will have a fighting chance of solving
the mystery of how polar crystal surfaces stabilize and grow.
180
Bibliography
[1] F. Bertaut. L’Energie Electrostatique De Reseaux Ioniques. J. Phys. et le Radium,13:499–505, 1952.
[2] F. Bertaut. Physique Du Cristal - Le terme electrostatique de l’energie de surface.Compt. Rendu., 246:3447–3450, 1958.
[3] P. W. Tasker. The stability of ionic crystal surfaces. J. Phys. C Solid State, 12:4977,1979.
[4] M. Bruno, D. Aquilano, L. Pastero, and M. Prencipe. Structures and surface energiesof (100) and octopolar (111) faces of halite (NaCl): an ab initio quantum-mechanicaland thermodynamical study. Cryst. Growth Des., 8:2163–2170, 2008.
[5] M. Bruno, D. Aquilano, and M. Prencipe. Quantum-mechanical and thermodynami-cal study on the (110) and reconstructed (111) faces of NaCl crystals. Cryst. GrowthDes., 9:1912–1916, 2009.
[6] V. E. Henrich and P. A. Cox. The Surface Science of Metal Oxides. CambridgeUniversity Press, Cambridge, U.K., 1996.
[7] A. Janotti and C. G. V. de Walle. Fundamentals of zinc oxide as a semiconductor.Rep. Prog. Phys., 72:126501, 2009.
[8] C. Woll. The chemistry and physics of zinc oxide surfaces. Prog. Surf. Sci., 82:55,2007.
[9] R. Docherty, K. J. Roberts, V. Saunders, S. Black, and R. J. Davey. Theoreticalanalysis of the polar morphology and absolute polarity of crystalline urea. FaradayDiscuss., 95:11–25, 1993.
[10] M. K. Singh and A. Banerjee. Growth and dissolution mechanism at the oppositeand hemihedral faces of polar crystals. CrystEngComm, 15:4143–4152, 2013.
[11] K. Srinivasan and J. N. Sherwood. Asymmetric growth of α-Resorcinol crystals:Comparison of growth from the vapor phase and from aqueous solution. Cryst.Growth Des., 5:1359–1370, 2005.
181
Bibliography
[12] K. Srinivasan and J. N. Sherwood. Asymmetric growth of α-Resorcinol crystals: Insitu studies of crystal growth from the vapor phase. Cryst. Growth Des., 11:5010–5018, 2011.
[13] M. K. Singh, S. K. Sharma, and A. Banerjee. Asymmetrical growth and dissolutionalong polar axis of α-resorcinol crystal: role of solvent and external environment.CrystEngComm, 15:8493–8503, 2013.
[14] S. Piana, M. Reyhani, and J. D. Gale. Simulating micrometre-scale crystal growthfrom solution. Nature, 438:70–73, 2005.
[15] K. Kihara and G. Donnay. Anharmonic thermal vibrations in ZnO. Can. Mineral.,23:647–654, 1985.
[16] M. Marezio. The crystal structure and anomalous dispersion of γ-LiAlO2. ActaCrystallogr., 19:396–400, 1965.
[17] P. S. Halasyamani and K. R. Poeppelmeier. Noncentrosymmetric oxides. Chem.Mater., 10:2753–2769, 1998.
[18] C. Giacovazzo, H. L. Monaco, D. Viterbo, F. Scordari, G. Gilli, G. Zanotti, andM. Catti. Fundamentals of Crystallography. Oxford University Press, New York,1992.
[19] P. Hartman and W. G. Perdok. On the relations between structure and morphologyof crystals. I. Acta Crystallogr., 8:49–52, 1955.
[20] W. J. Li, E. W. Shi, W. Z. Zhong, and Z. W. Yin. Growth mechanism and growthhabit of oxide crystals. J. Cryst. Growth, 203:186–196, 1999.
[21] H. Zhang, D. Yang, D. Li, X. Ma, S. Li, and D. Que. Controllable growth of ZnOmicrocrystals by a capping-molecule-assisted hydrothermal process. Cryst. GrowthDes., 5:547–550, 2005.
[22] J. J. Richardson and F. F. Lange. Controlling low temperature aqueous synthesisof ZnO. 1. Thermodynamic analysis. Cryst. Growth Des., 9:2570–2575, 2009.
[23] A. J. Kulkarni, M. Zhou, and F. J. Ke. Orientation and size dependence of theelastic properties of zinc oxide nanobelts. Nanotechnology, 16:2749, 2005.
[24] F. Labat, I. Ciofini, and C. Adamo. Modeling ZnO phases using a periodic approach:From bulk to surface and beyond. J. Chem. Phys., 131:044708, 2009.
[25] L. Whitmore, A. A. Sokol, and C. A. Catlow. Surface structure of zinc oxide (1010),using an atomistic, semi-infinite treatment. Surf. Sci., 498:135–146, 2002.
182
Bibliography
[26] C. R. A. Catlow, S. A. French, A. A. Sokol, A. A. Al-Sunaidi, and S. M. Woodley.Zinc oxide: A case study in contemporary computational solid state chemistry. J.Comput. Chem., 29:2234–2249, 2008.
[27] H. Jenkins. Handbook of Chemistry and Physics, chapter Lattice Energies, page 27.CRC Press, 1992.
[28] S. C. Lyu, Y. Zhang, C. J. Lee, H. Ruh, and H. J. Lee. Low-temperature growth ofZnO nanowire array by a simple physical vapor-deposition method. Chem. Mater.,15:3294–3299, 2003.
[29] K. Govender, D. S. Boyle, P. B. Kenway, and P. O’Brien. Understanding the fac-tors that govern the deposition and morphology of thin films of ZnO from aqueoussolution. J. Mater. Chem., 14:2575–2591, 2004.
[30] A. M. Peiro, J. A. Ayllon, J. Peral, X. Domenech, and C. Domingo. Microwaveactivated chemical bath deposition (MW-CBD) of zinc oxide: Influence of bathcomposition and substrate characteristics. J. Cryst. Growth, 285:6–16, 2005.
[31] K. M. McPeak and J. B. Baxter. ZnO nanowires grown by chemical bath depositionin a continuous flow microreactor. Cryst. Growth Des., 9:4538–4545, 2009.
[32] L. Xu, Y.-L. Hu, C. Pelligra, C.-H. Chen, L. Jin, H. Huang, S. Sithambaram, M. Ain-dow, R. Joesten, and S. L. Suib. ZnO with different morphologies synthesized bysolvothermal methods for enhanced photocatalytic activity. Chem. Mater., 21:2875–2885, 2009.
[33] C. Noguera. Polar oxide surfaces. J. Phys.: Condens. Matter, 12:R367, 2000.
[34] J. M. Carlsson. Electronic structure of the polar ZnO{0001}-surfaces. Comput.Mater. Sc., 22:24–31, 2001.
[35] A. Wander, F. Schedin, P. Steadman, A. Norris, R. McGrath, T. S. Turner,G. Thornton, and N. M. Harrison. Stability of polar oxide surfaces. Phys. Rev.Lett., 86:3811–3814, 2001.
[36] B. Meyer and D. Marx. Density-functional study of the structure and stability ofZnO surfaces. Phys. Rev. B, 67:035403, 2003.
[37] R. Girard, O. Tjernberg, G. Chiaia, S. Soderholm, U. Karlsson, C. Wigren, H. Nylen,and I. Lindau. Electronic structure of ZnO(0001) studied by angle-resolved photo-electron spectroscopy. Surf. Sci., 373:409–417, 1997.
[38] O. Dulub, L. A. Boatner, and U. Diebold. STM study of the geometric and elec-tronic structure of ZnO(0001)-Zn, (0001)-O, (1010), and (1120) surfaces. Surf. Sci.,519:201–217, 2002.
183
Bibliography
[39] L. F. J. Piper, A. R. H. Preston, A. Fedorov, S. W. Cho, A. DeMasi, and K. E.Smith. Direct evidence of metallicity at ZnO (0001)-(1 × 1) surfaces from angle-resolved photoemission spectroscopy. Phys. Rev. B, 81:233305, 2010.
[40] M. Valtiner, S. Borodin, and G. Grundmeier. Preparation and characterisation ofhydroxide stabilised ZnO(0001)-Zn-OH surfaces. Phys. Chem. Chem. Phys., 9:2406–2412, 2007.
[41] E. D. Batyrev and J. C. van den Heuvel. Modification of the ZnO(0001)-Zn surfaceunder reducing conditions. Phys. Chem. Chem. Phys., 13:13127–13134, 2011.
[42] M. Valtiner, M. Todorova, G. Grundmeier, and J. Neugebauer. Temperature sta-bilized surface reconstructions at polar ZnO(0001). Phys. Rev. Lett., 103:065502,2009.
[43] A. Onsten, D. Stoltz, P. Palmgren, S. Yu, M. Gothelid, and U. O. Karlsson. Wa-ter adsorption on ZnO(0001): Transition from triangular surface structures to adisordered hydroxyl terminated phase. J. Phys. Chem. C, 114:11157–11161, 2010.
[44] J. V. Lauritsen, S. Porsgaard, M. K. Rasmussen, M. C. R. Jensen, R. Bechstein,K. Meinander, B. S. Clausen, S. Helveg, R. Wahl, G. Kresse, and F. Besenbacher.Stabilization principles for polar surfaces of ZnO. ACS Nano, 5:5987–5994, 2011.
[45] O. Dulub, U. Diebold, and G. Kresse. Novel stabilization mechanism on polarsurfaces: ZnO(0001)-Zn. Phys. Rev. Lett., 90:016102, 2003.
[46] F. Ostendorf, S. Torbrugge, and M. Reichling. Atomic scale evidence for facetingstabilization of a polar oxide surface. Phys. Rev. B, 77:041405, 2008.
[47] N. Jedrecy, M. Sauvage-Simkin, and R. Pinchaux. The hexagonal polar ZnO (0001)- (1 × 1) surfaces: structural features as stemming from X-ray diffraction. Appl.Surf. Sci., 162-163:69–73, 2000.
[48] B. Meyer. First-principles study of the polar O-terminated ZnO surface in thermo-dynamic equilibrium with oxygen and hydrogen. Phys. Rev. B, 69:045416, 2004.
[49] R. Wahl, J. V. Lauritsen, F. Besenbacher, and G. Kresse. Stabilization mechanismfor the polar ZnO(0001)-O surface. Phys. Rev. B, 87:085313, 2013.
[50] G. Wulff. Zur frage der geschwindigkeit des wachsthums und der auflosung derkrystallflachen. Z. Kristallogr., 34:449, 1901.
[51] M. A. Lovette and M. F. Doherty. Predictive modeling of supersaturation-dependentcrystal shapes. Cryst. Growth Des., 12:656–669, 2012.
184
Chapter 7
Conclusions and Future Work
7.1 Overview and Summary
In this dissertation, a predictive model for the crystal shapes of inorganic solids grown
from solution has been developed. The model unifies a detailed description of the solid-
state interactions within inorganic crystals with a molecular level understanding of the
effect of the growth medium on the kinetics of inorganic crystal growth.
A systematic method has been developed for the identification of the periodic bond
chain (PBC) directions in inorganic crystals by using the concept of a building unit
of a PBC. The long-range electrostatic interactions between the ionic growth units are
accounted for, to calculate the energy values relevant to the crystal growth model. The
variation of the partial charges of the surface growth units is captured using an easy-to-
implement method which is based on the bond valence model [1]. Accurate information
of the surface relaxation and solvent structure from molecular simulations is used as input
for the partial charge calculations. A space partitioning method is applied to calculate
185
Chapter 7. Conclusions and Future Work
the potential energy of a growth unit situated in the kink site position. The interaction
energies with the solid-state neighbors are calculated by assigning the correct partial
charges to the atoms in the surface layer.
A steady-state master equation is used to derive a general expression for the kink
incorporation rate in terms of the attachment and detachment fluxes. These fluxes de-
pend on the solution composition as well as the kink site potential energies, the latter
calculated using the space partitioning method. Thus, the step velocity of spiral edges,
and the growth rates of crystal faces under the spiral growth regime are calculated within
a mechanistic framework that accounts for the solid-state and the solution phase chem-
istry. The model correctly predicts the steady-state morphologies of inorganic crystals
such as calcite and aragonite grown from solution at ambient conditions.
The PBC theory has also been applied to identify the directions of strongest in-
termolecular interactions in metal oxides such as TiO2 (anatase) and ZnO (wurtzite
structure). Ex situ AFM experiments on the anatase crystal surfaces grown using hy-
drothermal synthesis suggest that in addition to the oriented attachment mechanism [2],
a layered growth mechanism could also be active. The shape of the triangular recon-
structions believed to stabilize the polar crystal surfaces in ZnO wurtzite is found to be
consistent with the shape obtained from the Wulff condition.
186
Chapter 7. Conclusions and Future Work
7.2 Directions for Future Work
7.2.1 Modeling
Effect of Additives
This dissertation focuses on predicting the steady-state growth morphology of inor-
ganic crystals. However, the native or ‘typical’ crystal morphology may not be the most
functionally desirable morphology. For example, the native morphology of TiO2 anatase
crystals is tetragonal bipyramidal dominated by the {101} family of faces (see Figure
5.5b). However, the {004} family of faces show higher catalytic activity towards water
dissociation reaction [3]. Therefore, the desired morphology of anatase crystals should
expose higher surface area of the {004} surfaces. Thus, one of the future directions within
the modeling framework is to extend this mechanistic growth model to predict the effect
of various growth modifiers or additives on the crystal growth rates and the steady-state
morphology of inorganic crystals.
There is a considerable body of work on predicting the effect of impurities or addi-
tive species on the spiral growth on crystal surfaces [4–6]. Cabrera and Vermilyea [4]
developed a model, which has since been referred to as the “step-pinning” model, which
suggested that additive molecules block the attachment of new growth units to the step
edge and slow down the growth kinetics. There is a minimum supersaturation below
which the step does not advance [7]. ‘Spiral-pinning’ [5, 6] is another mechanism that
focuses on the effect of impurities/additives on spiral growth. This mechanism suggests
187
Chapter 7. Conclusions and Future Work
that the growth retardation is due to an increase in the critical length of a spiral edge in
the presence of the additive species along the edge. There are some other mechanisms by
which additive species can disrupt the crystal growth process and the reader is referred
to an article by De Yoreo and Vekilov [7] that discusses those mechanisms in further
detail.
The mechanistic model presented in this dissertation could be adapted to account for
the effect of the additive species on the crystal growth process. The composition of the
solution in the expressions for the kink attachment and detachment fluxes (Equations 3.13
and 3.14) will reflect the presence of the additive species in the solution. The solvation
structure of an ionic impurity, such as Mg2+ in calcite growth, will determine the kinetics
of attachment and detachment of the impurity ions into the kink sites (Equation 3.26).
Free Energy Barriers for Kink Attachment/Detachment
The expressions for the attachment and detachment fluxes into the kink sites in Sec-
tion 3.4.2 were derived based on the assumption that there is a single free energy barrier
between a completely solvated growth unit situated close to the crystal-solution interface
and the growth unit incorporated into a kink site along the edge (Figure 3.5). The free
energy landscape of the kink attachment/detachment process on several inorganic crystal
surfaces has been mapped using molecular simulations and multiple intermediate steps
were found to exist in the kink attachment/detachment process [8–10].
188
Chapter 7. Conclusions and Future Work
Depending on the intermediate step with the highest free energy barrier, the attach-
ment/detachment fluxes may not depend on the mole fraction of solute ions in the bulk
solution, as shown in equations 3.13 and 3.14. For example, if the rate-limiting step
was the kink site attachment of a growth unit from a surface adatom position, the mole
fraction prefactor in equation 3.13 would be equal to the mole fraction of the growth unit
species adsorbed on the crystal surface [11]. Moreover, if the rate-limiting step is not
the same for each growth unit along a spiral edge, the surface adsorbed mole fractions
cannot be estimated from the model by calculating a local solubility product K ′
sp from
equation 3.24. In such cases, molecular dynamics simulations could be used to calculate
the adsorbed mole fractions [12].
Therefore, molecular dynamics simulations coupled with rare-event methods such as
transition path sampling [13] or metadynamics [14], that correctly identify the rate-
limiting step, the free energy barriers for the kink attachment and detachment processes,
and the appropriate mole fraction prefactors for the attachment/detachment fluxes, could
be used as inputs to the mechanistic growth model to obtain accurate expressions for the
kink incorporation rate on the spiral edges of inorganic crystal surfaces.
Dynamics of the Step Edge Structure
The model developed in this dissertation assumes that the time scale for the thermal
rearrangement of a step edge is much smaller than the time scale for kink attachment.
Therefore, the edge structure is assumed to be in quasi-equilibrium with the solution and
189
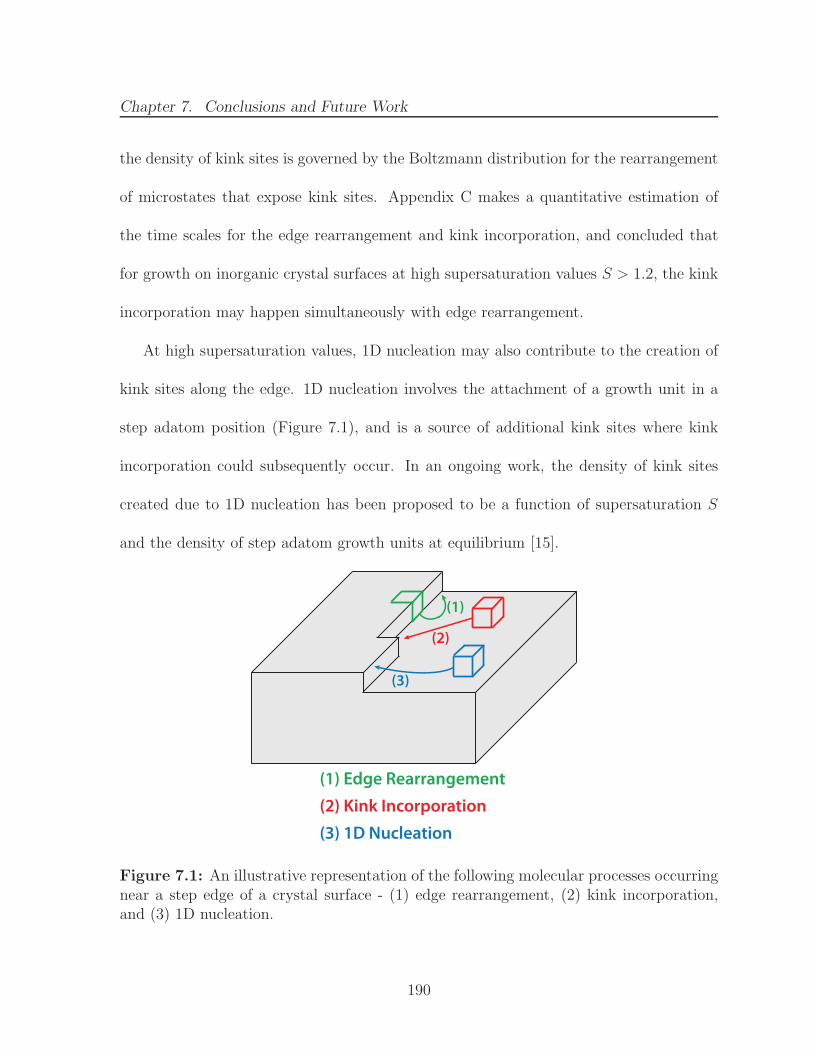
Chapter 7. Conclusions and Future Work
the density of kink sites is governed by the Boltzmann distribution for the rearrangement
of microstates that expose kink sites. Appendix C makes a quantitative estimation of
the time scales for the edge rearrangement and kink incorporation, and concluded that
for growth on inorganic crystal surfaces at high supersaturation values S > 1.2, the kink
incorporation may happen simultaneously with edge rearrangement.
At high supersaturation values, 1D nucleation may also contribute to the creation of
kink sites along the edge. 1D nucleation involves the attachment of a growth unit in a
step adatom position (Figure 7.1), and is a source of additional kink sites where kink
incorporation could subsequently occur. In an ongoing work, the density of kink sites
created due to 1D nucleation has been proposed to be a function of supersaturation S
and the density of step adatom growth units at equilibrium [15].
(2)
(3)
(1)
(1) Edge Rearrangement
(2) Kink Incorporation
(3) 1D Nucleation
Figure 7.1: An illustrative representation of the following molecular processes occurringnear a step edge of a crystal surface - (1) edge rearrangement, (2) kink incorporation,and (3) 1D nucleation.
190
Chapter 7. Conclusions and Future Work
The structure of a step edge exposed to a supersaturated solution will be a function
of the relative rates of three processes - edge rearrangement, kink incorporation and 1D
nucleation. The steady-state master equation (Equation 3.9) may need to be modified to
allow the kinetics of 1D nucleation or edge rearrangement to govern the transition rates
between any two kink types or states.
Molecular Design of Intergrown Mullite Crystals
Mullite refers to a class of aluminosilicate minerals with an alumina (Al2O3) to silica
(SiO2) stoichiometric ratio that typically varies from 5:4 to 3:1 [16]. Acicular or rod-like
mullite crystals exhibit favorable material properties such as low density, high porosity
and mechanical strength at high temperatures [17]. These properties have facilitated the
development of diesel particulate filters that contain crystalline films of mullite [18].
Intergrowth of rod-shaped mullite crystals provides a honeycomb-like microstructure
with high mechanical strength [16]. The design of such honeycomb structures with a
large fraction of intergrown mullite crystals requires a mechanistic understanding of the
growth conditions, including the effect of additives, which could yield crystals with non-
convex shapes. The reported synthesis of non-convex shapes of Engelhard Titanium
Silicate (ETS) [19, 20] and MnO [21] crystals could provide mechanistic insights into
the causality of non-convex crystal morphologies. A possible change in the rate-limiting
step from surface integration to diffusion-controlled kinetics may also result in a higher
fraction of crystals with non-convex shapes. A crystal growth modeling effort for the
191
Chapter 7. Conclusions and Future Work
design of intergrown mullites with application as composite structural materials [22],
could begin with studying the growth of sillimanite (Al2SiO5) crystals, which has the
simplest mullite composition of 1:1 stoichiometric ratio of alumina to silica.
7.2.2 Experiments
The characterization of growth features on crystal surfaces using ex situ atomic force
microscopy (AFM) was described in Chapter 5 of this dissertation. In situ AFM exper-
iments must be carried out to obtain conclusive evidence of the mechanisms that govern
the growth of hydrothermally grown crystals (e.g., anatase). In situ AFM techniques
have been developed to observe crystal growth at room temperature [23–26] as well as
higher temperatures [27, 28]. These techniques allow accurate measurement of the step
velocities, critical lengths, and spacing between adjacent steps along the spiral edges of
crystal surfaces [29–31]. The measured values of these quantities could be compared with
the model predictions to validate the mechanistic growth model for inorganic crystal sys-
tems other than calcite. The specific action of an additive species on the step velocity
of spiral edges can also be observed using in situ AFM experiments [32, 33]. With the
advent of commercial AFM instruments that can operate at high temperatures (up to
300◦) [34], there is an exciting opportunity to carry out in situ AFM experiments that
elucidate the relevant growth mechanism on crystal surfaces of inorganic oxides such as
TiO2, ZnO, etc.
192
Chapter 7. Conclusions and Future Work
The structure and the stoichiometry of the solution phase growth unit in the hy-
drothermal synthesis of inorganic crystals provides valuable insights into the structure
of the solid-state growth unit. Solution characterization techniques such as in situ Ra-
man spectroscopy [35], solution phase nuclear magnetic resonance (NMR) [36], neutron
scattering [37], etc., provide information about the structure of the growth unit in the
solution, and of the solvation shell around it. Measurements of the solvation shell co-
ordination and the distances between the solute and the solvent molecules from these
experimental techniques could be used by the mechanistic model as an input to calculate
the kink detachment work (∆W ) from equation 3.26. Alternatively, such measurements
could be used to check the predictions of such quantities from molecular dynamics sim-
ulations.
193
Bibliography
[1] I. D. Brown. The Chemical Bond in Inorganic Chemsitry: The Bond Valence Model.Oxford University Press, 2002.
[2] R. Penn and J. F. Banfield. Morphology development and crystal growth innanocrystalline aggregates under hydrothermal conditions: insights from titania.Geochim. Cosmochim. Acta, 63:1549–1557, 1999.
[3] X.-Q. Gong and A. Selloni. Reactivity of anatase TiO2 nanoparticles: The role ofthe minority (001) surface. J. Phys. Chem. B, 109:19560–19562, 2005.
[4] N. Cabrera and D. Vermilyea. Growth and Perfection of Crystals, chapter TheGrowth of Crystals from Solution, pages 393–410. New York: WIley, 1958.
[5] J. P. Sizemore and M. F. Doherty. A new model for the effect of molecular imposterson the shape of faceted molecular crystals. Cryst. Growth Des., 9:2637–2645, 2009.
[6] Z. B. Kuvadia and M. Doherty. Effect of structurally similar additives on crystalhabit of organic molecular crystals at low supersaturation. Cryst. Growth Des.,13:1412–1428, 2013.
[7] J. J. DeYoreo and P. G. Vekilov. Biomineralization, chapter Principles of CrystalNucleation and Growth, pages 57–93. Washington, DC: Mineralogical Society ofAmerica, 2003.
[8] S. Kerisit and S. C. Parker. Free energy of adsorption of water and metal ions onthe {1014} calcite surface. J. Am. Chem. Soc., 126:10152–10161, 2004.
[9] S. Piana, F. Jones, and J. D. Gale. Assisted desolvation as a key kinetic step forcrystal growth. J. Am. Chem. Soc., 128:13568–13574, 2006.
[10] A. G. Stack, P. Raiteri, and J. D. Gale. Accurate rates of the complex mechanismsfor growth and dissolution of minerals using a combination of rare-event theories. J.Am. Chem. Soc., 134:11–14, 2012.
[11] X. Y. Liu, E. S. Boek, W. J. Briels, and P. Bennema. Prediction of crystal growthmorphology based on structural analysis of the solid-fluid interface. Nature, 374:342–345, 1995.
194
Bibliography
[12] X. Y. Liu, E. S. Boek, W. J. Briels, and P. Bennema. Analysis of morphology ofcrystals based on identification of interfacial structure. J. Chem. Phys., 103:3747–3754, 1995.
[13] B. Peters. Recent advances in transition path sampling: accurate reaction coordi-nates, likelihood maximisation and diffusive barrier-crossing dynamics. Mol. Simul.,36:1265–1281, 2010.
[14] A. Laio and M. Parrinello. Escaping free-energy minima. Proc. Natl. Acad. Sci.U.S.A, 99:12562–12566, 2002.
[15] M. N. Joswiak, M. F. Doherty, and B. Peters. Is 1D nucleation important in kinksite generation? (manuscript in preparation), 2014.
[16] A. J. Pyzik, C. S. Todd, and C. Han. Formation mechanism and microstructuredevelopment in acicular mullite ceramics fabricated by controlled decomposition offluorotopaz. J. Eur. Ceram. Soc., 28:383 – 391, 2008.
[17] C.-H. Hsiung, A. Pyzik, F. D. Carlo, X. Xiao, S. Stock, and K. Faber. Microstructureand mechanical properties of acicular mullite. J. Eur. Ceram. Soc., 33:503–513, 2013.
[18] A. J. Pyzik and C. G. Li. New design of a ceramic filter for diesel emission controlapplications. Int. J. Appl. Ceram. Technol., 2:440–451, 2005.
[19] B. Yilmaz, P. Q. Miraglia, J. Warzywoda, and A. Sacco. Synthesis of titanosilicateETS-4 with controlled morphology and investigation of its crystallization kinetics.Microporous Mesoporous Mater., 71:167–175, 2004.
[20] Y.-Q. Zhang, W. Zhou, S. Liu, and A. Navrotsky. Controllable Morphology ofEngelhard Titanium Silicates ETS-4: Synthetic, Photocatalytic, and CalorimetricStudies. Chem. Mater., 23:1166–1173, 2011.
[21] T. Ould-Ely, D. Prieto-Centurion, A. Kumar, W. Guo, W. V. Knowles, S. Asokan,M. S. Wong, I. Rusakova, A. Luttge, and K. H. Whitmire. Manganese(II) OxideNanohexapods: Insight into Controlling the Form of Nanocrystals. Chem. Mater.,18:1821–1829, 2006.
[22] H. Fujita, G. Jefferson, R. M. McMeeking, and F. W. Zok. Mullite/Alumina Mix-tures for Use as Porous Matrices in Oxide Fiber Composites. J. Am. Ceram. Soc.,87:261–267, 2004.
[23] G. T. Paloczi, B. L. Smith, P. K. Hansma, D. A. Walters, and M. A. Wendman.Rapid imaging of calcite crystal growth using atomic force microscopy with smallcantilevers. Appl. Phys. Lett., 73:1658–1660, 1998.
195
Bibliography
[24] C. M. Pina, U. Becker, P. Risthaus, D. Bosbach, and A. Putnis. Molecular-scalemechanisms of crystal growth in barite. Nature, 395:483–486, 1998.
[25] H. H. Teng, P. M. Dove, C. A. Orme, and J. J. De Yoreo. Thermodynamics ofcalcite growth: Baseline for understanding biomineral formation. Science, 282:724–727, 1998.
[26] J. D. Rimer, Z. An, Z. Zhu, M. H. Lee, D. S. Goldfarb, J. A. Wesson, and M. D.Ward. Crystal Growth Inhibitors for the Prevention of L-Cystine Kidney StonesThrough Molecular Design. Science, 330:337–341, 2010.
[27] A. I. Lupulescu and J. D. Rimer. In situ imaging of silicalite-1 surface growth revealsthe mechanism of crystallization. Science, 344:729–732, 2014.
[28] J. D. Rimer, M. Kumar, R. Li, A. I. Lupulescu, and M. D. Oleksiak. Tailoring thephysicochemical properties of zeolite catalysts. Catal. Sci. Technol., (in press), 2014.
[29] H. Teng, P. M. Dove, and J. J. DeYoreo. Reversed calcite morphologies induced bymicroscopic growth kinetics: insight into biomineralization. Geochim. Cosmochim.Acta, 63:2507–2512, 1999.
[30] M. Kowacz, C. Putnis, and A. Putnis. The effect of cation:anion ratio in solution onthe mechanism of barite growth at constant supersaturation: Role of the desolvationprocess on the growth kinetics. Geochim. Cosmochim. Acta, 71:5168–5179, 2007.
[31] K. Larsen, K. Bechgaard, and S. L. S. Stipp. The effect of the Ca2+ to CO2−3 activity
ratio on spiral growth at the calcite {1014} surface. Geochom. Cosmochim. Acta,74:2099–2109, 2010.
[32] J. J. De Yoreo and P. M. Dove. Shaping crystals with biomolecules. Science,306:1301–1302, 2004.
[33] P. Dandekar and M. F. Doherty. Imaging crystallization. Science, 344:705–706,2014.
[34] J. Li and M. Rutgers. Asylum Research. Private Communication, 2014.
[35] F. Fan, Z. Feng, G. Li, K. Sun, P. Ying, and C. Li. In Situ UV Raman SpectroscopicStudies on the Synthesis Mechanism of Zeolite X. Chem. Eur. J., 14:5125–5129, 2008.
[36] C. A. Hunter, J. F. McCabe, and A. Spitaleri. Solvent effects of the structures ofprenucleation aggregates of carbamazepine. CrystEngComm, 14:7115–7117, 2012.
[37] R. C. Burton, E. S. Ferrari, R. J. Davey, J. L. Finney, and D. T. Bowron. Re-lationship between solution structure and phase behavior: A neutron scatteringstudy of concentrated aqueous hexamethylenetetramine solutions. J. Phys. Chem.B, 113:5967–5977, 2009.
196
Appendix A
Step-by-step Methodology forCrystal Morphology Prediction ofInorganic Solids
1. Input crystallography of the inorganic solid: The crystal structure and unit
cell information is obtained as an input from single crystal X-ray diffraction data
available in commonly used databases such as - Cambridge Structural Database, In-
organic Crystal Structure Database (ICSD), American Mineralogist Crystal Struc-
ture Database, etc. The list of symmetry operators from the crystallographic in-
formation file (CIF) must be checked to ensure that there is an inversion symmetry
operator within the unit cell. If the inversion operator is not present, an intrinsic
dipole moment is present within the unit cell and the subsequent steps cannot be
applied to model crystal growth for such systems. This method works only for
crystals with non-polar unit cells.
2. Input the force field and partial charges: An intermolecular force field that is
appropriate to study the crystal growth of this particular inorganic solid is required.
197
Appendix A. Step-by-step Methodology for Crystal Morphology Prediction of Inorganic
Solids
Buckingham potential is commonly used to describe the short range interactions
in typical inorganic solids. The parameters of the Buckingham potential and the
bulk partial charges of all the atoms are needed as an input to the crystal growth
model. Molecular simulations or quantum mechanical calculations may be carried
out to obtain the partial charges and short range interaction parameters by fitting
to structural and mechanical properties of the bulk crystal that are experimentally
known. The parameter values from an existing force field may be utilized if that
force field accurately predicts the experimentally obtained properties of the solid.
A molecular simulation package such as GULP [1] is extremely useful to fit force
field parameters for inorganic solids.
3. Identify the building unit of PBCs: The unit cell packing is constructed from
the asymmetric unit information and all the symmetry operators that are present
in the unit cell. In some cases, an entire building unit may be spread across two
adjacent unit cells. Therefore, a supercell is created that is 1.5 times the length
of the lattice constants in each of three directions. A stoichiometric arrangement
of atoms with zero dipole moment is identified from the contents of this supercell.
The dipole moment of any arrangement of n atoms is calculated as follows
~µ =
n∑
i=1
qi~ri
(A.1)
where qiis the partial charge and ~r
iis the position vector of atom i. Amongst
all the stoichiometric groups of atoms with zero dipole moment, choose the groups
with fewest number of atoms such that the atoms are located ‘close’ to each other.
198
Appendix A. Step-by-step Methodology for Crystal Morphology Prediction of Inorganic
Solids
4. Pack the entire unit cell with building units: If multiple stoichiometric ar-
rangements of atoms are found that have zero dipole moment and the same number
of atoms, the symmetry relationship between these arrangements must be checked.
If a single symmetry operator (from the list of all symmetry operators in the space
group table) can be applied to each atom in an arrangement to obtain a second
stoichiometric arrangement, the two arrangements are related to each other by
that particular symmetry operator and only one of the building units is indepen-
dent.Once an independent building unit within the unit cell is identified, the re-
maining symmetry operators are applied to each atom within the building unit to
obtain the remaining building unit arrangements within the unit cell.
5. Identification of PBC directions: Translational operators are applied to the
unit cell contents along the three crystallographic axes to create a large supercell
(e.g., 4× 4× 4 times the unit cell). Any building unit inside the central unit cell is
considered as a central building unit and all the building units surrounding it are
accounted for to identify chains of building units that run continuously throughout
the supercell packing. The crystallographic direction of each of these chains is
obtained by joining the centers of mass of all the building units present along the
chain. Each of these directions is a Periodic Bond Chain (PBC) vector. The actual
PBC vector is multiplied by the lowest common multiple of the denominators of its
fractional coordinates to create a vector of the form [uvw] such that u, v, w are all
integers.
199
Appendix A. Step-by-step Methodology for Crystal Morphology Prediction of Inorganic
Solids
6. Identify step edge structures on every face: A list of all possible (hkl) values
for the faces present on the crystal surface is obtained from the extinction conditions
listed in the crystallography tables for the specific space group. The PBC vectors
that are perpendicular to the [hkl] vector are short listed from the list of PBC
vectors obtained in step 5. The PBCs that will be present in the crystal face (hkl)
are thus obtained. Let (hkl) be a face with two PBC vectors, ~v1and ~v
2, present
on it. The chain of building units is constructed along both ~v1and ~v
2directions.
The length of the kink sites along each of the chains is calculated as the distance
between the adjacent growth units along the respective PBC directions. If the
thickness of the ~v1chain along ~v
2direction is more than the length of the kink
site along the ~v2direction, the chain of building units along ~v
1must be further
decomposed into a chain of growth units (also known as the step edge) along ~v1.
If the thickness of the chain is exactly equal to the length of the kink site, then
the chain of building units is exactly identical to the step edge structure. If there
is another PBC vector ~v3present on the (hkl) face, the thickness of the ~v
1chain
along ~v3must be similarly compared with the size of the kink site along ~v
3chain to
determine the step edge structure along ~v1. The step edge structure thus obtained
must result in a stoichiometric chain of growth units that has zero dipole moment
perpendicular to ~v1direction. The step edge must not share any interactions with
another step edge within that face. Similarly, a decomposition of the chain of
200
Appendix A. Step-by-step Methodology for Crystal Morphology Prediction of Inorganic
Solids
building units along every other PBC direction will result in identification of chains
of growth units along each of the PBC vectors present in the (hkl) face.
7. Identify all the F faces: The (hkl) slice is constructed of thickness equal to the
interplanar spacing dhkl. The slice boundaries may be shifted in the [hkl] direction
to obtain a slice that is stoichiometric and has zero dipole moment along the [hkl]
direction. If a continuous chain of growth units along a PBC vector is contained
within the slice, then that PBC vector is said to be present within the slice. All the
PBCs contained within the slice (hkl) are thus obtained. The (hkl) crystal face is
classified as an F, S or K face depending on if there are two (or more), one or zero
PBCs are present within the (hkl) slice, respectively.
8. Calculate solid state bond valences from bulk partial charges: Bond va-
lence parameters are required to calculate the partial charges of atoms in various
surface positions. The bond valence parameters R0 and b for every pair of atoms
are obtained from a database available online at
http://www.ccp14.ac.uk/ccp/web-mirrors/i_d_brown/bond_valence_param/bvparm2006.ci
The interatomic distances between all the pairs of atoms in the bulk crystal are
calculated from the fractional coordinate information using the crystal structure.
For atoms in the surface layer, the exact atomic positions are calculated from the
surface relaxation information that is an input to the growth model. The relaxation
of the surface layer atoms (in presence of the solvent) can be measured experimen-
tally or predicted using molecular simulations. The amount of surface relaxation
201
Appendix A. Step-by-step Methodology for Crystal Morphology Prediction of Inorganic
Solids
is used to recalculate the distances between atoms in the surface and in the under-
neath layers. The bond valence sij shared between atoms i and j is calculated from
equation 2.4. The oxidation state qi,OS on the atoms i is calculated from equation
2.3. Equation 2.6 is used to obtain the normalized bond valence s′ij from sij , qi,OS
and the partial charge qi,actual of atom i in the bulk crystal obtained in step 2.
9. Input solvent structure information around surface sites: The solvent struc-
ture next to the crystal surface and near the spiral edges (parallel to the PBC
vectors) is required as an input to the model. There are three types of surface sites
(surface, edge and kink) that are relevant for the energy calculations. The number
of solvent molecules surrounding each type of surface site and their interatomic
distances from all the atoms in that surface site is needed to calculate the bond va-
lence shared between the surface site atoms and the atoms of the solvent molecule,
as well as the interaction energy between the surface growth unit and the solvent
molecules. Molecular simulations provide the solvent structure information (e.g.,
radial distribution function) around every type of surface site. Molecular simulation
packages such as LAMMPS [2] or DL POLY [3] can be used to obtain the solvent
structure information around a crystal surface. The bond valence parameters (R0
and b) for the atoms in the solvent molecule and the atoms in the crystalline solid
are also obtained from the bond valence parameter database. The bond valences s′ij
between the growth unit atoms and atoms of solvent molecules are also calculated
using step 8. The solvent structure information around a fully solvated growth
202
Appendix A. Step-by-step Methodology for Crystal Morphology Prediction of Inorganic
Solids
unit in bulk solution is also required for kink detachment work calculations. The
number of solvent molecules and their average distances from a fully solvated ion
can be obtained from molecular simulations or neutron diffraction experiments.
10. Calculate the partial charges for every surface species: The actual partial
charge on every atom in each surface site is calculated from equation 2.7 using the
bond valences calculated in steps 8 and 9.
11. Calculate kink site interaction energy with solid state neighbors: The
potential energy of a growth unit situated in a kink site on a step edge is calculated
using the space partitioning method discussed in Section 2.4.1. The space par-
titioning method allows easy calculation of the long-range electrostatic potential
energy of the kink site growth unit, while assigning different partial charges to the
atoms in bulk, surface or edge sites in the crystal lattice.
12. Calculate kink site interaction energy with solvent molecules: Only the
nearest neighbor interactions are considered for the calculation of the interaction
energy between the kink site growth unit and the solvent. A more accurate energy
calculation can be performed if the radial distribution function of all the atoms
within the solvent molecules is known (from molecular simulations or neutron scat-
tering measurements) for large distances away from the kink site. The number of
solvent molecules surrounding the kink site growth unit and their average distances
from the atoms within the kink site growth unit are known from step 9.
203
Appendix A. Step-by-step Methodology for Crystal Morphology Prediction of Inorganic
Solids
13. Calculate the kink detachment work ∆Wk for every kink site: The work
done to remove a growth unit from a kink site and solvate it is calculated from
equation 3.26. The kink site energies (Ukink) are calculated using steps 11 and 12.
The potential energy of a growth unit on the step edge located next to the kink
site position (Ustep) is calculated in the same way except that the partial charges
appropriate for atoms situated at the edge site are used for the central growth
unit. The potential energy of a fully solvated ion (Usolvated) is calculated from the
information about the solvation shell structure, i.e., the number of solvent molecules
around the solvated ion and their average distances from the atoms within the ion).
14. Input experimental growth conditions: The parameters relevant to the growth
experiments such as the solubility product Ksp , supersaturation S, the ratio of the
ionic activities r, and the solution composition xI, x
IIand x
III(see Section 3.4.2)
are needed as input to the crystal growth model. If the exact concentration of
the growth units in the solution is known, the activity coefficients γA,B
of an AB
type ionic solid is calculated from ionic strength calculation and Davies equation
as follows
I =1
2
(
cAz2A+ c
Bz2B
)
(A.2)
− log γA,B
= 0.5zAzB
( √I
1 +√I− 0.15I
)
(A.3)
where I is the ionic strength in moles per liter, ciis the molar concentration of ion
i in the growth medium in moles per liter, ziis the dimensionless charge on the ion
204
Appendix A. Step-by-step Methodology for Crystal Morphology Prediction of Inorganic
Solids
i (i = A,B). If the exact concentrations (cA, c
B) are not known and only Ksp and
S are specified, the mole fractions of the ions in the growth medium are estimated
from equation 3.20 by putting the activity coefficient as 1. The actual values of
the activity coefficients is then obtained iteratively by solving the above equations
along with equation 3.20.
15. Calculate kink rate on every spiral edge: The actual solubility product K ′
sp
near a spiral edge is calculated from equations 3.23 or 3.24. The quantities xeq and
Sx′ are calculated from equation B.4. An accurate estimation of the ratio of the
kink attachment rate constant of the cation to that of the anion (ξ) is also required
to calculate the kink rate. The kink attachment rate constants may be calculated
either from a molecular simulation using rare event methods, or by fitting the
measured step velocity to empirical rate laws. The kink rate u is calculated from
equation B.5 using the values of ξ, ∆Wk, xeq , Sx′ and S.
16. Calculate kink density on every spiral edge: For every PBC step edge on
any F face, the work required for thermal rearrangement of the step edge that
creates kink sites is calculated. The kink sites created from thermal fluctuations
follow Boltzmann distribution where the density of a kink site depends on the work
done for each rearrangement that creates that particular kink site. Work done in
rearrangement of a straight step edge involves the change in the potential energy of
four growth units as their configuration changes from edge sites to kink sites. The
partial charges of the atoms of each growth unit in these two configurations along
205
Appendix A. Step-by-step Methodology for Crystal Morphology Prediction of Inorganic
Solids
with the change in the solvent structure is accounted for to calculate the change
in the potential energy of each growth unit. The density of each kink site along
a spiral edge is calculated by counting all the microstates of edge rearrangements
that expose that particular kink site.
17. Calculate step velocity, critical length and spiral growth rate: The step
velocity v of a spiral edge is calculated using the kink rate u and kink density ρ
from equation 3.4. The critical length lc of a spiral edge is calculated using the
Gibbs-Thomson law, which dictates that lc is the minimum length of the edge
beyond which the addition of a growth unit to the edge makes the free energy
change negative. The critical length lc is calculated using the equation 3.29. Other
definitions of critical length have been suggested in the literature [4] and may be
used in step 17 as appropriate. The spiral growth rate G of that crystal face is
calculated from equations 3.3 and 3.2.
18. Predict the crystal shape: The steady-state growth shape of the crystal is
predicted from the growth rates of all the F faces (normalized with respect to the
slowest growing face) using the Frank-Chernov condition
R1
x1
=R
2
x2
= . . . =R
N−1
xN−1
= 1 (A.4)
where Riis the growth rate of face i relative to a reference (slowest growing) face,
xiis the normalized perpendicular distance from the center of the crystal to the
206
Appendix A. Step-by-step Methodology for Crystal Morphology Prediction of Inorganic
Solids
face i and N is the total number of F faces. The x values are used to construct the
steady state growth shape of the crystal.
207
Bibliography
[1] J. D. Gale and A. L. Rohl. The general utility lattice program (GULP). Mol. Simul.,29:291–341, 2003.
[2] S. Plimpton. Fast parallel algorithms for short-range molecular dynamics. J. Comput.Phys., 117:1 – 19, 1995.
[3] I. Todorov and W. Smith. The DL POLY 4 User Manual. STFC Daresbury Labora-tory, UK, 2013.
[4] J. P. Sizemore and M. F. Doherty. A stochastic model for the critical length of aspiral edge. J. Cryst. Growth, 312:785–792, 2010.
208
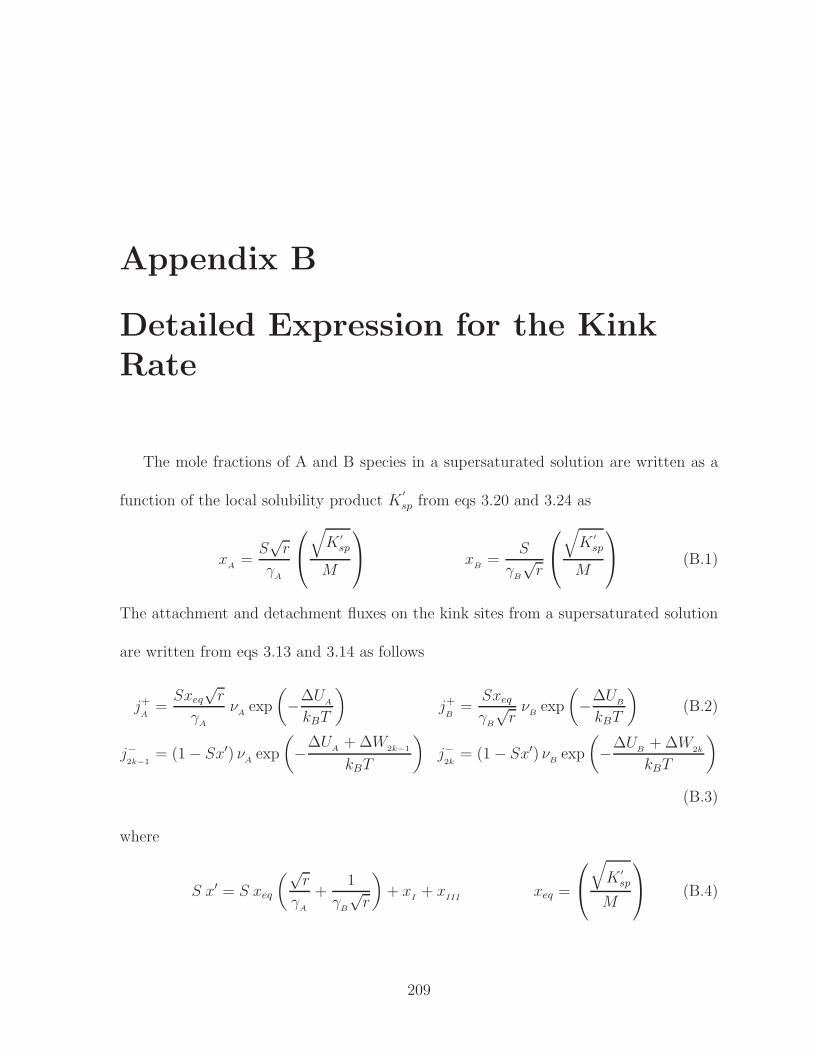
Appendix B
Detailed Expression for the KinkRate
The mole fractions of A and B species in a supersaturated solution are written as a
function of the local solubility product K′
sp from eqs 3.20 and 3.24 as
xA=
S√r
γA
√
K ′
sp
M
xB=
S
γB
√r
√
K ′
sp
M
(B.1)
The attachment and detachment fluxes on the kink sites from a supersaturated solution
are written from eqs 3.13 and 3.14 as follows
j+A=
Sxeq
√r
γA
νAexp
(
−∆UA
kBT
)
j+B=
Sxeq
γB
√rνBexp
(
−∆UB
kBT
)
(B.2)
j−2k−1
= (1− Sx′) νAexp
(
−∆UA+∆W
2k−1
kBT
)
j−2k
= (1− Sx′) νBexp
(
−∆UB+∆W
2k
kBT
)
(B.3)
where
S x′ = S xeq
(√r
γA
+1
γB
√r
)
+ xI+ x
IIIxeq =
√
K ′
sp
M
(B.4)
209
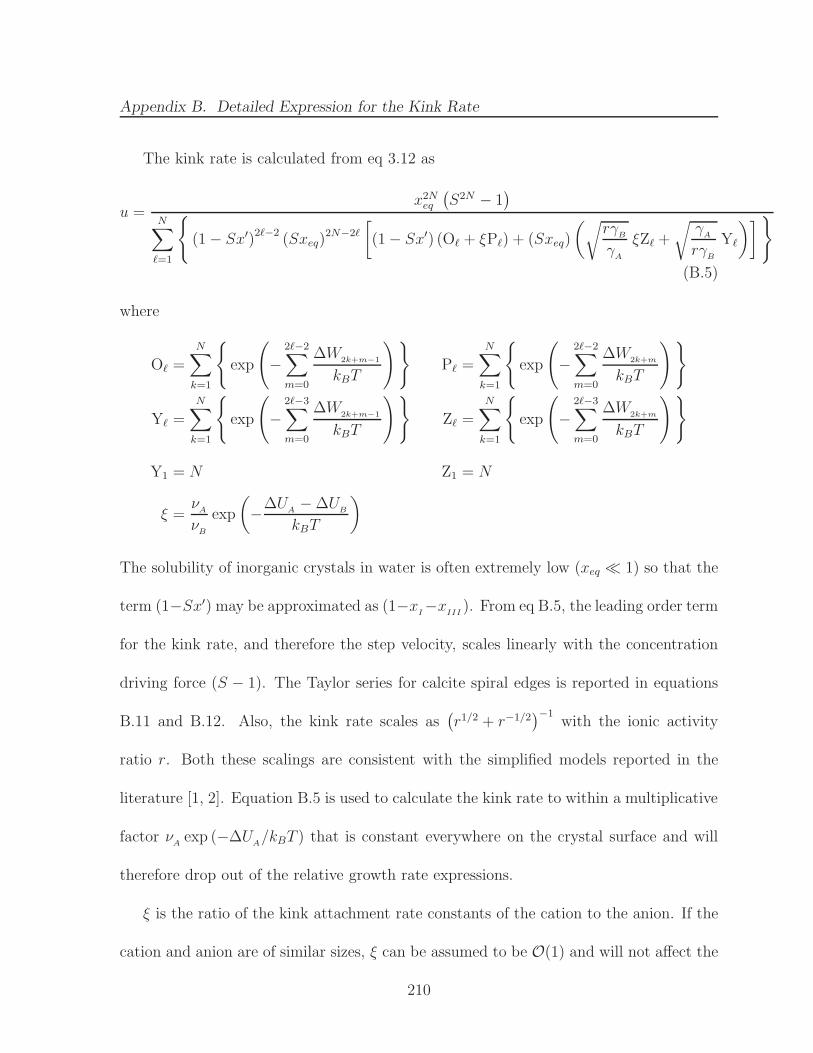
Appendix B. Detailed Expression for the Kink Rate
The kink rate is calculated from eq 3.12 as
u =x2Neq
(
S2N − 1)
N∑
ℓ=1
{
(1− Sx′)2ℓ−2
(Sxeq)2N−2ℓ
[
(1− Sx′) (Oℓ + ξPℓ) + (Sxeq)
(√
rγB
γA
ξZℓ +
√
γA
rγB
Yℓ
)]
}
(B.5)
where
Oℓ =
N∑
k=1
{
exp
(
−2ℓ−2∑
m=0
∆W2k+m−1
kBT
)}
Pℓ =
N∑
k=1
{
exp
(
−2ℓ−2∑
m=0
∆W2k+m
kBT
)}
Yℓ =N∑
k=1
{
exp
(
−2ℓ−3∑
m=0
∆W2k+m−1
kBT
)}
Zℓ =N∑
k=1
{
exp
(
−2ℓ−3∑
m=0
∆W2k+m
kBT
)}
Y1 = N Z1 = N
ξ =νA
νB
exp
(
−∆UA−∆U
B
kBT
)
The solubility of inorganic crystals in water is often extremely low (xeq ≪ 1) so that the
term (1−Sx′) may be approximated as (1−xI−x
III). From eq B.5, the leading order term
for the kink rate, and therefore the step velocity, scales linearly with the concentration
driving force (S − 1). The Taylor series for calcite spiral edges is reported in equations
B.11 and B.12. Also, the kink rate scales as(
r1/2 + r−1/2)
−1with the ionic activity
ratio r. Both these scalings are consistent with the simplified models reported in the
literature [1, 2]. Equation B.5 is used to calculate the kink rate to within a multiplicative
factor νAexp (−∆U
A/kBT ) that is constant everywhere on the crystal surface and will
therefore drop out of the relative growth rate expressions.
ξ is the ratio of the kink attachment rate constants of the cation to the anion. If the
cation and anion are of similar sizes, ξ can be assumed to be O(1) and will not affect the
210
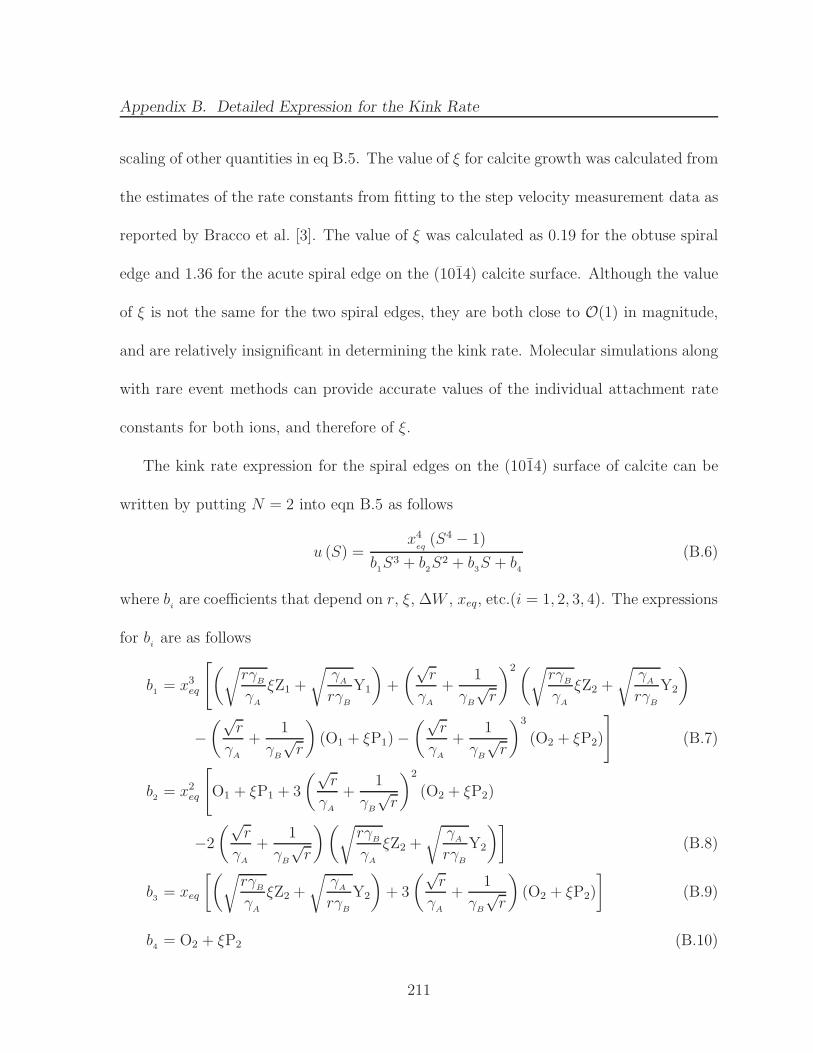
Appendix B. Detailed Expression for the Kink Rate
scaling of other quantities in eq B.5. The value of ξ for calcite growth was calculated from
the estimates of the rate constants from fitting to the step velocity measurement data as
reported by Bracco et al. [3]. The value of ξ was calculated as 0.19 for the obtuse spiral
edge and 1.36 for the acute spiral edge on the (1014) calcite surface. Although the value
of ξ is not the same for the two spiral edges, they are both close to O(1) in magnitude,
and are relatively insignificant in determining the kink rate. Molecular simulations along
with rare event methods can provide accurate values of the individual attachment rate
constants for both ions, and therefore of ξ.
The kink rate expression for the spiral edges on the (1014) surface of calcite can be
written by putting N = 2 into eqn B.5 as follows
u (S) =x4
eq(S4 − 1)
b1S3 + b
2S2 + b
3S + b
4
(B.6)
where biare coefficients that depend on r, ξ, ∆W , xeq, etc.(i = 1, 2, 3, 4). The expressions
for biare as follows
b1= x3
eq
[
(√
rγB
γA
ξZ1 +
√
γA
rγB
Y1
)
+
(√r
γA
+1
γB
√r
)2(√rγ
B
γA
ξZ2 +
√
γA
rγB
Y2
)
−(√
r
γA
+1
γB
√r
)
(O1 + ξP1)−(√
r
γA
+1
γB
√r
)3
(O2 + ξP2)
]
(B.7)
b2= x2
eq
[
O1 + ξP1 + 3
(√r
γA
+1
γB
√r
)2
(O2 + ξP2)
−2
(√r
γA
+1
γB
√r
)(√
rγB
γA
ξZ2 +
√
γA
rγB
Y2
)]
(B.8)
b3= xeq
[(√
rγB
γA
ξZ2 +
√
γA
rγB
Y2
)
+ 3
(√r
γA
+1
γB
√r
)
(O2 + ξP2)
]
(B.9)
b4= O2 + ξP2 (B.10)
211
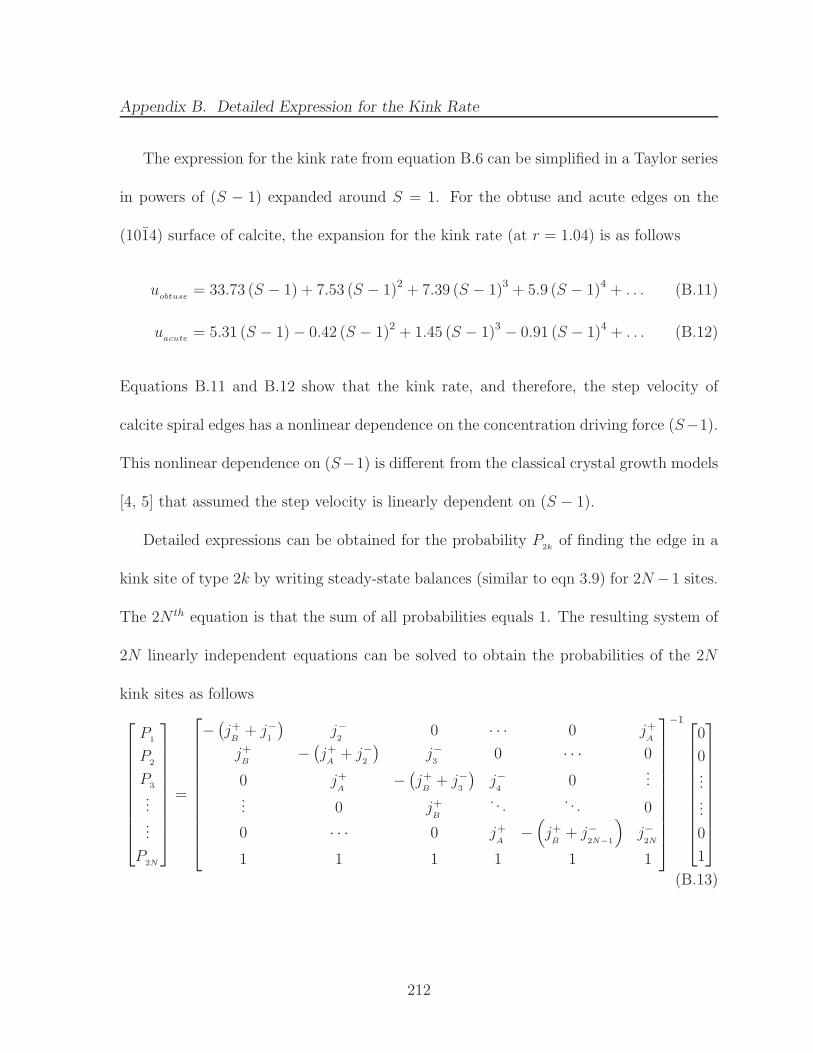
Appendix B. Detailed Expression for the Kink Rate
The expression for the kink rate from equation B.6 can be simplified in a Taylor series
in powers of (S − 1) expanded around S = 1. For the obtuse and acute edges on the
(1014) surface of calcite, the expansion for the kink rate (at r = 1.04) is as follows
uobtuse
= 33.73 (S − 1) + 7.53 (S − 1)2 + 7.39 (S − 1)3 + 5.9 (S − 1)4 + . . . (B.11)
uacute = 5.31 (S − 1)− 0.42 (S − 1)2 + 1.45 (S − 1)3 − 0.91 (S − 1)4 + . . . (B.12)
Equations B.11 and B.12 show that the kink rate, and therefore, the step velocity of
calcite spiral edges has a nonlinear dependence on the concentration driving force (S−1).
This nonlinear dependence on (S−1) is different from the classical crystal growth models
[4, 5] that assumed the step velocity is linearly dependent on (S − 1).
Detailed expressions can be obtained for the probability P2k
of finding the edge in a
kink site of type 2k by writing steady-state balances (similar to eqn 3.9) for 2N −1 sites.
The 2N th equation is that the sum of all probabilities equals 1. The resulting system of
2N linearly independent equations can be solved to obtain the probabilities of the 2N
kink sites as follows
P1
P2
P3
...
...
P2N
=
−(
j+B+ j−
1
)
j−2
0 · · · 0 j+A
j+B
−(
j+A+ j−
2
)
j−3
0 · · · 0
0 j+A
−(
j+B+ j−
3
)
j−4
0...
... 0 j+B
. . .. . . 0
0 · · · 0 j+A
−(
j+B+ j−
2N−1
)
j−2N
1 1 1 1 1 1
−1
0
0......
0
1
(B.13)
212
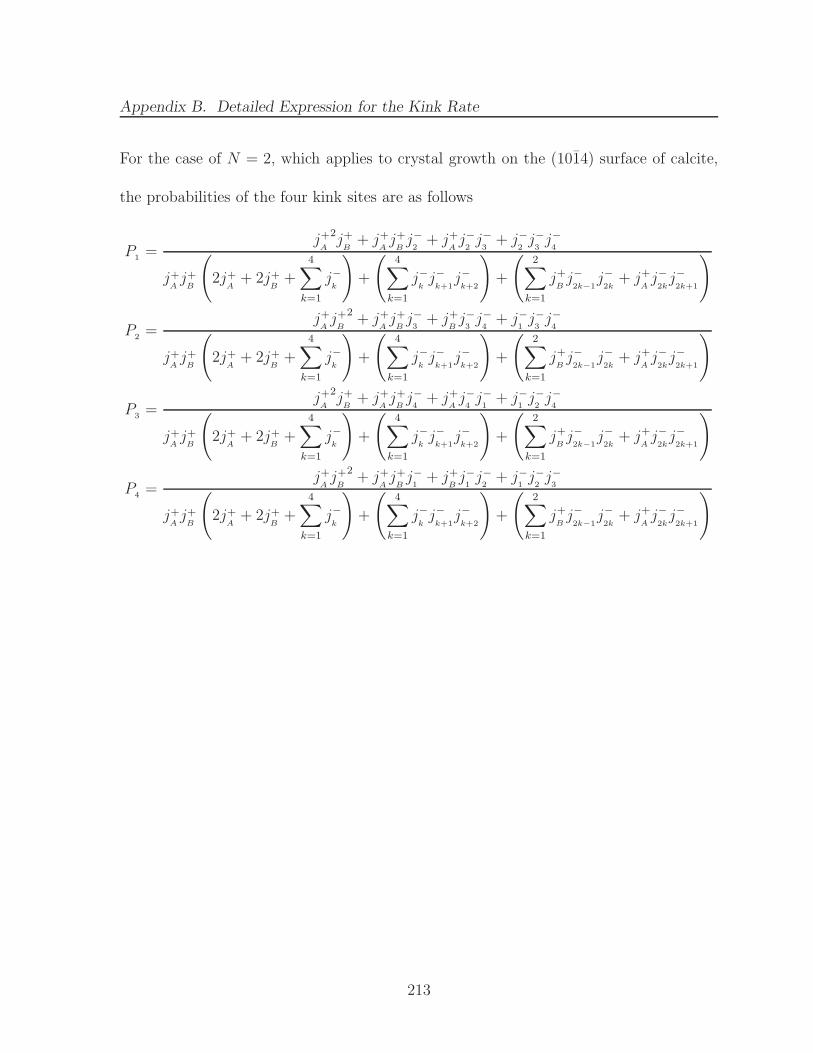
Appendix B. Detailed Expression for the Kink Rate
For the case of N = 2, which applies to crystal growth on the (1014) surface of calcite,
the probabilities of the four kink sites are as follows
P1=
j+A
2j+B+ j+
Aj+Bj−2+ j+
Aj−2j−3+ j−
2j−3j−4
j+Aj+B
(
2j+A+ 2j+
B+
4∑
k=1
j−k
)
+
(
4∑
k=1
j−kj−k+1
j−k+2
)
+
(
2∑
k=1
j+Bj−2k−1
j−2k+ j+
Aj−2kj−2k+1
)
P2=
j+Aj+B
2+ j+
Aj+Bj−3+ j+
Bj−3j−4+ j−
1j−3j−4
j+Aj+B
(
2j+A+ 2j+
B+
4∑
k=1
j−k
)
+
(
4∑
k=1
j−kj−k+1
j−k+2
)
+
(
2∑
k=1
j+Bj−2k−1
j−2k+ j+
Aj−2kj−2k+1
)
P3=
j+A
2j+B+ j+
Aj+Bj−4+ j+
Aj−4j−1+ j−
1j−2j−4
j+Aj+B
(
2j+A+ 2j+
B+
4∑
k=1
j−k
)
+
(
4∑
k=1
j−kj−k+1
j−k+2
)
+
(
2∑
k=1
j+Bj−2k−1
j−2k+ j+
Aj−2kj−2k+1
)
P4=
j+Aj+B
2+ j+
Aj+Bj−1+ j+
Bj−1j−2+ j−
1j−2j−3
j+Aj+B
(
2j+A+ 2j+
B+
4∑
k=1
j−k
)
+
(
4∑
k=1
j−kj−k+1
j−k+2
)
+
(
2∑
k=1
j+Bj−2k−1
j−2k+ j+
Aj−2kj−2k+1
)
213
Bibliography
[1] J. Zhang and G. H. Nancollas. Kink density and rate of step movement during growthand dissolution of an AB crystal in a nonstoichiometric solution. J. Colloid InterfaceSci., 200:131 – 145, 1998.
[2] A. Chernov, E. Petrova, and L. Rashkovich. Dependence of the CaOx and MgOx
growth rate on solution stoichiometry. Non-Kossel crystal growth. J. Cryst. Growth,289:245 – 254, 2006.
[3] J. N. Bracco, M. C. Grantham, and A. G. Stack. Calcite Growth Rates As a Functionof Aqueous Calcium-to-Carbonate Ratio, Saturation Index, and Inhibitor Concentra-tion: Insight into the Mechanism of Reaction and Poisoning by Strontium. Cryst.Growth Des., 12:3540–3548, 2012.
[4] W. K. Burton, N. Cabrera, and F. C. Frank. The growth of crystals and the equilib-rium structure of their surfaces. Phil. Trans. Roy. Soc. A, 243:299–358, 1951.
[5] A. A. Chernov. Modern Crystallography III. Crystal Growth. Berlin: Springer-Verlag,1984.
214
Appendix C
Time Scale Comparison betweenEdge Rearrangement and KinkIncorporation
The model developed here to calculate the step velocity assumes that the rearrange-
ment of the step edge structure happens on a time scale that is much faster than the
rate at which growth units incorporate into the kink sites present along the step edge.
Therefore, the edge structure is governed by the most probable equilibrium distribution
(i.e., Boltzmann distribution) and the density of kink sites along the edge depends only
on the energy required for edge rearrangement. To verify this assumption, a comparison
of characteristic time scales for edge rearrangement (τrea) and kink incorporation (τinc)
was carried out. The time scale estimation is performed for a simpler case of a single
type of kink site present along the edge, which corresponds to the crystal growth of cen-
trosymmetric molecules. This simplification allows us to make useful predictions, with
relative ease, of the time scales of the two processes involved. The inferences drawn from
215
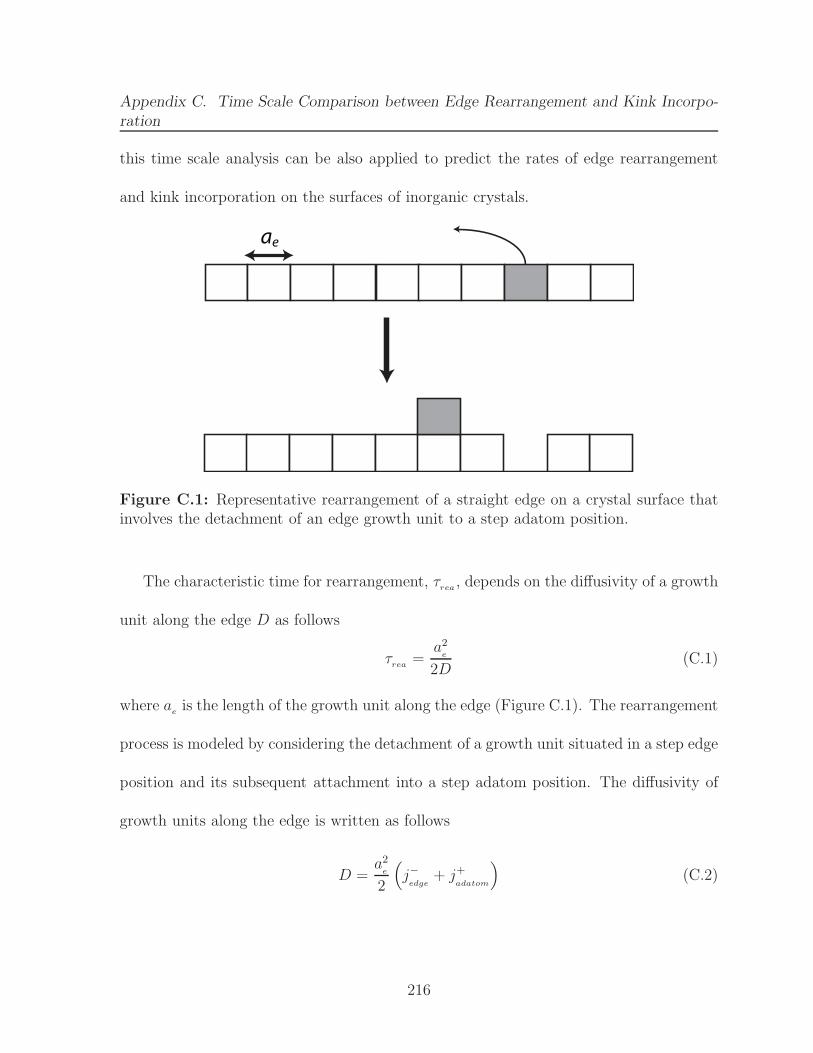
Appendix C. Time Scale Comparison between Edge Rearrangement and Kink Incorpo-
ration
this time scale analysis can be also applied to predict the rates of edge rearrangement
and kink incorporation on the surfaces of inorganic crystals.
ae
Figure C.1: Representative rearrangement of a straight edge on a crystal surface thatinvolves the detachment of an edge growth unit to a step adatom position.
The characteristic time for rearrangement, τrea , depends on the diffusivity of a growth
unit along the edge D as follows
τrea =a2
e
2D(C.1)
where ae is the length of the growth unit along the edge (Figure C.1). The rearrangement
process is modeled by considering the detachment of a growth unit situated in a step edge
position and its subsequent attachment into a step adatom position. The diffusivity of
growth units along the edge is written as follows
D =a2
e
2
(
j−edge
+ j+adatom
)
(C.2)
216
Appendix C. Time Scale Comparison between Edge Rearrangement and Kink Incorpo-
ration
where j−edge
and j+adatom
are the detachment and attachment fluxes from the edge and step
adatom positions, respectively. ae has units of nm or A, D has units of nm2.s−1 and the
fluxes have units of s−1.
The characteristic time for kink incorporation, τinc, depends on the net rate of at-
tachment into a kink site.
τinc
=1
j+kink
− j−kink
(C.3)
The ratio of the two time scales is written as follows
τreaτinc
=j+kink
− j−kink
j−edge
+ j+adatom
(C.4)
The kink site attachment and detachment fluxes for centrosymmetric growth units
are written as follows
j+kink
= Sxeqν exp
(
−∆U
kBT
)
j−kink
= (1− Sxeq)ν exp
(
−∆U +∆W
kBT
)
(C.5)
At equilibrium, supersaturation S = 1, and the attachment and detachment fluxes from
the kink site must be equal. This results in a relationship between solubility xeq and the
kink detachment work ∆W as follows
xeq =1
1 + exp (∆W/kBT )(C.6)
The ratio j+kink
/j−kink
is written as follows
j+kink
j−kink
=S e
∆W/kBT
1− S + e∆W/kBT
(C.7)
The attachment fluxes to any surface site depends primarily upon the supersaturation
and an energy barrier that depends on the desolvation of the incoming growth unit [1, 2].
217
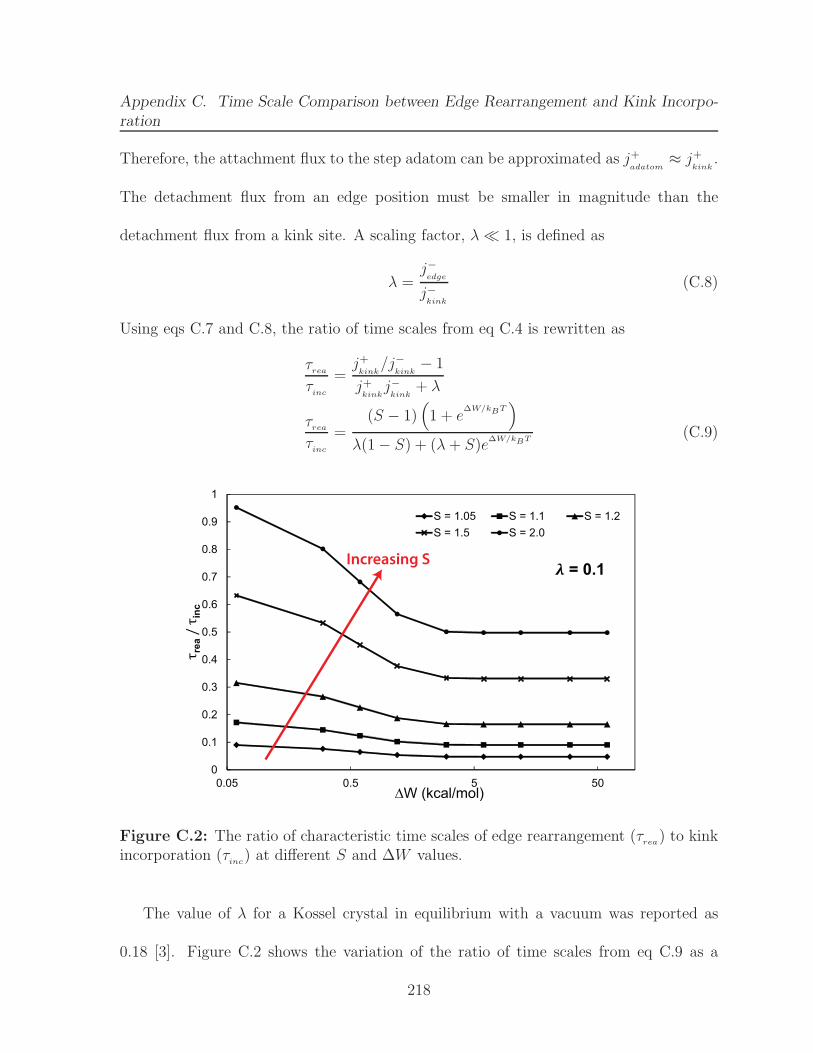
Appendix C. Time Scale Comparison between Edge Rearrangement and Kink Incorpo-
ration
Therefore, the attachment flux to the step adatom can be approximated as j+adatom
≈ j+kink
.
The detachment flux from an edge position must be smaller in magnitude than the
detachment flux from a kink site. A scaling factor, λ ≪ 1, is defined as
λ =j−edge
j−kink
(C.8)
Using eqs C.7 and C.8, the ratio of time scales from eq C.4 is rewritten as
τreaτinc
=j+kink
/j−kink
− 1
j+kink
j−kink
+ λ
τreaτinc
=(S − 1)
(
1 + e∆W/kBT
)
λ(1− S) + (λ+ S)e∆W/kBT
(C.9)
0
0.1
0.2
0.3
0.4
0.5
0.6
0.7
0.8
0.9
1
0.05 0.5 5 50
τre
a/
τin
c
∆W (kcal/mol)
λ = 0.1
S = 1.05 S = 1.1 S = 1.2
S = 1.5 S = 2.0
Increasing S
Figure C.2: The ratio of characteristic time scales of edge rearrangement (τrea) to kinkincorporation (τ
inc) at different S and ∆W values.
The value of λ for a Kossel crystal in equilibrium with a vacuum was reported as
0.18 [3]. Figure C.2 shows the variation of the ratio of time scales from eq C.9 as a
218
Appendix C. Time Scale Comparison between Edge Rearrangement and Kink Incorpo-
ration
function of the kink detachment work (∆W ) at λ = 0.1 for different values of S. At low
supersaturations (S ≤ 1.2), the time required for the edge to rearrange is much smaller
than the time required for a growth unit to be incorporated into a kink site. This is true
for all values of ∆W . However, at larger supersaturations (S > 1.2), the rate of kink
incorporation becomes faster and starts competing with the rearrangement process such
that the edge structure is no longer in quasi-equilibrium with a vacuum.
It is well known that for solution grown crystals, growth units in a kink site position
are solvated to a greater extent than those in an edge site [4, 5]. Therefore, the process of
dissolution and complete solvation should occur at a faster rate from a kink site position
than from an edge site. Hence, the assumption that λ ≪ 1 should also hold for solution
grown crystals. For calcite crystals grown from an aqueous solution, the values of ∆W
on the spiral edges of the (1014) surface are in the range 10-40 kcal/mol (Table 3.2).
At low supersaturations (S ≤ 1.2), the rearrangement is 5-10 times faster than kink
incorporation on those spiral edges. However, the spiral edges on a calcite crystal surface
will not undergo fast rearrangement at S > 1.2. The step velocity model derived in
Chapters 2 and 3 will need to be modified in this supersaturation range to account for
the two processes - edge rearrangement and kink incorporation, occurring simultaneously.
219
Bibliography
[1] I. V. Markov. Crystal Growth for Beginners, Fundamentals of Nucleation, CrystalGrowth and Epitaxy. World Scientific: Singapore, 2003.
[2] P. G. Vekilov. What determines the rate of growth of crystals from solution? Cryst.Growth Des., 7:2796–2810, 2007.
[3] B. Mutaftschiev. The Atomistic Nature of Crystal Growth. Springer-Verlag: Berlin,2001.
[4] A. G. Stack. Molecular Dynamics Simulations of Solvation and Kink Site Formationat the {001} Barite-Water Interface. J. Phys. Chem. C, 113:2104–2110, 2009.
[5] M. Wolthers, D. Di Tommaso, Z. Du, and N. H. de Leeuw. Calcite surface structureand reactivity: Molecular dynamics simulations and macroscopic surface modellingof the calcite-water interface. Phys. Chem. Chem. Phys., 14:15145–15157, 2012.
220
Appendix D
Modification of Surface Charges forPolarity Stabilization
A polar crystal surface is defined to possess a non-zero dipole moment perpendicular
to the plane of the surface [1, 2]. This dipole moment results in the divergence of the
surface energy of a polar crystal surface [3], thereby destabilizing the surface. This
appendix discusses the instability caused by the arrangement of ions in the surface layers
using the fundamentals of electrostatics.
The electrostatic potential or electric field at any point P above a Tasker type 3 [1]
crystal surface can be calculated by making certain assumptions about the arrangement
of the ions within the layers parallel to the surface. If the distance between the ions
within each layer is much smaller than the distance between the point P and the layers,
each atomic layer can be approximated by an infinitely long flat plane with a uniform
charge density σ (Figure D.1). σ has units of Coulombs per m2 or C.m−2. The charge
density σ will depend on the partial charges of the ions that lie within each layer and the
distances between the ions.
221
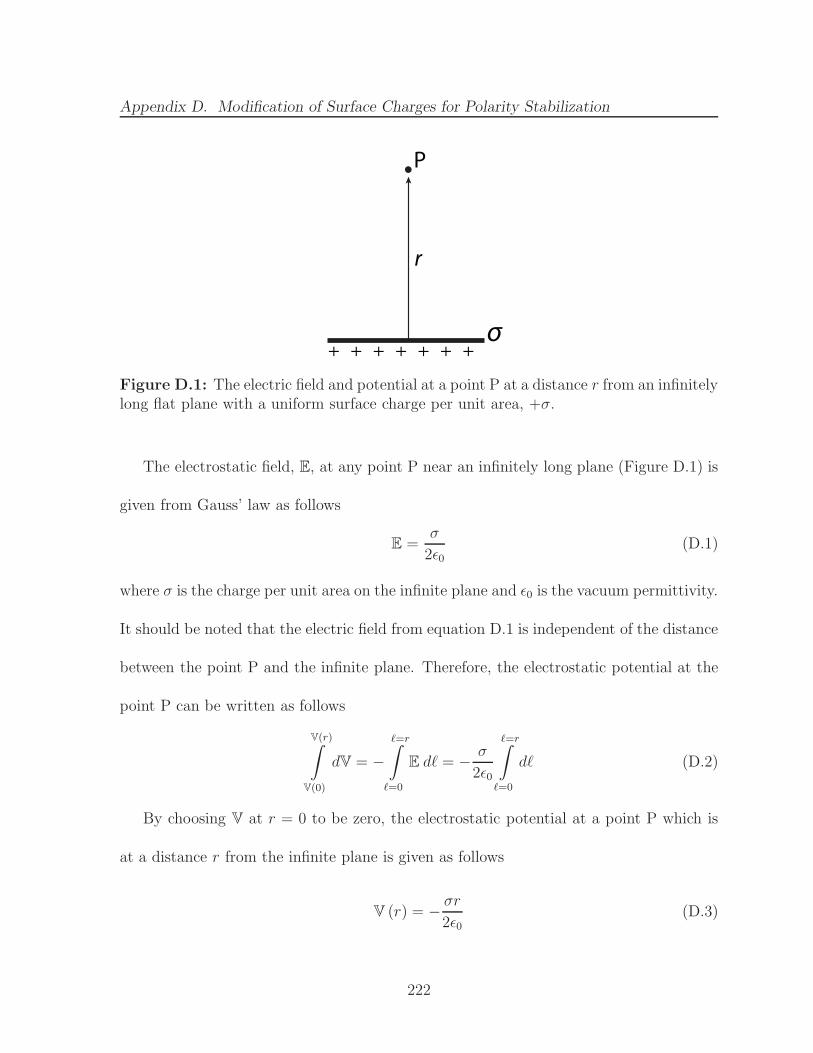
Appendix D. Modification of Surface Charges for Polarity Stabilization
P
σ
r
+ + + + + + +
Figure D.1: The electric field and potential at a point P at a distance r from an infinitelylong flat plane with a uniform surface charge per unit area, +σ.
The electrostatic field, E, at any point P near an infinitely long plane (Figure D.1) is
given from Gauss’ law as follows
E =σ
2ǫ0(D.1)
where σ is the charge per unit area on the infinite plane and ǫ0 is the vacuum permittivity.
It should be noted that the electric field from equation D.1 is independent of the distance
between the point P and the infinite plane. Therefore, the electrostatic potential at the
point P can be written as follows
V(r)∫
V(0)
dV = −ℓ=r∫
ℓ=0
E dℓ = − σ
2ǫ0
ℓ=r∫
ℓ=0
dℓ (D.2)
By choosing V at r = 0 to be zero, the electrostatic potential at a point P which is
at a distance r from the infinite plane is given as follows
V (r) = − σr
2ǫ0(D.3)
222
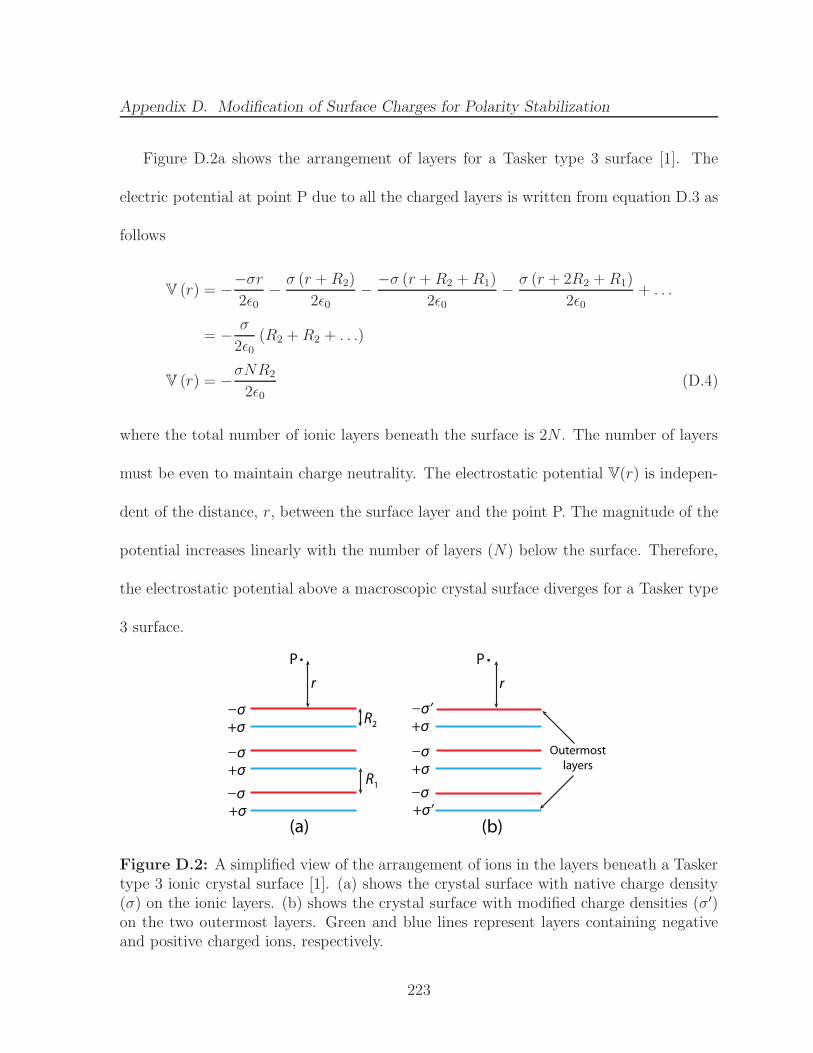
Appendix D. Modification of Surface Charges for Polarity Stabilization
Figure D.2a shows the arrangement of layers for a Tasker type 3 surface [1]. The
electric potential at point P due to all the charged layers is written from equation D.3 as
follows
V (r) = −−σr
2ǫ0− σ (r +R2)
2ǫ0− −σ (r +R2 +R1)
2ǫ0− σ (r + 2R2 +R1)
2ǫ0+ . . .
= − σ
2ǫ0(R2 +R2 + . . .)
V (r) = −σNR2
2ǫ0(D.4)
where the total number of ionic layers beneath the surface is 2N . The number of layers
must be even to maintain charge neutrality. The electrostatic potential V(r) is indepen-
dent of the distance, r, between the surface layer and the point P. The magnitude of the
potential increases linearly with the number of layers (N) below the surface. Therefore,
the electrostatic potential above a macroscopic crystal surface diverges for a Tasker type
3 surface.
R2+σ
_σ
(a) (b)
P
r
P
r
+σ
_σ
+σ
_σ
+σ
_σ’
+σ
_σ
+σ’
_σR1
Outermostlayers
Figure D.2: A simplified view of the arrangement of ions in the layers beneath a Taskertype 3 ionic crystal surface [1]. (a) shows the crystal surface with native charge density(σ) on the ionic layers. (b) shows the crystal surface with modified charge densities (σ′)on the two outermost layers. Green and blue lines represent layers containing negativeand positive charged ions, respectively.
223
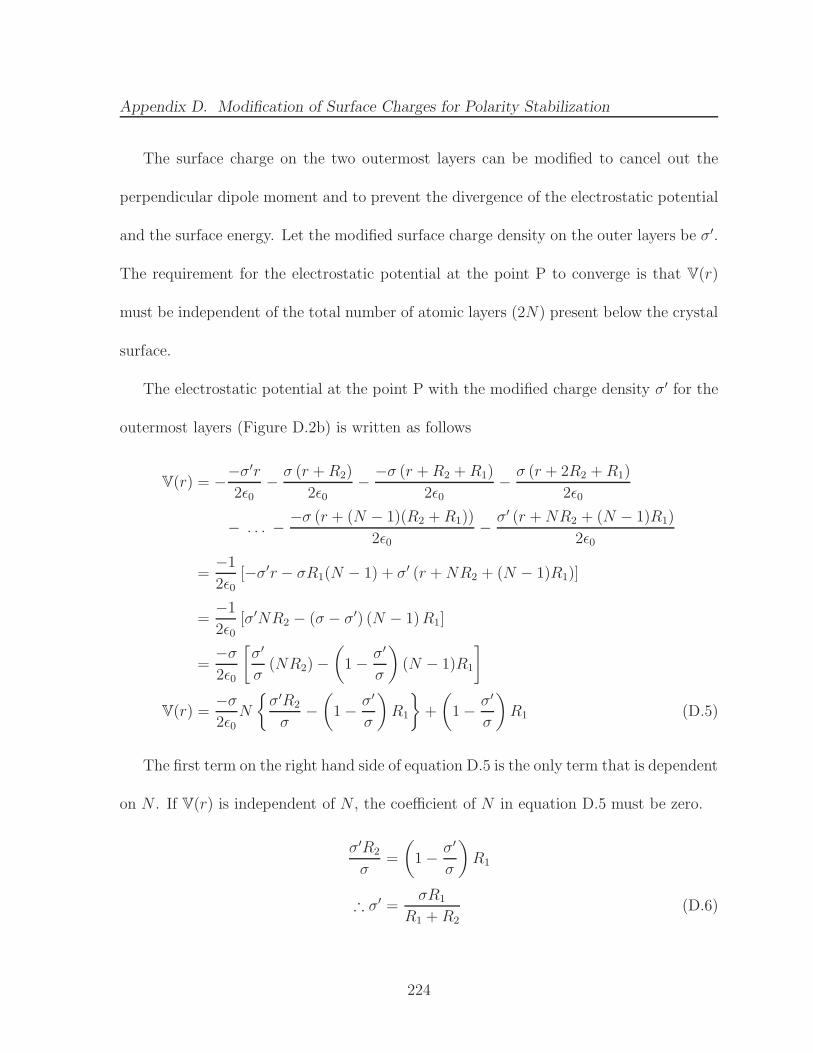
Appendix D. Modification of Surface Charges for Polarity Stabilization
The surface charge on the two outermost layers can be modified to cancel out the
perpendicular dipole moment and to prevent the divergence of the electrostatic potential
and the surface energy. Let the modified surface charge density on the outer layers be σ′.
The requirement for the electrostatic potential at the point P to converge is that V(r)
must be independent of the total number of atomic layers (2N) present below the crystal
surface.
The electrostatic potential at the point P with the modified charge density σ′ for the
outermost layers (Figure D.2b) is written as follows
V(r) = −−σ′r
2ǫ0− σ (r +R2)
2ǫ0− −σ (r +R2 +R1)
2ǫ0− σ (r + 2R2 +R1)
2ǫ0
− . . . − −σ (r + (N − 1)(R2 +R1))
2ǫ0− σ′ (r +NR2 + (N − 1)R1)
2ǫ0
=−1
2ǫ0[−σ′r − σR1(N − 1) + σ′ (r +NR2 + (N − 1)R1)]
=−1
2ǫ0[σ′NR2 − (σ − σ′) (N − 1)R1]
=−σ
2ǫ0
[
σ′
σ(NR2)−
(
1− σ′
σ
)
(N − 1)R1
]
V(r) =−σ
2ǫ0N
{
σ′R2
σ−(
1− σ′
σ
)
R1
}
+
(
1− σ′
σ
)
R1 (D.5)
The first term on the right hand side of equation D.5 is the only term that is dependent
on N . If V(r) is independent of N , the coefficient of N in equation D.5 must be zero.
σ′R2
σ=
(
1− σ′
σ
)
R1
∴ σ′ =σR1
R1 + R2(D.6)
224
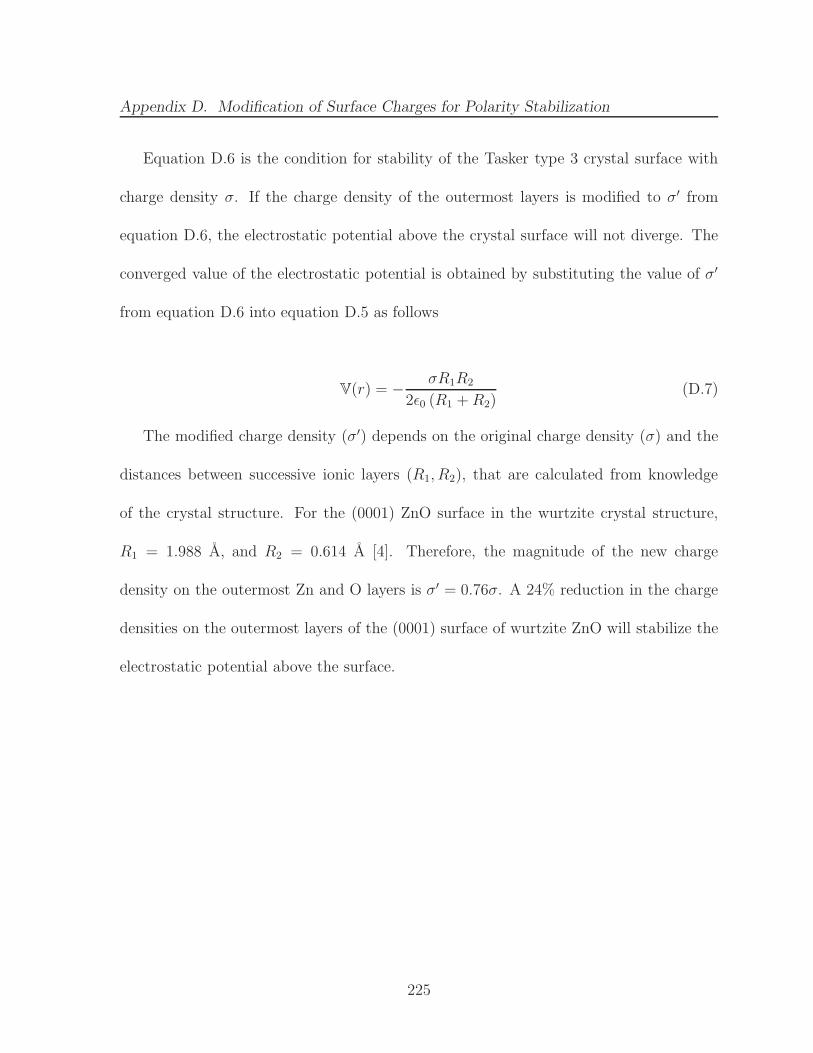
Appendix D. Modification of Surface Charges for Polarity Stabilization
Equation D.6 is the condition for stability of the Tasker type 3 crystal surface with
charge density σ. If the charge density of the outermost layers is modified to σ′ from
equation D.6, the electrostatic potential above the crystal surface will not diverge. The
converged value of the electrostatic potential is obtained by substituting the value of σ′
from equation D.6 into equation D.5 as follows
V(r) = − σR1R2
2ǫ0 (R1 +R2)(D.7)
The modified charge density (σ′) depends on the original charge density (σ) and the
distances between successive ionic layers (R1, R2), that are calculated from knowledge
of the crystal structure. For the (0001) ZnO surface in the wurtzite crystal structure,
R1 = 1.988 A, and R2 = 0.614 A [4]. Therefore, the magnitude of the new charge
density on the outermost Zn and O layers is σ′ = 0.76σ. A 24% reduction in the charge
densities on the outermost layers of the (0001) surface of wurtzite ZnO will stabilize the
electrostatic potential above the surface.
225
Bibliography
[1] P. W. Tasker. The stability of ionic crystal surfaces. J. Phys. C Solid State, 12:4977,1979.
[2] C. Noguera. Polar oxide surfaces. J. Phys.: Condens. Matter, 12:R367, 2000.
[3] F. Bertaut. L’Energie Electrostatique De Reseaux Ioniques. J. Phys. et le Radium,13:499–505, 1952.
[4] K. Kihara and G. Donnay. Anharmonic thermal vibrations in ZnO. Can. Mineral.,23:647–654, 1985.
226
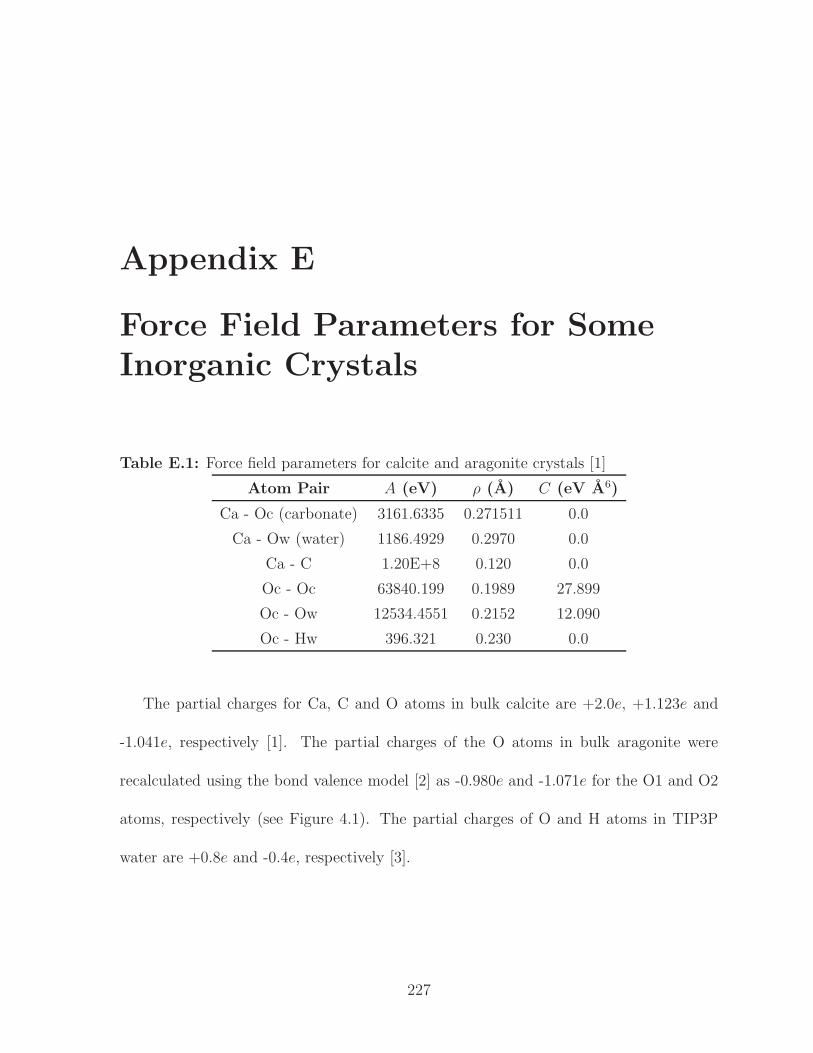
Appendix E
Force Field Parameters for SomeInorganic Crystals
Table E.1: Force field parameters for calcite and aragonite crystals [1]
Atom Pair A (eV) ρ (A) C (eV A6)
Ca - Oc (carbonate) 3161.6335 0.271511 0.0
Ca - Ow (water) 1186.4929 0.2970 0.0
Ca - C 1.20E+8 0.120 0.0
Oc - Oc 63840.199 0.1989 27.899
Oc - Ow 12534.4551 0.2152 12.090
Oc - Hw 396.321 0.230 0.0
The partial charges for Ca, C and O atoms in bulk calcite are +2.0e, +1.123e and
-1.041e, respectively [1]. The partial charges of the O atoms in bulk aragonite were
recalculated using the bond valence model [2] as -0.980e and -1.071e for the O1 and O2
atoms, respectively (see Figure 4.1). The partial charges of O and H atoms in TIP3P
water are +0.8e and -0.4e, respectively [3].
227
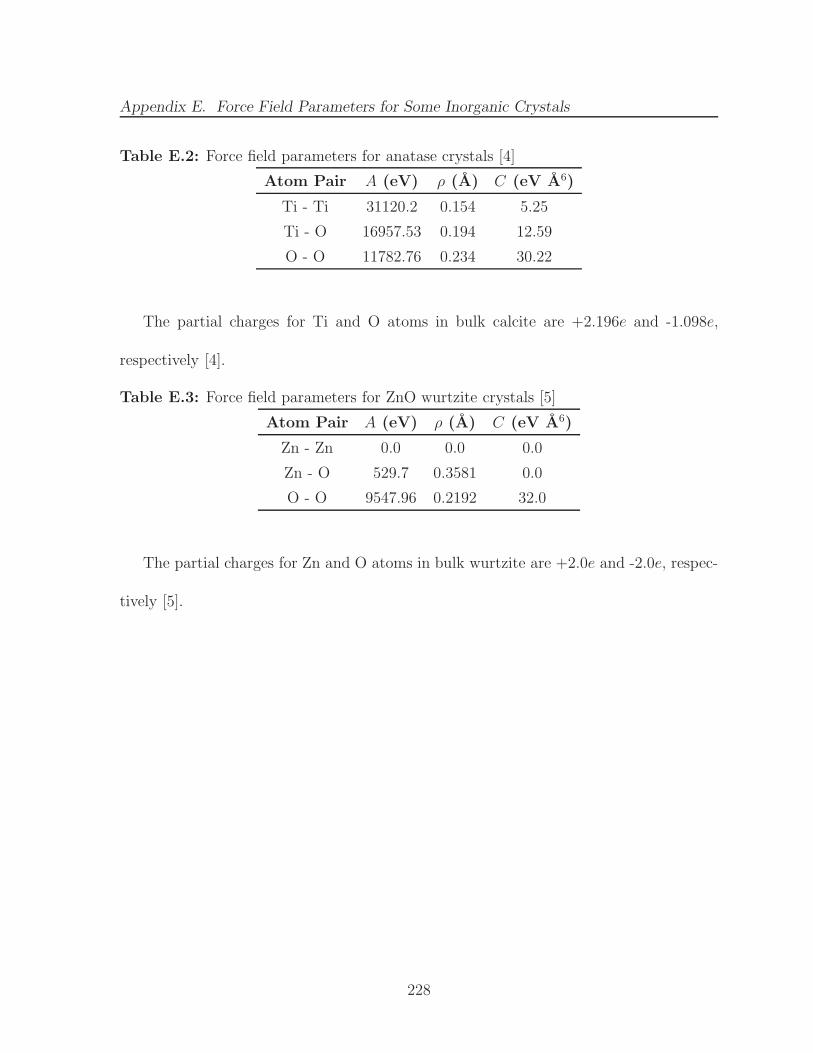
Appendix E. Force Field Parameters for Some Inorganic Crystals
Table E.2: Force field parameters for anatase crystals [4]
Atom Pair A (eV) ρ (A) C (eV A6)
Ti - Ti 31120.2 0.154 5.25
Ti - O 16957.53 0.194 12.59
O - O 11782.76 0.234 30.22
The partial charges for Ti and O atoms in bulk calcite are +2.196e and -1.098e,
respectively [4].
Table E.3: Force field parameters for ZnO wurtzite crystals [5]
Atom Pair A (eV) ρ (A) C (eV A6)
Zn - Zn 0.0 0.0 0.0
Zn - O 529.7 0.3581 0.0
O - O 9547.96 0.2192 32.0
The partial charges for Zn and O atoms in bulk wurtzite are +2.0e and -2.0e, respec-
tively [5].
228
Bibliography
[1] P. Raiteri, J. D. Gale, D. Quigley, and P. M. Rodger. Derivation of an accurateforce-field for simulating the growth of calcium carbonate from aqueous solution: Anew model for the calcite-water interface. J. Phys. Chem. C, 114:5997–6010, 2010.
[2] I. D. Brown. The Chemical Bond in Inorganic Chemsitry: The Bond Valence Model.Oxford University Press, 2002.
[3] W. L. Jorgensen, J. Chandrasekhar, J. D. Madura, R. W. Impey, and M. L. Klein.Comparison of simple potential functions for simulating liquid water. J. Chem. Phys.,79:926–935, 1983.
[4] P. M. Oliver, G. W. Watson, E. Toby Kelsey, and S. C. Parker. Atomistic simulationof the surface structure of the TiO2 polymorphs rutile and anatase. J. Mater. Chem.,7:563–568, 1997.
[5] A. J. Kulkarni, M. Zhou, and F. J. Ke. Orientation and size dependence of the elasticproperties of zinc oxide nanobelts. Nanotechnology, 16:2749, 2005.
229
Related Documents


![arXiv:1608.04782v3 [cond-mat.mtrl-sci] 24 Mar 2017Universal Fragment Descriptors for Predicting Properties of Inorganic Crystals Olexandr Isayev,1, Corey Oses,2 Cormac Toher,2 Eric](https://static.cupdf.com/doc/110x72/5fb8de806affe737fd628f70/arxiv160804782v3-cond-matmtrl-sci-24-mar-2017-universal-fragment-descriptors.jpg)

