United States Department of Agriculture Forest Service Rocky Mountain Research Station Research Paper Report RMRS-RP-66WWW June 2007 Modeling Snag Dynamics in Northern Arizona Mixed-Conifer and Ponderosa Pine Forests Joseph L. Ganey and Scott C. Vojta

Welcome message from author
This document is posted to help you gain knowledge. Please leave a comment to let me know what you think about it! Share it to your friends and learn new things together.
Transcript

United StatesDepartmentof Agriculture
Forest Service
Rocky MountainResearch Station
Research Paper Report RMRS-RP-66WWW
June 2007
Modeling Snag Dynamics in Northern Arizona Mixed-Conifer
and Ponderosa Pine ForestsJoseph L. Ganey and Scott C. Vojta
Rocky Mountain Research StationNatural Resources Research Center
2150 Centre Avenue, Building AFort Collins, CO 80526
Ganey, Joseph L.; Vojta, Scott C. 2007. Modeling snag dynamics in northern Arizona mixed-conifer and pon-derosa pine forests. Res. Pap. RMRS-RP-66WWW. Fort Collins, CO: U.S. Department of Agriculture, Forest Service, Rocky Mountain Research Station. 15 p.
Abstract __________________________________________________ Snags (standing dead trees) are important components of forested habitats that contribute to ecological decay and recycling processes as well as providing habitat for many life forms. As such, snags are of special interest to land managers, but information on dynamics of snag populations is lacking. We modeled trends in snag populations in mixed-conifer and ponderosa pine (Pinus ponderosa) forests in northern Arizona using a Leslie matrix model developed by Raphael and Morrison (1987). Models were parameterized using data on snag abundance in five decay classes in 2002, transition rates of snags among decay classes from 1997 to 2002, and recruitment of snags into these decay classes from 1997 to 2002. Snags were sampled on randomly located, 1-ha plots (n = 52 and 58 plots in mixed-conifer and ponderosa pine, respectively). These plots covered the entire elevational gradient occupied by these forest types and a wide range of stand conditions in both forest types. Trends were modeled separately for each forest type over a 30-yr time horizon. The models predicted that over this period: 1) overall snag densities would increase in both forest types, 2) densities of large snags would increase in both forest types, 3) despite these increases, densities of large snags would remain below target densities in both forest types, and 4) species composition and decay-class distributions would change only slightly in both forest types. The models described here were derived from snag data averaged over large landscapes and a wide range of stand conditions within forest types. These models thus are not suitable for modeling snag dynamics at the stand level, but rather provide a means for coarse-scale modeling of snag dynamics over large landscapes. Future inventories of snags on these plots (planned at five-year intervals) will provide a means to both test and improve model predictions.
Keywords: snags, forest habitats, mixed-conifer forest, ponderosa pine, Pinus ponderosa, matrix model
The Authors
Joseph L. Ganey is a Research Wildlife Biologist with the Rocky Mountain Research Station, Flagstaff, Arizona.
Scott C. Vojta is a Biological Technician with the Rocky Mountain Research Station, Flagstaff, Arizona, with over 30 years of experience in sampling forest vegetation.
Cover photo: Ponderosa pine snags in varying stages of decay near Roundup Park, Coconino National Forest, Arizona.
RMRS Publishing Services Telephone (970)498-1392 FAX (970) 498-1122 E-mail [email protected] Web site http://www.fs.fed.us/rmrs Mailing Address Publications Distribution RockyMountainResearchStation 240W.ProspectRoad FortCollins,CO80526

�USDA Forest Service Res. Pap. RMRS-RP-66WWW. 2007
Modeling Snag Dynamics in Northern Arizona Mixed-Conifer
and Ponderosa Pine Forests
Joseph L. Ganey and Scott C. Vojta
Introduction
Snags (standing dead trees) provide important resources for numerous species of native wildlife as well as important contributions to decay dynam-ics and ecological processes in the forests where they occur (Thomas and others �979, Davis and others �983, Raphael and White �984, Harmon and others �986, Bull and others �997, Laudenslayer and others 2002). Most National Forests have regulations requiring the retention of specified types and densities of snags to provide habitat for native wildlife (Morrison and others �986), and managers therefore are particularly concerned with maintaining snag populations (Mellen and others 2002). Despite these mandates for snag management, data on snag types and densities on Na-tional Forest lands often are sparse. Further, maintaining target densities of snags is difficult even when current snag densities are known, because snag dynamics are not well understood in most forest types and geographic areas (e.g., Everett and others �999), and they typically exhibit large spatial (Harris �999, Ohmann and Waddell 2002, Skinner 2002, Stephens 2004, Ganey and Vojta 2005) and temporal variability (Morrison and Raphael �993, Everett and others �999, Lehmkuhl and others 2003). We established a series of permanent plots in mixed-conifer and ponderosa pine (Pinus ponderosa) forests in north-central Arizona in �997 to monitor snag populations. Ganey (�999) described initial snag populations in this area, and Ganey and Vojta (2005) reported on changes in snag populations from �997 to 2002. Here, we (�) estimate transition rates among snag decay classes and recruitment rates into those classes from �997 to 2002, (2) use these data to parameterize simple matrix models of snag dynamics based on those rates (Raphael and Morrison �987), and (3) use these models to project trends in snag populations in five-year increments over a 30-year modeling horizon.
Methods
Field Sampling
We sampled snags in 2002 in a set of �-ha plots originally established and sampled in �997. Plots were randomly located in mixed-conifer and

2USDA Forest Service Res. Pap. RMRS-RP-66WWW. 2007
ponderosa pine forest (n = 53 and 60 plots, respectively; see Ganey [�999] for further details on plot selection, location, and establishment) in a study area spanning approximately 73,000 ha across two National Forests in north-central Arizona (fig. �). Three plots experienced severe wildfire, so they were not considered here because the metal tags used to mark the snags (see below) melted, making it impossible to determine fates of indi-vidual snags.
Figure 1. General location of the study area (top), and locations of �-ha snag-monitoring plots within the study area (bottom). Snags were sampled in the Coconino (right) and Kaibab (left) National Forests, north-central Arizona. Plots in ponderosa pine forest (n = 58) are indicated by red circles, plots in mixed-conifer forest (n = 52) by blue triangles. The more clumped distribution of mixed-conifer plots reflects the more restricted distribution of mixed-conifer forest within the study area.

3USDA Forest Service Res. Pap. RMRS-RP-66WWW. 2007
Mixed-conifer forests in this area were dominated by Douglas-fir (Pseu-dotsuga menziesii) and white fir (Abies concolor); other common species included ponderosa and limber (P. flexilis) pine, quaking aspen (Populus tremuloides), and Gambel oak (Quercus gambelii). Ponderosa pine forests were heavily dominated by ponderosa pine, often contained Gambel oak and/or alligator juniper (Juniperus deppeana), and sometimes contained quaking aspen, pinyon pine (P. edulis), limber pine, Douglas-fir, and other species of junipers. In1997,wemarkedallsnags≥2minheightand≥20cmindiameterwithuniquely numbered aluminum tags attached at the base of the snag and sampled a number of snag characteristics. We searched the plots for all snags in 2002, re-sampled all previously marked snags, and uniquely marked and sampled any new snags encountered (fig. 2). For this paper, relevant snag characteristics sampled included species, diameter at breast height (dbh), height, and decay class. Snag diameter was recorded to the nearest cm using a dbh tape. Snag height was estimated to the nearest m using a clinometer. Decay classes (fig. 3) recognized followed Raphael and White (�984). Snags in decay class � retained needles (or leaves), twigs, and intact limbs. Decay-class 2 snags retained twigs and intact limbs but lacked needles. Class 3 snags had limbs that were largely intact, but lacked twigs.
Figure 2. Scott Vojta samples diameter on a large ponderosa pine snag (decay class 3, see figure 3).
Class 4 snags had limbs that were mostly broken, and class 5 snags lacked large limbs entirely.
Modeling Snag Population Dynamics
We estimated transition rates among and recruit-ment into decay classes between �997 and 2002 for snags in each forest type. These transition matrices summarize information on progression of snags among decay classes. Snag fall rates differed among some species over this time period (Ganey and Vojta 2005), and re-cruitment and transition rates likely differed among species as well. Therefore, we estimated recruitment and transition rates for individual species where sample sizes allowed.

4USDA Forest Service Res. Pap. RMRS-RP-66WWW. 2007
A) Class � B) Class 2
C) Class 3 D) Class 4
Figure 3. Illustrations of five decay classes of snags recognized (after Raphael and White �984). Snags in decay class � retained needles (or leaves, for broadleaved trees). Snags in decay class 2 retained twigs but not needles. Class 3 snags had limbs that were largely intact, but lacked twigs. Class 4 snags had limbs that were mostly broken, and class 5 snags (next page) lacked large limbs entirely.

5USDA Forest Service Res. Pap. RMRS-RP-66WWW. 2007
We modeled the dynamics of snag populations in each forest type using a Leslie matrix model developed by Raphael and Morrison (�987). This model took the form:
Nt+1 = D Nt + R,whereNt+1 is the 5 x � matrix denoting snag abundance by decay class at time
t + �, D is the 5 x 5 decay transition matrix (with zeroes above the diagonal) de-
noting the probability Pij of a snag moving from decay class i at time t to decay class j at time t + �,
Nt is the 5 x � matrix of the total number of snags in each decay class at time t, and
R is the 5 x � matrix of the number of snags recruited into each decay class during the time period from t to t + 1.
The models were parameterized using observed transition rates among snag decay classes from �997–2002, information on snag abundance in these decay classes in 2002, and recruitment rates into these decay classes from �997 to 2002. Models were run separately for individual species within forest types (see below), and then results were summed across species within forest type. We ran models through 2032, as we suspected that there was little point in modeling longer time frames with the available data. The model requires an assumption that transition and recruitment rates remain constant, and that assumption becomes increasingly untenable as the time frame considered increases.
E) Class 5 (broken snags on left)

6USDA Forest Service Res. Pap. RMRS-RP-66WWW. 2007
Management guidelines in this region emphasized large snags (defined assnags≥46cmdbhand≥9mtall;Reynoldsandothers1992,U.S.ForestService �996). Consequently, we also modeled dynamics of large snags in each forest type. Because numbers of large snags were low in most combinations of forest type, species, and decay class, we parameterized large-snag models using transition rates averaged across species and forest types, as well as recruitment rates averaged across species within forest type.
Results and Discussion
We sampled �,902 and 446 snags in 2002 in mixed-conifer and ponderosa pine forest, respectively. Of these, 254 and 77 snags met criteria for large snags in mixed-conifer and ponderosa pine forest, respectively. Absolute abundance of both all snags and large snags increased in both forest types from �997 to 2002, although snag density differed significantly between years only for all snags in mixed-conifer forest (Ganey and Vojta 2005). A total of �,389 and 3�2 snags marked in �997 were available for estimat-ing transition rates in mixed-conifer and ponderosa pine forest, respectively (table �). Models for all snags were parameterized using species-specific data within forest type, whereas models for large snags used transition rates averaged across species and forest types. Therefore, we present transition rates for large snags to illustrate the form of the decay transition matrix (table �). Patterns were generally similar across species and forest types. Most class-� snags transitioned to other decay classes (table �), suggest-ing that residence time in this class was relatively short. In contrast, larger proportions of snags in all other decay classes remained in the same class, and this proportion generally increased from class 2 to class 5. This sug-gests greater residence time in classes 2 through 5 than in decay-class �, and that residence time within decay class increased from earlier to later decay classes.
Table 1. Transition rates�oflargesnags(definedasdbh≥46cmandheight≥9m)amongdecay classes from �997 to 2002 in mixed-conifer and ponderosa pine forest in northern Arizona. Decay classes are described in the text. Data presented here were averaged across species and forest types.
1997 decay class2002 decay class 1 2 3 4 5
� 0.0�9 2 0.6�5 0.368 3 0.096 0.338 0.68� 4 0.0�9 0.044 0.064 0.73 5 0.058 0.029 0.030 0.050 0.944 � Values shown are the proportions of snags decomposing from each decay class in �997 to the ob-served decay class in 2002. The proportion of snags falling, cut down, or unaccounted for is one minus the column sum.
7USDA Forest Service Res. Pap. RMRS-RP-66WWW. 2007
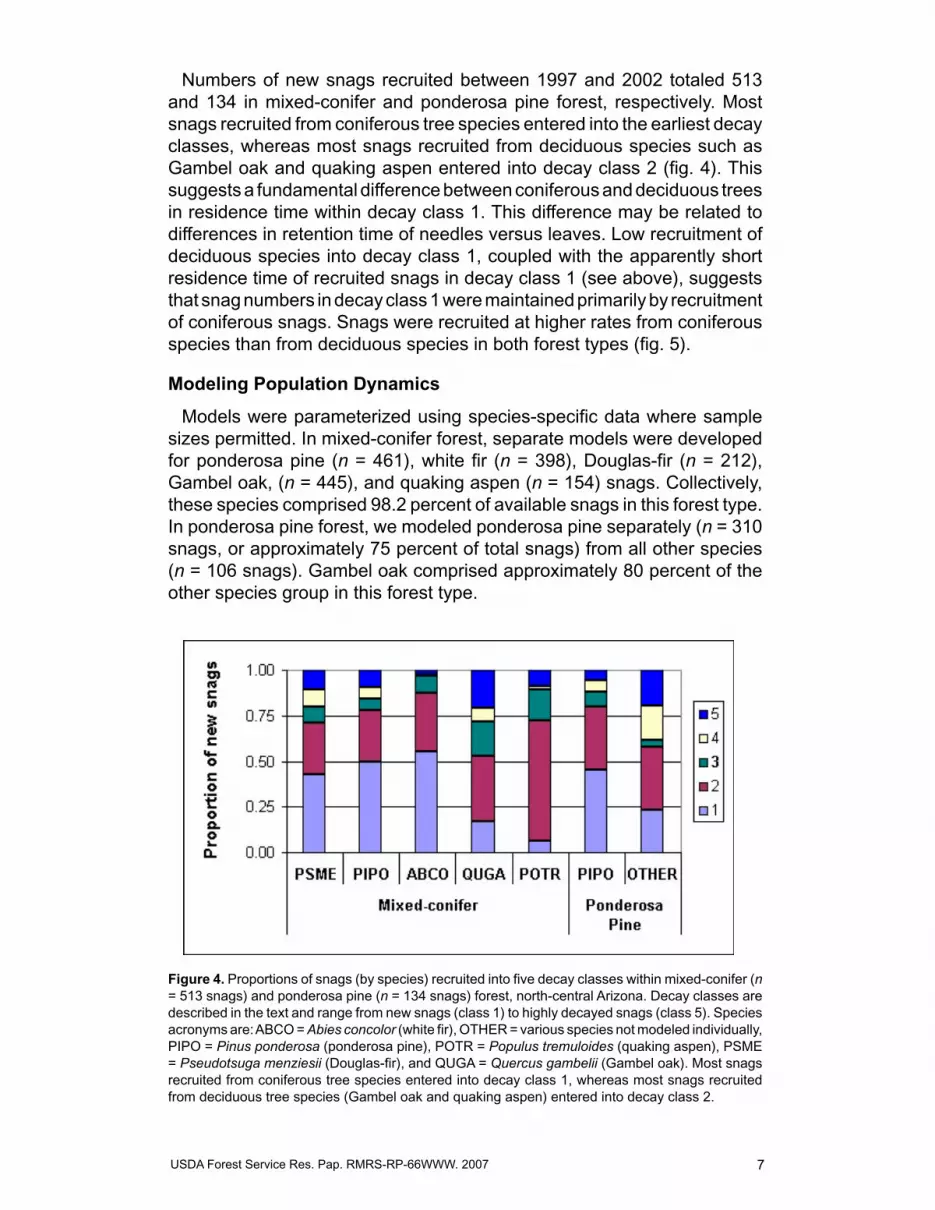
Numbers of new snags recruited between �997 and 2002 totaled 5�3 and �34 in mixed-conifer and ponderosa pine forest, respectively. Most snags recruited from coniferous tree species entered into the earliest decay classes, whereas most snags recruited from deciduous species such as Gambel oak and quaking aspen entered into decay class 2 (fig. 4). This suggests a fundamental difference between coniferous and deciduous trees in residence time within decay class �. This difference may be related to differences in retention time of needles versus leaves. Low recruitment of deciduous species into decay class �, coupled with the apparently short residence time of recruited snags in decay class � (see above), suggests that snag numbers in decay class � were maintained primarily by recruitment of coniferous snags. Snags were recruited at higher rates from coniferous species than from deciduous species in both forest types (fig. 5).
Modeling Population Dynamics
Models were parameterized using species-specific data where sample sizes permitted. In mixed-conifer forest, separate models were developed for ponderosa pine (n = 46�), white fir (n = 398), Douglas-fir (n = 2�2), Gambel oak, (n = 445), and quaking aspen (n = �54) snags. Collectively, these species comprised 98.2 percent of available snags in this forest type. In ponderosa pine forest, we modeled ponderosa pine separately (n = 3�0 snags, or approximately 75 percent of total snags) from all other species (n = �06 snags). Gambel oak comprised approximately 80 percent of the other species group in this forest type.
Figure 4. Proportions of snags (by species) recruited into five decay classes within mixed-conifer (n = 5�3 snags) and ponderosa pine (n = �34 snags) forest, north-central Arizona. Decay classes are described in the text and range from new snags (class �) to highly decayed snags (class 5). Species acronyms are: ABCO = Abies concolor (white fir), OTHER = various species not modeled individually, PIPO = Pinus ponderosa (ponderosa pine), POTR = Populus tremuloides (quaking aspen), PSME = Pseudotsuga menziesii (Douglas-fir), and QUGA = Quercus gambelii (Gambel oak). Most snags recruited from coniferous tree species entered into decay class �, whereas most snags recruited from deciduous tree species (Gambel oak and quaking aspen) entered into decay class 2.

8USDA Forest Service Res. Pap. RMRS-RP-66WWW. 2007
The Leslie matrix models for all snags predicted that snag populations would continue to increase in both forest types through 2032, given con-stant transition and recruitment rates (fig. 6a). Resulting snag densities in 2032 were predicted to be 32 and 20 percent greater than 2002 densities in mixed-conifer and ponderosa pine forest. The matrix model for large snags predicted that density of large snags would increase by approximately 32 and �59 percent in mixed-conifer and ponderosa pine forest, respectively (fig. 6b). Despite these increases, model predictions indicated that density of large snags would remain below target levels in both forest types through 2032. The matrix models predicted only modest changes in species composi-tion from 2002 to 2032 (fig. 7). In mixed-conifer forest, the proportion of ponderosa pine and white fir snags decreased by approximately 5 and 3 percent, respectively, whereas the proportion of Gambel oak and quaking aspen snags increased by approximately 4 and 5 percent, respectively (fig. 7a). In ponderosa pine forest, the proportion of ponderosa pine snags decreased by approximately 2.5 percent, whereas the proportion of other snags increased by the same amount (fig. 7b). Most of that increase was due to predicted increases in abundance of Gambel oak snags. Species composition changed across the modeling horizon in both forest types and did not appear to have stabilized in either forest type by 2032 (fig. 7).
Figure 5. Number of snags recruited in mixed-conifer and ponderosa pine forest, �997 to 2002, by type of tree (evergreen coniferous versus deciduous broadleaved). In both forest types, recruitment was dominated by snags recruited from coniferous tree species.

9USDA Forest Service Res. Pap. RMRS-RP-66WWW. 2007
Figure 6. Simulated trends in density of (A) all snags and (B) large snags in mixed-conifer and ponderosa pine forests, northern Arizona. Shown are empirical data from 2002 and projections for five-year intervals from 2007 to 2032. Projections were derived from a Leslie matrix model of population growth, parameterized using data collected in �997 and 2002. Overall snag density was predicted to increase over this interval in both forest types, with greater change predicted in mixed-conifer forest than in ponderosa pine forest. Density of large snags also was predicted to increase over this interval, with a greater proportional increase in ponderosa pine forest. Targets for retention of large snags are shown by horizontal reference lines (purple for mixed-conifer target, blue for ponderosa pine target). Density of large snags was predicted to remain below target values (7.4 and 4.9 snags/ha in mixed-conifer and ponderosa pine forest, respectively) in both forest types throughout the interval modeled.

�0USDA Forest Service Res. Pap. RMRS-RP-66WWW. 2007
Figure 7. Simulated trends in species composition of snags in northern Arizona mixed-conifer (A) and ponderosa pine (B) forest. Shown are empirical data from 2002 and projections for five-year intervals from 2007 to 2032. Projections were derived from a Leslie matrix model of population growth, parameterized using data collected in �997 and 2002. Snags were modeled for individual species where sample sizes allowed. Species acronyms are: ABCO = Abies concolor (white fir), OTHER = various species not modeled individually, PIPO = Pinus ponderosa (ponderosa pine), POTR = Populus tremuloides (quaking aspen), PSME = Pseudotsuga menziesii (Douglas-fir), and QUGA = Quercus gambelii (Gambel oak). Proportions of quaking aspen and Gambel oak were predicted to increase in mixed-conifer, with concomitant decreases in white fir and ponderosa pine. In ponderosa pine forest, proportions of ponderosa pine snags were predicted to decrease and proportions of OTHER snags were predicted to increase, with most of that increase in the Gambel oak component.
��USDA Forest Service Res. Pap. RMRS-RP-66WWW. 2007
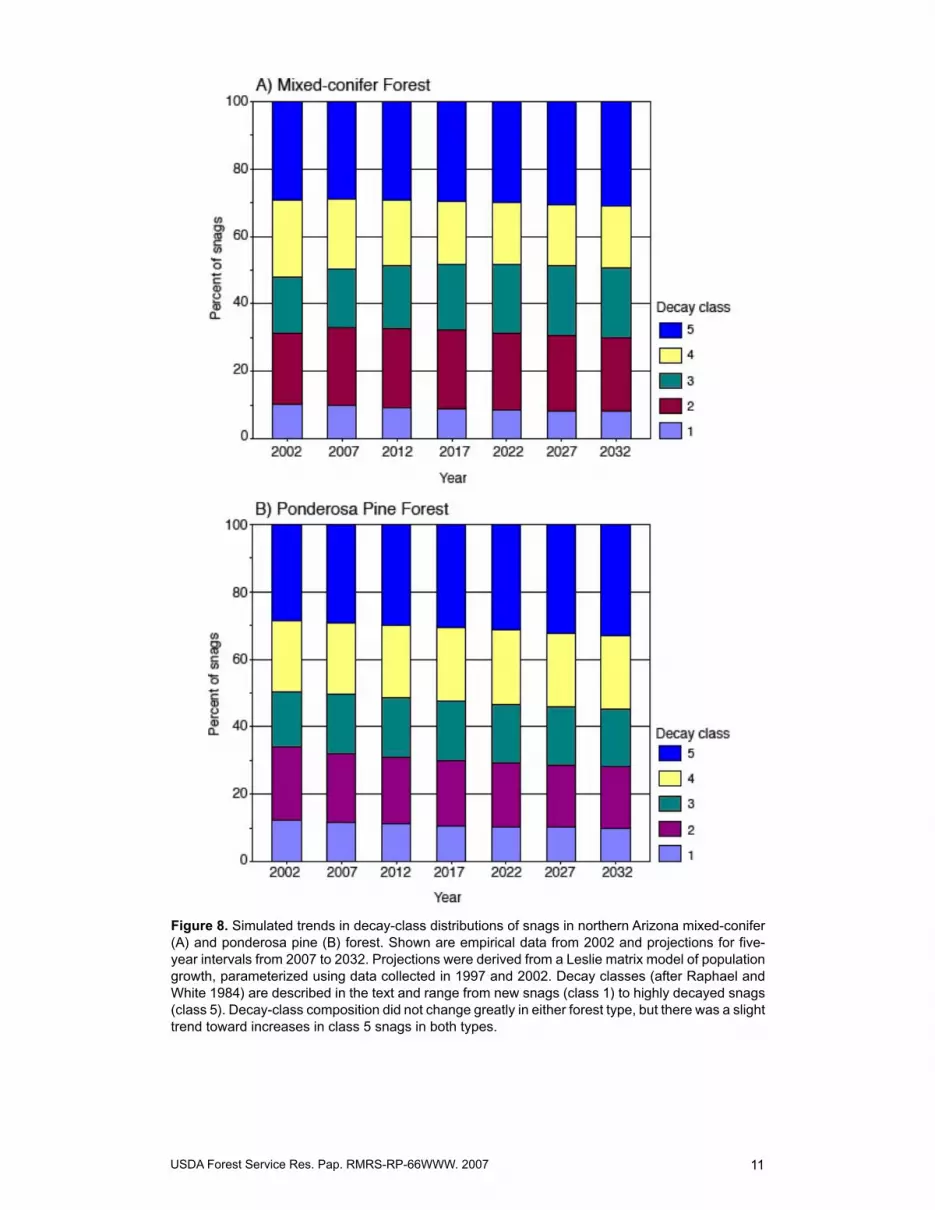
Figure 8. Simulated trends in decay-class distributions of snags in northern Arizona mixed-conifer (A) and ponderosa pine (B) forest. Shown are empirical data from 2002 and projections for five-year intervals from 2007 to 2032. Projections were derived from a Leslie matrix model of population growth, parameterized using data collected in �997 and 2002. Decay classes (after Raphael and White �984) are described in the text and range from new snags (class �) to highly decayed snags (class 5). Decay-class composition did not change greatly in either forest type, but there was a slight trend toward increases in class 5 snags in both types.

�2USDA Forest Service Res. Pap. RMRS-RP-66WWW. 2007
The matrix models also predicted only modest changes in decay-class distributions from 2002 to 2032 (fig. 8). In both forest types, proportions of snags changed by only 2 to 5 percent for various decay classes. Decay-class distribution appeared to be relatively stable by 2032 in mixed-conifer forest, but continued to change across the modeling horizon in ponderosa pine forest. Proportions of older snags continued to increase, and newer snags to decrease, in this forest type. We did not model species or decay-class composition of large snags due to low sample sizes in most combinations of species and decay class.
Conclusions
The matrix models used here are simplistic. These models do not incor-porate data on stand structure and composition, so they are unsuited for modeling snag dynamics at the scale of individual forest stands. Rather, these models were parameterized using data averaged over a wide range of stand conditions across a large landscape. Consequently, these data are useful primarily in a coarse-filter modeling framework, involving modeling trends across large landscapes. These models also require the assumption of constant recruitment and transition rates. This assumption is unlikely to be met. Snag recruitment depends partly on predictable factors such as stand structure (e. g., Fiedler and Morgan 2002) and partly on unpredictable events such as fire, wind events, and disease and/or insect outbreaks (e. g., Keen �955, Morrison and Raphael �993, Mitchell and Preisler �998, McHugh and others 2003), and thus can be highly episodic. Transition rates also may vary through time depending on factors such as cause of death and disturbance events (e.g., fire, large wind events; Morrison and Raphael �993, Bull and others �997). The assumption of constant rates also becomes more untenable with increasing time frames. As a result, we restricted model projections to a fairly short (30 years) modeling horizon. The current model also used rate estimates derived from short-term data. As future inventories (planned for five-year intervals) are completed on these plots, we will be able to base estimates of recruitment and transition rates on longer time frames, which will incorporate wider ranges of environmental conditions, and on larger samples of snags. Future inventories thus should improve model accuracy and will provide empirical data with which to test model predictions. Another important shortcoming of these models is the inability to incor-porate data on snag dynamics in severely burned plots due to tag loss and resulting uncertainty regarding fates of individual snags. Wildfire is both prevalent and increasing in frequency and extent in southwestern forests (e.g., McKenzie and others 2004) and can affect snag numbers and types, sometimes greatly (e.g., Chambers and Mast 2005, Ganey and Vojta 2005). Therefore, it would be desirable to incorporate the ability to model dynam-ics of individual snags in burned areas. This likely could be accomplished simply by substituting steel tags for aluminum tags (perhaps depending on fire intensity).

�3USDA Forest Service Res. Pap. RMRS-RP-66WWW. 2007
Despite these shortcomings, however, matrix models provide a useful tool for modeling snag dynamics at the landscape scale. Model projec-tions suggest that, at least in the short term, snag numbers will continue to increase, snags will continue to be relatively abundant in these forests, and densities of large snags will increase in both forest types but remain below target levels. Data on populations of live trees in these forests would help in modeling snag dynamics. Obviously, abundance and composition of snag populations depends heavily on the abundance and composition of source populations (live trees). Therefore, future modeling efforts will attempt to incorporate data on stand conditions in estimates of transition and recruitment rates.
Acknowledgments
We thank A. and J. Iníguez, J. Jenness, G. Martinez, M. Stoddard, B. Strohmeyer, C. Vojta, and R. White for their assistance in establishing plots and sampling snags. Numerous USFS personnel assisted with initial plot selection, including J. Ellenwood, B. Higgins, K. Menasco, C. Nelson, and G. Sheppard (Kaibab National Forest) and C. Beyerhelm, A. Brown, H. Green, T. Randall-Parker, C. Taylor, and M. Whitney (Coconino National Forest). R. M. King provided advice on statistical analyses, and B. Higgins, W. F. Laudenslayer, Jr., J. McMillin, B. Noble, and M. G. Raphael reviewed earlier versions of this paper.
Literature Cited
Bull, E. L.; Parks, C. G.; Torgersen, T. R. �997. Trees and logs important to wildlife in the interior Columbia River Basin. Gen. Tech. Rep. PNW-GTR-39�. Portland, OR: U.S. Department of Agriculture, Forest Service, Pacific Northwest Research Station. 55 p.
Chambers, C. L.; Mast, J. N. 2005. Ponderosa pine snag dynamics and cavity excavation following wildfire in northern Arizona. Forest Ecology and Management 2�6:227-240.
Davis, J.W.; Goodwin, G. A.; Ockenfels, R. A., tech. coords. �983. Snag habitat manage-ment: Proceedings of the symposium. Gen. Tech. Rep. RM-99. Fort Collins, CO: U.S. Department of Agriculture, Forest Service, Rocky Mountain Forest and Range Experi-ment Station. 226 p.
Everett, R.; Lehmkuhl, J.; Schellhaas, R.; Ohlson, P.; Keenum, D.; Reisterer, H.; Spur-beck, D. �999. Snag dynamics in a chronosequence of 26 wildfires on the east slope of the Cascade Range in Washington State, USA. International Journal of Wildland Fire 9:223–234.
Ganey, J. L. �999. Snag density and composition of snag populations on two National Forests in northern Arizona. Forest Ecology and Management ��7:�69-�78.
Ganey, J. L.; Vojta, S. C. 2005. Changes in snag populations in northern Arizona mixed-conifer and ponderosa pine forests, �997–2002. Forest Science 5�:396-405.
Harmon, M. E.; Franklin, J. F.; Swanson, F. J.; Sollins, P.; Gregory, S. V.; Lattin, J. D.; Anderson, N. H.; Cline, S. P.; Aumen, N. G.; Sedell, J. R.; Lienkamper, G. W.; Cromack, K., Jr.; Cummins, K. W. �986. Ecology of coarse woody debris in temperate ecosystems. Advances in Ecological Research �5:�33–302.
Harris, R. B. �999. Abundance and characteristics of snags in western Montana forests. Gen. Tech. Rep. RMRS-GTR-3�. Fort Collins, CO: U.S. Department of Agriculture, For-est Service, Rocky Mountain Research Station. �9 p.
Keen, F. P. �955. The rate of natural falling of beetle-killed ponderosa pine snags. Journal of Forestry 53(�0):720–723.

�4USDA Forest Service Res. Pap. RMRS-RP-66WWW. 2007
Laudenslayer, W. F., Jr.; Shea, P. J.; Valentine, B. E.; Weatherspoon, C. P.; Lisle, T. E., technical coordinators. 2002. Proceedings of the symposium on the ecology and man-agement of dead wood in western forests. Gen. Tech. Rep. PSW-GTR-�8�. Albany, CA: U.S. Department of Agriculture, Forest Service, Pacific Southwest Research Station. 949 pp.
Lehmkuhl, J. F.; Everett, R. L.; Schellhaas, R.; Ohlson, P.; Keenum, D.; Reisterer, H.; Spurbeck, D. 2003. Cavities in snags along a wildfire chronosequence in eastern Wash-ington. Journal of Wildlife Management 67:2�9–228.
McHugh, C. W.; Kolb, T. E., Wilson, J. L. 2003. Bark beetle attacks on ponderosa pine following fire in northern Arizona. Environmental Entomology 32:5�0–522.
McKenzie, D.; Gedalof, Z.; Peterson, D. L.; Mote, P. 2004. Climate change, wildfire, and conservation. Conservation Biology �8:890–902.
Mellen, K.; Marcot, B. G.; Ohmann, J. L.; Waddell, K. L.; Wilhite, E. A.; Hostetler, B. B.; Livingston, S. A.; Ogden, C. 2002. DecAID: a decaying wood advisory model for Oregon and Washington. In: Laudenslayer, W. F., Jr.; Shea, P. J.; Valentine, B. E.; Weatherspoon, C. P.; Lisle, T. E., technical coordinators. Proceedings of the symposium on the ecology and management of dead wood in western forests. Gen. Tech. Rep. PSW-GTR-�8�. Albany, CA: U.S. Department of Agriculture, Forest Service, Pacific Southwest Research Station: 527–533.
Mitchell, R. G.; Preisler, H. K. �998. Fall rate of lodgepole pine killed by the mountain pine beetle in central Oregon. Western Journal of Applied Forestry �3:23–26.
Morrison, M. L.; Raphael, M. G. �993. Modeling the dynamics of snags. Ecological Ap-plications 3:322–330.
Morrison, M.L.; Dedon, M. F.; Raphael, M. G.; Yoder-Williams, M. P. �986. Snag require-ments of cavity-nesting birds: are USDA Forest Service guidelines being met? Western Journal of Applied Forestry �:38–40.
Ohmann, J.L.; Waddell, K.L. 2002. Regional patterns of dead wood in forested habitats of Oregon and Washington. In: Laudenslayer, W. F., Jr.; Shea, P. J.; Valentine, B. E.; Weatherspoon, C. P.; Lisle, T. E., technical coordinators. Proceedings of the symposium on the ecology and management of dead wood in western forests. Gen. Tech. Rep. PSW-GTR-�8�. Albany, CA: U.S. Department of Agriculture,Forest Service, Pacific Southwest Research Station:535–560.
Raphael, M. G.; Morrison, M. L. �987. Decay and dynamics of snags in the Sierra Nevada, California. Forest Science 33:774–783.
Raphael, M. G.; White, M. �984. Use of snags by cavity-nesting birds in the Sierra Nevada. Wildlife Monographs 86:�–66.
Reynolds, R. T.; Graham, R. T.; Reiser, M. H.; Bassett, R. L.; Kennedy, R. L.; Boyce, D. A., Jr.; Goodwin, G.; Smith, R.; Fisher, E. L. �992. Management recommendations for the northern goshawk in the Southwestern United States. Gen. Tech. Rep. RM-2�7. Fort Collins, CO: U.S. Department of Agriculture, Forest Service, Rocky Mountain Forest and Range Experiment Station. 90 p.
Skinner, C.N. 2002. Influence of fire on the dynamics of dead woody material in forests of California and southwestern Oregon. In: Laudenslayer, W. F., Jr.; Shea, P. J.; Valen-tine, B. E.; Weatherspoon, C. P.; Lisle, T. E., technical coordinators. Proceedings of the symposium on the ecology and management of dead wood in western forests. Gen. Tech. Rep. PSW-GTR-�8�. Albany, CA: U.S. Department of Agriculture, Forest Service, Pacific Southwest Research Station:445–454.
Stephens, S. L. 2004. Fuel loads, snag density, and snag recruitment in an unmanaged Jeffrey pine–mixed conifer forest in northwestern Mexico. Forest Ecology and Manage-ment �99:�03–��3.
Thomas, J. W.; Anderson, R. G.; Maser, C.; Bull, E. L. �979. Snags. In: Thomas, J. W., technical editor. Wildlife habitats in managed forests: the Blue Mountains of Oregon and Washington. Agricultural Handbook 553. Washington, DC: U.S. Department of Agriculture:60–77.
U.S. Forest Service. �996. Record of Decision for amendment of Forest Plans: Arizona and New Mexico. Albuquerque, NM: U.S. Department of Agriculture, Forest Service, Southwestern Region. 96 p.

The U.S. Department of Agriculture (USDA) prohibits discrimination in all its programs and activities on the basis of race, color, national origin, age, disability, and where applicable, sex, marital status, familial status, parental status, religion, sexual orientation, genetic information, political beliefs, reprisal, or because all or part of an individual’s income is derived from any public assistance program. (Not all prohibited bases apply to all programs.) Persons with disabilities who require alternative means for communication of program information (Braille, large print, audiotape, etc.) should contact USDA’s TARGET Center at (202)-720-2600 (voice and TDD). To file a complaint of discrimination, write USDA, Director, Office of Civil Rights, 1400 Independence Avenue, SW, Washington, DC 20250-9410 or call (800)-795-3272 (voice) or (202) 720-6382 (TDD). USDA is an equal opportunity provider and employer.
The Rocky Mountain Research Station develops scientific in-formation and technology to improve management, protection, and use of the forests and rangelands. Research is designed to meet the needs of National Forest managers, Federal and State agencies, public and private organizations, academic institutions, industry, and individuals.
Studies accelerate solutions to problems involving ecosystems, range, forests, water, recreation, fire, resource inventory, land reclamation, community sustainability, forest engineering technol-ogy, multiple use economics, wildlife and fish habitat, and forest insects and diseases. Studies are conducted cooperatively, and applications may be found worldwide.
Research Locations
Flagstaff, Arizona Reno, NevadaFort Collins, Colorado* Albuquerque, New MexicoBoise, Idaho Rapid City, South DakotaMoscow, Idaho Logan, UtahBozeman, Montana Ogden, UtahMissoula, Montana Provo, Utah
*Station Headquarters, Natural Resources Research Center 2150 Centre Avenue, Building A, Fort Collins, CO 80526
Related Documents


