Atmos. Chem. Phys., 9, 6949–6982, 2009 www.atmos-chem-phys.net/9/6949/2009/ © Author(s) 2009. This work is distributed under the Creative Commons Attribution 3.0 License. Atmospheric Chemistry and Physics Modeling organic aerosols during MILAGRO: importance of biogenic secondary organic aerosols A. Hodzic 1 , J. L. Jimenez 2 , S. Madronich 1 , A. C. Aiken 2 , B. Bessagnet 3 , G. Curci 4 , J. Fast 5 , J.-F. Lamarque 1 , T. B. Onasch 6 , G. Roux 1 , J. J. Schauer 7,8 , E. A. Stone 7 , and I. M. Ulbrich 2 1 National Center for Atmospheric Research, Boulder, CO, USA 2 University of Colorado, Boulder, CO, USA 3 INERIS, Verneuil en Halatte, France 4 Universit` a degli Studi dell’Aquila, Italy 5 Pacific Northwest National Laboratory, Richland, WA, USA 6 Aerodyne Research, MA, USA 7 University of Wisconsin-Madison, Madison, WI, USA 8 School of Resources and Environmental Engineering, Wuhan University of Technology, Wuhan, China Received: 11 May 2009 – Published in Atmos. Chem. Phys. Discuss.: 19 May 2009 Revised: 19 August 2009 – Accepted: 20 August 2009 – Published: 22 September 2009 Abstract. The meso-scale chemistry-transport model CHIMERE is used to assess our understanding of major sources and formation processes leading to a fairly large amount of organic aerosols – OA, including primary OA (POA) and secondary OA (SOA) – observed in Mexico City during the MILAGRO field project (March 2006). Chemical analyses of submicron aerosols from aerosol mass spectrom- eters (AMS) indicate that organic particles found in the Mex- ico City basin contain a large fraction of oxygenated organic species (OOA) which have strong correspondence with SOA, and that their production actively continues downwind of the city. The SOA formation is modeled here by the one-step ox- idation of anthropogenic (i.e. aromatics, alkanes), biogenic (i.e. monoterpenes and isoprene), and biomass-burning SOA precursors and their partitioning into both organic and aque- ous phases. Conservative assumptions are made for uncer- tain parameters to maximize the amount of SOA produced by the model. The near-surface model evaluation shows that predicted OA correlates reasonably well with measurements during the campaign, however it remains a factor of 2 lower than the measured total OA. Fairly good agreement is found between predicted and observed POA within the city sug- gesting that anthropogenic and biomass burning emissions are reasonably captured. Consistent with previous studies in Correspondence to: A. Hodzic ([email protected]) Mexico City, large discrepancies are encountered for SOA, with a factor of 2–10 model underestimate. When only anthropogenic SOA precursors were considered, the model was able to reproduce within a factor of two the sharp in- crease in OOA concentrations during the late morning at both urban and near-urban locations but the discrepancy in- creases rapidly later in the day, consistent with previous re- sults, and is especially obvious when the column-integrated SOA mass is considered instead of the surface concentra- tion. The increase in the missing SOA mass in the after- noon coincides with the sharp drop in POA suggesting a tendency of the model to excessively evaporate the freshly formed SOA. Predicted SOA concentrations in our base case were extremely low when photochemistry was not active, es- pecially overnight, as the SOA formed in the previous day was mostly quickly advected away from the basin. These nighttime discrepancies were not significantly reduced when greatly enhanced partitioning to the aerosol phase was as- sumed. Model sensitivity results suggest that observed night- time OOA concentrations are strongly influenced by a re- gional background SOA (∼1.5 μg/m 3 ) of biogenic origin which is transported from the coastal mountain ranges into the Mexico City basin. The presence of biogenic SOA in Mexico City was confirmed by SOA tracer-derived estimates that have reported 1.14 (±0.22) μg/m 3 of biogenic SOA at T0, and 1.35 (±0.24) μg/m 3 at T1, which are of the same order as the model. Consistent with other recent studies, we Published by Copernicus Publications on behalf of the European Geosciences Union.

Welcome message from author
This document is posted to help you gain knowledge. Please leave a comment to let me know what you think about it! Share it to your friends and learn new things together.
Transcript

Atmos. Chem. Phys., 9, 6949–6982, 2009www.atmos-chem-phys.net/9/6949/2009/© Author(s) 2009. This work is distributed underthe Creative Commons Attribution 3.0 License.
AtmosphericChemistry
and Physics
Modeling organic aerosols during MILAGRO: importance ofbiogenic secondary organic aerosols
A. Hodzic1, J. L. Jimenez2, S. Madronich1, A. C. Aiken2, B. Bessagnet3, G. Curci4, J. Fast5, J.-F. Lamarque1,T. B. Onasch6, G. Roux1, J. J. Schauer7,8, E. A. Stone7, and I. M. Ulbrich 2
1National Center for Atmospheric Research, Boulder, CO, USA2University of Colorado, Boulder, CO, USA3INERIS, Verneuil en Halatte, France4Universita degli Studi dell’Aquila, Italy5Pacific Northwest National Laboratory, Richland, WA, USA6Aerodyne Research, MA, USA7University of Wisconsin-Madison, Madison, WI, USA8School of Resources and Environmental Engineering, Wuhan University of Technology, Wuhan, China
Received: 11 May 2009 – Published in Atmos. Chem. Phys. Discuss.: 19 May 2009Revised: 19 August 2009 – Accepted: 20 August 2009 – Published: 22 September 2009
Abstract. The meso-scale chemistry-transport modelCHIMERE is used to assess our understanding of majorsources and formation processes leading to a fairly largeamount of organic aerosols – OA, including primary OA(POA) and secondary OA (SOA) – observed in Mexico Cityduring the MILAGRO field project (March 2006). Chemicalanalyses of submicron aerosols from aerosol mass spectrom-eters (AMS) indicate that organic particles found in the Mex-ico City basin contain a large fraction of oxygenated organicspecies (OOA) which have strong correspondence with SOA,and that their production actively continues downwind of thecity. The SOA formation is modeled here by the one-step ox-idation of anthropogenic (i.e. aromatics, alkanes), biogenic(i.e. monoterpenes and isoprene), and biomass-burning SOAprecursors and their partitioning into both organic and aque-ous phases. Conservative assumptions are made for uncer-tain parameters to maximize the amount of SOA producedby the model. The near-surface model evaluation shows thatpredicted OA correlates reasonably well with measurementsduring the campaign, however it remains a factor of 2 lowerthan the measured total OA. Fairly good agreement is foundbetween predicted and observed POA within the city sug-gesting that anthropogenic and biomass burning emissionsare reasonably captured. Consistent with previous studies in
Correspondence to:A. Hodzic([email protected])
Mexico City, large discrepancies are encountered for SOA,with a factor of 2–10 model underestimate. When onlyanthropogenic SOA precursors were considered, the modelwas able to reproduce within a factor of two the sharp in-crease in OOA concentrations during the late morning atboth urban and near-urban locations but the discrepancy in-creases rapidly later in the day, consistent with previous re-sults, and is especially obvious when the column-integratedSOA mass is considered instead of the surface concentra-tion. The increase in the missing SOA mass in the after-noon coincides with the sharp drop in POA suggesting atendency of the model to excessively evaporate the freshlyformed SOA. Predicted SOA concentrations in our base casewere extremely low when photochemistry was not active, es-pecially overnight, as the SOA formed in the previous daywas mostly quickly advected away from the basin. Thesenighttime discrepancies were not significantly reduced whengreatly enhanced partitioning to the aerosol phase was as-sumed. Model sensitivity results suggest that observed night-time OOA concentrations are strongly influenced by a re-gional background SOA (∼1.5µg/m3) of biogenic originwhich is transported from the coastal mountain ranges intothe Mexico City basin. The presence of biogenic SOA inMexico City was confirmed by SOA tracer-derived estimatesthat have reported 1.14 (±0.22)µg/m3 of biogenic SOA atT0, and 1.35 (±0.24) µg/m3 at T1, which are of the sameorder as the model. Consistent with other recent studies, we
Published by Copernicus Publications on behalf of the European Geosciences Union.

6950 A. Hodzic et al.: Modeling organic aerosols during MILAGRO
find that biogenic SOA does not appear to be underestimatedsignificantly by traditional models, in strong contrast to whatis observed for anthropogenic pollution. The relative contri-bution of biogenic SOA to predicted monthly mean SOA lev-els (traditional approach) is estimated to be more than 30%within the city and up to 65% at the regional scale which mayhelp explain the significant amount of modern carbon in theaerosols inside the city during low biomass burning periods.The anthropogenic emissions of isoprene and its nighttimeoxidation by NO3 were also found to enhance the SOA meanconcentrations within the city by an additional 15%. Our re-sults confirm the large underestimation of the SOA produc-tion by traditional models in polluted regions (estimated as10–20 tons within the Mexico City metropolitan area duringthe daily peak), and emphasize for the first time the role ofbiogenic precursors in this region, indicating that they cannotbe neglected in urban modeling studies.
1 Introduction
There is growing evidence that organic aerosols affect cli-mate (IPCC, 2007) and human health (Pope and Dockery,2006) in proportions that are at present underestimated. Re-cently, carbonaceous matter has been identified as one of thetwo largest components of fine particles (together with sul-fate) over many continental regions of the Northern Hemi-sphere, including North America, Europe, and East Asia aswell as in the free troposphere (Murphy et al., 2006; Zhang etal., 2007; Yttri et al., 2007). OA is composed of both primar-ily emitted compounds such as hydrocarbons and fatty acids,and also of chemically processed organic material (i.e. SOA)most of which is operationally-defined as water-soluble un-der high-dilution (Kondo et al., 2007; Docherty et al., 2008)although it is generally not very hygroscopic (e.g. Ervens etal., 2007; Clarke et al., 2007; Cubison et al., 2008). OA-containing particles actively contribute to aerosol radiativeforcing by scattering and absorbing solar radiation, and byacting as condensation nuclei for cloud formation (Facchiniet al., 1999). In addition, OA contains primary species suchas polycyclic aromatic hydrocarbons (Marr et al., 2006) andsecondary species such as quinones (Tao et al., 2003) thathave been recognized as highly toxic for human health. De-spite their abundance in the troposphere and their adverseeffects, organic aerosols are currently the least characterizedspecies of all fine aerosol components in terms of both theirchemical composition and spatial distribution. This charac-terization is all the more challenging as organic aerosol is acomplex mixture of hundreds of chemically active individualcompounds (Murphy, 2005) among which many have not yetbeen identified. Hamilton et al. (2004) identified more thanten thousand compounds in an OA sample from London, UK.
The molecular-level identity of the majority of the OAmass is unknown (Turpin et al., 2000). For instance, gas
chromatography-mass spectroscopy (GC/MS) can identifythe species that comprise only 10–20% of the organic mass.On the other hand the total OA mass can be measured withreasonable accuracy (±25%) using thermal-optical analyzers(Turpin et al., 2000) or aerosol mass spectrometers (AMS;Canagaratna et al., 2007). The latter technique has high timeand size resolution and allows some characterization of thesources and types of species that make up the fine aerosolmass through factor analysis of the organic spectrum (Zhanget al., 2005a, b). In particular surrogates of POA and SOAand several subtypes of each have been identified in mul-tiple studies using this technique (e.g. Zhang et al., 2005a,b, 2007; Lanz et al., 2007; Nemitz et al., 2008; Ulbrich etal., 2009). There have been very few measurements thatallow a direct estimation of the relative contribution of an-thropogenic and biogenic precursors to the SOA formationand the uncertainties are still significant (e.g. Williams et al.,2007; Kleindienst et al., 2007).
Climate and air quality models often underpredict the mea-sured concentrations of organics in urban and remote areas,mainly because the processes involved in the formation andaging of secondary organic aerosols (SOA) are not well un-derstood (e.g. Zhang et al., 2006). According to the studyby Volkamer et al. (2006) this underestimation is a already afactor of 3 shortly after the start of the photochemistry andreaches a factor of 8 in urban areas and increases as the airmass ages when using very conservative (favoring SOA) as-sumptions in the model. Model comparisons using total OCor OA show lower underestimations, as expected due to theinfluence of POA and sometimes also due to POA overesti-mation (de Gouw and Jimenez, 2009). These poor modelingresults translate into large uncertainties on estimated globalproduction of secondary organic aerosols (70–205 TgC yr−1;Hallquist et al., 2009) as well as on their contribution toaerosol indirect radiative forcing that was qualified as an areaof “low level of understanding” by IPCC (2007).
The modeling of SOA formation and aging is currentlyone of the most challenging and most controversial aspectsof aerosol research (Kanakidou et al., 2005; Hallquist etal., 2009). Most 3-D models use a semi-empirical SOA ap-proach (Odum et al., 1996; Pankow, 1994) based on the gasphase oxidation of VOC precursors followed by gas-particlepartitioning of two semivolatile products onto existing or-ganic particles depending on local temperature and organicmass concentration. The saturation concentrations of thesemivolatile products are derived from fits to measurementsfrom smog chamber experiments of the oxidation of individ-ual VOCs. The effect of temperature on saturation concen-tration is taken into account using a lumped enthalpy of va-porization (Pun et al., 2003; Donahue et al., 2006). Generallyonly the lumped first (of early) generation oxidation productsfrom aromatic (e.g. toluene and xylene) and terpene precur-sors are considered. Only a few models use a more detailedrepresentation of the gas-phase chemistry of SOA precursorswhile still using lumping and surrogate compounds (Griffin
Atmos. Chem. Phys., 9, 6949–6982, 2009 www.atmos-chem-phys.net/9/6949/2009/

A. Hodzic et al.: Modeling organic aerosols during MILAGRO 6951
et al., 2002). Fully explicit models have been developed butare too computationally expensive for 3-D applications (e.g.Johnson et al., 2006; Camredon et al., 2007). Several limi-tations related to these modeling approaches have been dis-cussed in recent studies (Chung and Seinfeld, 2002; Don-ahue et al., 2006; Simpson et al., 2007; Hallquist et al., 2009;Camredon et al., 2007).
In the past few years, evidence for new precursors andpathways to SOA formation have been identified from mea-surements including oligomerization (Jang et al., 2002;Kalberer et al., 2004; Iinuma et al., 2004), aqueous-phaseproduction in clouds (Warneck, 2003; Lim et al., 2005; Liuet al., 2009), SOA formation from semivolatile and interme-diate volatility primary compounds (Robinson et al., 2007),and SOA formation from very volatile species such as gly-oxal (Volkamer et al., 2007). Kroll et al. (2006) and Pun andSeigneur (2007) have shown that species such as isoprenethat were previously considered not to form SOA, are likelyto act as SOA precursors, and similar findings were recentlyreported for benzene by Martin-Reviejo and Wirtz (2005)and for acetylene by Volkamer et al. (2009). The nighttimeoxidation of isoprene by NO3 radicals has also been shownto contribute to SOA formation (Ng et al., 2008). A recentchamber study by Song et al. (2007) suggests that SOA for-mation from biogenic compounds is insensitive to the pres-ence of hydrophobic primary particles, although the appli-cability of those results to real POA is under investigation.Their work suggested that the traditional assumption of awell-mixed organic phase (POA+SOA) may be inaccurate,which would have the tendency to artificially enhance modelSOA yields.
Improved SOA modules that integrate these recent ad-vances are under development and need extensive evaluationagainst chamber and ambient aerosol data. Assessment of thesignificance of some of the above mentioned SOA formationpathways (including the role of biogenic isoprene) in an ur-ban polluted environment is precisely one of the objectivesof the present modeling study in Mexico City.
Modeling of organic aerosols had suffered for a long timefrom the limited availability of ambient OA measurements(including speciation and tracers) due to the high cost, lowsensitivity, and low time and size resolution of most OAmeasurement methods until recently (McMurry et al., 2000).The MILAGRO (Megacity Initiative – Local and GlobalResearch Observations) field experiment that took place inMexico City during March 2006 provides in that perspec-tive a unique dataset to study the formation and evolution oforganic aerosols and their precursors (Molina et al., 2008).Extensive measurement of meteorological variables, gaseousand aerosol pollutants and radiative properties were collectedat several urban and near-urban sites as well as aboard re-gional aircraft flights with the purpose of characterizing thechemical nature and spatial extent of the urban plume, andits transformations during the outflow.
Results from both surface and airborne measurements ofthe aerosol composition indicate that Mexico City’s fine par-ticles are dominated by organic material (e.g. Salcedo et al.,2006; DeCarlo et al., 2008; Aiken et al., 2009a). The box-model study by Volkamer et al. (2006) could only explain35% (12%) of the observed OOA concentrations in the morn-ing (afternoon) from traditional anthropogenic precursors(mostly aromatics) inside the city during a case study withvery low regional or biomass burning influence. Dzepina etal. (2009) have recently revisited that case study and shownthat even with updated aerosol yields, traditional precursorsfail to explain more than 15% of the observed OOA growthduring that case study. Given the high correlation of organicaerosols with CO and HCN, several studies concluded thatanthropogenic activities and biomass burning are the mainsources of organic aerosols in the Mexico City area duringthe warm dry season (e.g. DeCarlo et al., 2008; Crounse etal., 2009).14C analyses have attributed 30–75% of the totalcarbonaceous aerosol observed at the city center to “mod-ern” carbon sources (i.e. biomass and agricultural burningactivities, vegetation emissions, and urban sources of mod-ern carbon such as food cooking and biofuel use; Hildemannet al., 1994; Aiken et al., 2009b; Marley et al., 2009), thebalance being due to ”fossil”carbon (i.e. POA and SOA fromthe combustion of fossil fuels). The relative importance of“modern” carbon seems to be higher at the near-city location(T1) than within the city (T0) suggesting a larger regional in-fluence of non-fossil OA sources. This fraction is consistentwith data reported in Europe (Szidat et al., 2004) and in theUS (Hildemann et al., 1994; Lemire et al., 2002), which sug-gest dominant biomass contribution to SOA production. It ishowever unclear what proportion of this modern carbon orig-inates from regional biomass burning vs. biogenic SOA vs.urban sources such as food cooking. Inside Mexico City theformation of biogenic SOA is reported to be small, e.g. in abox-model framework Volkamer et al. (2006) report that iso-prene and terpenes contribute less than 5% to the total VOC-OH reactivity while Dzepina et al. (2009) report that thosespecies account for∼2% of the SOA predicted to form fromthese biogenic precursors inside the city. Their studies werehowever intended to look only at stagnant conditions becausethe box model calculations could not account for transport.Since stagnant conditions are infrequent in Mexico City, theregional effects are likely to be important. A more significantcontribution of BSOA would be expected for this tropical re-gion where biogenic emissions (Guenther et al., 1995) andconcentrations of hydroxyl radicals are at their maximum.We are not aware of any studies that have evaluated the im-portance of biogenic SOA on the region around Mexico City.However, the high fraction of modern carbon observed evenin periods with low biomass burning (Aiken et al., 2009b)provides additional motivation to investigate this topic.
In this study, we use measurements from several AerodyneAerosol Mass Spectrometers (AMS) taken at three groundlocations in order to evaluate the skill of the urban-scale
www.atmos-chem-phys.net/9/6949/2009/ Atmos. Chem. Phys., 9, 6949–6982, 2009

6952 A. Hodzic et al.: Modeling organic aerosols during MILAGRO
chemistry-transport model CHIMERE in simulating OAwithin the Mexico City metropolitan area. The main focusof the study is to investigate the efficiency of various SOAformation pathways represented in the model and to quan-tify the relative contribution of anthropogenic and biogenicSOA precursors. We compare the measurements to resultsfrom Positive Matrix Factorization of AMS spectra (PMF,Ulbrich et al., 2009; Aiken et al., 2009a, b) which allow thequantification of hydrocarbon-like OA (HOA, a chemically-reduced component which is considered a surrogate for ur-ban POA, including sources such as meat cooking), oxy-genated OA (OOA, an SOA surrogate), and biomass burningOA (BBOA). Being able to quantify separately the BBOAfraction allows estimating errors related to the modeling ofprimary organic aerosols from biomass burning that are dif-ficult to predict in models due to large uncertainties in emis-sion factors and the amount of biomass burned (Fast et al.,2009; Aiken et al., 2009b; Zaveri et al., 2008). In particular,small burning activities (i.e. trash and agricultural fires) arenot detected by satellites and therefore not accounted in theemissions retrievals (Yokelson et al., 2009).
Because of the great diversity of SOA formation and evo-lution processes we limit the discussion in this paper toformation processes that control concentrations of organicaerosols within the city (close to the emission sources). Theevolution and aging of the organic aerosols in the outflowof the Mexico City plume will be addressed in future stud-ies. The present paper is organized as follows: the MILA-GRO measurements and model configuration are describedin Sects. 2 and 3, respectively. In Sect. 4, the model abil-ity to represent the transport and mixing of pollutants withinthe city is evaluated by examining meteorological variablesand primary emitted pollutants. In Sect. 5, model predictionsof primary and secondary OA are assessed against AMS re-sults, and the relative contribution of the major SOA forma-tion pathways is discussed. Section 6 summarizes the con-clusions of the study.
2 Ground observations during the MILAGRO fieldproject
The MILAGRO (Megacity Initiative: Local and Global Re-search Observations) field project took place in Mexico Cityin March 2006. During 1 month an extensive set of measure-ments of meteorological variables, gas and aerosol pollutantconcentrations, chemistry and radiation was collected fromground platforms, aircrafts and satellites, and made publiclyavailable through NCAR, NASA, and DOE data portals. Thesummary of scientific objectives and experimental design isdescribed by Molina et al. (2008). In this section we brieflypresent characteristics of measurement sites and data setsused in this study. MILAGRO is the largest of a series ofinternational campaigns in and around Mexico City, which
also includes IMADA-AVER in 1997 (Edgerton et al., 1999)and MCMA-2003 (Molina et al., 2007).
To evaluate the model results for POA and SOA within thecity basin we use AMS measurements of submicron aerosols(approx. PM1) collected at two supersites (Fig. 1a) at theInstituto Mexicano del Petroleo (designed as T0) and Uni-versidad Technologica de Tecamac (T1). Data collected bythe Aerodyne Mobile Laboratory located on an elevated siteof Pico Tres Padres (PTP, 900 m above city ground) on theNorth of Mexico City are also used. The AMS and its cali-bration and data analysis techniques have been described indetail elsewhere (Canagaratna et al., 2007, and referencestherein). The AMS at T0 was a high-resolution time-of-flight AMS (DeCarlo et al., 2006) while those at the othertwo sites were compact time-of-flight versions (Drewnick etal., 2005) which report unit mass resolution data. Detailedanalyses and intercomparisons of the AMS data are reportedin separate publications (Aiken et al., 2008, 2009a, b; Hern-don et al., 2008; Paredes-Miranda et al., 2008; Zheng et al.,2008; de Gouw et al., 2009; Huffman et al., 2009; Yu etal., 2009). The T0 AMS + refractory measurements (Aikenet al., 2009a) showed overall composition, diurnal cycles,and size distributions that were similar to those from pre-vious data collected at another urban site during the MCMA-2003 campaign (Salcedo et al., 2006). Aiken et al. (2009a)and Paredes-Miranda et al. (2009) present intercomparisonswhich are consistent with the AMS accuracy of±25%. TheAMS spectra are analyzed with the PMF technique (Paateroand Tapper, 1994) as described by Ulbrich et al. (2009) andAiken et al. (2009a). The absolute uncertainty of the AMSconcentrations is±25% and is dominated by the uncertaintyin particle collection efficiency, while the relative uncertaintyin the separation of PMF components is of the order of 10%(somewhat lower for high resolution data vs. the unit resolu-tion data). It should be noted that AMS data are reported forambient atmospheric conditions (T & P) for all three sites, asis the model output.
Observed PBL heights were derived by Shaw et al. (2007)from measured vertical gradients in the radio refractive in-dices and light scattering obtained by radar wind profilersand a lidar, respectively. Uncertainties associated with theseretrievals are of the order of a few hundred meters.
In addition to the MIRAGE dataset, model results havealso been assessed against surface chemical and meteoro-logical data collected by the RAMA monitoring network.Comparisons were performed at measurement locations (seeFig. 1) for hourly concentrations of ozone, carbon monoxide,nitrogen oxides and particles as well as meteorological dataincluding surface temperature, relative humidity, wind speedand wind direction.
Atmos. Chem. Phys., 9, 6949–6982, 2009 www.atmos-chem-phys.net/9/6949/2009/

A. Hodzic et al.: Modeling organic aerosols during MILAGRO 6953
Fig. 1. CHIMERE geographical domains used over the Mexico re-gion. Runs were performed at(a) fine (i.e. 5×5 km2) and(b) coarse(i.e. 35×35 km2) horizontal resolution respectively. The small-scale domain extends from 101.1◦ W to 98.3◦ W and 18.6◦ N to21.1◦ N, and is embedded into the coarse-scale domain. The con-tours represent the distribution of emissions (Tons/km2/day) aver-aged over 4–30 March 2006 period for (a) anthropogenic CO in thevicinity of the Mexico City and (b) regional isoprene estimates fromthe MEGAN model. The location of MILAGRO field campaignmeasurement sites used in this study including supersites (T0, T1,T2), mobile site of Pico de Tres Padres (PTP, cross north of T0) andRAMA monitoring air quality network (dots) are also included. Iso-contours indicate the terrain height, with contours from 1 to 4 km.MC indicates the location of Mexico City.
3 Air quality model CHIMERE
3.1 General model description
In order to simulate the formation and transport of majorprimary, photo-oxidant, and aerosol pollutants over MexicoCity, the meso-scale chemistry-transport model CHIMEREis applied. CHIMERE has been widely used in Europe for airquality process studies (e.g. Bessagnet et al., 2004; Hodzic etal., 2004), operational forecasting (http://www.prevair.org)and inverse modeling of emissions (e.g. Konovalov et al.,2007). Although this is the first time it has been appliedin a highly polluted megacity-type environment, its perfor-mance in simulating aerosols has been demonstrated withinseveral model inter-comparison studies (e.g. Stern et al.,2008) and field projects (e.g. Hodzic et al., 2006a) in Eu-rope. Improving the representation of organic aerosols con-stitutes one of the major challenges for CHIMERE (Bessag-net et al., 2009). A detailed description of the model ispresented in previous references and can also be found onhttp://euler.lmd.polytechnique.fr/chimere. In this section, webriefly describe the aerosol module and the updates that havebeen included for the purpose of this study.
Tropospheric photochemistry is represented using theMELCHIOR chemical mechanism (Lattuati, 1997) that in-cludes 120 reactions and 44 prognostic gaseous species.In addition to gaseous pollutants, 10 aerosol componentsare considered in the present application, including primaryorganic (POA) and black (BC) carbon, other unspecifiedprimary anthropogenic components, wind-blown dust, sec-ondary inorganics (sulfate, nitrate and ammonium) as well assecondary organic aerosols from anthropogenic and biogenicorigin, and particulate water. The size distribution is repre-sented using a sectional distribution, considering 8 size binsgeometrically spaced from 40 nm to 10µm in physical diam-eter. The thermodynamic partitioning of the inorganic mix-ture (i.e. sulfate, nitrate, and ammonium) is computed usingthe ISORROPIA model (Nenes et al., 1998). The dynami-cal processes influencing aerosol growth such as nucleation,coagulation and absorption of semi-volatile species are in-cluded in the model as described by Bessagnet et al. (2004).The wind-blown dust is accounted for in the model follow-ing Vautard et al. (2005). Heterogeneous chemical processesonto particles (Hodzic et al., 2006b) and a simplified sulfuraqueous chemistry are also considered. Dry and wet depo-sition for all gaseous and aerosols species are computed asa function of the friction velocities and stability of the low-est model layer (Wesely, 1989), and as a function of grid-averaged precipitation rates and cloud water content (Tsyro,2002; Loosmore and Cederwall, 2004), respectively. Clearsky photolysis rates are calculated off-line based on the TUVmodel (Madronich et al., 1998), and they are modified whenin the presence of clouds. The effect of aerosols on photoly-sis rates is not included (Hodzic et al., 2007).
www.atmos-chem-phys.net/9/6949/2009/ Atmos. Chem. Phys., 9, 6949–6982, 2009

6954 A. Hodzic et al.: Modeling organic aerosols during MILAGRO
3.2 SOA formation from anthropogenic and biogenicVOC precursors
Modeling of secondary organic aerosol formation requires(i) a gas-phase mechanism to predict the rate of formation ofsemivolatile products from the oxidation of VOCs, and (ii) athermodynamic module to predict the gas-particle partition-ing of these species. In CHIMERE, SOA formation is repre-sented according to a simplified approach described by Punet al. (2005, 2006). The performance of this SOA formationmechanism has been assessed mainly against smog chamberdata (Pun et al., 2006), and with total daily-averaged OC con-centrations in the US (Pun et al., 2003) and Europe (Bessag-net et al., 2009). In the present study, the predicted SOAfrom CHIMERE will be evaluated for the first time againstAMS measurements offering high temporal resolution andsome chemical/source resolution.
3.2.1 Gas-phase chemistry of precursors
The MELCHIOR gas-phase mechanism has been extendedto account for one-step lumped oxidation of aromatic andbiogenic compounds as shown in Table 1 (Pun et al., 2005,2006; Bessagnet et al., 2009). For anthropogenic com-pounds, three families of precursors are considered in-cluding benzene, toluene and other mono-substituted aro-matics (TOL); xylene, tri-methyl-benzene and other poly-substituted aromatics (TMB); and higher alkanes. The gas-phase chemistry (oxidation by OH, O3 and NO3) of four bio-genic SOA surrogates are considered in this study includ-ing α-pinene and sabinene (APIN);β-pinene andδ3-carene(BPIN); limonene (LIM); ocimene and myrcene (TPO). Day-and nighttime chemistry of isoprene has been added for thisstudy as described below. Other reactive biogenic VOCssuch as sesquiterpenes are not considered here because theiremissions are highly uncertain. Recent work by Liao etal. (2007) indicated a small contribution of these precursorsto SOA formation compared to isoprene and monoterpene,while other studies have reported a comparable contributionto SOA among these three sets of precursors (Kleindienst etal., 2007).
The condensable oxidation products from both anthro-pogenic and biogenic precursors are lumped into 9 groupsof surrogate compounds (i.e. AnA0D, AnA1D, AnA2D,AnBmP, AnBlP, BiA0D, BiA1D, BiA2D, BiBmP) accord-ing to their physico-chemical properties including their hy-drophobicity, acid dissociation and saturation vapor pressure(see Table 2). As explained by Pun et al. (2006), the physico-chemical properties of surrogate species, such as the molec-ular weight, are determined based on the structure and func-tional groups of each surrogate compound. The Henry’s lawconstant and the saturation vapor pressure of the surrogatespecies are derived from the geometric average property ofthe group.
In this study all hydrophilic oxidation products (e.g.,AnA0D, AnA1D, AnA2D) were grouped into a single surro-gate compound (i.e. AnA1D for anthropogenics and BiA1Dfor biogenics) in order to increase computational efficiency.The stoichiometry coefficient for this product was derivedfrom the sum of the stoichiometry coefficients of individualhydrophilic oxidation products used in the base model pre-sented in Pun et al. (2005, 2006). According to several stud-ies (Griffin et al., 2002; Pun et al., 2003; Varutbangkul et al.,2006; Prenni et al., 2007) based on laboratory experiments,most SOA products present in the particulate phase are notvery hydrophilic. Therefore, grouping hydrophilic oxidationproducts into a single hydrophilic compound (AnA1D for an-thropogenic and BiA1D for biogenic species) with moderatesaturation vapor pressure characteristics is not expected togreatly impact the predicted SOA mass and seems to be areasonable assumption in this study.
In this work we assume that all gaseous semi-volatileorganic species undergo dry deposition based on We-sely (1989). As the deposition velocities for these specieshave not yet been determined, deposition velocities havebeen calculated similar to NO2. The actual deposition veloc-ities of the semivolatile and at least somewhat polar speciesthat partition to SOA are likely to be larger than that of NO2,however this assumption provides a conservative upper limitof the amount of SOA that the model can produce. Consid-eration of dry deposition with the NO2 deposition velocityis expected to lower the predicted SOA concentrations by10–20% with respect to a run in which dry deposition wasignored (Bessagnet et al., 2009).
3.2.2 Gas/particle partitioning of condensable material
The gas/particle partitioning is treated as an external mix-ture of hydrophilic and hydrophobic particles (Pun et al.,2006). Hydrophilic SOA surrogates dissolve into existingaqueous particles (associated with the inorganic phase) fol-lowing Henry’s law. Hydrophobic SOA surrogates absorbinto organic particles according to equilibrium gas/particlepartitioning (Raoult’s law) between the aerosol phase andgas phase. The equilibrium concentrations are a function ofthe particle chemical composition, temperature and relativehumidity for hydrophilic species (Pun et al., 2006). Simi-lar to Bessagnet et al. (2009), the mass transfer between gasand aerosol phases is represented by dynamic gas-particleabsorption theory for each aerosol size bin. However, un-like in Bessagnet et al. (2009) that used both inorganic andsecondary organic aerosol mass for the partitioning of semi-volatile organics to obtain an upper limit of SOA formation,even though equilibrium partitioning of SOA into inorganicaerosols has not been demonstrated experimentally, we usein this study the better justified assumption of semivolatilepartitioning into a well-mixed organic phase (POA+SOA).This results in a considerably lower, but presumably morerealistic, amount of SOA being formed by the model at the
Atmos. Chem. Phys., 9, 6949–6982, 2009 www.atmos-chem-phys.net/9/6949/2009/

A. Hodzic et al.: Modeling organic aerosols during MILAGRO 6955
Table 1. Gas-phase chemical mechanism for SOA formation as used in the CHIMERE model.
VOC Precursors Oxidation Reactions Kinetics (cm3 molec−1 s−1)
Toluene TOLa,b + OH→0.005 AnA1D + 0.084 AnBmP + 0.013 AnBlP 1.81×10⁻¹²exp(355/T)Tri-methyl-benzene TMBa,b + OH→0.005 AnA1D + 0.088 AnBmP + 0.006 AnBlP 9.80×10⁻⁹/THigher alkanes ALKc + OH→0.07 AnBmP 1.36×10⁻¹²exp(190/T)(300/T)−2
α−pinene and sabinene APINa+ OH→0.57 BiA1D 1.21×10⁻¹¹ exp(444/T)APINa+ NO3→0.80 BiBmP 1.19×10⁻¹²exp(490/T)APINa+ O3→0.39 BiA1D 1.01×10⁻¹⁵exp(−732/T)
β−pinene andδ3-carene BPINa+ OH→0.21 BiA1D 2.38×10⁻¹¹exp(357/T)BPINa+ NO3→0.80 BiBmP 2.51×10⁻¹²
BPINa+ O3→0.26 BiA1D 1.50×10⁻¹⁷
Limonene LIMa+ OH→0.455 BiA1D 1.71×10⁻¹⁰
LIM a+ O3→0.19 BiA1D 2.0×10⁻¹⁶
Octimene and mycene TPOa+ OH→0.775 BiA1D 5.1×10⁻¹⁶/TTPOa+ NO3→0.775 BiA1D 4.3×10⁻⁹/TTPOa+ O3→0.555 BiA1D 7.5×10⁻¹⁴/T
Isoprene ISOd + OH→0.232 ISO1 + 0.0288 ISO2 2.55×10⁻¹¹exp(410/T)ISOe+ NO3→0.089 ISO3 + 0.203 ISO4 7.0×10⁻¹³
a Simplified mechanism based on Pun et al. (2005, 2006); in this study all hydrophilic oxidation products were grouped into a single surrogatecompound (AnA1D for anthropogenics and BiA1D for biogenics) in order to increase the computational efficiency. The stoichiometriccoefficient for this product was derived from the sum of the stoichiometric coefficients of individual hydrophilic oxidation products usedin the base model presented by Pun et al. (2005, 2006). According to several studies (e.g. Pun et al., 2003, 2006) based on laboratoryexperiments, most SOA products present in the particulate phase are hydrophobic (Pun et al., 2003 reported>80% of hydrophobic SOAin their simulation in the southern US). Therefore, grouping hydrophilic oxidation products into a single hydrophilic compound (AnA1Dfor anthropogenic and BiA1D for biogenic species) with moderate saturation vapour pressure characteristics is a reasonable assumption.The following molecular weight (g/mol) and enthalpy of vaporization (kJ/mol) were considered for SOA surrogates: AnA1D (168 g/mol;88 kJ/mol), AnBmP (152 g/mol; 88 kJ/mol), AnBlP (167 g/mol; 88 kJ/mol), BiA1D (170 g/mol; 88 kJ/mol), BiBmP (236 g/mol; 175 kJ/mol).b Emissions of anthropogenic VOCs are grouped into classes of precursors: all mono-substituted single-ring aromatic compounds such astoluene and ethylbenzene are combined as high SOA yield aromatic precursors with toluene (TOL) as representative precursor. All poly-substituted single-ring aromatic compounds such as xylene and trimethylbenzene are combined as low SOA yield aromatic precursors withtrimethylbenzene (TMB) as representative precursor (Pun et al., 2006).c similar to Bessagnet et al., (2009).d Henze and Seinfeld (2006) formulation under low-NOx conditions;e Nighttime chemistry of isoprene following Ng et al. (2008).
Table 2. Proprieties of hydrophobic organic aerosols in CHIMEREfollowing Pun et al. (2005, 2006) and Henze and Seinfeld (2006).
Condensable Saturation concentrationa Vaporization enthalpySpecies (µg/m3) (kJ/mol)
AnBlP 1.8×10⁻² 88AnBmP 24.5 88BiBlP 9.6×10⁻³ 175BiBmP 3.8 175ISO1 116 88ISO2 0.62 88ISO3 5495 88ISO4 21 739 88
a The partitioning parameters are given at 298 K for AnBIP,AnBmP, BiBIP, BiBmP, and 295 K for isoprene derived species.
regional scale compared to the model formulation of Bessag-net et al. (2009). In this study POA species are treated asnon-volatile.
3.2.3 Additional SOA formation pathways consideredin this study
In addition to the SOA module based on Pun et al. (2005,2006), we consider here two newly recognized SOA forma-tion pathways including the oxidation of isoprene by OH(Henze and Seinfeld, 2006) and the nighttime oxidation ofisoprene by nitrate radicals (Ng et al., 2008).
Recently, isoprene has been identified to significantly con-tribute to SOA formation (e.g. Limbeck et al., 2003; Claeyset al., 2004; Kroll et al., 2006). Henze and Seinfeld (2006)have reported an increase of a factor of 2 in predicted SOAconcentrations at the global scale after accounting for SOAformation from isoprene. Within the CHIMERE model, SOA
www.atmos-chem-phys.net/9/6949/2009/ Atmos. Chem. Phys., 9, 6949–6982, 2009

6956 A. Hodzic et al.: Modeling organic aerosols during MILAGRO
production from isoprene is represented according to thetwo-product parameterization under low-NOx conditions de-veloped by Henze and Seinfeld (2006) based on experimen-tal data from Kroll et al. (2006). Table 1 presents the first-generation oxidation of isoprene by OH leading to the forma-tion of two semivolatile products (ISO1 and ISO2) that canbe absorbed into aerosols following gas/particle equilibriumpartitioning theory (see Table 2).
In addition to the daytime chemistry of isoprene, it hasbeen observed that isoprene mixing ratio drops rapidly aftersunset when OH radicals are no longer available (e.g. Stroudet al., 2002). The rapid reaction with nitrate radicals, NO3,is believed to be the major contributor to isoprene decay atnight, leading to the formation of low-volatility products (Nget al., 2008; Brown et al., 2009). Table 1 presents the reac-tion of isoprene and NO3 as it was included into CHIMERE.This first-generation oxidation leads to the formation of twosemivolatile reaction products (ISO3 and ISO4) that can fur-ther be partitioned to the aerosol phase (Table 2).
3.3 Model configuration and simulation design for MI-LAGRO
3.3.1 Model setup
CHIMERE baseline and sensitivity simulations are per-formed locally over the Mexico City area using a one-waynesting procedure where a coarse simulation with a 35 kmhorizontal resolution over all of Mexico and the North ofCentral America (Fig. 1) is first carried out. Boundary con-ditions for this regional simulation are provided by monthlyclimatology of the LMDZ/INCA global chemistry-transportmodel (Hauglustaine et al., 2004) for gaseous species and theGOCART model (Ginoux et al., 2001) for aerosol species.Concentrations from this regional simulation are then usedevery hour to force at the boundaries the higher resolutionsimulation (5×5 km2), performed over a nested grid of Mex-ico City and surrounding region (Fig. 1). Vertically, ter-rain following hybrid sigma-pressure coordinates are usedincluding 20 vertical layers, unequally distributed betweenthe ground and the 300 hPa pressure level.
The meteorological input fields are taken from the MM5mesoscale model (Dudhia et al., 1993). MM5 is initializedand forced at the boundaries by the 6-hourly analyses of theAVN model of the National Centers for Environmental pre-diction (NCEP), given on a 1◦×1◦ grid. In order for themodel to stay close to the analyses for this month-long sim-ulation, the nudging option is used above the boundary layerthroughout the MM5 model domain for wind and tempera-ture.
3.3.2 Anthropogenic emissions
Anthropogenic emissions for the Mexico City metropolitanarea (MCMA) are based on the 2002 official Mexican emis-
sion inventory (CAM, 2004). This emission set has alreadybeen used and evaluated in previous modeling studies overMexico City (Lei et al., 2007; Fast et al., 2009). The method-ology used to derive spatially and temporarily resolved emis-sions from total annual quantities reported in the inventoryis described by Lei et al. (2007). The total annual emis-sions of VOCs, CO, NOx and aerosols for various sourcecategories including mobile, area and point sources weretransformed into temporally resolved and chemically speci-ated emission data: (i) the diurnal cycle was applied for allspecies based on West et al. (2004); (ii) the weekend effectwas also considered based on traffic count information forCO and resulted in an decrease of total emissions by 10%for Saturdays and 30% for Sundays compared to week-dayemissions; (iii) the volatile organic compound (VOC) spe-ciation was performed following the procedure described inVelasco et al. (2007). Based on an extensive comparison withthe ground observations from the 2003 MCMA field experi-ment, Lei et al. (2007) have adjusted the emissions for VOCspecies used in the present inventory to better match the ob-served values. That resulted in an increase of 65% of theVOC total emitted mass, but with variable adjustment for in-dividual VOCs components. Outside Mexico City we com-plemented the MCMA emission inventory by the regionalNEI 1999 emissions (M. Mena, personal communications,2007). The description of the inventory can be found athttp://mexiconei.blogspot.com/. Fast et al. (2009) suggest that theMCMA inventory is more accurate than the NEI for CO andEC. Total emission rates over fine and coarse model domainsare summarized in SI-Table 1http://www.atmos-chem-phys.net/9/6949/2009/acp-9-6949-2009-supplement.pdffor sev-eral gaseous and aerosols species used in this study.
Emissions from biomass burning activities are accountedfor in the present study with the same procedures as in Fast etal. (2009) and resulting in similar predicted concentrations.Estimates of daily emissions of trace gases and primary par-ticles together with their geographic location were derivedfrom satellite data as described by Wiedinmyer et al. (2006)and included within the CHIMERE model following Hodzicet al. (2007).
3.3.3 Biogenic emissions
Hourly emissions of nitrogen oxides and eight biogenic VOCspecies (isoprene,α-pinene,β-pinene, myrcene, sabinene,limonene,δ3-carene, ocimene) are considered in this study.In the standard configuration of CHIMERE biogenic emis-sions are calculated using the algorithms of Guenther etal. (1995), combined with emissions factors for Europeanspecies (e.g. emission potential, foliar density, tree distri-bution) developed by Simpson et al. (1999). As such char-acterization of the vegetation is not available for the Mex-ico City region, biogenic emissions were generated using theglobal scale model MEGAN (Model of Emissions of Gasesand Aerosols from Nature,http://bai.acd.ucar.edu) developed
Atmos. Chem. Phys., 9, 6949–6982, 2009 www.atmos-chem-phys.net/9/6949/2009/

A. Hodzic et al.: Modeling organic aerosols during MILAGRO 6957
Table 3. Description of the CHIMERE model simulations carried out in this study.
Name of the experiment Description of the model run
ANT-T SOA formation from only anthropogenic VOC precursors with traditional partitioning theoryANT-EP Similar to ANT-T with enhanced partitioning efficiency toward aerosol phaseBIO-T SOA formation from both biogenic and anthropogenic VOC precursors with traditional partitioning theoryBIO-ANT Similar to BIO-T with isoprene emissions from anthropogenic sourcesBIO-EP Similar to BIO-ANT with enhanced partitioning efficiency toward aerosol phaseBIO-NT Similar to BIO-ANT including the nighttime production of SOA from isoprene
by Guenther et al. (2006). The emission rates are deter-mined as a function of (i) gridded emission factors aver-aged over local plant functional types (i.e. needleleaf trees,broadleaf trees, shrubs, grass, crops) at standard conditions,and (ii) several activity factors that account for variationsof environmental conditions with respect to the standard.The driving environmental variables are (i) monthly meanleaf area index (LAI) provided with MEGAN and derivedfrom satellite observations, and (ii) ambient temperature andshort-wave radiation supplied at hourly rates by the MM5model. The variation of LAI is used to calculate a leaf-age activity factor, while the other two variables are usedto simulate the hourly vegetation response to leaf temper-ature and photo-synthetically active radiation respectively.The evaluation of the MEGAN model with regard to iso-prene emissions has been extremely limited, and mainlybased on in-situ flux measurements or satellite data of iso-prene reaction products such as formaldehyde. Muller etal. (2008) have reported a reasonable agreement betweensimulated and measured isoprene fluxes over the SouthernUS, while Warneke et al. (2009) report a slight overesti-mation of isoprene from MEGAN over the Eastern US andTexas. For our region of interest, we verified that the spa-tial distribution of broadleaf trees which are the main emit-ter of isoprene is consistent with vegetation types providedby an independent data base (Global Land Cover Facility,GLCF, http://glcf.umiacs.umd.edu/). In addition, we com-pared modeled isoprene concentrations with canister-basedmeasurements from the G1 aircraft that were available duringMILAGRO (see SI-Fig. 1http://www.atmos-chem-phys.net/9/6949/2009/acp-9-6949-2009-supplement.pdf). The com-parison is limited to the immediate vicinity of Mexico City,and shows that predicted isoprene is of comparable magni-tude or lower than the measured values, suggesting that theisoprene emissions are not overestimated in our model. Sim-ilar results are also found for ground isoprene values withinthe city (as discussed in Sect. 5.4). Data are however notavailable over forest areas in the coastal region where thehighest isoprene emissions are predicted by the model (seeFig. 1).
3.3.4 Simulations
For this study, the CHIMERE model is run from 1 to 31March 2006 for both regional and urban-scale simulations. A3-day spin-up, from 1 to 3 March, is considered to initializethe model from climatological values and the model predic-tions for this time period are not used for comparisons withobservations. Several model simulations were carried out(see Table 3) in order to determine the relative contributionto SOA formation of various precursor sources including an-thropogenic, biogenic and biomass burning emissions, and toevaluate the sensitivity to the gas/particle partitioning param-eters. For comparison with measurements, the simulated pa-rameters are spatially and temporally interpolated at the loca-tion of the measurement sites. The ground measurements arecompared with the model’s lowest level (about 25 m abovethe surface). Only predicted organic aerosols from the lowerfive size bins (below 1.2µm in diameter) were considered forthe comparison with AMS measurements. The size cut of themodel is larger than that of the measurements, and this intro-duces some additional uncertainty in the comparisons, but itshould provide an upper limit of the expected SOA concen-tration.
4 Chemical and meteorological conditions
4.1 Synoptic weather during March 2006
Weather conditions during March 2006 were typical of thedry season in Mexico characterized by clear skies, low hu-midity, and weak winds aloft associated with high-pressuresystems. Afternoon maximum temperatures within the cityranged from 20 to 29◦C, and surface winds were below5 m/s most of the time (Fig. 2). According to observedwind regimes, three types of synoptic conditions were distin-guished by Fast et al. (2007): (i) the first regime prior to 14March was characterized by a high pressure system slowlymoving from northwestern Mexico towards the east associ-ated with northerly and easterly synoptic winds over Mex-ico City. (ii) the second regime between 14 and 23 March,was associated with the passage of a weak cold surge on 14March, the development of late afternoon convection, andvariable wind directions. The rest of this period was drier
www.atmos-chem-phys.net/9/6949/2009/ Atmos. Chem. Phys., 9, 6949–6982, 2009

6958 A. Hodzic et al.: Modeling organic aerosols during MILAGRO
Fig. 2. Time series of meteorological variables (2 m-temperature, wind speed and relative humidity) simulated by the model (full line) andmeasured by RAMA network (dotted line) from 4 to 31 March 2006. 15 RAMA stations measuring meteorological data were available forthis comparison. Statistical indicators such as the bias, the Root Mean Square Error (RMSE) and the correlation coefficients (Corr.) are alsoincluded for this comparison.
as the deep convection gradually diminished after 18 Marchand synoptic winds progressively turned southwest. (iii) Thethird regime after 23 March began with the passage of astrong cold surge that lead to higher humidity, afternoon con-vection, and precipitation over the central plateau. After 25March, high pressure progressively developed over southernMexico associated with westerly winds over central Mexicofor the rest of the month. A detailed overview of meteo-rological conditions during MILAGRO can be found in theoverview by Fast et al. (2007).
4.2 Ozone and aerosol surface concentrations duringthe period
Figure 3 shows average hourly concentrations of O3 andPM2.5 observed by urban stations of the RAMA network dur-ing March 2006. Moderately high ozone levels are observedduring the entire month with ozone peaks generally exceed-ing 70 ppbv in the afternoon, except from 18 to 20 March, aperiod during which peak concentrations remained below av-erage. These three days were associated with stronger windsboth at the surface and aloft (not shown here), causing fasterdispersion of pollutants. Ozone diurnal variability is typi-cal of a photochemically generated pollutant with peak con-centrations occurring in the early afternoon (i.e. from 12:00
Atmos. Chem. Phys., 9, 6949–6982, 2009 www.atmos-chem-phys.net/9/6949/2009/

A. Hodzic et al.: Modeling organic aerosols during MILAGRO 6959
to 16:00 LT). Evening concentrations decrease significantlyand remain very low (<10 ppb) during the night due to titra-tion with fresh NO emissions. Strong day-to-day variabilityin the spatial distribution of ozone concentrations (also truefor other species) is observed during the MILAGRO experi-ment caused by important changes in the surface circulationpatterns.
The PM2.5 average concentrations vary from morningpeak traffic hour values of 30µg m−3 to an afternoon peakvalue of 50–55µg m−3. It is clear that aerosol has both pri-mary and secondary influences that lead to a significant in-crease of the concentrations during the morning rush hourand then a significant mass creation in the late morning byphotochemistry. As already noted by Stephens et al. (2008)for PM10, the observed PM2.5 evening peak occurs two hoursearlier (02:00 UTC i.e. 20:00 LT) than CO and NOx peaks(04:00 UTC i.e. 22:00 LT), and its temporal occurrence is notwell captured by the model. The presence of a large amountof coarse particles (revealed by the difference between PM10and PM2.5 observations, not shown) suggests that wind-blown dust is contributing significantly to the aerosol loadin the late afternoon (Querol et al., 2008) in addition to re-maining high levels of secondary aerosols produced duringthe daytime. The wind-blown dust is accounted for in themodel, and it represents a large fraction of the predictedPM2.5 aerosol within the city (contribution ranging from 10%up to 70% on windy days). Background concentrations aremaintained over night, most likely the consequence of lim-ited vertical dispersion of primary emissions in a shallownighttime boundary layer, and of transport of regionally gen-erated particulates into the basin from surrounding areas latein the day (Moffet et al., 2007).
Unlike for other polluted cities, e.g. Paris (Hodzic et al.,2006a) or Pittsburgh (Zhang et al., 2005c), we do not ob-serve strong multi-day accumulation of pollutants within theMexico City basin during March 2006 despite the fact thatthe daily production of primary and secondary pollutants isvery intense. Although the city is in a basin and is mostlysurrounded by mountains, the valley is well ventilated at theend of the day as a result of converging thermally-driven cir-culations (Fast and Zhong, 1998; de Foy et al., 2006) andbecause it is open to both the north and south (see Sect. 4.3).
4.3 Evaluation of meteorological and chemical simula-tion
The meteorological variables such as wind speed and plan-etary boundary layer (PBL) height are essential parametersthat control the dispersion and vertical mixing of gaseous andaerosol pollutants. Thus, before evaluating the CHIMEREchemistry-transport model skill to reproduce aerosol pollu-tant concentrations we first examine whether these meteo-rological variables are adequately reproduced by the MM5meteorological model during the period of interest.
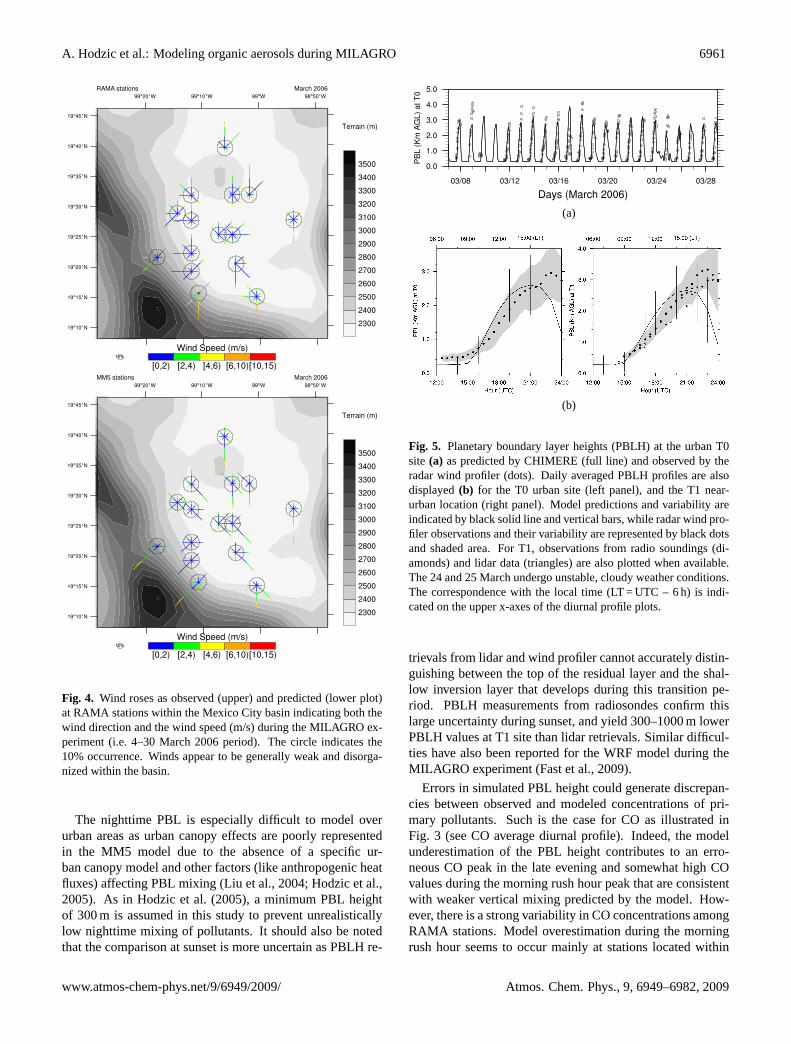
Figure 4 shows windroses of observed and modeled windsfor each of the 15 available RAMA surface stations. Bothmodel and measurements indicate the occurrence of weak(<5 m/s) and disorganized winds during March 2006 in re-lation with stagnant atmospheric conditions and valley-typenear-surface circulation. The valley’s influence on wind di-rection is clear for stations located at the southwest edge ofthe city with winds predominantly from the southwest in-dicative of the down-slope circulation. This southwesterlyflow is qualitatively represented by the model. In the easternpart of the basin, surface circulation is dominated by strongersoutherly winds (up to 10 m/s) which penetrate the basin inthe afternoon through the southeast mountain gap bringingbackground air from outside the basin (Doran and Zhong,2000). Modeled southerly flow is more frequent than ob-served and goes deeper into the basin leading to a higher fre-quency of southerly winds at four northern stations. Thisqualitative comparison suggests that the model is capturingthe overall features (wind direction and speed) of the near-surface circulation reasonably well.
A more systematic comparison of measured and simu-lated average wind speed at RAMA sites displayed in Fig. 2bdemonstrates the ability of the model to reasonably repro-duce the temporal variability of the wind velocity during MI-LAGRO. On most of the days, predicted wind speed fall intothe observational variability interval and the overall modelbias is small (0.21 m/s). During the day winds stay relativelyweak (∼1 m/s) until late afternoon when they increase sig-nificantly (>3 m/s) favoring the dispersion of pollutants.
Figure 2 also shows temporal trends of observed and pre-dicted surface temperature and relative humidity averagedamong all RAMA stations. Surface temperature is predictedaccurately for the entire period under study. Modeled valuesstay within the observational variability and are highly corre-lated with measurements (correlation of 0.97). A slight coldbias of 0.5◦C can be noticed mainly at night which is charac-teristic of the MM5 model (Zhong and Fast, 2003). DuringMarch 2006, the observed RH values are adequately repro-duced by the model, except for the 5–7 March period wherean overestimation of 20–30% RH in predicted values is ob-tained for nighttime values. Dryer daytime values (10–30%)as well as the increase in humidity toward the end of Marchseem correctly captured by the model for these surface sta-tions. Verifying the model’s ability to reproduce the T andRH is important as these parameters play a determining rolein aerosol thermodynamics and chemistry.
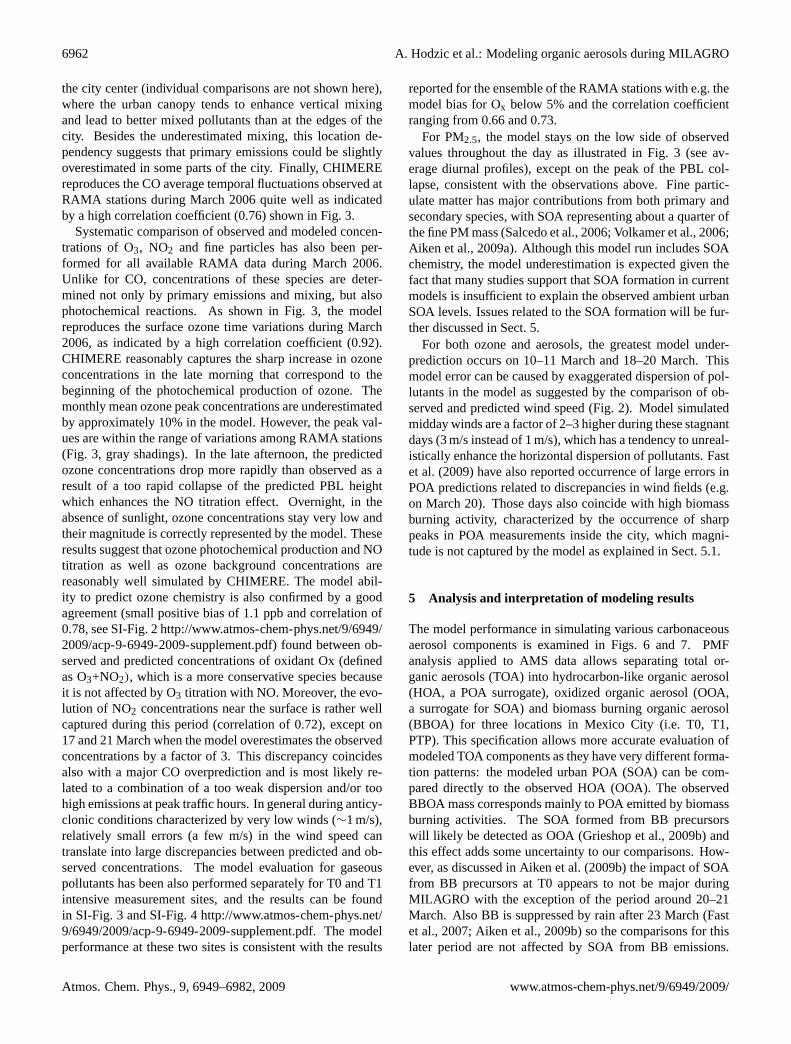
Finally, a comparison of the MM5 planetary boundarylayer (PBL) height is performed using measurements ob-tained during MILAGRO. Modeled PBL height was deter-mined from the Richardson number in a similar way as inTroen and Mahrt (1986), based on a critical value (0.5) of thebulk Richardson number, in the MRF PBL scheme. Figure 5ashows time series of observed and predicted PBL heights atthe urban site of T0. Observed and simulated PBL heightranges from 2.5 to 4 km during the day. The comparison
www.atmos-chem-phys.net/9/6949/2009/ Atmos. Chem. Phys., 9, 6949–6982, 2009

6960 A. Hodzic et al.: Modeling organic aerosols during MILAGRO
Fig. 3. Major pollutant concentrations as observed by air quality stations of the RAMA network (dotted line) and simulated by the CHIMEREmodel (full line, BIO-EP run) from 4 to 30 March 2006 (left panel). The variability among observations is denoted by gray shading andmain statistical indicators for the comparison are also given (bias, RMSE and correlation coefficient Corr.). The right panel represents thecorresponding diurnal cycles in UTC time for each pollutants averaged over all stations. The correspondence with the local time (LT = UTC– 6 h) is also indicated on the upper x-axes. Model is solid line with error bars, observations are hourly points with shaded areas. Allavailable measurements have been considered for this comparison (i.e. 21 ozone stations; 19 NO2 stations; 25 CO stations, 8 PM2.5 stations).The description of the RAMA network including the location of stations dedicate to the monitoring of each pollutant can be found athttp://www.sma.df.gob.mx/simat/.
reveals a slight underestimation of the observed PBL heightfor a few specific days, but this behaviour is not a persis-tent bias. Following Fast et al. (2009), the comparison ofobserved and predicted average diurnal PBL depth profilesprovides a better understanding of the model behaviour at T0and T1. The sharp ascent of the PBL in the late morning
seems to occur 1 h earlier in the model than observed. Thediagnosing of the PBL height seems to be more challengingfor the model during the late afternoon and over night, as thepredicted PBL collapses 2 h sooner than observed, and stayssignificantly lower over night.
Atmos. Chem. Phys., 9, 6949–6982, 2009 www.atmos-chem-phys.net/9/6949/2009/
A. Hodzic et al.: Modeling organic aerosols during MILAGRO 6961
Fig. 4. Wind roses as observed (upper) and predicted (lower plot)at RAMA stations within the Mexico City basin indicating both thewind direction and the wind speed (m/s) during the MILAGRO ex-periment (i.e. 4–30 March 2006 period). The circle indicates the10% occurrence. Winds appear to be generally weak and disorga-nized within the basin.
The nighttime PBL is especially difficult to model overurban areas as urban canopy effects are poorly representedin the MM5 model due to the absence of a specific ur-ban canopy model and other factors (like anthropogenic heatfluxes) affecting PBL mixing (Liu et al., 2004; Hodzic et al.,2005). As in Hodzic et al. (2005), a minimum PBL heightof 300 m is assumed in this study to prevent unrealisticallylow nighttime mixing of pollutants. It should also be notedthat the comparison at sunset is more uncertain as PBLH re-
(a)
(b)
Fig. 5. Planetary boundary layer heights (PBLH) at the urban T0site (a) as predicted by CHIMERE (full line) and observed by theradar wind profiler (dots). Daily averaged PBLH profiles are alsodisplayed(b) for the T0 urban site (left panel), and the T1 near-urban location (right panel). Model predictions and variability areindicated by black solid line and vertical bars, while radar wind pro-filer observations and their variability are represented by black dotsand shaded area. For T1, observations from radio soundings (di-amonds) and lidar data (triangles) are also plotted when available.The 24 and 25 March undergo unstable, cloudy weather conditions.The correspondence with the local time (LT = UTC – 6 h) is indi-cated on the upper x-axes of the diurnal profile plots.
trievals from lidar and wind profiler cannot accurately distin-guishing between the top of the residual layer and the shal-low inversion layer that develops during this transition pe-riod. PBLH measurements from radiosondes confirm thislarge uncertainty during sunset, and yield 300–1000 m lowerPBLH values at T1 site than lidar retrievals. Similar difficul-ties have also been reported for the WRF model during theMILAGRO experiment (Fast et al., 2009).
Errors in simulated PBL height could generate discrepan-cies between observed and modeled concentrations of pri-mary pollutants. Such is the case for CO as illustrated inFig. 3 (see CO average diurnal profile). Indeed, the modelunderestimation of the PBL height contributes to an erro-neous CO peak in the late evening and somewhat high COvalues during the morning rush hour peak that are consistentwith weaker vertical mixing predicted by the model. How-ever, there is a strong variability in CO concentrations amongRAMA stations. Model overestimation during the morningrush hour seems to occur mainly at stations located within
www.atmos-chem-phys.net/9/6949/2009/ Atmos. Chem. Phys., 9, 6949–6982, 2009
6962 A. Hodzic et al.: Modeling organic aerosols during MILAGRO
the city center (individual comparisons are not shown here),where the urban canopy tends to enhance vertical mixingand lead to better mixed pollutants than at the edges of thecity. Besides the underestimated mixing, this location de-pendency suggests that primary emissions could be slightlyoverestimated in some parts of the city. Finally, CHIMEREreproduces the CO average temporal fluctuations observed atRAMA stations during March 2006 quite well as indicatedby a high correlation coefficient (0.76) shown in Fig. 3.
Systematic comparison of observed and modeled concen-trations of O3, NO2 and fine particles has also been per-formed for all available RAMA data during March 2006.Unlike for CO, concentrations of these species are deter-mined not only by primary emissions and mixing, but alsophotochemical reactions. As shown in Fig. 3, the modelreproduces the surface ozone time variations during March2006, as indicated by a high correlation coefficient (0.92).CHIMERE reasonably captures the sharp increase in ozoneconcentrations in the late morning that correspond to thebeginning of the photochemical production of ozone. Themonthly mean ozone peak concentrations are underestimatedby approximately 10% in the model. However, the peak val-ues are within the range of variations among RAMA stations(Fig. 3, gray shadings). In the late afternoon, the predictedozone concentrations drop more rapidly than observed as aresult of a too rapid collapse of the predicted PBL heightwhich enhances the NO titration effect. Overnight, in theabsence of sunlight, ozone concentrations stay very low andtheir magnitude is correctly represented by the model. Theseresults suggest that ozone photochemical production and NOtitration as well as ozone background concentrations arereasonably well simulated by CHIMERE. The model abil-ity to predict ozone chemistry is also confirmed by a goodagreement (small positive bias of 1.1 ppb and correlation of0.78, see SI-Fig. 2http://www.atmos-chem-phys.net/9/6949/2009/acp-9-6949-2009-supplement.pdf) found between ob-served and predicted concentrations of oxidant Ox (definedas O3+NO2), which is a more conservative species becauseit is not affected by O3 titration with NO. Moreover, the evo-lution of NO2 concentrations near the surface is rather wellcaptured during this period (correlation of 0.72), except on17 and 21 March when the model overestimates the observedconcentrations by a factor of 3. This discrepancy coincidesalso with a major CO overprediction and is most likely re-lated to a combination of a too weak dispersion and/or toohigh emissions at peak traffic hours. In general during anticy-clonic conditions characterized by very low winds (∼1 m/s),relatively small errors (a few m/s) in the wind speed cantranslate into large discrepancies between predicted and ob-served concentrations. The model evaluation for gaseouspollutants has been also performed separately for T0 and T1intensive measurement sites, and the results can be foundin SI-Fig. 3 and SI-Fig. 4http://www.atmos-chem-phys.net/9/6949/2009/acp-9-6949-2009-supplement.pdf. The modelperformance at these two sites is consistent with the results
reported for the ensemble of the RAMA stations with e.g. themodel bias for Ox below 5% and the correlation coefficientranging from 0.66 and 0.73.
For PM2.5, the model stays on the low side of observedvalues throughout the day as illustrated in Fig. 3 (see av-erage diurnal profiles), except on the peak of the PBL col-lapse, consistent with the observations above. Fine partic-ulate matter has major contributions from both primary andsecondary species, with SOA representing about a quarter ofthe fine PM mass (Salcedo et al., 2006; Volkamer et al., 2006;Aiken et al., 2009a). Although this model run includes SOAchemistry, the model underestimation is expected given thefact that many studies support that SOA formation in currentmodels is insufficient to explain the observed ambient urbanSOA levels. Issues related to the SOA formation will be fur-ther discussed in Sect. 5.
For both ozone and aerosols, the greatest model under-prediction occurs on 10–11 March and 18–20 March. Thismodel error can be caused by exaggerated dispersion of pol-lutants in the model as suggested by the comparison of ob-served and predicted wind speed (Fig. 2). Model simulatedmidday winds are a factor of 2–3 higher during these stagnantdays (3 m/s instead of 1 m/s), which has a tendency to unreal-istically enhance the horizontal dispersion of pollutants. Fastet al. (2009) have also reported occurrence of large errors inPOA predictions related to discrepancies in wind fields (e.g.on March 20). Those days also coincide with high biomassburning activity, characterized by the occurrence of sharppeaks in POA measurements inside the city, which magni-tude is not captured by the model as explained in Sect. 5.1.
5 Analysis and interpretation of modeling results
The model performance in simulating various carbonaceousaerosol components is examined in Figs. 6 and 7. PMFanalysis applied to AMS data allows separating total or-ganic aerosols (TOA) into hydrocarbon-like organic aerosol(HOA, a POA surrogate), oxidized organic aerosol (OOA,a surrogate for SOA) and biomass burning organic aerosol(BBOA) for three locations in Mexico City (i.e. T0, T1,PTP). This specification allows more accurate evaluation ofmodeled TOA components as they have very different forma-tion patterns: the modeled urban POA (SOA) can be com-pared directly to the observed HOA (OOA). The observedBBOA mass corresponds mainly to POA emitted by biomassburning activities. The SOA formed from BB precursorswill likely be detected as OOA (Grieshop et al., 2009b) andthis effect adds some uncertainty to our comparisons. How-ever, as discussed in Aiken et al. (2009b) the impact of SOAfrom BB precursors at T0 appears to not be major duringMILAGRO with the exception of the period around 20–21March. Also BB is suppressed by rain after 23 March (Fastet al., 2007; Aiken et al., 2009b) so the comparisons for thislater period are not affected by SOA from BB emissions.
Atmos. Chem. Phys., 9, 6949–6982, 2009 www.atmos-chem-phys.net/9/6949/2009/

A. Hodzic et al.: Modeling organic aerosols during MILAGRO 6963
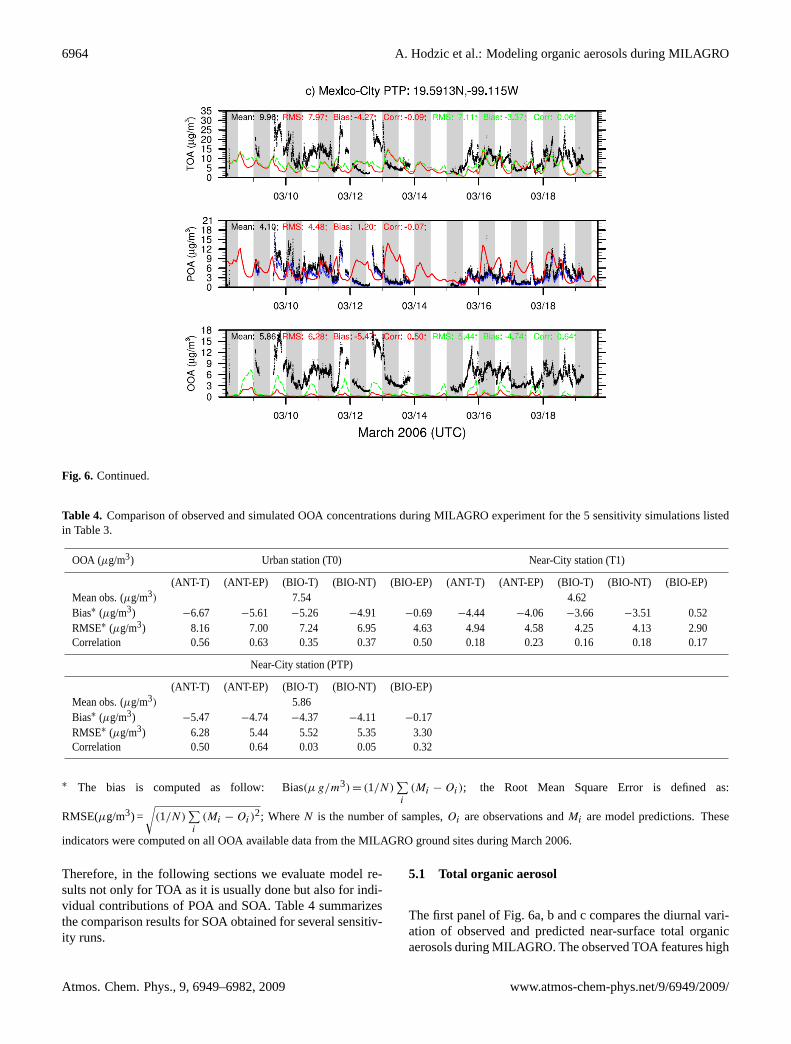
Fig. 6. Time series of modeled and observed surface concentrations (µg m−3) of various carbonaceous compounds including total organicaerosol matter (TOA), primary organic aerosol (POA) and oxygenated organic aerosol (OOA). Comparison is made at the(a) urban site T0,and two near-urban sites(b) T1 and(c) PTP during the MILAGRO experiment. Black dots stand for observations, the red solid line for theANT-T model run that accounts only for anthropogenic SOA precursors, and the green dashed line for the ANT-EP model run that examinesthe sensitivity to the enhanced partitioning towards aerosol phase. On the POA panel, black dots account for the measured POA from bothanthropogenic and biomass burning sources, while blue dots indicate the primary organic mass that excludes organics generated by biomassburning emissions. Model results shown on the POA comparison panel includes also primary organic aerosols from biomass burning. Graystripes denote the nighttime (00:00–12:00 UTC; i.e. 18:00–06:00 LOC).
www.atmos-chem-phys.net/9/6949/2009/ Atmos. Chem. Phys., 9, 6949–6982, 2009
6964 A. Hodzic et al.: Modeling organic aerosols during MILAGRO
Fig. 6. Continued.
Table 4. Comparison of observed and simulated OOA concentrations during MILAGRO experiment for the 5 sensitivity simulations listedin Table 3.
OOA (µg/m3) Urban station (T0) Near-City station (T1)
(ANT-T) (ANT-EP) (BIO-T) (BIO-NT) (BIO-EP) (ANT-T) (ANT-EP) (BIO-T) (BIO-NT) (BIO-EP)Mean obs. (µg/m3) 7.54 4.62Bias∗ (µg/m3) −6.67 −5.61 −5.26 −4.91 −0.69 −4.44 −4.06 −3.66 −3.51 0.52RMSE∗ (µg/m3) 8.16 7.00 7.24 6.95 4.63 4.94 4.58 4.25 4.13 2.90Correlation 0.56 0.63 0.35 0.37 0.50 0.18 0.23 0.16 0.18 0.17
Near-City station (PTP)
(ANT-T) (ANT-EP) (BIO-T) (BIO-NT) (BIO-EP)Mean obs. (µg/m3) 5.86Bias∗ (µg/m3) −5.47 −4.74 −4.37 −4.11 −0.17RMSE∗ (µg/m3) 6.28 5.44 5.52 5.35 3.30Correlation 0.50 0.64 0.03 0.05 0.32
∗ The bias is computed as follow: Bias(µ g/m3) = (1/N)∑i
(Mi − Oi); the Root Mean Square Error is defined as:
RMSE(µg/m3) =√
(1/N)∑i
(Mi − Oi)2; WhereN is the number of samples,Oi are observations andMi are model predictions. These
indicators were computed on all OOA available data from the MILAGRO ground sites during March 2006.
Therefore, in the following sections we evaluate model re-sults not only for TOA as it is usually done but also for indi-vidual contributions of POA and SOA. Table 4 summarizesthe comparison results for SOA obtained for several sensitiv-ity runs.
5.1 Total organic aerosol
The first panel of Fig. 6a, b and c compares the diurnal vari-ation of observed and predicted near-surface total organicaerosols during MILAGRO. The observed TOA features high
Atmos. Chem. Phys., 9, 6949–6982, 2009 www.atmos-chem-phys.net/9/6949/2009/

A. Hodzic et al.: Modeling organic aerosols during MILAGRO 6965
Fig. 7. Observed and predicted average diurnal profiles of total organic aerosol matter (TOA), primary organic aerosol (POA) and oxygenatedorganic aerosol (OOA) at T0(a), T1 (b), and PTP(c) sites for the available MILAGRO dataset. Black dots and shaded area representobservations associated with their variability, the red solid line and red vertical bars indicate the ANT-T model run and the green solidline indicate the ANT-EP sensitivity simulation. Crosses shown on the POA plots indicate the primary organic mass that excludes organicsgenerated by biomass burning emissions. Model results shown on the POA comparison panel include also primary organic aerosols frombiomass burning. The correspondence with the local time (LT = UTC – 6 h) is indicated on the upper x-axes.
concentrations over the entire field campaign. Elevated TOAlevels are found within the city basin with daily maximumconcentrations ranging from 20 up to 70µg m−3. The peakvalues observed on 11, 18 and 21 March are associated withbiomass burning events as indicated by the difference be-tween POA and POA-BBOA measurements shown on Fig. 6and also reported by Aiken et al. (2009a). At this urbanlocation, the model generally reproduces the diurnal vari-ability found in TOA observations (correlation coefficientof 0.48). The comparison of observed and modeled aver-age TOA diurnal profiles for March 2006 (Fig. 7) shows thatthe model correctly replicates the gradual increase in TOA
concentrations during the day caused by both early morn-ing primary emissions (13:00 UTC, i.e. 07:00 LT) and theincrease of SOA concentrations starting at sunrise (07:00–08:00 LT) with SOA concentrations peaking around mid-day(18:00 UTC, 12:00 LT). However, the modeled TOA onlyexplains 55% of the observed organic material. This modelunderestimation is particularly large in the afternoon (17:00–23:00 UTC, i.e. 11:00–17:00 LT) suggesting a very ineffi-cient production of secondary organic species in the model.
The observed surface TOA concentrations gradually de-crease downwind of the city. A factor of 2 decrease could benoticed at the PTP elevated site, and a factor of 4 decrease
www.atmos-chem-phys.net/9/6949/2009/ Atmos. Chem. Phys., 9, 6949–6982, 2009

6966 A. Hodzic et al.: Modeling organic aerosols during MILAGRO
at the T1 near-urban site (Fig. 7). At the T1 site, the highestTOA concentrations are associated with the downwind ad-vection of pollutants from the city or the biomass burningevents (e.g. 21 March). According to Doran et al. (2007),this site is much less affected by the Mexico City plumethan expected, with the exception of 18, 19, 20, 24 and 27March. The rest of the time regional background conditionsprevail. At this downwind location discrepancies betweenmodeled and observed TOA are large both in terms of mag-nitude and temporal variability. Observed TOA concentra-tions are underestimated by a factor of 2–3 and the correla-tion with the measurements is reduced (R2=0.28). While theobserved TOA features a pronounced diurnal cycle with peakvalues at 06:00 LT and 15:00 LT, the modeled diurnal pro-file is rather uniform with large underprediction of the mid-day production of the aerosol due to the photochemistry. Itshould also be noticed that T1 is located at the northeasternborder of the city that is growing continuously. This spatialexpansion might not be reflected in the current emission in-ventory which could contribute to the model underpredictionof aerosol concentrations.
The comparison with AMS data at the PTP site confirmsmodel underestimation of TOA levels. Located on a hill only10 km downwind of the city center, the PTP site is greatlyinfluenced by urban activities. Because of its elevated topog-raphy (900 m above the city ground), TOA concentrationsdisplay however a very specific diurnal profile with a peakvalue occurring at 10:00 LT, which is 3 h later than at T0 andT1. As explained in Fast et al. (2009) this sharp increase inconcentrations at 12:00 LT coincides with the growth of thePBL above the altitude of the station and the arrival of thecity pollution.
This comparison clearly shows model difficulties in sim-ulating TOA levels in this polluted region, difficulties thatseem to increase with the distance from emission sources.Given that the model predicts reasonably well the concentra-tions of gas phase species, it is likely that the aerosol errorsresult either from an underestimation of POA emissions oran underestimation of SOA formation.
5.2 Primary organic aerosols
The second panel of Fig. 6a, 6b and 6c assesses model perfor-mance in simulating POA during March 2006 and the accu-racy of primary emissions. At T0, CHIMERE successfullyreproduces the observed POA diurnal variation (R2=0.59)characterized by an early morning peak associated with traf-fic (Fig. 7). Predicted POA lies between measured anthro-pogenic POA (crosses) and the measured total POA that ac-counts for both anthropogenic and biomass burning emis-sions. POA peak values are adequately simulated by themodel most of the time, except as previously mentioned onthree specific days (11, 18, 21 March) influenced by intensebiomass burning activities. As shown in Fig. 6a, for thesedays, the model tends to underestimate the observed peaks
by a factor of 2 even though modeled POA takes into accountbiomass burning emissions. Possible reasons for this under-prediction include: (i) the inaccurate representation of smallburning activities (<1 km in size) within the city, which arecurrently unaccounted for in the emissions inventory (Yokel-son et al., 2007); (ii) the dilution of the smoke emissionswithin 5×5 km2 model grid boxes which results in morespread BB plumes and smother gradients in POA concen-trations associated with the fires. The comparison of diurnalprofiles also shows the model tendency to overpredict night-time concentrations. This pattern has already been seen forother primary species such as CO, and is most likely causedby a too shallow nighttime boundary layer over the basin.The agreement is still reasonable at T1, although the modeltends once again to underestimate by 15% the average morn-ing POA peak concentrations as shown in Fig. 7. As previ-ously mentioned, the emission inventory does not representwell the spatial expansion of the city at this location. In addi-tion, the model spatial resolution (5×5 km2) is too coarse tocapture sharp spatial emission gradients associated with thepresence of a major highway near T1.
At PTP, larger discrepancies between observed and mod-eled POA values are found. While POA average concentra-tions seem to be captured by the model with small positivebias, the predicted diurnal variability is inconsistent with ob-servations. The predicted morning POA peak occurs 2–3 hearlier than observed. This time the shift most likely has adynamic origin to it. As previously mentioned, the late ar-rival of pollutants over the elevated PTP site is associatedwith the growth of the PBL above 900 m (station’s altitude).Although there is no evidence for the more rapid growth ofthe PBL height (see Fig. 5b) in the model, the unrealistic up-slope winds (see Fig. 4) could be advecting city pollutionmore rapidly to PTP. In addition, as suggested by Fast etal. (2009), the model horizontal resolution of 5 km is mostlikely insufficient in order to accurately resolve the topogra-phy of the PTP site. Therefore, the simulated peak heightis several hundred meters lower than the actual height ofthis site, causing this site to stay all the time inside the pol-luted boundary layer. According to the difference betweenmeasured anthropogenic POA and total anthropogenic andBB POA it seems that the absolute contribution of biomassburning is reduced outside of the city (<3µg m−3 at PTPand T1) compared to their influence within the city basin(∼5µg m−3). This may be due to the closer location of mostfires to T0 compared to T1. An alternative explanation is theinfluence of very small fires (from cooking, biofuel use, etc.)may be occurring within the city or that sources of partiallyoxidized aerosols such as meat cooking may be retrieved to-gether with BBOA due to some similarities in the spectra ofboth POA sources (Mohr et al., 2009). However the resultsof Aiken et al. (2009a) suggest that this source is small sincethe BBOA concentration is very low during the days in whichregional biomass burning is suppressed.
Atmos. Chem. Phys., 9, 6949–6982, 2009 www.atmos-chem-phys.net/9/6949/2009/

A. Hodzic et al.: Modeling organic aerosols during MILAGRO 6967
Diurnal POA profiles simulated by the CHIMERE modelare very consistent with the results reported by Fast etal. (2009) for the WRF/Chem model suggesting that the treat-ment of primary aerosol emissions from both anthropogenicand biomass burning activities is correctly handled in thisstudy. These results also show that primary emissions oforganic aerosols do not have major biases and suggest thatTOA underestimation is mainly caused by poor representa-tion of secondary organic aerosols.
5.3 SOA formation from anthropogenic precursors
5.3.1 Reference run
SOA predictions from a reference model simulation (ANT-T) are first examined in order to quantify the amount of SOAthat can be explained by the first-generation oxidation of an-thropogenic precursors. According to Volkamer et al. (2006)SOA production from anthropogenic precursors accountedfor over 95% of the calculated daytime SOA productionwithin the city for their case study, during which there wasvery low background and regional influence (which is rela-tively unusual for Mexico City). Figure 7 presents the com-parison of monthly mean diurnal profiles of predicted SOAand observed OOA at the 3 locations under study. The shapeof the OOA diurnal profile features a strong enhancement inconcentrations during the morning associated with an activephotochemical production of SOA close to the emissions (i.e.T0, PTP). The diurnal variability is less pronounced at theperipheral T1 station and displays a more gradual increaseof concentrations during the day. Similar to TOA concentra-tions, OOA surface levels gradually decrease downwind ofthe city with monthly average concentrations ranging from7.5µg m−3 at T0 to 4.6µg m−3 at T1. Table 4 indicates thatthe reference run (i.e. ANT-T) severely underpredicts the ob-served OOA levels, typically by a factor of 5–10 for variousstations. Figure 7 confirms that the predicted SOA values liewell below the observed ones and their associated variabilityrange.
These results are certainly consistent in many ways withearlier studies performed in this region; however, an in-triguing feature emerges from this comparison. As illus-trated in Fig. 7, the predicted morning average SOA pro-duction rate of 4µg m−3 hr1 is only a factor of 2 lowerthan the intensity of the observed increase at the urban sitein the morning, although the discrepancy in the observedconcentrations grows to a factor of 5–10 by 20:00 UTC(i.e. 14:00 LT), consistent with the findings of Volkamer etal. (2006), Kleinman et al. (2008), Dzepina et al. (2009), andTsimpidi et al. (2009). This similarity in the relative diur-nal cycles when the background OOA is excluded explainsthe observed correlation with the OOA measurements. Thecomparison (see SI-Fig. 5http://www.atmos-chem-phys.net/9/6949/2009/acp-9-6949-2009-supplement.pdf) also showsthat the predicted SOA that was photochemicaly generated
within the city tends to evaporate within the growing PBLduring early afternoon, while the observed SOA stays ele-vated until late afternoon (22:00 UTC, i.e. 16:00 LT) despitethe enhanced afternoon PBL mixing and lower OA concen-trations available for the gas/aerosol partitioning. One pos-sible reason for the increasing discrepancy later in the dayis that as the aerosol ages the organic material tends to staymore permanently in the particle (despite dilution) which isnot captured correctly in the model (i.e. the model evaporateshalf of the freshly produced SOA material). This is consis-tent with thermal denuder measurements at T0 which showedthat the measured OOA was significantly less volatile thantypical model SOA, and that the more aged OOA (OOA-1)was less volatile than the fresher OOA (OOA-2) (Huffmanet al., 2009; Dzepina et al., 2009). The sensitivity of modelresults to the gas/aerosol partitioning is discussed further be-low.
The large model underestimation is present throughout theday, about 6–8µg m−3 at T0 for example, suggesting thatin addition to the local photochemical production, regionalSOA levels might be underpredicted. Regional pollution isindeed advected into the city during the late afternoon un-der the influence of southerly winds that have the tendencyto clean out pollutants generated during the day and bringcleaner regional concentrations. The fact that predicted SOAconcentrations drop rapidly after the collapse of the PBL inthe late afternoon to very low values (<1µg m−3), and re-main close to zero overnight is an additional indication thatbackground levels are not well predicted and potentially alsothat the model SOA is too volatile. As expected, large dis-crepancies between modeled and observed SOA concentra-tions are observed at the two other sites.
5.4 Emissions of aromatics
Low SOA background levels are the result of an inefficientregional production of SOA which could be related to a num-ber of uncertainties surrounding SOA formation. Anthro-pogenic emissions of SOA precursors certainly constituteone of them. The representation of VOC chemical com-position, as well as their temporal and spatial variation isvery crude in current inventories. The extensive dataset col-lected during MILAGRO campaign enables the evaluationof predicted VOC precursors. Figure 8 compares averagediurnal profiles of predicted and observed mono-substituted(e.g. toluene, ethylbenzene) and poly-substituted (e.g. xy-lene, trimethylbenzene) aromatics at T0, which are the dom-inant anthropogenic SOA precursors in Mexico City ac-cording to traditional SOA models (Volkamer et al., 2006;Dzepina et al., 2009). Even qualitative comparison suggeststhat the model matches quite well with the observed concen-trations both in terms of magnitude and temporal variation. Aslight overestimation of the morning peak is expected thoughas predicted aromatic surrogates include species that are notpresent in the measurements. As for other primary species,
www.atmos-chem-phys.net/9/6949/2009/ Atmos. Chem. Phys., 9, 6949–6982, 2009

6968 A. Hodzic et al.: Modeling organic aerosols during MILAGRO
Fig. 8. Comparison of predicted (black dots) and observed (full line) surface concentrations of VOCs that are involved in the SOA formationincluding mono-substituted and poly-substituted aromatics and isoprene. Averaged diurnal cycles have been computed over the period of4-30 March 2006 at the urban supersite (T0). The variability among observations and model predictions is denoted by gray shading andvertical bars respectively. The isoprene plot includes two model predictions: bottom full line represents biogenic isoprene emissions only(BIO-T run), while top line accounts for both biogenic and anthropogenic isoprene emissions (BIO-ANT run).
Fig. 9. Comparison of predicted (black dots) and observed (fullline) surface concentrations of OH at T1 that is involved in the oxi-dation of SOA precursors. Averaged diurnal cycles have been com-puted over the period of 4–30 March 2006. The variability amongobservations and model predictions is denoted by gray shading andvertical bars respectively.
there is no indication of a systematic model bias for aromaticSOA precursors. This is consistent with the results of Fastet al. (2009), whom however point out that the concentra-tions of most other VOC types have significantly more prob-lems than the aromatics. As OH is the oxidant controllingthe chemistry of VOC precursor species, we have also veri-fied that the model reasonably reproduces OH concentrationsduring this period (Fig. 9). The model underestimates OH atnight and overestimates the mid-day peak, but the overall av-erage is well-captured.
5.4.1 Sensitivity to partitioning coefficients
Besides uncertainties in VOC emissions, the choice of pa-rameters used in SOA equilibrium partitioning can make alarge difference on predicted SOA levels in some cases (e.g.Simpson et al., 2007). In particular, determination of satu-ration vapor pressure and enthalpy of vaporization of semi-volatile aerosols remains highly uncertain (e.g. Kanakidou etal., 2005; Faulhaber et al., 2009; Hallquist et al., 2009). Also,in the traditional lumped approach, chemically similar com-pounds are lumped into a single surrogate compound whichis assigned a unique saturation pressure and vaporization en-thalpy representative of the group. This surrogate compoundundergoes only first generation oxidation which does not al-low accurate representation of changes in volatility with in-creased degree of oxidation (i.e. decrease in volatility withaged material). These approximations can significantly af-fect the gas/aerosol partitioning and the amount of the pre-dicted SOA. In addition, freshly absorbed organic speciescan further react inside the particle by oligomerization cre-ating larger molecules with a lower vapor pressure that ir-reversibly stay inside the aerosol (e.g. Kroll and Seinfeld,2005; Pun and Seigneur, 2007). If these processes are impor-tant and are not compensated by others such as fragmentationof molecules leading to more volatile species, the aerosol or-ganic mass can increase as well as the aerosol ability to ab-sorb additional semi-volatile compounds.
Given the limited knowledge on these mechanisms, we donot attempt to include them in this study. To perform a first-order evaluation of their potential impact on predicted SOAconcentrations, partitioning toward the particulate phase isartificially increased by lowering the saturation vapor pres-sure by two orders of magnitude (i.e. by a factor of 100 for allspecies). The ANT-EP sensitivity study should be seen there-fore as an upper limit of the SOA production from traditionalanthropogenic precursors when calculated with traditionalmodel formulations (from the same initial amount of precur-sors as for ANT-T). Figure 7 shows the comparison between
Atmos. Chem. Phys., 9, 6949–6982, 2009 www.atmos-chem-phys.net/9/6949/2009/

A. Hodzic et al.: Modeling organic aerosols during MILAGRO 6969
ANT-EP and the reference run for three stations under study.A near doubling of average predicted SOA concentrationscan be noticed during the day. The early morning increase inthe model now approaches the measured one at T0 and PTPsoon after the start of the photochemistry and less so later on,leading to a better agreement with observations. The overallbias and root mean square error are decreased somewhat, butthe model sill falls short of the observations. Despite thesestatistical improvements, the nighttime discrepancy is not re-duced which is indicative of a missing formation process orprecursor in the model.
5.5 Unexpectedly large contribution of biogenic precur-sors
5.5.1 Presence of biogenics
One of the SOA formation pathways that have not been ex-plored so far in Mexico City is the production from biogenicprecursors. Although SOA formation from anthropogenicpollution is significant in and downwind of urban areas, theglobal SOA burden is thought to have the largest contribu-tion from biogenic sources, with a 50% contribution fromisoprene (e.g. Tsigaridis and Kanakidou, 2007). The frac-tion of modern carbon within Mexico City (Marley et al.,2009; Aiken et al., 2009b) is higher than the estimates ofthe biomass burning contribution to OC (Stone et al., 2008;Aiken et al., 2009a, b), which leaves room for other sourcessuch as biogenic SOA or urban sources of modern carbon(Hildemann et al., 1994). The concentrations of biogenicprecursors within the city are more than an order of magni-tude lower than for the aromatics, and thus the formation ofSOA from these species within the city is thought to be small(Volkamer et al., 2006; Dzepina et al., 2009). For example,Fortner et al. (2009) reported daily peak values of 1.7 ppb forisoprene and 1.2 ppb for monoterpenes at T0 (see Fig. 3 ofFortner et al., 2009) vs. 100 ppb for total aromatics. Whileisoprene can have both biogenic and anthropogenic origin,monoterpenes are clearly not produced by anthropogenic ac-tivities within the city, and are either advected from sur-rounding mountains or long-range transported from remotecoastal areas.
Figure 1b shows the spatial distribution of isoprene emis-sion fluxes estimated from the MEGAN model for March2006 over Mexico and Central America. As expected, nearthe metropolitan area isoprene emissions are several ordersof magnitude lower than those from aromatics (e.g. the fluxof mono-substituted aromatics is estimated as 20 tons/daywithin the city, not shown). However, much larger emissionsof isoprene are found in the coastal regions, esp. southwestof Mexico City. Even though the lifetime of isoprene is rel-atively short (∼1–2 h), SOA formed from these precursorshas a much longer lifetime (∼5–7 days) and can be long-range transported to Mexico City from the Southwest andthe Gulf of Mexico under the influence of the regional winds
contributing therefore to the SOA regional background lev-els. An order-of-magnitude estimate of the regional con-tribution of isoprene to SOA background concentrations ispresented here to evaluate the potential importance of thissource. Given a relatively low wind speed during this pe-riod, we assume that isoprene emitted within a 150 km radiusaround Mexico City can influence the regional SOA forma-tion and reach the basin. Assuming a 2% SOA mass yieldfrom isoprene, we estimate SOA regional production as ap-proximately 20 tons/day within the given perimeter. This es-timate corresponds to an emission flux of SOA of approx-imately 290µg/m2/day, which results in a total productionof ∼1.5µg m−3 over 5 days period (assuming an averageboundary layer dispersion of 1 km). This amount is of thesame order of magnitude as SOA production from mono-substituted aromatics, estimated as 34 tons/day in this sameregion (assuming a 9.6% yield). These estimates suggest thatbiogenic SOA levels in the Mexico City region are far fromnegligible.
The influence of biogenic sources on predicted SOA levelsin Mexico City by the CHIMERE model is quantified in Ta-ble 4. Compared to the reference simulation, the BIO-T runsignificantly reduces the model underprediction of SOA lev-els at all three stations. The model bias is reduced by morethan 20% as well as the RMS error indicating an improvedagreement with observations. A decrease in correlation coef-ficients is observed for the PTP site and could have a dynamicorigin as already discussed for primary species. The increasein predicted SOA concentrations of 1–2µg m−3 is observedthroughout the day as illustrated in Fig. 10. In particular,the comparison of SOA diurnal profiles between BIO-T andANT-T runs shows that nighttime SOA levels are much bet-ter captured when biogenic sources are taken into account.SOA concentrations are reproduced within a factor of 3 atall sites, however predicted SOA diurnal profiles stay at thebottom edge of the observation variability interval.
The predicted concentrations of biogenic SOA from ourCHIMERE/MEGAN model have been compared with themeasurement-based estimates of biogenic SOA that recentlybecame available from the work of Stone et al. (2009). TheStone et al. (2009) estimates are based on measurements ofspecific tracers of different biogenic SOA precursors from24-h filter measurements at T0 and T1. The total SOA aris-ing from each biogenic SOA precursor is then estimated asthe tracer concentration multiplied by the SOA/tracer con-centration average from chamber experiments as reported byKleindienst et al. (2007). Figure 11 shows that the modeldaily-averaged BSOA levels are of the same order as themeasured ones for both T0 and T1: tracer-derived (modelpredicted) BSOA values range from 0.3 to 1.8µg/m3 (0.7 to2µg/m3) at T0, and from 0.4 to 2.1µg/m3 (0.5 to 1µg/m3)at T1, respectively. The total model BSOA and also theprecursor-specific model BSOA are generally within a fac-tor of 2–3 of the observations. This contrast with the strongunderprediction of the anthropogenic SOA reported here and
www.atmos-chem-phys.net/9/6949/2009/ Atmos. Chem. Phys., 9, 6949–6982, 2009

6970 A. Hodzic et al.: Modeling organic aerosols during MILAGRO
Fig. 10. Observed and predicted average diurnal profiles of OOA at T0, PTP and T1 sites during MILAGRO experiment. Black dots andshaded area represent observations associated with their variability, the red solid line and red vertical bars indicate the ANT-T model run, thegreen solid line indicate the BIO-T simulation, and blue dashed line the BIO-EP sensitivity simulation.
Fig. 11. Measurement-derived (black line) and model-predicted (black dots) daily-averaged concentrations of biogenic SOA at T0 and T1including the total BSOA, BSOA from isoprene and BSOA from monoterpenes. The variability associated with observations and modelpredictions is displayed by gray shading and vertical bars respectively.
in previous studies in Mexico City. It is also consistent withother studies which have reported that biogenic SOA mod-els typically predict the right levels of SOA observed in thefield and do not show order-of-magnitude underpredictions(Tunved et al., 2006; Chen et al., 2009).
Additional sensitivity runs (not shown here) have been car-ried out in order to determine whether biogenic SOA parti-cles found within the basin have been locally produced onthe hills surrounding Mexico City or long-range transportedfrom the coastal region. Model results indicate that onlya few percent of biogenic SOA has a local origin, the ma-jor fraction being produced upwind on the coastal areas andadvected into the city. The largest contribution to biogenic
SOA is from regional isoprene (>60%). Production frommonoterpenes is smaller, which is consistent with the factthat emissions of monoterpenes are one to two orders of mag-nitude lower than those of isoprene in the model.
Our modeling results are the first to raise the question ofthe contribution of biogenic precursors and their role in theSOA formation in Mexico City. Generally neglected in pre-vious modeling studies, the presence of 1–2µg m−3 of back-ground biogenic SOA can play an important role in the gas-aerosol partitioning of semi-volatile organic material fromanthropogenic origin.
Atmos. Chem. Phys., 9, 6949–6982, 2009 www.atmos-chem-phys.net/9/6949/2009/

A. Hodzic et al.: Modeling organic aerosols during MILAGRO 6971
5.5.2 Role of anthropogenic emissions of isoprene
Although it seems very likely that regionally produced bio-genic isoprene contributes significantly to SOA formationwithin the city, it should also be noted that isoprene concen-trations are surprisingly elevated within the city throughoutthe day (1–2 ppb; see Fig. 8). The diurnal variability of iso-prene concentrations has a strong anthropogenic signatureto it with peak concentrations occurring during traffic rushhours. The anthropogenic character of isoprene within thecity is also confirmed by the comparison of observed con-centrations with the results of two model runs at T0 (Fig. 8):the model sensitivity run BIO-ANT that accounts for anthro-pogenic emissions provides much better agreement with ob-servations than the original BIO-T run. The anthropogenicisoprene is likely contributing to urban SOA formation, es-pecially given its high reactivity. According to the results ofthe sensitivity run BIO-ANT, SOA formation from anthro-pogenic isoprene (with OH chemistry) is not negligible dur-ing MILAGRO: 0.20µg m−3 increase in the monthly meanSOA concentrations at T0.
5.6 Nighttime chemistry of isoprene
Finally, in addition to SOA formation from the reaction ofisoprene with OH, we also investigate the importance of theoxidation of isoprene by NO3 radicals. This reaction occursonly at night and consumes unreacted isoprene that has ac-cumulated during the daytime. The recent study by Ng etal. (2008) estimated that the production of SOA from night-time chemistry of isoprene is comparable to the productionfrom aromatics on a global scale, and Brown et al. (2009)used aircraft observations of isoprene and NO3 that thismechanism made a modest contribution to SOA formationover the New England region. Table 4 shows the effects ofisoprene nighttime chemistry on the predicted total SOA inthe vicinity of Mexico City. The average production of SOAis increased by approximately 0.15µg m−3 within MexicoCity (run BIO-NT), leading to a slightly better agreementwith the observations. However the effect of this mechanismis limited in comparison to the background SOA productionfrom isoprene daytime chemistry, since the regions of highisoprene and high NO3 radical are mostly disjoint.
5.6.1 Enhanced partitioning to the aerosol
Similar to anthropogenic precursors, biogenic SOA surro-gates can be irreversibly partitioned to the aerosol phase asthey undergo heterogeneous reactions inside the particles.Surratt et al. (2006) have identified the presence of oligomersamong the SOA products of isoprene. If these processes areenhanced in the atmosphere compared to chamber studies,the SOA mass could be significantly increased. Because pa-rameterizations for these reactions are currently unavailable,it is difficult to accurately quantify the fraction of the surro-
gate species that stays trapped inside the particle. Similar tothe ANT-EP run, the partitioning to the aerosol phase wasartificially increased by two orders of magnitude in order toprovide a first-order estimate the upper limit for SOA con-centrations that can be formed from biogenic sources presentin the region. As expected, the BIO-EP run leads to an en-hancement of SOA concentrations as a result of a greaterpartitioning of semivolatile species into the aerosol phase.The increase in concentrations is constant throughout theday (∼2–3µg m−3) at all sites, as the BSOA is produced atthe regional scale, upwind of the city. Even though a muchbetter agreement is reached between modeled and observedSOA diurnal profiles (Fig. 10) with this run, correlation co-efficients are decreased indicating higher spatio-temporal in-consistencies in the BSOA fields. In particular, the modelbias has been significantly reduced in the early afternoon butnot completely eliminated in the model predictions. The im-portant conclusion from these results is that biogenic SOAformation is sensitive to the choice of partitioning parame-ters (which are currently highly uncertain). If chemical ag-ing of semi-volatile gaseous precursors or oligomerizationreactions within the particle could lower the vapor pressurespecies as much as assumed here, the predicted amount of theBSOA could increase by a factor of 2. This sensitivity to par-titioning parameters has already been reported by Johnson etal. (2006) during the TORCH 2003 field study in the UK. Inorder to match the AMS-derived OOA concentrations, John-son et al. (2006) had to increase all partitioning coefficientsby a factor of 500 suggesting the occurrence of unaccountedchemical processes within the aerosol.
5.7 How large is the underpredicted SOA mass?
The interpretation of the comparison results for pollutantconcentrations performed at the surface is largely dependenton the model ability to predict their vertical dispersion withinthe boundary layer and the PBL depth itself. This depen-dence can be misleading, and drive our focus on solvingdiscrepancies encountered during nighttime when errors areamplified due to the presence of shallow PBL. Here, we in-troduce another way of evaluating the predicted SOA lev-els based on comparisons of their column-integrated mass(within PBL) which is not influenced by the vertical dilu-tion. Figure 12 shows the comparison of PBL-integratedSOA concentrations as observed at T0 and predicted bythree model runs previously discussed (i.e. ANT-T, BIO-Tand BIO-EP). The observed SOA column was calculated as-suming a uniformly distributed SOA mass throughout thePBL (by multiplying the surface SOA concentrations by thePBL depth), while the modeled SOA concentrations were in-tegrated within the predicted PBL. The comparison of thePBL-integrated SOA mass clearly shows that major discrep-ancies between the model and measurements occur duringdaytime (16:00–24:00 UTC, i.e. 10:00–18:00 LT) althoughthe model underprediction of SOA surface concentrations by
www.atmos-chem-phys.net/9/6949/2009/ Atmos. Chem. Phys., 9, 6949–6982, 2009

6972 A. Hodzic et al.: Modeling organic aerosols during MILAGRO
Fig. 12. Average diurnal profiles of column-integrated oxygenatedorganic aerosol (OOA,µg m−2) within the boundary layer as ob-served and modeled during MILAGRO at T0. Similar to Fig. 10,black dots and shaded area represent observations associated withtheir variability, the red solid line and red vertical bars indicate theANT-T model run, the green solid line indicate the BIO-T simula-tion, and blue dashed line the BIO-EP sensitivity simulation.
the reference run (ANT-T) appears to be constant when plot-ting surface concentrations (6–8µg m−3) throughout the dayas previously shown. The model underprediction for the ref-erence simulation (ANT-T) ranges from 2 mg/m2 during thenighttime up to 23 mg/m2 in the afternoon, which correspondroughly to an underprediction of the observed SOA massover the MCMA region (assuming an area of 30×30 km2)from 1.8 tons at night and up to 20.7 tons during the day.This underprediction is indeed similar to those reported byKleinman et al. (2008) and Dzepina et al. (2009) when usingtraditional SOA models and using ratios of OOA to excessCO to remove the effect of dilution. Accounting for biogenicVOC precursors (BIO-T) contributes to reduce these discrep-ancies by half during the nighttime, however a large under-estimation (up to 21 mg/m2 or 18.9 tons) persists during theday. This comparison once again highlights the limitationsof the traditional SOA formation approach, and the need formore realistic SOA parameterizations for air quality modelsthat can account for e.g. the multi-generational oxidation ofgaseous precursors and chemical processing of SOA withinthe particle. Significant improvement in SOA predictionsis obtained under the assumption of greatly enhanced par-titioning of oxidized semi-volatile material with the aging ofaerosol particles in the afternoon. As shown in Fig. 12, theBIO-NT run reproduces fairly well the SOA levels at nightand lies within the observation variability interval during the
day. The model underprediction of the SOA mass is indeedreduced from∼20 tons down to∼8 tons as estimated in theearly afternoon (20:00–21:00 UTC, i.e. 14:00–15:00 LT).
5.8 Discussion
Systematic evaluation of the predicted primary and sec-ondary organic aerosols with highly time-resolved AMS datastrongly suggests that anthropogenic emissions and biomassburning are not the only sources of SOA in Mexico City. Fig-ure 13 shows the relative contributions of various emissionsources to the predicted monthly mean SOA concentrations(from 4 to 31 March 2006) over the Mexico City region. Theresults presented are based on the integrated run (best-guessrun BIO-NT) in which SOA is formed from all sources dis-cussed above (i.e. anthropogenic, biogenic, nighttime chem-istry as well as biomass burning). The % contribution is com-puted from monthly mean concentrations of source-taggedspecies.
In agreement with our previous analyses, model resultsindicate that anthropogenic SOA concentrations reach theirhighest values within the Mexico City basin close to theemission sources, and that they gradually decrease at theregional scale. The average SOA production from anthro-pogenic activities is estimated to be 3µg m−3, and is com-parable in magnitude to the predicted regional background(∼2µg m−3). The percentage contribution of various com-ponents to the total SOA amounts shows a strong spatial vari-ability as illustrated in Fig. 13b and 13c. Within the Mex-ico City basin, predicted average contributions from anthro-pogenic and biogenic sources appear to be almost of the sameorder (∼60% and 40%, respectively). However one has tokeep in mind that the anthropogenic SOA is majorly under-predicted by current models while biogenic SOA does notappear to be, so in reality anthropogenic SOA likely domi-nates inside Mexico City.
The presence of biogenic SOA predicted by the model andconfirmed with the tracer analysis is consistent with the highfraction of modern carbon in aerosol within the city reportedby Marley et al. (2009) and Aiken et al. (2009b), whichreaches 30–45% even during periods with very low biomassburning, although some of the modern carbon during thoseperiods may also be explained by urban sources of moderncarbon (e.g. Hildemann et al., 1994). Similar to the frac-tion of modern carbon reported for the measurements whichwas higher at the T1 than T0 site (Marley et al., 2009), therelative importance of BSOA increases at the regional scale.Although our results provide an average estimate of BSOAduring March 2006 that is in agreement with BSOA tracer-derived estimates for the same period, it should be notedthat BSOA contribution may vary from day-to-day based onmeteorological conditions (i.e. measurements-derived BSOAranges from 0.6 to 2.1µg m−3 in March 2006) and it can bevery low in certain cases (Volkamer et al., 2006; Dzepina etal., 2009).
Atmos. Chem. Phys., 9, 6949–6982, 2009 www.atmos-chem-phys.net/9/6949/2009/

A. Hodzic et al.: Modeling organic aerosols during MILAGRO 6973
Fig. 13.Modeled SOA concentrations (µg×m−3) for March 2006 based on BIO-T simulation(a). Percentage contribution (%) to total SOAis shown for(b) anthropogenic emissions and (b) biogenic emissions.
Besides aromatic and biogenic precursors, there is reasonto believe that semivolatile POA and intermediate volatil-ity species (IVOCs) emitted along with it contribute sig-nificantly to the formation of SOA. Recently, a box-modelstudy by Dzepina et al. (2009), suggested that these pri-mary species could be responsible for about 50% of the ob-served SOA within Mexico-City for a local-SOA dominatedcase study during the MCMA-2003 field project. Tsimpidiet al. (2009) showed a contribution of these compounds of∼25% of the total SOA mass for a different time periodduring MCMA-2003, and partially due to using a more ag-gressive “aging” mechanism for traditional SOA which in-creased its relative fraction. The influence of this mechanismfor the MILAGRO field project will be examined in a futurepublication. However, it should be mentioned that account-ing for the volatility distribution of POA and their chemistryis not expected to significantly influence the predicted POAmass in Mexico City because the reported POA emissionsaccount for the aerosol fraction that is left after the primarysemivolatile organic vapors have evaporated (Tsimpidi et al.,2009).
Finally, forest and agricultural burning also contribute toambient SOA concentrations. Biomass burning emissionsare included in all of our simulations as well as the SOAformation from fire-emitted VOCs. A sensitivity study (notshown here) has shown that their influence on SOA produc-tion is however limited (∼2%) in the model results and arisesmainly in the hills surrounding Mexico City. The net effect ofSOA formation from biomass burning on total BBOA massis uncertain at present, different studies report results thatvary between no net increase (Capes et al., 2008) and dou-bling of the primary BBOA (Yokelson et al., 2009). How-ever Grieshop et al. (2009a) showed that SOA formationfrom traditional precursors significantly underpredicted theamount of SOA formed from some types of wood smoke ina smog chamber. Thus it is likely that our prediction of SOA
formation from BB emissions is also biased low. Grieshopet al. (2009a) suggest that the SOA formed from BB emis-sions is dominated by that from semivolatile and intermedi-ate volatility species (SVOC+IVOC) which are not consid-ered in current models, and the effect of this mechanism willbe evaluated in the follow up study. From the point of viewof the observations, the impact of SOA from BB emissionsappears to have been limited at the T0 site during MILA-GRO, mainly because the largest impact was observed in theearly morning due to emissions in the evening which had notundergone photochemical processing (Aiken et al., 2009a).This finding is confirmed by the lack of variation of the OOAconcentration between the high and low fire periods duringMILAGRO (Aiken et al., 2009b).
6 Conclusions
This article uses an air quality model to investigate the pro-cesses controlling organic aerosols, with a particular focuson SOA formation, in the vicinity of Mexico City. TheCHIMERE model results have been evaluated against aerosolmass spectrometry measurements at three ground sites in theframework of the 2006 MILAGRO field campaign. For thefirst time we were able to assess separately the model resultsfor primary and secondary organic fractions during a month-long time period.
Because of complex meteorology associated with theMexico City basin, the ability of the CHIMERE/MM5 modelin simulating meteorological variables and dispersion of pri-mary pollutants has been assessed (for the base case simu-lation) prior to the aerosol results. In addition to the basesimulation, several sensitivity runs have been performed inorder to address the question of the origin of SOA particlesand the sensitivity to the choice of partitioning parameters.The following specific conclusions arise from the study:
www.atmos-chem-phys.net/9/6949/2009/ Atmos. Chem. Phys., 9, 6949–6982, 2009

6974 A. Hodzic et al.: Modeling organic aerosols during MILAGRO
(i) The model/measurement comparison shows absence ofsystematic bias in simulated meteorological variablesthat are responsible for pollutant dispersion and trans-port including wind speed and boundary layer height.A slightly underestimated PBL overnight is suspectedto lead to too weak dilution of primary-emitted speciesand their overestimation by the model.
(ii) The statistical comparison using the RAMA monitoringnetwork (>20 stations) reveals an overall agreement be-tween measured and simulated gas-species during thestudy period of March 2006. In particular, a small pos-itive bias of 1.1 ppb and correlation coefficient of 0.78between observed and predicted concentrations of oxi-dant Ox show the model ability to predict ozone chem-istry.
(iii) Observed concentrations of primary organic aerosolsare reasonably reproduced by the model throughout theday (e.g. bias less than 15% at T0 and T1) indicatingthat there is no significant bias in aerosol primary emis-sions related to anthropogenic activities and biomassburning. POA peak values during the intense biomassburning periods (11, 18 and 21 March) are underpre-dicted by a factor of 2, most likely due to model coarseresolution (5×5 km2). Our modeling results on POAare consistent with a previous study (Fast et al., 2009)that also simulated the MILAGRO period with the sameemissions and also considered POA as non-volatile.
(iv) Less than 15% of the observed SOA within the city canbe explained by the traditional mechanism based on ox-idation of anthropogenic precursors, even though con-servative assumptions are used for SOA partitioning,dry deposition, and size integration of the model thatincrease the amount of model SOA. The gap betweenmodeled and observed concentrations strongly variesduring the day. The model tends to capture within a fac-tor of two the rapid photochemical production of SOAimmediately after sunrise, however the discrepancy in-creases several fold during the day, and the observednighttime SOA concentrations are severely underesti-mated (modeled SOA levels close to zero).
(v) Regional biogenic precursors (isoprene and monoter-penes) play an important role in regional SOA forma-tion which is advected into Mexico City. Modeled SOAconcentrations during nighttime are dominated by bio-genics, with predicted BSOA levels close to 2µg m−3,reducing the model overall bias by 20% at all sites com-pared to the ANT-T case which does not include bio-genic SOA.
The presence of anthropogenic emissions of isoprenewithin the city and the SOA formation during night-time from the oxidation of isoprene by NO3, contributean additional 15% increase in the total simulated SOA.
The predicted biogenic SOA levels are of the same or-der as those estimated from tracers, which implies thatbiogenic SOA is not majorly underestimated by currentmodels, in strong contrast of what is observed for an-thropogenic pollution. However, accounting for bothtraditional anthropogenic and biogenic SOA precursorsexplains only 35% of the observed SOA within the city,showing the need to account for additional processes orprecursors.
(vi) Concentrations of mono-substituted and poly-substituted aromatics are reasonably reproducedby the model which indicates that traditional anthro-pogenic SOA precursors are not underpredicted and arenot responsible for the strong negative bias in modeledSOA. Similarly OH is reasonably reproduced by themodel.
(vii) Gas/aerosol partitioning is poorly understood and con-stitutes a sensitive parameter for the prediction of SOAlevels. Sensitivity runs indicate that a much betteragreement with SOA observations can be achievedwhen vapor pressures of various organic compoundsare artificially decreased by two orders of magnitude.This decrease may possibly happen if semi-volatile or-ganic precursors undergo multiple generations of oxida-tions or if organic species oligomerize inside the parti-cle leading to a less volatile mix of species. This arti-ficially increase partitioning toward aerosol provides afirst-order upper limit for the amount of SOA that canbe formed using the traditional two-product mechanismfrom the initially available VOC precursors if polymer-ization processes were to be considered.
(viii) The comparison of daily SOA profiles suggests that themodel model/measurement discrepancies could arisefrom too high volatility of the model SOA, which wouldlead to the model’s inability to retain more permanentlythe freshly formed secondary organic aerosols insidethe particulate phase during the afternoon hours. Al-though sensitivity runs with enhanced partitioning to-ward the aerosol phase provided more realistic daily av-erage SOA concentrations, the large afternoon discrep-ancies remained. The model inability to simulate thispersistent SOA fraction could be explained by missingprocesses that reduce the vapor pressure of semivolatileorganic species, such as oligomerization. However thediscrepancies can also be due to missing precursors,rather or in addition to missing processes for the pre-cursors that are represented in the model.
(ix) The comparison of the PBL column-integrated SOAmass at the T0 site allowed quantifying the missingSOA mass in the model in this region. We estimatedthat within the MCMA area the model underprediction
Atmos. Chem. Phys., 9, 6949–6982, 2009 www.atmos-chem-phys.net/9/6949/2009/

A. Hodzic et al.: Modeling organic aerosols during MILAGRO 6975
ranges from 1 Ton at nighttime up to 20 Tons in the af-ternoon when considering the traditional SOA forma-tion approach from both anthropogenic and biogenicVOC precursors. The assumed extreme enhanced parti-tioning toward the aerosol phase allowed reducing themodel underprediction from a factor of 5 (∼20 tons)down to 30% (∼8 tons) during the day. This new way ofevaluating the predicted SOA mass using the column-integrated concentration highlights the extent of theSOA mass underprediction in current models and thepotential influence of this gap on the estimates of theaerosol direct radiative forcing in this region.
(x) The contribution of biomass burning to SOA productionis very small in the model but it is likely underestimated.The effect of SOA formation from SVOC+IVOC emit-ted from BB sources will be evaluated in the follow-onstudy.
(xi) According to our modeling results, the relative contri-bution of biogenic SOA (modern carbon) to the pre-dicted monthly mean SOA amount from the traditionalapproach is up to 40% at T0, and that ratio exceeds 60%at the regional scale (T1) during MILAGRO which isconsistent with recent measurements of C14 (Marley etal., 2009; Aiken et al. 2009b) during low biomass burn-ing periods.
Obtaining perfect agreement with the observed SOAvalues is extremely challenging, and it is beyond theobjectives of this paper, because of large uncertain-ties involved at every step of the SOA modeling. Wehave shown the importance of biogenic precursors inthe formation of SOA in this region, but there are manymore areas of uncertainty and directions for improve-ment to be considered such as the formation of SOAfrom S/IVOCs (Robinson et al., 2007), in clouds (Limet al., 2005), by reactions in the aerosol water phase(Volkamer et al., 2009), etc. One should keep in mindthat other precursors with similar lifetimes and over-all yields could lead to similar results and explain theobserved SOA levels. The results of the present workhave an important impact on the way the future model-ing studies in this region should be designed.
Acknowledgements.We gratefully acknowledge L. Emmons(NCAR), T. Karl (NCAR), J. Orlando (NCAR), for valuablescientific discussions on this topic. We thank Rahul Zaveri, ChenSong, and Liz Alexander from PNNL for providing AMS data atT1. We thank C. Wiedinmyer for providing wildfire emissions.This research was performed under sponsorship of the NationalScience Foundation and the NCAR Advanced Study Program.J. L. Jimenez, A. C. Aiken, and I. M. Ulbrich were supported byNSF, DOE (BER, ASP Program), and NOAA OGP, while G. Curciwas supported by the QUITSAT/ASI project.
Edited by: J. Gaffney
References
Aiken, A. C., Salcedo, D., Cubison, M. J., Huffman, J. A., DeCarlo,P. F., Ulbrich, I. M., Docherty, K. S., Sueper, D., Kimmel, J.R., Worsnop, D. R., Trimborn, A., Northway, M., Stone, E. A.,Schauer, J. J., Volkamer, R. M., Fortner, E., de Foy, B., Wang, J.,Laskin, A., Shutthanandan, V., Zheng, J., Zhang, R., Gaffney, J.,Marley, N. A., Paredes-Miranda, G., Arnott, W. P., Molina, L. T.,Sosa, G., and Jimenez, J. L.: Mexico City aerosol analysis duringMILAGRO using high resolution aerosol mass spectrometry atthe urban supersite (T0) – Part 1: Fine particle composition andorganic source apportionment, Atmos. Chem. Phys., 9, 6633–6653, 2009a,http://www.atmos-chem-phys.net/9/6633/2009/.
Aiken, A. C., de Foy, B., Wiedinmyer, C., DeCarlo, P. F., et al.:Mexico City Aerosol Analysis during MILAGRO using HighResolution Aerosol Mass Spectrometry at the Urban Supersite(T0) – Part 2: Analysis of the Biomass Burning Contribution andthe Modern Carbon Fraction. Atmos. Chem. Phys. Discuss., inpress, 2009b.
Aiken, A. C., DeCarlo, P. F., Kroll, J. H., Worsnop, D. R., Huff-man, J. A., Docherty, K., Ulbrich, I. M., Mohr, C., Kimmel, J.R., Sueper, D., Zhang, Q., Sun, Y., Trimborn, A., Northway, M.,Ziemann, P. J., Canagaratna, M. R., Onasch, T. B., Alfarra, R.,Prevot, A. S. H., Dommen, J., Duplissy, J., Metzger, A., Bal-tensperger, U., and Jimenez, J. L.: O/C and OM/OC Ratios ofPrimary, Secondary, and Ambient Organic Aerosols with HighResolution Time-of-Flight Aerosol Mass Spectrometry, Environ.Sci. Technol., 42, 4478–4485, doi:10.1021/es703009q, 2008.
Bessagnet, B., Menut, L., Curci, G., Hodzic, A., et al.: Regionalmodeling of carbonaceous aerosol over Europe – Focus on Sec-ondary Organic Aerosols, J. Atmos. Chem., 0167-7764 (Print)1573-0662, doi:10.1007/s10874-009-9129-2, 2009.
Bessagnet, B., A. Hodzic, R. Vautard, M. Beekmann, S. Cheinet,C. Honore, C. Liousse and L. Rouil, Aerosol modeling withCHIMERE – preliminary evaluation at the continental scale, At-mos. Environ., 38, 2803–2817, 2004.
Brown, S. S., deGouw, J. A., Warneke, C., Ryerson, T. B., Dube, W.P., Atlas, E., Weber, R. J., Peltier, R. E., Neuman, J. A., Roberts,J. M., Swanson, A., Flocke, F., McKeen, S. A., Brioude, J., Som-mariva, R., Trainer, M., Fehsenfeld, F. C., and Ravishankara,A. R.: Nocturnal isoprene oxidation over the Northeast UnitedStates in summer and its impact on reactive nitrogen partitioningand secondary organic aerosol, Atmos. Chem. Phys., 9, 3027–3042, 2009,http://www.atmos-chem-phys.net/9/3027/2009/.
CAM (Comision Ambiental Metropolitana): Inventario de Emi-siones 2002 de la Zona Metropolitana del Valle de Mexico, Mex-ico, 2004.
Camredon, M., Aumont, B., Lee-Taylor, J., and Madronich, S.: TheSOA/VOC/NOx system: an explicit model of secondary organicaerosol formation, Atmos. Chem. Phys., 7, 5599–5610, 2007,http://www.atmos-chem-phys.net/7/5599/2007/.
Canagaratna, M. R., Jayne, J. T., Jimenez, J. L., Allan, J. D., Al-farra, M. R., Zhang, Q., Onasch, T. B., Drewnick, F., Coe, H.,Middlebrook, A., Delia, A., Williams, L. R., Trimborn, A. M.,Northway, M. J., DeCarlo, P. F., Kolb, C. E., Davidovits, P.,and Worsnop, D. R.: Chemical and Microphysical Character-ization of Ambient Aerosols with the Aerodyne Aerosol MassSpectrometer, Mass Spectrom. Rev., 26, 185–222, 2007.
Capes, G., Johnson, B., McFiggans, G., Williams, P. I., Haywood,J., and Coe, H.: Aging of Biomass Burning Aerosols Over West
www.atmos-chem-phys.net/9/6949/2009/ Atmos. Chem. Phys., 9, 6949–6982, 2009

6976 A. Hodzic et al.: Modeling organic aerosols during MILAGRO
Africa: Aircraft Measurements of Chemical Composition, Mi-crophysical Properties, and Emission Ratios, J. Geophys. Res.,113, D00C15, doi:10.1029/2008JD009845, 2008.
Chen, Q., Farmer, D. K., Schneider, J., et al.: Mass Spectral Charac-terization of Submicron Biogenic Organic Particles in the Ama-zon Basin, Geophys. Res. Lett., in press, 2009.
Chung, S. H. and Seinfeld, J. H.: Global distribution and climateforcing of carbonaceous aerosols, J. Geophys. Res., 107(D19),4407, doi:10.1029/2001JD001397, 2002.
Claeys, M., Graham, B., Vas, G., et al.: Formation of secondaryorganic aerosols through photooxidation of isoprene, Science,303(5661), 1173–1176, 2004.
Clarke, A., McNaughton, C., Kasputin, V. N., et al.: Biomassburning and pollution aerosol over North America: Organiccomponents and their influence on spectral optical propertiesand humidification response, J. Geophys. Res., 112, D12S18,doi:10.1029/2006JD007777, 2007.
Crounse, J. D., DeCarlo, P. F., Blake, D. R., Emmons, L. K., Cam-pos, T. L., Apel, E. C., Clarke, A. D., Weinheimer, A. J., Mc-Cabe, D. C., Yokelson, R. J., Jimenez, J. L., and Wennberg, P.O.: Biomass burning and urban air pollution over the CentralMexican Plateau, Atmos. Chem. Phys., 9, 4929–4944, 2009,http://www.atmos-chem-phys.net/9/4929/2009/.
Cubison, M. J., Ervens, B., Feingold, G., et al.: The influence ofchemical composition and mixing state of Los Angeles urbanaerosol on CCN number and cloud properties, Atmos. Chem.Phys., 8, 5649–5667, 2008,http://www.atmos-chem-phys.net/8/5649/2008/.
DeCarlo, P. F., Kimmel, J. R., Trimborn, A., Northway, M. J., Jayne,J. T., Aiken, A. C., Gonin, M., Fuhrer, K., Horvath, T., Docherty,K., Worsnop, D. R., and Jimenez, J. L.: Field-Deployable, High-Resolution, Time-of-Flight Aerosol Mass Spectrometer, Anal.Chem., 78, 8281–8289, 2006.
DeCarlo, P. F., Dunlea, E. J., Kimmel, J. R., Aiken, A. C., Sueper,D., Crounse, J., Wennberg, P. O., Emmons, L., Shinozuka, Y.,Clarke, A., Zhou, J., Tomlinson, J., Collins, D., Knapp, D., Wein-heimer, A., Campos, T., and Jimenez, J. L.: Fast airborne aerosolsize and chemistry measurements above Mexico City and CentralMexico during the MILAGRO campaign,. Atmos. Chem. Phys.,8, 4027–4048, 2008,http://www.atmos-chem-phys.net/8/4027/2008/.
De Foy, B., Varela, J. R., Molina, L. T., and Molina, M. J.: Rapidventilation of the Mexico City basin and regional fate of the ur-ban plume, Atmos. Chem. Phys., 6, 2321–2335, 2006,http://www.atmos-chem-phys.net/6/2321/2006/.
de Gouw, J. A., Welsh-Bon, D., Warneke, C., Kuster, W. C., Alexan-der, L., Baker, A. K., Beyersdorf, A. J., Blake, D. R., Cana-garatna, M., Celada, A. T., Huey, L. G., Junkermann, W., Onasch,T. B., Salcido, A., Sjostedt, S. J., Sullivan, A. P., Tanner, D.J., Vargas, O., Weber, R. J., Worsnop, D. R., Yu, X. Y., andZaveri, R.: Emission and chemistry of organic carbon in thegas and aerosol phase at a sub-urban site near Mexico City inMarch 2006 during the MILAGRO study, Atmos. Chem. Phys.,9, 3425–3442, 2009,http://www.atmos-chem-phys.net/9/3425/2009/.
de Gouw, J. and Jimenez, J. L.: Organic Aerosols in the Earth’sAtmosphere, Environ. Sci. Technol., in press, 2009.
Docherty, K. S., Stone, E. A., Ulbrich, I. M., DeCarlo, P. F., Snyder,D. C., Schauer, J. J., Peltier, R. E., Weber, R. J., Murphy, S. M.,
Seinfeld, J. H., Grover, B. D., Eatough, D. J., and Jimenez, J. L.:Apportionment of Primary and Secondary Organic Aerosols inSouthern California during the 2005 Study of Organic Aerosolsin Riverside (SOAR), Environ. Sci. Technol., 42, 7655–7662,doi:10.1021/es8008166, 2008.
Donahue, N. M., Robinson, A. L., Stanier, C. O., and Pandis,S. N.: Coupled partitioning, dilution, and chemical aging ofsemivolatile organics, Environ. Sci. Technol., 40, 2635–2643,2006.
Doran, J. C., Barnard, J. C., Arnott, W. P., Cary, R., Coulter, R.,Fast, J. D., Kassianov, E. I., 15 Kleinman, L., Laulainen, N. S.,Martin, T., Paredes-Miranda, G., Pekour, M. S., Shaw, W. J.,Smith, D. F., Springston, S. R., and Yu, X.-Y.: The T1-T2 study:evolution of aerosol properties downwind of Mexico City, At-mos. Chem. Phys., 7, 1585–1598, 2007,http://www.atmos-chem-phys.net/7/1585/2007/.
Doran, J. C. and Zhong, S.: Thermally driven gap winds into theMexico City basin, J. Appl. Meteorol., 39, 1330–1340, 2000.
Drewnick, F., Hings, S. S., DeCarlo, P. F., Jayne, J. T., Gonin, M.,Fuhrer, K., Weimer, S., Jimenez, J. L., Demerjian, K. L., Bor-rmann, S., and Worsnop, D. R.: A new Time-of-Flight AerosolMass Spectrometer (ToF-AMS) – Instrument Description andFirst Field Deployment, Aerosol Sci. Tech., 39, 637–658, 2005.
Dudhia, J.: A nonhydrostatic version of the Penn State/NCARmesoscale model: validation tests and simulation of an Atlanticcyclone and cold front, Mon. Weather Rev., 121, 1493–1513,1993.
Dzepina, K., Volkamer, R. M., Madronich, S., Tulet, P., Ulbrich,I. M., Zhang, Q., Cappa, C. D., Ziemann, P. J., and Jimenez, J.L.: Evaluation of New Secondary Organic Aerosol Models for aCase Study in Mexico City, Atmos. Chem. Phys., 9, 5681–5709,2009,http://www.atmos-chem-phys.net/9/5681/2009/..
Edgerton, S. A., Edgerton, S. A., Arriaga, J. L., Archuleta, J., Bian,X., Bossert, J. E., et al.: Particulate air pollution in Mexico City:A collaborative research project, JAPCA J. Air Waste Manage.,49(10), 1221–1229, 1999.
Ervens, B., Cubison, M., Andrews, E., et al.: Prediction of cloudcondensation nucleus number concentration using measurementsof aerosol size distributions and composition and light scatteringenhancement due to humidity, J. Geophys. Res., 112, D10S32,doi:10.1029/2006JD007426, 2007.
Facchini, M. C., Mircea, M., Fuzzi, S., and Charlson, R. J.: Cloudalbedo enhancement by surface-active organic solutes in growingdroplets, Nature, 401, 257–259, 1999.
Fast, J. D. and Zhong, S.: Meteorological factors associated withinhomogeneous ozone concentrations within the Mexico Citybasin, J. Geophys. Res., 103, 18927–18946, 1998.
Fast, J. D., de Foy, B., Acevedo Rosas, F., Caetano, E., Carmichael,G., Emmons, L., McKenna, D., Mena, M., Skamarock, W.,Tie, X., Coulter, R. L., Barnard, J. C., Wiedinmyer, C., andMadronich, S.: A meteorological overview of the MILAGROfield campaigns, Atmos. Chem. Phys., 7, 2233–2257, 2007,http://www.atmos-chem-phys.net/7/2233/2007/.
Fast, J., Aiken, A. C., Allan, J., et al.: Evaluating simulated primaryanthropogenic and biomass burning organic aerosols during MI-LAGRO: implications for assessing treatments of secondary or-ganic aerosols, Atmos. Chem. Phys., 9, 6191–6215, 2009,http://www.atmos-chem-phys.net/9/6191/2009/.
Faulhaber, A., Klingbeil, B. M., Jimenez, J. L., Jayne, J. T.,
Atmos. Chem. Phys., 9, 6949–6982, 2009 www.atmos-chem-phys.net/9/6949/2009/

A. Hodzic et al.: Modeling organic aerosols during MILAGRO 6977
Worsnop, D. R., and Ziemann, P. J.: Characterization of aThermodenuder-Particle Beam Mass Spectrometer System forthe Study of Organic Aerosol Volatility and Composition, At-mos. Meas. Tech., 2, 15–31, 2009,http://www.atmos-meas-tech.net/2/15/2009/.
Fortner, E. C., Zheng, J., Zhang, R., et al.: Measurements of VolatileOrganic Compounds Using Proton Transfer Reaction – MassSpectrometry during the MILAGRO 2006 Campaign, Atmos.Chem. Phys., 9, 467–481, 2009,http://www.atmos-chem-phys.net/9/467/2009/.
Ginoux, P., Chin, M., Tegen, I., Prospero, J. M., Holben, B.,Dubovik, O., and Lin, S.-J.: Sources and distributions of dustaerosols simulated with the GOCART model, J. Geophys. Res.,106, 20255–20273, 2001.
Grieshop, A. P., Logue, J. M., Donahue, N. M., and Robinson, A.L.: Laboratory investigation of photochemical oxidation of or-ganic aerosol from wood fires 1: measurement and simulation oforganic aerosol evolution, Atmos. Chem. Phys., 9, 1263–1277,2009a,http://www.atmos-chem-phys.net/9/1263/2009/.
Grieshop, A. P., Donahue, N. M., and Robinson, A. L.: Laboratoryinvestigation of photochemical oxidation of organic aerosol fromwood fires 2: analysis of aerosol mass spectrometer data, Atmos.Chem. Phys., 9, 2227–2240, 2009b,http://www.atmos-chem-phys.net/9/2227/2009/.
Griffin, R. J., Dabdub, D., and Seinfeld, J. H.: Secondary organicaerosol: I. Atmospheric chemical mechanism for productionof molecular constituents, J. Geophys. Res., 107(D17), 4332,doi:10.1029/2001JD000541, 2002.
Guenther, A., Karl, T., Harley, P., et al.: Estimates of global terres-trial isoprene emissions using MEGAN (Model of Emissions ofGases and Aerosols from Nature), Atmos. Chem. Phys., 6, 3181–3210, 2006,http://www.atmos-chem-phys.net/6/3181/2006/.
Guenther, A., Hewitt, C. N., Erickson, D., et al.: A global model ofnatural volatile organic compound emissions, J. Geophys. Res.,100(D5), 8873–8892, 1995.
Hallquist, M., Wenger, J. C., Baltensperger, U., Rudich, Y., Simp-son, D., Claeys, M., Dommen, J., Donahue, N. M., George,C., Goldstein, A. H., Hamilton, J. F., Herrmann, H., Hoffmann,T., Iinuma, Y., Jang, M., Jenkin, M., Jimenez, J. L., Kiendler-Scharr, A., Maenhaut, W., McFiggans, G., Mentel, T., Monod,A., Prevot, A. S. H., Seinfeld, J. H., Surratt, J. D., Szmigielski,R., and Wildt, J.: The Formation, Properties and Impact of Sec-ondary Organic Aerosol: Current and Emerging Issues, Atmos.Chem. Phys., 9, 5155–5235, 2009,http://www.atmos-chem-phys.net/9/5155/2009/.
Hamilton, J. F., Webb, P. J., Lewis, A. C., Hopkins, J. R., Smith,S., and Davy, P.: Partially oxidised organic components in urbanaerosol using GCXGC-TOF/MS, Atmos. Chem. Phys., 4, 1279–1290, 2004,http://www.atmos-chem-phys.net/4/1279/2004/.
Hauglustaine, D. A., Hourdin, F., Walters, S., Jourdain, L., Fil-iberti, M.-A., Larmarque, J.-F., and Holland, E. A.: Interac-tive chemistry in the Laboratoire de Meteorologie Dynamiquegeneral circulationmodel: description and background tropo-spheric chemistry evaluation, J. Geophys. Res., 109, D04314,doi:10.1029/2003JD003957, 2004.
Henze, D. K. and Seinfeld, J. H.: Global secondary organic aerosolfrom isoprene oxidation, Geophys. Res. Lett., 33, L09812,doi:10.1029/2006GL025976, 2006.
Herndon, S. C., Onasch, T. B., Wood, E. C., Kroll, J. H., Cana-
garatna, M. R., Jayne, J. T., Zavala, M. A., Knighton, W. B.,Mazzoleni, C., Dubey, M. K., Ulbrich, I. M., Jimenez, J. L.,Seila, R., de Gouw, J. A., de Foy, B., Fast, J., Molina, L. T.,Kolb, C. E., and Worsnop, D. R.: The Correlation of SecondaryOrganic Aerosol with Odd Oxygen in a Megacity Outflow, Geo-phys. Res. Lett., 35, L15804, doi:10.1029/2008GL034058, 2008.
Hildemann, L. M., Klinedinst, D. B., Klouda, G. A., Currie, L.A., and Cass, G. R.: Sources of Urban Contemporary CarbonAerosol, Environ. Sci. Technol., 28(9), 1565–1576, 1994.
Hodzic, A., Chepfer, H., Vautard, R., et al.: Comparison of aerosolchemistry transport model simulations with lidar and Sun pho-tometer observations at a site near Paris, J. Geophys. Res., 109,D23201, doi:10.1029/2004JD004735, 2004.
Hodzic, A., Vautard, R., Bessagnet, B., et al.: Long-term urbanaerosol simulation versus routine particulate matter observations,Atmos. Environ., 39, 5851–5864, 2005.
Hodzic, A., Vautard, R., Chazette, P., Menut, L., and Bessagnet,B.: Aerosol chemical and optical properties over the Paris areawithin ESQUIF project, Atmos. Chem. Phys., 6, 3257–3280,2006a,http://www.atmos-chem-phys.net/6/3257/2006/.
Hodzic, A., Bessagnet, B., and Vautard, R.: A model evaluation ofcoarse-mode nitrate heterogeneous formation on dust particles,Atmos. Environ., 40(22), 4158–4171, 2006b.
Hodzic, A., Madronich, S., Bohn, B., et al.: Wildfire particulatematter in Europe during summer 2003: meso-scale modeling ofsmoke emissions, transport and radiative effects, Atmos. Chem.Phys., 7, 4043–4064, 2007,http://www.atmos-chem-phys.net/7/4043/2007/.
Huffman, J. A., Docherty, K. S., Aiken, A. C., Cubison, M. J., Ul-brich, I. M., DeCarlo, P. F., Sueper, D., Jayne, J. T., Worsnop,D. R., Ziemann, P. J., and Jimenez, J. L.: Chemically-ResolvedAerosol Volatility Measurements from Two Megacity Field Stud-ies, Atmos. Chem. Phys., in press, 2009.
Iinuma, Y., Boge, O., Gnauk, T., and Herrmann, H.: Aerosol cham-ber study of theα-pinene/O3 reaction: Influence of particle acid-ity on aerosol yields and products, Atmos. Environ., 38, 761–773, 2004.
IPCC: Forster, P., Ramaswamy, V., Artaxo, P., Berntsen, T., Betts,R., Fahey, D. W., Haywood, J., Lean, J., Lowe, D. C., Myhre,G., Nganga, J., Prinn, R., Raga, G., Schulz, M., and Van Dor-land, R.: Changes in Atmospheric Constituents and in RadiativeForcing, in: Climate Change 2007: The Physical Science Basis.Contribution of Working Group I to the Fourth Assessment Re-port of the Intergovernmental Panel on Climate Change, editedby: Solomon, S., Qin, D., Manning, M., Chen, Z., Marquis, M.,Averyt, K. B., Tignor, M., and Miller, H. L., Cambridge Univer-sity Press, Cambridge, UK and New York, NY, USA, 2007.
Jang, M., Czoschke, N. M., Lee, S., and Kamens, R. M.: Heteroge-neous atmospheric aerosol production by acid-catalyzed particle-phase reactions, Nature, 298, 814–817, 2002.
Johnson, D., Utembe, S. R., Jenkin, M. E., Derwent, R. G., Hay-man, G. D., Alfarra, M. R., Coe, H., and McFiggans, G.: Simu-lating regional scale secondary organic aerosol formation duringthe TORCH 2003 campaign in the southern UK, Atmos. Chem.Phys., 6, 403–418, 2006,http://www.atmos-chem-phys.net/6/403/2006/.
Kalberer, M., Paulsen, D., Sax, M., et al.: Identification of polymersas major components of atmospheric organic aerosols, Science,303(5664), 1659–1662, 2004.
www.atmos-chem-phys.net/9/6949/2009/ Atmos. Chem. Phys., 9, 6949–6982, 2009
6978 A. Hodzic et al.: Modeling organic aerosols during MILAGRO
Kanakidou, M., Seinfeld, J. H., Pandis, S. N., Barnes, I., Dentener,F. J., Facchini, M. C., Van Dingenen, R., Ervens, B., Nenes, A.,Nielsen, C. J., Swietlicki, E., Putaud, J. P., Balkanski, Y., Fuzzi,S., Horth, J., Moortgat, G. K., Winterhalter, R., Myhre, C. E.L., Tsigaridis, K., Vignati, E., Stephanou, E. G., and Wilson, J.:Organic aerosol and global climate modelling: A review, Atmos.Chem. Phys, 5, 1053–1123, 2005.
Kleindienst, T. E., Jaoui, M., Lewandowski, M., Offenberg,J.H., Lewis, C.W., Bhave, P.W., and Edney, E.O. Estimatesof the contributions of biogenic and anthropogenic hydro-carbons to secondary organic aerosol at a southeastern U.S.Location, Atmospheric Environment (2007), 41, 8288–8300,doi:10.1016/j.atmosenv.2007.06.045.
Kleinman, L. I., Springston, S. R., Daum, P. H., Lee, Y.-N., Nun-nermacker, L. J., Senum, G. I., Wang, J., Weinstein-Lloyd, J.,Alexander, M. L., Hubbe, J., Ortega, J., Canagaratna, M. R., andJayne, J.: The time evolution of aerosol composition over theMexico City plateau, Atmos. Chem. Phys., 8, 1559–1575, 2008,http://www.atmos-chem-phys.net/8/1559/2008/.
Kondo, Y., Miyazaki, Y., Takegawa, N., Miyakawa, T., Weber,R. J., Jimenez, J. L., Zhang, Q., and Worsnop, D. R.: Oxy-genated and water-soluble organic aerosols in Tokyo. Jour-nal of Geophysical Research - Atmospheres, 112, D01203,doi:10.1029/2006JD007056, 2007.
Konovalov, I. B., Beekmann, M., Richter, A., and Burrows, J. P.:Inverse modelling of the spatial distribution of NOx emissionson a continental scale using satellite data. Atmos. Chem. Phys.6, 1747–1770, 2007.
Kroll, J. H. and Seinfeld, J. H.: Representation of secondary organicaerosol laboratory chamber data for the interpretation of mecha-nisms of particle growth, Environ. Sci. Technol., 39, 4159–4165,2005.
Kroll, J. H., Ng, N. L., Murphy, S. M., Flagan, R. C., and Seinfeld J.H.: (2006), Secondary organic aerosol formation from isopreneoxidation, Environ. Sci. Technol., 40, 1869–1877, 2006.
Lanz, V. A., Alfarra, M. R., Baltensperger, U., Buchmann, B.,Hueglin, C., and Prevot, A. S. H.: Source Apportionmentof Submicron Organic Aerosols at an Urban Site by Fac-tor Analytical Modelling of Aerosol Mass Spectra, Atmos.Chem. Phys., 7, 1503–1522, 2007,http://www.atmos-chem-phys.net/7/1503/2007/.
Lattuati, M.: Contributiona l’etude du bilan de l’ozone tro-pospheriquea l’interface de l’Europe et de l’Atlantique Nord:Modelisation lagrangienne et mesures en altitude. Ph.D. Thesis,University Pierre et Marie Curie, Paris, France, 1997.
Lei, W., de Foy, B., Zavala, M., Volkamer, R., and Molina, L. T.:Characterizing ozone production in the Mexico City Metropoli-tan Area: a case study using a chemical transport model, Atmos.Chem. Phys., 7, 1347–1366, 2007,http://www.atmos-chem-phys.net/7/1347/2007/.
Lemire, K. R., Allen, D. T., Klouda, G. A., and Lewis, C.W.: Fine particulate matter sourceattribution for SoutheastTexas using C-14/C-13 ratios, J. Geophys. Res., 107, 4613,doi:10.1029/2002JD002339, 2002.
Liao, H., Henze, D. K., Seinfeld, J. H., Wu, S., and Mickley, L.J.: Biogenic secondary organic aerosol over the United States:Comparison of climatological simulations with observations, J.Geophys. Res., 112, D06201, doi:10.1029/2006JD007813, 2007.
Lim, H.-J., Carlton, A. C., and Turpin, B. J.: Isoprene forms sec-
ondary organic aerosol through cloud processing: model simula-tions, Environ. Sci. Technol., 39, 4441–4446, 2005.
Limbeck, A., Kulmala, M., and Puxbaum, H.: Secondary organicaerosol formation via heterogeneous reaction of gaseous iso-prene on acidic particles. Geophys. Res. Lett., 30(19), 1996,doi:10.1029/2003GL017738, 2003.
Liu, Y., Chen, F., Warner, T., Swerdlin, S., Bowers, J., and Halvor-son, S.: Improvements to surface flux computations in a non-local-mixing PBL scheme, and refinements on urban processesin the Noah land-surface model with the NCAR/ATEC real-timeFDDA and forecast system. 20th Conference on Weather Anal-ysis and Forecasting/16 Conference on Numerical Weather Pre-diction, Seattle, Washington, USA, 2004.
Liu, Y., El Haddad, I., Scarfogliero, M., Nieto-Gligorovski,L., Temime-Roussel, B., Quivet, E., Marchand, N., Picquet-Varrault, B., and Monod, A.: In-cloud processes of methacroleinunder simulated conditions – Part 1: Aqueous phase photooxida-tion, Atmos. Chem. Phys., 9, 5093–5105, 2009,http://www.atmos-chem-phys.net/9/5093/2009/.
Loosmore, G. and Cederwall, R.: Precipitation scavenging of atmo-spheric aerosols for emergency response applications: testing anupdated model with new real-time data, Atmos. Env., 38, 993–1003, 2004.
Madronich, S., McKenzie, R. E., Bjorn, L. O., and Caldwell, M.M.: Changes in biologically active ultraviolet radiation reachingthe earth’s surface, J. Photochem. Photobiol. Biology, 46, 5–19,1998.
Marley, N. A., Gaffney, J. S., Tackett, M., Sturchio, N. C., et al.:The impact of biogenic carbon sources on aerosol absorption inMexico City, Atmos. Chem. Phys., 9, 1537–1549, 2009,http://www.atmos-chem-phys.net/9/1537/2009/.
Martin-Reviejo, M. and Wirtz, K.: Is benzene a precursor for sec-ondary organic aerosol? Environ. Sci. Technol., 39, 1045–1054,2005.
Marr, L. C., Dzepina, K., Jimenez, J. L., Riesen, F., Bethel, H. L.,Arey, J., Gaffney, J. S., Marley, N. A., Molina, L. T., Molina,M. J.: Sources and transformations of particle-bound polycyclicaromatic hydrocarbons in Mexico City, Atmos. Chem. Phys., 6,1733–1745, 2006,http://www.atmos-chem-phys.net/6/1733/2006/.
McMurry, P. H.: A review of atmospheric aerosol measurements,Atmos. Environ., 34, 1959–1999, 2000.
Moffet, R. C., de Foy, B., Molina, L. T., Molina, M. J., and Prather,K. A.: Measurement of ambient aerosols in northern Mexico Cityby single particle mass spectrometry, Atmos.Chem. Phys. Dis-cuss., 7, 6413–6457, 2007.
Mohr, C., Huffman, J. A., Cubison, M. J., Aiken, A. C., et al.:Characterization of Primary Organic Aerosol Emissions fromMeat Cooking, Trash Burning, and Motor Vehicles with High-Resolution Aerosol Mass Spectrometry and Comparison withAmbient and Chamber Observations, Environ. Sci. Technol., 43,2443–2449, 2009.
Molina, L. T., Kolb, C. E., de Foy, B., Lamb, B. K., Brune, W.H., Jimenez, J. L., Ramos-Villegas, R., Sarmiento, J., Paramo-Figueroa, V. H., Cardenas, B., Gutierrez-Avedoy, V., and Molina,M. J.: Air quality in North America’s most populous city –overview of the MCMA-2003 campaign, Atmos. Chem. Phys.,7, 2447–2473, 2007,http://www.atmos-chem-phys.net/7/2447/2007/.
Atmos. Chem. Phys., 9, 6949–6982, 2009 www.atmos-chem-phys.net/9/6949/2009/

A. Hodzic et al.: Modeling organic aerosols during MILAGRO 6979
Molina, L. T., Madronich, S., Gaffney, J. S., and Singh, H.B.: Overview of MILAGRO/INTEX-B Campaign, IGACtivitiesNewsletter, Issue 38, 2–15, 2008.
Muller, J.-F., Stavrakou, T., Wallens, S., De Smedt, I., Van Roozen-dael, M., Potosnak,M. J., Rinne, J., Munger, B., Goldstein, A.,and Guenther, A. B.: Global isoprene emissions estimated usingMEGAN, ECMWF analyses and a detailed canopy environmentmodel, Atmos. Chem. Phys., 8, 1329–1341, 2008,http://www.atmos-chem-phys.net/8/1329/2008/.
Murphy, D. M.: Something in the air. Science, 307, 1888–1890,2005.
Murphy, D. M., Cziczo, D. J., Froyd, K. D., Hudson, P. K., Matthew,B. M., Middlebrook, A. M., Peltier, R. E., Sullivan, A., Thomson,D. S., and Weber, R. J.: Single-particle mass spectrometry oftropospheric aerosol particles, J. Geophys. Res., 111, D23S32,doi:10.1029/2006JD007340, 2006.
Nemitz, E., Jimenez, J. L., Huffman, J. A., Canagaratna, M. R.,Worsnop, D. R., and Guenther, A. B.: An eddy-covariance sys-tem for the measurement of surface / atmosphere exchange fluxesof submicron aerosol chemical species – first application abovean urban area, Aerosol Sci. Technol., 42, 636–657, 2008.
Nenes, A., Pilinis, C., and Pandis, S.: ISORROPIA: A new ther-modynamic model for inorganic multicomponent atmosphericaerosols, Aquatic Geochem., 4, 123–152, 1998.
Ng NL, Kwan AJ, Surratt JD, et al., Secondary organic aerosol(SOA) formation from reaction of isoprene with nitrate radicals(NO3), Atmos. Chem. Phys., 8, issue 14, pp 4117-4140, 2008.
Odum, J. R., Hoffmann, T., Bowman, F., Collins, D., Flagan, R.C., and Seinfeld, J. H.: Gas/particle partitioning and secondaryorganic aerosol yields. Environ. Sci. Technol., 30, 2584–2585,1996.
Paatero, P. and Tapper, U.: Positive matrix factorization: A non-negative factor model with optimal utilization of error estimatesof data values, Environmetrics, 5, 111–126, 1994.
Pankow, J. F.: An absorption model of gas/particle partitioningof organic compounds in the atmosphere, Atmos. Environ., 28,185–188, 1994.
Paredes-Miranda, G., Arnott, W. P., Jimenez, J. L., Aiken, A. C.,Gaffney, J. S., and Marley, N. A.: Primary and Secondary Con-tributions to Aerosol Light Scattering and Absorption in Mex-ico City During the MILAGRO 2006 Campaign, Atmos. Chem.Phys., 8, 3721–3730, 2009,http://www.atmos-chem-phys.net/8/3721/2009/.
Prenni, A. J., Petters, M. D., Kreidenweis, S. M., et al.: Clouddroplet activation of secondary organic aerosol, J. Geophys.Res.-Atmos., 112, D10223, doi:10.1029/2006JD007963, 2007.
Pope CA, Dockery DW, Health effects of fine particulate air pol-lution: Lines that connect, J. Air Waste Manage. Assoc., 56(6),709–742, 2006.
Pun, B., Wu, S., Seigneur, C., Seinfeld, J., Griffin, R., and Pan-dis, A.: Uncertainties in modeling secondary organic aerosols:Three-dimensional modeling studies in Nashville/western Ten-nessee, Environ. Sci. Technol., 37, 3647–3661, 2003.
Pun, B.: Modeling secondary organic aerosol formation via multi-phase partitioning with molecular data, Environ. Sci. Technol.,40, 4722–4731, 2006.
Pun, B.: Hydrophilic/Hydrophobic organic aerosol partition model– User’s Manual, INERIS, Doc. Nb. CP198-05-01, July 2005.
Pun, B. and Seigneur, C.: Investigative modeling of new pathways
for secondary organic aerosol formation, Atmos. Chem. Phys.,7(9), 2199–2216, 2007.
Querol, X., Pey, J., Minguillon, M. C., Perez, N., Alastuey, A.,Viana, M., Moreno, T., Bernabe, R. M., Blanco, S., Cardenas, B.,Vega, E., Sosa, G., Escalona, S., Ruiz, H., and Artınano, B.: PMspeciation and sources in Mexico during the MILAGRO-2006Campaign, Atmos. Chem. Phys., 8, 111–128, 2008,http://www.atmos-chem-phys.net/8/111/2008/.
Robinson, A. L., Donahue, N. M., Shrivastava, M. K., Weitkamp, E.A., Sage, A. M., Grieshop, A. P., Lane, T. E., Pandis, S. N., andPierce, J. R.: Rethinking organic aerosols: Semivolatile emis-sions and photochemical aging, Science, 315, 1259–1262, 2007.
Salcedo, D., Onasch, T. B., Dzepina, K., Canagaratna, M. R.,Zhang, Q., Huffman, J. A., DeCarlo, P. F., Jayne, J. T., Mor-timer, P., Worsnop, D. R., Kolb, C. E., Johnson, K. S., Zuberi,B., Marr, L. C., Volkamer, R., Molina, L. T., Molina, M. J., Car-denas, B., Bernabe, R. M., Marquez, C., Gaffney, J. S., Marley,N. A., Laskin, A., Shutthanandan, V., Xie, Y., Brune, W., Lesher,R., Shirley, T., and Jimenez, J. L.: Characterization of ambientaerosols in Mexico City during the MCMA-2003 campaign withAerosol Mass Spectrometry: results from the CENICA Super-site, Atmos. Chem. Phys., 6, 925–946, 2006,http://www.atmos-chem-phys.net/6/925/2006/.
Shaw, W. J., Pekour, M. S., Coulter, R. L., Martin, T. J., and Walters,J. T.: The daytime mixing layer observed by radiosonde, profiler,and lidar during MILAGRO, Atmos. Chem. Phys. Discuss., 7,15025–15065, 2007,http://www.atmos-chem-phys-discuss.net/7/15025/2007/.
Simpson, D., Yttri, K. E., Klimont, Z., Kupiainen, K., Caseiro, A.,Gelencser, A., Pio, C., Puxbaum, H., and Legrand, M.: Modelingcarbonaceous aerosol over Europe: Analysis of the CARBOSOLand EMEP EC/OC campaigns, J. Geophys. Res., 112, D23S14,doi:10.1029/2006JD008158, 2007.
Simpson, D., Winiwarter, W., Borjesson, G., et al.: Inventoryingemissions from nature in Europe, J. Geophys. Res., 104(D7),8113–8152, 1999.
Song, C., Zaveri, R. A., Alexander, M. L., Thornton, J. A.,Madronich, S., Ortega, J. V., Zelenyuk, A. N., Yu, X. Y., Laskin,A., and Maughan, A. D.: Effect of Hydrophobic Primary Or-ganic Aerosols on Secondary Organic Aerosol Formation fromOzonolysis ofα-Pinene, Geophys. Res. Lett., 34(20), L20803,doi:10.1029/2007GL030720, 2007.
Stephens, S., Madronich, S., Wu, F., Olson, J. B., Ramos, R., Re-tama, A., and Munoz, R., 2007. Weekly patterns of MeexicoCity’s surface concentrations of CO, NOx, PM10 and O3 dur-ing 1986–2007, Atmos. Chem. Phys., 8, 5313–5325, 2008,http://www.atmos-chem-phys.net/8/5313/2008/.
Stern, R., Builtjes, P., Schaap, M., Timmermans, R., Vautard, R.,Hodzic, A., Memmesheimer, M., Feldmann, H., Renner, R.,Wolke, R., and Kerschbaumer, A.: A model inter-comparisonstudy focussing on episodes with elevated PM10 concentrations,Atmos. Environ., 42(19), 4567–4588, 2008.
Stone, E. A., Hedman, C. J., Zhou, J., Mieritz, A., and Schauer, J. J:Insights into the nature of secondary organic aerosol in MexicoCity during the MILAGRO experiment 2006, Atmos. Environ.,submitted, 2009.
Stone, E. A., Snyder, D. C., Sheesley, R. J., et al.: Source appor-tionment of fine organic aerosol in Mexico City during the MI-LAGRO experiment 2006, Atmos. Chem. Phys. 8, 1249–1259,
www.atmos-chem-phys.net/9/6949/2009/ Atmos. Chem. Phys., 9, 6949–6982, 2009
6980 A. Hodzic et al.: Modeling organic aerosols during MILAGRO
2008.Stroud, C. A., Roberts, J. M., Williams, E. J., et al.: Night-
time isoprene trends at an urban forested site during the 1999Southern Oxidant Study, J. Geophys. Res., 107(D16), 4291,doi:10.1029/2001JD000959, 2002.
Surratt, J. D., Murphy, S. M., Kroll, J. H., et al.: Chemical compo-sition of secondary organic aerosol formed from the photooxida-tion of isoprene, J. Phys. Chem., 110, 9665–9690,2006.
Szidat, S., Jenk, T. M., Gaggeler, H. W., Synal, H. A., Fisseha, R.,Baltensperger, U., Kalberer, M., Samburova, V., Reimann, S.,Kasper-Giebl, A., and Hajdas, I.: Radiocarbon (C-14)-deducedbiogenic and anthropogenic contributions to organic carbon (OC)of urban aerosols from Zurich, Switzerland, Atmos. Environ., 38,4035–4044, 2004.
Tao, F., Gonzalez-Flecha, B., and Kobzik, L.: Reactive oxygenspecies in pulmonary inflammation by ambient particles, FreeRad. B., 35, 327–340, 2003.
Troen I. and Mahrt L., A simple-model of the atmospheric boundarylayer – Sensitivity to surface evaporation, Bound.-Layer Meteo-rol., 37(1–2), 129–148, 1986.
Tsigaridis, K. and Kanakidou, M.: Secondary organic aerosol im-portance in the future atmosphere, Atmos. Environ. 41, 4682–4692, 2007.
Tsimpidi, A. P., Karydis, V. A., Zavala, M., Lei, W., Molina, L.,Ulbrich, I. M., Jimenez, J. L., and Pandis, S. N.: Evaluation of thevolatility basis-set approach for the simulation of organic aerosolformation in the Mexico City metropolitan area, Atmos. Chem.Phys. Discuss., 9, 13693–13737, 2009,http://www.atmos-chem-phys-discuss.net/9/13693/2009/.
Tsyro, S.: First estimates of the effect of aerosol dynamics in thecalculation of PM10 and PM2.5, EMEP report, 2002.
Tunved, P., Hansson, H.-C., Kerminen, V.-M. et al., High NaturalAerosol Loading over Boreal Forests, Science, 312, 261, 2006.
Turpin B.J., Saxena P. and Andrews E., 2000. Measuring and sim-ulating particulate organics in the atmosphere: problems andprospects, Atmos. Environ. 34(18), 2983–3013.
Ulbrich, I. M., Canagaratna, M. R., Zhang, Q., Worsnop, D. R., andJimenez, J. L.: Interpretation of Organic Components from Pos-itive Matrix Factorization of Aerosol Mass Spectrometric Data,Atmos. Chem. Phys., 9, 2891–2918, 2009,http://www.atmos-chem-phys.net/9/2891/2009/.
Varutbangkul, V., Brechtel, F. J., Bahreini, R., et al.: Hygro-scopicity of secondary organic aerosols formed by oxidation ofcycloalkenes, monoterpenes, sesquiterpenes, and related com-pounds, Atmos. Chem. Phys., 6, 2367–2388, 2006,http://www.atmos-chem-phys.net/6/2367/2006/.
Vautard, R., Bessagnet, B., Chin, M., et al.: On the contributionof natural Aeolian sources to particulate matter concentrations inEurope: Testing hypotheses with a modelling approach. Atmos.Environ., 39(18), 3291–3303, 2005.
Vay, S. A., Tyler, S. C., Choi, Y., Blake, D. R., Blake, N. J., Sachse,G. W., Diskin, G. S., and Singh, H. B.: Sources and transport of14C on CO2 within the Mexico City Basin and vicinity, Atmos.Chem. Phys., 9, 4973–4985, 2009,http://www.atmos-chem-phys.net/9/4973/2009/.
Velasco, E., Lamb, B., Westberg, H., Allwine, E., Sosa, G., Ar-riaga, J. L., Jonson, T., Alexander, M., Prazeller, P., Knighton,B., Rogers, T. M., Grutter, M., Herndon, S. C., Kolb, C. E.,Zavala, M., de Foy, B., Molina, L. T., and Molina, M. J.: Dis-
tribution, magnitudes, reactivities, ratios and diurnal patterns ofvolatile organic compounds in the Valley of Mexico during theMCMA 2002 & 2003 field campaigns, Atmos. Chem. Phys., 7,329–353, 2007,http://www.atmos-chem-phys.net/7/329/2007/.
Volkamer, R., Jimenez, J. L., San Martini, F., Dzepina, K., Zhang,Q., Salcedo, D., Molina, L. T., Worsnop, D. R., and Molina, M.J.: Secondary Organic Aerosol Formation from AnthropogenicAir Pollution: Rapid and Higher than Expected, Geophys. Res.Lett., 33, L17811, doi:10.1029/2006GL026899, 2006.
Volkamer, R., San Martini, F., Molina, L. T., Salcedo, D.,Jimenez, J. L., Molina, M. J.: A Missing Sink for Gas-Phase Glyoxal in Mexico City: Formation of Secondary Or-ganic Aerosol. Geophysical Research Letters, 34, L19807,doi:10.1029/2007GL030752, 2007.
Volkamer, R., Ziemann, P. J., and Molina, M. J.: Secondary or-ganic aerosol formation from acetylene (C2H2): seed effect onSOA yields due to organic photochemistry in the aerosol aque-ous phase, Atmos. Chem. Phys., 9, 1907–1928, 2009,http://www.atmos-chem-phys.net/9/1907/2009/.
Warneck, P.: In-cloud chemistry opens pathway to the formationof oxalic acid in the marine atmosphere, Atmos. Environ., 37,2423–2427, 2003.
Warneke C., de Gouw, J. A., Del Negro, L., J. Brioude, McKeen, S.,Stark, H., Kuster, W. C., Goldan, P. D., Trainer, M., Fehsenfeld,F. C., Wiedinmyer, C., Guenther, A. B., Hansel, A., Wisthaler,A., Atlas, E., Huey, L. G., Case Hanks, A. T.: Determinationof Biogenic Emissions in the Eastern United States and Texasand Comparison with Biogenic Emission Inventories. J. Geo-phys. Res., submitted, 2009.
Wesely, M. L.: Parameterization of surface resistance of gaseousdry deposition in regional-scale numerical models, Atmos. Env-iron., 23, 1293–1304, 1989.
Wiedinmyer, C., Quayle, B., Geron, C., et al.: Estimating emissionsfrom fires in North America for air quality modeling, Atmos.Environ., 40, 3419–3432, 2006.
Williams, B. J., Goldstein, A. H., Millet, D. B., Holzinger, R.,Kreisberg, N. M., Hering, S. V., Allan, J. D., Worsnop, D. R.,Jimenez, J. L., and White, A. B.: Chemical Speciation of Or-ganic Aerosol during ICARTT 2004: Results from In-Situ Mea-surements. Journal of Geophysical Research-Atmospheres, 112,D10S26, doi:10.1029/2006JD007601, 2007.
West, J. J., Zavala, M. A., Molina, L. T., Molina, M. J., San Mar-tini, F., McRae, G. J., Sosa-Iglesias, G., and Arriaga-Colina, J.L.: Modeling ozone photochemistry and evaluation of hydrocar-bon emissions in the Mexico City metropolitan area, J. Geophys.Res., 109, D19312, doi:10.1029/2004JD004614, 2004.
Yttri, K. E., Aas, W., Bjerke, A., Cape, J. N., Cavalli, F., Ceburnis,D., Dye, C., Emblico, L., Facchini, M. C., Forster, C., Hanssen,J. E., Hansson, H. C., Jennings, S. G., Maenhaut, W., Putaud,J. P., and Trseth, K.: Elemental and organic carbon in PM10:A one year measurement campaign within the European Moni-toring and Evaluation Programme EMEP, Atmos. Chem. Phys.Disc., 7, 3859–3899, 2007.
Yokelson, R. J., Crounse, J. D., DeCarlo, P. F., Karl, T., Urbanski,S., Atlas, E., Campos, T., Shinozuka, Y., Kapustin, V., Clarke, A.D., Weinheimer, A., Knapp, D. J., Montzka, D. D., Holloway, J.,Weibring, P., Flocke, F., Zheng, W., Toohey, D., Wennberg, P. O.,Wiedinmyer, C., Mauldin, L., Fried, A., Richter, D., Walega, J.,Jimenez, J. L., Adachi, K., Buseck, P. R., Hall, S. R., and Shet-
Atmos. Chem. Phys., 9, 6949–6982, 2009 www.atmos-chem-phys.net/9/6949/2009/

A. Hodzic et al.: Modeling organic aerosols during MILAGRO 6981
ter, R.: Emissions from biomass burning in the Yucatan. Atmos.Chem. Phys., 9, 5785–5812, 2009,http://www.atmos-chem-phys.net/9/5785/2009/.
Yu, X. Y., Cary, R. A., and Laulainen, N. S.: Primary and secondaryorganic carbon downwind of Mexico City, Atmos. Chem. Phys.Discuss., 9, 541–593, 2009,http://www.atmos-chem-phys-discuss.net/9/541/2009/.
Zaveri, R. A., Song, C., Alexander, L., et al.: Unraveling Con-tributions of Urban, Biomass Burning and Secondary OrganicAerosols Near Mexico City During MILAGRO 2006. Eos Trans.AGU, 89(53), Fall Meet. Suppl., Abstract A31B-0085.
Zhang, Y., Liu, P., Queen, A., Misenis, C., Pun, B., Seigneur,C., Wu, and S. Y.: A comprehensive performance evaluationof MM5-CMAQ for the summer 1999 Southern Oxidants Studyepisode. Part II: gas and aerosol predictions Atmos. Environ.,40(26), 4839–4855, 2006.
Zhang, Q., Alfarra, M. R., Worsnop, D. R., Allan, J. D., Coe, H.,Canagaratna, M. R., and Jimenez, J. L.: Deconvolution and quan-tification of hydrocarbon-like and oxygenated organic aerosolsbased on aerosol mass spectrometry. Environmental Science andTechnology, 39, 4938–4952, 2005a.
Zhang, Q., Worsnop, D. R., Canagaratna, M. R., and Jimenez, J.L.: Hydrocarbon-like and Oxygenated Organic Aerosols in Pitts-burgh: Insights into Sources and Processes of Organic Aerosols,Atmos. Chem. Phys., 5, 3289–3311, 2005b,http://www.atmos-chem-phys.net/5/3289/2005/.
Zhang, Q., Canagaratna, M. R., Jayne, J. T., Worsnop, D. R., andJimenez, J. L.: Time and Size-Resolved Chemical Compositionof Submicron Particles in Pittsburgh – Implications for AerosolSources and Processes. J. Geophys. Res. – Atmos. 110, D07S09,doi:10.1029/2004JD004649, 2005c.
Zhang, Q., Jimenez, J. L., Canagaratna, M. R., et al.:Ubiquity and dominance of oxygenated species in or-ganic aerosols in anthropogenically-influenced Northern Hemi-sphere midlatitudes, Geophys. Res. Lett., 34, L13801,doi:10.1029/2007GL029979, 2007.
Zheng, J., Zhang, R., Fortner, E. C., Volkamer, R. M., Molina, L.,Aiken, A. C., Jimenez, J. L., Gaeggeler, K., Dommen, J., Du-santer, S., Stevens, P. S., and Tie, X.: Measurements of HNO3and N2O5 using ion drift-chemical ionization mass spectrometryduring the MILAGRO/MCMA-2006 campaign, Atmos. Chem.Phys., 8, 6823–6838, 2008,http://www.atmos-chem-phys.net/8/6823/2008/.
Zhong, S. Y. and Fast, J.: An evaluation of the MM5, RAMS, andMeso-Eta models at subkilometer resolution using VTMX fieldcampaign data in the Salt Lake Valley, Mon. Weather Rev., 131,1301–1322, 2003.
www.atmos-chem-phys.net/9/6949/2009/ Atmos. Chem. Phys., 9, 6949–6982, 2009
Related Documents