Chemical Engineering Science 60 (2005) 6049 – 6066 www.elsevier.com/locate/ces Modeling of vaporization and cracking of liquid oil injected in a gas–solid riser Subramanya V. Nayak, Saket L. Joshi, Vivek V. Ranade ∗ Industrial Flow Modeling Group, National Chemical Laboratory, Pune 411008, India Received 8 November 2004; accepted 19 April 2005 Available online 8 June 2005 Abstract Vaporization and cracking of liquid oil injected in a gas–solid riser (fluid catalytic cracking riser reactor) was computationally studied in this work. Evaporation of a single drop injected in a stream of gas–solid mixture was analyzed first. A model for simulating evaporation of a drop considering heat transfer from the gas phase as well as from the solid particles was developed. The model relates the evaporation rate of droplet with rate of collisions of solid particles, specific heat capacities of solid and liquid, latent heat of vaporization, relative velocity of gas and liquid and temperatures of three phases. The understanding gained from such a model was then extended to simulate evaporation of liquid drops injected in FCC risers. The Eulerian–Lagrangian approach was used to simulate simultaneous evaporation and cracking reactions occurring in FCC riser reactors. A commercial CFD code, FLUENT (of Fluent Inc., USA) was used. Four and ten lump models were used for simulating cracking reactions. Appropriate user defined functions were developed to implement heterogeneous kinetics and heat transfer models in FLUENT. A special algorithm was developed to calculate accumulated coke on catalyst particles. A boiling point range was considered for simulating realistic oil feedstock. The model was first evaluated by comparing predicted results with published industrial data. The simulations were then carried out to understand influence of key design and operating parameters on performance of FCC riser reactors. The parameters studied included; initial oil droplet distribution, catalyst inlet temperature, catalyst to oil ratio and thermal cracking. The approach, model and results presented here would be useful for optimization of FCC operation, cost to benefit analysis of new FCC nozzles and related decision-making. 2005 Elsevier Ltd. All rights reserved. Keywords: FCC; Riser; Evaporation; Heat transfer; Cracking reactions 1. Introduction Liquid is injected in hot fluidized beds in many industrial applications including coating/agglomeration processes to catalytic reactors like cracking of oil and polymerization of olefins. Droplet size distribution of injected liquid, particle characteristics (solid flux, volume fraction, diameter, heat capacity and density), contact between the particles and the drops and characteristics of fluidizing medium determine the quality of overall process. In this work, we have computa- tionally studied evaporation and cracking of injected liquid ∗ Corresponding author. Tel.: +91 20 2589 3400; fax: +91 20 2589 3260. E-mail address: [email protected] (V.V. Ranade). 0009-2509/$ - see front matter 2005 Elsevier Ltd. All rights reserved. doi:10.1016/j.ces.2005.04.046 in gas–solid risers. Fluid catalytic cracking (FCC) reactor, which is one of the most important examples of liquid in- jection in gas–solid risers, was considered in this work. FCC riser reactor converts heavy hydrocarbon petroleum fractions into a slate of more usable products such as gasoline, middle distillates and light olefins. First commer- cialized over half a century ago, the FCC is still evolving. Improvements in technology as well as changing feedstocks and product requirements continue to drive this evolution. A schematic of FCC unit is shown in Fig. 1. Pre-heated liquid feed mixed is injected through multiple nozzles into the riser reactor, where it comes in contact with hot cata- lyst. Inert steam, which serves as atomizing media, is also introduced in feed-injection zone. The hot catalyst collides with atomized feed droplets and provides the sensible heat

Welcome message from author
This document is posted to help you gain knowledge. Please leave a comment to let me know what you think about it! Share it to your friends and learn new things together.
Transcript
Chemical Engineering Science 60 (2005) 6049–6066
www.elsevier.com/locate/ces
Modeling of vaporization and cracking of liquid oil injected in agas–solid riser
Subramanya V. Nayak, Saket L. Joshi, Vivek V. Ranade∗
Industrial Flow Modeling Group, National Chemical Laboratory, Pune 411008, India
Received 8 November 2004; accepted 19 April 2005Available online 8 June 2005
Abstract
Vaporization and cracking of liquid oil injected in a gas–solid riser (fluid catalytic cracking riser reactor) was computationally studiedin this work. Evaporation of a single drop injected in a stream of gas–solid mixture was analyzed first. A model for simulating evaporationof a drop considering heat transfer from the gas phase as well as from the solid particles was developed. The model relates the evaporationrate of droplet with rate of collisions of solid particles, specific heat capacities of solid and liquid, latent heat of vaporization, relativevelocity of gas and liquid and temperatures of three phases. The understanding gained from such a model was then extended to simulateevaporation of liquid drops injected in FCC risers. The Eulerian–Lagrangian approach was used to simulate simultaneous evaporation andcracking reactions occurring in FCC riser reactors. A commercial CFD code, FLUENT (of Fluent Inc., USA) was used. Four and tenlump models were used for simulating cracking reactions. Appropriate user defined functions were developed to implement heterogeneouskinetics and heat transfer models in FLUENT. A special algorithm was developed to calculate accumulated coke on catalyst particles. Aboiling point range was considered for simulating realistic oil feedstock. The model was first evaluated by comparing predicted resultswith published industrial data. The simulations were then carried out to understand influence of key design and operating parameters onperformance of FCC riser reactors. The parameters studied included; initial oil droplet distribution, catalyst inlet temperature, catalyst tooil ratio and thermal cracking. The approach, model and results presented here would be useful for optimization of FCC operation, costto benefit analysis of new FCC nozzles and related decision-making.� 2005 Elsevier Ltd. All rights reserved.
Keywords:FCC; Riser; Evaporation; Heat transfer; Cracking reactions
1. Introduction
Liquid is injected in hot fluidized beds in many industrialapplications including coating/agglomeration processes tocatalytic reactors like cracking of oil and polymerization ofolefins. Droplet size distribution of injected liquid, particlecharacteristics (solid flux, volume fraction, diameter, heatcapacity and density), contact between the particles and thedrops and characteristics of fluidizing medium determine thequality of overall process. In this work, we have computa-tionally studied evaporation and cracking of injected liquid
∗ Corresponding author. Tel.: +91 20 2589 3400; fax: +91 20 2589 3260.E-mail address:[email protected](V.V. Ranade).
0009-2509/$ - see front matter� 2005 Elsevier Ltd. All rights reserved.doi:10.1016/j.ces.2005.04.046
in gas–solid risers. Fluid catalytic cracking (FCC) reactor,which is one of the most important examples of liquid in-jection in gas–solid risers, was considered in this work.
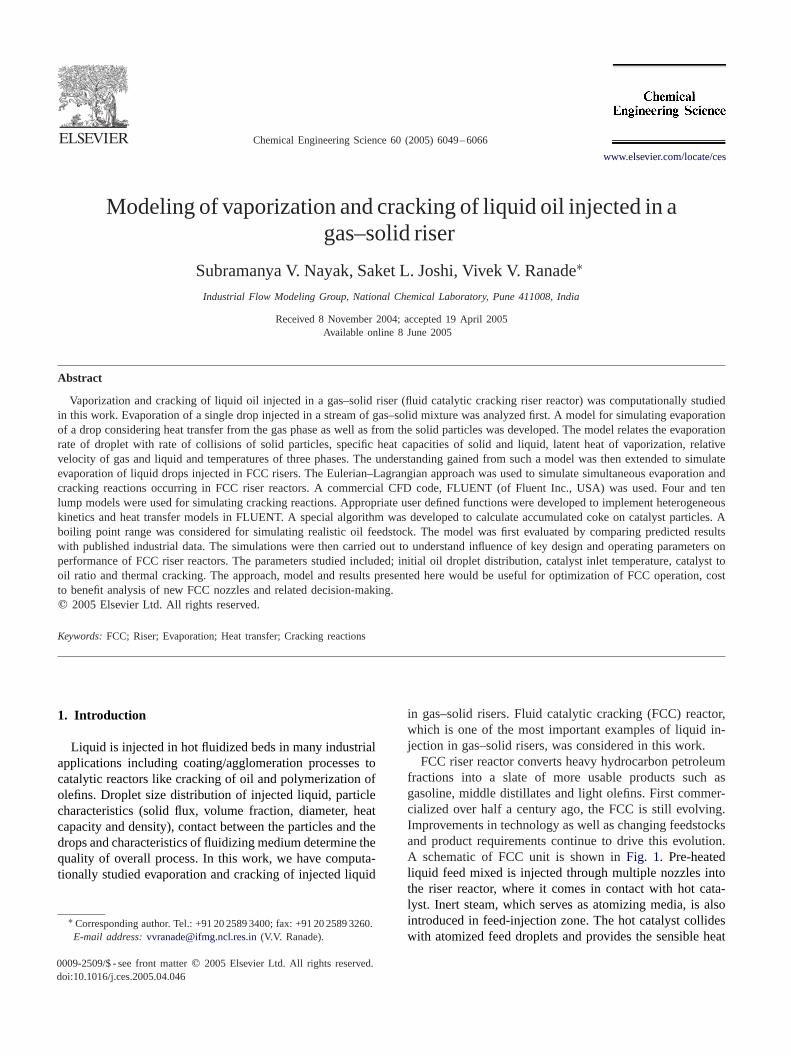
FCC riser reactor converts heavy hydrocarbon petroleumfractions into a slate of more usable products such asgasoline, middle distillates and light olefins. First commer-cialized over half a century ago, the FCC is still evolving.Improvements in technology as well as changing feedstocksand product requirements continue to drive this evolution.A schematic of FCC unit is shown inFig. 1. Pre-heatedliquid feed mixed is injected through multiple nozzles intothe riser reactor, where it comes in contact with hot cata-lyst. Inert steam, which serves as atomizing media, is alsointroduced in feed-injection zone. The hot catalyst collideswith atomized feed droplets and provides the sensible heat
6050 S.V. Nayak et al. / Chemical Engineering Science 60 (2005) 6049–6066
Reactor
Riser
Products to Fractionator
Spent Gases
Air
Feed
Steam
Regenerated Catalyst
Spent Catalyst
Regenerator
Fig. 1. Schematic diagram of a typical fluid catalytic cracking unit(FCCU).
and heat of vaporization to the feed droplets. The increasedamount of vapor due to vaporization of feed followed by gasphase cracking reactions, including atomizing steam causesthe velocity of the flowing mixture to increase and suspen-sion density to decrease. Partial vaporization of feed causesthree phase flow of solid catalyst, hydrocarbon liquid, hy-drocarbon vapor and steam, which approximately accountsfor 3–4 m of riser height depending on feed droplet diam-eter. After complete vaporization of hydrocarbon feed two-phase flow of solid catalyst, hydrocarbon vapor and steamis encountered in riser reactor (Gao et al., 2001). The en-dothermic catalytic cracking reactions are completed in shortcontact time, where the catalyst is pneumatically conveyedby the hydrocarbon vapor from the bottom to the top of avertical riser.
With today’s high-activity FCC catalysts, majority of thecracking and catalyst coking occur in the vicinity of the feedinjection zone. As the need to crack more and heavier hy-drocarbon at ever-shorter contact times grows, oil dropletvaporization may become rate limiting in FCC riser reactor.The feed-injection zone, in which the atomized feedstockis mixed with the hot catalyst and the accelerating steam,
is therefore one of the most important regions of the FCCriser reactor. The main purpose of the feed-injection zone isto ensure fast vaporization of feedstock. Slow vaporizationleads to a very high catalyst to vaporized feed ratio coupledwith high catalytic activity and temperature in the riser entryzone. These factors can lead to undesirable secondary crack-ing reactions, pyrolysis and may accelerate coke formation.
Faster vaporization rates can be realized by effectivefeed atomization into fine drops. Most of the new develop-ments related to feed injection systems therefore have theirprimary objective as atomization of feed into very smalldrops. Improvements in conversions and yield patterns, dueto replacement of feed injection system of older designs bynewer ones, have been reported (for example, seeHackerand Thiart, 2002). A computational model that accountsfor these factors affecting the vaporization and cracking offeed in FCC riser reactors is needed to facilitate and speedup the development of new and/or upgrade feed injectionsystems in FCC reactors. Previous work on evaporation andcracking is briefly reviewed in the following section.
1.1. Brief review of previous work
Heat transfer from evaporating drops in flowing gasstream has been extensively studied. The correlationsproposed byRanz and Marshall (1952)for homogenous(gas–liquid) system has accordance with the experimentalfindings. It is expected that the presence of hot solid par-ticles in gas stream will enhance heat transfer coefficient.Though influence of solid particles on heat transfer fromtubes is extensively studied (Block and Molerus, 1983;Beedy and Potter, 1984), relatively few studies on influenceof solid particles on evaporating drops are available. Someof these studies are discussed in the following paragraphs.
Buchanan (1994)analyzed the model of heating and va-porization of feed droplet based on following hypothesis;direct contact, convective heat transfer and radiative heattransfer. The model based on direct contact hypothesis canbe used to estimate enhanced heat transfer coefficient byassuming infinitely fast heat transfer during droplet/particlecollisions. This means that solid particle colliding with thedrop leaves the drop after attaining thermal equilibrium. Thismodel predicted order of magnitude faster evaporation rates.Mirgain et al. (2000)used the concept but distinguishedthree different types of collisions. The first particle to be hitby the droplet gets covered with liquid. This particle thencontacts another particle and the collision may result in oneof three alternate processes:
• This particle sticks to the new fresh particle, resulting insmall agglomerate. This type of collision is referred to asimpact with adhesion.
• The liquid is shared between the two particles, resulting intwo particles covered with a fraction of the initial liquid.This type of collision is referred to as impact with sharing.
S.V. Nayak et al. / Chemical Engineering Science 60 (2005) 6049–6066 6051
• The liquid is entirely transferred to the new particle. Thistype of collision is referred to as impact with transfer.
Mirgain et al. (2000)applied the approach ofBuchanan(1994). The vaporization time was then estimated from thetime needed for the liquid to impact enough particles. Insome cases, a complete vaporization could not be achievedbefore a large number of impacts occurred. This was partic-ularly true for larger droplets. This emphasized the fact thatdroplet diameter is an important parameter for vaporization.
Buchanan (1994)also considered convective heat transferthrough a gas layer between the drop and the particles (‘Lei-denfrost effect’). This approach was similar to the homoge-neous case but was corrected to take into account the factthat the thermal boundary layer through which heat trans-fer occurs is affected by the presence of the particles. Heproposed to use the empirical correlation (see Eq. (1)) witha value of Reynolds number calculated based on effectivedensity of gas–solid mixture to estimate heat transfer coef-ficient in presence of solid particles.
Nu = 2 + 0.6Re0.5eff Pr1/3)(
1 + Cp∞(T∞ − TD)
�vaporization
)0.7, (1)
whereReeff is effective Reynolds number calculated basedon the effective density of gas and solid. The proposed cor-relation however did not consider the key parameters likeparticle specific heat, particle diameter and particle temper-ature, which may have considerable influence on heat trans-fer coefficient of the particles and the droplet. Further workon understanding influence of solid particles on heat transfercoefficient from evaporating drops is therefore needed.
Numerous articles are found on catalytic cracking reac-tion in the published literature. Most of them are based onrepresentation of oil in few lumps (like 4 lump, 10 lump,14 lump and so on).Weekman and Nace (1970)were firstto develop a three-lump cracking model to study gasolineproduction of a FCC unit; the three lumps considered weregas oil, gasoline and light gases plus coke lumps. The sub-sequent study conducted byFarag (1993)showed the needto consider light gases and coke as separate lumps, there-fore considering a four lump model.Jacob et al. (1976)de-veloped a more detailed ten-lump kinetic model taking intoaccount different feed properties in addition to boiling pointrange. All these models considered isothermal plug flow inthe riser reactor.Pitault et al. (1994)proposed kinetic modelbased on a molecular approach and the kinetic model wasbuilt from experiments with a small fixed bed reactor (themicro activity test). In the present work, we have consid-ered two of the most widely used cracking models namelythe four-lump model ofFarag et al. (1994)and the ten-lumpmodel ofJacob et al. (1976).
Gas–solid flow through vertical riser with high solids flux(∼ 400 kg/m2 s) used in practice is a subject of intense in-vestigation over the last few decades (seeRanade, 2002for
an overview). When a gas vertical riser transports the parti-cle, experimental studies have shown that they are distributednon-uniformly all over the cross-section of the riser (see forexample,Horio and Kuroki (1994)). In the last decade, withthe advancement of computational techniques and computerhardware, computational fluid dynamics (CFD) is beingincreasingly used to simulate gas–solid flows in verticalrisers. Most of the research groups used Eulerian–Eulerianapproach where the dispersed solid particles are treated asinterpenetrating continuum (see for example,Das et al.,2004; Theologos and Markatos, 1993). The kinetic theoryof the granular flow is used to simulate gas–solid flow inriser for different particle size and /or particle density (forexample,Mathesian et al., 2000; Van Wachem et al., 2001;Neri and Gidaspow, 2000). However, the detailed compari-son of predicted results with experimental data at high solidsflux (Ranade, 2002) revealed severe inadequacies of thesemodels to simulate complex gas–solid flows. Apart fromdifficulties in accurate simulations of gas–solid flows, evap-oration of injected oil droplets (which boil over a range oftemperature) and subsequent cracking and coke formationreactions in Eulerian–Eulerian framework is extremely dif-ficult. In Eulerian–Lagrangian approach, each particle istreated by solving Lagrangian equation of motion for allthe particles of the system with a prescribed set of initialconditions. It offers more natural way to simulate complexparticle level processes like evaporation and cracking reac-tions. Heat and mass transfer and chemical reactions oc-curring at the individual particle scale can be convenientlyaccounted. The approach also provides the particle historystarting from injection into flow field. The approach how-ever requires significantly more computational resourcesand therefore rarely used for dense gas–solid risers.
Momentum transfer, heat transfer, catalytic cracking re-action and droplet vaporization are interrelated and occursimultaneously in commercial FCC riser reactor. To predictaccurate behavior of the riser reactor all these processes needto be modeled.Theologos et al. (1999)extended their CFDmodel to account for feed atomization effects on overall re-actor performance. They assumed feed spray vaporizationoccurs in single-phase, gas-phase and only modified the heattransfer coefficient of gas-phase.Gao et al. (2001)showedthe synergetic effects of the hydrodynamics, heat transferand droplet size on the overall conversion of the FCC riserreactor. They assumed simplifiedd2 law for droplet vapor-ization without considering the influence of solid particleson heat transfer.Gupta and Subba Rao (2003)have usedan empirical correlation to account for influence of solidson droplet evaporation rates in their model. However; theirmodel is not applicable for oil, which boils over a range oftemperatures rather than a specific value of boiling point.Berry et al. (2004)developed a two-dimensional adiabaticmodel for FCC riser. The model combines a predictive riserhydrodynamic model with a four lump kinetic model. How-ever, the model uses empirical correlation (ofBuchanan,1994) for estimating the heat transfer coefficient for droplet
6052 S.V. Nayak et al. / Chemical Engineering Science 60 (2005) 6049–6066
vaporization which does not include influence of key pa-rameters like solid heat capacity, particle diameter and soon. The model also considered a single value for the heatof reaction and a specific boiling point for the gas oil andis therefore of limited applicability. The model predictionswere matched with the plant data by adjusting the value ofactivation energy. This brief review of published informationon different aspects of FCC riser reactor clearly indicatesthe need for further work. The scope and the contributionsof the present work are discussed in the following.
1.2. Present contribution
In the present work, three-dimensional adiabatic model ofFCC riser reactor is developed which takes into account hy-drodynamics, evaporation of liquid oil injected in gas–solidflow and endothermic catalytic cracking reactions. The em-phasis was not on developing accurate flow model but wason developing a framework to simultaneously simulate flow,evaporation and reactions in riser reactor. In this work, there-fore, scope was restricted to use the framework to carry outone-dimensional simulations of FCC riser reactor. Evapo-ration of a single drop injected in a stream of gas–solidmixture was analyzed first. The understanding gained fromsuch a model was then extended to simulate evaporation ofthe multi-component liquid drops, which boil over a rangeof temperature. Multi-layer modeling approach was used toencompass all the complex parameters encountered in FCCriser reactor. The heat transfer, evaporation and kinetic mod-els were incorporated in a commercial CFD code FLUENT(of Fluent Inc., USA), using user-defined functions. A spe-cial algorithm was developed to calculate accumulated cokeon catalyst particles. The model was capable of estimatingthe effect of the droplet size, catalyst to oil (CTO) ratio,catalyst inlet temperature and pyrolysis on conversion andyield profiles as the function of riser height.
2. Computational model
In the present work, a typical FCC riser reactor was con-sidered where the hot solid catalyst particles and oil dropletswere injected at the bottom. Steam was used as a fluidiz-ing medium. The hot catalyst particles transfer energy togas and liquid phases. To mimic the behavior of oil, the liq-uid was considered as boiling over a range of temperature(560–700 K) rather than at a specific boiling point. It wasassumed that the cracking reactions take place only in thegas phase. The cracking reactions were modeled using thefour lump and the ten lump kinetic models. With the four-lump kinetic model the liquid feed was assumed to con-tain pure vacuum gas oil (VGO). When the ten-lump ki-netic model was used, it was assumed that the liquid feedcontained five components and each component vaporizesaccording to their corresponding boiling point cuts startingwith the most volatile component to vaporize first. The de-
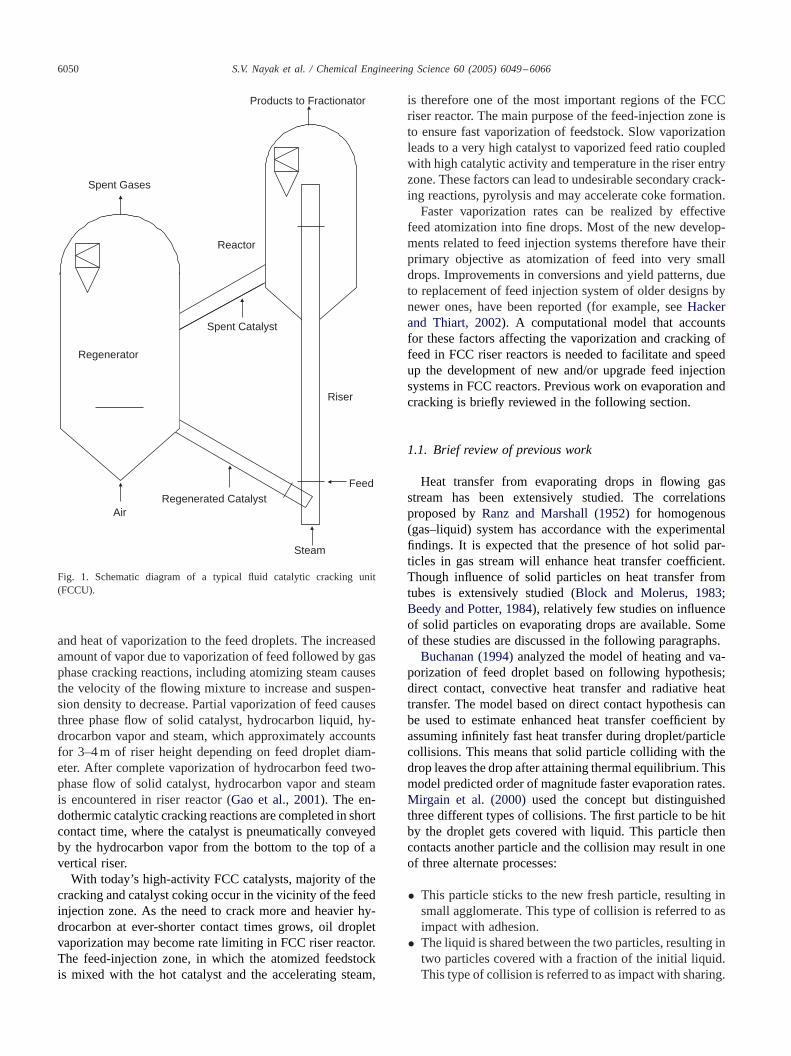
Drop, Solid
Particle, T1
Vapor Generated due to Contact Heat Transfer
T
Fig. 2. Schematic of contact heat transfer between a hot solid particleand a liquid drop.
tails of computational models for evaporation of oil drops ingas–solid flow, cracking reactions and flow gas–solid–liquidwith heat transfer and reactions using Eulerian–Lagrangianapproach are discussed in the following section.
2.1. Heat transfer from solid particles to liquid drops
Heat transfer to oil drop suspended in a gas–solid mixtureneeds to be modeled to understand influence of key param-eters like drop diameter, particle diameter, specific heat ofsolids and solid holdup on evaporation rates. The collisionsof solid particles with liquid drop are expected to signifi-cantly influence the heat transfer to liquid drops. When asolid particle of temperatureTS collides with a liquid dropof temperatureT , solid particle transfers energy to liquidphase. If the heat transfer is infinitely fast, the solid particlewould attain temperature of liquid (if particle diameter ismuch smaller than that of liquid drop). Considering the situ-ation in a FCC riser, where solid particles are at much highertemperature than boiling point of liquid, it is more likelythat the vapors generated due to heat transfer from solidparticle will push the particle away from the drop and thusaborting the heat transfer from solid particle to liquid drop.The process is shown schematically inFig. 2. If the solidparticle is pushed away immediately, that is contact time isvirtually zero, the net heat transfer will be zero and parti-cle temperature will remain atTS . If particle is not pushedaway at all, the particle will attain temperature of liquid. Atany intermediate case, solid particle will be pushed awaywith an intermediate temperature betweenTS and T . Ac-tual physics of contacting of hot solids with volatile liquiddrops is quite complex. Experimental information on colli-sions of hot solid particles and evaporating liquid drops isnot adequate to develop phenomenological model to repre-sent a repelling process of solid particles from liquid dropdue to vapor generation. In absence of such information, wedevelop a phenomenological model by hypothesizing thatwhen adequate amount of vapor is generated due to con-tacting with hot solid particle, the particle will be pushedback. Before solid particle is pushed back, it transfers someamount of energy to liquid drop (which is used to generatevapors) and attains a temperatureT1 which is lower thanoriginal solid temperatureTS . The energy balance over the
S.V. Nayak et al. / Chemical Engineering Science 60 (2005) 6049–6066 6053
process is represented by the following equation:
�6D3S�SCpS (TS − T1) = �
�6D3S�∞�. (2)
The left-hand side of Eq. (2) signifies heat lost by the solidparticle to liquid phase before it is pushed back due to gen-erated vapors. During this contact, solid particle is assumedto attain temperatureT1. Solid particle is assumed to getpushed back when vapor of volume� times the particle vol-ume are generated. As a first approximation, the energy lostby the solid particle can be equated to the energy required togenerate vapor of volume� times the particle volume (rep-resented by right-hand side of Eq. (2)). Thus, the tempera-ture of solid particle,T1, may be calculated as a function of� (an empirical parameter defined as a ratio of volume ofvapor needed to push back solid particle to volume of solidparticle) as
T1 = TS −(
�∞���SCpS
), (3)
whereD, � andCp are diameter, density and heat capacity.The subscriptS indicates solid particles.� is latent heat ofvaporization of liquid. The lower limit ofT1 is of course, theliquid temperature,T . If liquid droplet is small, and is notable to generate vapors adequate to push back solids despitecomplete evaporation would impose additional limit onT1.
Heat transfer per collision is given as
HeatTransfer/Collision= �6D3S�SCpS (TS − T1) (4)
or
HeatTransfer/Collision= ��6D3S�∞�. (5)
The rate of collisions of solid particles and liquid drops perunit volume may be estimated as
Collisions/m3 s= UslipS−DnDnS�4(DD + DS)
2, (6)
wherenD andnS are number of drops and solid particlesper unit volume.UslipS−D is the slip velocity between solidparticle and liquid drop (difference between local velocitiesof solid phase and liquid phase). The calculation of localvelocity field for gas, liquid and solid phases is discussedlater (Section 2.3).
Rewriting nD and nS in terms of volume fractions,Eq. (6) becomes
Collisions/m3s= UslipS−D
(�S
�D3S/6
)(�D
�D3D/6
)
× �4(DD + DS)
2. (7)
Overall heat transfer from solids to liquid may be estimatedas a product of number of collisions per unit time and energytransferred per collision as
Q = 3��∞�UslipS−D�S�D2DD
(1 + DS
DD
)2
, (8)
whereQ(J/m3 s) is overall heat transfer. Equating energytransferred via collisions to product of effective heat transfercoefficient, surface area of drops and temperature differencebetween solid and liquid, one can write an expression foreffective heat transfer coefficient as
heffective= ��UslipS−D�S�∞4(TS − TD)
(1 +
(DS
DD
))2
. (9)
Thus the overall heat transfer becomes
Q = heffective6�DDD
(TS − TD). (10)
As mentioned earlier, the factor� has two limiting values.The lower bound is zero, which is indicative of zero contacttime between solid particles and drop and no heat transfer.The upper bound on� is
� = �D�∞
(DD
DS
)3
. (11)
This signifies complete evaporation of a liquid drop as aresult of collision with solid particle. Such a case can existwhen the drop size becomes very small.
Collision of solid particle with a liquid drop will also af-fect gas–liquid mass transfer. In this work, it was assumedthat the collision of solid particle causes release of vaporscorresponding to heat transferred via collision. The addi-tional mass transfer due to collisions of solid particles cantherefore be written as
NAiKsolids = heffective(TS − TD)
�, (12)
whereNAiKsolids is the rate of droplet evaporation per unitsurface area of the droplet.
2.2. Cracking reactions
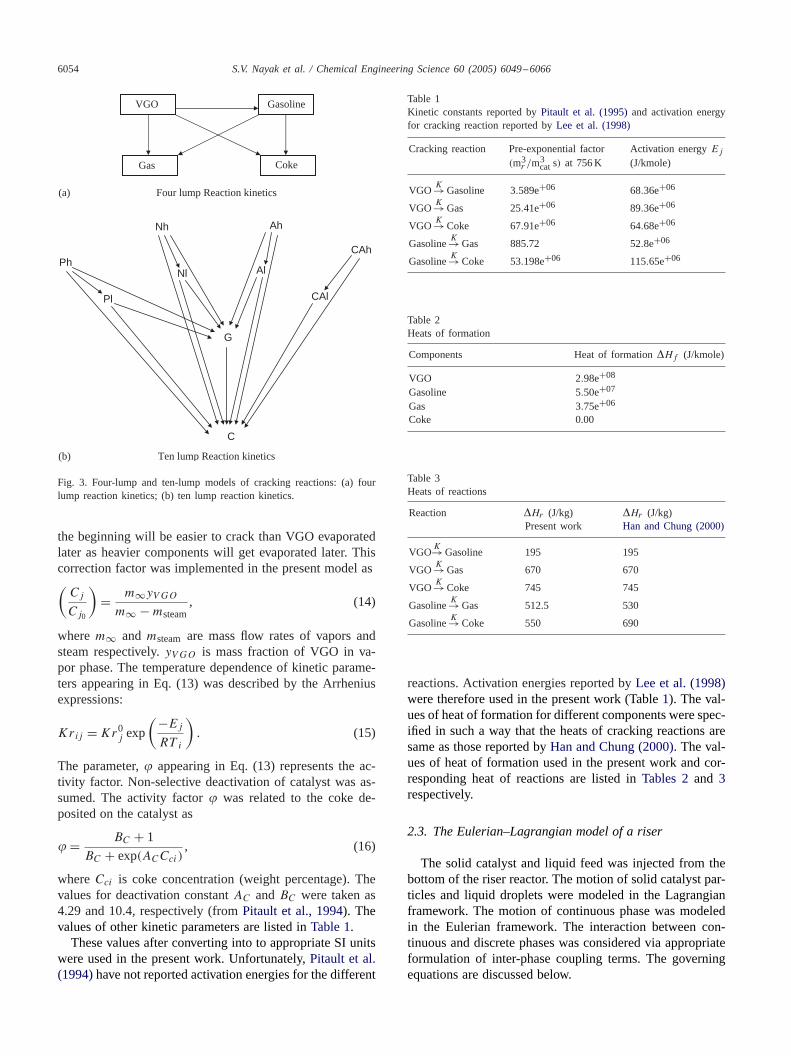
Four-lump and ten-lump reaction kinetic models wereconsidered in the present work to represent gas phase cat-alytic cracking reactions. The reaction schemes for thesekinetic models are shown inFig. 3. Here we discuss theframework with the four-lump kinetic model. The details often-lump kinetic model are discussed in Appendix A. Thefour lumps are: VGO (feedstock), gasoline, gas and coke.VGO is cracked to gasoline, gas and coke. The rate of con-sumption of reactantj per unit catalyst volume can be ex-pressed as (Pachovsky and Wojciechowski, 1971):
−rj = Krij
(Cj
Cj0
)nCj��S , (13)
whereCj is concentration of componentj andCj0 is initialconcentration of pure componentj . The value ofn is 1 forVGO cracking, andn = 0 for all other reactions. Eq. (13)can be used to formulate the rates of production individuallumps (in kg/s) per unit of reactor volume in the ‘ith’ cell.The value ofn=1 for VGO implies that VGO evaporated at
6054 S.V. Nayak et al. / Chemical Engineering Science 60 (2005) 6049–6066
Four lump Reaction kinetics
Ten lump Reaction kinetics
VGO
Gas
Gasoline
Coke
C
Ph
Pl
G
Nh
Nl
Ah
Al
CAh
CAl
(a)
(b)
Fig. 3. Four-lump and ten-lump models of cracking reactions: (a) fourlump reaction kinetics; (b) ten lump reaction kinetics.
the beginning will be easier to crack than VGO evaporatedlater as heavier components will get evaporated later. Thiscorrection factor was implemented in the present model as(Cj
Cj0
)= m∞yVGO
m∞ − msteam, (14)
wherem∞ andmsteam are mass flow rates of vapors andsteam respectively.yVGO is mass fraction of VGO in va-por phase. The temperature dependence of kinetic parame-ters appearing in Eq. (13) was described by the Arrheniusexpressions:
Krij = Kr0j exp
(−Ej
RT i
). (15)
The parameter,� appearing in Eq. (13) represents the ac-tivity factor. Non-selective deactivation of catalyst was as-sumed. The activity factor� was related to the coke de-posited on the catalyst as
� = BC + 1
BC + exp(ACCci), (16)
whereCci is coke concentration (weight percentage). Thevalues for deactivation constantAC andBC were taken as4.29 and 10.4, respectively (fromPitault et al., 1994). Thevalues of other kinetic parameters are listed inTable 1.
These values after converting into to appropriate SI unitswere used in the present work. Unfortunately,Pitault et al.(1994)have not reported activation energies for the different
Table 1Kinetic constants reported byPitault et al. (1995)and activation energyfor cracking reaction reported byLee et al. (1998)
Cracking reaction Pre-exponential factor Activation energyEj
(m3r /m
3cats) at 756 K (J/kmole)
VGOK→ Gasoline 3.589e+06 68.36e+06
VGOK→ Gas 25.41e+06 89.36e+06
VGOK→ Coke 67.91e+06 64.68e+06
GasolineK→ Gas 885.72 52.8e+06
GasolineK→ Coke 53.198e+06 115.65e+06
Table 2Heats of formation
Components Heat of formation�Hf (J/kmole)
VGO 2.98e+08
Gasoline 5.50e+07
Gas 3.75e+06
Coke 0.00
Table 3Heats of reactions
Reaction �Hr (J/kg) �Hr (J/kg)Present work Han and Chung (2000)
VGOK→ Gasoline 195 195
VGOK→ Gas 670 670
VGOK→ Coke 745 745
GasolineK→ Gas 512.5 530
GasolineK→ Coke 550 690
reactions. Activation energies reported byLee et al. (1998)were therefore used in the present work (Table1). The val-ues of heat of formation for different components were spec-ified in such a way that the heats of cracking reactions aresame as those reported byHan and Chung (2000). The val-ues of heat of formation used in the present work and cor-responding heat of reactions are listed inTables 2and 3respectively.
2.3. The Eulerian–Lagrangian model of a riser
The solid catalyst and liquid feed was injected from thebottom of the riser reactor. The motion of solid catalyst par-ticles and liquid droplets were modeled in the Lagrangianframework. The motion of continuous phase was modeledin the Eulerian framework. The interaction between con-tinuous and discrete phases was considered via appropriateformulation of inter-phase coupling terms. The governingequations are discussed below.
S.V. Nayak et al. / Chemical Engineering Science 60 (2005) 6049–6066 6055
The volume averaged momentum, mass and energy bal-ance equations for the continuous phase were written as
�(�C�C)�t
+ ∇ · (�C�CUC) = SC , (17)
�(�C�CUC)
�t+ ∇ · (�C�CUCUC)
= −�C∇p − ∇ · (�C�C) + �C�Cg + SCm, (18)
�(�C�ChC)�t
+ ∇ · (�C�CUChC)
= −∇ · (�CqC) + SCh, (19)
where,SC, SCm andSCh are the mass, momentum and en-thalpy sources representing the exchange between dispersedphase particles, (FCC catalyst and liquid feed) and contin-uous phase, (gas phase) as well as any sources due to volu-metric reaction occurring in the continuous phase. In addi-tion to these, individual species conservation equation waswritten as:
�(�C�Cmi)
�t+ ∇ · (�C�CUCmi) = SCi , (20)
where,SCi is the mass source for the speciesi andmi isthe mass fraction of speciesi in the continuous phase. Thedetails of volumetric reactions and heat and mass transferbetween dispersed and continuous phase are discussed later.
The motion of catalyst particles and injected liquid dropswas simulated by solving equations of motion of individ-ual dispersed phase particles. The general force balanceover a single dispersed phase particle may be written as(Ranade, 2002):
mP
dUP
dt= FP + FD + FVM + FL + FH + FG. (21)
HeremP andUP represent mass flow rate and velocity vec-tor of the particle, respectively. The right-hand side repre-sents the total force acting on the dispersed phase particle.The sum of force due to continuous phase pressure gradient,FP , and due to gravity,FG, can be written as
FP + FG = VP∇p − �P VP g, (22)
wherep is pressure in the continuous phase andVP is vol-ume of the particle.
The drag force,FD, can be written as
FD = −�8CD�CD
2P |UP − UC |(UP − UC), (23)
where subscriptC denotes continuous phase andP denotesthe particulate phase. In the present work, the followingcorrelation proposed by Morsi and Alexander (1972) wasused for estimating drag coefficient:
CD = A
Rep+ B
Re2p+ C. (24)
Table 4Constants of Morsi and Alexander correlation of drag coefficient
Res A B C
0–0.1 24 0 00.1–1 22.73 0.0903 3.69<10 29.2 −3.9 1.222<100 46.5 −116.7 0.6167<1000 98.3 −2778 0.3644
ConstantsA,B and C for different Rep are given inTable 4. Rep is the particle Reynolds number defined as
Rep = �CDP |UP − UC |C
(25)
|UP −UC | is resultant slip velocity between the particulateand the continuous phase. Local velocities of dispersed andcontinuous phase were obtained by solving momentum bal-ance equations listed previously. In this work, the remainingthree forces acting on dispersed phase particles namely liftforce; virtual mass force and Basset history force were notconsidered due to their relatively small magnitude comparedto the drag force term.
Once the velocity field is calculated from the force bal-ances discussed above, the trajectories of all the particlescan be calculated by solving:
dxidt
= UPi . (26)
The overall solution procedure is discussed in Section 2.3.2.
2.3.1. Heat and mass transfer modelsThree models corresponding to following three different
heat and mass transfer regimes between dispersed and con-tinuous phase were considered:
• Inert heating;• Vaporization model;• Boiling model.
2.3.1.1. Inert heating. For the liquid droplet when its tem-perature is less than the vaporization temperatureTvap of thedroplet and/or when all the volatile mass of the drop is evap-orated, the inert heating was considered. These conditionsmay be written as
TD <Tvap, (27)
mD�(1 − fv0)mD0, (28)
whereTD is the droplet temperature,mD0 is the initial massof the particle,mD is its current mass andfv0, is massfraction of the volatile components. When these conditionswere satisfied, the following heat balance equation was usedto relate the droplet temperature,TD(t), to the convective
6056 S.V. Nayak et al. / Chemical Engineering Science 60 (2005) 6049–6066
heat transfer:
mDCPD
dTDdt
= hAD(T∞ − TD), (29)
whereh is heat transfer coefficients, which was calculatedas (see Section 2.1):
Nu = hDD
K∞= 2 + 0.6Re1/2D Pr1/3 +
(��S�Pr
4CP (T∞ − TD)
×[ReD − ReS
DD
DS
] [1 + DS
DD
]2)
. (30)
In case of solid particles, only inert heating model was con-sidered and heat transfer coefficient appearing in Eq. (29)was calculated using the correlation ofRanz and Marshall(1952)as
Nu = hDS
K∞= 2 + 0.6Re1/2S Pr1/3. (31)
2.3.1.2. Vaporization from the drop.When evaporation ofliquid initiates, it is essential to consider the mass transferas well as the heat transfer from the droplet surface. Thisregime of droplet heating was initiated when the temperatureof the droplet reaches the vaporization temperature,Tvap andcontinues until droplet reaches the boiling point,Tbp, or untilthe droplet’s volatile fraction is completely consumed:
TD <Tbp, (32)
mD > (1 − fv0)mD0. (33)
Mass Transfer: The rate of vaporization was modeled byrelating the flux of droplet vapor into the gas phase to thegradient of the vapor concentration between the droplet sur-face and the bulk gas as
Ni = kc(Ci,s − Ci,∞). (34)
The concentration of vapor at the droplet surface is evaluatedby assuming that the partial pressure of vapor at the interfaceis equal to the saturated vapor pressure,Psat, at the particledroplet temperature,TD:
Ci,s = Psat(TD)
RT D
, (35)
whereR is the universal gas constant. The value of satu-rated vapor pressurePsat was calculated using the followingequation:
lnPsat= f (Tbp) − A
TD. (36)
In the present work, the value ofA was set to 3676.2412.The concentration of vapor in the bulk gas is known fromsolution of the transport equation for speciesi:
Ci,∞ = Xi
Pop
RT∞, (37)
whereXi is local bulk mole fraction of speciesi, Pop is theoperating pressure andT∞ is the local bulk temperature in
the gas. The mass transfer coefficient,kc, in Eq. (34) wascalculated from a correlation proposed by Ranz and Marshall(1952):
Sh = kcDD
Di,m
= 2.0 + 0.6Re1/2D Sc1/3, (38)
whereDi,m is diffusion coefficient of the vapor in the bulk,Sc is the Schmidt number andDD is droplet diameter.
The vapor flux in Eq. (34) becomes a source of speciesi
in the gas phase species transport equation. The mass of thedroplet is reduced to:
mD(t + �t) = mD(t) − NiADMi�t , (39)
whereMi is molecular weight of speciesi andmD mass ofthe droplet.Heat Transfer: The droplet temperature was updated ac-
cording to a heat balance that relates the sensible heat changein the droplet to the convective and latent heat transfer be-tween the droplet and the gas:
mDCPD
dTDdt
= hAD(T∞ − TD) + dmD
dt�. (40)
The heat transfer coefficient was calculated using Eq. (30).Eqs. (39) and (40) were solved using FLUENT.
2.3.1.3. Boiling from the drop. This phase was initiatedwhen the temperature of the droplet has reached the boilingtemperature,Tbp, and while the mass of the droplet exceedsthe non-volatile fraction, (1− fv0):
TD�Tbp, (41)
mD�(1 − fv0)mD0. (42)
When the droplet temperature reaches the boiling point, theevaporation model discussed in Section 2.1 was used toconsider the effect of solid presence on droplet size reduc-tion. Eq. (43) was used to simulate the change of dropletdiameter:
dDD
dt= 4K∞
�DCp∞DD
(1 + Nueff
2+ Re1/2D
)
× ln
[1 + Cp∞(T∞ − TD)
�
], (43)
where
Nueff =(
�∈S�Pr4Cp∞(T∞ − TD)
[ReD − ReS
DD
DS
]
×[1 + DD
DS
]2)
. (44)
The droplet was assumed to stay at the corresponding boilingtemperature while the boiling mode was active. The energyrequired for vaporization appears as a sink term in the energyequation for the gas phase. The evaporated species entersthe gas phase as speciesi.
S.V. Nayak et al. / Chemical Engineering Science 60 (2005) 6049–6066 6057
These models were implemented in version 6.1.18 ofFLUENT (of Fluent Inc., USA) using user defined routines.Some of the results are discussed in the following after de-scribing issues related to coupling of dispersed and contin-uous phases.
2.3.2. Coupling between the dispersed and the continuousphases
It is necessary to model the two-way coupling between thecontinuous and the dispersed phase. Such coupling occursthrough volume fraction,�C , and exchange source terms,SC , SCm andSCh. These sources can be computed by sum-ming up the changes in momentum (or enthalpy or mass) ofa particle as it passes through the control volume for contin-uous phase, over all the particles passing through that con-trol volume. For such coupled system, it was necessary tosolve the governing equations of dispersed and continuousphase iteratively till one gets the converged solution. Whilecalculating particle trajectories, the solver keeps track of theheat, mass and momentum gained or lost by each particles.The cumulative influence of these particles moving throughcontinuous phase is then incorporated in subsequent solu-tion of continuous phase governing equations. The overallprocedure followed in the present work was:
1. The continuous phase flow field was solved in absenceof the dispersed phases.
2. The dispersed phases were introduced and trajectories ofdispersed phase particles were simulated.
3. The continuous phase flow was recalculated using theinter-phase exchange of momentum, heat and mass de-termined from previous particle trajectory calculations.
4. The dispersed phase trajectories were recalculated usingmodified continuous phase flow field.
5. The previous two steps were repeated until a convergedsolution was achieved.
For more details of solution procedure, reader is referred toRanade (2002)and FLUENT user manuals.
3. Results and discussion
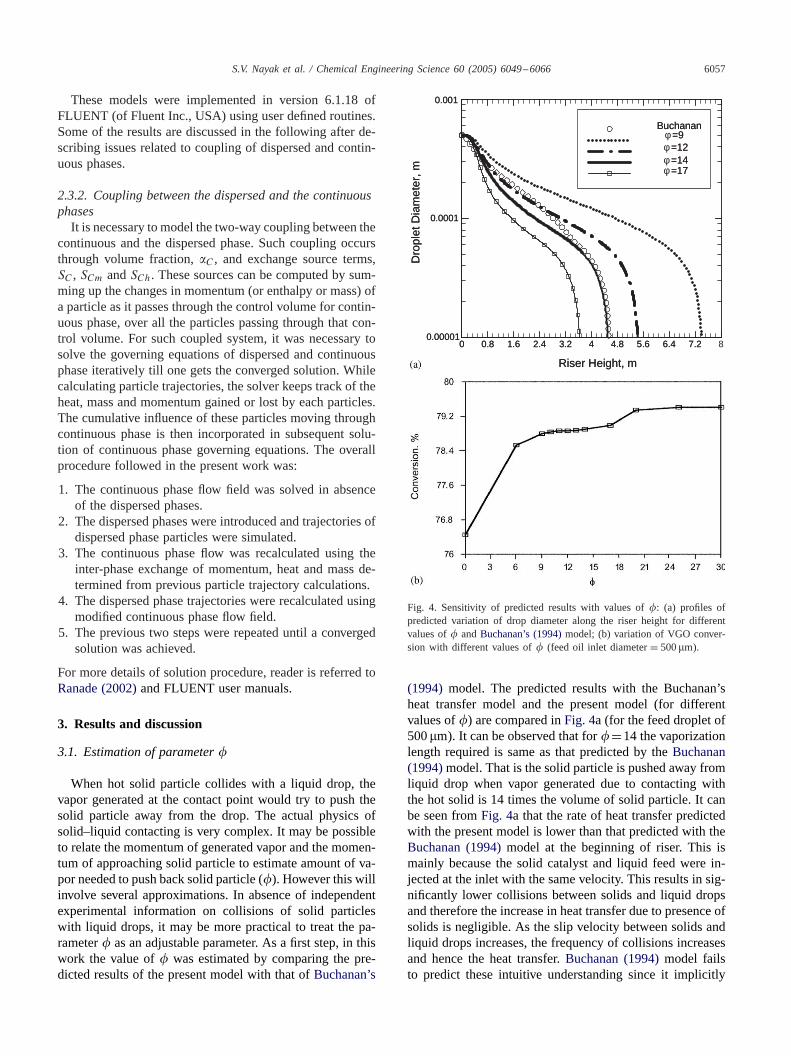
3.1. Estimation of parameter�
When hot solid particle collides with a liquid drop, thevapor generated at the contact point would try to push thesolid particle away from the drop. The actual physics ofsolid–liquid contacting is very complex. It may be possibleto relate the momentum of generated vapor and the momen-tum of approaching solid particle to estimate amount of va-por needed to push back solid particle (�). However this willinvolve several approximations. In absence of independentexperimental information on collisions of solid particleswith liquid drops, it may be more practical to treat the pa-rameter� as an adjustable parameter. As a first step, in thiswork the value of� was estimated by comparing the pre-dicted results of the present model with that ofBuchanan’s
0 0.8 1.6 2.4 3.2 4 4.8 5.6 6.4 7.20.00001
0.0001
0.001
Buchanan =9 =12 =14 =17
Riser Height, m
Dro
plet
Dia
met
er, m
0 0.8 1.6 2.4 3.2 4 4.8 5.6 6.4 7.2 80.00001
0.0001
0.001
Buchananφ=9φ=12φ=14φ=17
Riser Height, m
Dro
plet
Dia
met
er, m
Fig. 4. Sensitivity of predicted results with values of�: (a) profiles ofpredicted variation of drop diameter along the riser height for differentvalues of� andBuchanan’s (1994)model; (b) variation of VGO conver-sion with different values of� (feed oil inlet diameter= 500�m).
(1994) model. The predicted results with the Buchanan’sheat transfer model and the present model (for differentvalues of�) are compared inFig. 4a (for the feed droplet of500�m). It can be observed that for�=14 the vaporizationlength required is same as that predicted by theBuchanan(1994)model. That is the solid particle is pushed away fromliquid drop when vapor generated due to contacting withthe hot solid is 14 times the volume of solid particle. It canbe seen fromFig. 4a that the rate of heat transfer predictedwith the present model is lower than that predicted with theBuchanan (1994)model at the beginning of riser. This ismainly because the solid catalyst and liquid feed were in-jected at the inlet with the same velocity. This results in sig-nificantly lower collisions between solids and liquid dropsand therefore the increase in heat transfer due to presence ofsolids is negligible. As the slip velocity between solids andliquid drops increases, the frequency of collisions increasesand hence the heat transfer.Buchanan (1994)model failsto predict these intuitive understanding since it implicitly
6058 S.V. Nayak et al. / Chemical Engineering Science 60 (2005) 6049–6066
500
560
620
680
740
0.20.10 0.3 0.4 0.5 0.6 0.7 0.8 0.9Droplet Volume Fraction Yet to Vaporize
Dro
plet
Boi
ling
Poi
nt. K
1
Fig. 5. Variation of boiling point (560–700 K) with fraction of oil yet tobe evaporated.
assumes that the solid particles are moving with samevelocity as gas phase.
Riser performance was simulated with different values of� to understand sensitivity of the predicted results with thevalue of�. The predicted results are shown inFig. 4b. It canbe seen that when the value of� was set to 0, the conversionof VGO is lowest due to delayed vaporization. The overallconversion was found to increase with increase in value of�. The increase was rapid at the beginning which eventuallyslows when value of� increases beyond 6. Fortunately, thepredictions are not very sensitive to the actual value of�as long as the value lies between 9 and 18. These valuesof � seem to be reasonable following the physical basis.The model presented here may be refined when independentexperimental information is available.
It should be noted that the value of parameter� is notdependent on droplet diameter or droplet inertia providedthe droplet is large enough to generate adequate vapors topush back solid particle. The limiting case of complete va-porization of liquid droplet was any way considered as alimit on the heat transfer that could take place via one col-lision of solid and liquid particles. The value of parameter� of course depends on solid particle diameter and density.In this work, the solid particles were assumed to be monosize (65�m) and properties of solid particles (listed in Ap-pendix B) were not varied. Therefore for all the subsequentsimulations the value of� was set to 14.
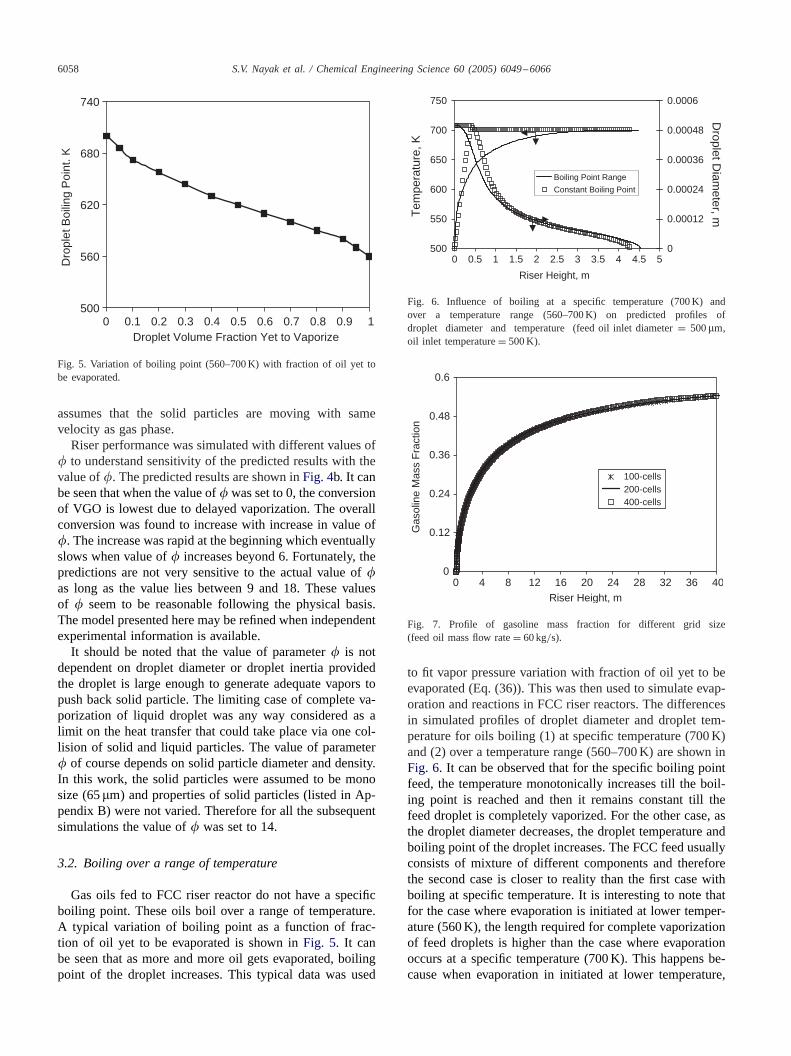
3.2. Boiling over a range of temperature
Gas oils fed to FCC riser reactor do not have a specificboiling point. These oils boil over a range of temperature.A typical variation of boiling point as a function of frac-tion of oil yet to be evaporated is shown inFig. 5. It canbe seen that as more and more oil gets evaporated, boilingpoint of the droplet increases. This typical data was used
500
550
600
650
700
750
0 0.5 1 1.5 2 2.5 3 3.5 4 4.5 5
Riser Height, m
Tem
pera
ture
, K
0
0.00012
0.00024
0.00036
0.00048
0.0006
Droplet D
iameter, m
Boiling Point Range
Constant Boiling Point
Fig. 6. Influence of boiling at a specific temperature (700 K) andover a temperature range (560–700 K) on predicted profiles ofdroplet diameter and temperature (feed oil inlet diameter= 500�m,oil inlet temperature= 500 K).
0
0.12
0.24
0.36
0.48
0.6
Riser Height, m
Gas
olin
e M
ass
Fra
ctio
n
100-cells200-cells400-cells
3632 402824201612840
Fig. 7. Profile of gasoline mass fraction for different grid size(feed oil mass flow rate= 60 kg/s).
to fit vapor pressure variation with fraction of oil yet to beevaporated (Eq. (36)). This was then used to simulate evap-oration and reactions in FCC riser reactors. The differencesin simulated profiles of droplet diameter and droplet tem-perature for oils boiling (1) at specific temperature (700 K)and (2) over a temperature range (560–700 K) are shown inFig. 6. It can be observed that for the specific boiling pointfeed, the temperature monotonically increases till the boil-ing point is reached and then it remains constant till thefeed droplet is completely vaporized. For the other case, asthe droplet diameter decreases, the droplet temperature andboiling point of the droplet increases. The FCC feed usuallyconsists of mixture of different components and thereforethe second case is closer to reality than the first case withboiling at specific temperature. It is interesting to note thatfor the case where evaporation is initiated at lower temper-ature (560 K), the length required for complete vaporizationof feed droplets is higher than the case where evaporationoccurs at a specific temperature (700 K). This happens be-cause when evaporation in initiated at lower temperature,
S.V. Nayak et al. / Chemical Engineering Science 60 (2005) 6049–6066 6059
0
0.2
0.4
0.6
0.8
1
0 12 16 20 24 28 32 36 40
Riser Height, m
Mas
s F
ract
ion
GasGasolineVGOSteam
750
780
810
840
870
900
Riser Height, m
Tem
pera
ture
, K
0
4
8
12
16
20V
elocity, m/sec
Gas PhaseFCC Cataltys
0
20
40
60
80
100
Riser Height, m
Con
vers
ion,
%
10
30
50
70
90
110
Mean M
olecular Weight,
Km
ole/kg
Conversion
Mean Molecular Weight
450
510
570
630
690
750
Riser Height, m
Dro
plet
Tem
pera
ture
, K
0
0.00012
0.00024
0.00036
0.00048
0.0006
Droplet D
iameter, m
Temperature
Diameter
0
0.12
0.24
0.36
0.48
0.6
Riser Height, m
Cok
e on
Cat
alys
t, w
t%
0
0.014
0.028
0.042
0.056
0.07
Solid H
oldup
Coke on Catalyst,%Solid Holup
4 8 0 12 16 20 24 28 32 36 404 8
0 12 16 20 24 28 32 36 404 8 0 1.5 2 2.5 3 3.5 4 4.5 50.5 1
0 12 16 20 24 28 32 36 404 8
(a) (b)
(c) (d)
(e)
Fig. 8. Simulated results for the base case: (a) profiles of mass fractions of VGO, gasoline, gas and steam; (b) profiles of temperature and velocityof gas and FCC catalyst; (c) profiles of conversion and mean molecular weight; (d) profiles of droplet temperature and diameter; (e) profiles of cokeon catalyst (wt%) and solid holdup. Feed oil mass flux= 60 kg/m2 s; feed oil inlet temperature= 500 K; feed oil inlet diameter= 500�m; CTO= 8;catalyst inlet temperature= 900 K; coke on catalyst= 0.1%; catalyst inlet velocity= 5 m/s; Steam inlet velocity= 5 m/s; riser height= 40 m.
endothermic cracking reactions also occur earlier. These en-dothermic reactions reduce the temperature of solids andtherefore delay complete evaporation of oil droplets com-pared to the case where evaporation is initiated at highertemperature. For all the subsequent simulations, oil evapo-ration over a range of temperature was considered.
3.3. Simulation of a base case of FCC riser reactor
Before using the model to understand behavior of riserreactors, the simulations were carried out using differentnumber of computational cells along the riser height. Thepredicted profiles of gasoline mass fraction along the riserheight using three different grids having 100 cells, 200 cells
and 400 cells are shown inFig. 7. It can be seen that numberof cells had no significant influence on the predicted results.For all the subsequent simulations, 200 cells were used alongthe riser height.
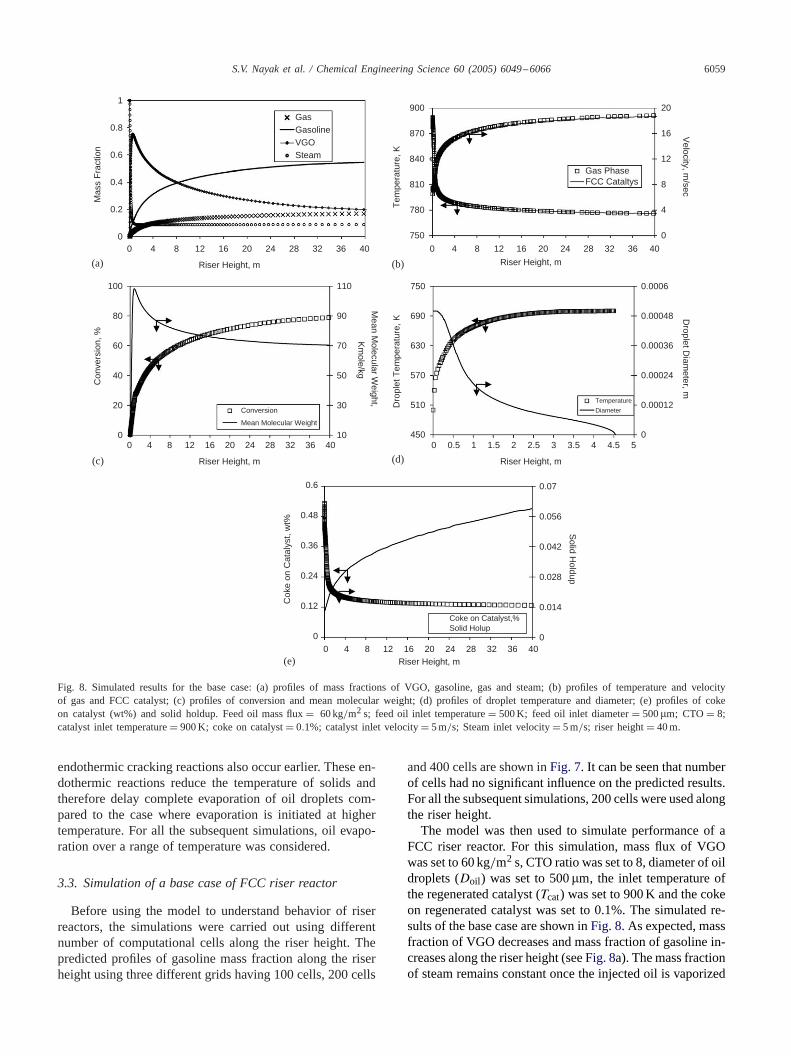
The model was then used to simulate performance of aFCC riser reactor. For this simulation, mass flux of VGOwas set to 60 kg/m2 s, CTO ratio was set to 8, diameter of oildroplets (Doil ) was set to 500�m, the inlet temperature ofthe regenerated catalyst (Tcat) was set to 900 K and the cokeon regenerated catalyst was set to 0.1%. The simulated re-sults of the base case are shown inFig. 8. As expected, massfraction of VGO decreases and mass fraction of gasoline in-creases along the riser height (seeFig. 8a). The mass fractionof steam remains constant once the injected oil is vaporized
6060 S.V. Nayak et al. / Chemical Engineering Science 60 (2005) 6049–6066
completely. The temperature of the solid catalyst decreasesalong the riser height due to heat transfer with liquid andgas phase. The gas temperature initially rises due to rapidheat transfer from the solid particles. It exhibits a maximumand then decreases along the riser height due to endothermicnature of cracking reactions. Cracking reactions rapidly in-crease moles and therefore cause significant increase in thegas (and therefore catalyst) velocity (seeFig. 8b). Conver-sion increases along the height of the riser. The mean molec-ular weight initially increases as VGO is vaporized and thendecreases as cracking reactions break bigger molecules intothe smaller ones (seeFig. 8c). The liquid phase tempera-ture increases as the boiling point range was used. It can beseen that the evaporation was completed within first 4.5 mof the riser height (seeFig. 8d). It was assumed that thecoke formed due to cracking reaction gets deposited on thecatalyst. The coke on the catalyst increases along the riserheight. The solids hold-up decreases first sharply and thenslowly along the riser height (seeFig. 8e). The results of thebase case discussed above are consistent with the prevail-ing understanding of riser performance. The computationalmodel was then evaluated by comparing model predictionswith some of the published data on industrial FCC riserreactors.
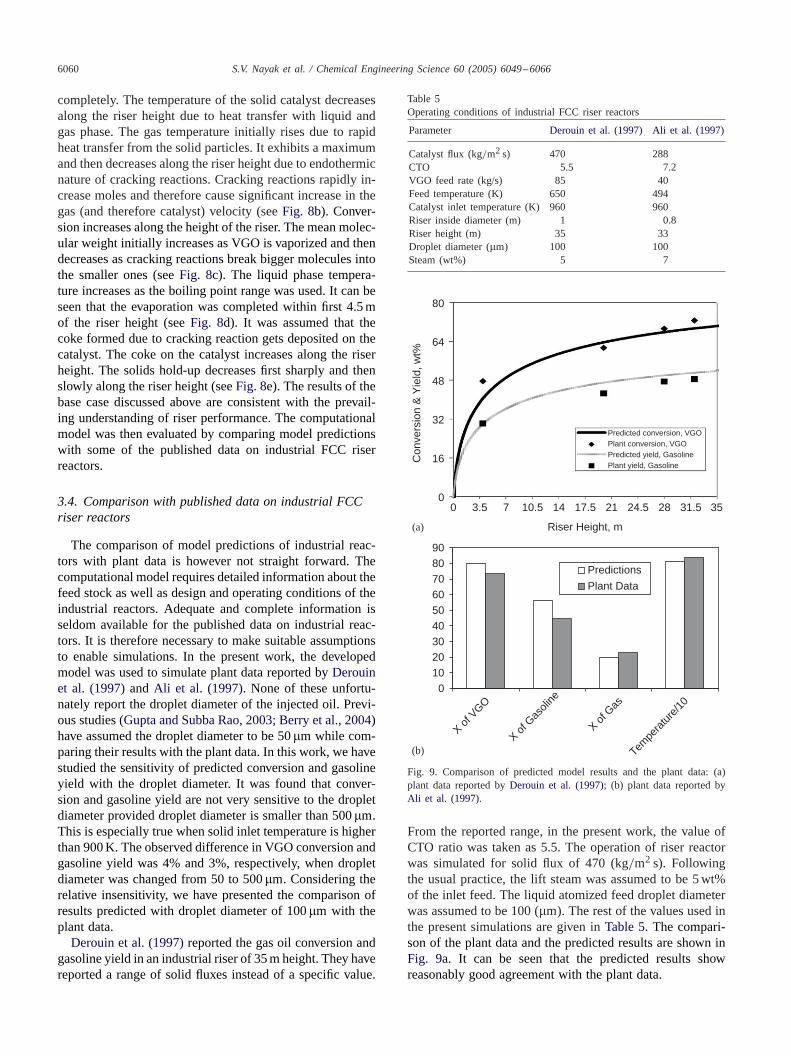
3.4. Comparison with published data on industrial FCCriser reactors
The comparison of model predictions of industrial reac-tors with plant data is however not straight forward. Thecomputational model requires detailed information about thefeed stock as well as design and operating conditions of theindustrial reactors. Adequate and complete information isseldom available for the published data on industrial reac-tors. It is therefore necessary to make suitable assumptionsto enable simulations. In the present work, the developedmodel was used to simulate plant data reported byDerouinet al. (1997)andAli et al. (1997). None of these unfortu-nately report the droplet diameter of the injected oil. Previ-ous studies (Gupta and Subba Rao, 2003; Berry et al., 2004)have assumed the droplet diameter to be 50�m while com-paring their results with the plant data. In this work, we havestudied the sensitivity of predicted conversion and gasolineyield with the droplet diameter. It was found that conver-sion and gasoline yield are not very sensitive to the dropletdiameter provided droplet diameter is smaller than 500�m.This is especially true when solid inlet temperature is higherthan 900 K. The observed difference in VGO conversion andgasoline yield was 4% and 3%, respectively, when dropletdiameter was changed from 50 to 500�m. Considering therelative insensitivity, we have presented the comparison ofresults predicted with droplet diameter of 100�m with theplant data.
Derouin et al. (1997)reported the gas oil conversion andgasoline yield in an industrial riser of 35 m height. They havereported a range of solid fluxes instead of a specific value.
Table 5Operating conditions of industrial FCC riser reactors
Parameter Derouin et al. (1997) Ali et al. (1997)
Catalyst flux (kg/m2 s) 470 288CTO 5.5 7.2VGO feed rate (kg/s) 85 40Feed temperature (K) 650 494Catalyst inlet temperature (K) 960 960Riser inside diameter (m) 1 0.8Riser height (m) 35 33Droplet diameter (�m) 100 100Steam (wt%) 5 7
0
16
32
48
64
80
Riser Height, m
Con
vers
ion
& Y
ield
, wt%
0102030405060708090
X of V
GO
X of G
asoli
ne
X of G
as
Tempe
ratu
re/1
0
Predictions
Plant Data
0 3.5 7 10.5 14 17.5 21 24.5 28 31.5 35
Predicted conversion, VGOPlant conversion, VGOPredicted yield, GasolinePlant yield, Gasoline
(a)
(b)
Fig. 9. Comparison of predicted model results and the plant data: (a)plant data reported byDerouin et al. (1997); (b) plant data reported byAli et al. (1997).
From the reported range, in the present work, the value ofCTO ratio was taken as 5.5. The operation of riser reactorwas simulated for solid flux of 470 (kg/m2 s). Followingthe usual practice, the lift steam was assumed to be 5 wt%of the inlet feed. The liquid atomized feed droplet diameterwas assumed to be 100 (�m). The rest of the values used inthe present simulations are given inTable 5. The compari-son of the plant data and the predicted results are shown inFig. 9a. It can be seen that the predicted results showreasonably good agreement with the plant data.
S.V. Nayak et al. / Chemical Engineering Science 60 (2005) 6049–6066 6061
65
70
75
80
85
90
6
6 6.6 7.2 7.8 8.4 9 9.6 10.2 10.8 11.4 12
7 8 9 10 11 12
CTO
Con
vers
ion,
%
77.4
77.6
77.8
78
78.2
78.4
78.6
78.8
79
79.20 0.0004 0.0008 0.0012 0.0016 0.002
Droplet Diameter, m
Conversion, %
CTODroplet Diameter
52
54
56
58
60
62
CTO
Gas
olin
e Y
eild
, %
56
56.6
57.2
57.8
58.4
590 0.0004 0.0008 0.0012 0.0016 0.002
Droplet Diameter, m
Gasoline Y
eild, %
CTO
Droplet Diameter
(a)
(b)
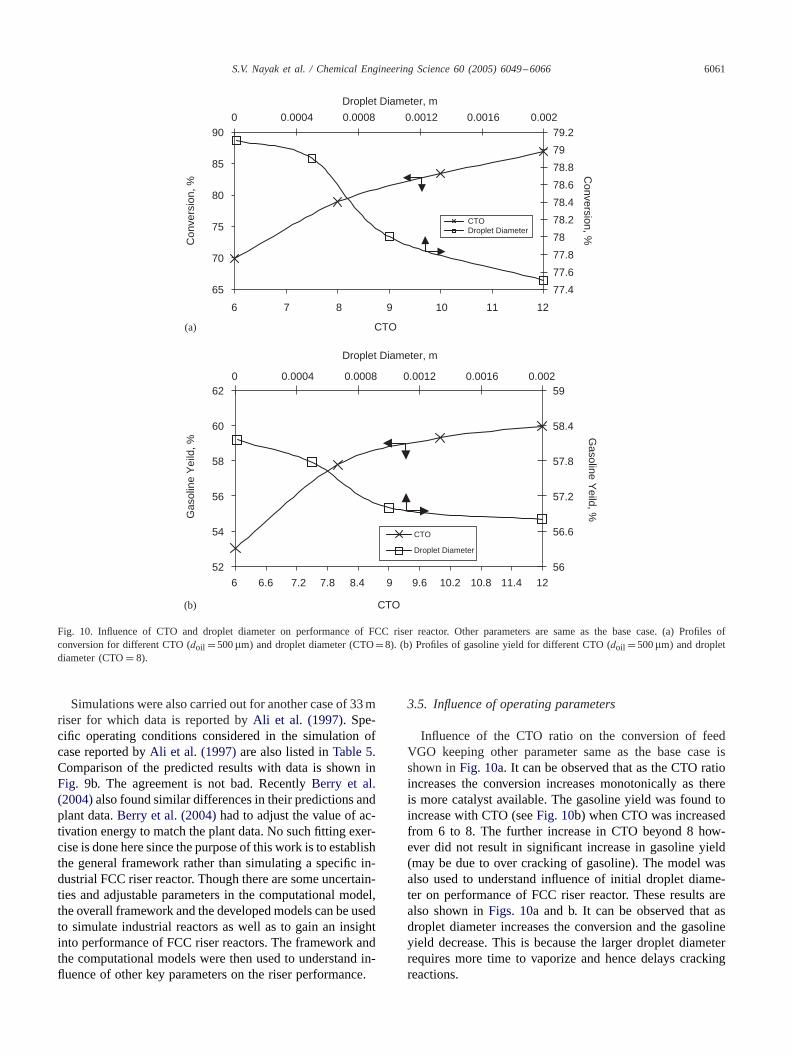
Fig. 10. Influence of CTO and droplet diameter on performance of FCC riser reactor. Other parameters are same as the base case. (a) Profiles ofconversion for different CTO (doil =500�m) and droplet diameter (CTO=8). (b) Profiles of gasoline yield for different CTO (doil =500�m) and dropletdiameter (CTO= 8).
Simulations were also carried out for another case of 33 mriser for which data is reported byAli et al. (1997). Spe-cific operating conditions considered in the simulation ofcase reported byAli et al. (1997)are also listed inTable 5.Comparison of the predicted results with data is shown inFig. 9b. The agreement is not bad. RecentlyBerry et al.(2004)also found similar differences in their predictions andplant data.Berry et al. (2004)had to adjust the value of ac-tivation energy to match the plant data. No such fitting exer-cise is done here since the purpose of this work is to establishthe general framework rather than simulating a specific in-dustrial FCC riser reactor. Though there are some uncertain-ties and adjustable parameters in the computational model,the overall framework and the developed models can be usedto simulate industrial reactors as well as to gain an insightinto performance of FCC riser reactors. The framework andthe computational models were then used to understand in-fluence of other key parameters on the riser performance.
3.5. Influence of operating parameters
Influence of the CTO ratio on the conversion of feedVGO keeping other parameter same as the base case isshown inFig. 10a. It can be observed that as the CTO ratioincreases the conversion increases monotonically as thereis more catalyst available. The gasoline yield was found toincrease with CTO (seeFig. 10b) when CTO was increasedfrom 6 to 8. The further increase in CTO beyond 8 how-ever did not result in significant increase in gasoline yield(may be due to over cracking of gasoline). The model wasalso used to understand influence of initial droplet diame-ter on performance of FCC riser reactor. These results arealso shown inFigs. 10a and b. It can be observed that asdroplet diameter increases the conversion and the gasolineyield decrease. This is because the larger droplet diameterrequires more time to vaporize and hence delays crackingreactions.
6062 S.V. Nayak et al. / Chemical Engineering Science 60 (2005) 6049–6066
60
66
72
78
84
90
800 900 1000 1100
Catalyst Temperature, Ky
Con
vers
ion,
%
68
70.8
73.6
76.4
79.2
82
0 0.1 0.2 0.3 0.4 0.5
0 0.1 0.2 0.3 0.4 0.5
Coke on Regenerated Catalyst, %
Conversion, %
Catalyst TemperatureCoke on Catalyst
48
50.4
52.8
55.2
57.6
60
800 900 1000 1100
Catalyst Temperature, K
Gas
olin
e Y
ield
, %
50
52
54
56
58
60
Coke on Regenerated Catalyst, %
Gasoline Y
ield, %
Catalyst TemeperatureCoke on Catalyst
(a)
(b)
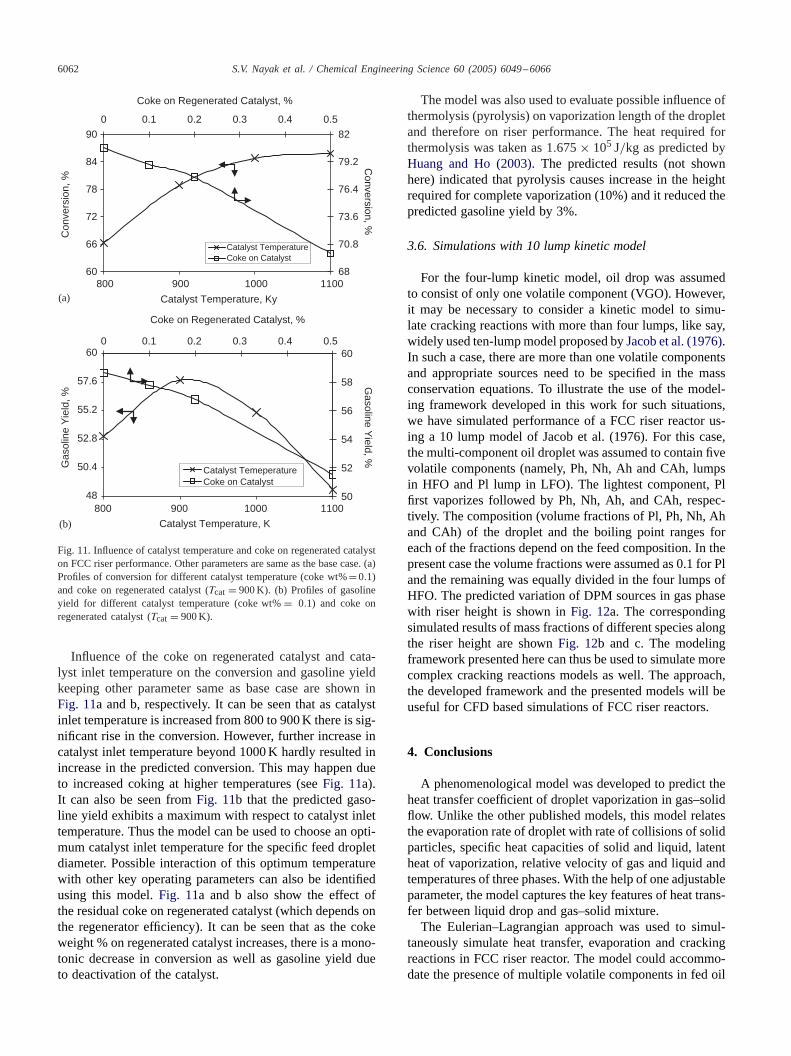
Fig. 11. Influence of catalyst temperature and coke on regenerated catalyston FCC riser performance. Other parameters are same as the base case. (a)Profiles of conversion for different catalyst temperature (coke wt%=0.1)and coke on regenerated catalyst (Tcat = 900 K). (b) Profiles of gasolineyield for different catalyst temperature (coke wt%= 0.1) and coke onregenerated catalyst (Tcat = 900 K).
Influence of the coke on regenerated catalyst and cata-lyst inlet temperature on the conversion and gasoline yieldkeeping other parameter same as base case are shown inFig. 11a and b, respectively. It can be seen that as catalystinlet temperature is increased from 800 to 900 K there is sig-nificant rise in the conversion. However, further increase incatalyst inlet temperature beyond 1000 K hardly resulted inincrease in the predicted conversion. This may happen dueto increased coking at higher temperatures (seeFig. 11a).It can also be seen fromFig. 11b that the predicted gaso-line yield exhibits a maximum with respect to catalyst inlettemperature. Thus the model can be used to choose an opti-mum catalyst inlet temperature for the specific feed dropletdiameter. Possible interaction of this optimum temperaturewith other key operating parameters can also be identifiedusing this model.Fig. 11a and b also show the effect ofthe residual coke on regenerated catalyst (which depends onthe regenerator efficiency). It can be seen that as the cokeweight % on regenerated catalyst increases, there is a mono-tonic decrease in conversion as well as gasoline yield dueto deactivation of the catalyst.
The model was also used to evaluate possible influence ofthermolysis (pyrolysis) on vaporization length of the dropletand therefore on riser performance. The heat required forthermolysis was taken as 1.675× 10⁵ J/kg as predicted byHuang and Ho (2003). The predicted results (not shownhere) indicated that pyrolysis causes increase in the heightrequired for complete vaporization (10%) and it reduced thepredicted gasoline yield by 3%.
3.6. Simulations with 10 lump kinetic model
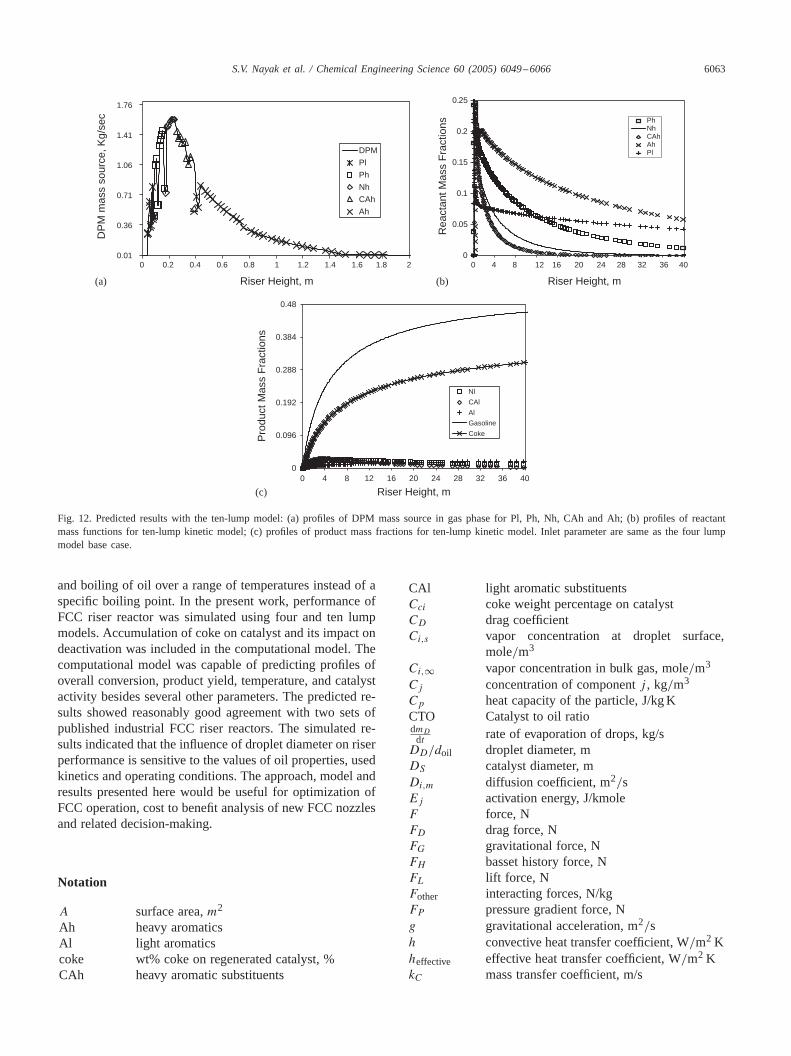
For the four-lump kinetic model, oil drop was assumedto consist of only one volatile component (VGO). However,it may be necessary to consider a kinetic model to simu-late cracking reactions with more than four lumps, like say,widely used ten-lump model proposed byJacob et al. (1976).In such a case, there are more than one volatile componentsand appropriate sources need to be specified in the massconservation equations. To illustrate the use of the model-ing framework developed in this work for such situations,we have simulated performance of a FCC riser reactor us-ing a 10 lump model of Jacob et al. (1976). For this case,the multi-component oil droplet was assumed to contain fivevolatile components (namely, Ph, Nh, Ah and CAh, lumpsin HFO and Pl lump in LFO). The lightest component, Plfirst vaporizes followed by Ph, Nh, Ah, and CAh, respec-tively. The composition (volume fractions of Pl, Ph, Nh, Ahand CAh) of the droplet and the boiling point ranges foreach of the fractions depend on the feed composition. In thepresent case the volume fractions were assumed as 0.1 for Pland the remaining was equally divided in the four lumps ofHFO. The predicted variation of DPM sources in gas phasewith riser height is shown inFig. 12a. The correspondingsimulated results of mass fractions of different species alongthe riser height are shownFig. 12b and c. The modelingframework presented here can thus be used to simulate morecomplex cracking reactions models as well. The approach,the developed framework and the presented models will beuseful for CFD based simulations of FCC riser reactors.
4. Conclusions
A phenomenological model was developed to predict theheat transfer coefficient of droplet vaporization in gas–solidflow. Unlike the other published models, this model relatesthe evaporation rate of droplet with rate of collisions of solidparticles, specific heat capacities of solid and liquid, latentheat of vaporization, relative velocity of gas and liquid andtemperatures of three phases. With the help of one adjustableparameter, the model captures the key features of heat trans-fer between liquid drop and gas–solid mixture.
The Eulerian–Lagrangian approach was used to simul-taneously simulate heat transfer, evaporation and crackingreactions in FCC riser reactor. The model could accommo-date the presence of multiple volatile components in fed oil
S.V. Nayak et al. / Chemical Engineering Science 60 (2005) 6049–6066 6063
0
0.05
0.1
0.15
0.2
0.25
0
Riser Height, m
Rea
ctan
t Mas
s F
ract
ions Ph
NhCAhAhPl
0
0.096
0.192
0.288
0.384
0.48
Riser Height, m
Pro
duct
Mas
s F
ract
ions
Nl
CAl
Al
Gasoline
Coke
4 8 12 16 20 24 28 32 36 40
0 4 8 12 16 20 24 28 32 36 40
0.01
0.36
0.71
1.06
1.41
1.76
0 0.40.2 0.6 0.8 1 1.2 1.4 1.6 1.8 2
Riser Height, m
DP
M m
ass
sour
ce, K
g/se
c
DPM
Pl
Ph
Nh
CAh
Ah
(a) (b)
(c)
Fig. 12. Predicted results with the ten-lump model: (a) profiles of DPM mass source in gas phase for Pl, Ph, Nh, CAh and Ah; (b) profiles of reactantmass functions for ten-lump kinetic model; (c) profiles of product mass fractions for ten-lump kinetic model. Inlet parameter are same as the four lumpmodel base case.
and boiling of oil over a range of temperatures instead of aspecific boiling point. In the present work, performance ofFCC riser reactor was simulated using four and ten lumpmodels. Accumulation of coke on catalyst and its impact ondeactivation was included in the computational model. Thecomputational model was capable of predicting profiles ofoverall conversion, product yield, temperature, and catalystactivity besides several other parameters. The predicted re-sults showed reasonably good agreement with two sets ofpublished industrial FCC riser reactors. The simulated re-sults indicated that the influence of droplet diameter on riserperformance is sensitive to the values of oil properties, usedkinetics and operating conditions. The approach, model andresults presented here would be useful for optimization ofFCC operation, cost to benefit analysis of new FCC nozzlesand related decision-making.
Notation
A surface area,m2
Ah heavy aromaticsAl light aromaticscoke wt% coke on regenerated catalyst, %CAh heavy aromatic substituents
CAl light aromatic substituentsCci coke weight percentage on catalystCD drag coefficientCi,s vapor concentration at droplet surface,
mole/m3
Ci,∞ vapor concentration in bulk gas, mole/m3
Cj concentration of componentj , kg/m3
Cp heat capacity of the particle, J/kg KCTO Catalyst to oil ratiodmD
dt rate of evaporation of drops, kg/sDD/doil droplet diameter, mDS catalyst diameter, mDi,m diffusion coefficient, m2/sEj activation energy, J/kmoleF force, NFD drag force, NFG gravitational force, NFH basset history force, NFL lift force, NFother interacting forces, N/kgFP pressure gradient force, Ng gravitational acceleration, m2/sh convective heat transfer coefficient, W/m2 Kheffective effective heat transfer coefficient, W/m2 KkC mass transfer coefficient, m/s
6064 S.V. Nayak et al. / Chemical Engineering Science 60 (2005) 6049–6066
Krij reaction kinetic constant forj th reaction,m3r /mcatS
Kr0j pre-exponential factor, m3r /mcatS
K∞ thermal conductivity, W/m KmD mass of the particle, kgmp mass flow rate of the particle, kg/sMi molecular weight of speciesi, kg/kmoln number of particles per unit volume, 1/m3
NAiKsolids rate of droplet vaporization per unit surfacearea of drop, kg/m2 s
Ni molar flux of vapor, mol/m2 sNh heavy naphthaleneNl light naphthaleneNu Nusselt numberNueff effective Nusselt numberPop operating pressure, pascalPsat saturated vapor pressure, pascalPh heavy paraffinPl light paraffinPr Prandlt number,Cp/K∞Q overall heat transfer coefficient, J/m3 s−rj rate of consumption of component, kg/m3 sR gas constant, J/kmol KRe Reynolds numberReeff Effective Reynolds numberSc Schmidt number,/Di,m�Sh Sherwood numberT temperature, KTS orTcat
solid or catalyst temperature,K
U velocity, m/sUP−C/USlip slip velocity, m/sVp volume of particle,m3
VGO vacuum gas oilXi mole fraction of speciesiycj mole fraction of speciesj
Greek letters
� volume fraction�D liquid holdup�S solid holdup� latent heat, J/kg viscosity, kg/m s� density, kg/m3
� empirical parameter for droplet vaporization� activity factor
Subscripts
C continuous phaseD feed dropletP dispersed phase particlesS FCC catalyst∞ gas phase
Appendix A. Ten lump Kinetic Model
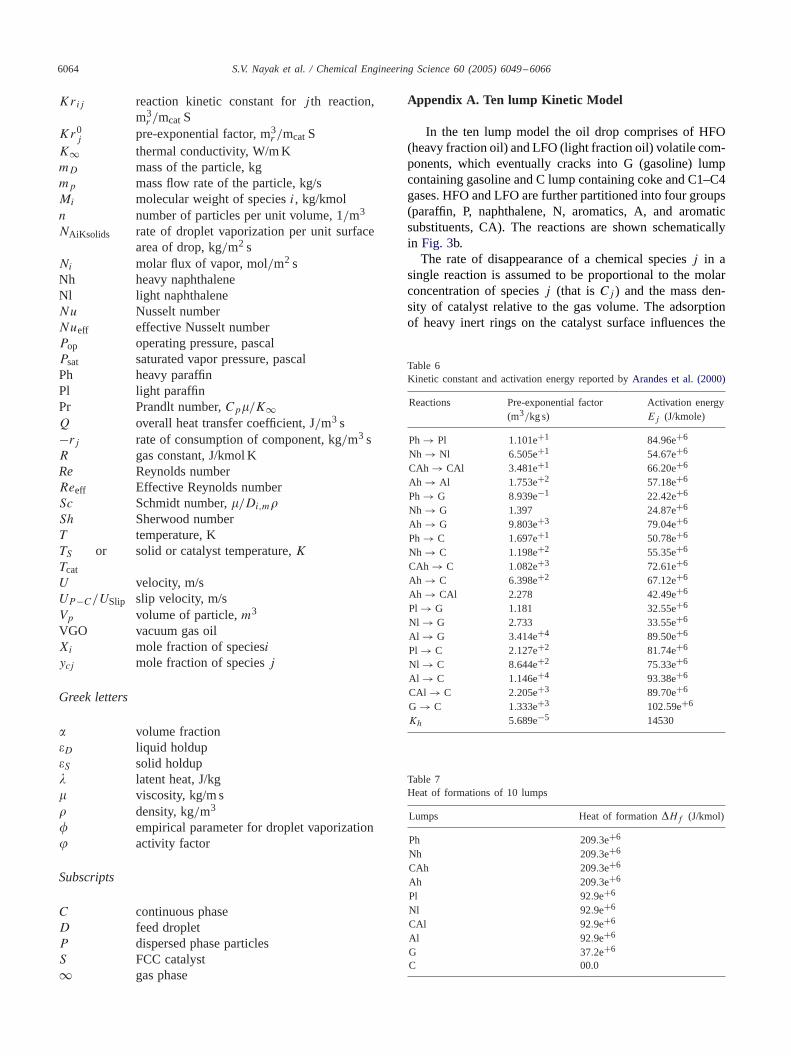
In the ten lump model the oil drop comprises of HFO(heavy fraction oil) and LFO (light fraction oil) volatile com-ponents, which eventually cracks into G (gasoline) lumpcontaining gasoline and C lump containing coke and C1–C4gases. HFO and LFO are further partitioned into four groups(paraffin, P, naphthalene, N, aromatics, A, and aromaticsubstituents, CA). The reactions are shown schematicallyin Fig. 3b.
The rate of disappearance of a chemical speciesj in asingle reaction is assumed to be proportional to the molarconcentration of speciesj (that isCj ) and the mass den-sity of catalyst relative to the gas volume. The adsorptionof heavy inert rings on the catalyst surface influences the
Table 6Kinetic constant and activation energy reported byArandes et al. (2000)
Reactions Pre-exponential factor Activation energy(m3/kg s) Ej (J/kmole)
Ph→ Pl 1.101e+1 84.96e+6
Nh → Nl 6.505e+1 54.67e+6
CAh → CAl 3.481e+1 66.20e+6
Ah → Al 1.753e+2 57.18e+6
Ph→ G 8.939e−1 22.42e+6
Nh → G 1.397 24.87e+6
Ah → G 9.803e+3 79.04e+6
Ph→ C 1.697e+1 50.78e+6
Nh → C 1.198e+2 55.35e+6
CAh → C 1.082e+3 72.61e+6
Ah → C 6.398e+2 67.12e+6
Ah → CAl 2.278 42.49e+6
Pl → G 1.181 32.55e+6
Nl → G 2.733 33.55e+6
Al → G 3.414e+4 89.50e+6
Pl → C 2.127e+2 81.74e+6
Nl → C 8.644e+2 75.33e+6
Al → C 1.146e+4 93.38e+6
CAl → C 2.205e+3 89.70e+6
G → C 1.333e+3 102.59e+6
Kh 5.689e−5 14530
Table 7Heat of formations of 10 lumps
Lumps Heat of formation�Hf (J/kmol)
Ph 209.3e+6
Nh 209.3e+6
CAh 209.3e+6
Ah 209.3e+6
Pl 92.9e+6
Nl 92.9e+6
CAl 92.9e+6
Al 92.9e+6
G 37.2e+6
C 00.0
S.V. Nayak et al. / Chemical Engineering Science 60 (2005) 6049–6066 6065
Table 8Heat of reaction
Reactions Heat of reaction used Heat of reactionreported in present case byArbel et al. (1995),
�Hr (J/kmole) �Hr (J/kmole)
Ph→ Pl 2.33e+7 2.33e+7
Nh → Nl 2.33e+7 2.33e+7
Ah → Al 2.33e+7 2.33e+7
CAh → CAl 2.33e+7 2.33e+7
Ph→ G 6.05e+7 6.05e+7
Nh → G 6.05e+7 6.05e+7
Ah → G 6.05e+7 6.05e+7
Ph→ C 20.93e+7 20.93e+7
Nh → C 20.93e+7 20.93e+7
Ah → C 20.93e+7 20.93e+7
CAh → C 20.93e+7 20.93e+7
Ah → CAl 2.33e+7 2.33e+7
Pl → G 1.86e+7 1.86e+7
Nl → G 1.86e+7 1.86e+7
Al → G 1.86e+7 1.86e+7
Pl → C 18.6e+7 9.3e+7
Nl → C 18.6e+7 9.3e+7
CAl → C 18.6e+7 9.3e+7
Al → C 18.6e+7 9.3e+7
G → C 14.9e+7 3.72e+7
availability of the active sites and consequently the rate ofreaction. The rate is given by (Secchi et al., 2001):
−rj = �(
�S1 − �S
)(1
1 + KhCAh
)�S
9∑j=1
KrijCj , (A.1)
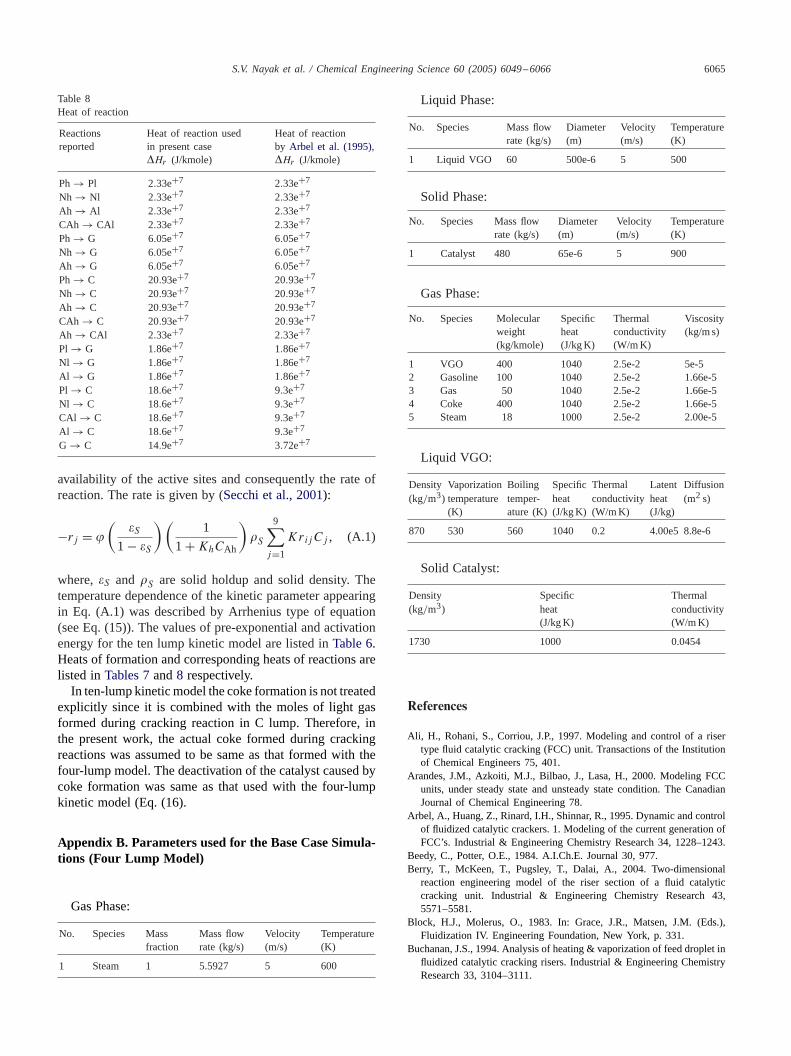
where,�S and �S are solid holdup and solid density. Thetemperature dependence of the kinetic parameter appearingin Eq. (A.1) was described by Arrhenius type of equation(see Eq. (15)). The values of pre-exponential and activationenergy for the ten lump kinetic model are listed inTable 6.Heats of formation and corresponding heats of reactions arelisted inTables 7and8 respectively.
In ten-lump kinetic model the coke formation is not treatedexplicitly since it is combined with the moles of light gasformed during cracking reaction in C lump. Therefore, inthe present work, the actual coke formed during crackingreactions was assumed to be same as that formed with thefour-lump model. The deactivation of the catalyst caused bycoke formation was same as that used with the four-lumpkinetic model (Eq. (16).
Appendix B. Parameters used for the Base Case Simula-tions (Four Lump Model)
Gas Phase:
No. Species Mass Mass flow Velocity Temperaturefraction rate (kg/s) (m/s) (K)
1 Steam 1 5.5927 5 600
Liquid Phase:
No. Species Mass flow Diameter Velocity Temperaturerate (kg/s) (m) (m/s) (K)
1 Liquid VGO 60 500e-6 5 500
Solid Phase:
No. Species Mass flow Diameter Velocity Temperaturerate (kg/s) (m) (m/s) (K)
1 Catalyst 480 65e-6 5 900
Gas Phase:
No. Species Molecular Specific Thermal Viscosityweight heat conductivity (kg/m s)(kg/kmole) (J/kg K) (W/m K)
1 VGO 400 1040 2.5e-2 5e-52 Gasoline 100 1040 2.5e-2 1.66e-53 Gas 50 1040 2.5e-2 1.66e-54 Coke 400 1040 2.5e-2 1.66e-55 Steam 18 1000 2.5e-2 2.00e-5
Liquid VGO:
Density Vaporization Boiling Specific Thermal Latent Diffusion(kg/m3) temperature temper- heat conductivity heat (m2 s)
(K) ature (K) (J/kg K) (W/m K) (J/kg)
870 530 560 1040 0.2 4.00e5 8.8e-6
Solid Catalyst:
Density Specific Thermal(kg/m3) heat conductivity
(J/kg K) (W/m K)
1730 1000 0.0454
References
Ali, H., Rohani, S., Corriou, J.P., 1997. Modeling and control of a risertype fluid catalytic cracking (FCC) unit. Transactions of the Institutionof Chemical Engineers 75, 401.
Arandes, J.M., Azkoiti, M.J., Bilbao, J., Lasa, H., 2000. Modeling FCCunits, under steady state and unsteady state condition. The CanadianJournal of Chemical Engineering 78.
Arbel, A., Huang, Z., Rinard, I.H., Shinnar, R., 1995. Dynamic and controlof fluidized catalytic crackers. 1. Modeling of the current generation ofFCC’s. Industrial & Engineering Chemistry Research 34, 1228–1243.
Beedy, C., Potter, O.E., 1984. A.I.Ch.E. Journal 30, 977.Berry, T., McKeen, T., Pugsley, T., Dalai, A., 2004. Two-dimensional
reaction engineering model of the riser section of a fluid catalyticcracking unit. Industrial & Engineering Chemistry Research 43,5571–5581.
Block, H.J., Molerus, O., 1983. In: Grace, J.R., Matsen, J.M. (Eds.),Fluidization IV. Engineering Foundation, New York, p. 331.
Buchanan, J.S., 1994. Analysis of heating & vaporization of feed droplet influidized catalytic cracking risers. Industrial & Engineering ChemistryResearch 33, 3104–3111.
6066 S.V. Nayak et al. / Chemical Engineering Science 60 (2005) 6049–6066
Das, A.K., De Wilde, J., Hegnderickx, G.J., Marin, G.B., Vierendeels, J.,Dick, E., 2004. CFD simulation of dilute phase gas–solid riser reactors:Part I—a new solution method and flow model validation. ChemicalEngineering Science 59, 167–186.
Derouin, C., Nevicato, D., Forissier, M., Wild, G., Bernard, J., 1997.Hydrodynamics of riser units and their impact on FCC operation.Industrial & Engineering Chemistry Research 36, 4504.
Farag, H. 1993. Catalytic cracking of hydrocarbons with novel metal traps.Ph.D. Dissertation, University of Western Ontario, London, Ontario,Canada.
Farag, H., Gianetto, A., Blasetti, A., de Lasa, H., 1994. FCC catalystfor reformulated gasolines. Kinetic modeling. Industrial & EngineeringChemistry Research 33, 3053.
Gao, J., Xu, C., Lin, S., Yang, G., 2001. Simulation of gas–Liquid–solid3 phase flow and reaction in FCC Riser Reactors. A.I.Ch.E. Journal47, 677–692.
Gupta, A., Subba Rao, D., 2003. Effect of feed atomization on FCCperformance: Simulation of entire unit. Chemical Engineering Science58, 4567–4579.
Hacker, S., Thiart, J.J., 2002. Short contact time (SCT) FCC: Applicationand benefit. Grace Davision Seminar, ExxonMobil Research andEngineering CO.
Han, I.S., Chung, C.-B., 2000. Dynamic modeling and simulation offluidized catalytic cracking process, Part: II: Property estimation andsimulation. Chemical Engineering Science 56, 1973–1990.
Horio, M., Kuroki, H., 1994. Three dimensional flow visualization ofdilutely dispersed solids in bubbling and circulating fluidized beds.Chemical Engineering Science 49, 2413–2428.
Huang, Z., Ho, T.C., 2003. Effect of thermolysis on resid dropletvaporization in fluid catalytic cracking. Chemical Engineering Journal91, 45–48.
Jacob, S.M., Gross, B., Weekman, V.W., 1976. A lumping and reactionscheme for catalytic cracking. A.I.Ch.E. Journal 22, 701–713.
Lee, L.S., Chen, Y.W., Huang, T.N., 1998. Four lump kinetic model forfluid catalytic cracking process. The Canadian Journal of ChemicalEngineering 67, 615–619.
Mathesian, V., Solberg, T., Hjertager, B.H., 2000. Prediction of gas/particleflow with an Eulerian model including a realistic particle sizedistribution. Powder Technology 112, 34–35.
Mirgain, C., Breins, C., Del Pozo, M., Loutaty, R., Bergougnou, M., 2000.Modeling of feed vaporization in fluid catalytic cracking. Industrial &Engineering Chemistry Research 39, 4392–4399.
Neri, A., Gidaspow, D., 2000. Riser hydrodynamics: Simulation usingkinetic theory. A.I.Ch.E. Journal 46 (1), 52–67.
Pachovsky, R.A., Wojciechowski, B.W., 1971. Theoretical interpretationof gas oil conversion data on an X-Sieve catalyst. The Canadian Journalof Chemical Engineering 49, 365–369.
Pitault, I., Nevicato, D., Forissier, M., Bernand, J.R., 1994. Kinetic modelbased on a molecular description for catalytic cracking of vacuum gasoil. Chemical Engineering Science 49, 4249–4262.
Pitault, I., Forissier, M., Bernand, J.R., 1995. Determination de constantescinetique du craquage catalytique par la modelisation du test demicroactivities MAT. The Canadian Journal of Chemical Engineering73, 498–503.
Ranz, E.E., Marshall, W.R., 1952. Journal of Chemical EngineeringProgress 48, 141, 173.
Ranade, V.V., 2002. Computational Flow Modeling for Chemical ReactorEngineering. Academic Press, London.
Secchi, A.R., Santos, M.G., Neuwmann, G.A., Trierweiler, J.O., 2001. Adynamic model for a FCC UOP stacked converter unit. Computer andChemical Engineering 25, 851–858.
Theologos, K.N., Markatos, N.C., 1993. Advance modeling of fluidcatalytic cracking riser-type reactors. A.I.Ch.E. Journal 39 (6),1007–1017.
Theologos, K.N., Markatos, N.C., Lygeros, A.I., 1999. Feedstockatomization effects on FCC riser reactors selectivity. ChemicalEngineering Science 54, 5617–5625.
Van Wachem, B.G.M., Schowten, J.C., Van Den Bleck, C.M., Krishna,R., Sinclair, J.L., 2001. A CFD modeling of gas fluidized beds with abimodal particle mixture. A.I.Ch.E. Journal 1292–1301.
Weekman, V.W., Nace, D.M., 1970. Kinetics of catalytic crackingselectivity in fixed, moving, and fluid bed reactors. A.I.Ch.E. Journal16 (3), 3397–404.
Related Documents