Modeling of Trace Gas Sensors Susan E. Minkoff 1 , No´ emi Petra 2 , John Zweck 1 , Anatoliy Kosterev 3 , and James Doty 3 1 Department of Mathematical Sciences, University of Texas at Dallas 2 Institute for Computational Engineering and Sciences, University of Texas at Austin 3 Department of Electrical and Computer Engineering, Rice University IMA Special Workshop: Career Options for Women in Mathematical Sciences March 3, 2013 Susan E. Minkoff (UTD) Trace Gas Sensors IMA Women in Math 1 / 24

Welcome message from author
This document is posted to help you gain knowledge. Please leave a comment to let me know what you think about it! Share it to your friends and learn new things together.
Transcript

Modeling of Trace Gas Sensors
Susan E. Minkoff1, Noemi Petra2, John Zweck1, Anatoliy Kosterev3, and JamesDoty3
1Department of Mathematical Sciences, University of Texas at Dallas
2Institute for Computational Engineering and Sciences, University of Texas at Austin
3Department of Electrical and Computer Engineering, Rice University
IMA Special Workshop: Career Options for Women in Mathematical SciencesMarch 3, 2013
Susan E. Minkoff (UTD) Trace Gas Sensors IMA Women in Math 1 / 24

Outline
1 Applications of Trace Gas Sensors
2 Description of How Sensors Work
3 Modeling and Numerical Simulation of a Resonant Optothermoacoustic (ROTADE)Sensor
4 Design Optimization of Tuning Forks for Resonant Optothermoacoustic (ROTADE)Sensors
Susan E. Minkoff (UTD) Trace Gas Sensors IMA Women in Math 2 / 24
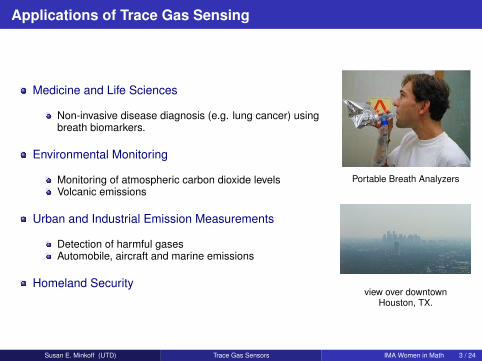
Applications of Trace Gas Sensing
Medicine and Life Sciences
Non-invasive disease diagnosis (e.g. lung cancer) usingbreath biomarkers.
Environmental Monitoring
Monitoring of atmospheric carbon dioxide levelsVolcanic emissions
Urban and Industrial Emission Measurements
Detection of harmful gasesAutomobile, aircraft and marine emissions
Homeland Security
Portable Breath Analyzers
view over downtownHouston, TX.
Susan E. Minkoff (UTD) Trace Gas Sensors IMA Women in Math 3 / 24

The physics of trace gas sensing
The detection of trace gases is based on the interaction between
optical radiation: a laser source
gas molecules: absorb light onlyat certain wavelengths
Susan E. Minkoff (UTD) Trace Gas Sensors IMA Women in Math 4 / 24

How do we detect the acoustic and thermal waves?
Detection using Quartz Tuning Forks(QTFs):
Quartz crystals have piezo- and pyroelectricproperties.
Piezoelectricity is the ability of some materials togenerate electricity in response to applied stress.
Pyroelectricity is the ability of some materials togenerate electricity when heated.
Quartz Tuning Fork
Quartz-Enhanced PhotoAcoustic Spectroscopy (QEPAS)
acoustic pressure wave⇒ mechanical resonance in a QTF
Resonant OptoThermoAcoustic DEtection (ROTADE)
diffusion (heat) wave⇒ mechanical resonance in a QTF
Susan E. Minkoff (UTD) Trace Gas Sensors IMA Women in Math 5 / 24

Characteristics of QEPAS and ROTADE Sensors
QEPAS and ROTADE are complementary techniques.
QEPAS ROTADE
Ambient Pressure & 50 Torr (∼ 7kPa) . 50 Torr (∼ 7 kPa)
Laser Source Position Top of QTF Bottom of QTF
QEPAS and ROTADE Characteristics:
allow for the analysis of very small concentration of gas (< 1mm3 in volume);
offer immunity to environmental acoustic noise;
high sensitivity;
compact, low cost;
potential for trace gas sensor networks.
Susan E. Minkoff (UTD) Trace Gas Sensors IMA Women in Math 6 / 24

Experimental configurations of QEPAS and ROTADE sensors
QEPAS withouta microresonator
QEPAS witha microresonator
ROTADE
Susan E. Minkoff (UTD) Trace Gas Sensors IMA Women in Math 7 / 24
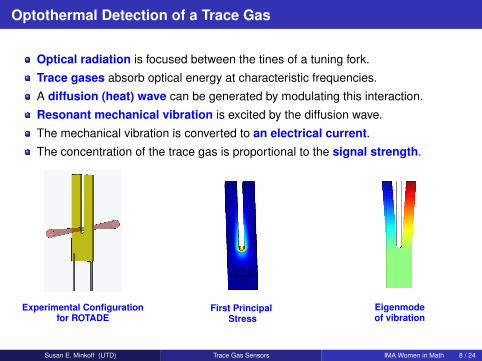
Optothermal Detection of a Trace Gas
Optical radiation is focused between the tines of a tuning fork.
Trace gases absorb optical energy at characteristic frequencies.
A diffusion (heat) wave can be generated by modulating this interaction.
Resonant mechanical vibration is excited by the diffusion wave.
The mechanical vibration is converted to an electrical current.The concentration of the trace gas is proportional to the signal strength.
Experimental Configurationfor ROTADE
First PrincipalStress
Eigenmodeof vibration
Susan E. Minkoff (UTD) Trace Gas Sensors IMA Women in Math 8 / 24

Mathematical Modeling of a ROTADE Sensor
Modeling Goal: to determine how the signal strength depends on systemparameters such as
the optimal placement of the laser beam source, and
numerical optimization of the tuning fork geometry.
The mathematical model of a ROTADE sensor includes three parts:
I. Modeling heat transfer
II. Modeling the vibration of the tuning fork
III. Modeling the conversion of mechanical stresses into electrical signal (as before).
Modeling Assumptions:
ignore the QEPAS signal;
model heat diffusion via the Heat equation.
Susan E. Minkoff (UTD) Trace Gas Sensors IMA Women in Math 9 / 24

I. Heat Transfer Model
We compute the temperature distribution via the heat equation
cpρ∂T∂t−∇ · (K∇T ) = H,
whereT = temperature t = time H = time-harmonic heat sourcecp = specific heat ρ = density K = thermal conductivity tensor.
Considering only time-harmonic waves of the form
T (x, t) = T (x)eiωt ,
the heat equation reduces to a Helmholtz type equation
−∇ · (k∇T ) + iωT = H,
where k = K/ρcp is thermal diffusivity, ω = is the laser modulation frequency, andH is the spatial part of the heat source.
Susan E. Minkoff (UTD) Trace Gas Sensors IMA Women in Math 10 / 24

II. Model for the vibration of the tuning fork
Thermoelastic deformation problem:8<: ∇ · C[∇u] + (ρω2 − ibω)u = ∇ · C[αtT ], in ΩTFu = 0, on Γ1
C[∇u]n = C[αtT ]n, on Γ2,
u = displacement field ρ = densityC = elasticity tensor ω = laser modulation frequencyT = temperature b = damping constantαt = thermal expansion tensor n = is the outward unit normal vector to Γ2.
Eigenfrequency Analysis:8<: ∇ · C[∇u] + ρω2u = 0, in ΩTF,u = 0, on Γ1,
C[∇u]n = 0, on Γ2.
Susan E. Minkoff (UTD) Trace Gas Sensors IMA Women in Math 11 / 24
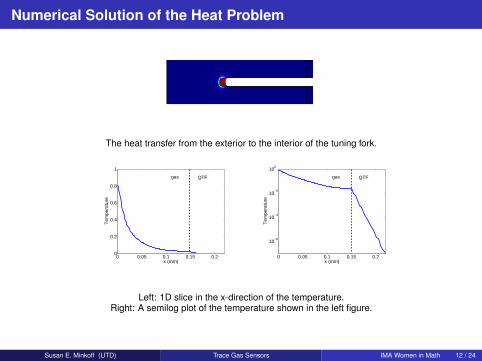
Numerical Solution of the Heat Problem
The heat transfer from the exterior to the interior of the tuning fork.
0 0.05 0.1 0.15 0.20
0.2
0.4
0.6
0.8
1
x (mm)
Tem
pera
ture
gas QTF
0 0.05 0.1 0.15 0.2
10−6
10−4
10−2
100
x (mm)T
empe
ratu
re
gas QTF
Left: 1D slice in the x-direction of the temperature.Right: A semilog plot of the temperature shown in the left figure.
Susan E. Minkoff (UTD) Trace Gas Sensors IMA Women in Math 12 / 24

Numerical Solution of the Deformation Problem
The magnitude of the piezoelectric current as a function of frequency.
33805.83 33807.33 33808.83 33810.33 33811.830
0.5
1
1.5
2
2.5
3
3.5
4x 10
5
Frequency (Hz)
Am
plitu
de o
f the
piez
oele
ctric
sig
nal (
pA)
The first principal stress (left) and the fourth eigenmode of the QTF correspondingto the 32.8 kHz eigenfrequency
Susan E. Minkoff (UTD) Trace Gas Sensors IMA Women in Math 13 / 24

ROTADE Simulation Results
Left: Schematic diagram of laser positions with respect to tuning fork.Theoretical piezoelectric signal (center) and the phase (right) as functions of the
vertical position of the laser beam.
−0.2 0.2 0.6 1
1
2
3
4
z (mm)
Nom
aliz
ed s
igna
l str
engt
h
S1(pA) − 0.15 mm, centerS2(pA) − 0.03 mmS3(pA) − 0.013 mm
−0.2 0.2 0.6 1
−60
0
60
z (mm)
Pha
se (
degr
ees)
Phase1 − 0.15 mm, centerPhase2 − 0.03 mmPhase3 − 0.013 mm
The results show that the output is largest when the source isfocused near the base of the QTF.
Susan E. Minkoff (UTD) Trace Gas Sensors IMA Women in Math 14 / 24

ROTADE Simulation Results
Left: Map of experimental ROTADE signal as a function of laser position.Right: The first principal stress of the QTF at the resonance frequency.
Signal strength is largest near where the stress is largest.
Susan E. Minkoff (UTD) Trace Gas Sensors IMA Women in Math 15 / 24

Comparison of Model with Experiments
0 0.4 0.810
4
105
106
107
z (mm)
Nor
mal
ized
sig
nal s
tren
gth
TheoryExperiment
0 0.4
100
140
180
z (mm)P
hase
TheoryExperiment
Comparison of the theoretical and experimental normalized amplitude (left) and phase (center)of the ROTADE signal as a function of the vertical position of the laser source for C2H2:N2.
Right: Experimental signal map obtained at 20 Torr for pure CO2.
The right figure shows an interference between ROTADE and QEPAS signals: atthe dark spots on the center the QEPAS and ROTADE amplitudes are equal and
the phase is opposite.
Susan E. Minkoff (UTD) Trace Gas Sensors IMA Women in Math 16 / 24

Comparison of Model with Experiments
0 0.4 0.810
1
102
103
z (mm)
Nor
mal
ized
sig
nal s
tren
gth
TheoryExperiment
0 0.4 0.8
−150
−50
z (mm)
Pha
se (
degr
ees)
TheoryExperiment
Comparison of the theoretical (blue dotted line) and experimental (blue circles) normalized amplitude (left) andphase (right) of the ROTADE signal as a function of the vertical position of the laser source for CO2. These
results are obtained at an ambient pressure of 20 Torr.
The slopes of the initial part of the experimental and theoreticalROTADE signal phase agree well.
Susan E. Minkoff (UTD) Trace Gas Sensors IMA Women in Math 17 / 24
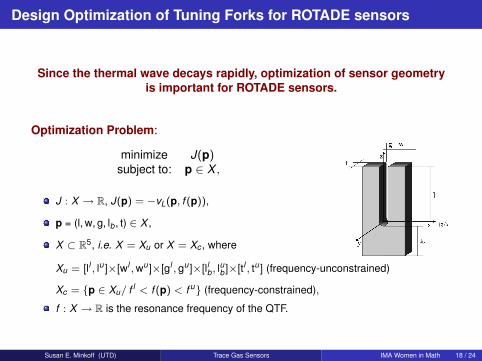
Design Optimization of Tuning Forks for ROTADE sensors
Since the thermal wave decays rapidly, optimization of sensor geometryis important for ROTADE sensors.
Optimization Problem:
minimize J(p)subject to: p ∈ X ,
J : X → R, J(p) = −vL(p, f (p)),
p = (l, w, g, lb , t) ∈ X ,
X ⊂ R5, i.e. X = Xu or X = Xc , where
Xu = [ll , lu ]×[wl , wu ]×[gl , gu ]×[llb, lub ]×[tl , tu ] (frequency-unconstrained)
Xc = p ∈ Xu/ f l < f (p) < f u (frequency-constrained),
f : X → R is the resonance frequency of the QTF.
Susan E. Minkoff (UTD) Trace Gas Sensors IMA Women in Math 18 / 24

Tuning fork optimization for ROTADE sensors via NOMADm
NOMADm is optimization software developed by Abramson et al. - it is
a MATLAB implementation of the class of Mesh-Adaptive Direct Search (MADS)algorithms;
intended for solving nonlinear and mixed variable optimization problems withgeneral nonlinear constraints;
expected to perform well when the dimension of the search space is . 10.
References:
http://www.gerad.ca/NOMAD/Abramson/NOMADm.html
C. Audet and J. E. Dennis, Jr., “Mesh Adaptive Direct Search Algorithms for Constrained Optimization”,SIAM J. Optim., vol. 17, pp. 88-217, 2006.
Susan E. Minkoff (UTD) Trace Gas Sensors IMA Women in Math 19 / 24

Optimization Simulation Results
The first principal stress of the 32.8 kHz(top left), 30 kHz (top right), and 3 kHz
(bottom left) quartz tuning forks,respectively (at the resonance frequency).
Susan E. Minkoff (UTD) Trace Gas Sensors IMA Women in Math 20 / 24
Optimization Simulation Results (cont’d)
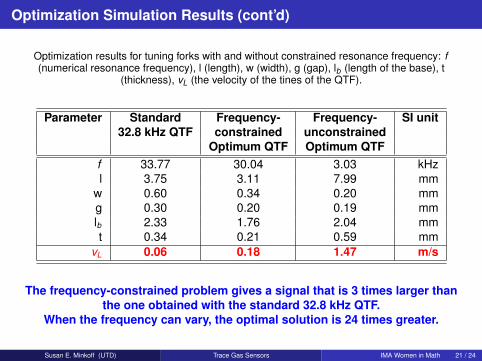
Optimization results for tuning forks with and without constrained resonance frequency: f(numerical resonance frequency), l (length), w (width), g (gap), lb (length of the base), t
(thickness), vL (the velocity of the tines of the QTF).
Parameter Standard Frequency- Frequency- SI unit32.8 kHz QTF constrained unconstrained
Optimum QTF Optimum QTFf 33.77 30.04 3.03 kHzl 3.75 3.11 7.99 mm
w 0.60 0.34 0.20 mmg 0.30 0.20 0.19 mmlb 2.33 1.76 2.04 mmt 0.34 0.21 0.59 mm
vL 0.06 0.18 1.47 m/s
The frequency-constrained problem gives a signal that is 3 times larger thanthe one obtained with the standard 32.8 kHz QTF.
When the frequency can vary, the optimal solution is 24 times greater.
Susan E. Minkoff (UTD) Trace Gas Sensors IMA Women in Math 21 / 24

Conclusions and Future Work
We validated experimental results which show that the ROTADE signal is largestwhen the source is focused near the base of the quartz tuning fork.
We found that the optimally-shaped quartz tuning fork (with the resonancefrequency constrained to about 30 kHz) is almost 3 times larger than the signalobtained with the standard 32.8 kHz tuning fork.
The frequency-unconstrained formulation provided a ROTADE signal that is 24times larger than the signal obtained with the standard 32.8 kHz tuning fork.
Ongoing and Future Work:
Model the molecular interactions of trace gases.
Develop a method to automatically compute the damping of the QTF in terms ofthe geometry.
Susan E. Minkoff (UTD) Trace Gas Sensors IMA Women in Math 22 / 24

Acknowledgements
Funding was provided by the National Science Foundation through the MIRTHE-ERCprogram (grant no. EEC–0540832).
Susan E. Minkoff (UTD) Trace Gas Sensors IMA Women in Math 23 / 24

For Further Reading See:
1 Petra, N., Zweck, J., Minkoff, S., Kosterev, A., and Doty, J., “Validation of a Model of a ResonantOptothermoacoustic Trace Gas Sensor,” Proceedings of the CLEO/QELS: 2011 Laser Science toPhotonic Applications Conference, Optical Society of America, 2011, #JTuI115.
2 Petra, N., Zweck, J., Minkoff, S., Kosterev, A., and Doty, J., “Modeling and Design Optimization of aResonant Optothermoacoustic Trace Gas Sensor,” SIAM Journal on Applied Mathematics, 71, pp.309-332, 2011.
3 N. Petra, A. A. Kosterev, J. Zweck, S. E. Minkoff, and J. H. Doty III, “Numerical and ExperimentalInvestigation for a Resonant Optothermoacoustic Sensor,” in Conference on Lasers and Electro-Optics,Optical Society of America, 2010, p. CMJ6.
4 Petra, N., Zweck, J., Kosterev, A., Minkoff, S., and Thomazy, D., “Theoretical Analysis of aQuartz-Enhanced Photoacoustic Spectroscopy Sensor,” Applied Physics B: Lasers and Optics, 94, pp.673–680, 2009: DOI:10.1007/s00340-009-3379-1.
Susan E. Minkoff (UTD) Trace Gas Sensors IMA Women in Math 24 / 24
Related Documents