Modeling of Echocardiogram Video Based on Views and States Aditi Roy 1 , Shamik Sural 1 , J. Mukherjee 2 , and A.K. Majumdar 2 1 School of Information Technology 2 Department of Computer Science & Engineering Indian Institute of Technology, Kharagpur, India {aditi.roy@sit, shamik@sit, joy@cse, akmj@cse}.iitkgp.ernet.in Abstract. In this work we propose a hierarchical state-based model for representing an echocardiogram video using objects present and their dynamic behavior. The modeling is done on the basis of the different types of views like short axis view, long axis view, apical view, etc. For view classification, an artificial neural network is trained with the his- togram of a ‘region of interest’ of each video frame. A state transition diagram is used to represent the states of objects in different views and corresponding transition from one state to another. States are detected with the help of synthetic M-mode images. In contrast to traditional single M-mode approach, we propose a new approach named as ‘Sweep M-mode ’ for the detection of states. 1 Introduction In the last few decades, medical imaging research has seen a rapid progress. Echo- cardiography is a common diagnostic imaging technique that uses ultrasound to analyze cardiac structures and function [1]. Present work is motivated by the grow-ing interest in managing medical image/video collections based on their content. Some systems and standards such as PACS [2] and DICOM [3] are used in medical imaging centers to digitize, view, communicate and store medical images. How-ever, these do not take into account the characteristics of the content of the medical images or videos. In recent past, advances have been made in content based retrieval of medical images [4]. Research has also been done on the extrac- tion of cardiac object boundaries from sequences of echocardiographic images [5]. Work on echo-cardiographic video summarization, temporal segmentation for interpretation, storage and content based retrieval of echo video has been re- ported [6]. This process is heavily dependent on the available domain knowledge which includes spatial structure of the echo video frames in terms of the ‘Region of Interest ’ (ROI), where an ROI is the region in a frame containing only the echo image of heart. On the other hand, an approach towards semantic content based retrieval of video data using object state transition data model has been put forward in [7][8]. In these articles, the echo videos are segmented based on states of the heart object. A view-based model-ing approach has been reported in P. Kalra and S. Peleg (Eds.): ICVGIP 2006, LNCS 4338, pp. 397–408, 2006. c Springer-Verlag Berlin Heidelberg 2006

Welcome message from author
This document is posted to help you gain knowledge. Please leave a comment to let me know what you think about it! Share it to your friends and learn new things together.
Transcript
Modeling of Echocardiogram Video Based on
Views and States
Aditi Roy1, Shamik Sural1, J. Mukherjee2, and A.K. Majumdar2
1 School of Information Technology2 Department of Computer Science & EngineeringIndian Institute of Technology, Kharagpur, India
{aditi.roy@sit, shamik@sit, joy@cse, akmj@cse}.iitkgp.ernet.in
Abstract. In this work we propose a hierarchical state-based model forrepresenting an echocardiogram video using objects present and theirdynamic behavior. The modeling is done on the basis of the differenttypes of views like short axis view, long axis view, apical view, etc. Forview classification, an artificial neural network is trained with the his-togram of a ‘region of interest’ of each video frame. A state transitiondiagram is used to represent the states of objects in different views andcorresponding transition from one state to another. States are detectedwith the help of synthetic M-mode images. In contrast to traditionalsingle M-mode approach, we propose a new approach named as ‘SweepM-mode’ for the detection of states.
1 Introduction
In the last few decades, medical imaging research has seen a rapid progress. Echo-cardiography is a common diagnostic imaging technique that uses ultrasound toanalyze cardiac structures and function [1]. Present work is motivated by thegrow-ing interest in managing medical image/video collections based on theircontent.
Some systems and standards such as PACS [2] and DICOM [3] are used inmedical imaging centers to digitize, view, communicate and store medical images.How-ever, these do not take into account the characteristics of the content of themedical images or videos. In recent past, advances have been made in contentbased retrieval of medical images [4]. Research has also been done on the extrac-tion of cardiac object boundaries from sequences of echocardiographic images[5]. Work on echo-cardiographic video summarization, temporal segmentationfor interpretation, storage and content based retrieval of echo video has been re-ported [6]. This process is heavily dependent on the available domain knowledgewhich includes spatial structure of the echo video frames in terms of the ‘Regionof Interest ’ (ROI), where an ROI is the region in a frame containing only theecho image of heart. On the other hand, an approach towards semantic contentbased retrieval of video data using object state transition data model has beenput forward in [7][8]. In these articles, the echo videos are segmented based onstates of the heart object. A view-based model-ing approach has been reported in
P. Kalra and S. Peleg (Eds.): ICVGIP 2006, LNCS 4338, pp. 397–408, 2006.c© Springer-Verlag Berlin Heidelberg 2006
398 A. Roy et al.
[9], which uses parts based representation for automatic view recognition. Theyrepresent the structure of heart by a constellation of its parts (chambers) underthe different views. Statistical variations of the parts in the constellation andtheir spatial relationships are modeled using Markov Random Field. SupportVector Machine [SVM] is used for view recognition which fuses the assessmentsof a test image by all the view-models. A state based modeling approach [10]measures the relative changes in left ventricular cavity in echo video sequencesto identify end diastolic and end systolic frames. This information is then used inconjunction with the statistical correlation between echo video frames to extractinformation about systole and diastole states of heart. Thus, view-based model-ing and state-based modeling of echo video are done separately. But hierarchicalstate-based modeling, combining views and states, is a new problem which hasnot been addressed till now, to the best of our knowledge.
In our work, we segment an echo video hierarchically based on views and statesof the heart object by exploiting specific structures of the video. The advantageof using this approach is that it allows storage and indexing of the echo video atdifferent levels of abstraction based on semantic features of video objects.
For hierarchical state-based modeling we first segment the video based onviews. To detect view boundary, we use traditional color histogram based com-parison [11] and edge change ratio [12]. After detecting shot boundary, we applya novel technique for automatic view classification of each shot which is basedon the signal properties and their statistical variations for each view in echovideo. We train an artificial neural network [17] with the histogram of ‘region ofinterest’ of each video frame for classification. For state detection, we propose anew method using single and sweep M-Mode.
The rest of the paper is organized as follows. In Section 2, we discuss echo videosegmentation techniques based on views. First, we give a brief description of theshot detection techniques used for detecting various views. Then we introduceour method for view classification. In Section 3, we discuss state detection usingsingle and sweep M-mode and finally, we conclude in Section 4 of the paper.
2 Echocardiogram Video Segmentation Based on View
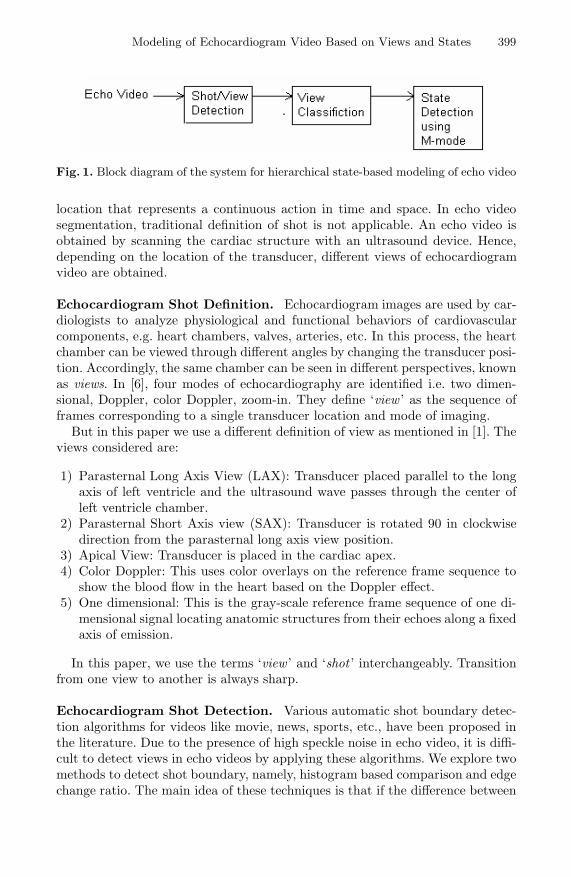
For browsing and content based manipulations of echo video, the visual informa-tion must be structured and broken down into meaningful components. Shotsare the basic structural building blocks for this and shot boundaries need tobe determined without user intervention. In Figure 1, we show the basic blockdiagram of the system. After detecting each shot, we classify them using ourclassifier. Then, each view is further segmented based on the states of the heart,as specified by its state transition diagram.
2.1 Shot Detection
As mentioned above, the first step of video processing for hierarchical state-based modeling is segmentation of the input video into shots. A shot can bedefined as a sequence of interrelated frames captured from the same camera
Modeling of Echocardiogram Video Based on Views and States 399
Fig. 1. Block diagram of the system for hierarchical state-based modeling of echo video
location that represents a continuous action in time and space. In echo videosegmentation, traditional definition of shot is not applicable. An echo video isobtained by scanning the cardiac structure with an ultrasound device. Hence,depending on the location of the transducer, different views of echocardiogramvideo are obtained.
Echocardiogram Shot Definition. Echocardiogram images are used by car-diologists to analyze physiological and functional behaviors of cardiovascularcomponents, e.g. heart chambers, valves, arteries, etc. In this process, the heartchamber can be viewed through different angles by changing the transducer posi-tion. Accordingly, the same chamber can be seen in different perspectives, knownas views. In [6], four modes of echocardiography are identified i.e. two dimen-sional, Doppler, color Doppler, zoom-in. They define ‘view ’ as the sequence offrames corresponding to a single transducer location and mode of imaging.
But in this paper we use a different definition of view as mentioned in [1]. Theviews considered are:
1) Parasternal Long Axis View (LAX): Transducer placed parallel to the longaxis of left ventricle and the ultrasound wave passes through the center ofleft ventricle chamber.
2) Parasternal Short Axis view (SAX): Transducer is rotated 90 in clockwisedirection from the parasternal long axis view position.
3) Apical View: Transducer is placed in the cardiac apex.4) Color Doppler: This uses color overlays on the reference frame sequence to
show the blood flow in the heart based on the Doppler effect.5) One dimensional: This is the gray-scale reference frame sequence of one di-
mensional signal locating anatomic structures from their echoes along a fixedaxis of emission.
In this paper, we use the terms ‘view ’ and ‘shot ’ interchangeably. Transitionfrom one view to another is always sharp.
Echocardiogram Shot Detection. Various automatic shot boundary detec-tion algorithms for videos like movie, news, sports, etc., have been proposed inthe literature. Due to the presence of high speckle noise in echo video, it is diffi-cult to detect views in echo videos by applying these algorithms. We explore twomethods to detect shot boundary, namely, histogram based comparison and edgechange ratio. The main idea of these techniques is that if the difference between
400 A. Roy et al.
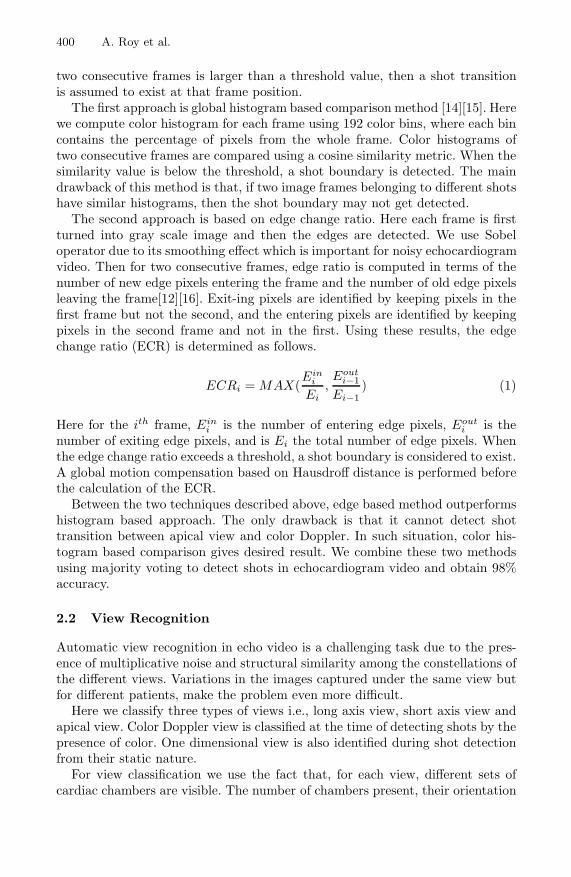
two consecutive frames is larger than a threshold value, then a shot transitionis assumed to exist at that frame position.
The first approach is global histogram based comparison method [14][15]. Herewe compute color histogram for each frame using 192 color bins, where each bincontains the percentage of pixels from the whole frame. Color histograms oftwo consecutive frames are compared using a cosine similarity metric. When thesimilarity value is below the threshold, a shot boundary is detected. The maindrawback of this method is that, if two image frames belonging to different shotshave similar histograms, then the shot boundary may not get detected.
The second approach is based on edge change ratio. Here each frame is firstturned into gray scale image and then the edges are detected. We use Sobeloperator due to its smoothing effect which is important for noisy echocardiogramvideo. Then for two consecutive frames, edge ratio is computed in terms of thenumber of new edge pixels entering the frame and the number of old edge pixelsleaving the frame[12][16]. Exit-ing pixels are identified by keeping pixels in thefirst frame but not the second, and the entering pixels are identified by keepingpixels in the second frame and not in the first. Using these results, the edgechange ratio (ECR) is determined as follows.
ECRi = MAX(Ein
i
Ei,Eout
i−1
Ei−1) (1)
Here for the ith frame, Eini is the number of entering edge pixels, Eout
i is thenumber of exiting edge pixels, and is Ei the total number of edge pixels. Whenthe edge change ratio exceeds a threshold, a shot boundary is considered to exist.A global motion compensation based on Hausdroff distance is performed beforethe calculation of the ECR.
Between the two techniques described above, edge based method outperformshistogram based approach. The only drawback is that it cannot detect shottransition between apical view and color Doppler. In such situation, color his-togram based comparison gives desired result. We combine these two methodsusing majority voting to detect shots in echocardiogram video and obtain 98%accuracy.
2.2 View Recognition
Automatic view recognition in echo video is a challenging task due to the pres-ence of multiplicative noise and structural similarity among the constellations ofthe different views. Variations in the images captured under the same view butfor different patients, make the problem even more difficult.
Here we classify three types of views i.e., long axis view, short axis view andapical view. Color Doppler view is classified at the time of detecting shots by thepresence of color. One dimensional view is also identified during shot detectionfrom their static nature.
For view classification we use the fact that, for each view, different sets ofcardiac chambers are visible. The number of chambers present, their orientation
Modeling of Echocardiogram Video Based on Views and States 401
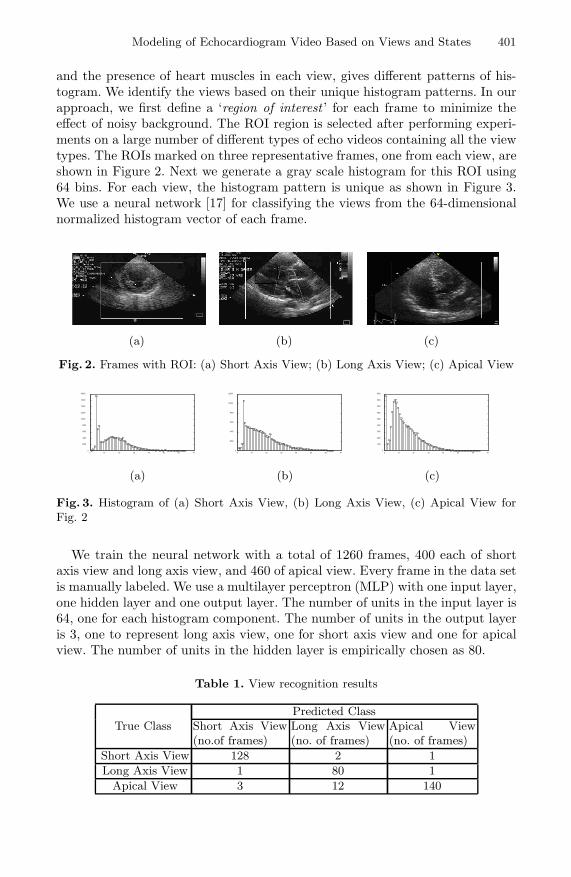
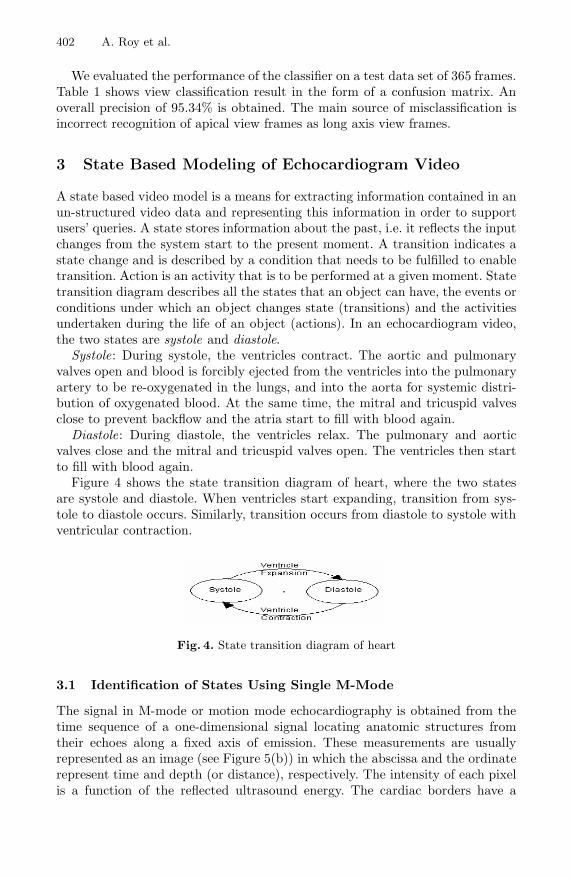
and the presence of heart muscles in each view, gives different patterns of his-togram. We identify the views based on their unique histogram patterns. In ourapproach, we first define a ‘region of interest ’ for each frame to minimize theeffect of noisy background. The ROI region is selected after performing experi-ments on a large number of different types of echo videos containing all the viewtypes. The ROIs marked on three representative frames, one from each view, areshown in Figure 2. Next we generate a gray scale histogram for this ROI using64 bins. For each view, the histogram pattern is unique as shown in Figure 3.We use a neural network [17] for classifying the views from the 64-dimensionalnormalized histogram vector of each frame.
(a)
(b)
(c)
Fig. 2. Frames with ROI: (a) Short Axis View; (b) Long Axis View; (c) Apical View
0 10 20 30 40 50 60 70
0
2000
4000
6000
8000
10000
12000
14000
16000
18000
(a)
0 10 20 30 40 50 60 70
0
2000
4000
6000
8000
10000
12000
(b)
0 10 20 30 40 50 60 70
0
1000
2000
3000
4000
5000
6000
7000
8000
9000
(c)
Fig. 3. Histogram of (a) Short Axis View, (b) Long Axis View, (c) Apical View forFig. 2
We train the neural network with a total of 1260 frames, 400 each of shortaxis view and long axis view, and 460 of apical view. Every frame in the data setis manually labeled. We use a multilayer perceptron (MLP) with one input layer,one hidden layer and one output layer. The number of units in the input layer is64, one for each histogram component. The number of units in the output layeris 3, one to represent long axis view, one for short axis view and one for apicalview. The number of units in the hidden layer is empirically chosen as 80.
Table 1. View recognition results
Predicted ClassTrue Class Short Axis View
(no.of frames)Long Axis View(no. of frames)
Apical View(no. of frames)
Short Axis View 128 2 1
Long Axis View 1 80 1
Apical View 3 12 140
402 A. Roy et al.
We evaluated the performance of the classifier on a test data set of 365 frames.Table 1 shows view classification result in the form of a confusion matrix. Anoverall precision of 95.34% is obtained. The main source of misclassification isincorrect recognition of apical view frames as long axis view frames.
3 State Based Modeling of Echocardiogram Video
A state based video model is a means for extracting information contained in anun-structured video data and representing this information in order to supportusers’ queries. A state stores information about the past, i.e. it reflects the inputchanges from the system start to the present moment. A transition indicates astate change and is described by a condition that needs to be fulfilled to enabletransition. Action is an activity that is to be performed at a given moment. Statetransition diagram describes all the states that an object can have, the events orconditions under which an object changes state (transitions) and the activitiesundertaken during the life of an object (actions). In an echocardiogram video,the two states are systole and diastole.
Systole: During systole, the ventricles contract. The aortic and pulmonaryvalves open and blood is forcibly ejected from the ventricles into the pulmonaryartery to be re-oxygenated in the lungs, and into the aorta for systemic distri-bution of oxygenated blood. At the same time, the mitral and tricuspid valvesclose to prevent backflow and the atria start to fill with blood again.
Diastole: During diastole, the ventricles relax. The pulmonary and aorticvalves close and the mitral and tricuspid valves open. The ventricles then startto fill with blood again.
Figure 4 shows the state transition diagram of heart, where the two statesare systole and diastole. When ventricles start expanding, transition from sys-tole to diastole occurs. Similarly, transition occurs from diastole to systole withventricular contraction.
Fig. 4. State transition diagram of heart
3.1 Identification of States Using Single M-Mode
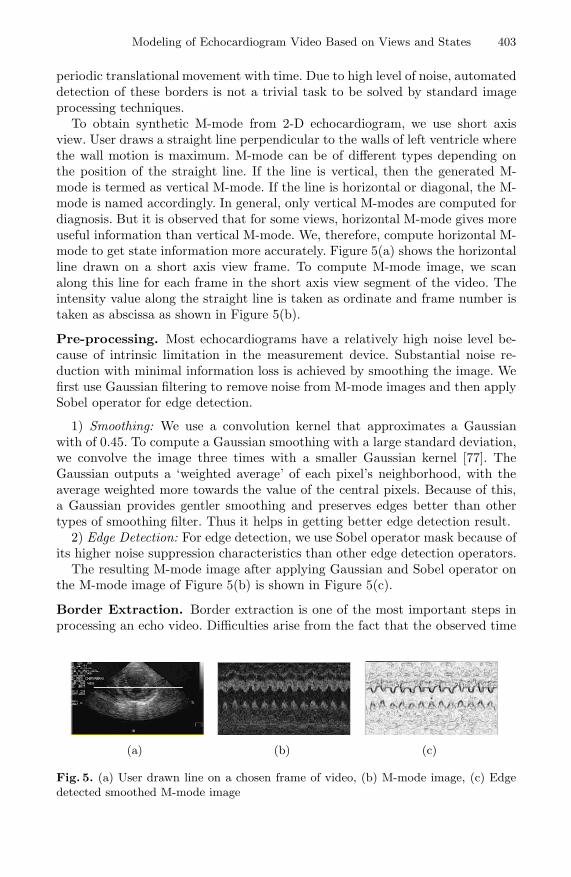
The signal in M-mode or motion mode echocardiography is obtained from thetime sequence of a one-dimensional signal locating anatomic structures fromtheir echoes along a fixed axis of emission. These measurements are usuallyrepresented as an image (see Figure 5(b)) in which the abscissa and the ordinaterepresent time and depth (or distance), respectively. The intensity of each pixelis a function of the reflected ultrasound energy. The cardiac borders have a
Modeling of Echocardiogram Video Based on Views and States 403
periodic translational movement with time. Due to high level of noise, automateddetection of these borders is not a trivial task to be solved by standard imageprocessing techniques.
To obtain synthetic M-mode from 2-D echocardiogram, we use short axisview. User draws a straight line perpendicular to the walls of left ventricle wherethe wall motion is maximum. M-mode can be of different types depending onthe position of the straight line. If the line is vertical, then the generated M-mode is termed as vertical M-mode. If the line is horizontal or diagonal, the M-mode is named accordingly. In general, only vertical M-modes are computed fordiagnosis. But it is observed that for some views, horizontal M-mode gives moreuseful information than vertical M-mode. We, therefore, compute horizontal M-mode to get state information more accurately. Figure 5(a) shows the horizontalline drawn on a short axis view frame. To compute M-mode image, we scanalong this line for each frame in the short axis view segment of the video. Theintensity value along the straight line is taken as ordinate and frame number istaken as abscissa as shown in Figure 5(b).
Pre-processing. Most echocardiograms have a relatively high noise level be-cause of intrinsic limitation in the measurement device. Substantial noise re-duction with minimal information loss is achieved by smoothing the image. Wefirst use Gaussian filtering to remove noise from M-mode images and then applySobel operator for edge detection.
1) Smoothing: We use a convolution kernel that approximates a Gaussianwith of 0.45. To compute a Gaussian smoothing with a large standard deviation,we convolve the image three times with a smaller Gaussian kernel [77]. TheGaussian outputs a ‘weighted average’ of each pixel’s neighborhood, with theaverage weighted more towards the value of the central pixels. Because of this,a Gaussian provides gentler smoothing and preserves edges better than othertypes of smoothing filter. Thus it helps in getting better edge detection result.
2) Edge Detection: For edge detection, we use Sobel operator mask because ofits higher noise suppression characteristics than other edge detection operators.
The resulting M-mode image after applying Gaussian and Sobel operator onthe M-mode image of Figure 5(b) is shown in Figure 5(c).
Border Extraction. Border extraction is one of the most important steps inprocessing an echo video. Difficulties arise from the fact that the observed time
(a)
(b)
(c)
Fig. 5. (a) User drawn line on a chosen frame of video, (b) M-mode image, (c) Edgedetected smoothed M-mode image
404 A. Roy et al.
trajectories of cardiac borders sometimes present discontinuities and may notalways correspond to well-defined edges. Here we extract the border by searchingfor optimal path along time axis. We use a maximum tracking procedure [13]whose performance is improved by using a local model to predict the position ofthe next border point.
The system described by Unser et al.[13] is based on a search algorithm thattraces gray-scale maxima corresponding to each relevant cardiac internal struc-ture along the horizontal time axis. Although this algorithm was initially de-signed to be applied to the data directly, it can also be used in our system inwhich tracking of cardiac border is based on the position of minimum intensitypixel on the edge detected M-mode image. A digitized M-mode echocardiogramis represented as a two dimensional image {Xk,l}, where ‘k ’ represents the timevariable and ‘l ’ represents the distance along the axis of the straight line drawnon the view. A brief review of the algorithms is presented here.
1) Basic Algorithm: The basic procedure is based on the fact that the move-ment of cardiac borders from one time frame to another is restricted to a rela-tively narrow region. A starting point is first determined by the user. Then, as-suming the present position of the cardiac border to be l, the algorithm searchesfor the point with mini-mal intensity in the next vertical line in a window cen-tered around the previous position (l±w), where w is the window size. This pointis then taken as the next position of the border. The procedure is iterated untilall the frames have been considered. This simple approach follows a single pathguided by locally optimizing the sum of the signal values along the trajectory. Itusually detects the posterior wall epicardium satisfactorily, but generally fails indetecting the endocardium or the boundaries of the interventricular septum. Weuse this algorithm to detect the lower border, having lesser movement, shown inFigure 6(a).
2) Kuwahara Algorithm (KMTA): Kuwahara et al. suggest searching for thecardiac borders by reference to the border that has already been detected. Theiralgorithm uses the same principle as the basic algorithm except that the positionand extent of the search window at a given time k is also a function of the relativedisplacement of the reference structure �lr(K) = lr(K) − lr(K − 1), where lris the reference cardiac border position. The reference position is now given byl(K − 1) + �lr(K), where l(K − 1) denotes the previously detected positionof the structure. Furthermore, the width of the search window is increased inan asymmetric way, depending on the sign of �l(K) . Broadening the searchwindow in the expected direction of movement is designed to compensate forthe greater velocity of the endocardium in systole and early diastole. We usethis algorithm to detect the upper border in Figure 6(a).
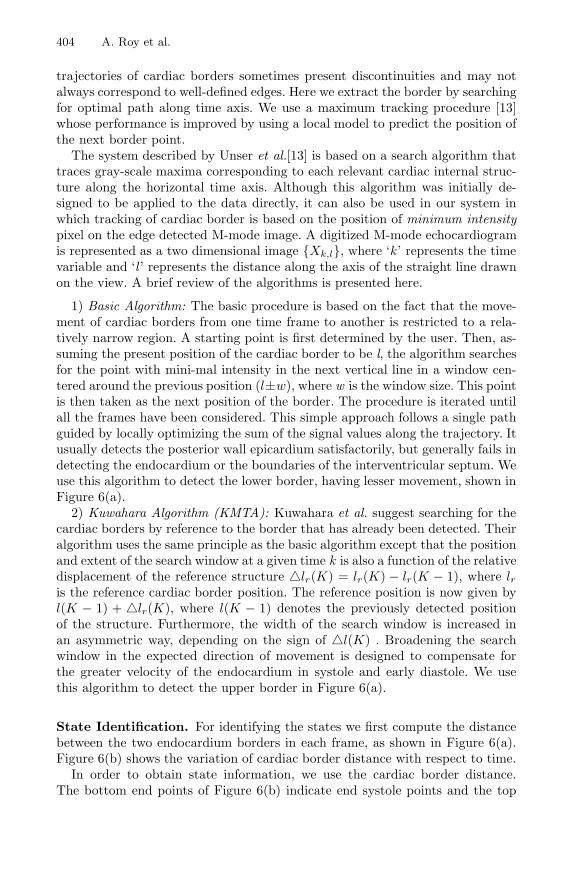
State Identification. For identifying the states we first compute the distancebetween the two endocardium borders in each frame, as shown in Figure 6(a).Figure 6(b) shows the variation of cardiac border distance with respect to time.
In order to obtain state information, we use the cardiac border distance.The bottom end points of Figure 6(b) indicate end systole points and the top
Modeling of Echocardiogram Video Based on Views and States 405
points indicate the end diastole points. During the time elapsed between endsystole point to end diastole point, the heart is in diastole state and is in systolestate from end diastole point to end systole point. In the diastole state leftventricle expands, thus the distance between the endocardium borders increases.Hence, the slope is positive. Similarly, in diastole, left ventricle contracts and thedistance between the endocardium borders decreases which results in negativeslope in the distance graph.
Using the distance information, we classify the echocardiogram video framesinto two classes, namely, systole and diastole. In the echocardiogram video, theframes corresponding to positive slope are classified as diastolic state frames,while those corresponding to negative slope are classified as systolic. This com-pletes the process of state detection from an echocardiogram video. The statetransition graph obtained from Figure 6(b) is shown in Figure 6(c).
(a)
(b)
(c)
Fig. 6. (a) Border extracted M-mode image, (b) Variation cardiac border distance withtime, (c) State transition graph
Table 2 shows the detailed result of state identification from 267 frames inshort axis view using single M-mode. This method gives total misclassificationerror of 26.22%. Most of the misclassified or unclassified frames are those duringwhich state transition occurs. The table also shows Sweep M-mode results asexplained in the next sub-section.
3.2 State Identification Using Sweep M-Mode
In order to further improve the state detection accuracy, we propose a multipleM-mode generation method termed as ‘Sweep M-mode’. It is so named becausemultiple M-modes are generated by scanning the intensity value along a straightline as before, while the straight line is continuously swept by a specified intervalin a direction normal to a fixed axis.
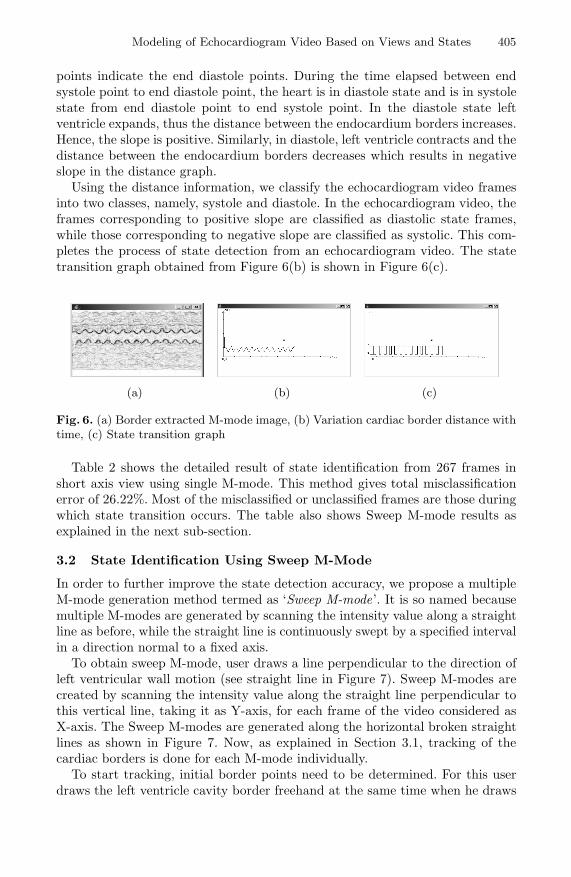
To obtain sweep M-mode, user draws a line perpendicular to the direction ofleft ventricular wall motion (see straight line in Figure 7). Sweep M-modes arecreated by scanning the intensity value along the straight line perpendicular tothis vertical line, taking it as Y-axis, for each frame of the video considered asX-axis. The Sweep M-modes are generated along the horizontal broken straightlines as shown in Figure 7. Now, as explained in Section 3.1, tracking of thecardiac borders is done for each M-mode individually.
To start tracking, initial border points need to be determined. For this userdraws the left ventricle cavity border freehand at the same time when he draws
406 A. Roy et al.
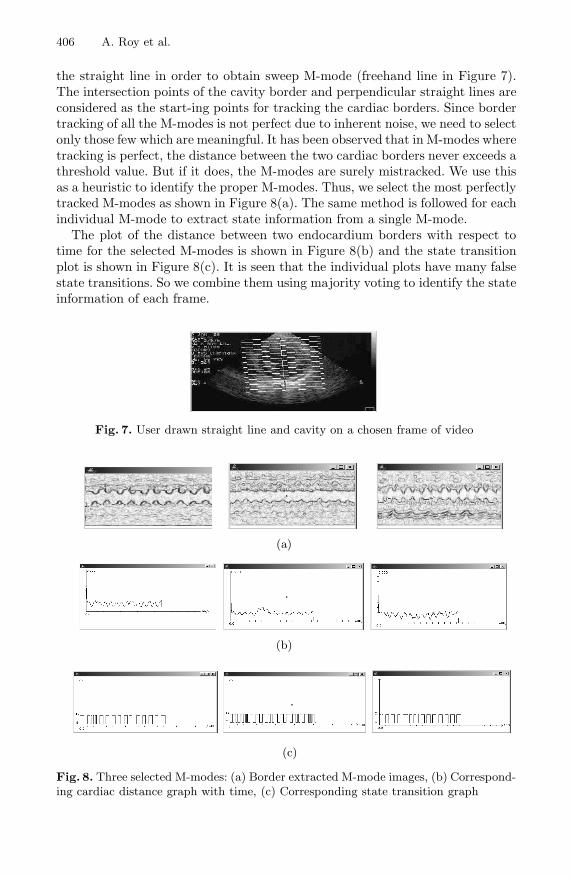
the straight line in order to obtain sweep M-mode (freehand line in Figure 7).The intersection points of the cavity border and perpendicular straight lines areconsidered as the start-ing points for tracking the cardiac borders. Since bordertracking of all the M-modes is not perfect due to inherent noise, we need to selectonly those few which are meaningful. It has been observed that in M-modes wheretracking is perfect, the distance between the two cardiac borders never exceeds athreshold value. But if it does, the M-modes are surely mistracked. We use thisas a heuristic to identify the proper M-modes. Thus, we select the most perfectlytracked M-modes as shown in Figure 8(a). The same method is followed for eachindividual M-mode to extract state information from a single M-mode.
The plot of the distance between two endocardium borders with respect totime for the selected M-modes is shown in Figure 8(b) and the state transitionplot is shown in Figure 8(c). It is seen that the individual plots have many falsestate transitions. So we combine them using majority voting to identify the stateinformation of each frame.
Fig. 7. User drawn straight line and cavity on a chosen frame of video
(a)
(b)
(c)
Fig. 8. Three selected M-modes: (a) Border extracted M-mode images, (b) Correspond-ing cardiac distance graph with time, (c) Corresponding state transition graph
Modeling of Echocardiogram Video Based on Views and States 407
We carried out experiments with the same echocardiogram video as before.The right hand part of Table 2 shows the detailed result obtained using sweep M-mode. It is seen that the misclassification error has come down to about 12.36%.Thus, use of sweep M-mode reduces the misclassification error as compared tosingle M-mode described in the previous section.
Table 2. Results of state identification using M-mode
Predicted ClassTrue Class Single M-mode Sweep M-mode
Systole Diastole Undetected Systole Diastole Undetected
Systole 96 5 21 111 10 2
Diastole 26 101 18 18 123 3
4 Conclusion
In this paper we have proposed a new approach for hierarchical state-basedmodeling of echo video data by identifying the views and states of objects. Wefirst detect the view boundaries using histogram based comparison and edgechange ratio. Then we classify the views by considering signal properties ofdifferent views. Our technique gives a precision rate of 95.34%. To extract stateinformation from each view, we use synthetic M-modes. At first, we apply singleM-mode. But the misclassification error in identifying the states with the helpof single M-mode is quite high (around 27%). So we introduce a new type of M-mode generation method named as sweep M-mode. Application of sweep M-modereduces the misclassification error to about 13%. We have used this approach ofhierarchical state-based modeling to develop an object relational video databasefor storage and retrieval of echocardiogram video segments. The proposed schemeis now being extended for finer (sub state) segmentation.
Acknowledgments. This work is partially supported by the Department ofScience and Technology (DST), India, under Research Grant No. SR/S3/EECE/024/ 2003-SERC-Engg.
References
1. Feigenbaum, H.: Echocardiography, LEA & FEBIGER, 19972. Huang, H.K.: PACS: Basic Principles and Applications, Wiley, New York, 19993. DICOM: Http://Medical.nema.org/dicom.html4. Shyu, C.R., Brodely, C.E., Kak, A.C, Osaka, A.: ASSERT: A physician-in-the loop
content-based retrieval system for HRCT image databases. Computer Vision andImage Understanding, Vol. 75, July/August, pp. 111-132, 1999
5. Duncan, J.S., Ayache, N.: Medical image analysis: progress over two decades andthe challenges ahead. IEEE Trans. Pattern Analysis and Machine Intelli-gence,Vol. 22, No. 1, January 2000, pp. 95-105, 2000
408 A. Roy et al.
6. Ebadollahi, S., Chang, S.F., Wu, H.: Echocardiogram videos: summarization, tem-poral segmentation and browsing. Proc. IEEE Int’l Conference on Image Process-ing, (ICIP’02), Vol. 1, pp. 613-616, September 2002
7. Sing, P.K., Majumdar, A.K.: Semantic content based retrieval in a video data-base.Proc. Int’l Workshop on Multimedia Data Mining, (MDM/KDD’2001), pp. 50-57,August 2001
8. Acharya, B., Mukherjee, J., Majumdar, A.K.: Modeling dynamic objects in data-bases: a logic based approach. ER 2001, LNCS 2224, Springer Verlag, pp. 449-512
9. Ebadollahi, S., Chang, S.F., Wu, H.: Automatic view recognition in echocardio-gram videos using parts-based representation. Proc. IEEE Computer Society Con-ference on Computer Vision and Pattern Recognition, (CVPR’04), Vol. 2, pp. II-II-9, June 2004
10. Acharya, B., Mukherjee, J., Majumdar, A.K.: An object state transition model forechocardiogram video data. Proc. Conference of Multimedia Processing Systems,pp. 103-106, 2000
11. Yu, H., Wolf, W.: A visual search system for video and image database. Proc. IEEEInt’l Conference on Multimedia Computing and Systems, pp. 517-524, June1997
12. Zabin, R., Miller, J., Mai, K.: A feature-based algorithm for detecting and classi-fying scene breaks. Proc. ACM Multimedia, pp. 189-200, 1995
13. Unser, M., Palle, G., Braun, P., Eden, M.: Automated extraction of serial myo-cardial borders from M-mode echocardiograms. IEEE Trans. Medical Imaging, Vol.8, pp. 96-103, March 1989
14. Murphy, N., Marlows, S., O’Toole, C., Smeaton, A.: Evaluation of automatic shotboundary detection on a large video test suite. The Challenges of Image Re-trieval- 2nd UK Conference on Image Retrieval, 1999
15. Mas, J., Fernandez, G.: Video shot boundary detection based on color histogram.TREC 2003
16. Lienhart, P.: Reliable transition detection in videos: a survey and practioners guide.Int’l Journal of Image and graphics, Vol. 1, No. 3, pp. 469-486, 2001
17. Bishop, C.M.: Neural networks for pattern recognition. Oxford: Oxford Univer-sityPress.1997
Related Documents