MODELING OF CLIMATE CHANGE IMPACTS ON AGRICULTURE, FORESTRYAND FISHERY B. K. Bala*, M. A. Munnaf**, F. Y. Ruma*** and M. S. Alam**** * Universiti Putra Malaysia, Malaysia. Email: [email protected]. ** Hajee Mohammad Danesh Science and Technology University, Bangladesh. ***Bangladesh Agricultural Development Corporation, Bangladesh. ****Sher-e-Bangla Agricultural University, Bangladesh. A scientific journal of COMSATS – SCIENCE VISION Vol.18 No.1&2 (January to December 2012) 21 ABSTRACT Keywords: 1. INTRODUCTION 2. MODELINGAND SIMULATION 2.1 Modeling of Climate Change Impacts on Crop Growth Changes in climate affect agriculture, forest and fisheries. This paper examines the climate change impacts on crop production, fishery and forestry using state-of-the-art modeling technique. Crop growth model InfoCrop was used to predict the climate change impacts on the yields of rice, wheat and maize in Bangladesh. Historical climate change scenario has little or no negative impacts on rice and wheat yields in Mymensingh and Dinajpur but IPCC climate change scenario has higher negative impacts. There is almost no change in the yields of rice and maize for the historical climate change scenario in the Hill Tracts of but there is a small decrease in the yields of rice and maize for IPCC climate change scenario. A new statistical model to forecast climate change impacts on fishery in the world oceans has been developed. Total climate change impact on fishery in the Indian Ocean is negative and the predictor power is 94.14 % for eastern part and 98.59 % for the western part. Two models are presented for the mangrove forests of the Sundarbans. Total bole volumes of the pioneer, intermediate and climax are simulated for three different logging strategies and the results have been discussed in this paper. Climate Change, Crop Production, Forestry, Fishery, Modeling, Simulation, Adaptation, Management Strategies. Chittagong, Many studies have been reported on modeling of forest growth, management strategies and climate change (Bossel, 1991; Bossel and Kreiger, 1991; Huth and Ditzer, 2000; Ito and Oikawa, 2002; Phillips, et al., 2003; Masera, et al., 2003; Wallman et al., 2004; Köhler and Huth, 2004; Tietjen and Huth, 2006; Fyllas et al., 2007 and Drouet and Pages, 2007). Bala, et al., (2003, 2004 & 2008) adopted the process based cohort model of Kohler (2000) and Kohler and Huth (1998) to simulate the mangrove forest growth of the Sundarbans and also applied the aggregate model CO2FIX (Masera, et al., 2003). Computation of climate change impacts on crop yields are based on the crop growth model, InfoCrop, developed by Aggarwal, et al. (2006 a & b). Computation of canopy photosynthesis from the incoming photosynthetically active radiation forms the central part of the crop-growth simulation models. The crop development and growth processes and their relationships with the crop growth model, InfoCrop, are shown in Figure-1, where light and temperature are the independent variables, and photosynthetic parameters are constants. Rectangles represent quantities (state variables), valve symbols indicate flows (rate variables), circles are auxiliary variables (converters), full lines are flows of material, and dashed lines are flow of information. Development and growth processes are dry matter production, dry matter partitioning, leaf area growth and phenology. The growth rate of the crop is calculated as a function of radiation use efficiency; photosynthetically active radiation; total leaf area index; and a crop/ cultivar specific extinction coefficient. The growth rate of the crop is calculated as follows: Where GCROP = net crop growth rate; RUE = radiation use efficiency; PAR = photosynthetically active radiation; KDF = extinction coefficient; and LAI = leaf area index. Under favorable growth conditions, light, temperature, and the crop characteristics for phenological, morphological, and physiological processes are the main factors determining the growth rate of the crop on a specific day. The net dry matter available each day for crop growth is partitioned into roots, leaves, stems, and storage organs as a crop-specific function of development stage. Allocation is made first to roots, which increase in case the crop experiences water, or nitrogen stress. The remaining dry matter is allocated to the above ground shoot, from which a fraction was allocated to leaves and stems. The balance dry matter is automatically allocated to the storage organs. The model follows a daily calculation scheme for the rates of dry matter production of the plant organs, the rate of leaf area development, and the rate of phenological development (growth stages). By integrating these rates over time, dry-matter production of the crop is simulated throughout the crop growing season and the yield of the crop is computed. Radiation use efficiency changes for the changes in temperature and CO concentrations in the atmosphere as a result of climate 2 (1)

Welcome message from author
This document is posted to help you gain knowledge. Please leave a comment to let me know what you think about it! Share it to your friends and learn new things together.
Transcript
MODELING OF CLIMATE CHANGE IMPACTS ONAGRICULTURE, FORESTRYAND FISHERY
B. K. Bala*, M. A.Munnaf**, F. Y. Ruma***
and M. S. Alam****
* Universiti Putra Malaysia, Malaysia. Email: [email protected]. ** Hajee Mohammad Danesh Science and Technology University,Bangladesh. ***Bangladesh Agricultural Development Corporation, Bangladesh. ****Sher-e-Bangla Agricultural University, Bangladesh.
A scientific journal of COMSATS – SCIENCE VISION Vol.18 No.1&2 (January to December 2012) 21
ABSTRACT
Keywords:
1. INTRODUCTION
2. MODELINGAND SIMULATION
2.1 Modeling of Climate Change Impacts on CropGrowth
Changes in climate affect agriculture, forest andfisheries. This paper examines the climate changeimpacts on crop production, fishery and forestry usingstate-of-the-art modeling technique. Crop growthmodel InfoCrop was used to predict the climatechange impacts on the yields of rice, wheat and maizein Bangladesh. Historical climate change scenario haslittle or no negative impacts on rice and wheat yields inMymensingh and Dinajpur but IPCC climate changescenario has higher negative impacts. There is almostno change in the yields of rice and maize for thehistorical climate change scenario in theHill Tracts of but there is a small decrease in the yieldsof rice and maize for IPCC climate change scenario. Anew statistical model to forecast climate changeimpacts on fishery in the world oceans has beendeveloped. Total climate change impact on fishery inthe Indian Ocean is negative and the predictor poweris 94.14 % for eastern part and 98.59 % for the westernpart. Two models are presented for the mangroveforests of the Sundarbans. Total bole volumes of thepioneer, intermediate and climax are simulated forthree different logging strategies and the results havebeen discussed in this paper.
Climate Change, Crop Production,Forestry, Fishery, Modeling, Simulation, Adaptation,Management Strategies.
Chittagong,
Many studies have been reported on modeling offorest growth, management strategies and climatechange (Bossel, 1991; Bossel and Kreiger, 1991; Huthand Ditzer, 2000; Ito and Oikawa, 2002; Phillips, et al.,2003; Masera, et al., 2003; Wallman et al., 2004;Köhler and Huth, 2004; Tietjen and Huth, 2006; Fyllaset al., 2007 and Drouet and Pages, 2007). Bala, et al.,(2003, 2004 & 2008) adopted the process basedcohort model of Kohler (2000) and Kohler and Huth(1998) to simulate the mangrove forest growth of theSundarbans and also applied the aggregate modelCO2FIX (Masera, et al., 2003).
Computation of climate change impacts on crop yields
are based on the crop growth model, InfoCrop,developed by Aggarwal, et al. (2006 a & b).Computation of canopy photosynthesis from theincoming photosynthetically active radiation forms thecentral part of the crop-growth simulation models. Thecrop development and growth processes and theirrelationships with the crop growth model, InfoCrop,are shown in Figure-1, where light and temperatureare the independent variables, and photosyntheticparameters are constants. Rectangles representquantities (state variables), valve symbols indicateflows (rate variables), circles are auxiliary variables(converters), full lines are flows of material, anddashed lines are flow of information. Development andgrowth processes are dry matter production, drymatter partitioning, leaf area growth and phenology.The growth rate of the crop is calculated as a functionof radiation use efficiency; photosynthetically activeradiation; total leaf area index; and a crop/ cultivarspecific extinction coefficient. The growth rate of thecrop is calculated as follows:
Where GCROP = net crop growth rate;RUE = radiation use efficiency;PAR = photosynthetically active radiation;KDF = extinction coefficient; andLAI = leaf area index.
Under favorable growth conditions, light, temperature,and the crop characteristics for phenological,morphological, and physiological processes are themain factors determining the growth rate of the crop ona specific day. The net dry matter available each dayfor crop growth is partitioned into roots, leaves, stems,and storage organs as a crop-specific function ofdevelopment stage. Allocation is made first to roots,which increase in case the crop experiences water, ornitrogen stress. The remaining dry matter is allocatedto the above ground shoot, from which a fraction wasallocated to leaves and stems. The balance dry matteris automatically allocated to the storage organs. Themodel follows a daily calculation scheme for the ratesof dry matter production of the plant organs, the rate ofleaf area development, and the rate of phenologicaldevelopment (growth stages). By integrating theserates over time, dry-matter production of the crop issimulated throughout the crop growing season and theyield of the crop is computed. Radiation use efficiencychanges for the changes in temperature and COconcentrations in the atmosphere as a result of climate
2
(1)
Modeling of Climate Change Impacts onAgriculture, Forestry and Fishery
A scientific journal of COMSATS – SCIENCE VISION Vol.18 No.1&2 (January to December 2012)22
change and these changes are incorporated in thecrop growth model to compute the climate changeimpacts on crop productions.
Several studies reported that fishing in the oceans isaffected by surface water temperature. Greenhouseand other effects contribute to global warming and theglobal warming in turn affects the fish catches. Aknowledge of the impact of the temperature on fishcatches in world fishery is essential for sustainablemanagement of the world fishery resources, and anew method for prediction of climate change impact inthe world oceans is described as follows.
Two categories of data were analyzed and processedto assess the dynamics of spatial temperaturedistribution and fish catches for the oceans of thefishery resources. The predictor is a rule, inaccordance with which the dynamics of fish catch w(t)for the future, i.e. for new values of m1,...,m4(moments of a future temperature distribution) can bepredicted. Assuming that the values of w(t) (both forprevious years and for future) can be presented in theform:
With n=32>>4, system can be considered as an over-
determined linear algebraic system with respect to
which can be solved by the Gauss method (themethod of least squares (Hoel, 1966).
Now assuming that the solution of Equation (2) is: {
2.2 Modeling of Climate Change Impacts onFishery in the Oceans
�
�
k
k;
k=1,2,3,4}. It is obvious that :
Where u(t) is the relative deviation of predicted totalfish catch.
Finally, the decision rule with the predictor s power isthat:
if u(j) > 0, then the fish catch would be higher thanthe amount predicted by the curve of the meangrowth (climate change has a positive influence);this statement is true with probability P ;If u(j) < 0, then the fish catch would be lower thanpredicted by the curve of the mean growth (FF hasa negative influence); this statement is true withprobability P .
The details of the construction of the predictor andpredictor power are given by Biswas, et al. (2005).
The tree geometry and canopy development ofmangrove forests are not well defined and are highlyvariable. Based on critical reviews on previous effortson modeling and search for a simple but realisticmodel, two approaches of modeling of the mangroveforests are considered and these are aggregatemodeling and individual based growth modeling. Theaggregate model consists of three successional treespecies of Keora (Sonneratia apetala), Gewa(Excoecaria agallocha) and Sundari (Heritiera fomes).The individual based growth curve model proposed byChen and Twilley (1998) is adapted for modeling of the
+
-
2.3 Modeling of Mangrove Forest
Figure - 1: Simple representation of crop growth model
nttmtw
k
kk,...,1),()(
4
1
�� ��
� (2)
nttwtmtu
k
kk,...,1),()()(
4
1
��� ��
�� (3)
23
B. K. Bala, M. A. Munnaf, F. Y. Ruma and M. S. Alam
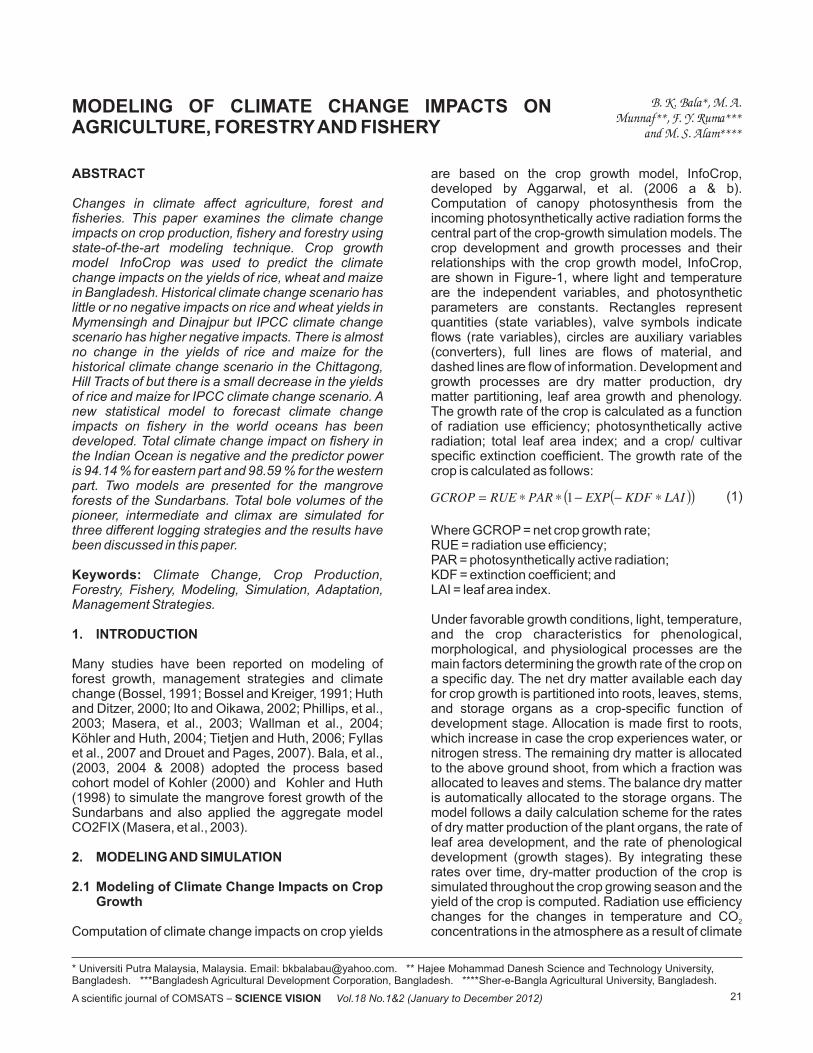
mangrove forests of the Sundarbans incorporating thesalinity multiplier, temperature multiplier, anddominance effect or basal area multiplier. Theaggregate model is based on a system of threecoupled equations, which describe the stem volumechanges of the three successional groups of Keora,Gewa and Sundari for every time step. The model inSTELLA flow diagram is shown in Figure-2 and theseequations are solved using Runge Kutta method oforder 4.
There are few individual based ecological simulationmodels describing the structural and functionalcharacteristics of mangrove forests. The FORMANmodel based modifications of the JABOWA andFORET models (Shugart, 1984; Botkin, 1993) wasdeveloped to simulate demographic processes ofmangroves in a 0.05 ha plot. This model is adapted formangrove forest of the Sundarbans and the growthequation of the mangrove forest is as follows:
WhereA=andD = Diameter at breast height, m;H = height, m;
t = Time, year;G, b and b are constants.
Furthermore, the height of the tree is related to thediameter at breadth height as follows:
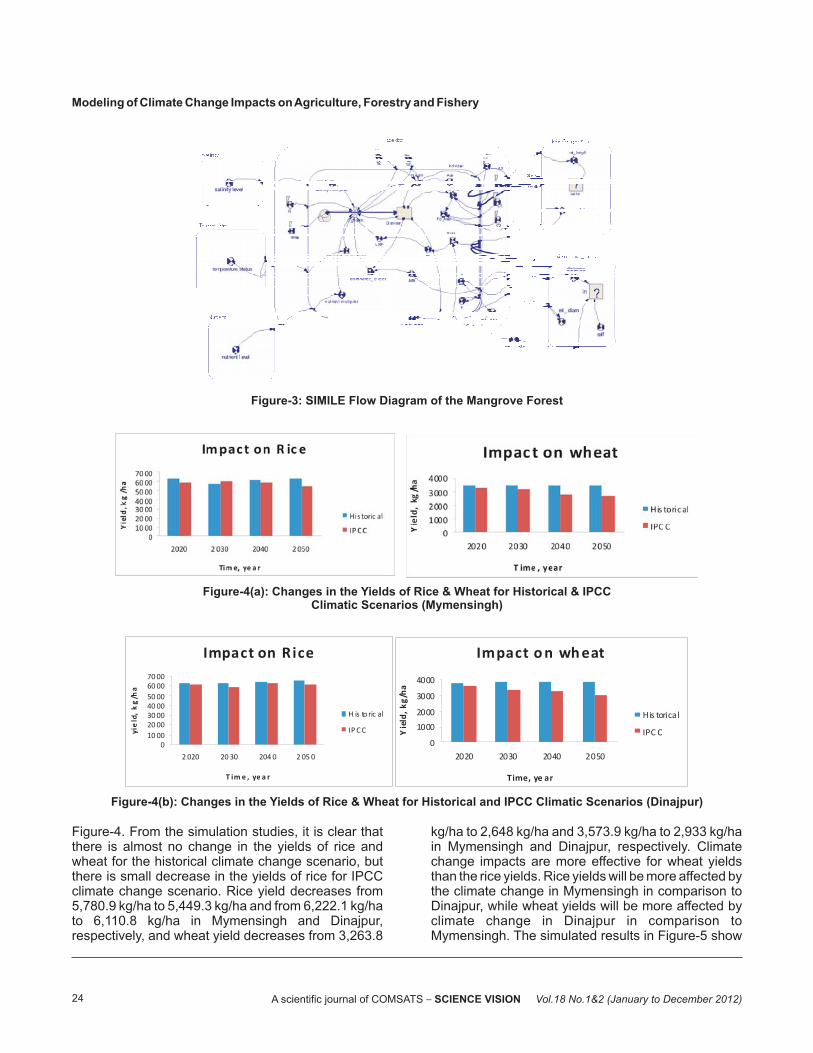
The SIMILE flow diagram of the individual basedgrowth curve model is shown in Figure-3.
As the global warming continues, the weatherparameters are also changing in conjuncture,gradually creating a new unacquainted ambientenvironment for the field crops. What will be the yield,duration and spatial dispersion of the field crops in thechanging scenarios of climate change, are the burningissue to the global intellectual community.
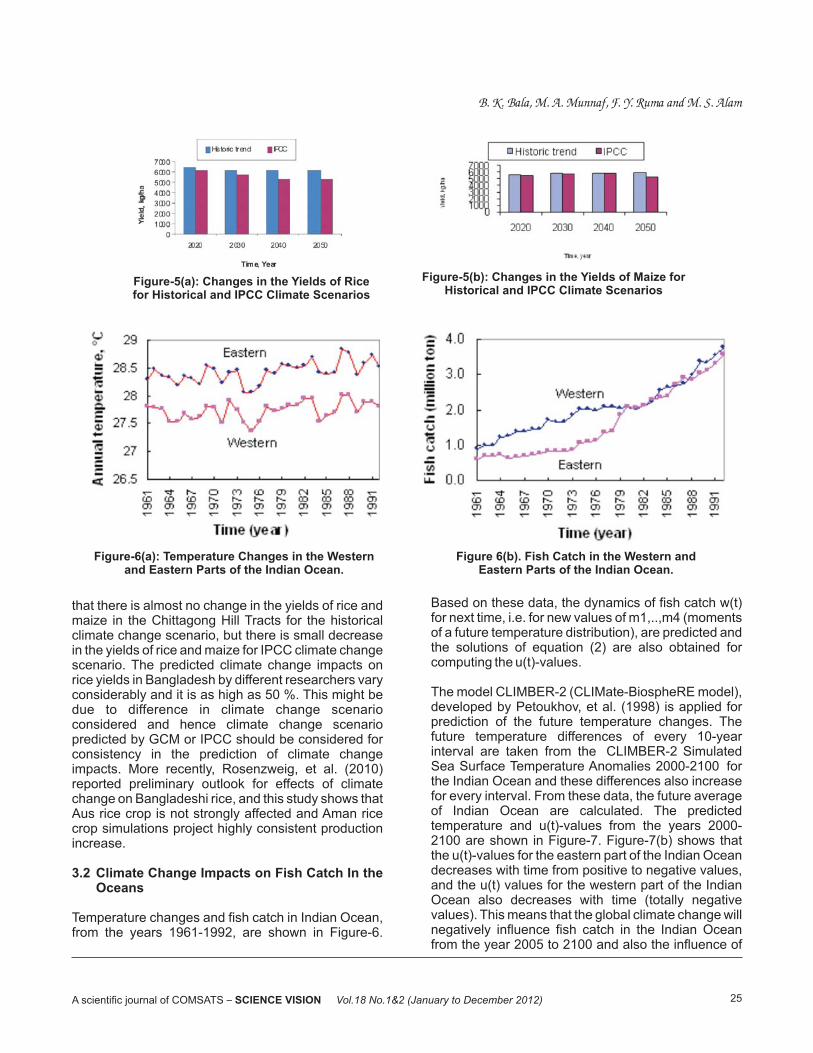
The simulated climate change impacts on the yields ofrice and wheat in Mymensingh and Dinajpur forhistorical and IPCC trends of the temperature and COchanges for a period of 2020-2050 are shown in
2 3
2
3. RESULTSAND DISCUSSIONS
3.1 Climate Change Impacts on Rice, Wheat andMaize Production
A scientific journal of COMSATS – SCIENCE VISION Vol.18 No.1&2 (January to December 2012)
Figure-2: STELLA Flow Diagram for Forest Growth Model with Logging Operations
)()()()( BADDEGDTNUTNSALT ���
(4)ADbDb
HDDHGD
dt
dD�
�
��
)43274(
)/1(2
32
maxmax
2
32197 DbDbH �� (5)
24
Figure-4. From the simulation studies, it is clear thatthere is almost no change in the yields of rice andwheat for the historical climate change scenario, butthere is small decrease in the yields of rice for IPCCclimate change scenario. Rice yield decreases from5,780.9 kg/ha to 5,449.3 kg/ha and from 6,222.1 kg/hato 6,110.8 kg/ha in Mymensingh and Dinajpur,respectively, and wheat yield decreases from 3,263.8
kg/ha to 2,648 kg/ha and 3,573.9 kg/ha to 2,933 kg/hain Mymensingh and Dinajpur, respectively. Climatechange impacts are more effective for wheat yieldsthan the rice yields. Rice yields will be more affected bythe climate change in Mymensingh in comparison toDinajpur, while wheat yields will be more affected byclimate change in Dinajpur in comparison toMymensingh. The simulated results in Figure-5 show
A scientific journal of COMSATS – SCIENCE VISION Vol.18 No.1&2 (January to December 2012)
Figure-3: SIMILE Flow Diagram of the Mangrove Forest
Figure-4(a): Changes in the Yields of Rice & Wheat for Historical & IPCCClimatic Scenarios (Mymensingh)
Impact on Rice
0
10 00
20 00
30 00
40 00
50 00
60 00
70 00
2 020 20 30 204 0 2 05 0
T im e , ye a r
yie
ld,
kg
/ha
H is to ric al
IP C C
Impact o n wh eat
0
1000
2000
3000
4000
2020 2030 2040 2050
Time, ye ar
Yie
ld,
kg
/ha
His torical
IPC C
Figure-4(b): Changes in the Yields of Rice & Wheat for Historical and IPCC Climatic Scenarios (Dinajpur)
Modeling of Climate Change Impacts onAgriculture, Forestry and Fishery
25
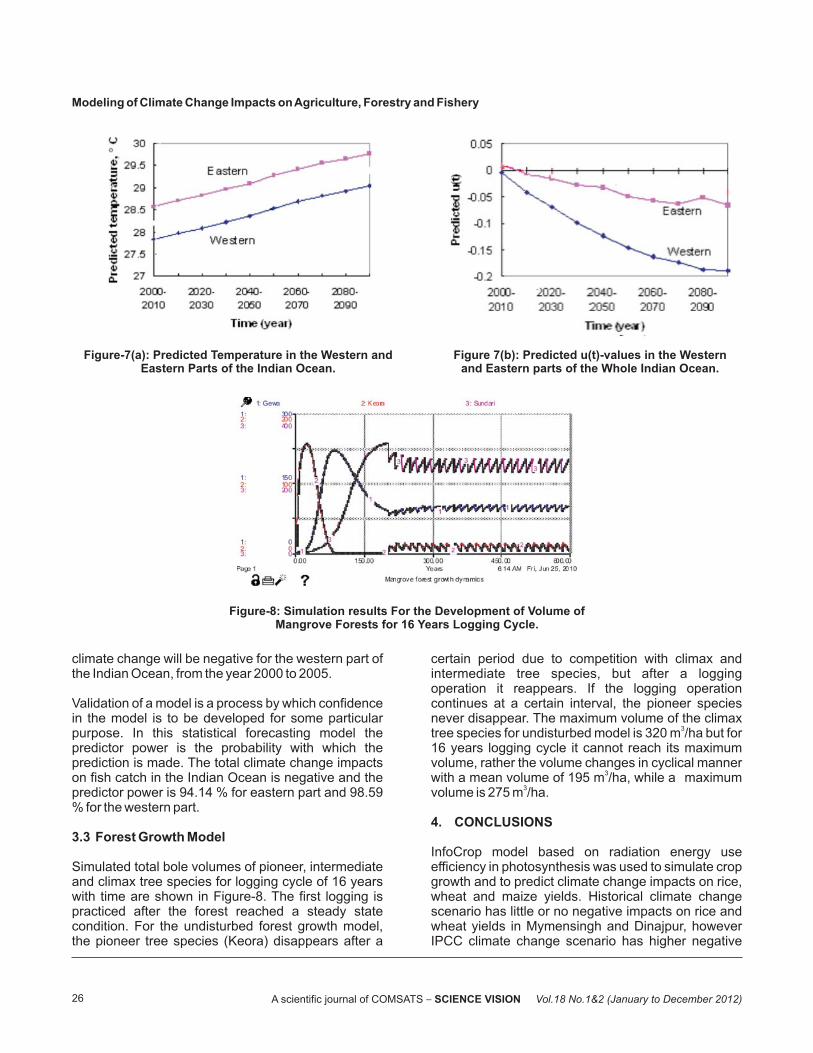
that there is almost no change in the yields of rice andmaize in the Chittagong for the historicalclimate change scenario, but there is small decreasein the yields of rice and maize for IPCC climate changescenario. The predicted climate change impacts onrice yields in Bangladesh by different researchers varyconsiderably and it is as high as 50 %. This might bedue to difference in climate change scenarioconsidered and hence climate change scenariopredicted by GCM or IPCC should be considered forconsistency in the prediction of climate changeimpacts. More recently, Rosenzweig, et al. (2010)reported preliminary outlook for effects of climatechange on Bangladeshi rice, and this study shows thatAus rice crop is not strongly affected and Aman ricecrop simulations project highly consistent productionincrease.
Temperature changes and fish catch in Indian Ocean,from the years 1961-1992, are shown in Figure-6.
Hill Tracts
3.2 Climate Change Impacts on Fish Catch In theOceans
Based on these data, the dynamics of fish catch w(t)for next time, i.e. for new values of m1,..,m4 (momentsof a future temperature distribution), are predicted andthe solutions of equation (2) are also obtained forcomputing the u(t)-values.
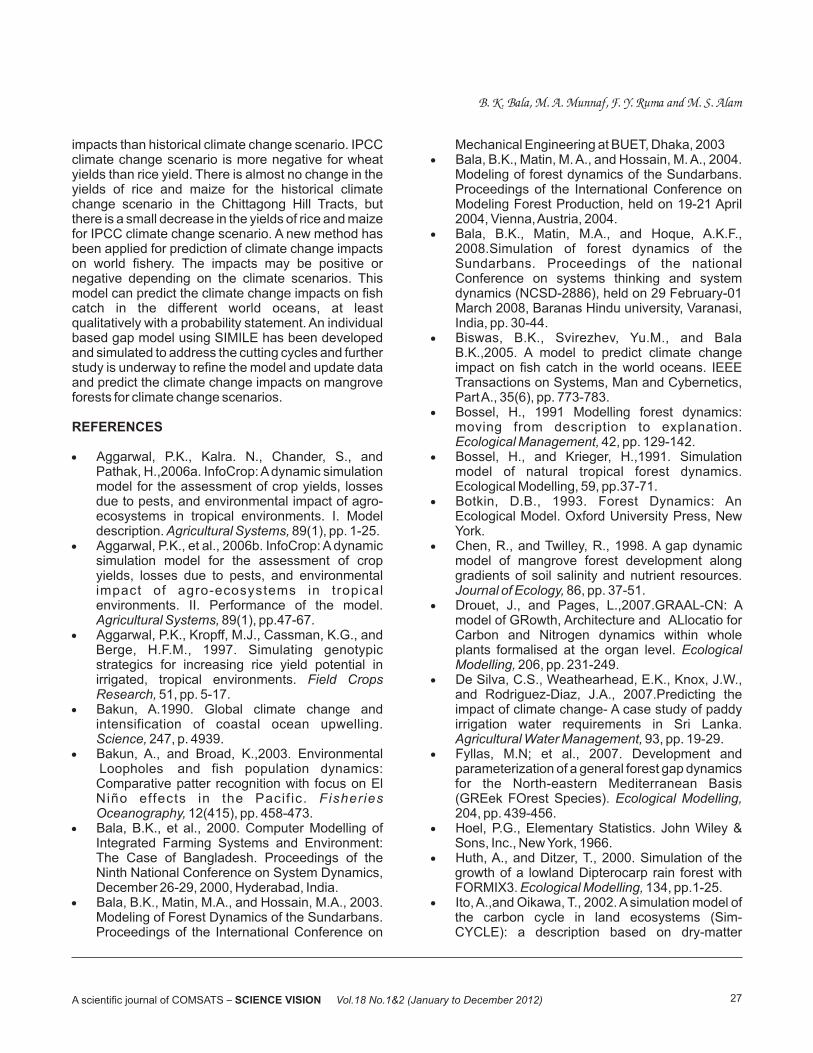
The model CLIMBER-2 (CLIMate-BiospheRE model),developed by Petoukhov, et al. (1998) is applied forprediction of the future temperature changes. Thefuture temperature differences of every 10-yearinterval are taken from the CLIMBER-2 SimulatedSea Surface Temperature Anomalies 2000-2100 forthe Indian Ocean and these differences also increasefor every interval. From these data, the future averageof Indian Ocean are calculated. The predictedtemperature and u(t)-values from the years 2000-2100 are shown in Figure-7. Figure-7(b) shows thatthe u(t)-values for the eastern part of the Indian Oceandecreases with time from positive to negative values,and the u(t) values for the western part of the IndianOcean also decreases with time (totally negativevalues). This means that the global climate change willnegatively influence fish catch in the Indian Oceanfrom the year 2005 to 2100 and also the influence of
A scientific journal of COMSATS – SCIENCE VISION Vol.18 No.1&2 (January to December 2012)
Figure-6(a): Temperature Changes in the Westernand Eastern Parts of the Indian Ocean.
Figure 6(b). Fish Catch in the Western andEastern Parts of the Indian Ocean.
B. K. Bala, M. A. Munnaf, F. Y. Ruma and M. S. Alam
Figure-5(a): Changes in the Yields of Ricefor Historical and IPCC Climate Scenarios
Figure-5(b): Changes in the Yields of Maize forHistorical and IPCC Climate Scenarios
26
climate change will be negative for the western part ofthe Indian Ocean, from the year 2000 to 2005.
Validation of a model is a process by which confidencein the model is to be developed for some particularpurpose. In this statistical forecasting model thepredictor power is the probability with which theprediction is made. The total climate change impactson fish catch in the Indian Ocean is negative and thepredictor power is 94.14 % for eastern part and 98.59% for the western part.
Simulated total bole volumes of pioneer, intermediateand climax tree species for logging cycle of 16 yearswith time are shown in Figure-8. The first logging ispracticed after the forest reached a steady statecondition. For the undisturbed forest growth model,the pioneer tree species (Keora) disappears after a
3.3 Forest Growth Model
certain period due to competition with climax andintermediate tree species, but after a loggingoperation it reappears. If the logging operationcontinues at a certain interval, the pioneer speciesnever disappear. The maximum volume of the climaxtree species for undisturbed model is 320 m /ha but for16 years logging cycle it cannot reach its maximumvolume, rather the volume changes in cyclical mannerwith a mean volume of 195 m /ha, while a maximumvolume is 275 m /ha.
InfoCrop model based on radiation energy useefficiency in photosynthesis was used to simulate cropgrowth and to predict climate change impacts on rice,wheat and maize yields. Historical climate changescenario has little or no negative impacts on rice andwheat yields in Mymensingh and Dinajpur, howeverIPCC climate change scenario has higher negative
3
3
3
4. CONCLUSIONS
A scientific journal of COMSATS – SCIENCE VISION Vol.18 No.1&2 (January to December 2012)
Figure-7(a): Predicted Temperature in the Western andEastern Parts of the Indian Ocean.
Figure 7(b): Predicted u(t)-values in the Westernand Eastern parts of the Whole Indian Ocean.
Figure-8: Simulation results For the Development of Volume ofMangrove Forests for 16 Years Logging Cycle.
Modeling of Climate Change Impacts onAgriculture, Forestry and Fishery
27
impacts than historical climate change scenario. IPCCclimate change scenario is more negative for wheatyields than rice yield. There is almost no change in theyields of rice and maize for the historical climatechange scenario in the Chittagong , butthere is a small decrease in the yields of rice and maizefor IPCC climate change scenario. A new method hasbeen applied for prediction of climate change impactson world fishery. The impacts may be positive ornegative depending on the climate scenarios. Thismodel can predict the climate change impacts on fishcatch in the different world oceans, at leastqualitatively with a probability statement. An individualbased gap model using SIMILE has been developedand simulated to address the cutting cycles and furtherstudy is underway to refine the model and update dataand predict the climate change impacts on mangroveforests for climate change scenarios.
Aggarwal, P.K., Kalra. N., Chander, S., andPathak, H.,2006a. InfoCrop:Adynamic simulationmodel for the assessment of crop yields, lossesdue to pests, and environmental impact of agro-ecosystems in tropical environments. I. Modeldescription. 89(1), pp. 1-25.Aggarwal, P.K., et al., 2006b. InfoCrop: A dynamicsimulation model for the assessment of cropyields, losses due to pests, and environmentalimpact of agro-ecosystems in tropicalenvironments. II. Performance of the model.
89(1), pp.47-67.Aggarwal, P.K., Kropff, M.J., Cassman, K.G., andBerge, H.F.M., 1997. Simulating genotypicstrategics for increasing rice yield potential inirrigated, tropical environments.
51, pp. 5-17.Bakun, A.1990. Global climate change andintensification of coastal ocean upwelling.
247, p. 4939.Bakun, A., and Broad, K.,2003. EnvironmentalLoopholes and fish population dynamics:Comparative patter recognition with focus on ElNiño effects in the Pacif ic.
12(415), pp. 458-473.Bala, B.K., et al., 2000. Computer Modelling ofIntegrated Farming Systems and Environment:The Case of Bangladesh. Proceedings of theNinth National Conference on System Dynamics,December 26-29, 2000, Hyderabad, India.Bala, B.K., Matin, M.A., and Hossain, M.A., 2003.Modeling of Forest Dynamics of the Sundarbans.Proceedings of the International Conference on
Hill Tracts
REFERENCES
�
�
�
�
�
�
�
Agricultural Systems,
Agricultural Systems,
Field CropsResearch,
Science,
FisheriesOceanography,
Mechanical Engineering at BUET, Dhaka, 2003Bala, B.K., Matin, M. A., and Hossain, M. A., 2004.Modeling of forest dynamics of the Sundarbans.Proceedings of the International Conference onModeling Forest Production, held on 19-21 April2004, Vienna,Austria, 2004.Bala, B.K., Matin, M.A., and Hoque, A.K.F.,2008.Simulation of forest dynamics of theSundarbans. Proceedings of the nationalConference on systems thinking and systemdynamics (NCSD-2886), held on 29 February-01March 2008, Baranas Hindu university, Varanasi,India, pp. 30-44.Biswas, B.K., Svirezhev, Yu.M., and BalaB.K.,2005. A model to predict climate changeimpact on fish catch in the world oceans. IEEETransactions on Systems, Man and Cybernetics,PartA., 35(6), pp. 773-783.Bossel, H., 1991 Modelling forest dynamics:moving from description to explanation.
42, pp. 129-142.Bossel, H., and Krieger, H.,1991. Simulationmodel of natural tropical forest dynamics.Ecological Modelling, 59, pp.37-71.Botkin, D.B., 1993. Forest Dynamics: AnEcological Model. Oxford University Press, NewYork.Chen, R., and Twilley, R., 1998. A gap dynamicmodel of mangrove forest development alonggradients of soil salinity and nutrient resources.
86, pp. 37-51.Drouet, J., and Pages, L.,2007.GRAAL-CN: Amodel of GRowth, Architecture and ALlocatio forCarbon and Nitrogen dynamics within wholeplants formalised at the organ level.
206, pp. 231-249.De Silva, C.S., Weathearhead, E.K., Knox, J.W.,and Rodriguez-Diaz, J.A., 2007.Predicting theimpact of climate change- A case study of paddyirrigation water requirements in Sri Lanka.
93, pp. 19-29.Fyllas, M.N; et al., 2007. Development andparameterization of a general forest gap dynamicsfor the North-eastern Mediterranean Basis(GREek FOrest Species).204, pp. 439-456.Hoel, P.G., Elementary Statistics. John Wiley &Sons, Inc., New York, 1966.Huth, A., and Ditzer, T., 2000. Simulation of thegrowth of a lowland Dipterocarp rain forest withFORMIX3. 134, pp.1-25.Ito, A.,and Oikawa, T., 2002. A simulation model ofthe carbon cycle in land ecosystems (Sim-CYCLE): a description based on dry-matter
�
�
�
�
�
�
�
�
�
�
�
�
�
Ecological Management,
Journal of Ecology,
EcologicalModelling,
Agricultural Water Management,
Ecological Modelling,
Ecological Modelling,
A scientific journal of COMSATS – SCIENCE VISION Vol.18 No.1&2 (January to December 2012)
B. K. Bala, M. A. Munnaf, F. Y. Ruma and M. S. Alam
28
production theory and plot-scale validation.151, pp. 143 176.
Klyashtorin, L.B., 1998. Long-term change andmain commercial fish production in the Atlanticand Pacific. 37 pp. 115-125.Köhler, P.,2000. Modeling anthropogenic impactson the growth of tropical rain forests using anindividual-oriented forest growth model foranalyses of logging and fragmentation in threecase studies. Ph.D Thesis, University of Kassel,Germany.Köhler, P., and Huth, A., 1998. The effect of treespecies grouping in tropical rain forest modelling -Simulation with the individual based modelFORMIND. 109(3), pp. 301-321.Köhler, P., and Huth, A.,2004. Simulating growthdynamics in South-east Asian rainforestthreatened by recruitment shortage and treeharvesting. 67., pp.95-117.Masera, O.R., et al., 2003. Modeling carbonsequestration in afforestation, agroforestry andforest management projects: the CO2FIX V.2approach. 164, pp. 177-199.Magrin, G. O., Travasso, M. I., and Rodriguez, G.R., 2005. Changes in climate and crop productionduring the 20th century in Argentina.
72, pp. 229-249.Mati, B. M.,2000. The influence of climate changeon maize production in the semi-humid-arid areasof Kenya. 46, pp.333-344.Meza, F. J., Silva, D., and Vigil, H., 2008. Climatechange impacts on irrigated maize production inMediterranean climates: Evaluation of doublecropping as an emerging adaptation alternative.
96(1); pp. 21-30.Orlowski,A., 2003. Influence of thermal conditionson biomass of fish in the Polish EEZ.
63, pp. 367-377.Pathak, H., and Wassmann, R.,2008. Quantitativeevaluation of climatic variability and risk for wheatyield in India. 93(1-2), pp.157-175.Petoukhov, V. et al., CLIMBER-2: A climaticsystem model of intermediate complexity. Part I:Model description and performance for presentclimate, PIK report No. 35, 1998.Phillips, D.P., et al., 2003. An individual-basedspatially explicit tree growth model for forests inEast Kalimantan (Indonesian Borneo).
159, pp. 1-26.Impacts on Bangladeshi Rice. Available online at:
Ecological Modeling,
Fisheries Research,
Ecological Modelling,
Climate Change,
Ecological Modelling,
ClimateChange,
Journal of Arid Environment,
Agricultural Systems,
FisheriesResearch,
Climatic Change,
EcologicalModelling,
�
�
�
�
�
�
�
�
�
�
�
�
�
http://siteresources.worldbank.org/EXTWAT/Resources/4602122-1213366294492/5106220-1234469721549/20.2_Modeling_the_impact_of_CC_on_Agriculturet.pdfSaseendrain, S. A., et al., 2000. Effects of climatechange on rice production in the tropical humidclimate of Kerala, India. 44, pp.495-514.Shugart, H. H., 1984. A Theory of ForestDynamics: The Ecological Implications of ForestSuccession Models. Springer Verlag, New York.Tian, Y;Akamine, T; and Suda, M. Variations in theabundance of Pacific Saury (Colobasis saira) fromthe Northwestern Pacific in relation to oceanic-climate changes. 60; 2003,439-454.Tietjen, B., and Huth, A., 2006. Modellingdynamics of managed tropical rainforests - Anaggregated approach. 199,pp. 421-432.Wallman, P., et al., 2004. ForSAFE An integratedprocess-oriented forest model for long-termsustainability assessments.
207, pp. 19-36.Yao, F., et al., 2007. Assessing the impact ofclimate change on rice yields in the main riceareas of China. 80, pp. 395-409.
�
�
�
�
�
�
Climate Change,
Fisheries Research,
Ecological Modelling,
Forest Ecology andManagement,
Climate Change,
A scientific journal of COMSATS – SCIENCE VISION Vol.18 No.1&2 (January to December 2012)
Modeling of Climate Change Impacts onAgriculture, Forestry and Fishery
Related Documents