HAL Id: hal-01452694 https://hal.inria.fr/hal-01452694 Submitted on 2 Feb 2017 HAL is a multi-disciplinary open access archive for the deposit and dissemination of sci- entific research documents, whether they are pub- lished or not. The documents may come from teaching and research institutions in France or abroad, or from public or private research centers. L’archive ouverte pluridisciplinaire HAL, est destinée au dépôt et à la diffusion de documents scientifiques de niveau recherche, publiés ou non, émanant des établissements d’enseignement et de recherche français ou étrangers, des laboratoires publics ou privés. Modeling Distributed Platforms from Application Traces for Realistic File Transfer Simulation Anchen Chai, Mohammad-Mahdi Bazm, Sorina Camarasu-Pop, Tristan Glatard, Hugues Benoit-Cattin, Frédéric Suter To cite this version: Anchen Chai, Mohammad-Mahdi Bazm, Sorina Camarasu-Pop, Tristan Glatard, Hugues Benoit- Cattin, et al.. Modeling Distributed Platforms from Application Traces for Realistic File Transfer Simulation. 17th IEEE/ACM International Symposium on Cluster, Cloud and Grid Computing., May 2017, Madrid, Spain. hal-01452694

Welcome message from author
This document is posted to help you gain knowledge. Please leave a comment to let me know what you think about it! Share it to your friends and learn new things together.
Transcript
HAL Id: hal-01452694https://hal.inria.fr/hal-01452694
Submitted on 2 Feb 2017
HAL is a multi-disciplinary open accessarchive for the deposit and dissemination of sci-entific research documents, whether they are pub-lished or not. The documents may come fromteaching and research institutions in France orabroad, or from public or private research centers.
L’archive ouverte pluridisciplinaire HAL, estdestinée au dépôt et à la diffusion de documentsscientifiques de niveau recherche, publiés ou non,émanant des établissements d’enseignement et derecherche français ou étrangers, des laboratoirespublics ou privés.
Modeling Distributed Platforms from ApplicationTraces for Realistic File Transfer Simulation
Anchen Chai, Mohammad-Mahdi Bazm, Sorina Camarasu-Pop, TristanGlatard, Hugues Benoit-Cattin, Frédéric Suter
To cite this version:Anchen Chai, Mohammad-Mahdi Bazm, Sorina Camarasu-Pop, Tristan Glatard, Hugues Benoit-Cattin, et al.. Modeling Distributed Platforms from Application Traces for Realistic File TransferSimulation. 17th IEEE/ACM International Symposium on Cluster, Cloud and Grid Computing.,May 2017, Madrid, Spain. �hal-01452694�
Modeling Distributed Platforms from Application Traces for
Realistic File Transfer Simulation
Anchen Chai1,2 Mohammad-Mahdi Bazm1,2 Sorina Camarasu-Pop1
Tristan Glatard4 Hugues Benoit-Cattin1 Frédéric Suter2,3
1 Université de Lyon, CREATIS,
CNRS UMR5220, Inserm U1044, INSA-Lyon, Université Lyon 12 IN2P3 Computing Center, CNRS
3 Inria Avalon project team4 Department of Computer Science and Software Engineering
Concordia University
Abstract
Simulation is a fast, controlled, and reproducible way to evaluate new algorithms for distributed
computing platforms in a variety of conditions. However, the realism of simulations is rarely assessed,
which critically questions the applicability of a whole range of �ndings.
In this paper, we present our e�orts to build platform models from application traces, to allow for
the accurate simulation of �le transfers across a distributed infrastructure. File transfers are key to
performance, as the variability of �le transfer times has important consequences on the data�ow of
the application. We present a methodology to build realistic platform models from application traces
and provide a quantitative evaluation of the accuracy of the derived simulations. Results show that
the proposed models are able to correctly capture real-life variability and signi�cantly outperform
the state-of-the-art model.
1 Introduction
Numerical simulation has become a critical tool to study distributed systems. Not only does it allowresearchers to quickly evaluate new algorithms in a variety of conditions with literally no cost, but it alsoenables reproducible experiments whereas real systems are hampered by various uncontrolled factors suchas background network tra�c, concurrent CPU usage, and hardware faults. Simulation also providesaccess to variables that could hardly be monitored in real systems, for instance network congestion.
Simulating application executions requires several components to complement the core simulationkernel. Simulators usually build on models of (i) the hardware platform, (ii) the software services deployedon the platform, e.g., schedulers, and (iii) the application itself, i.e., the workload characteristics. Eachaspect needs to be accurately validated since it may have a serious impact on the simulated performance.
In practice, however, the realism of simulations is rarely assessed, which critically questions theveracity of a whole range of �ndings derived from simulations. Even more importantly, studies suchas [21] have shown that widely-used simulation toolkits patently lack realism, in particular regarding theestimation of �le transfer times across the network.
Yet, �le transfers are critical to the performance of distributed applications. The variability of �letransfer times increases with the number of storage and computing sites, which has important conse-quences on the data�ow of the application. A subtle time di�erence in a �le transfer may delay a task,change the schedule of subsequent tasks in the application work�ow, impact the data storage policy, andeventually greatly a�ect the execution time. Therefore, �le transfers have a substantial impact on therealism of simulations.
This paper presents our e�orts to build platform models that accurately simulate �le transfers acrossa distributed infrastructure of computing and storage resources. It proposes a methodology to build
1
platform models from application traces and it provides a quantitative evaluation of the accuracy ofthe derived simulations. The methodology highlights and provides a detailed analysis of the phenomenainvolved in �le transfer simulation on large distributed systems.
We focus on the platform as de�ned in the SimGrid toolkit [9], which includes the compute nodesand the network links and routes. The network topology is an important part of the platform thatdescribes how resources are clustered into sites (called Autonomous Systems or ASes [3]) and how sitesare interconnected, possibly in a hierarchical way. The platform model also describes the resourceproperties, including their processing speed, network bandwidth and latency, or sharing policy. Othersimulation toolkits may have di�erent representations for platforms, but they usually include (i) a setof computation and communication resources and (ii) the network interconnection. OptorSim [2] andSimGrid use external text �les for the platform description while GridSim [5] de�nes the platform directlyin the code of the simulator.
We adopt a trace-based approach where platform models are built strictly from application logs,i.e., without requiring speci�c monitoring probes. Compared to invasive approaches such as networktomography [19], the trace-based approach might be less accurate but also easier to use on infrastructureswhere probing is not possible. Ultimately, we aim at replaying application traces as accurately as possiblein a simulated environment. In this paper, we rely on a corpus of traces extracted from the VirtualImaging Platform (VIP) [12], a web portal for medical image analysis and simulation.
The paper is organized as follows. In Section 2, we present the real system that we aim at simulating,the traces that will be used to de�ne the simulated platform, and the simulation framework we developedbased on the SimGrid toolkit. Section 3 presents the platform construction methodology, i.e., techniquesto estimate network bandwidths from application traces. Starting from a rough platform model thatrepresents the state of the art used in works such as [8], we present six successive improvements thatwe motivate through illustrative cases extracted from the trace corpus. Section 4 presents the �nalsimulation results that are evaluated against the state-of-the-art platform model. All the code anddata used in this article are available online, to allow readers and reviewers to reproduce and furtherinvestigate our results [10]. Section 5 presents related work on simulation, platform models, trace-basedapproaches, and simulation evaluation. Finally, Section 6 summarizes our �ndings and details our futurework.
2 Technical Context and Traces
2.1 Real System
Our target system is the distributed execution of an application submitted through the VIP portal.VIP gives access to several applications while completely hiding the underlying storage and computinginfrastructure. It leverages the resources of the Biomed Virtual Organization (VO) within the EuropeanGrid Infrastructure (EGI). This VO is supported by about 65 sites world-wide, o�ering a total of 130computing clusters and 5 PB of storage. The high variability of the static and dynamic characteristics ofthese heterogeneous resources scattered across multiple organizations makes it particularly challengingto build realistic models for such a system.
In this work, we focus on the GATE application [14], whose work�ow is described in Figure 1. In thecomputing phase, a set of independent workers: (1) download the input �les; (2) execute a single GATEjob each; and (3) upload partial results on a storage element (SE) upon completion. Once all the GATEjobs are completed, the work�ow enters a merging phase, where all the partial results are downloadedfrom di�erent SEs (4) and aggregated (5). The �nal result is then copied back to a SE (6). The dataexchanges between the tasks of the work�ow are �le-based and require transfers over the network andthrough SEs, since the worker nodes do not share a common �le system.
2.2 Execution Traces
We collected execution traces of 60 work�ow executions submitted by 14 distinct VIP users over a periodof one month. These work�ows are all di�erent in terms of software release used, input �les, number ofjobs, and execution times. However, they do not all match the current capabilities of our simulator [18],which assumes that all the partial results �les produced by the GATE jobs are downloaded by the Merge
2
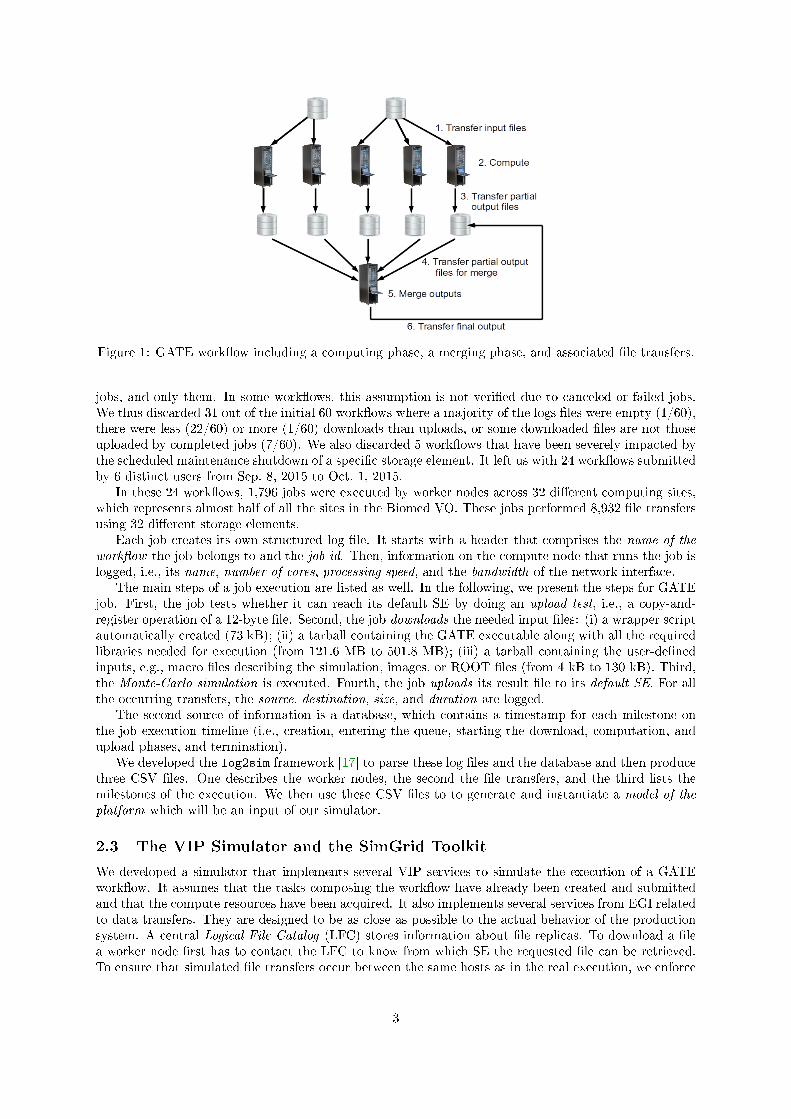
Figure 1: GATE work�ow including a computing phase, a merging phase, and associated �le transfers.
jobs, and only them. In some work�ows, this assumption is not veri�ed due to canceled or failed jobs.We thus discarded 31 out of the initial 60 work�ows where a majority of the logs �les were empty (1/60),there were less (22/60) or more (1/60) downloads than uploads, or some downloaded �les are not thoseuploaded by completed jobs (7/60). We also discarded 5 work�ows that have been severely impacted bythe scheduled maintenance shutdown of a speci�c storage element. It left us with 24 work�ows submittedby 6 distinct users from Sep. 8, 2015 to Oct. 1, 2015.
In these 24 work�ows, 1,796 jobs were executed by worker nodes across 32 di�erent computing sites,which represents almost half of all the sites in the Biomed VO. These jobs performed 8,932 �le transfersusing 32 di�erent storage elements.
Each job creates its own structured log �le. It starts with a header that comprises the name of thework�ow the job belongs to and the job id. Then, information on the compute node that runs the job islogged, i.e., its name, number of cores, processing speed, and the bandwidth of the network interface.
The main steps of a job execution are listed as well. In the following, we present the steps for GATEjob. First, the job tests whether it can reach its default SE by doing an upload test, i.e., a copy-and-register operation of a 12-byte �le. Second, the job downloads the needed input �les: (i) a wrapper scriptautomatically created (73 kB); (ii) a tarball containing the GATE executable along with all the requiredlibraries needed for execution (from 121.6 MB to 501.8 MB); (iii) a tarball containing the user-de�nedinputs, e.g., macro �les describing the simulation, images, or ROOT �les (from 4 kB to 130 kB). Third,the Monte-Carlo simulation is executed. Fourth, the job uploads its result �le to its default SE. For allthe occurring transfers, the source, destination, size, and duration are logged.
The second source of information is a database, which contains a timestamp for each milestone onthe job execution timeline (i.e., creation, entering the queue, starting the download, computation, andupload phases, and termination).
We developed the log2sim framework [17] to parse these log �les and the database and then producethree CSV �les. One describes the worker nodes, the second the �le transfers, and the third lists themilestones of the execution. We then use these CSV �les to to generate and instantiate a model of theplatform which will be an input of our simulator.
2.3 The VIP Simulator and the SimGrid Toolkit
We developed a simulator that implements several VIP services to simulate the execution of a GATEwork�ow. It assumes that the tasks composing the work�ow have already been created and submittedand that the compute resources have been acquired. It also implements several services from EGI relatedto data transfers. They are designed to be as close as possible to the actual behavior of the productionsystem. A central Logical File Catalog (LFC) stores information about �le replicas. To download a �lea worker node �rst has to contact the LFC to know from which SE the requested �le can be retrieved.To ensure that simulated �le transfers occur between the same hosts as in the real execution, we enforce
3
the use of the �le replica involved in the corresponding real transfers. Then the worker node contacts thetargeted SE to download the �le. Conversely, a worker uploads a �le to a SE and then noti�es the LFCto register its location. For all �le transfers, and based on an analysis of actual transfer durations, oursimulator models these interactions between the di�erent services by a 900ms delay that encompasses tothe cost of processing transfer requests and storage access latency in addition to the network latency.
This simulator is based on the SimGrid toolkit [9], that provides all the core functionalities for thesimulation of distributed applications in heterogeneous distributed environments. SimGrid relies fastand tractable �uid models, whose validity has been thoroughly assessed [21], to simulate network tra�cand ensures the realism of the simulated communication times. SimGrid also provides a scalable enginethat allows us to simulate large work�ows with many concurrent transfers on large infrastructures in areasonable time.
SimGrid usually requires a model of the platform as input, in our case the EGI infrastructure accessedthrough VIP. This model describes the characteristics of the compute (i.e., hosts with a certain numberof cores and processing speed) and network (i.e., links of a given bandwidth, latency, and contentionmodel) resources. It also describes how hosts are grouped (e.g., in clusters, data centers, . . . ) andinterconnected through a network topology. SimGrid formalism adopts a hierarchical organization basedon Autonomous Systems (ASes) similar to that of the Internet [3]. The correct instantiation of thisplatform model is key to simulation realism. To the best of our knowledge, there exists no full andfaithful description of EGI that has been built for simulation purposes.
3 Modeling Platforms from Execution Traces
In this section, we detail incremental improvements to the platform model to increase the accuracy of�le transfer simulation thanks to a thorough analysis of both trace contents and simulation results. Foreach improvement, we motivate and illustrate the impact of the proposed solution on a particular caseextracted from the traces.
3.1 Baseline Model
The quality of �le transfer simulation is mainly impacted by two main features of a platform model: theinterconnection topology and the instantiation of network link bandwidth. To de�ne a baseline for ourstudy, we consider a �rst platform model that only minimally relies on the execution traces for these twoimportant features. Nevertheless, the characteristics of the computing nodes (e.g., name or processingspeed) are extracted from the execution traces, as well as their hierarchical organization in clusters andsites.
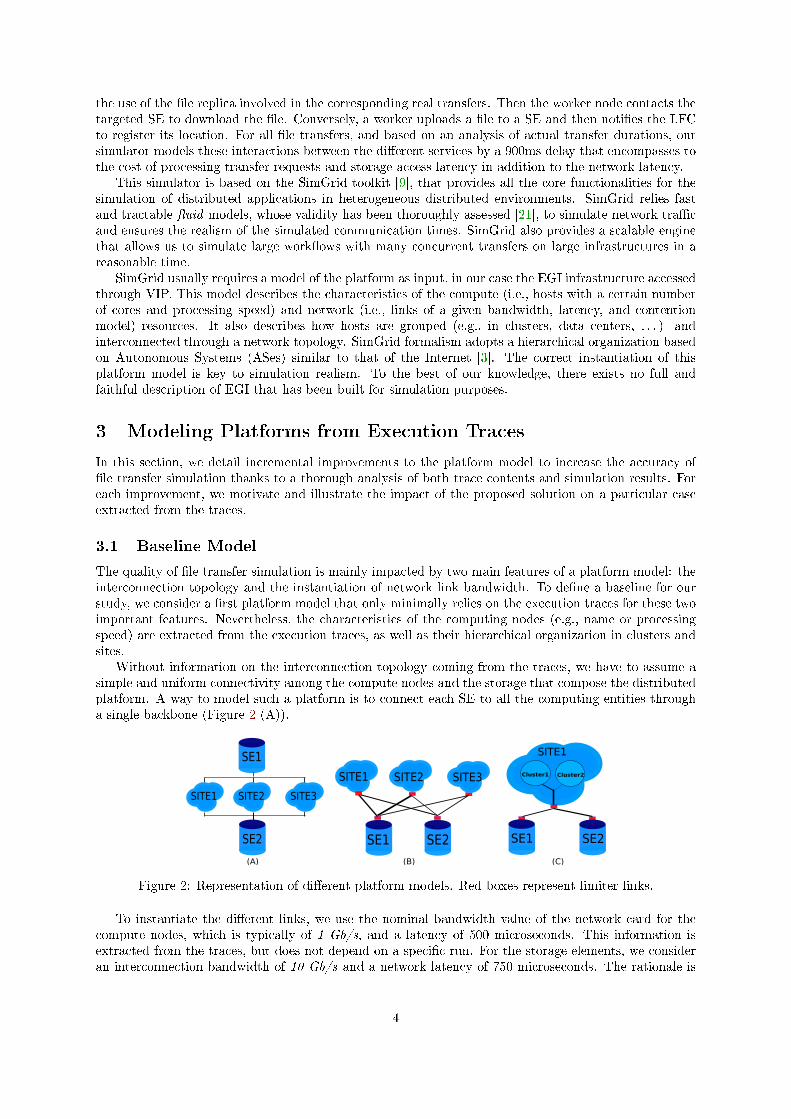
Without information on the interconnection topology coming from the traces, we have to assume asimple and uniform connectivity among the compute nodes and the storage that compose the distributedplatform. A way to model such a platform is to connect each SE to all the computing entities througha single backbone (Figure 2 (A)).
SITE2
SE1
SITE3SITE1
SE2
(A) (B) (C)
SE1
SITE1 SITE2 SITE3
SE2
SITE1
Cluster1 Cluster2
SE2SE1
Figure 2: Representation of di�erent platform models. Red boxes represent limiter links.
To instantiate the di�erent links, we use the nominal bandwidth value of the network card for thecompute nodes, which is typically of 1 Gb/s, and a latency of 500 microseconds. This information isextracted from the traces, but does not depend on a speci�c run. For the storage elements, we consideran interconnection bandwidth of 10 Gb/s and a network latency of 750 microseconds. The rationale is
4
●●●●●●●●●●●●●
●
●●
●
●
●
●●
●●
●●●●●
●
●●●●
●
●●
●
●●●
●●
●●●●●●●●●●
●
●●●●●●●●●●
●●
●●●●●●●●●
●
●●●●●●
●
●●●●●●●●●●
●
●●●
●
●
●
●
●
●
●
●
●
●
●
●
●
●
●
●●
●
●
●
●
●●
●
●
●
●●
●
●
●
●
●
●
●
●
●
●
●
●
●
●●
●
●
●
●●
●
●●
●
●●●
●
●●●
●
●
●
●
●●●●
●
●
●
●
●●●
●
●
●
●
●●
●
●●
●
●
●
●●●●●●●
●
●●●●●●●
●
●
Wrapper Release
1
2
3
4
5
0
50
100
150
200
0 25 50 75 100 0 25 50 75 100Jobs
Dur
atio
n (in
sec
onds
) ● Measured
Simulated
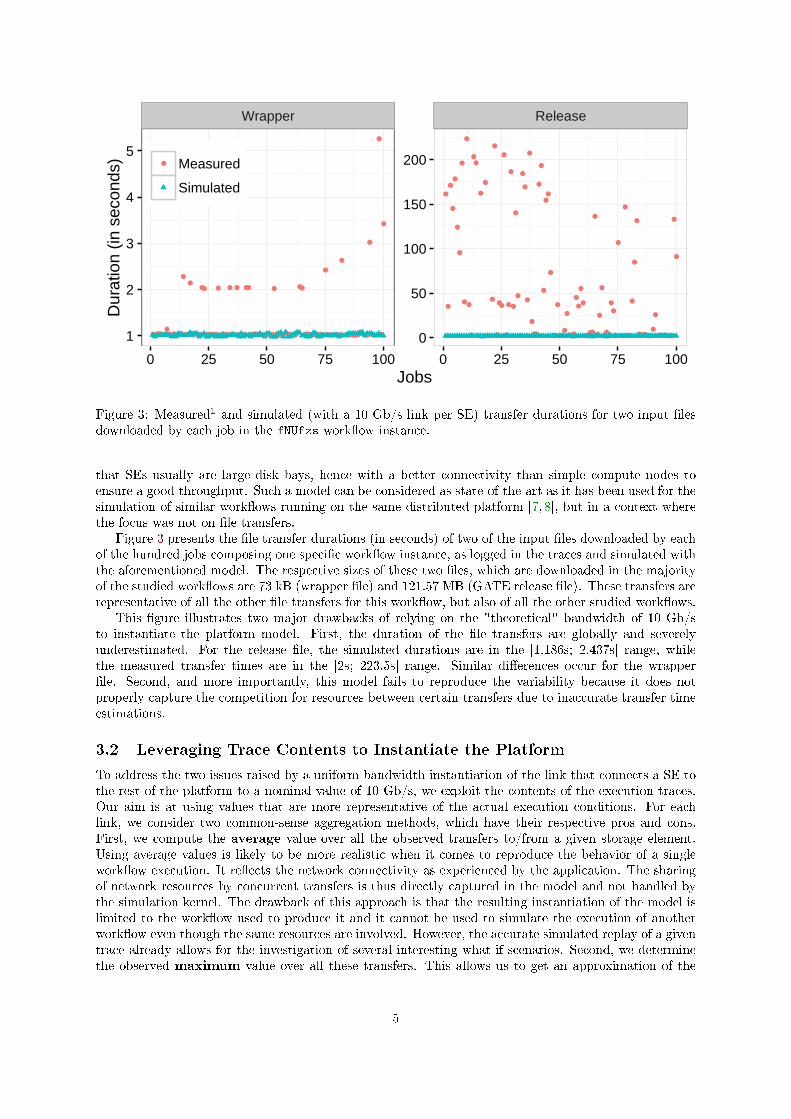
Figure 3: Measured1 and simulated (with a 10 Gb/s link per SE) transfer durations for two input �lesdownloaded by each job in the fNUfzs work�ow instance.
that SEs usually are large disk bays, hence with a better connectivity than simple compute nodes toensure a good throughput. Such a model can be considered as state-of-the-art as it has been used for thesimulation of similar work�ows running on the same distributed platform [7, 8], but in a context wherethe focus was not on �le transfers.
Figure 3 presents the �le transfer durations (in seconds) of two of the input �les downloaded by eachof the hundred jobs composing one speci�c work�ow instance, as logged in the traces and simulated withthe aforementioned model. The respective sizes of these two �les, which are downloaded in the majorityof the studied work�ows are 73 kB (wrapper �le) and 121.57 MB (GATE release �le). These transfers arerepresentative of all the other �le transfers for this work�ow, but also of all the other studied work�ows.
This �gure illustrates two major drawbacks of relying on the "theoretical" bandwidth of 10 Gb/sto instantiate the platform model. First, the duration of the �le transfers are globally and severelyunderestimated. For the release �le, the simulated durations are in the [1.186s; 2.437s] range, whilethe measured transfer times are in the [2s; 223.5s] range. Similar di�erences occur for the wrapper�le. Second, and more importantly, this model fails to reproduce the variability because it does notproperly capture the competition for resources between certain transfers due to inaccurate transfer timeestimations.
3.2 Leveraging Trace Contents to Instantiate the Platform
To address the two issues raised by a uniform bandwidth instantiation of the link that connects a SE tothe rest of the platform to a nominal value of 10 Gb/s, we exploit the contents of the execution traces.Our aim is at using values that are more representative of the actual execution conditions. For eachlink, we consider two common-sense aggregation methods, which have their respective pros and cons.First, we compute the average value over all the observed transfers to/from a given storage element.Using average values is likely to be more realistic when it comes to reproduce the behavior of a singlework�ow execution. It re�ects the network connectivity as experienced by the application. The sharingof network resources by concurrent transfers is thus directly captured in the model and not handled bythe simulation kernel. The drawback of this approach is that the resulting instantiation of the model islimited to the work�ow used to produce it and it cannot be used to simulate the execution of anotherwork�ow even though the same resources are involved. However, the accurate simulated replay of a giventrace already allows for the investigation of several interesting what-if scenarios. Second, we determinethe observed maximum value over all these transfers. This allows us to get an approximation of the
5
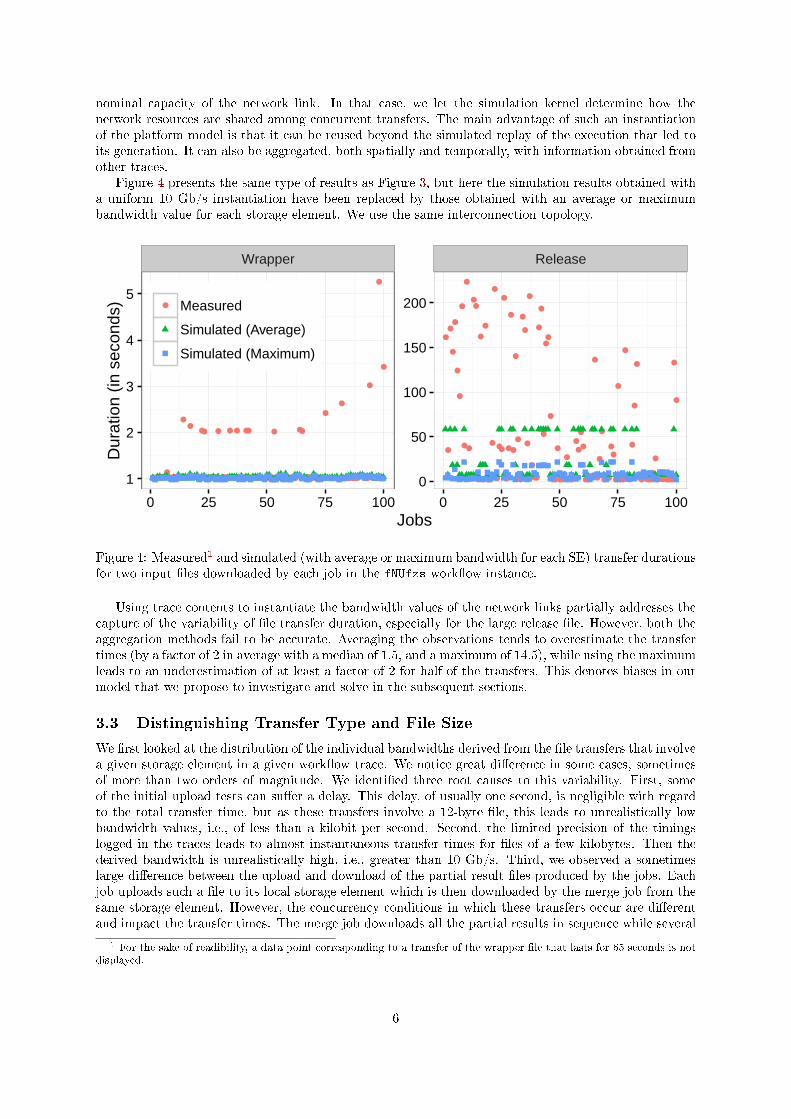
nominal capacity of the network link. In that case, we let the simulation kernel determine how thenetwork resources are shared among concurrent transfers. The main advantage of such an instantiationof the platform model is that it can be reused beyond the simulated replay of the execution that led toits generation. It can also be aggregated, both spatially and temporally, with information obtained fromother traces.
Figure 4 presents the same type of results as Figure 3, but here the simulation results obtained witha uniform 10 Gb/s instantiation have been replaced by those obtained with an average or maximumbandwidth value for each storage element. We use the same interconnection topology.
●●●●●●●●●●●●●
●
●●
●
●
●
●●
●●
●●●●●
●
●●●●
●
●●
●
●●●
●●
●●●●●●●●●●
●
●●●●●●●●●●
●●
●●●●●●●●●
●
●●●●●●
●
●●●●●●●●●●
●
●●●
●
●
●
●
●
●
●
●
●
●
●
●
●
●
●
●●
●
●
●
●
●●
●
●
●
●●
●
●
●
●
●
●
●
●
●
●
●
●
●
●●
●
●
●
●●
●
●●
●
●●●
●
●●●
●●
●
●
●●●●
●
●
●
●
●●●
●●
●
●
●●
●
●●
●
●
●
●●●●●●●
●
●●●●●●●
●
●
Wrapper Release
1
2
3
4
5
0
50
100
150
200
0 25 50 75 100 0 25 50 75 100Jobs
Dur
atio
n (in
sec
onds
) ● Measured
Simulated (Average)
Simulated (Maximum)
Figure 4: Measured1 and simulated (with average or maximum bandwidth for each SE) transfer durationsfor two input �les downloaded by each job in the fNUfzs work�ow instance.
Using trace contents to instantiate the bandwidth values of the network links partially addresses thecapture of the variability of �le transfer duration, especially for the large release �le. However, both theaggregation methods fail to be accurate. Averaging the observations tends to overestimate the transfertimes (by a factor of 2 in average with a median of 1.5, and a maximum of 14.5), while using the maximumleads to an underestimation of at least a factor of 2 for half of the transfers. This denotes biases in ourmodel that we propose to investigate and solve in the subsequent sections.
3.3 Distinguishing Transfer Type and File Size
We �rst looked at the distribution of the individual bandwidths derived from the �le transfers that involvea given storage element in a given work�ow trace. We notice great di�erence in some cases, sometimesof more than two orders of magnitude. We identi�ed three root causes to this variability. First, someof the initial upload tests can su�er a delay. This delay, of usually one second, is negligible with regardto the total transfer time, but as these transfers involve a 12-byte �le, this leads to unrealistically lowbandwidth values, i.e., of less than a kilobit per second. Second, the limited precision of the timingslogged in the traces leads to almost instantaneous transfer times for �les of a few kilobytes. Then thederived bandwidth is unrealistically high, i.e., greater than 10 Gb/s. Third, we observed a sometimeslarge di�erence between the upload and download of the partial result �les produced by the jobs. Eachjob uploads such a �le to its local storage element which is then downloaded by the merge job from thesame storage element. However, the concurrency conditions in which these transfers occur are di�erentand impact the transfer times. The merge job downloads all the partial results in sequence while several
1 For the sake of readibility, a data point corresponding to a transfer of the wrapper �le that lasts for 65 seconds is not
displayed.
6
worker nodes can upload their �les to the same storage element simultaneously. Consequently, dependingon the direction of the transfer, i.e., to or from a given SE, the derived bandwidth may greatly di�er.
All these observations are likely to negatively impact the computation of the average or maximumbandwidth of the link connecting a storage element to the rest of the platform.
To address these issues, we propose to group the transfers by type (i.e., upload test, each of the threeinput �les, and both upload and download of partial result �les) and direction (i.e., to or from a storageelement) before computing the average and maximum bandwidth values. Bandwidth estimations arethen performed based on speci�c types for which the measured �le transfer durations are assumed morereliable. For transfers from a storage element, we favor that of the release �le, whose larger size preventsto be hit by the timing precision. Similarly, for transfers to a storage element, upload of partial resultsis preferred over the more sensitive initial upload test.
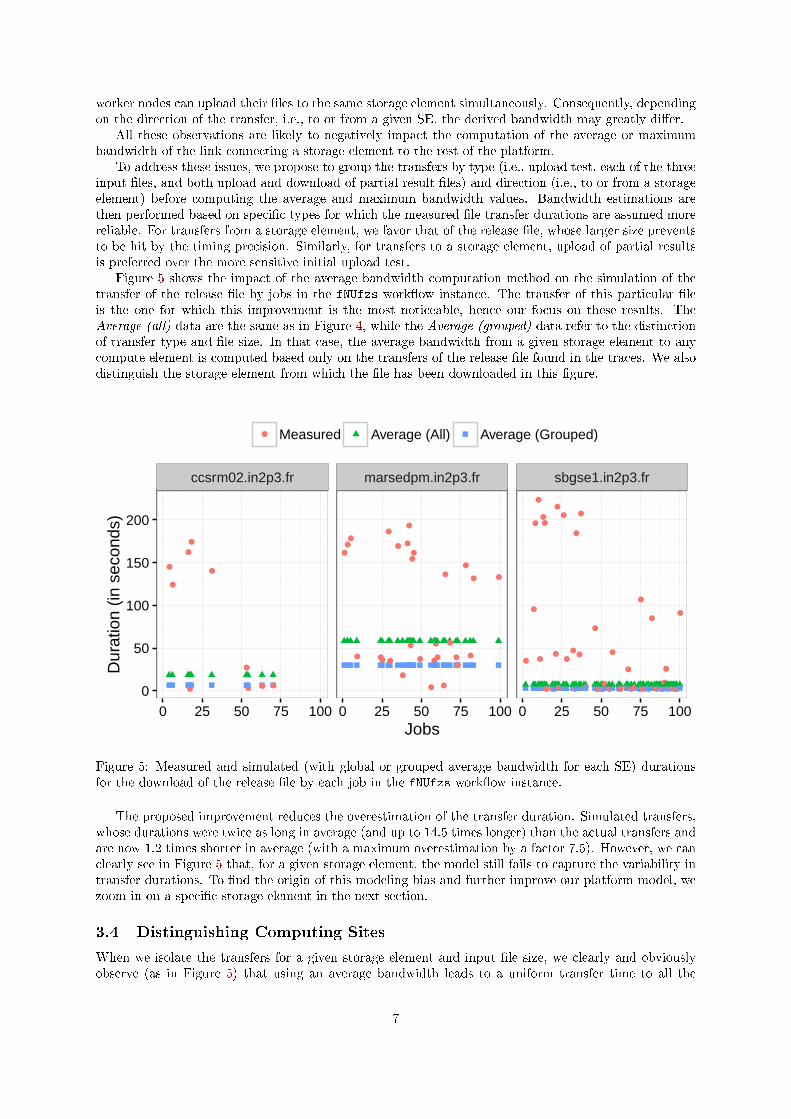
Figure 5 shows the impact of the average bandwidth computation method on the simulation of thetransfer of the release �le by jobs in the fNUfzs work�ow instance. The transfer of this particular �leis the one for which this improvement is the most noticeable, hence our focus on these results. TheAverage (all) data are the same as in Figure 4, while the Average (grouped) data refer to the distinctionof transfer type and �le size. In that case, the average bandwidth from a given storage element to anycompute element is computed based only on the transfers of the release �le found in the traces. We alsodistinguish the storage element from which the �le has been downloaded in this �gure.
●
●
●
●
●
●
●
● ● ●
●●●
● ●●
●
●
●
●
●
●
●
●●
●
●
●
●
●
●
●
●
●●
●
●
● ●
●
●
●
●
●
●
●●
●●●
●
●
●
●
●
●●
●
●
●
●
●●
●
●●●●●
●
●
●●●
●
●●●
●
●●●●
●
●●●●●●●
●
●●●●●●●
●
ccsrm02.in2p3.fr marsedpm.in2p3.fr sbgse1.in2p3.fr
0
50
100
150
200
0 25 50 75 100 0 25 50 75 100 0 25 50 75 100Jobs
Dur
atio
n (in
sec
onds
)
● Measured Average (All) Average (Grouped)
Figure 5: Measured and simulated (with global or grouped average bandwidth for each SE) durationsfor the download of the release �le by each job in the fNUfzs work�ow instance.
The proposed improvement reduces the overestimation of the transfer duration. Simulated transfers,whose durations were twice as long in average (and up to 14.5 times longer) than the actual transfers andare now 1.2 times shorter in average (with a maximum overestimation by a factor 7.5). However, we canclearly see in Figure 5 that, for a given storage element, the model still fails to capture the variability intransfer durations. To �nd the origin of this modeling bias and further improve our platform model, wezoom in on a speci�c storage element in the next section.
3.4 Distinguishing Computing Sites
When we isolate the transfers for a given storage element and input �le size, we clearly and obviouslyobserve (as in Figure 5) that using an average bandwidth leads to a uniform transfer time to all the
7
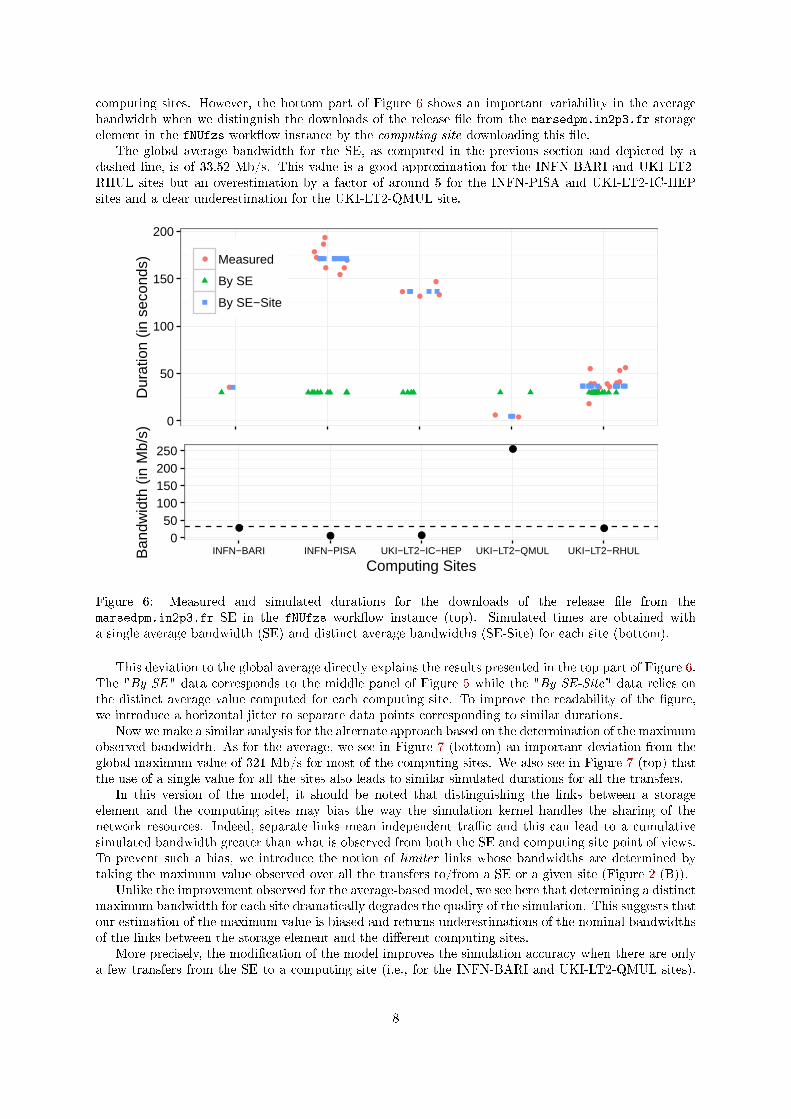
computing sites. However, the bottom part of Figure 6 shows an important variability in the averagebandwidth when we distinguish the downloads of the release �le from the marsedpm.in2p3.fr storageelement in the fNUfzs work�ow instance by the computing site downloading this �le.
The global average bandwidth for the SE, as computed in the previous section and depicted by adashed line, is of 33.52 Mb/s. This value is a good approximation for the INFN-BARI and UKI-LT2-RHUL sites but an overestimation by a factor of around 5 for the INFN-PISA and UKI-LT2-IC-HEPsites and a clear underestimation for the UKI-LT2-QMUL site.
●
●●
●●●
●
●
●
●
●
●
●
●●
●
●
●
●
●
●
●
●
●
●
●
●
● ●
0
50
100
150
200
Dur
atio
n (in
sec
onds
) ● Measured
By SE
By SE−Site
●● ●
●
●
0 50
100 150 200 250
INFN−BARI INFN−PISA UKI−LT2−IC−HEP UKI−LT2−QMUL UKI−LT2−RHUL
Computing Sites
Ban
dwid
th (
in M
b/s)
Figure 6: Measured and simulated durations for the downloads of the release �le from themarsedpm.in2p3.fr SE in the fNUfzs work�ow instance (top). Simulated times are obtained witha single average bandwidth (SE) and distinct average bandwidths (SE-Site) for each site (bottom).
This deviation to the global average directly explains the results presented in the top part of Figure 6.The "By SE" data corresponds to the middle panel of Figure 5 while the "By SE-Site" data relies onthe distinct average value computed for each computing site. To improve the readability of the �gure,we introduce a horizontal jitter to separate data points corresponding to similar durations.
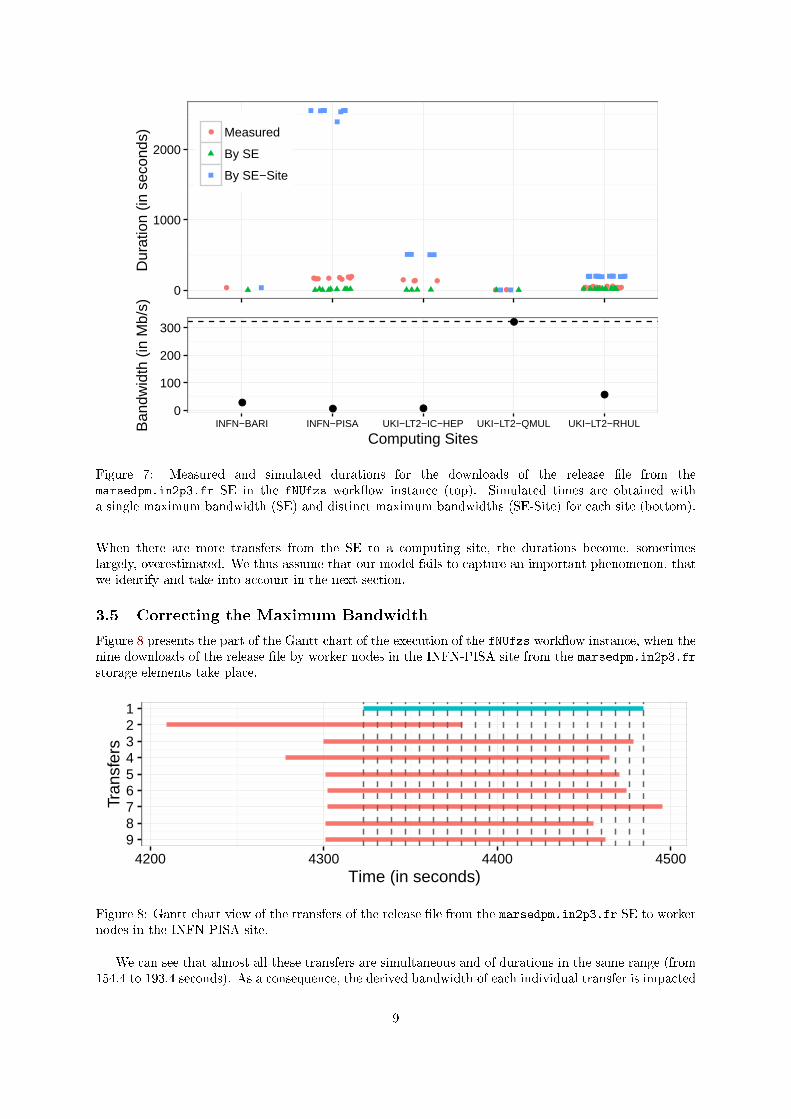
Now we make a similar analysis for the alternate approach based on the determination of the maximumobserved bandwidth. As for the average, we see in Figure 7 (bottom) an important deviation from theglobal maximum value of 321 Mb/s for most of the computing sites. We also see in Figure 7 (top) thatthe use of a single value for all the sites also leads to similar simulated durations for all the transfers.
In this version of the model, it should be noted that distinguishing the links between a storageelement and the computing sites may bias the way the simulation kernel handles the sharing of thenetwork resources. Indeed, separate links mean independent tra�c and this can lead to a cumulativesimulated bandwidth greater than what is observed from both the SE and computing site point of views.To prevent such a bias, we introduce the notion of limiter links whose bandwidths are determined bytaking the maximum value observed over all the transfers to/from a SE or a given site (Figure 2 (B)).
Unlike the improvement observed for the average-based model, we see here that determining a distinctmaximum bandwidth for each site dramatically degrades the quality of the simulation. This suggests thatour estimation of the maximum value is biased and returns underestimations of the nominal bandwidthsof the links between the storage element and the di�erent computing sites.
More precisely, the modi�cation of the model improves the simulation accuracy when there are onlya few transfers from the SE to a computing site (i.e., for the INFN-BARI and UKI-LT2-QMUL sites).
8
●● ●
● ●●
●
●
●
●
●●
●●●
●●● ● ●●
●●● ●
●●
● ●
0
1000
2000D
urat
ion
(in s
econ
ds) ● Measured
By SE
By SE−Site
●● ●
●
●
0
100
200
300
INFN−BARI INFN−PISA UKI−LT2−IC−HEP UKI−LT2−QMUL UKI−LT2−RHUL
Computing Sites
Ban
dwid
th (
in M
b/s)
Figure 7: Measured and simulated durations for the downloads of the release �le from themarsedpm.in2p3.fr SE in the fNUfzs work�ow instance (top). Simulated times are obtained witha single maximum bandwidth (SE) and distinct maximum bandwidths (SE-Site) for each site (bottom).
When there are more transfers from the SE to a computing site, the durations become, sometimeslargely, overestimated. We thus assume that our model fails to capture an important phenomenon, thatwe identify and take into account in the next section.
3.5 Correcting the Maximum Bandwidth
Figure 8 presents the part of the Gantt chart of the execution of the fNUfzs work�ow instance, when thenine downloads of the release �le by worker nodes in the INFN-PISA site from the marsedpm.in2p3.frstorage elements take place.
123456789
4200 4300 4400 4500Time (in seconds)
Tran
sfer
s
Figure 8: Gantt chart view of the transfers of the release �le from the marsedpm.in2p3.fr SE to workernodes in the INFN-PISA site.
We can see that almost all these transfers are simultaneous and of durations in the same range (from154.4 to 193.4 seconds). As a consequence, the derived bandwidth of each individual transfer is impacted
9
by the competition with the other transfers for a single shared network resource. In other words, theobserved bandwidths correspond to the shares of the link capacity that are respectively allocated to eachtransfer, but they do not re�ect the total capacity of the link itself.
To get a better estimate of the nominal capacity of the link, we thus have to �rst compute a correctingfactor to the bandwidth derived from each transfer. The computation of this factor, during the generationof the platform model, somehow corresponds to the inverse of the computation made by the simulationkernel to assign a share of the network resource to a given transfer. We proceed as follows. First wesample the duration of the transfer in at most 50 uniform intervals. For instance, in Figure 8, we split the�rst transfer (in blue) in 20 intervals. For each of them, we estimate the number of concurrent transfers,hence how the network resource is shared. The �rst transfer will thus have only one ninth of the capacityof the link for the seven �rst interval but one third of it during the last interval. Then we compute thecorrecting factor as:
f =n∑n
i=11ci
, (1)
where n is the number of intervals, and ci the number of concurrent transfers in the ith interval. In ourexample, we obtain a correcting factor of 20/(7/8+10/7+1/6+1/4+1/2) = 6.21 for the �rst transfer.
For each transfer, we compute three di�erent correcting factors by estimating the concurrency foreach SE, each site and each (SE, Site) couple. This allows us to correct the instantiation of the linkbetween a SE and a site and of the limiter links.
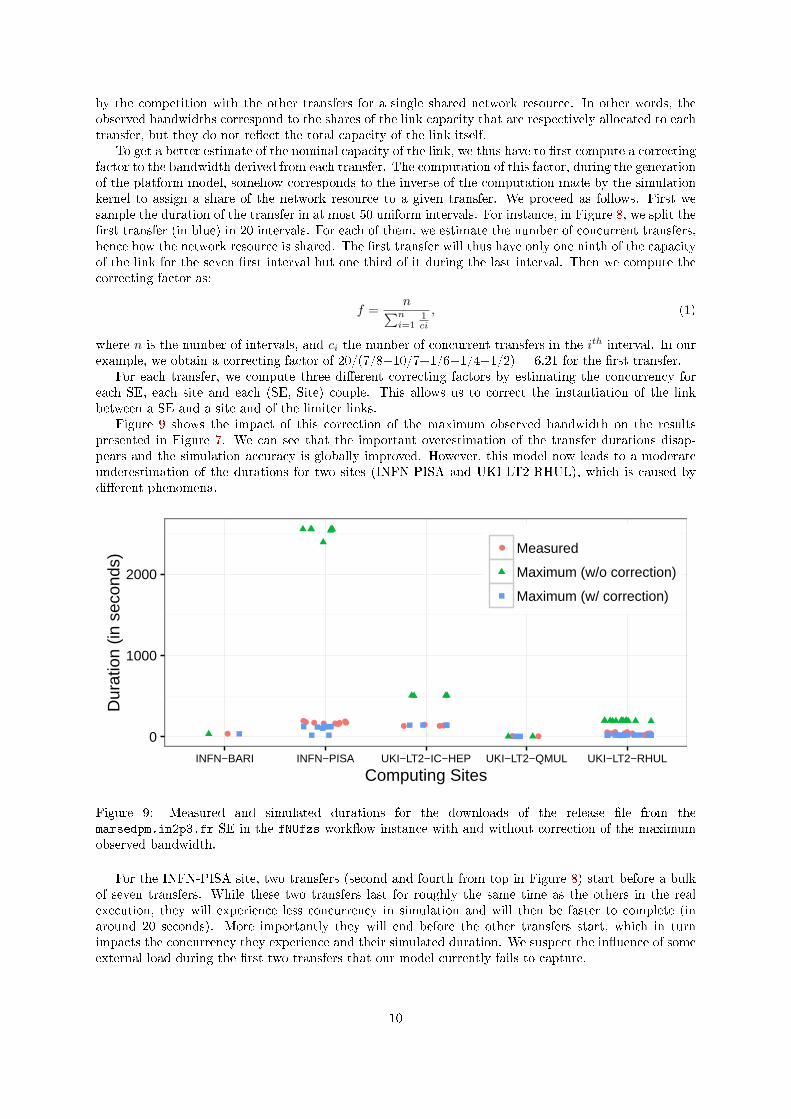
Figure 9 shows the impact of this correction of the maximum observed bandwidth on the resultspresented in Figure 7. We can see that the important overestimation of the transfer durations disap-pears and the simulation accuracy is globally improved. However, this model now leads to a moderateunderestimation of the durations for two sites (INFN-PISA and UKI-LT2-RHUL), which is caused bydi�erent phenomena.
●●●
● ●●
●
●
●
●
●●
●●●
●●● ●●●
●●● ●
●●
● ●
0
1000
2000
INFN−BARI INFN−PISA UKI−LT2−IC−HEP UKI−LT2−QMUL UKI−LT2−RHUL
Computing Sites
Dur
atio
n (in
sec
onds
) ● Measured
Maximum (w/o correction)
Maximum (w/ correction)
Figure 9: Measured and simulated durations for the downloads of the release �le from themarsedpm.in2p3.fr SE in the fNUfzs work�ow instance with and without correction of the maximumobserved bandwidth.
For the INFN-PISA site, two transfers (second and fourth from top in Figure 8) start before a bulkof seven transfers. While these two transfers last for roughly the same time as the others in the realexecution, they will experience less concurrency in simulation and will then be faster to complete (inaround 20 seconds). More importantly they will end before the other transfers start, which in turnimpacts the concurrency they experience and their simulated duration. We suspect the in�uence of someexternal load during the �rst two transfers that our model currently fails to capture.
10
For the UKI-LT2-RHUL site, we observed that the transfer durations di�er depending on whichcluster in the site is involved. We propose to illustrate and address this phenomenon in the next sectionusing a more glaring example.
3.6 Distinguishing Clusters in Sites
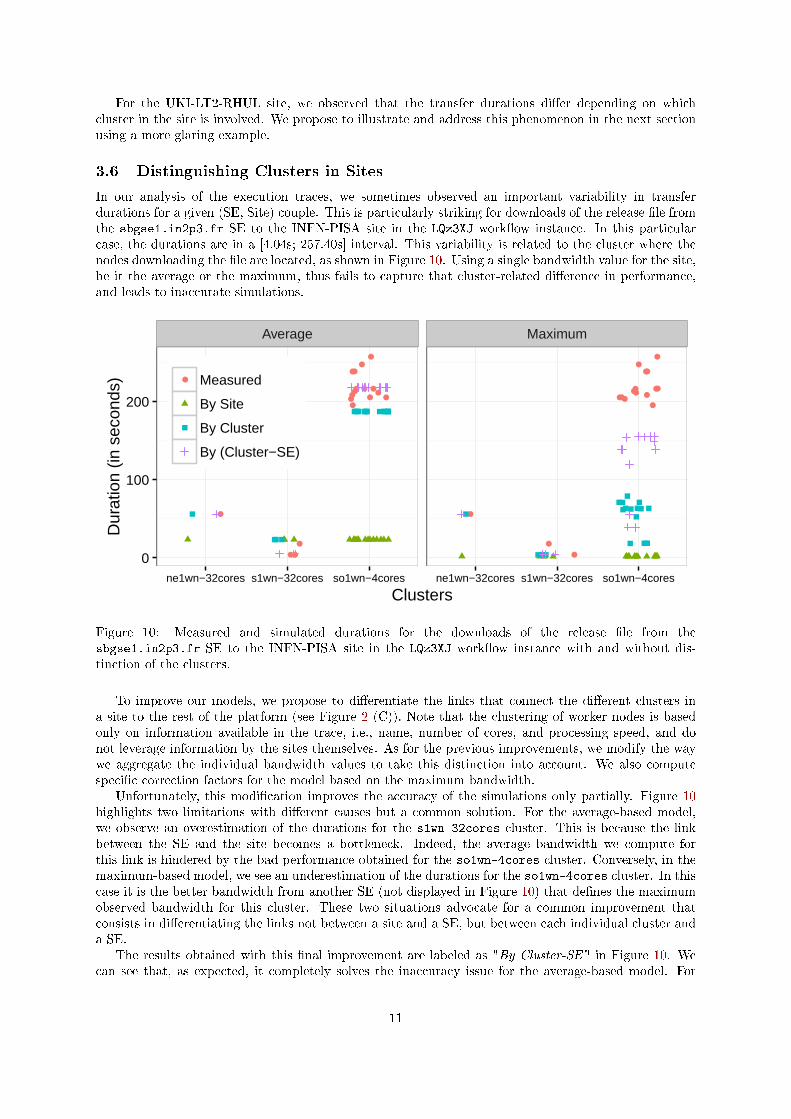
In our analysis of the execution traces, we sometimes observed an important variability in transferdurations for a given (SE, Site) couple. This is particularly striking for downloads of the release �le fromthe sbgse1.in2p3.fr SE to the INFN-PISA site in the LQz3XJ work�ow instance. In this particularcase, the durations are in a [4.04s; 257.40s] interval. This variability is related to the cluster where thenodes downloading the �le are located, as shown in Figure 10. Using a single bandwidth value for the site,be it the average or the maximum, thus fails to capture that cluster-related di�erence in performance,and leads to inaccurate simulations.
●
●●
●
●
●
● ●
●
●
●
●
● ●
●
●
●
●
●
●●
●
●
●
●●
●
●
●
●
●●
●
●
●
●
Average Maximum
0
100
200
ne1wn−32cores s1wn−32cores so1wn−4cores ne1wn−32cores s1wn−32cores so1wn−4cores
Clusters
Dur
atio
n (in
sec
onds
) ● Measured
By Site
By Cluster
By (Cluster−SE)
Figure 10: Measured and simulated durations for the downloads of the release �le from thesbgse1.in2p3.fr SE to the INFN-PISA site in the LQz3XJ work�ow instance with and without dis-tinction of the clusters.
To improve our models, we propose to di�erentiate the links that connect the di�erent clusters ina site to the rest of the platform (see Figure 2 (C)). Note that the clustering of worker nodes is basedonly on information available in the trace, i.e., name, number of cores, and processing speed, and donot leverage information by the sites themselves. As for the previous improvements, we modify the waywe aggregate the individual bandwidth values to take this distinction into account. We also computespeci�c correction factors for the model based on the maximum bandwidth.
Unfortunately, this modi�cation improves the accuracy of the simulations only partially. Figure 10highlights two limitations with di�erent causes but a common solution. For the average-based model,we observe an overestimation of the durations for the s1wn-32cores cluster. This is because the linkbetween the SE and the site becomes a bottleneck. Indeed, the average bandwidth we compute forthis link is hindered by the bad performance obtained for the so1wn-4cores cluster. Conversely, in themaximum-based model, we see an underestimation of the durations for the so1wn-4cores cluster. In thiscase it is the better bandwidth from another SE (not displayed in Figure 10) that de�nes the maximumobserved bandwidth for this cluster. These two situations advocate for a common improvement thatconsists in di�erentiating the links not between a site and a SE, but between each individual cluster anda SE.
The results obtained with this �nal improvement are labeled as "By Cluster-SE" in Figure 10. Wecan see that, as expected, it completely solves the inaccuracy issue for the average-based model. For
11
the maximum-based model, the proposed distinction improves the accuracy only partially. This can beexplained, as in the previous section, by some abnormally long transfers in the real execution that havea shorter simulated duration which in turn modi�es the level of concurrency on the network resource.We can see three such transfers in Figure 10.
4 Experimental Evaluation
In this section we evaluate our improved platform models by confronting simulation results obtainedusing these models to other simulation results using the state-of-the-art model presented in Section 3.1and to the reference given by the real transfer durations extracted from traces. Then we provide ananalysis of the causes of the main simulation inacurracies.
4.1 Analysis of Simulated Transfer Durations
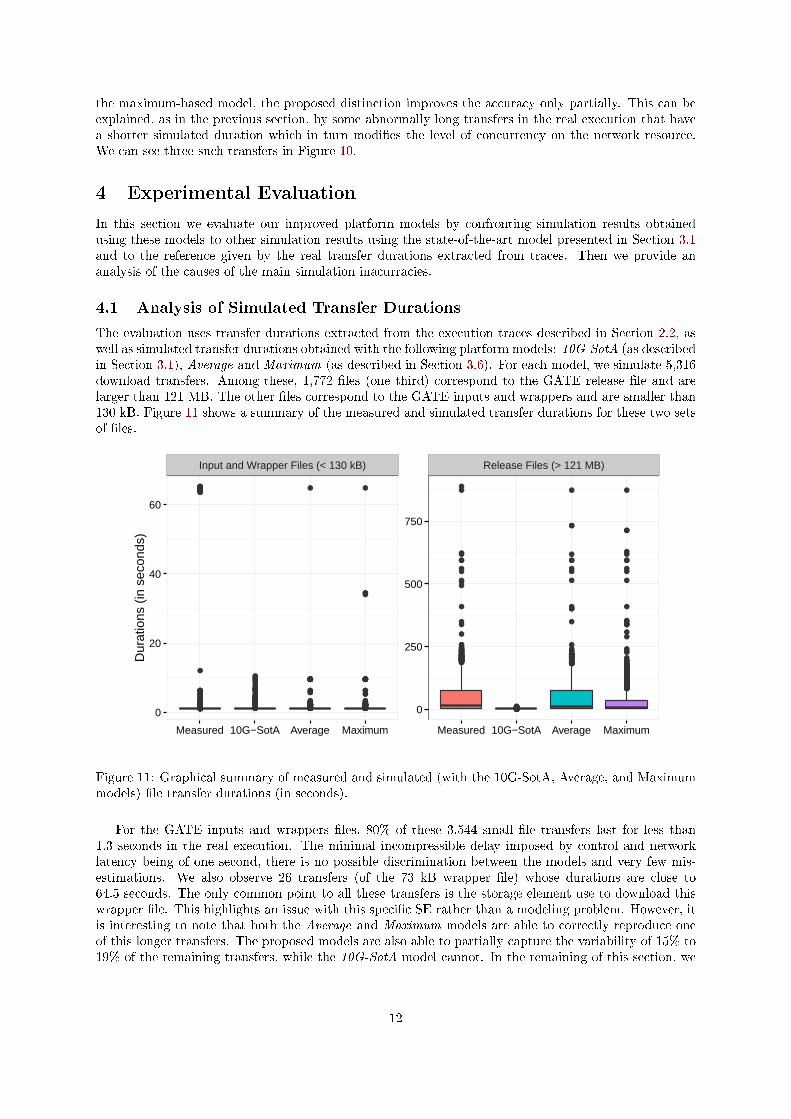
The evaluation uses transfer durations extracted from the execution traces described in Section 2.2, aswell as simulated transfer durations obtained with the following platform models: 10G-SotA (as describedin Section 3.1), Average and Maximum (as described in Section 3.6). For each model, we simulate 5,316download transfers. Among these, 1,772 �les (one third) correspond to the GATE release �le and arelarger than 121 MB. The other �les correspond to the GATE inputs and wrappers and are smaller than130 kB. Figure 11 shows a summary of the measured and simulated transfer durations for these two setsof �les.
●●●●●●●●●
●
●●●●●●●●●●●●●●●●●●●●●●●●●●●●●●●●●●●●●●●●●●●●●●●●●●●
●
●●●●●●●●●●●●●●●●●●●●●●●●●●●●●
●
●
●
●●●●●●●●●●●●●●●●●●●●●●
●
●●●●●●●●●●●●●●●●●●●●●●●●●●●●●●●●●●●●●●●●●●●●●●●●●●●●
●
●●●●●●●●●●●●●●●●●●●●
●
●●●●●●●●
●
●●●●●●●●●●●●●●
●
●●●●
●●●●●●●●●●●●●●●●●●●●●●●●●●●●●●●●●●●●●●
●●●●●●●●●●●●●●●●●●●●●●●●●●
●
●●●●●●●●●●●●●●●●●●●●●●●●●●●●●●●●●●●●●●●●●●●●●●●●●●●●
●
●●●●●●●●●●●●●●●●●●●●●●●●●●●●●●●●●●●●●●●●●●●●●●●●●●●●●●●●●●●
●
●●●●●●●●●●●●●●●●●●●●●●●●●●●●●●●●●●●●●●●●●●●●
●
●●●
●
●●●●●
●●
●●●
●
●●
●●
●
●●●●●●●●
●●
●●●●●●●●●●●●●●●●●●●●
●
●●●●
●
●●●●●●
●
●●●●●●●●
●●
●●●●●●●
●
●
●
●●●●●●●●●●●●●●●●●●●●●●●●●●●●●●●●●●●●●●●●●●●●●●●●●●●●●●●●●●●●
●
●●●●●●●
●
●●●●●●●●●●●●●●●●●●●●●●●●●●●●●●●
●
●●●●●●●●●●
●
●●●●●●●●●●●●●●●●●●●●●●●●●●●●●●●●●●●●●●●●●●●●●
●
●●●●●●
●
●●●●●●●●●●●●●●●●●●
●
●●●●●●●●●●●●●●●●●●●●●●●●●●●●●●●●●
●
●●●●●●●●●●●●
●
●●●●●●
●
●●●●●● ●●●●
●●●●●●●●●●●●●●●
●●●●●●●●
●
●
●●
●
●●●●●
●
●
●●●●●
●●
●●●
●●
●
●●●●●●
●
●
●
●
●
●●
●
●●●
●
●
●
●●●●●●●●
●●●●●●●●●●●●●●●●●●●●●●●●●●●●●●●●●●●●●●●●●●●●●●●●●●●●●●●●●●●●●●●●●●●●●
●●●●●
●●
●●●●
●●●●●●●●●●●●●●
●
●●●●●●●●●●●●●●●●●●●●●
●●●
●●●
●
●●●●●●●●●●●●●●●●●●●●●●●●●●●●●●●●●●●●●●●●●●●●●●●●●●●●●●●●●●●●●●●●●●●●●●●
●
●
●●
●●
●
●●
●●
●●
●●●●●●●●●●●●●●●●●●●●●●●●●●●●●●●●●●●●●●●●●●●●●●●●●●●●●●●●●●●●●
●
●●
●
●
●●
●
●
●●
●●●●●
●
●●●●●
●●●
●●●
●
●●●●●●●●●●●●●●●●●●●●●●●●●●●●●●●●●●●●●●●●
●
●
●
●
●
●
●●
●
●
●●●●●●●●●●
●
●
●●●●●●●●●●●●●●●
●
●●
●●
●●●
●
●●●●●●●●●●●
●●●●
●
●●●●●
●
●
●
●
●
●●●●●●●●●●●●
●
●●
●
●●●●●●●●●●●●●●●●●●●●●●●●●●●●●●●●●●●●●●●●●●●●●●●●●●●●●●●●●●●●●●●●●●●●●●●●●●●●●●●●●●●●●●●●●●●●●●●●●●●●●●●●●●●●●●●●●●●●●●●●●●●●●●●●●●●●●●●●●●●●●●●●●●●●●●●●●●●●●●●●●●●●●●●●●●●●●●●●●●●●●●●●●●●●●●●●●●●●●●●●●●●●●●●●●●●●●●●●●●●●●●●●●●●●●●●●●●●●●●●●●●●●●●●●●●●●●●●●●●●●●●●●●●●●●●●●●●●●●●●●●●●●●●●●●●●●●●●●●●●●●●●●●●●●●●●●●●●●●●●●●●●●●●●●●●●●●●●●●●●●●●●●●●●●●●●●●●●●●●●●●●●●●●●●●●●●●●●●●●●●●●●●●●●●●●●●●●●●●●●●●●●●●●●●●●●●●●●●●●●●●●●●●●●●●●●●●●●●●●●●●●
●
●
●
●
●
●
●●
●
●●●●●●●●
●
●
●●●●●
●●
●●
●●●
●
●
●
●●
●●●
●
●●●●●●
●
●●
●●
●
●●
●
●●●●●●●●●●●●●●
●
●
●
●
●
●
●●
●●●
●
●●
●
●
●
●●
●●●
●
●●●●●
●●●●●●
●
●●●●●●●●●●●
●
●
●
●
●
●
●●
●●●●
●
●●●
●
●
●
●●
●
●
●
●
●●
●●●●●
●●●
●
●
●●
●●●●
●●●●
●●●●
●●●
●
●●●●
●
●●
●
●●
●●●●
●
●
●
●
●
●●
●●●●●
●
●
●
●●
●
●●
●
●●●●
●●●●●●●●●
●
●
●●●●●
●
●●●●
●●●●●●●
●
●
●
●
●●
●
Input and Wrapper Files (< 130 kB) Release Files (> 121 MB)
0
20
40
60
0
250
500
750
Measured 10G−SotA Average Maximum Measured 10G−SotA Average Maximum
Dur
atio
ns (
in s
econ
ds)
Figure 11: Graphical summary of measured and simulated (with the 10G-SotA, Average, and Maximummodels) �le transfer durations (in seconds).
For the GATE inputs and wrappers �les, 80% of these 3,544 small �le transfers last for less than1.3 seconds in the real execution. The minimal incompressible delay imposed by control and networklatency being of one second, there is no possible discrimination between the models and very few mis-estimations. We also observe 26 transfers (of the 73 kB wrapper �le) whose durations are close to64.5 seconds. The only common point to all these transfers is the storage element use to download thiswrapper �le. This highlights an issue with this speci�c SE rather than a modeling problem. However, itis interesting to note that both the Average and Maximum models are able to correctly reproduce oneof this longer transfers. The proposed models are also able to partially capture the variability of 15% to19% of the remaining transfers, while the 10G-SotA model cannot. In the remaining of this section, we
12
focus our analysis on the transfers of the larger GATE release �le. The longer durations allow us to geta better insight on the respective strengths and limitations of the di�erent models.
Table 1: Statistics of measured and simulated (with the 10G-SotA, Average, and Maximum models)durations (in seconds) of the transfer of the GATE release �les (> 121 MB).
Min. 1st Qu. Median Mean 3rd Qu. Max.Measured 2.00 5.01 17.42 49.91 77.31 888.8010G-SotA 1.19 2.02 2.03 2.55 2.15 11.52Average 2.01 5.21 11.44 45.17 73.62 873.80Maximum 1.98 3.21 7.44 31.72 35.09 873.80
We complete Figure 11 with Table 1 that gives the corresponding statistics for the transfers of therelease �le. The poor quality of the 10G-SotA model is blatant: it largely underestimates all the transferdurations and cannot capture the variability that characterizes the real executions. The proposed Averageand Maximum models, however, are able to reproduce that variability and correctly simulate the longesttransfers. We also note a tendency of the Maximum platform model to underestimate the transferdurations, which can be explained by the fact that this models relies on estimations of the nominalbandwidths of the links that are less accurate than the average of the bandwidths as perceived by theapplication.
4.2 Analysis of Errors
Another way to assess the respective quality of the di�erent platform models and to measure the bene�tsof the proposed trace-based approach in terms of simulation accuracy is to compare errors with respectto the real transfer times. The relative di�erence between simulation results and the reference of a realexecution can be computed in many ways. For instance, the relative error is a standard error measurewhich gives a good indication on the precision of a simulation and whether it under- or overestimatesthe reality. However, this method has a certain number of disadvantages such as the fact that it is notsymmetrical (the error lies in the interval ]-∞, 1]) or the fact that the relative di�erence of bandwidthsis di�erent of the relative di�erence of transfer times, while there is a priori no reason to favor one overthe other. As explained in [20], an absolute logarithmic error solves these two issues and allows us tocompare the di�erent models more easily. We de�ne the absolute logarithmic error as follows:
LogErr = |log(R)− log(S)|, (2)
where R is the real time and S the simulated time.The absolute logarithmic error also allow us to apply additive aggregation operators such as the
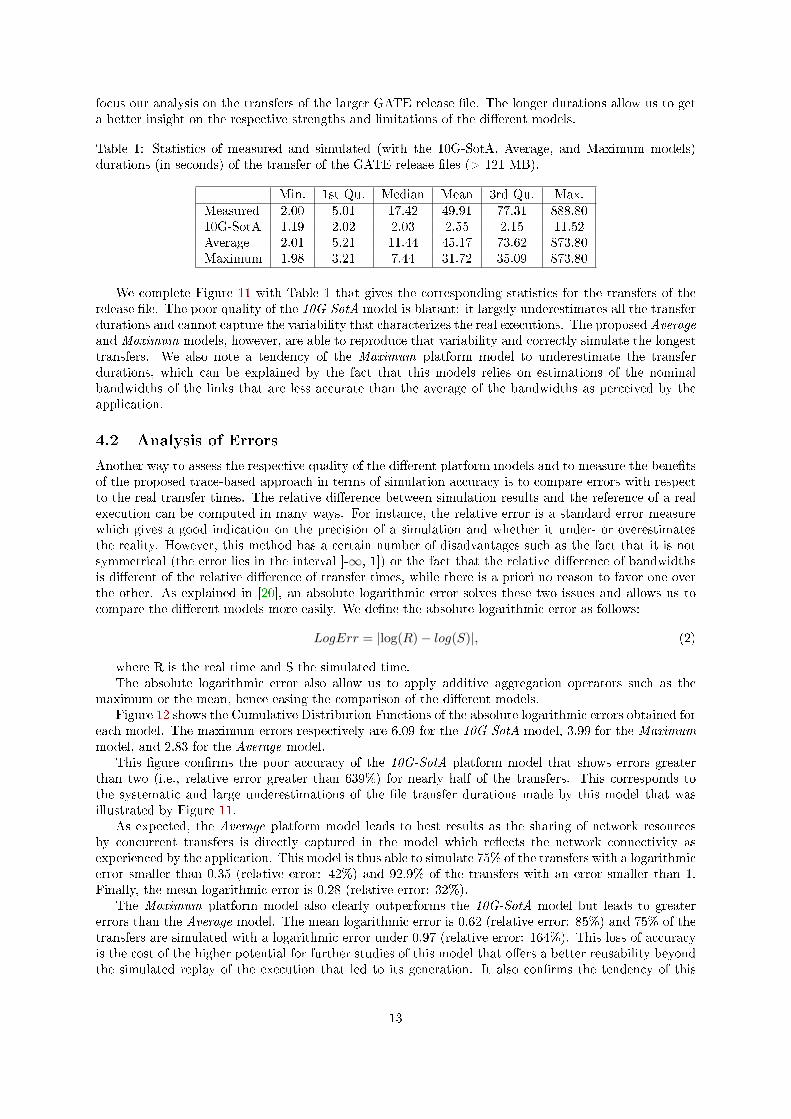
maximum or the mean, hence easing the comparison of the di�erent models.Figure 12 shows the Cumulative Distribution Functions of the absolute logarithmic errors obtained for
each model. The maximum errors respectively are 6.09 for the 10G-SotA model, 3.99 for the Maximummodel, and 2.83 for the Average model.
This �gure con�rms the poor accuracy of the 10G-SotA platform model that shows errors greaterthan two (i.e., relative error greater than 639%) for nearly half of the transfers. This corresponds tothe systematic and large underestimations of the �le transfer durations made by this model that wasillustrated by Figure 11.
As expected, the Average platform model leads to best results as the sharing of network resourcesby concurrent transfers is directly captured in the model which re�ects the network connectivity asexperienced by the application. This model is thus able to simulate 75% of the transfers with a logarithmicerror smaller than 0.35 (relative error: 42%) and 92.9% of the transfers with an error smaller than 1.Finally, the mean logarithmic error is 0.28 (relative error: 32%).
The Maximum platform model also clearly outperforms the 10G-SotA model but leads to greatererrors than the Average model. The mean logarithmic error is 0.62 (relative error: 85%) and 75% of thetransfers are simulated with a logarithmic error under 0.97 (relative error: 164%). This loss of accuracyis the cost of the higher potential for further studies of this model that o�ers a better reusability beyondthe simulated replay of the execution that led to its generation. It also con�rms the tendency of this
13
0%
25%
50%
75%
100%
0 1 2 3 4 5 6Absolute Logarithmic Error
Per
cent
age
of fi
le tr
ansf
ers
10G−SotA
Maximum
Average
Figure 12: Cumulative Distributed Functions of the absolute logarithmic error achieved by the threeplatform models over the whole set of transfers of the release �les.
model to be too optimistic in its determination of the bandwidth values, and thus to underestimates thetransfer durations. A deeper analysis of the individual simulation results would be needed to determinewhether the way to compute the bandwidth correction factor can be improved.
To summarize, our analysis of the distribution of the simulated transfer durations and of the logarith-mic errors demonstrates that a correct modeling of the interconnection topology and a good instantiationof the characteristics of the network resources are key to the quality of simulations of �le transfers on alarge-scale distributed infrastructure. It also shows that leveraging the contents of execution traces is asound approach that enables a pretty accurate simulated replay of a given execution with the Averagemodel or even beyond with the Maximum model, with an a�ordable accuracy loss.
4.3 Analysis of the Root Causes of Main Simulation Errors
While the obtained results are promising and greatly outperform the state-of-the-art model, they alsoinclude some prohibitive errors. In this section, we analyze such errors to determine whether theycorrespond to a modeling �aw or to phenomena that we cannot, or do not even want to, model. Forinstance, the cause behind the outlying durations for small �le transfers does not have to be part of theplatform model, but rather to be injected into the simulation as an additional parameter. Then, andbefore presenting two phenomena that we identi�ed as sources of high inaccuracy, we recall that Table 1shows that all the simulated durations lie in the same range of values as the actual durations.
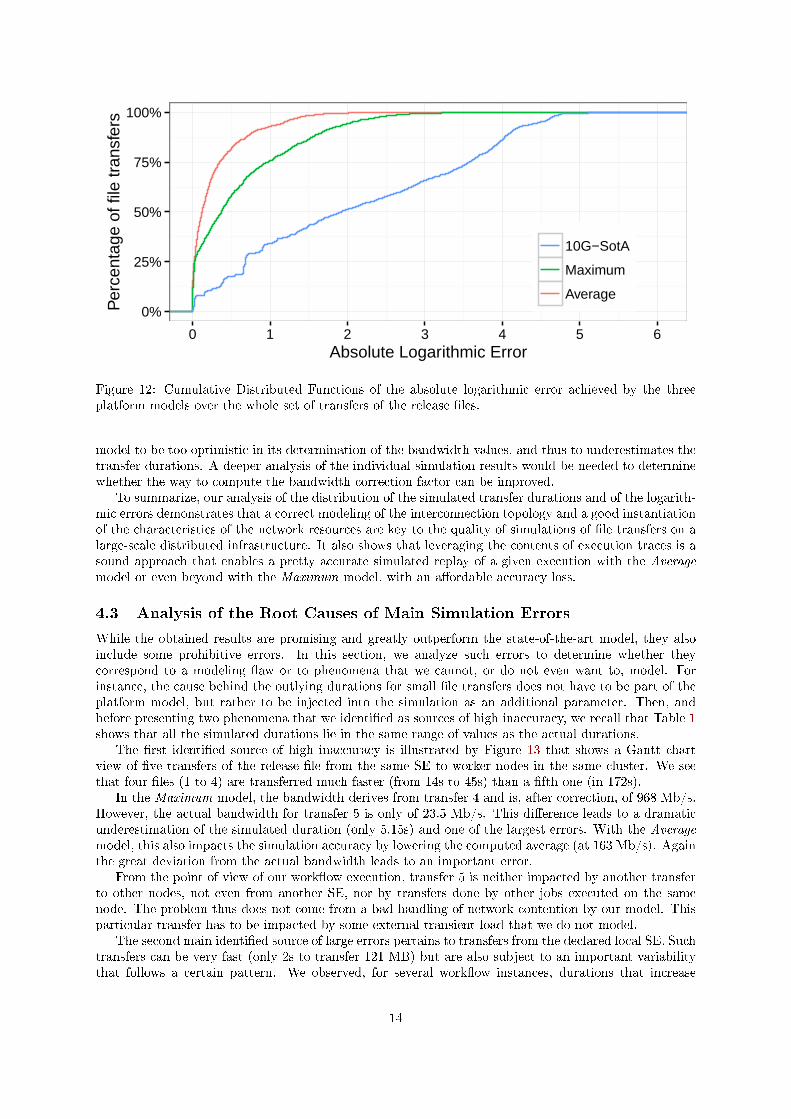
The �rst identi�ed source of high inaccuracy is illustrated by Figure 13 that shows a Gantt chartview of �ve transfers of the release �le from the same SE to worker nodes in the same cluster. We seethat four �les (1 to 4) are transferred much faster (from 14s to 45s) than a �fth one (in 172s).
In the Maximum model, the bandwidth derives from transfer 4 and is, after correction, of 968 Mb/s.However, the actual bandwidth for transfer 5 is only of 23.5 Mb/s. This di�erence leads to a dramaticunderestimation of the simulated duration (only 5.15s) and one of the largest errors. With the Averagemodel, this also impacts the simulation accuracy by lowering the computed average (at 163 Mb/s). Againthe great deviation from the actual bandwidth leads to an important error.
From the point of view of our work�ow execution, transfer 5 is neither impacted by another transferto other nodes, not even from another SE, nor by transfers done by other jobs executed on the samenode. The problem thus does not come from a bad handling of network contention by our model. Thisparticular transfer has to be impacted by some external transient load that we do not model.
The second main identi�ed source of large errors pertains to transfers from the declared local SE. Suchtransfers can be very fast (only 2s to transfer 121 MB) but are also subject to an important variabilitythat follows a certain pattern. We observed, for several work�ow instances, durations that increase
14
1
2
3
4
5
200 400 600Time (in seconds)
Tran
sfer
s
Figure 13: Gantt chart view of the transfers of the release �le from the ccsrm02.in2p3.fr SE to workernodes in the AUVERGRID site in the 2RcwCY work�ow instance.
exponentially. We suspect the in�uence of some local con�guration of the storage elements that limitsthe number of concurrent transfers and might trigger some timeout-retry mechanisms. Unfortunately,the traces do not make the distinction between the time spent waiting for the SE to be available fromthe time actually spent to transfer the �le over the network. Our models are thus unable to capture thise�ect.
5 Related Work
The simulation of large-scale distributed computing infrastructures has received an enormous amountof attention in the literature. In the area of grid and cloud computing, many simulators have beendeveloped and used by researchers over the last decade. Some were made available to the communitybut proved to be short-lived perhaps because they were too project-speci�c. For instance, ChicSim [16]and OptorSim [2], designed to study data replication in grids, have been discontinued. SimGrid [9] andGridSim [5] are two simulation toolkits widely used in grid computing research. More recently, simulatorshave been proposed for simulating cloud computing platforms and applications. GroudSim [15] is aframework that enables the simulation of both grid and cloud systems. CloudSim [6] builds on the samesimulation internals as GridSim but exposes speci�c cloud interfaces.
Platform models are mandatory to the simulation of distributed computing infrastructures. However,large production infrastructures such as EGI are di�cult to model. Then, studies such as [7,13] come toeither use existing descriptions of controlled environments, such as that of the Grid'5000 [4] experimentaltestbed or more simplistic descriptions instantiated with homogeneous bandwidths (e.g., 10 Gb/s).
Trace analysis is a common approach to model large scale distributed platforms and predict theperformance of individual operations, e.g., �le transfers. In [1], authors propose a hybrid simulationmodel for data grids based on the statistical analysis of traces. In [11], authors present a practicalmachine learning method to predict job characteristics by conducting an analysis of the workload traces.
Simulation results should ideally be close to results that would be obtained in a production system.The accuracy of a simulator can be evaluated by confronting simulation results to the ground truth ofactual experiments. However, published evaluations are often weak and/or incomplete. Some evaluationsare merely qualitative. When quantitative, evaluations often consist in exhibiting a few good cases inwhich simulation results lead to reasonable trends (few real executions are actually attempted). Recentwork [8] emphasizes the need for realistic simulators and the use of multiple approaches (mathematicalmodels, discrete-event simulation, and real production experiments) for cross-validation, allowing for agood level of con�dence in the obtained results.
6 Conclusion and Future Work
Simulation is a powerful tool that allows for easier prototyping and testing of new methods, enabling atthe same time their thorough evaluation through deterministic and reproducible experiments. However,
15
simulators are rarely tuned to faithfully model large-scale distributed computing platforms and simulationresults are seldom compared to the ground truth of actual production runs of real applications.
In this paper, we proposed a methodology for building realistic platform models that allow us toaccurately simulate �le transfers across a distributed infrastructure. The models were built and instan-tiated from execution traces obtained from a production environment. Last but not least, we evaluatedthe proposed models by confronting our simulation results to (i) the ground-truth of the real traces and(ii) simulation results using a more homogeneous state-of-the-art platform model.
Results show that the proposed platform models are able to correctly reproduce real-life variability,as opposed to the state-of-the-art platform model. Indeed, both the Maximum and Average modelsmanage to correctly capture the distribution of the transfer durations. The analysis of the absolutelogarithmic errors also shows that the proposed models clearly outperform the 10G-SotA model, whichlargely underestimates a vast majority of the transfer durations.
Based on the the obtained results, we conclude that realistic platform models are essential for theaccuracy of simulations aiming at reproducing �le transfers across a distributed infrastructure. Theylargely outperform the more simplistic, homogeneous existing models, thus fully accounting for the e�ortsneeded to build such realistic models.
As future work, we plan to build on these very promising results and address the di�erent limitationshighlighted by our analysis of the root causes of the main simulation errors. It would also be interestingto con�rm our �ndings on a larger set of execution traces, and to conduct a deeper invalidation study.The spatial and temporal aggregations of di�erent execution traces is a challenging task that would allowus move away from a speci�c trace and generate simulated platforms that mimic the characteristics of aproduction system.
We also aim at extending the simulation capacities of the VIPSimulator that underlies this study,not only to handle more complex scenarios that includes failed jobs, but also to simulate the othercomponents of the work�ow execution.
Acknowledgments
This work is partially supported by the LABEX PRIMES (ANR-11-LABX-0063) of Université de Lyon,within the program "Investissements d'Avenir" (ANR-11-IDEX-0007) operated by the French NationalResearch Agency (ANR) and the SONGS ANR project (11-ANR-INFR-13).
References
[1] Martin Barisits, Eva Kühn, and Mario Lassnig. A Hybrid Simulation Model for Data Grids. InProc. of 16th IEEE/ACM Intl. Symp. on Cluster, Cloud and Grid Computing, pages 255�260, 2016.
[2] William H. Bell, David G. Cameron, A. Paul Millar, Luigi Capozza, Kurt Stockinger, and FlorianoZini. OptorSim - A Grid Simulator for Studying Dynamic Data Replication Strategies. IJHPCA,17(4):403�416, 2003.
[3] Laurent Bobelin, Arnaud Legrand, David Alejandro González Márquez, Pierre Navarro, MartinQuinson, Frédéric Suter, and Christophe Thiery. Scalable Multi-Purpose Network Representationfor Large Scale Distributed System Simulation. In Proc. of the 12th IEEE/ACM Intl. Symp. onCluster, Cloud and Grid Computing, pages 220�227, 2012.
[4] Raphaël Bolze et al. Grid'5000: A Large Scale And Highly Recon�gurable Experimental GridTestbed. IJHPCA, 20(4):481�494, 2006.
[5] Rajkumar Buyya and Manzur Murshed. Gridsim: A Toolkit for the Modeling and Simulation ofDistributed Resource Management and Scheduling for Grid Computing. CCPE, 14(13-15):1175�1220, 2002.
[6] Rodrigo N. Calheiros, Rajiv Ranjan, Anton Beloglazov, Cesar A. F. De Rose, and Rajkumar Buyya.CloudSim: A Toolkit for Modeling and Simulation of Cloud Computing Environments and Evalua-tion of Resource Provisioning Algorithms. SPE, 41(1):23�50, 2011.
16
[7] Sorina Camarasu-Pop, Tristan Glatard, and Hugues Benoit-Cattin. Simulating Application Work-�ows and Services Deployed on the European Grid Infrastructure. In Proc. of the 13th IEEE/ACMIntl. Symp. on Cluster, Cloud, and Grid Computing, pages 18�25, Delft, Netherlands, May 2013.
[8] Sorina Camarasu-Pop, Tristan Glatard, and Hugues Benoit-Cattin. Combining Analytical Modeling,Realistic Simulation and Real Experimentation for the Optimization of Monte-Carlo Applicationson the European Grid Infrastructure. FGCS, 57:13�23, 2016.
[9] Henri Casanova, Arnaud Giersch, Arnaud Legrand, Martin Quinson, and Frédéric Suter. Versatile,Scalable, and Accurate Simulation of Distributed Applications and Platforms. JPDC, 74(10):2899�2917, 2014.
[10] Anchen Chai, Mohammad Bazm, Sorina Camarasu-Pop, Tristan Glatard, Hugues Benoit-Cattin,and Frédéric Suter. Companion of the article on Modeling Distributed Platforms from ApplicationTraces for Realistic File Transfer Simulation, 2016. Available at: https://dx.doi.org/10.6084/m9.�gshare.4253426.
[11] Rafael Ferreira da Silva, Mats Rynge, Gideon Juve, Igor S�ligoi, Ewa Deelman, James Letts, FrankWürthwein, and Miron Livny. Characterizing a High Throughput Computing Workload: The Com-pact Muon Solenoid (CMS) Experiment at LHC. Procedia Computer Science, 51:39�48, 2015.
[12] Tristan Glatard et al. A Virtual Imaging Platform for Multi-Modality Medical Image Simulation.IEEE Transactions on Medical Imaging, 32(1):110�118, 2013.
[13] Harshit Gupta, Amir Vahid Dastjerdi, Soumya K. Ghosh, and Rajkumar Buyya. iFogSim: A Toolkitfor Modeling and Simulation of Resource Management Techniques in Internet of Things, Edge andFog Computing Environments. Preprint available at: http://arxiv.org/abs/1606.02007, 2016.
[14] Sébastien Jan et al. GATE: a Simulation Toolkit for PET and SPECT. Physics in Medicine andBiology, 49(19):4543, 2004.
[15] Simon Ostermann, Radu Prodan, and Thomas Fahringer. Dynamic Cloud Provisioning for Scienti�cGrid Work�ows. In Proc. of the 11th ACM/IEEE International Conference on Grid Computing,pages 97�104, 2010.
[16] Kavitha Ranganathan and Ian Foster. Decoupling Computation and Data Scheduling in DistributedData-Intensive Applications. In Proc. of the 11th IEEE Intl. Symp. on High Performance DistributedComputing, pages 352�358, 2002.
[17] Frédéric Suter, Anchen Chai, and Mohammad Bazm. The Log2sim Framework. Available at:http://github.com/frs69wq/log2sim, 2016.
[18] Frédéric Suter, Anchen Chai, and Sorina Camarasu-Pop. VIPSimulator: a Simulator of Gate Work-�ow Execution. Available at: http://github.com/frs69wq/VIPSimulator, 2016.
[19] Yehuda Vardi. Network Tomography: Estimating Source-Destination Tra�c Intensities from LinkData. Journal of the American statistical association, 91(433):365�377, 1996.
[20] Pedro Velho and Arnaud Legrand. Accuracy Study and Improvement of Network Simulation inthe SimGrid Framework. In Proc. of the 2nd Intl. Conf. on Simulation Tools and Techniques forCommunications, Networks and Systems, 2009.
[21] Pedro Velho, Lucas Mello Schnorr, Henri Casanova, and Arnaud Legrand. On the Validity of Flow-Level TCP Network Models for Grid and Cloud Simulations. ACM TOMACS, 23(4):23, 2013.
17
Related Documents