Modern Applied Science; Vol. 14, No. 1; 2020 ISSN 1913-1844 E-ISSN 1913-1852 Published by Canadian Center of Science and Education 41 Modeling Design and Implementation of an Embeds System Real Time Over a Network of Wireless Sensors to Environmental Monitoring F. Essahlaoui 1 , N. Elhajrat 2 , A. El Abbassi 1 , O. Elouatssi 2 & M. Aftatah 3 1 Team of Electronics, Physical Instrumentation and Measurements, Dept. of Physics, FST, B.P. 509, Boutalamine, Errachidia, My Ismail University of Meknes, Morocco. 2 Team of Optoelectronics and Applied Energetics Techniques Dept. of Physics, FST, B.P. 509, Boutalamine, Errachidia, My Ismail University Meknes, Morocco. 3 Faculty of Sciences and Techniques, Sultan Moulay Slimane University, Beni Mellal, Morocco. Correspondence: F. ESSAHLAOUI, Team of of Electronics, Physical Instrumentation and Measurements, Dept. of Physics, FST, B.P. 509, Boutalamine, Errachidia, My Ismail University Meknes, Morocco. E-mail: [email protected] Received: November 29, 2019 Accepted: December 24, 2019 Online Published: December 26, 2019 doi:10.5539/mas.v14n1p41 URL: https://doi.org/10.5539/mas.v14n1p41 Abstract Artificial Neurons Network (ANN) is used in the decision and control of dynamic systems which can be with a lack of superfluous information.it forces the use of fuzzy logic. For this reason, several methods and monitoring techniques have been implemented. This article presents a technique based on artificial neural networks implanted at the level of a multisensor surveillance system. It is a statistical learning method that displays optimal training and generalization performance in several domains, including the recognition domain of forms. In this case ANN based on raspberry PI card for decision node and arduino for the input and hidden nodes, in order to develop a complete platform environmental monitoring system. and hence enhance multi-Sensor wireless signals aggregation via multi-bit decision fusion. The back-propagation algorithm generates a weight for all nodes in the networks, with aim of minimizing absolute error committed in fusion data and economics of electrical energy using artificial intelligence techniques. This algorithm is more efficient than the human being since it can reason and learn from its errors so as not to repeat them. Its main applications include a variety of data monitoring parameters (such as: temperature, humidity, gas sensor, … etc), that can be found in factory automation, for instance : home automation, remote monitoring and home device control, or it may be used in environment to make an exact decision in short time. Keywords: multi-Sensor, wireless signal, neurons, embedded systems, humidity, temperature, Python 1. Introduction The embedded systems have been developed very quickly in the last years. This technology has become a hot research topic and greater used in the surrounding environment for spider calculated data and more thing such as control house the aim of not fastness, making certain, high and uniform level of quality (Sekkas et al., 2010; Zervas et al., 2011; Bouamar and Ladjal, 2007). Those systems take the decision in real-time and transfer data convenience to a variety of personal portable digital devices. On the one hand, sensor networks might be used for monitor accidental or natural environmental changes. In (Werner-Allen et al., 2006) the authors describe in this work the implementation of a sensor array on the "Reventator" volcano in the western Amazon in Ecuador. The data collected during the movements were transmitted to the next level nodes while nodes were always in the same place. The expected lifespan of the nodes is about 45 years. They can also be used for monitor the changing in the environment.(Abdellah, 2010;

Welcome message from author
This document is posted to help you gain knowledge. Please leave a comment to let me know what you think about it! Share it to your friends and learn new things together.
Transcript

Modern Applied Science; Vol. 14, No. 1; 2020 ISSN 1913-1844 E-ISSN 1913-1852
Published by Canadian Center of Science and Education
41
Modeling Design and Implementation of an Embeds System Real Time Over a Network of Wireless Sensors to Environmental
Monitoring
F. Essahlaoui1, N. Elhajrat2, A. El Abbassi1, O. Elouatssi2 & M. Aftatah3 1 Team of Electronics, Physical Instrumentation and Measurements, Dept. of Physics, FST, B.P. 509, Boutalamine, Errachidia, My Ismail University of Meknes, Morocco.
2 Team of Optoelectronics and Applied Energetics Techniques Dept. of Physics, FST, B.P. 509, Boutalamine, Errachidia, My Ismail University Meknes, Morocco. 3 Faculty of Sciences and Techniques, Sultan Moulay Slimane University, Beni Mellal, Morocco.
Correspondence: F. ESSAHLAOUI, Team of of Electronics, Physical Instrumentation and Measurements, Dept. of Physics, FST, B.P. 509, Boutalamine, Errachidia, My Ismail University Meknes, Morocco. E-mail: [email protected] Received: November 29, 2019 Accepted: December 24, 2019 Online Published: December 26, 2019
doi:10.5539/mas.v14n1p41 URL: https://doi.org/10.5539/mas.v14n1p41
Abstract Artificial Neurons Network (ANN) is used in the decision and control of dynamic systems which can be with a lack of superfluous information.it forces the use of fuzzy logic.
For this reason, several methods and monitoring techniques have been implemented. This article presents a technique based on artificial neural networks implanted at the level of a multisensor surveillance system. It is a statistical learning method that displays optimal training and generalization performance in several domains, including the recognition domain of forms.
In this case ANN based on raspberry PI card for decision node and arduino for the input and hidden nodes, in order to develop a complete platform environmental monitoring system. and hence enhance multi-Sensor wireless signals aggregation via multi-bit decision fusion.
The back-propagation algorithm generates a weight for all nodes in the networks, with aim of minimizing absolute error committed in fusion data and economics of electrical energy using artificial intelligence techniques. This algorithm is more efficient than the human being since it can reason and learn from its errors so as not to repeat them.
Its main applications include a variety of data monitoring parameters (such as: temperature, humidity, gas sensor, … etc), that can be found in factory automation, for instance : home automation, remote monitoring and home device control, or it may be used in environment to make an exact decision in short time.
Keywords: multi-Sensor, wireless signal, neurons, embedded systems, humidity, temperature, Python
1. Introduction The embedded systems have been developed very quickly in the last years. This technology has become a hot research topic and greater used in the surrounding environment for spider calculated data and more thing such as control house the aim of not fastness, making certain, high and uniform level of quality (Sekkas et al., 2010; Zervas et al., 2011; Bouamar and Ladjal, 2007).
Those systems take the decision in real-time and transfer data convenience to a variety of personal portable digital devices.
On the one hand, sensor networks might be used for monitor accidental or natural environmental changes. In (Werner-Allen et al., 2006) the authors describe in this work the implementation of a sensor array on the "Reventator" volcano in the western Amazon in Ecuador. The data collected during the movements were transmitted to the next level nodes while nodes were always in the same place. The expected lifespan of the nodes is about 45 years. They can also be used for monitor the changing in the environment.(Abdellah, 2010;
mas.ccsenet.org Modern Applied Science Vol. 14, No. 1; 2020
42
Jiang et al., 2011; Valdma et al., 2007).
On the other hand, the physical topology of sensor networks depends on the deployment model, random or deterministic. The choice of this model is made according to the realization difficulty of this deployment, linked to the size of the reed and the accessibility of the deployment zone.
Typically, the aim of physical deployment studies is to determine network coverage in terms of event detection.
Logical topology often determines the qualities and performance of the network. (Mamun, 2012) performed a detailed comparison of four types of logical topologies using ten different metrics. The four topologies are:
The flat or unorganized topology, in which all the nodes have the same role in the meantime the routing is determined at each emission, thus we use unaddressed diffusion;
The clustered topology in which the nodes are organized into groups and the organized routing are priori by choosing a "leader" cluster that is a kind of intermediate sink for its group;
Tree topology, which is a construction obtained by the routes created and stored from each sensor node to the well which is the root of the attract;
The chain topology in which the nodes form one or more chains passing through the well.
Then the wireless sensor networks have already been widely used in the daily life environment. It is applied in many different fields, including health care, digital home, industrial control, environmental monitoring and other fields to provide various types of wireless information and communication.
As in our previous work where we have implemented two methods that make decision following the detection of failure in these real and random signals outcome from multiple wireless sensors (Essahlaoui et al., 2016).
Here we focus on the problem of efficient data fusion while reducing the number of bits transmitted in the wireless sensor network, and change the deflate weight to the best one to economize energy using artificial intelligence techniques.
In our work, we used two post-detection decision-making methods and one algorithm to find the best weight to minimize the error. using it to identify multiple wireless sensors in the result of these real signals. we designed a neural network with Raspberry Pi, Arduino, Rf RF433hz and several open source software.
2. Background 2.1 The Node Card and Transmission Module
2.1.2 Raspberry
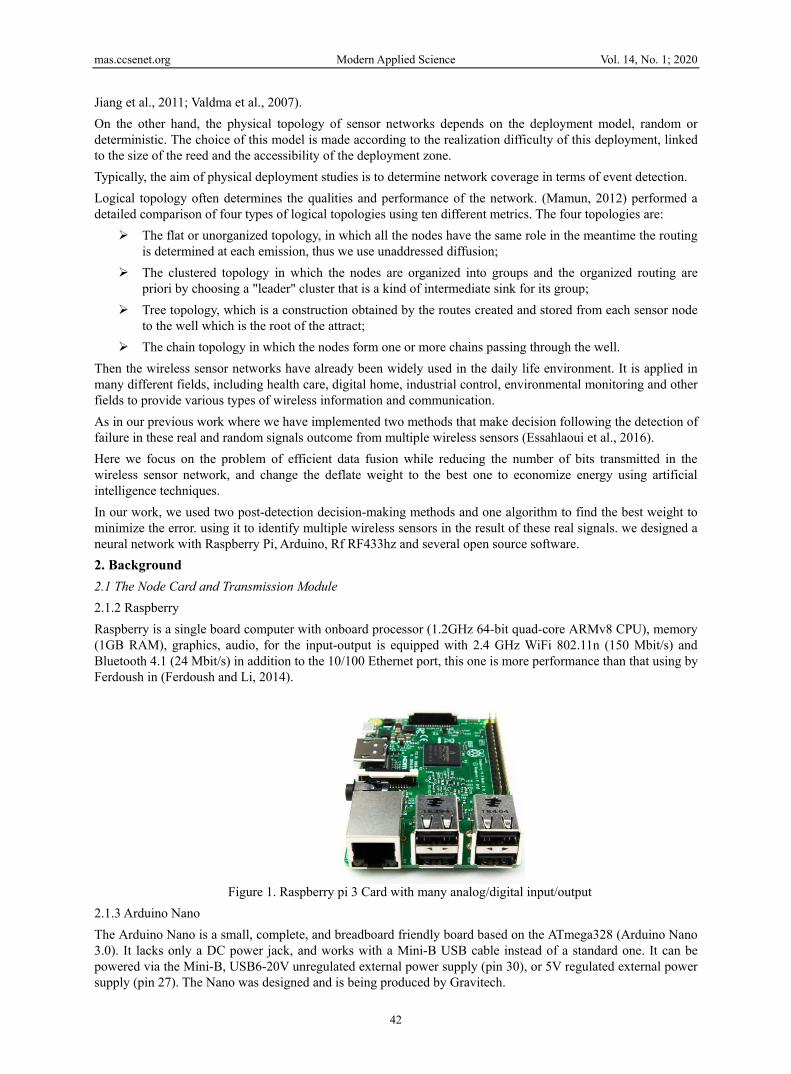
Raspberry is a single board computer with onboard processor (1.2GHz 64-bit quad-core ARMv8 CPU), memory (1GB RAM), graphics, audio, for the input-output is equipped with 2.4 GHz WiFi 802.11n (150 Mbit/s) and Bluetooth 4.1 (24 Mbit/s) in addition to the 10/100 Ethernet port, this one is more performance than that using by Ferdoush in (Ferdoush and Li, 2014).
Figure 1. Raspberry pi 3 Card with many analog/digital input/output
2.1.3 Arduino Nano
The Arduino Nano is a small, complete, and breadboard friendly board based on the ATmega328 (Arduino Nano 3.0). It lacks only a DC power jack, and works with a Mini-B USB cable instead of a standard one. It can be powered via the Mini-B, USB6-20V unregulated external power supply (pin 30), or 5V regulated external power supply (pin 27). The Nano was designed and is being produced by Gravitech.

mas.ccsenet.org Modern Applied Science Vol. 14, No. 1; 2020
43
Figure 2. NANO R3 card Interfaced to Sensors.
2.1.4 The transmission channels (WIFI and RF433hz)
Transmission channel is a narrow band of frequencies usable for communication that is free (i.e not requiring a radio license) to pay. In Morocco the National Telecommunications Regulatory Agency (ANRT) is the regulator responsible for the use of the frequency bands, which authorized the use of bands below 3GHz and 433 - 437.79 MHz (“ANRT-Maroc-Plan-national-frequences-2013,” n.d.; “Frequency Spectrum | Morocco - National Telecommunications Regulatory Agency,” n.d.).
In this work we have implemented a set of low cost radio transmitter / receiver modules using ASK (Amplitude Shift Keying) modulation on a frequency of 433 MHz which can be used for industrial, scientific and medical applications and a Built-in wi-fi module on raspberry cards which is based on the IEEE 802.11n standard to define the low layers of the OSI model to make a wireless connection using electromagnetic waves.
2.2 Sensor
2.2.1 Temperature LM 36
This is the same temperature sensor that is included in (Essahlaoui et al., 2016; Ferdoush and Li, 2014). the TMP36 is a low voltage, precision centigrade temperature sensor. It provides a voltage output that is linearly proportional to the Celsius temperature. It also doesn’t require any external calibration to provide typical accuracies of 1° at +25° and2° over the 40 + 125 temperature range. We like it because it’s so easy to use: just give the device a ground and 2.7 5.5 and read the voltage on the Vout pin. The output voltage can be converted to temperature easily using the scale factor of 10 / .
LM 36 Features:
2.7 5.5
10 /
±2°
±0.5°
: − 40° + 125°
2.2.2 Humidity and Temperature Sensor RHT03
The RHT03 (also known by DHT-22) is a low-cost humidity and temperature sensor with a single wire digital interface. The sensor is calibrated and doesn’t require extra components so you can get right to measuring relative humidity and temperature of Environment (Jiang et al., 2011; Zhang et al., 2013) .
RHT03 Features:
3.3 − 6
1 − 1.5
40 − 50
0 − 100%
−40 − 80°
±2%
mas.ccsenet.org Modern Applied Science Vol. 14, No. 1; 2020
44
±0.5°
2.2.3 Gas Sensor MQ-6
Description liquefied petroleum gas Sensor - MQ-6: This is a simple-to-use liquefied petroleum gas (LPG) sensor, suitable for sensing LPG (composed of mostly propane and butane) concentrations in the air. The MQ-6 can detect gas concentrations anywhere from 200 to 10000 ppm.
This sensor has a high sensitivity and fast response time. The sensors output is an analog resistance. The drive circuit is very simple; all you need to do is power the heater coil with 5V, add a load resistance, and connect the output to an ADC.
LPG Gas Sensor (MQ6) Features:
High Sensitivity to LPG, iso-butane, propane
Small sensitivity to alcohol, smoke
Detection Range: 100 − 10,000 iso-butane propane
Fast Response Time: < 10s
Simple drive circuit
Heater Voltage:5.0
2.2.4 Gas Sensor MQ-4
Description Methane CNG Gas Sensor - MQ-4: This is a simple-to-use compressed natural gas (CNG) sensor, suitable for sensing natural gas (composed of mostly Methane [CH4]) concentrations in the air. The MQ-4 can detect natural gas concentrations anywhere from 200 to 10000ppm.
This sensor has a high sensitivity and fast response time. The sensors output is an analog resistance. The drive circuit is very simple; all you need to do is power the heater coil with 5V, add a load resistance, and connect the output to an ADC.
3. Overview Result In this work we have used an accurate simulation to find the suitable parameter to the neurons for a good decision to the output of the two algorithms used, and then we make a comparison of the performance of these algorithms.
3.1 Neuronal Parameters
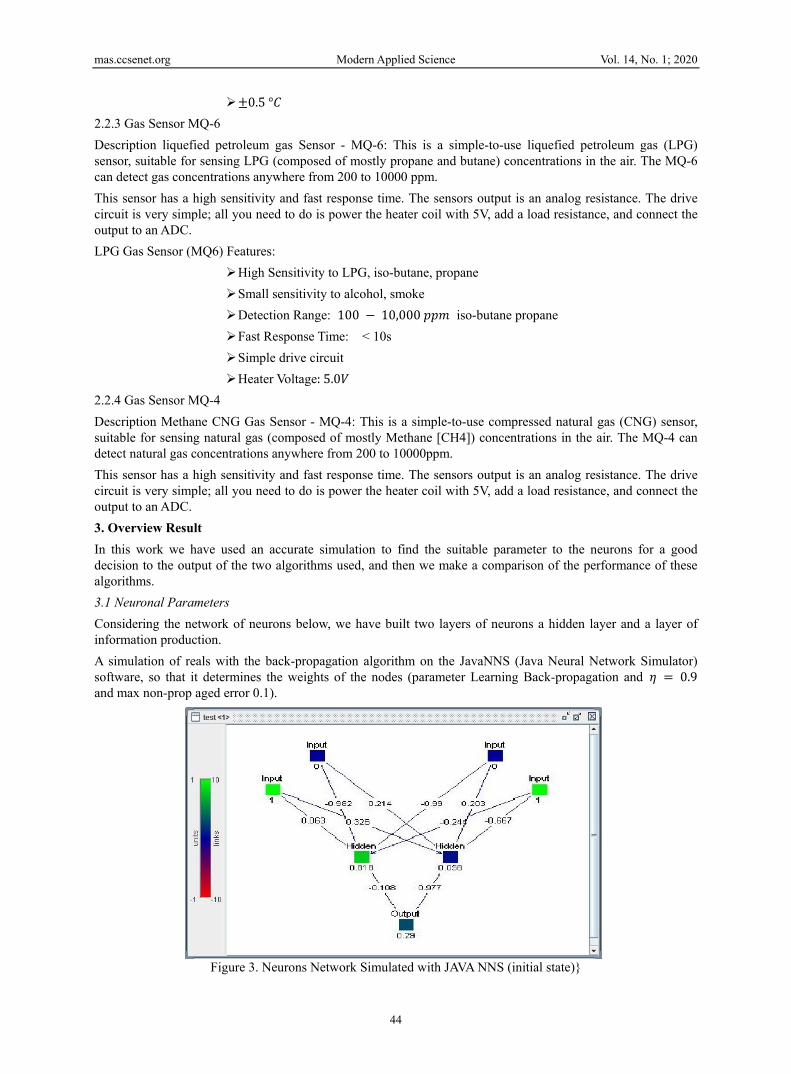
Considering the network of neurons below, we have built two layers of neurons a hidden layer and a layer of information production.
A simulation of reals with the back-propagation algorithm on the JavaNNS (Java Neural Network Simulator) software, so that it determines the weights of the nodes (parameter Learning Back-propagation and = 0.9 and max non-prop aged error 0.1).
Figure 3. Neurons Network Simulated with JAVA NNS (initial state)}

mas.ccsenet.org Modern Applied Science Vol. 14, No. 1; 2020
45
Which in the Minimum Error therefore calculate the sensitivity for each iteration following equation Eq (1) , so that it determines the effect of each of the weights on the minimization of the error and adjusted that for the rest of the experiment.
This requires an algorithm which reduces the absolute error that results by the back coupling, and therefore the error quadrille subsequently: = − (1)
Pred Network production.
Req Production requires.
The functional description of the neuron is given by the following diagram like (Sekkas et al., 2010; Zervas et al., 2011) with parameter given by back-propagation algorithm:
Figure 4. Neuron Function and System Description
The transition weights between the input nodes at the nodes hidden are given by the weights Nodes, at the start of the algorithm sounds randomly for example for our case:
= . .− . .− . .− . − . (2)
At the end of program run JAVANNS Parameters of peas after the stabilization of neural networks without:
= − . − .− . .− . .− . − . (3)
We obtain the same results for the weights between the hidden nodes and the output node.
Initially: = − .. (4)
The result of the running program is: = .. (5)

mas.ccsenet.org Modern Applied Science Vol. 14, No. 1; 2020
46
Figure 6. Sum of Quadratic Errors in 1000 iterations
Note that the back-propagation algorithm converges in almost 250 iterations this result is best than (Shaohua Chen et al., 2003).
These parameters propagate (Chafik et al., 2014) on the network periodically so that all neuron changes the weight automatically.
The objective of this distribution and its contribution by the supervised network is to regulate the weights so that the difference between the production of network and the production demands is reduced.
3.2 Theoretical Approch's
The different test signal using for comparing between the performed results and results detection of both algorithms Cusum and Onset, After data fusion processing in ANN:
Figure 7. The Result of Fused Signal for two different signale
The output of the network of sensors (after fusion) in the case where there is no detection algorithm, It gives only a signal that is not directly used.
Therefore, for the future it is necessary to use a one of the algorithms Previously mentioned, to detected automatically the breaking point.
3.3 Detection of Onset
One of the simplest methods to automatically detect or identify the change or occurrence of a particular event in the data, for example, its beginning and ending, or simply the data onset, is based on amplitude threshold, where the signal is considered to be ’on’ when it is above a certain threshold. This threshold can be proportional to the amplitude of the baseline (the part of the data that we know there is no real signal, only noise). For instance, a threshold equals to two or three times the standard deviation of the baseline is a common procedure employed in the analysis of electromyographic data. On the other way, to set the threshold would be as a percentage value of

mas.ccsenet.org Modern Applied Science Vol. 14, No. 1; 2020
47
the maximum or peak of the data. For instance, in movement analysis it’s common to define the onset period as the signal above 5% of the peak velocity of the investigated movement.
The function ‘ . ‘ implements such onset detection based on the amplitude threshold method with a parameter to specify a minimum number of samples above threshold to detect as onset and another parameter to specify the minimum number of samples (continuous or not) below threshold that will be ignored in the detection of data greater or equal to threshold (to avoid the detection of spikes or transients in the data). The function signature is:
_ ( , ℎ ℎ = 0, = 1, = 0, ℎ = , = ) The out of networks after using back-propagation algorithm, import the necessary Python libraries and application of ONSET. the results find are trace with the card Output Raspberry in a monitor.
Figure 8. The ONSET Result for two signale
Onset Performance: The card automatically detects breakage instantly. The performance of the result found after best of the last three loops Onset algorithms withe data size = 10000 is: 1000 , 3 224
3.4 CUSUM Algorithm
Refers to procedures to identify abrupt changes in a phenomenon (Basseville et al., 1993) , by abrupt change it is meant any difference in relation to previous known data faster than expected of some characteristic of the data such as amplitude, mean, variance, frequency, etc.
The Cumulative sum Algorithm (CUSUM) is a classical technique for monitoring change detection. One form of implementing the CUSUM algorithm involves the calculation of the cumulative sum of positive and negative changes ( and ) in the data ( ) and comparison to a ℎ ℎ .
When this ℎ ℎ is exceeded a change is detected ( ) and the cumulative sum restarts from zero. To avoid the detection of a change in absence of an actual change or a slow drift, this algorithm also depends on a parameter for drift correction. This form of the CUSUM algorithm is given by: [ ] = [ ] − [ − ][ ] = ( [ − ] + [ ] − ; )[ ] = ( [ − ] − [ ] − ; ) (6)
( [ ] > ℎ ℎ ) ( [ ] > ℎ ℎ ): = [ ] = [ ] = (7)
There are different implementations of the CUSUM algorithm; for example, the term for the sum of the last elements ( [ ] above) can have a longer history (with filtering), it can be normalized by removing the data mean and then divided by the data variance), or this sum term can be squared for detecting both variance and parameter changes, etc.
For the CUSUM algorithm to work properly, it depends on tuning the parameters ℎ and to what is meant by

mas.ccsenet.org Modern Applied Science Vol. 14, No. 1; 2020
48
a change in the data, this tuning can be performed following these steps:
Stape 1: Start with a very large ℎ ℎ .
Stape 2: Choose to one half of the expected change, or adjust such that = 0 more than 50% of the time.
Stape 3: Then set the ℎ ℎ so the required number of false alarms (this can be done automatically) or delay for detection is obtained.
Stape 4: If faster detection is sought, try to decrease .
Stape 5: If fewer false alarms are wanted, try to increase .
Stape 6: If there is a subset of the change times that does not make sense, try to increase .
The function 'detect\_cusum.py' (code at the end of this text) implements the CUSUM algorithm and a procedure to calculate the ending of the detected change. The function is called with:
_ ( , ℎ ℎ = 1, = 0, = , ℎ = , = ) Let’s see how 'detect\_cusum.py' work; first we import the necessary Python libraries and implement algorithm to detect the change in environment like (Granjon, 2014) :
Figure 9. a) Cusum detection with alarm point, b) is Cusum Result of negative and positive changes
Cusum Performance: The same in this case the card detects automatically breakage instantly. The performance of the result found after best of the last three loops Cusum algorithms withe data size = 10000 is: 10 , 3 49.7 . The output of this filter is approximately similar to the result found by Granjon Pierre in (Granjon, 2014).
4. Summary and Conclusions In this paper, we have implemented two methods of decision-making following detection and one algorithm for find the best weight to minimize the error. using this for determines in these real signal’s outcome from multiple wireless sensors. we designed neuron network with Raspberry Pi, Arduino, Rf RF433hz and a number of open-source software packages.
The system contains a variety of engaging options, as well as low-priced, compact, scalable, simple to customise, easy to deploy, and simple to keep up. One major advantage of the planning lies within the integration of the gateway node of wireless sensing element network, as a result, it's considerably reduced the complexness of wireless sensor network system development. The detailed design and mensuration results given during this paper clearly demonstrate the utility of such a system.
From the results, we have found, the use of the Cusum filter after a neuron resonator gives us an excellent degree

mas.ccsenet.org Modern Applied Science Vol. 14, No. 1; 2020
49
of accuracy than onste. That it is at the levels of the execution time with 49.7 ms/loop and also of use CPU just 10 loops to detected the threshold.
However, the time of the training phase is relatively long, which makes it possible to consider other faster calculation tools (FPGAs for example) for more performance. By increasing the training base and adding new sensors capable of providing more information, such as software sensors, the accuracy of the decision can be further improved.
References Abdellah, M.D. (2010). Répartition économique de l’énergie électrique utilisant les techniques d’intelligence
artificielle (these). Université Mentouri de Constantine, Faculté des Sciences de l’ingénieur, Département d’électrotechnique.
ANRT-Maroc-Plan-national-frequences-2013 [WWW Document], n.d. URL https://www.anrt.ma/sites/default/files/ANRT-Maroc-Plan-national-frequences-2013.pdf (accessed 2.3.17).
Basseville, M., Nikiforov, I.V., others. (1993). Detection of abrupt changes: theory and application. Prentice Hall Englewood Cliffs.
Bouamar, M., & Ladjal, M. (2007). Multisensor system using support vector machines for water quality classification, in: 2007 9th International Symposium on Signal Processing and Its Applications. Presented at the 2007 9th International Symposium on Signal Processing and Its Applications (ISSPA), IEEE, Sharjah, United Arab Emirates, pp. 1–4. https://doi.org/10.1109/ISSPA.2007.4555463
Chafik, A., Lecuire, V., & Lepage, F. (2014). Wireless Sensor Network Architecture for Monitoring Large Physical System in Cyclic Mobility. IFAC Proc, 47, 7170–7175. https://doi.org/10.3182/20140824-6-ZA-1003.02386
Essahlaoui, F., El Abbassi, A., & Skouri, R. (2016). Implementing and Comparison between Two Algorithms to Make a Decision in a Wireless Sensors Network. Int. J. Adv. Comput. Sci. Appl. 7, 77–83. https://doi.org/10.14569/IJACSA.2016.070812
Ferdoush, S., & Li, X. (2014). Wireless Sensor Network System Design Using Raspberry Pi and Arduino for Environmental Monitoring Applications. Procedia Comput. Sci. 34, 103–110. https://doi.org/10.1016/j.procs.2014.07.059
Frequency Spectrum | Morocco - National Telecommunications Regulatory Agency [WWW Document], n.d. URL https://www.anrt.ma/en/missions/spectre-des-frequences (accessed 2.3.17).
Granjon, P. (2014). The cusum algorithm a small review. Gipsa-Lab Grenoble Fr. Team SAIGA hal-00914697f.
Jiang, M., Li, J., Gao, L., & Wang, Y. (2011). Simple underwater wireless communication system. Procedia Eng. 15, 2459–2463. https://doi.org/10.1016/j.proeng.2011.08.462
Mamun, Q. (2012). A Qualitative Comparison of Different Logical Topologies for Wireless Sensor Networks. Sensors, 12, 14887–14913. https://doi.org/10.3390/s121114887
Sekkas, O., Hadjiefthymiades, S., & Zervas, E. (2010). A multi-level data fusion approach for early fire detection, in: Intelligent Networking and Collaborative Systems (INCOS), 2010 2nd International Conference On. IEEE, pp. 479–483. https://doi.org/10.1109/INCOS.2010.64
Shaohua Chen, Hong Bao, Xianyun Zeng, & Yimin Yang. (2003). A fire detecting method based on multi-sensor data fusion, in: SMC’03 Conference Proceedings. 2003 IEEE International Conference on Systems, Man and Cybernetics. Conference Theme - System Security and Assurance (Cat. No.03CH37483). Presented at the SMC ’03 2003 IEEE International Conference on Systems, Man and Cybernetics, IEEE, Washington, DC, USA, pp. 3775–3780. https://doi.org/10.1109/ICSMC.2003.1244476
Valdma, M., Keel, M., Tammoja, H., & Shuvalova, J. (2007). ECONOMICAL DISPATCH OF POWER UNITS UNDER FUZZINESS 24 N2, 249–263.
Werner-Allen, G., Lorincz, K., Ruiz, M., Marcillo, O., Johnson, J., Lees, J., & Welsh, M. (2006). Deploying a wireless sensor network on an active volcano. IEEE Internet Comput. 10, 18–25. https://doi.org/10.1109/MIC.2006.26
Zervas, E., Mpimpoudis, A., Anagnostopoulos, C., Sekkas, O., & Hadjiefthymiades, S. (2011). Multisensor data fusion for fire detection. Inf. Fusion, 12, 150–159. https://doi.org/10.1016/j.inffus.2009.12.006
Zhang, Z.-J., Fu, J.-S., Chiang, H.-P., & Huang, Y.-M. (2013). A Novel Mechanism for Fire Detection in Subway

mas.ccsenet.org Modern Applied Science Vol. 14, No. 1; 2020
50
Transportation Systems Based on Wireless Sensor Networks. Int. J. Distrib. Sens. Netw, 2013, 1–10. https://doi.org/10.1155/2013/185327
Copyrights Copyright for this article is retained by the author(s), with first publication rights granted to the journal.
This is an open-access article distributed under the terms and conditions of the Creative Commons Attribution license (http://creativecommons.org/licenses/by/3.0/).
Related Documents