Modeling dependence of price spikes in Australian electricity markets Adebayo A. Aderounmu * Rodney C. Wolff WH Bryan Mining and Geology Research Centre, Sustainable Minerals Institute, The University of Queensland, St. Lucia, Brisbane, QLD 4072, Australia. Abstract Price spikes are of particular importance due to their severe impacts on consumers, busi- nesses and industry. They constitute a major source of price risk to market participants, e.g., electricity retailers with commitments to meet customers’ daily electricity demands. To those trading in several electricity markets simultaneously, the probability of simulta- neous price spikes termed as tail dependence is of great importance when computing risks. For this purpose, the problem of modeling joint price spikes in the Australian electricity market is considered. A common measure of tail dependence measure is the so-called tail dependence coefficient (TDC). We present a nonparametric estimator of the tail de- pendence and further, point estimation is complemented with an hypotheses test. We find significant tail dependence in electricity prices that cannot be ignored. Accurate charac- terization of this tail dependence is important for a variety of risk management purposes. These include the hedging activities of market participants. Keywords: Price spikes, Electricity markets, Tail dependence, Risk management JEL Classification: Q4, C12, C13, C15 1 Introduction In order to assist market participants who are operating in several markets simultaneously to manage the risk of joint price spikes, we examine the dependence between price spikes. The occurrence of spikes in the spot electricity price has far-reaching consequences for effective risk management. Interestingly, there is considerable evidence that electricity markets in Australia * Corresponding author. Email: [email protected] (A. Aderounmu) 1

Welcome message from author
This document is posted to help you gain knowledge. Please leave a comment to let me know what you think about it! Share it to your friends and learn new things together.
Transcript
Modeling dependence of price spikesin Australian electricity markets
Adebayo A. Aderounmu ∗ Rodney C. WolffWH Bryan Mining and Geology Research Centre, Sustainable Minerals Institute,
The University of Queensland, St. Lucia, Brisbane, QLD 4072, Australia.
Abstract
Price spikes are of particular importance due to their severe impacts on consumers, busi-
nesses and industry. They constitute a major source of price risk to market participants,
e.g., electricity retailers with commitments to meet customers’ daily electricity demands.
To those trading in several electricity markets simultaneously, the probability of simulta-
neous price spikes termed as tail dependence is of great importance when computing risks.
For this purpose, the problem of modeling joint price spikes in the Australian electricity
market is considered. A common measure of tail dependence measure is the so-called
tail dependence coefficient (TDC). We present a nonparametric estimator of the tail de-
pendence and further, point estimation is complemented with an hypotheses test. We find
significant tail dependence in electricity prices that cannot be ignored. Accurate charac-
terization of this tail dependence is important for a variety of risk management purposes.
These include the hedging activities of market participants.
Keywords: Price spikes, Electricity markets, Tail dependence, Risk managementJEL Classification: Q4, C12, C13, C15
1 Introduction
In order to assist market participants who are operating in several markets simultaneously tomanage the risk of joint price spikes, we examine the dependence between price spikes. Theoccurrence of spikes in the spot electricity price has far-reaching consequences for effective riskmanagement. Interestingly, there is considerable evidence that electricity markets in Australia
∗Corresponding author. Email: [email protected] (A. Aderounmu)
1
are known to be highly prone to price spikes, and they seem to occur roughly simultaneouslyacross domestic markets (Weron, 2006). For this purpose, the problem of modeling joint pricespikes in the Australian electricity market is considered.Literature on electricity markets contains many papers studying the relationships between elec-tricity spot prices, but none consider how price spikes correlate with each other. Such correla-tions among those price spikes can be termed as tail dependence. Hence, if tail dependence canbe accurately modeled, then this information can be used by market participants to estimateand manage the risk of joint price spikes in these markets. In the next section, we introduce theconcept of tail dependence which is important in modeling dependence between price spikes.
2 Tail Dependence Coefficient (TDC)
The tail dependence coefficient (TDC) measures the probability of extreme values occurring forone random variable (r.v.) given that another assumes an extreme value too. More precisely, itis defined as
λ = limu→1−
PY > F−1Y (u)|X > F−1X (u)
, (1)
where FX and FY are the marginal distribution functions (d.f’s) of r.v.’s X and Y , respec-tively. The measure λ can be estimated assuming a parametric specification of a copula (ordependence) function or nonparametrically via estimators. In general, parametric estimationsare efficient if the joint distribution function of the data is known. In this paper, we prefer toconsider nonparametric estimation since no assumption is made regarding the joint distributionfunction. Further, the important feature of this study is the implementation of the test for taildependence, i.e., point estimation of λ is complemented by an hypotheses test.
2.1 Estimation of the TDC and test for tail dependence
As suggested in Caperaa et al. (1997), Frahm et al. (2005) presented a nonparametric estimatorfor λ as:
λ = 2− 2 exp
(1
n
n∑i=1
log
√log
1
FX(Xi)log
1
FY (Yi)/ log
1
max(FXi, FYi)2
). (2)
This estimator was shown by the authors to have the best performance among all nonparametricestimators. In the sequel, we shall use this estimator to test for tail dependence.
Assume we have a setting made of pairs of i.i.d. observations (Xi, Yi); i = 1, ..., n of arandom vector (X, Y ). We wish to test
2
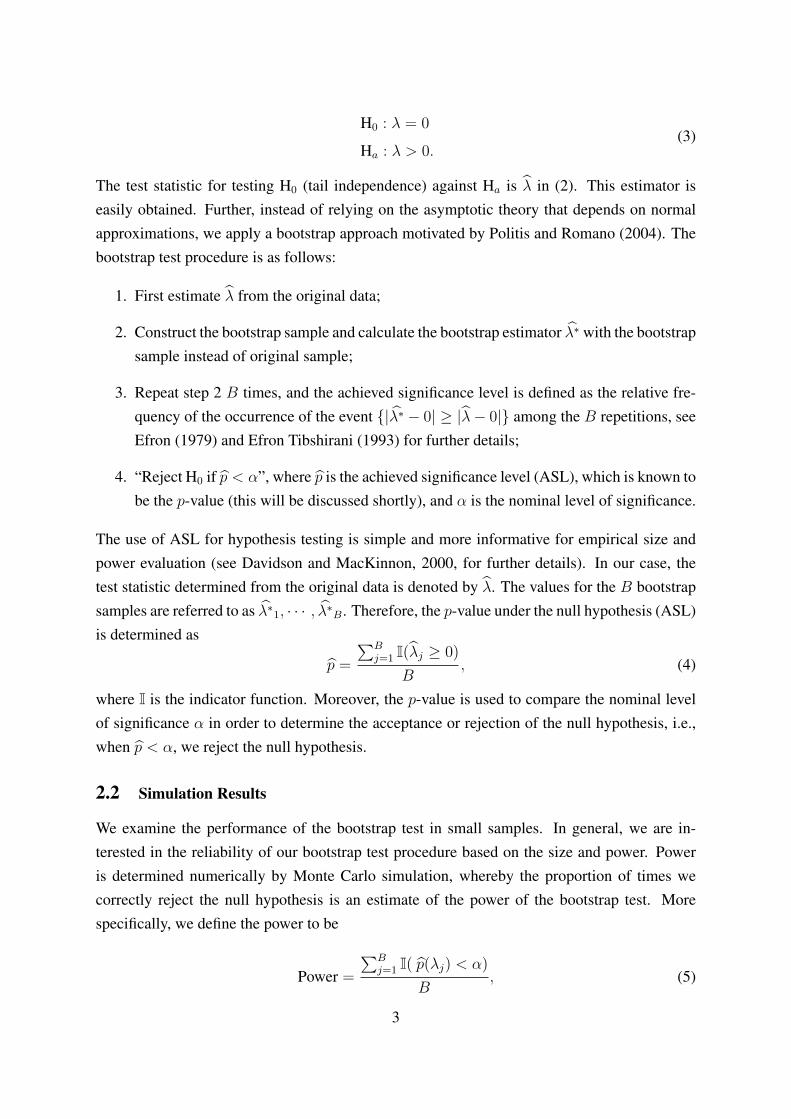
H0 : λ = 0
Ha : λ > 0.(3)
The test statistic for testing H0 (tail independence) against Ha is λ in (2). This estimator iseasily obtained. Further, instead of relying on the asymptotic theory that depends on normalapproximations, we apply a bootstrap approach motivated by Politis and Romano (2004). Thebootstrap test procedure is as follows:
1. First estimate λ from the original data;
2. Construct the bootstrap sample and calculate the bootstrap estimator λ∗ with the bootstrapsample instead of original sample;
3. Repeat step 2 B times, and the achieved significance level is defined as the relative fre-quency of the occurrence of the event |λ∗ − 0| ≥ |λ− 0| among the B repetitions, seeEfron (1979) and Efron Tibshirani (1993) for further details;
4. “Reject H0 if p < α”, where p is the achieved significance level (ASL), which is known tobe the p-value (this will be discussed shortly), and α is the nominal level of significance.
The use of ASL for hypothesis testing is simple and more informative for empirical size andpower evaluation (see Davidson and MacKinnon, 2000, for further details). In our case, thetest statistic determined from the original data is denoted by λ. The values for the B bootstrapsamples are referred to as λ∗1, · · · , λ∗B. Therefore, the p-value under the null hypothesis (ASL)is determined as
p =
∑Bj=1 I(λj ≥ 0)
B, (4)
where I is the indicator function. Moreover, the p-value is used to compare the nominal levelof significance α in order to determine the acceptance or rejection of the null hypothesis, i.e.,when p < α, we reject the null hypothesis.
2.2 Simulation Results
We examine the performance of the bootstrap test in small samples. In general, we are in-terested in the reliability of our bootstrap test procedure based on the size and power. Poweris determined numerically by Monte Carlo simulation, whereby the proportion of times wecorrectly reject the null hypothesis is an estimate of the power of the bootstrap test. Morespecifically, we define the power to be
Power =
∑Bj=1 I( p(λj) < α)
B, (5)
3
where I is the indicator function. We can construct a power curve by repeating this procedurefor a number of alternatives and plotting the estimated power against the distance from the nullhypothesis. Larger power is preferred for testing tail dependence between two time series. Toinvestigate the performance of the bootstrap test, we carry out Monte Carlo experiments. Eachof the experiments consist of generating two electricity price series of 1000 observations eachfrom GARCH(1,1) processes, whose joint behavior is assumed to be adequately represented bya Gumbel copula and Frank copula. We investigated the power of the proposed test by drawing1000 random samples of size n = 50, 100, 500, and 1000 from the Gumbel copula defined as
F (x, y) = exp[(− log x)θ + (− log y)θ
]1/θ, (6)
for all θ ∈ [−1,∞), and the Frank copula defined as
F (x, y) = −1
θlog
[1 +
(e−θx − 1)(e−θy − 1)
e−θ − 1
], (7)
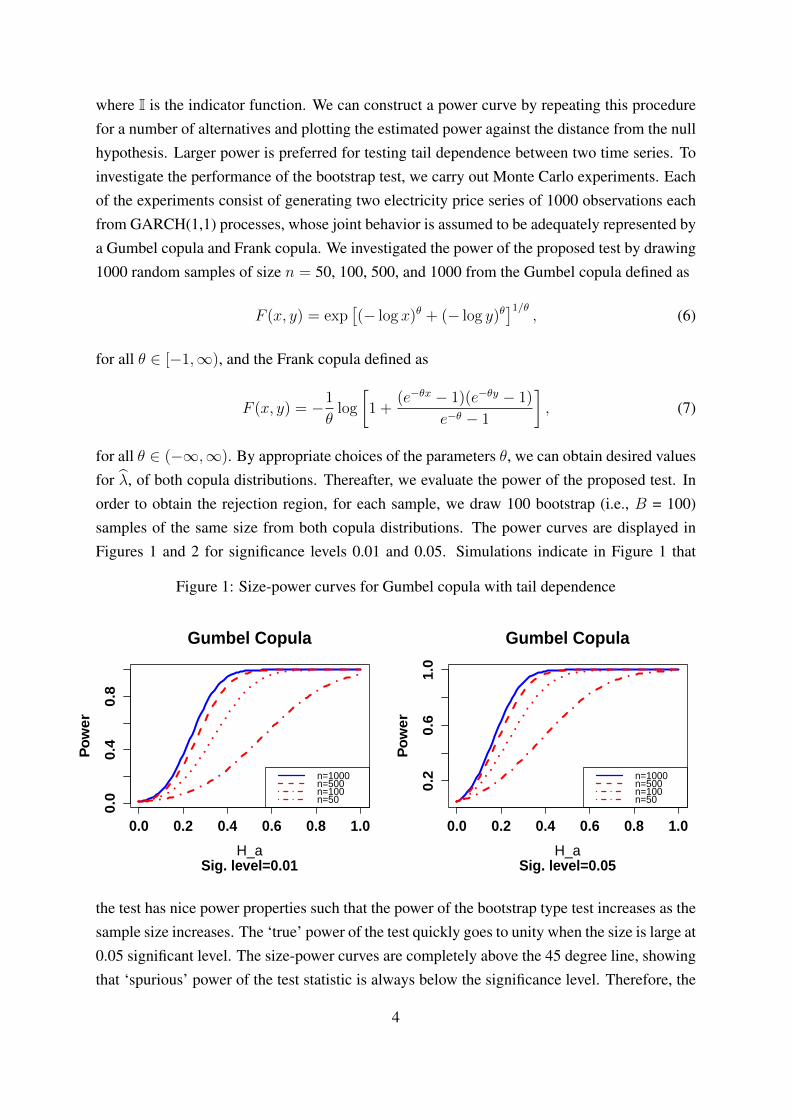
for all θ ∈ (−∞,∞). By appropriate choices of the parameters θ, we can obtain desired valuesfor λ, of both copula distributions. Thereafter, we evaluate the power of the proposed test. Inorder to obtain the rejection region, for each sample, we draw 100 bootstrap (i.e., B = 100)samples of the same size from both copula distributions. The power curves are displayed inFigures 1 and 2 for significance levels 0.01 and 0.05. Simulations indicate in Figure 1 that
Figure 1: Size-power curves for Gumbel copula with tail dependence
0.0 0.2 0.4 0.6 0.8 1.0
0.0
0.4
0.8
Gumbel Copula
Sig. level=0.01H_a
Pow
er
n=1000n=500n=100n=50
0.0 0.2 0.4 0.6 0.8 1.0
0.2
0.6
1.0
Gumbel Copula
Sig. level=0.05H_a
Pow
er
n=1000n=500n=100n=50
the test has nice power properties such that the power of the bootstrap type test increases as thesample size increases. The ‘true’ power of the test quickly goes to unity when the size is large at0.05 significant level. The size-power curves are completely above the 45 degree line, showingthat ‘spurious’ power of the test statistic is always below the significance level. Therefore, the
4
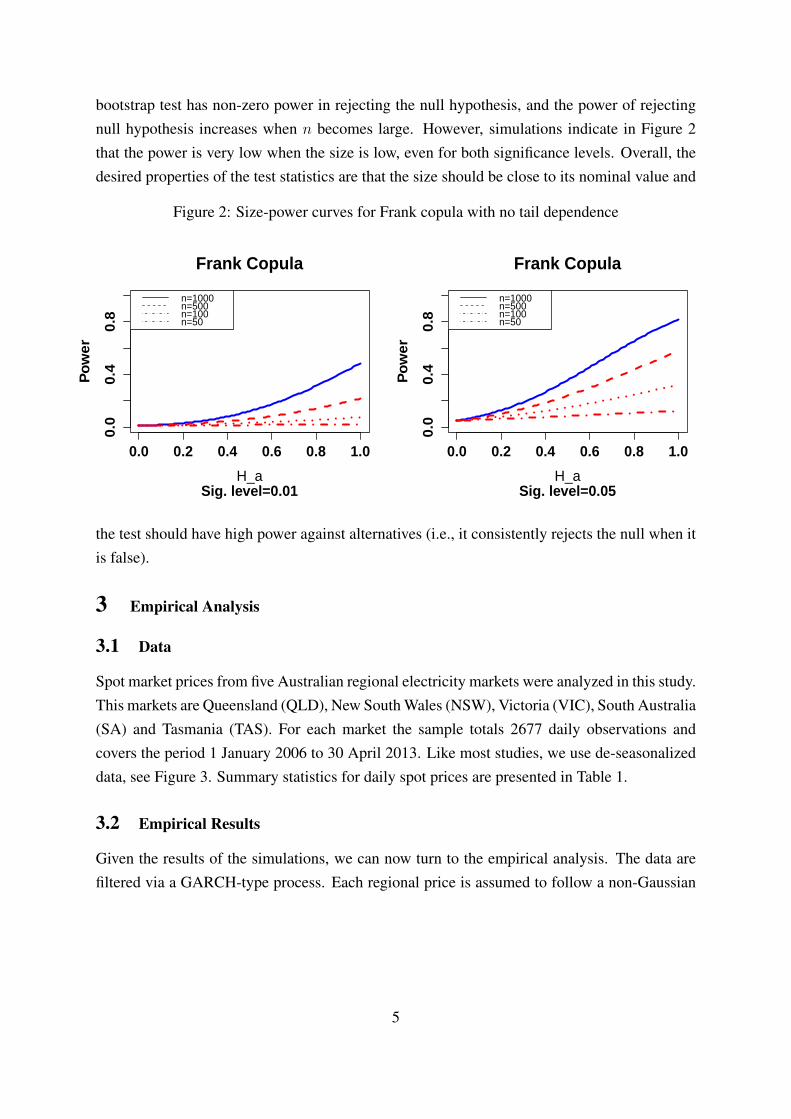
bootstrap test has non-zero power in rejecting the null hypothesis, and the power of rejectingnull hypothesis increases when n becomes large. However, simulations indicate in Figure 2that the power is very low when the size is low, even for both significance levels. Overall, thedesired properties of the test statistics are that the size should be close to its nominal value and
Figure 2: Size-power curves for Frank copula with no tail dependence
0.0 0.2 0.4 0.6 0.8 1.0
0.0
0.4
0.8
Frank Copula
Sig. level=0.01H_a
Pow
er
n=1000n=500n=100n=50
0.0 0.2 0.4 0.6 0.8 1.0
0.0
0.4
0.8
Frank Copula
Sig. level=0.05H_a
Pow
er
n=1000n=500n=100n=50
the test should have high power against alternatives (i.e., it consistently rejects the null when itis false).
3 Empirical Analysis
3.1 Data
Spot market prices from five Australian regional electricity markets were analyzed in this study.This markets are Queensland (QLD), New South Wales (NSW), Victoria (VIC), South Australia(SA) and Tasmania (TAS). For each market the sample totals 2677 daily observations andcovers the period 1 January 2006 to 30 April 2013. Like most studies, we use de-seasonalizeddata, see Figure 3. Summary statistics for daily spot prices are presented in Table 1.
3.2 Empirical Results
Given the results of the simulations, we can now turn to the empirical analysis. The data arefiltered via a GARCH-type process. Each regional price is assumed to follow a non-Gaussian
5
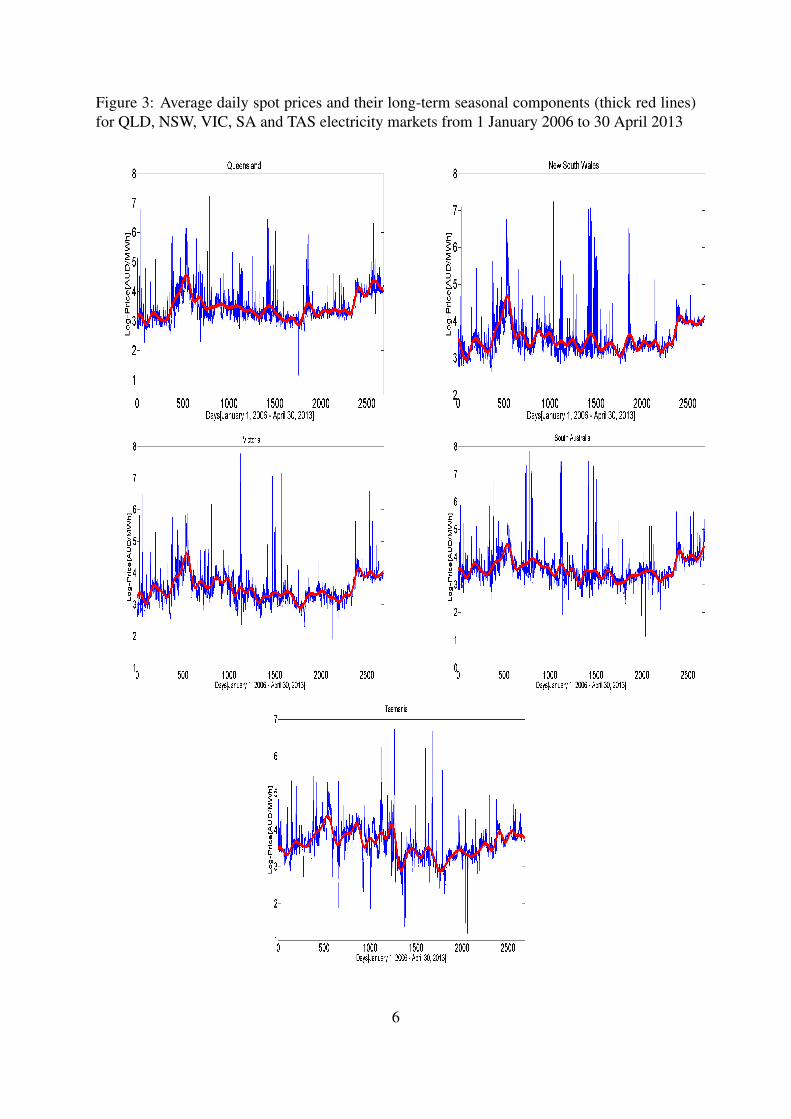
Figure 3: Average daily spot prices and their long-term seasonal components (thick red lines)for QLD, NSW, VIC, SA and TAS electricity markets from 1 January 2006 to 30 April 2013
6
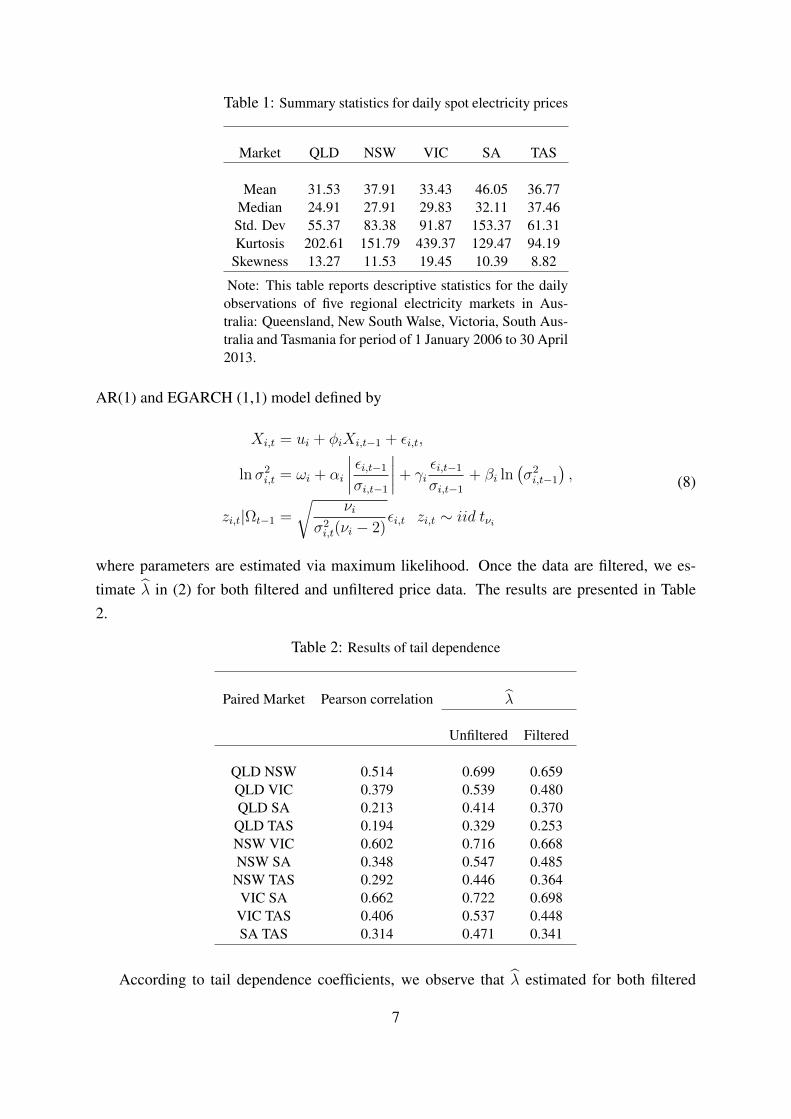
Table 1: Summary statistics for daily spot electricity prices
Market QLD NSW VIC SA TAS
Mean 31.53 37.91 33.43 46.05 36.77Median 24.91 27.91 29.83 32.11 37.46Std. Dev 55.37 83.38 91.87 153.37 61.31Kurtosis 202.61 151.79 439.37 129.47 94.19
Skewness 13.27 11.53 19.45 10.39 8.82
Note: This table reports descriptive statistics for the dailyobservations of five regional electricity markets in Aus-tralia: Queensland, New South Walse, Victoria, South Aus-tralia and Tasmania for period of 1 January 2006 to 30 April2013.
AR(1) and EGARCH (1,1) model defined by
Xi,t = ui + φiXi,t−1 + εi,t,
lnσ2i,t = ωi + αi
∣∣∣∣ εi,t−1σi,t−1
∣∣∣∣+ γiεi,t−1σi,t−1
+ βi ln(σ2i,t−1
),
zi,t|Ωt−1 =
√νi
σ2i,t(νi − 2)
εi,t zi,t ∼ iid tνi
(8)
where parameters are estimated via maximum likelihood. Once the data are filtered, we es-timate λ in (2) for both filtered and unfiltered price data. The results are presented in Table2.
Table 2: Results of tail dependence
Paired Market Pearson correlation λ
Unfiltered Filtered
QLD NSW 0.514 0.699 0.659QLD VIC 0.379 0.539 0.480QLD SA 0.213 0.414 0.370
QLD TAS 0.194 0.329 0.253NSW VIC 0.602 0.716 0.668NSW SA 0.348 0.547 0.485
NSW TAS 0.292 0.446 0.364VIC SA 0.662 0.722 0.698
VIC TAS 0.406 0.537 0.448SA TAS 0.314 0.471 0.341
According to tail dependence coefficients, we observe that λ estimated for both filtered
7
and unfiltered data are larger than the corresponding Pearson correlation coefficients. Thisreinforces previous conjecture that the Pearson correlation measure is a poor measure for taildependence. Since most of the pairs are asymptotically dependent, then the Pearson correlationmeasures for spot prices are likely to have underestimated joint tail risk. Moreover, as wefind the presence of strong dependence in the tail, we observe that the estimates are larger forthe unfiltered than those for the filtered spot prices, indicating that volatility is a contributingfactor to the estimation of tail dependence. However, qualitatively there is little difference if aGARCH-type filter used.
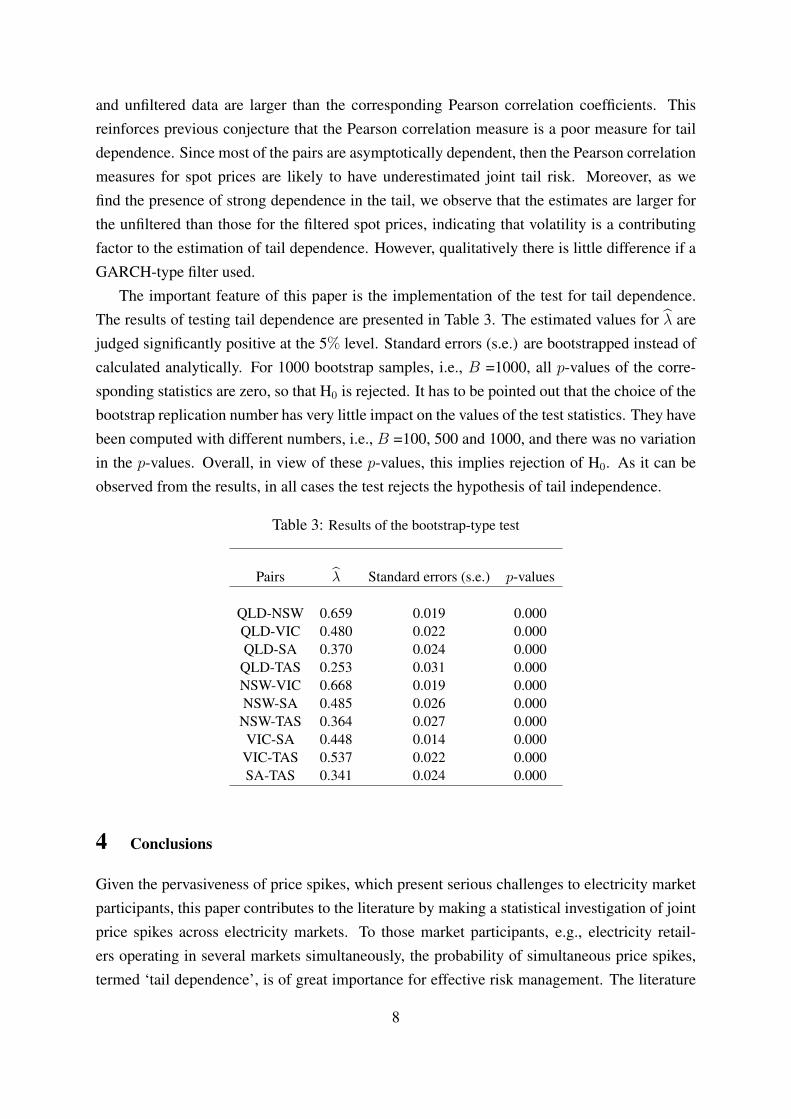
The important feature of this paper is the implementation of the test for tail dependence.The results of testing tail dependence are presented in Table 3. The estimated values for λ arejudged significantly positive at the 5% level. Standard errors (s.e.) are bootstrapped instead ofcalculated analytically. For 1000 bootstrap samples, i.e., B =1000, all p-values of the corre-sponding statistics are zero, so that H0 is rejected. It has to be pointed out that the choice of thebootstrap replication number has very little impact on the values of the test statistics. They havebeen computed with different numbers, i.e., B =100, 500 and 1000, and there was no variationin the p-values. Overall, in view of these p-values, this implies rejection of H0. As it can beobserved from the results, in all cases the test rejects the hypothesis of tail independence.
Table 3: Results of the bootstrap-type test
Pairs λ Standard errors (s.e.) p-values
QLD-NSW 0.659 0.019 0.000QLD-VIC 0.480 0.022 0.000QLD-SA 0.370 0.024 0.000
QLD-TAS 0.253 0.031 0.000NSW-VIC 0.668 0.019 0.000NSW-SA 0.485 0.026 0.000
NSW-TAS 0.364 0.027 0.000VIC-SA 0.448 0.014 0.000
VIC-TAS 0.537 0.022 0.000SA-TAS 0.341 0.024 0.000
4 Conclusions
Given the pervasiveness of price spikes, which present serious challenges to electricity marketparticipants, this paper contributes to the literature by making a statistical investigation of jointprice spikes across electricity markets. To those market participants, e.g., electricity retail-ers operating in several markets simultaneously, the probability of simultaneous price spikes,termed ‘tail dependence’, is of great importance for effective risk management. The literature
8
appears already to have addressed tail dependence in economics and financial applications, butnot much attention has been given to electricity markets, and the particular time series phenom-ena they display. However, the important feature of this study is the implementation of the testfor tail dependence. A novel statistical framework for testing tail dependence was developedvia a bootstrap technique. The bootstrap technique is a resampling procedure to perform sta-tistical inference, and can be used as an alternative to classical asymptotic inference. The mainresults that can be drawn from our empirical investigation can be summarized as follows.
According to the proposed statistical test conducted, tail dependence is found to be sig-nificant between regional electricity markets. These quantitative dependence measures tell usimplicitly how much another market can contribute when managing the risk of price spikes, in-dicating a framework for effective risk management. It is our belief that the statistical analysispresented here will help market participants to determine the presence of strong dependencein the tail. Picking up tail dependence could lead to a more realistic assessment of the linkagebetween electricity markets and possibly more accurate risk management and pricing models.
Finally, we point out that any pricing model that focuses on the Pearson correlation hypoth-esis may be inadequate and requires further investigation. It may be interesting to see how toincorporate time-varying tail dependence coefficient explicitly in optimal hedging strategies.Further research might see how the proposed test can be extended to account for the effects oftime-varying tail dependence.
Acknowledgments
The first author would like to thank Professor Rodney C. Wolff for his helpful comments.This work has been developed in the framework of the DP1096326 ARC Discovery Project“Managing the risk of price spikes, dependences and contagion effects in Australian electricitymarkets” administered by Macquarie University (Professor Stefan Trueck).
References
Caperaa, P., Fougeres, A. & Genest, C. (1997), ‘A nonparametric estimation procedure forbivariate extreme value copulas’, Biometrika 84, 567–577.
Davidson, R. & MacKinnon, J. (2000), ‘Bootstrap tests: how many bootstraps’, Econometric
Reviews 19, 55–68.
Efron, B. (1979), ‘Bootstrap methods: another look at jackknife’, The Annals of Statistics 7, 1–26.
9

Efron, B. & Tibshirani, R. (1993), An Introduction to The Bootstrap, Chapman and Hall, NewYork.
Frahm, G., Junker, M. & Schmidt, R. (2005), ‘Estimating the tail-dependence coefficient: prop-erties and pitfalls’, Insurance: mathematics and Economics 37(1), 80–100.
Politis, D. & Romano, J. (2004), ‘The stationary bootstrap’, Journal of the American Statistical
Association 89, 1303–1313.
Weron, R. (2006), Modeling and Forecasting Electricity Loads and Prices: A Statistical Ap-
proach, Wiley, Chichester.
10
Related Documents