Ecological Applications, 16(6), 2006, pp. 2123-2142 © 2006 by the Ecological Society of America MODELING DENITRIFICATION IN TERRESTRIAL AND AQUATIC ECOSYSTEMS AT REGIONAL SCALES ELIZABETH W. BOYER,I,9 RICHARD B. ALEXANDER,2 WILLIAM J. PARTON,3 CHANGSHENG LI,4 KLAUS BUTTERBACH-BAHL,5 SIMON D. DONNER,6 R. WAYNE SKAGGS,7 AND STEPHEN J. DEL GROSS0 8 1University of California, Department of Environmental Science, Policy, and Management, Berkeley, California 94720 USA 2U.S. Geological Survey, National Water Quality Assessment Program, Reston, Virginia 20192 USA 3Colorado State University, Natural Resource Ecology Laboratory, Fort Collins, Colorado 80523 USA 4University of New Hampshire, Institute for the Study of Earth, Oceans, and Space, Durham, New Hampshire 03824 USA 5Institute for Meteorology and Climate Research, Garmisch-Partenkirchen, Germany 6Princeton University, Woodrow Wilson School of Public and International Affairs, Princeton, New Jersey 08544 USA 7North Carolina State University, Department of Biological and Agricultural Engineering, Raleigh, North Carolina 27695 USA 8U.S. Department of Agriculture, Agricultural Research Service, Fort Collins, Colorado 80526 USA Abstract. Quantifying where, when, and how much denitrification occurs on the basis of measurements alone remains particularly vexing at virtually all spatial scales. As a result, models have become essential tools for integrating current understanding of the processes that control denitrification with measurements of rate-controlling properties so that the permanent losses of N within landscapes can be quantified at watershed and regional scales. In this paper, we describe commonly used approaches for modeling denitrification and N cycling processes in terrestrial and aquatic ecosystems based on selected examples from the literature. We highlight future needs for developing complementary measurements and models of denitrification. Most of the approaches described here do not explicitly simulate microbial dynamics, but make predictions by representing the environmental conditions where denitrification is expected to occur, based on conceptualizations of the N cycle and empirical data from field and laboratory investigations of the dominant process controls. Models of denitrification in terrestrial ecosystems include generally similar rate-controlling variables, but vary in their complexity of the descriptions of natural and human-related properties of the landscape, reflecting a range of scientific and management perspectives. Models of denitrification in aquatic ecosystems range in complexity from highly detailed mechanistic simulations of the N cycle to simpler source-transport models of aggregate N removal processes estimated with empirical functions, though all estimate aquatic N removal using first-order reaction rate or mass-transfer rate expressions. Both the terrestrial and aquatic modeling approaches considered here generally indicate that denitrification is an important and highly substantial component of the N cycle over large spatial scales. However, the uncertainties of model predictions are large. Future progress will be linked to advances in field measurements, spatial databases, and model structures. Key words: aquatic; denitrification; modeling; nitrogen cycle; regional; terrestrial. INTRODUCTION Nitrogen inputs to landscapes have been increasing all over the world, stemming from food and energy production activities supporting the growing population (Smil 1997, Vitousek et al. 1997, Galloway et al. 2004). The changing nitrogen cycle and associated abundance of reactive nitrogen (N) in the environment has been linked to many concerns, including the deterioration of air quality related to particulate matter and ground level Manuscript received 19 April 2005; revised 24 January 2006; accepted 23 February 2006; final version received 4 April 2006. Corresponding Editor: A. R. Townsend. For reprints of this Invited Feature, see footnote 1, p. 2055. 9 E-mail: [email protected]. ozone (Townsend et al. 2003), disruption of forest ecosystem processes (Aber et al. 2003), acidification of lakes and streams (Driscoll et al. 2001), and degradation of coastal waters including high-profile water quality issues such as eutrophication, hypoxia, and harmful algal blooms (National Research Council 2000, Rabalais 2002). The role of denitrification is of utmost impor- tance in this context, as it is the only mechanism by which reactive forms of N in terrestrial and aquatic landscapes are transformed back into dinitrogen (N 2 ) gas, which is the dominant component of the earth's atmosphere. Understanding factors controlling denitri- fication and its rates over space and time is crucial for quantifying the effects of human activity on the N cycle, 2123

Welcome message from author
This document is posted to help you gain knowledge. Please leave a comment to let me know what you think about it! Share it to your friends and learn new things together.
Transcript
Ecological Applications, 16(6), 2006, pp. 2123-2142© 2006 by the Ecological Society of America
MODELING DENITRIFICATION IN TERRESTRIAL AND AQUATICECOSYSTEMS AT REGIONAL SCALES
ELIZABETH W. BOYER,I,9 RICHARD B. ALEXANDER,2 WILLIAM J. PARTON,3 CHANGSHENG LI,4
KLAUS BUTTERBACH-BAHL,5 SIMON D. DONNER,6 R. WAYNE SKAGGS,7 AND STEPHEN J. DEL GROSS08
1University of California, Department of Environmental Science, Policy, and Management, Berkeley, California 94720 USA2U.S. Geological Survey, National Water Quality Assessment Program, Reston, Virginia 20192 USA
3Colorado State University, Natural Resource Ecology Laboratory, Fort Collins, Colorado 80523 USA4University of New Hampshire, Institute for the Study of Earth, Oceans, and Space, Durham, New Hampshire 03824 USA
5Institute for Meteorology and Climate Research, Garmisch-Partenkirchen, Germany6Princeton University, Woodrow Wilson School of Public and International Affairs, Princeton, New Jersey 08544 USA
7North Carolina State University, Department of Biological and Agricultural Engineering, Raleigh, North Carolina 27695 USA8U.S. Department of Agriculture, Agricultural Research Service, Fort Collins, Colorado 80526 USA
Abstract. Quantifying where, when, and how much denitrification occurs on the basis ofmeasurements alone remains particularly vexing at virtually all spatial scales. As a result,models have become essential tools for integrating current understanding of the processes thatcontrol denitrification with measurements of rate-controlling properties so that the permanentlosses of N within landscapes can be quantified at watershed and regional scales. In this paper,we describe commonly used approaches for modeling denitrification and N cycling processesin terrestrial and aquatic ecosystems based on selected examples from the literature. Wehighlight future needs for developing complementary measurements and models ofdenitrification. Most of the approaches described here do not explicitly simulate microbialdynamics, but make predictions by representing the environmental conditions wheredenitrification is expected to occur, based on conceptualizations of the N cycle and empiricaldata from field and laboratory investigations of the dominant process controls. Models ofdenitrification in terrestrial ecosystems include generally similar rate-controlling variables, butvary in their complexity of the descriptions of natural and human-related properties of thelandscape, reflecting a range of scientific and management perspectives. Models ofdenitrification in aquatic ecosystems range in complexity from highly detailed mechanisticsimulations of the N cycle to simpler source-transport models of aggregate N removalprocesses estimated with empirical functions, though all estimate aquatic N removal usingfirst-order reaction rate or mass-transfer rate expressions. Both the terrestrial and aquaticmodeling approaches considered here generally indicate that denitrification is an importantand highly substantial component of the N cycle over large spatial scales. However, theuncertainties of model predictions are large. Future progress will be linked to advances in fieldmeasurements, spatial databases, and model structures.
Key words: aquatic; denitrification; modeling; nitrogen cycle; regional; terrestrial.
INTRODUCTION
Nitrogen inputs to landscapes have been increasing allover the world, stemming from food and energyproduction activities supporting the growing population(Smil 1997, Vitousek et al. 1997, Galloway et al. 2004).The changing nitrogen cycle and associated abundanceof reactive nitrogen (N) in the environment has beenlinked to many concerns, including the deterioration ofair quality related to particulate matter and ground level
Manuscript received 19 April 2005; revised 24 January 2006;accepted 23 February 2006; final version received 4 April 2006.Corresponding Editor: A. R. Townsend. For reprints of thisInvited Feature, see footnote 1, p. 2055.
9 E-mail: [email protected].
ozone (Townsend et al. 2003), disruption of forest
ecosystem processes (Aber et al. 2003), acidification of
lakes and streams (Driscoll et al. 2001), and degradation
of coastal waters including high-profile water quality
issues such as eutrophication, hypoxia, and harmful
algal blooms (National Research Council 2000, Rabalais
2002). The role of denitrification is of utmost impor
tance in this context, as it is the only mechanism by
which reactive forms of N in terrestrial and aquatic
landscapes are transformed back into dinitrogen (N2)
gas, which is the dominant component of the earth's
atmosphere. Understanding factors controlling denitri
fication and its rates over space and time is crucial for
quantifying the effects of human activity on the N cycle,
2123

and for managing and mItIgating the severe environmental consequences associated with N pollution.
Denitrification is a reduction process performed byparticular groups of heterotrophic bacteria that areubiquitous in the environment and that have the abilityto use nitrate (N03) as an electron acceptor duringanaerobic respiration, thereby converting N03 in soilsand waters to gaseous forms (Firestone and Davidson1989). At low oxygen (02) levels, these microbialcommunities may use nitrate (N03), nitrite (N02), ornitrous oxide (N20) as alternative electron acceptors to02, with molecular N2 as the final product, given by thefollowing reaction sequence: N03- ~ N02- ~ NO ~
N20 ~ N2 (Davidson and SchimeI1995). There remainsuncertainty about the conditions favoring the variousproducts of the N03 transformation. Understandingthese controlling factors is of interest because theintermediate gaseous products are important greenhousegases whereas the N2 final product is highly inert andthus has no adverse environmental consequences.
Quantifying where, when, and how much denitrification occurs in ecosystems remains particularly vexing atvirtually all spatial scales (Van Breemen et al. 2002,Galloway et al. 2004, Groffman et al. 2006, Seitzinger etal. 2006). It is difficult to detect changes in N2 in theenvironment attributed to denitrification amid the verylarge reservoir of N2 that makes up the majority (nearly80%) of earth's atmosphere. At present, there are noscientific methods for making direct measurements ofthe rates of denitrification at the scale of watersheds orlarge regions. Even at field scales, there remain largechallenges in using direct measurements of denitrification-the measurements are often sparse, sometimesunreliable, and can vary appreciably over short distances. Understanding this variability is complicated bythe complex set of environmental variables that controlthe rates of denitrification and heterogeneity in soils andmicrobial communities (Firestone and Davidson 1989,Tiedje 1988). Because the dominant controlling factorsare highly variable over space and time, they give rise to"hot spots" and "hot moments" of denitrification thatare difficult to predict (McClain et al. 2003).
Given these difficulties, terr~strial and aquatic modelshave become essential tools for integrating currentunderstanding of the processes that control denitrification with broad-scale measurements of the rate-controlling properties so that the losses of N can be quantifiedwithin landscapes. Models provide a framework forextrapolating over a wide range of spatial and temporalscales, and over a range of climatic, soil, and land useconditions. Moreover, they are needed to quantify thecumulative effects of the rate-controlling properties onN losses along surface and ground water flow paths;these cumulative losses have important implications foraquatic ecosystems where the effects of N pollution areoften observed. Comparisons of model predictions withobservational data have been used for verification and totest hypotheses about rate-controlling processes.
In this paper, we give examples of current approachesfor modeling denitrification, and identify future needs inmeasurements and models. Our goal is not to review allof the current models of denitrification in ecosystems.Rather, we chose several mainstream examples toillustrate how denitrification losses of N in terrestrialand aquatic systems are quantified or can be inferredfrom the various conceptualizations of the N cycleunderlying the models. We use the term "loss" to refer tothe permanent removal of N from an ecosystem or flowpath by denitrification, but may also include, inreference to certain of the models, the effects of longterm N storage in terrestrial or aquatic ecosystems. Notethat this definition of "loss" differs from that used in theEuropean literature (e.g., Grimvall and Stalnacke 1996)to refer to N flux in streams or from the terrestriallandscape. We use the term "removal" in this paper torefer to the collection of processes that are responsiblefor N removal from flow paths, including permanent Nlosses by denitrification, long-term N storage, and thetemporary N removal by heterotrophic or autotrophicprocesses.
The modeling approaches described herein typicallydo not explicitly represent or simulate microbialprocesses and dynamics. Rather, they aim to representthe environmental conditions where microbial denitrification is expected to occur, based on many years ofempirical field and laboratory investigations of thedominant controlling processes conducted by ecologists,soil scientists, microbiologists, and agronomists (e.g.,Knowles 1981, Tiedje 1988, Groffman and Tiedje1989a, b, Mosier et al. 2004). The general conceptualmodel requires that four conditions are met simultaneously. These include:
1) Nitrogen availability: there must be a source ofN03 to be transformed to the various gaseous products.
2) A source of energy: organic carbon is what istypically used to fuel this process, but other suitableelectron donors may also serve this role.
3) Sub-oxic or anoxic conditions: this typically occursin waterlogged areas of soil that are therefore low indissolved oxygen, and in anoxic microsites withinotherwise unsaturated (oxic) areas of the soil profile.
4) Availability of denitrifiers: an active population ofdenitrifiers must be present, usually the facultativeanaerobes which are capable of using oxygen or nitrateas an electron acceptor. Denitrifier activity is maximizedwithin an optimal temperature range, and minimized atboth low and high temperature extremes.
The combination of these four conditions can arisefrom different environmental settings, at different times,and to varying degrees in aquatic and terrestrialecosystems, adding to the challenges of quantifyingdenitrification.
One key to understanding spatial and temporal ratesand patterns of denitrification is the role of soilmoisture. In general, denitrification is favored in suboxic conditions or in anoxic microenvironments within
larger oxygenated regions. Because N03 is preferentiallyreduced to NH4 when no oxygen is present, thecondition of complete anoxia is not required (orpreferred) for denitrification (Firestone and Davidson1989). Typically, wet areas of the landscape areassociated with sub-oxic or anoxic conditions. Thusthere is a high potential for denitrification to occur inriparian zones, wetland rice paddies, heavily irrigatedlands, and animal manure holding areas (Galloway et al.2004). While average rates of denitrification in welldrained upland systems are typically fairly low, duringprecipitation events, anaerobic microsites in the welloxygenated soils provide potential for significant gaseous N losses over large upland areas (Holmes et al.1996).
Many of the approaches to model denitrification seekto represent these coupled eco-hydrological controls bydescribing where and when in the landscape denitrification is likely to occur. Hydrology affects denitrificationin several key ways: by transporting and mixing thenecessary ingredients such as nitrate, and by changingthe oxygen status of the landscape soils and the riparianareas of aquatic ecosystems. Biogeochemical conditionsdesirable for denitrification are often found at oxicanoxic interfaces, mediated by hydrology. Oxic conditions are needed for N03 production by nitrification,denitrification requires anoxic conditions, and waterserves as the transport medium between the oxic andanoxic zones (McClain et al. 2003). For example, intemperate regions, the hydrologically connected soilsand land areas that drain to streams expand andcontract (both laterally and vertically) during periodsof wetting and drying. This causes the expansion ofsaturated areas in the landscape, especially in riparianzones where flow paths converge (Hornberger et al.1998). The associated changes in soil redox conditions inthese riparian areas often create conditions that areappropriate for denitrification. The hyporheic zone ofstreambeds is also increasingly thought to be animportant hot spot for denitrification. Strong gradientsin the oxygen status of streambed sediments occur dueto hyporheic exchange; that is, the mixing of the aeratedand thus well oxygenated stream water with deeper andanoxic subsurface flows (Bencala 1993). Such redoxgradients found in hyporheic regions favor communitiesof the facultative anaerobes, which can metabolizecarbon using either O2 or N03 as an electron acceptor(Duff and Triska 1990, Holmes et al. 1996).
MODELING DENITRIFICATION IN TERRESTRIAL ECOSYSTEMS
We have identified a variety of terrestrial landscapemodels to illustrate the range of approaches that havebeen used to quantify the rates of. N flux anddenitrification in soils and terrestrial ecosystems fromfield to regional spatial scales. The models includegenerally similar rate-controlling variables, but vary intheir complexity of the descriptions of natural andhuman-related properties of the landscape.. Models that
assume unlimited supplies or externally imposed loadsof inorganic N can be applied with relatively shortperiods of record for representation of the rate-controlling variables, while models that represent biogeochemical cycling of N and the associated short- and long-timescales of soil organic matter dynamics require simulations over longer time periods. These differences inmodel structures reflect a range of scientific andmanagement perspectives, including those of biogeochemists, ecologists, agronomists, agricultural managers, and hydrologists.
A BIOGEOCHEMIST'S ApPROACH: MASS BALANCE MODEL
Accounting for inputs, outputs, and changes instorage in landscapes, mass balance budgets haveproved useful to explore the magnitude of denitrificationoccurring over large areas. Howarth et al. (1996) putforth a mass balance budget method to quantify sourcesof N to large regions and to constrain estimates of Nlosses in the terrestrial and aquatic ecosystems of theseregions. This approach was extended to investigate totalN inputs to 16 large watersheds of the northeasternUnited States from Maine to Virginia (Boyer et al. 2002)and to explore the fate of these N inputs in the soils,vegetation, and ground and surface waters of thesewatersheds (Van Breemen et al. 2002). The methodquantified the mean annual rates of various N inputs(fertilizers, fixation, food and feed, atmospheric deposition), storage (soils and vegetation in agricultural,urban, and forested lands), and outputs (riverine export,ammonia volatilization, and in-stream denitrification),which were estimated using a series of independentmodeling approaches (Alexander et al. 2002b, Seitzingeret al. 2002, Van Breemen et al. 2002). After accountingfor the N sinks, N losses within the soils and groundwaters of the terrestrial landscape were calculated as thedifference between N inputs and all storage and lossterms; N losses accounted for '""'-'40% of the total Ninputs to the northeastern watersheds. Considering thevariety of terms included in the mass-balance calculations, Van Breemen et al. (2002) indicated thatdenitrification was the most likely mechanism forexplaining N losses in the terrestrial landscape. Storagein ground waters could account for a portion of the Nloss to the extent that the mass balance does not reflectlong-term, steady state conditions in the watersheds.The greatest N losses occurred in lands drainingagricultural areas, given the greater N inputs availableto be denitrified. The denitrification estimates wereconsidered to be highly uncertain because they reflectaccumulated errors from the other estimates (VanBreemen et al. 2002). Nonetheless, the results undeniably suggest substantial N losses occurring in terrestrialecosystems; the process of denitrification must play asubstantial role given the mass balance constraints.
Similar mass balance approaches, though based onmuch coarser resolution datasets, have been used toestimate rates of denitrification at very large regional

scales. The results suggest that huge fractions of Ninputs are lost via denitrification in the terrestriallandscape: 40% for Europe (van Egmond et al. 2002),30% for Asia (Zheng et al. 2002), 33% for land areasdraining to the North Atlantic Ocean (Howarth et al.1996), 37% for land areas draining to the Yellow-BohaiSeas (Bashkin et al. 2002), 40% for the Netherlands(Kroeze et al. 2003), 32% for the United States(Howarth et al. 2002), 16% for China (Xing and Zhu2002), and 25% for the combined area of continentsglobally (Galloway et al. 2004).
AN ECOLOGIST'S ApPROACH: DAYCENT MODEL
Among the most popular mechanistic models of Ncycling in soils used by biogeochemists and ecologists isCENTURY, which simulates the long-term dynamics ofN (among other elements) in the landscape (Parton et al.1994). A related model, DAYCENT, is the version ofthe model operating on a daily timestep (Parton et al.1998, Kelly et al. 2000, DelGrosso et al. 2001), which isappropriate for simulation of denitrification in soilsgiven that large losses are associated with changes in soilmoisture during short term· rain, melt, or irrigationevents (Parton et al. 1988). However, because DAYCENT represents the full N cycle and both short- andlong-term time scales of soil organic matter dynamics,the representation of soil water content and relatedparameters (e.g., temperature) needs to be carried outfor long time periods. DAYCENT simulates N gasfluxes from soils due to nitrification and denitrification.The model assumes that all NOx from denitrification willbe further reduced to N 20 or N2 before diffusing fromthe soil.
The denitrification submodel used in DAYCENT,originally called NGAS, was first presented by Parton etal. 1996. The DAYCENT submodel for N 20 and N 2flux from denitrification (Parton et al. 1996, 2001, DelGrosso et al. 2000) assumes that N gas flux fromdenitrification is controlled by soil N03- concentration(e- acceptor), labile C avaitability (e- donor), and O2availability (competing e- acceptor). As soils becomemore anoxic, a higher proportion ofN20 produced fromdenitrification is further reduced to N 2 before leaving thesoil (Davidson and Schimel 1995). In addition to soilwater content, soil parameters related to texture(porosity, field capacity) affect O2 availability and Ngas flux (Groffman 1991). The denitrification model isbased on the law of the minimum, i.e., it assumes thatdenitrification is controlled by the molecular species(N03 or labile C) or environmental condition (02availability) that is most limiting. The model firstcalculates total N gas flux from denitrification, thenpartitions this between N2 and N 20 using an N2:N20ratio function. The ratio function assumes that as O2availability or the ratio of e- acceptor to e- donordecreases, a larger proportion of N 20 from denitrification will be further reduced to N2 before diffusing fromthe soil to the atmosphere.
The governing equations were developed usinglaboratory data from incubations of intact soil cores(Del Grosso et al. 2000). Soil texture, WFPS (waterfilled pore space), labile C (dextrose) concentration, and15N-labeled N03 concentration were varied in a fullfactorial design similar to Weier et al. (1993). N20, N 2,and CO2 fluxes for each core were estimated frommeasured changes in the gas concentrations in theincubation chamber headspace. l\1.odel equations weredeveloped to relate total N gas flux and the N 2:N20ratio to the independent variables (WFPS, N03 concentration, and CO2 respiration). Measured CO2 respiration was used as a surrogate for labile C availabilitywhen fitting model equations.
The ability of DAYCENT to simulate N cycling hasbeen tested fairly extensively at field sites and overregional scales (Del Grosso et al. 2001, 2002, 2005). Toevaluate the model, isotopically labeled N03 was addedto the soil, and gaseous N 2 and N 20 fluxes weremeasured weekly for several years for corn and barleycrops in the field. The N 20 emission data from eightcropped sites and N03 leaching data from three croppedsites showed reasonable model performance (Del Grossoet al. 2005). However, that is the first tim~ simulated andobserved N2 fluxes have been compared. To simulate N 2fluxes correctly, the model must also realisticallysimulate decomposition and N cycling, which rely onproper representation of soil water content and temperature. Reasonable simulation of labile C availability iscrucial because most denitrifiers are heterotrophs.Proper simulation of decomposition rates is importantbecause high O2 demand associated with high decomposition rates can contribute to the anoxic conditionsthat are necessary for denitrification. Comparisons ofobserved and simulated N 2 flux rates for the data used inmodel calibration showed that the denitrification submodel satisfactorily simulated N 2 emissions for the dataused for model parameterization. Four independentvariables (WFPS, CO2 emissions, N03 concentration,and soil gas diffusivity referenced to field capacity) wereable to explain 76% of the variability in N 2 fluxes. Thisprovides evidence that the denitrification submodel isconsistent with and can explain most of the variability inthe data used for model building. Further, a test of theability of the overall DAYCENT model to simulateobserved N 2 fluxes from an independent data set wastested, using N2 flux measurements from irrigated corn(Zea mays L.) cropping in Colorado (Mosier et al. 1986),showed good model performance. The ability of DAYCENT to simulate N 2 needs to be further tested, butfield data describing N2 fluxes over space and time areextremely limited.
AN AGRONOMIST'S ApPROACH: DNDC MODEL
Another mainstream tool for exploring denitrificationin terrestrial soils is the denitrification-decomposition(DNDC) model, which was initially developed forquantifying nitrous oxide (N20) emissions from agricul-

tural soils in the United States (Li et al. 1992, 1996,2000). The capability of the model to simulate soilbiogeochemistry also allows DNDC to model emissionsfrom other ecosystems through linkages with vegetationmodels; the model can be applied from field site toregional scales.
The core of DNDC is a soil biogeochemistry model, inwhich the concept of "biogeochemical field" plays acentral role. Biogeochemical field is an assembly ofenvironmental forces or factors that vary in space andtime and are controlled by a few primary drivers (e.g.,climate, soil properties, vegetation, anthropogenicactivity) that result in a series of biochemical orgeochemical reactions to determine transport and transformation of the chemical elements in ecosystems (Li2001). DNDC contains two components to bridgebetween the primary drivers and the coupled biogeochemical cycles of carbon and nitrogen in terrestrialecosystems. The first component, consisting of soilclimate, plant growth, and decomposition sub-models,predicts the soil environmental factors using the primarydrivers as input parameters. The second componentconsists of nitrification, denitrification, and fermentation sub-models, quantifies production and consumption of N 20, nitric oxide (NO), dinitrogen (N2),
ammonia, and methane by tracking the kinetics ofrelevant biochemical or geochemical reactions, driven bythe modeled soil environmental factors. The nitrification, denitrification, and fermentation sub-models simulate activities of nitrifiers, denitrifiers, andmethanogens by tracking the soil Eh and concentrationsof relevant substrates (e.g., dissolved organic C or DOC,ammonium, nitrate, and so forth).
Denitrification is modeled with a series of biologicallymediated reductive reactions from nitrate to N 2 . The keyequations adopted in DNDC for modeling the microbialactivities include the Nernst equation and MichaelisMenten equation. The Nernst equation is a basicthermodynamic formula defining soil Eh based onconcentrations of the oxidants and reductants existingin a soil liquid phase (Stumm and Morgan 1981). TheMichaelis-Menten equation is a widely applied formuladescribing the kinetics of microbial growth with dualnutrients (Paul and Clark 1989), which usually includeDOC (i.e., energy source) and an electron acceptor (i.e.,oxidant) such as nitrate, nitrite, NO or N20. Thedenitrification process will be depressed when either theenergy source or the electron acceptor becomes limited.The values of the kinetic coefficients (i.e., Michaelisconstant Km and maximum reaction rate Vmax) in theMichaelis-Menten equation used in DNDC were adopted from the laboratory incubation experiments done byLeffelaar and Wessel (1998). The Nernst and theMichaelis-Menten equations can be linked because theyshare a common factor, the oxidant concentration. TheNernst and the Michaelis-Menten equations are linkedin DNDC through a simple kinetic scheme called the"anaerobic balloon." By tracking the evolution of soil
bulk Eh, DNDC allocates DOC and N oxides into theanaerobic balloon at an hourly time step, defining theeffective anaerobic volumetric fraction of a soil. The Ehvalue for a soil layer is estimated based on the dominantoxidant species with the Nernst equation, determiningthe size of the anaerobic balloon and the allocation ofsoil substrates inside and outside of the balloon. Onlythe substrates allocated within the balloon are involvedin the anaerobic reactions (e.g., denitrification, methanogenesis, and so on); substrates allocated outside theballoon are involved in the aerobic reactions (e.g.,nitrification, methanotrophy, and so on). The kinetics oftransformations from nitrate to nitrite, to NO, to N20,and finally to N2 are then handled by the MichaelisMenten equation. When the anaerobic balloon grows,more substrates are allocated within the balloon, therate of the reductive reactions (e.g., denitrification)increases based on the Michaelis-Menten equation, andthe probability increases that intermediate product gases(e.g., N 20, NO, and so on, which take longer to diffusefrom the anaerobic to the aerobic fraction) will befurther reduced to N 2 .
Any change in climate, soil properties and management will simultaneously alter the soil temperature,moisture, pH, Eh, and substrate concentration gradients,which will collectively affect the size of the anaerobicballoon, the substrate ava~lability, and finally theproduction of NO, N 20, and N2 . DNDC has been usedto model denitrification for both upland and wetlandecosystems. DNDC has been tested against a number ofNO and N 20 flux measurements in agricultural andforest ecosystems, and evaluated against datasets of cropyield, C sequestration, and trace gas emissions observedat croplands or grasslands worldwide (Brown et al. 2002,Farahbakhshazad et al. 2002, Zhang et al. 2002, Cai etal. 2003, Xu-Ri et al. 2003, Saggar et al. 2004, Smith et al.2004, Kesik et al. 2005, Pathak et al. 2005). DNDCcurrently quantifies N 2 fluxes based on the kineticparameters observed in the laboratory experiments(Leffelaar and Wessel 1998) as well as the N balancecontrols. The model has not been adequately validatedfor N2 fluxes due to the lack of observations. Increasingdirect measurement of N2 fluxes will provide betteropportunities to improve the model performance.
AN AGRICULTURAL MANAGEMENT ApPROACH:EPIC AND RELATED MODELS
Various agricultural management models that simulate crop production and related nutrient and C cyclinginclude components that simulate denitrification in soils.One of the more widely used models is EPIC (Williamset al. 1984, Sharpley and Williams 1990)-a dynamicsimulation model that describes the influence ofagricultural management on crop productivity anderosion. The model has been used in studies of climatechange and agriculture (Rosenberg et al. 1992, Mearnset al. 1999) and in evaluations of agricultural policy,water-quality, and field-scale management. EPIC simu-
lates the major N cycling processes in agriculturalsoils-including mineralization, nitrification, immobilization, ammonia volatilization and denitrification, runoff and surbsurface leaching-at a daily time step basedon physical principles and parameter values derivedfrom extensive model testing and specific field validation(Williams 1995).
In EPIC, denitrification is simulated as a function ofnitrate availability, C availability, soil temperature, andsoil moisture content. If the ratio of soil water content tofield capacity in a soil layer is greater than 95%(Williams 1995) or the soil water content is greater than90% of the saturation value (Marchetti et al. 1997),indicating nearly saturation conditions and likelyanoxia, denitrification can occur (Williams 1995). Therate of denitrification (DN, in kg.ha-1.d-1) in a soil layeri over time t is determined from the mass of nitrate(N03, in kg.ha-l~d-l), the organic Ccontent (C~rg, in %)and a soil temperature factor used in other nutrientcycling processes in the model (AT,z), such that
DNi = N03i (1 ~ exp[-1.4AT,iC~rgt]) (1)
where AT,i= T/(T+exp[9.93 - 0.321T]) for T=the soiltemperature. If the soil temperature is less than or equalto zero, no denitrification is assumed to occur.
The field -scale agricultural management modelGLEAMS (Leonard et al. 1987, Knisel 1993) wasdeveloped from both EPIC and CREAMS and employsa more explicit description of soil water content. InGLEAMS, the concentration of nitrate-N removed viadenitrification over a period of time (t) is a function ofthe factors describing the soil water content (Wj ), thesoil temperature, and the organic C content, such that
DNi = N03i (1 - exp[-WfAT,iC~rgt]) (2)
where c~rg = 24 X (0.002e + 0.0042) and ~r= (SW [FC+O.l(SAT - FC)])/(SAT - [FC+0.I0(SAT - FC)]),and where SW is the soil water content, FC is the fieldcapacity, and SAT is the saturation level. Under thisformulation, denitrification only occurs if the soil watercontent is greater than a parameter related to the soilwater content at field capacity and saturation. Thefraction of soil nitrate-N lost to denitrification increasesquickly as soil water content increases beyond the fieldcapacity. As in EPIC, no denitrification occurs if the soiltemperature is less than or equal to zero.
The EPIC and GLEAMS method of simulatingdenitrification neglects denitrification that may occurin anaerobic micro-zones when the soil is not at fieldcapacity or saturation. Therefore, simulation modelslike EPIC and GLEAMS will tend to estimate a lowerfrequency of denitrifier activity than observed in the field(Marchetti et al. 1997). Conversely, the models tend tooverestimate the magnitude of denitrification when soilwater content exceeds the threshold defined for denitrification. For example, Marchetti et al. (1997) foundthat the simulated denitrification rate in EPIC can
rapidly reach the maximum allowable value once soilwater content exceeds the assumed 90% of saturationthreshold value. The method of representing soil watercontent is particularly poorly suited to simulatingdenitrification in well-drained soils where the watercontent rarely rises to saturation or field capacity.
The popular SWAT (soil water assessment tool) is aphysically based mechanistic simulation model thatdescribes processes of water movement, sediment transport, crop growth, and nutrient cycling on land and inwater. Input data are required on climate, soil properties, topography, vegetation, and land managementpractices. SWAT, a modification of the SWRRB model(simulator for water resources in rural basins; Arnold etal. 1990), incorporates features of several United StatesDepartment of Agriculture models (i.e., CREAMS,GLEAMS, EPIC) to describe land surface and subsurface processes; it uses components of the QUAL2Emodel to simulate in-stream and reservoir transport ofcontaminants. It has been applied at a wide range ofwatershed scales, including hydrologic units of theUnited States in the Mississippi River Basin (Brezoniket al. 1999). The N loss from denitrification (mass perarea per time) is estimated for individual soil layers as afunction of the initial nitrate concentration in the soilwater, temperature, and organic C percentage, such asthat described in Eq. 1. Denitrification losses increasewith increases in temperature and C.
The highly detailed Dutch soil chemistry modelANIMO (Kroes and Roelsma 1998) provides a methodfor estimating denitrification under both anaerobic andpartially anaerobic soil conditions. In ANIMO, denitrification is estimated by either the rate of soil organicmatter respiration or the soil nitrate and moistureavailability, depending on which is more limiting(Schoumans and Silgram 2003). The aeration status ofthe soil is determined from the equilibrium betweenoxygen demand for respiration and nitrification and theoxygen supply, which is based upon soil texture andhydrology. Under fully aerobic soil conditions, nitrification and soil respiration occur at optimal levels and nodenitrification occurs. Under fully anaerobic soil conditions, the denitrification rate is estimated via a basicfirst-order rate equation. In the case of partiallyanaerobic conditions, soil respiration and nitrificationare limited by oxygen availability (in soil and viaatmospheric diffusion) and a potential rate of denitrification is estimated from the respiration rate. In theseconditions, the final model denitrification rate isassumed to be the lower of the denitrification ratesestimated from the respiration and first order rateequation.
Field-scale N models with denitrification componentshave also been developed that are capable of modelingN dynamics and turnover in agricultural ecosystems andwatersheds under various management practices and soilconditions. The DRAINMOD model (Skaggs 1999) anda new N version of the model, DRAINMOD-N II

(Youssef 2003, Youssef et al. 2005), quantify N lossesand transport from agricultural lands with shallowwater tables where artificial drainage systems (eitherburied drain tubing or open ditches) are extensivelyused. Watershed-scale versions of DRAINMOD havebeen developed and extensively evaluated based on datacollected on a 100-km2 watershed on the North Carolinacoastal plain (Skaggs et al. 2004, Fernandez et al. 2005).DRAINMOD is based on water balances in the soil andat the soil surface. It uses functional methods to quantifyinfiltration, subsurface drainage, surface drainage, evapotranspiration, seepage, freezing, thawing, snowmelt,and seepage. The model predicts the water table depthand soil water contents above the water table, drainagerates and the other hydrologic components on an hourlyand daily basis for long periods of hydrologic record.Hydrologic predictions of the model have been testedand found to be reliable for a wide range of soil, crop,and climatological conditions (Skaggs 1999).
DRAINMOD-N II considers both N03-N and NHx
N pools in modeling mineral N and simulates nitrification and denitrification processes. It includes a comprehensive fertilizer submodel that simulates theapplication of NH4 and NH4-forming fertilizers, including urea and anhydrous NH3, and associated short-termprocesses such as fertilizer dissolution, urea hydrolysis,temporal change in soil pH, and NH3 volatilization. Itsimulates organic C dynamics using a simplified C cyclethat includes a description of N mineralization/immobilization processes and the transport of organic N.Denitrification is modeled using Michaelis-Mentenkinetics for N03- N; the influence of organic C on theprocess rate is implicitly expressed in the exponential soildepth function. The maximum denitrification rate is sitespecific and depends on the soil organic matter contentand texture and agronomic practices (tillage practicesand additional organic C sources). N removal indrainage channels is modeled according to a first orderdecay process. Modeled daily nitrate loads usingDRAINMOD were recently compared with measuredloads at the outlet of a 3000-ha forested catchment ineastern North Carolina for the period 1996-2001(Fernandez et al. 2005). Predicted nitrate loads wererelatively unbiased and showed good agreement onaverage across multiple years with the measured loadsduring this period, with low prediction errors followingcalibration.
A HYDROLOGIST'S ApPROACH:INCA AND RHESSys MODELS
Two popular mechanistic models are illustrative ofapproaches that have strong descriptions of catchmenthydrology coupled with relatively simple denitrificationfunctions. The INCA (integrated nitrogen in catchments) model is a water and N mass balance simulationmodel; it estimates the integrated effects of point anddiffuse N sources on stream nitrate and ammoniumconcentrations and loads and also estimates the N loads
related to processes in the plant/soil system (Whiteheadet al. 1998). It has been most commonly applied towatersheds of 1000-2000 km2 within the UK, but morerecently has been modified for use in smaller Europeanwatersheds from 0.005 to 4000 km2 (Wade et al. 2002).INCA quantifies plant uptake of nitrate and ammonium, nitrification, denitrification, and mineralizationand immobilization within each land-use type and subcatchment. The model simulates flow and N transport in1-km2 or smaller cells in each of six land-use types.Biogeochemical reactions are limited to the soil zonefrom which water and N are leached to deeper groundwater. The fraction of stream water flow that is derivedfrom soils and deep groundwater is estimated using abase-flow index method. Long-term changes in soil andground water storage are modeled using componentsfrom the TNT model (Beaujouan et al. 2001); theseinclude estimated terms for water volumes and residencetimes. Water storage in soils is described by a soilmoisture captured through the use of a "retention" term(which responds slowly and constitutes the majority ofsoil water storage) and a drainage term (which respondsrapidly to water inflows). Estimates of the soil andgroundwater contributions to stream flow and the waterresidence times and storage volumes are generallyrecognized as having large uncertainties (Wade et al.2002). Denitrification is modeled according to a firstorder function of soil wetness and the nitrate concentration of the soil water; the denitrification ratecoefficient is a mass flux expressed as length per time.The denitrification rate and other model coefficients aremanually adjusted or statistically estimated, dependingon the availability of data and user discretion; INCAmodels are highly parameterized and unique parametersets are not always feasible to obtain (e.g., Wade et al.2002).
The regional hydrological ecosystem simulation system (RHESSys; Band et al. 1991, 2000) is also widelyused to explore N dynamics at the watershed scale(Creed et al. 1998, Band et al. 2001). RHESSys simulatesthe coupled effects of C, N, and hydrological processesusing a coupling of biogeochemical dynamics from theBIOME_BGC (Running and Hunt 1993) and the NGASmodel used in DAYCENT as described above (Parton etal. 1996). Streamflow generation, including the distribution of surface wetness, saturation areas, and theflowpath partitioning of overland flow, throughflow,and baseflow, is based on the implementation of variablesource-area concepts based on topography, quantifyingrouting of water through the landscape from patch topatch using either a lumped topographic approachadapted from TOPMODEL (Beven and Kirkby 1979)or a distributed approach adapted from the DHSVMmodel (Wigmosta et al. 1994). For example, oneinsightful modeling result stems from an application ofRHESSys to a forested watershed in Maryland, providing high frequency simulations of denitrification ratesover time (Band et al. 2001). During both wet (January)
and dry (August) periods, the downslope, riparianpatches typically maintain high soil water suitable forhigh denitrification. Riparian areas are wetted morefrequently than uplands, thus N and organic matter maybe accumulating in upland regions during the dryperiods. The highest overall denitrification rates wereobserved in riparian zones in simulations for bothJanuary and August. However, significant rates ofdenitrification were observed in January in upland areasthat became transiently saturated during precipitationevents, whereas these upland areas have relatively lowrates in August when dry conditions prevail. Some of thelowest denitrification rates occur in the well-drainedmid-slope areas (Band et al. 2001). The results of thismodel application highlight the importance of understanding the coupling of hydrologic and biogeochemicalprocesses in identifying denitrification hot spots withinthe landscape of watersheds. As noted for the INCAmodel, RHESSys also lacks explicit representation ofground water volumes and residence times, and thusdoes not quantify N that is denitrified in ground waters.
Similarly, another watershed scale approach usessimilar concepts based on variable source area conceptsof streamflow generation to quantify denitrification inthe landscape, based on new formulations of the modelTOPMODEL with coupled C and N components (e.g.,Beaujouan et al. 2002, Whelan and Gandolfi 2002).Whelan and Gandolfi (2002) predicted spatial andtemporal distributions of denitrification for a 15-yearperiod in a l-km2 catchment in southwest England,where denitrification is controlled principally by the soilwater regime and available soil C. Stochastic generationof model parameters provided estimates of uncertaintiesin denitrification. The model developed by Beaujouan etal. (2002), called TNT2 (topography-based N transferand transformation model), is based on hydrologic andbiogeochemical properties of a 5-km2 catchment inwestern France. The model combines a fully distributedversion of TOPMODEL with the N transformationssimulated in an existing agronomic plant-soil model,STICS (Brisson et al. 1998). The results demonstrate theimportance of using a relatively simple mode to accountfor the spatial distribution of biogeochemical processesalong flow paths and their effects on denitrification andN flux.
Progress has been made in evaluating various topographic metrics as indicators of the effects of soilproperties on soil moisture and denitrifying bacterialpopulations. The results are generally consistent withthose of models based on variable source area concepts.The use of topography as a predictor of denitrification isattractive given the readily available digital elevationmodel data. Three studies of N 2 and N 20 emissions innorthern grasslands of North America (Pennock et al.1992, Van Kessel et al. 1993, Corre et al. 1996) useddigital elevation models (DEMs) to derive slopegradients and curvature and found that the highestpredicted emission rates occurred in downslope areas
and depressions. This is not unexpected, given that suchconvergent areas of the landscape are also directlyassociated with the accumulati0n of water according totopographic properties (Beven and Kirkby 1979).
Few studies, however, have evaluated the influence oftopography on soil microbial activity. In one recentinvestigation of the effect of topography on the activityof denitrifiers under different humidity conditions at a1.3-km2 site in the northern grasslands of Canada,Florinsky et al. (2004) evaluated a rather wide range oftopographic and soil properties, including nine topographic attributes, two soil properties, and six propertiesof soil microbial activity. The resulting regressionmodels indicated that the denitrification rate generallywas highest in wetter soils and areas where nutrientsupplies to the microbiota were topographically controlled. Topographic properties, especially slope and therelative position of a point on the landscape, influencedthe denitrification rate and denitrifier enzyme activity. Indry soils, only the number of denitrifiers was related totopography; various measures of denitrifier activity weregenerally unrelated to relief and probably reflected soilaeration status. Other recent work clearly demonstratesthat nitrification potentials and N cycling in soils aredirectly related to topographic controls on the distribution of soil moisture (Creed and Band 1998, Lavermanet al. 2000, Hefting. et al. 2004, Machefert et al. 2004).
MODELING DENITRIFICATION IN AQUATIC ECOSYSTEMS
To date, empirical and mechanistic models of the ratesof denitrification in aquatic ecosystems have been basedon relatively few studies with many of the measurementscollected primarily in small lakes and in the headwaterand low-order streams of temperate regions (e.g.,Howarth et al. 1996, Alexander et al. 2000, 2002a,Seitzinger et al. 2002). The estimated rates have largeuncertainties related to limitations in the mass balancetechniques and the in situ and laboratory measurementsof sediment cores; these include the poor accounting ofN inputs in some studies and the exclusion of hyporheicflow effects in others (Seitzinger et al. 2002). Littleinformation has been reported on the seasonal variability in denitrification rates (Royer et al. 2004) and thebiogeochemical controls on aquatic rates (Seitzinger1988), including the importance of water-column nitrateconcentrations (i.e., saturation kinetics) and propertiesof the benthic sediment of streams and lakes such asorganic C content, grain size, and the density of benthicmicrobial communities. Moreover, few studies of eitherheterotrophic or autotrophic processing of N havemeasured N removal rates along a stream continuumto systematically evaluate the influence of streamdynamics on metabolic processes and especially denitrification rates (Garcia-Ruiz et al. 1998). Theselimitations have made cross-site comparisons difficultand complicated efforts to generalize denitrificationrates over time and space. Only recently have studiesof N cycling and loss in streams employed reliable tracer
a
10
- SPARROW Mean, U.S. Rivers (TN)SPARROW 90% CI
- CB SPARROW (TN)Howarth Synthesis (N03)* Delaware R. (DIN)
• Potomac R. (TN)+ Rhine R., Elbe R., Warnow R. (DIN)i.. Rhine R.+ S. Platte R. (N03)* Neversink R. (N03)
• Duffin Ck. (TN)o San Antonio R. (TN)
+
1.7 ......---------------------------.
1.6 *1.5
1.4
b 1.3
E 1.2 +CO 1.1 At..~ ....(j) 1.0
.~ 0.9
'* 0.8'- 0.7ro6 0.6E 0.5
~ 0.4
Z 0.3
0.2
0.1
O+------.....--~,;;,.:".,;,...:.:...~~~ .......a_--.......0.4
Stream depth (m)
by = 88.453x-o·3677
(2 = 0.73
10 100 1000
Stream depth/time of travel (m/yr)
100;? 90~
E 80CO~ 70(j)
60c
ro 50>
400E~ 30
Z 20
10
0
0
DO
o
o
o o
oo
•10000
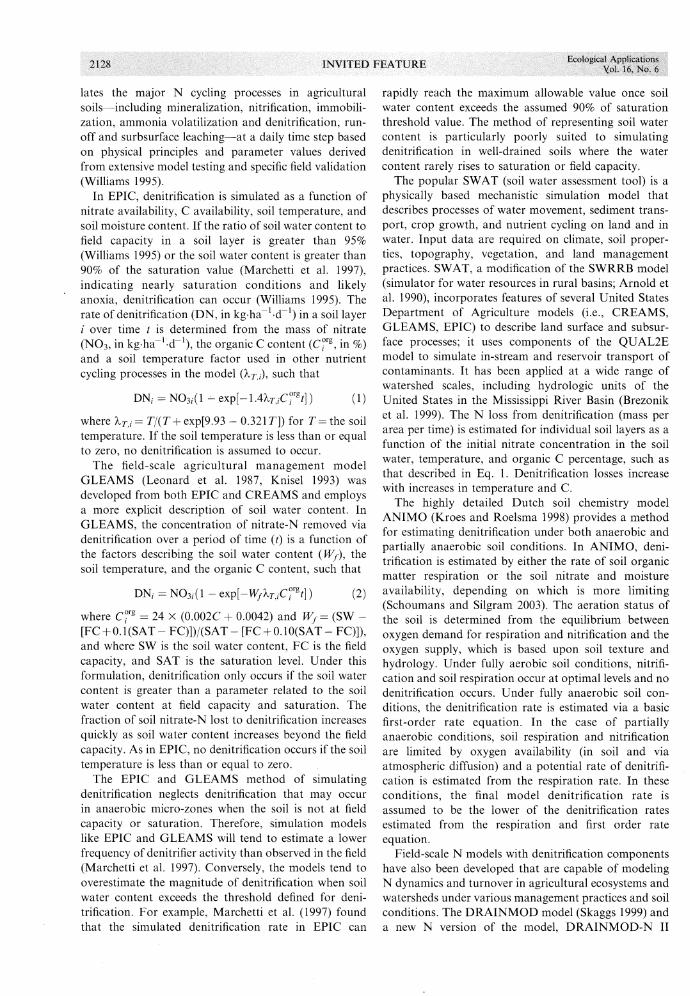
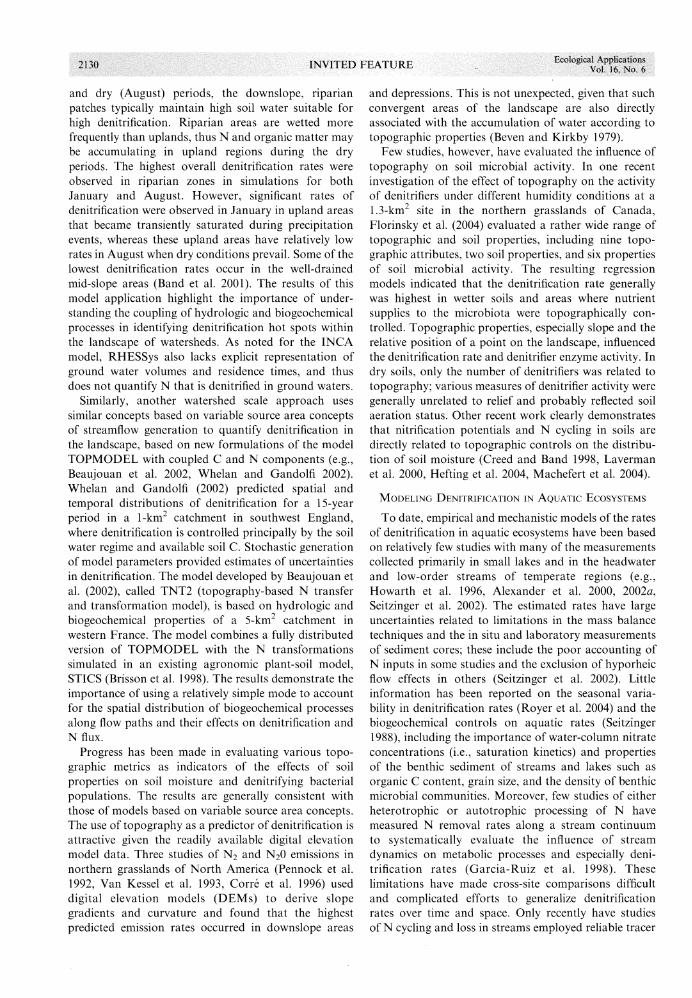
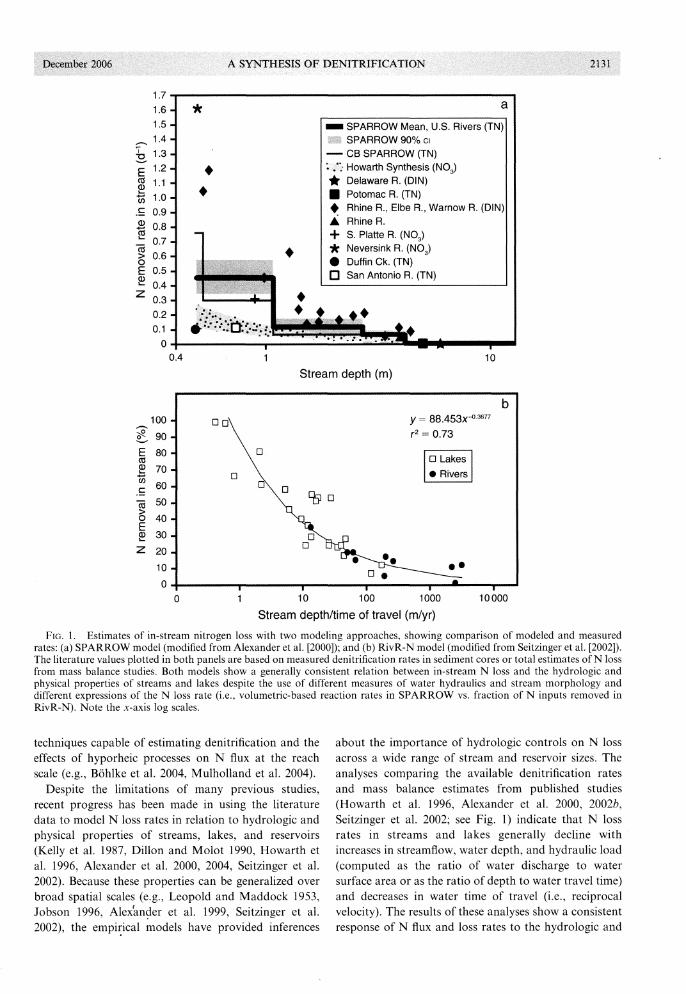
FIG. 1. Estimates of in-stream nitrogen loss with two modeling approaches, showing comparison of modeled and measuredrates: (a) SPARROW model (modified from Alexander et al. [2000]); and (b) RivR-N model (modified from Seitzinger et al. [2002]).The literature values plotted in both panels are based on measured denitrification rates in sediment cores or total estimates of N lossfrom mass balance studies. Both models show a generally consistent relation between in-stream N loss and the hydrologic andphysical properties of streams and lakes despite the use of different measures of water hydraulics and stream morphology anddifferent expressions of the N loss rate (i.e., volumetric-based reaction rates in SPARROW vs. fraction of N inputs removed inRivR-N). Note the x-axis log scales.
techniques capable of estimating denitrification and theeffects of hyporheic processes on N flux at the reachscale (e.g., Bohlke et al. 2004, Mulholland et al. 2004).
Despite the limitations of many previous studies,recent progress has been made in using the literaturedata to model N loss rates in relation to hydrologic andphysical properties of streams, lakes, and reservoirs(Kelly et al. 1987, Dillon and Molot 1990, Howarth etal. 1996, Alexander et al. 2000, 2004, Seitzinger et al.2002). Because these properties can be generalized overbroad spatial scales (e.g., Leopold and Maddock 1953,Jobson 1996, Alexan~er et al. 1999, Seitzinger et al.2002), the empi~ical models have provided inferences
about the importance of hydrologic controls on N lossacross a wide range of stream and reservoir sizes. Theanalyses comparing the available denitrification ratesand mass balance estimates from published studies(Howarth et al. 1996, Alexander et al. 2000, 2002b,Seitzinger et al. 2002; see Fig. 1) indicate that N lossrates in streams and lakes generally decline withincreases in streamflow, water depth, and hydraulic load(computed as the ratio of water discharge to watersurface area or as the ratio of depth to water travel time)and decreases in water time of travel (i.e., reciprocalvelocity). The results of these analyses show a consistentresponse of N flux and loss rates to the hydrologic and

Different functional forms of this exponential relationhave been used in the various models described below.Note that the mass-transfer coefficient is equivalent tothe product of the reaction rate coefficient and the meanwater depth or may be estimated as the quotient of themeasured areal rate of N removal (related to hetero-
representation of N transport in streams and reservoirs.Other more specialized models are appropriate for useon specific water bodies and provide a more detailedmultidimensional representation of aquatic N transport(e.g., Cerco and Cole 1995).
The rate expressions used in the models describedbelow assume first-order kinetics, i.e., the rate of N lossby denitrification from the water column is proportionalto the N conce~tration, such that the concentrationdeclines exponentially according to a specified reactiontime (a zero-order process would correspond to aconstant rate of N loss per unit of time). In a reactionrate expression, the final N concentration at a downstream location on a stream reach, C~n' can beapproximated as a function of the initial upstreamconcentration, C~it' and the effects of in-stream removalprocesses acting on the concentration in a water parcelduring its transport along the reach, and is expressedaccording to an exponential function of thexeaction ratecoefficient, kc (in units of reciprocal time), and the meansolute time of travel (TR) along the stream reach, suchthat
The reaction rate describes N removal on a volumetricbasis and is, therefore, dependent on dimensions of thewater volume such as depth (Stream Solute Workshop1990). Note that, for simplicity, Eq. 3 and subsequentexpressions of the in-stream loss functions ignore theincoming supply of N along the stream reach. In manymodels (e.g., Smith et al. 1997), diffuse nitrogen sourcesthat are introduced at various locations along a streamreach are assumed to travel on average one half thelength of the reach, and therefore, are only subjected toone half of the solute time of travel. Also· note that insome models as described below the functional form ofthe relation in Eq. 3 describes first-order reactionsrelated to in-stream load rather than concentration.
Alternatively, N removal has been described as a fluxto the benthic sediment, measured according to a masstransfer coefficient, v, expressed in units of length pertime. This depth-independent measure of N removalquantifies the vertical velocity at which N migrates intothe sediment. Accordingly, the final N concentration isan exponential function of the mass-transfer coefficient(v) and the reciprocal of the vertical water displacementin the water body expressed as a ratio of the mean watertime of travel to the mean depth (d), such that
(4)
(3)
N N (TR)Cfin = Cinitexp -vd .
physical properties of streams and lakes despite the useof different measures of water hydraulics and streammorphology and different expressions of the N loss rate(i.e., volumetric-based reaction rates, mass-transferrates, or fraction of N inputs removed).
The empirical relations reported in these studies areconsistent with current understanding of the physicaland biological mechanisms that explain N loss from thewater column (Stream Solute Workshop 1990, Findlay1995, Harvey and Wagner 2000, Peterson et al. 2001,Thomas et al. 2001 )-namely that the hydrological andphysical properties of streams and lakes exert a majorcontrol on water and N contact with the benthicsediment and exchange in stream hyporheic zones wheredenitrification and biotic uptake occurs. Greater watersediment contact and N removal by denitrification andbiotic uptake and organic N burial (e.g., expressed as areaction rate or as a fraction of N inputs) is generallyexpected in small streams where water volumes are smallrelative to the benthic surface area. Greater N removal isalso expected to occur in poorly flushed lakes and inreservoirs with long water residence times. The conceptual and empirical basis for the importance of smallstreams and hyporheic zones as metabolically activelocations for N processing and removal is found in agrowing body of experimental research on autotrophicand heterotrophic processes in streams (e.g., Thomas etal. 2001, Bohlke et al. 2004, Mulholland et al. 2004). Thedevelopment of nutrient spiraling concepts has provideda mathematical framework (e.g., Newbold et al. 1981,Stream Solute Workshop 1990) for modeling thelongitudinal distances in streams over which N is cycledamong inorganic and organic forms and permanentlyremoved from waters via denitrification. Notableexceptions have also been reported to these generalizations about the effects of the hydrologic and physicalproperties of streams on N loss that are related to theeffects of floodplains of large rivers. For example, N lossby denitrification in sections of the Mississippi River andsoutheastern U.S. rivers generally increases with elevated water depth because of the increase in hydrologicconnections to microbially active locations on thefloodplain (Richardson et al. 2004, Scott et al. 2004).
The models used to quantify denitrification andaggregate N losses in aquatic ecosystems range fromhighly detailed mechanistic models, which simulatemultiple components of the N cycle, to simpler sourcetransport models that reflect more aggregate N-relatedprocesses estimated using empirical functions. Despitethese differences, the models are similar in their relianceon two fundamental types of N loss-rate expressions foraquatic ecosystems. Our summary of the principalaquatic modeling approaches is organized accordinglyand describes reaction rate and mass flux rate expressions of denitrification and total N loss (i.e., inclusive oforganic N storage). We illustrate the use of theseapproaches for a selected set of reaction and masstransfer type models that provide a one-dimensional

trophic or autotrophic processes) and the water-columnN concentration (Stream Solute Workshop 1990). Masstransfer coefficients are frequently used in tracer studieswhen comparing removal rates among streams ofdiffering size (Stream Solute Workshop 1990, Petersonet al. 2001, Bohlke et al. 2004) and have been used inempirical mass-transport models of denitrification andparticulate settling and storage processes in lakes andreservoirs (Kelly et al. 1987, Chapra 1997). The masstransfer coefficient generally provides a more intrinsicmeasure of the effects of non-hydrologic properties on Nremoval (e.g., sediment grain size, organic C, dissolvedoxygen, and microbial population densities) than avolumetric-based reaction rate that includes the effect ofdepth (Stream Solute Workshop 1990). According tofirst-order assumptions, the mass-transfer coefficientwould be expected to remain relatively constant withincreases in N concentrations, and thus, the areal rate ofN removal (e.g., by denitrification) would rise proportionally with increases in N concentration.
REACTION-RATE EXPRESSIONS
Applications of the empirical SPARROW waterquality model (spatially referenced regressions on watershed attributes) have used a flow-dependent reactionrate expression to estimate the long-term net N loss instreams (e.g., Smith et al. 1997, Alexander et al. 2000).Alternative mass-flux rate expressions have also beenrecently developed for the model and are discussed inSchwarz et al. (2006); these give virtually identicalestimates of the in-stream N loss as compared with thosebased on reaction-rate expressions. SPARROW employs a hybrid statistical and process-based approach toestimate N sources and transport in watersheds andsurface waters under mean-annual flow conditions. Themodel structure consists of a detailed stream andreservoir network (e.g., 1:500000 scale with l-km2 gridfor the United States [Nolan et al. 2002]; 1: 100 000 scalewith 30-m grid for New England [Moore et al. 2004])that supports the quantification of N losses separatelyfor terrestrial and aquatic ecosystems. Model parameters are determined using nonlinear estimation techniques and mass balance constraints on model inputs(sources) and outputs (riverine measurements of nutrientexport). The parameter estimation is driven by spatialcorrelations between measured mean-annual N loads instreams and the geography of N sources (e.g., atmospheric deposition, fertilizers, human and animal wastes)and climatic and hydrogeologic properties of watersheds(e.g., precipitation, topography, vegetation, soils, waterrouting) that influence N transport. Stream N loads arestandardized, in a prior modeling step, to reflect longterm mean conditions by adjusting for intra- andinterannual seasonal and flow variability. SPARROWmodeling techniques have been shown to appreciablyimprove the accuracy and interpretability of modelparameters and the predictions of N loadings andsources in streams and rivers in comparison to those
estimated using conventional regression approaches(e.g., Smith et al. 1997, Alexander et al. 2000, 2002b).The models statistically account for 88% to 96% of thespatial variability in stream N loads and the modelprediction errors range from 20% to 55% for individualreaches. In modeling in-stream N loss, a depth-dependent reaction rate coefficient is estimated for each streamsize class (Fig. 1). Thus, the N mass flux (e.g., kgjyr) atthe outlet of a reach i (that results exclusively from theeffects of in-stream loss processes acting on the upstream N flux), Nf, is estimated in a reaction-rateexpression as a function of the upstream N flux enteringreach i from reach j (N}), the mean water time of travel(TR~; units of time) in the modeled reach for stream-sizeclass k (defined according to discrete intervals of meanstreamflow or depth), and a stream-size dependentreaction-rate coefficient (8~; units time-I) such that
(5)
Because SPARROW is based on estimates of the longterm mean-annual flux of total N in rivers, the estimatedin-stream loss rates are indicative of permanent or longterm losses of N; this principally includes denitrification,but may also include the long-term storage of particulateand organic N in rivers and floodplains. The in-streamloss rates estimated in the model are generally similar tothose estimated from literature denitrification measurements and mass balance studies (Fig. 1). Estimates of thefraction of N input to streams that is removed span awide range depending on the water time of travel andchannel sizes in watersheds, but may range from as littleas a few percent in some small eastern watersheds to asmuch as 900/0 in relatively arid watersheds of the westernGulf of Mexico region (Alexander et al. 2001). Onelimitation of this and other models applied at largespatial scales is that the spatial resolution of the streamnetwork and associated maps of landscape propertiesmay not be sufficient to provide a clear separation of theeffects on nitrogen loss of in-stream processes fromthose caused by riparian or terrestrial processes. Inaddition, SPARROW does not explicitly quantifydenitrification in ground water as separate from theprocesses that affect the long-term storage of nitrogen insoils and ground waters; N storage may reflect theeffects of long groundwater residence times thatsignificantly delay the delivery of nitrogen to streamsfrom N sources (e.g., Bohlke and Denver 1995, McIsaacet al. 2001).
In mechanistic source-transport models, the rate of Nloss via denitrification in streams is frequently modeledas a first-order reaction process. Mechanistic watershedsimulation models, such as HSPF (hydrologic simulation program-Fortran; Bicknell et al. 2001) and INCA(integrated N in catchments; Whitehead et al. 1998,Wade et al. 2002), estimate the N concentration leavingstream reach or cell i (C~03) as a function of the watercolumn concentration of N entering from the upstream
(7)
reach or cell j (C~03), the water temperature (T:), andthe water time of travel (TR), such that
C~03 ~ CY03 exp(_esTR~eT:-20) (6)
where eT: -20 is a simplified temperature-dependent
expression of the Arrhenius equation (Chapra 1997)for observed values of temperature (T') in units ofcentigrade, and eT
' is the estimated Arrhenius coefficient(values above unity indicate a positive relation betweenthe loss rate and temperature; values below unityindicate a negative relation).
HSPF is the most complex of the available waterquality mechanistic simulation models of watersheds. Itoriginated from the Stanford watershed model and cansimulate the hydrologic and water-quality processes onpervious and impervious land surfaces and in streamsand well-mixed impoundments (Bicknell et al. 2001).The model operates on a daily time step and includescomponents that reflect the major N sources in watersheds and the principal N processes in soils, shallowgroundwater, and aquatic systems. HSPF is oftenapplied to relatively small catchments; one of the largestapplications has been to the whole Chesapeake Baywatershed of 160000 km2 (Shenk et al. 1998). INCA alsooperates on a daily time step and simulates point anddiffuse N sources with components that describe soil Ntransformations and water and N transport in shallowsoils and groundwater.
The estimates of denitrification rates in these modelsmay be manually adjusted or statistically derived at theuser's discretion, depending on the availability ofparameter estimation software and data for calibrationor validation; rate coefficients may also vary spatially,depending upon the spatial segmentation of the streamnetwork. The rates of denitrification reported for HSPFmodel applications to Chesapeake Bay streams rangefrom 0.024 to 0.24 d- I (G. Shenk, personal communication), whereas higher rates ranging from 5 to 20 d- 1 havebeen reported for large streams in the Ipswich RiverBasin (Filoso et al. 2004; however, riparian N losses arealso included in these estimates). Denitrification rates ofless than 0.1 d- I have been reported for certainapplications of the INCA model in the River Dee inScotland (Wade et al. 2001). Less information has beenreported on the uncertainties (e.g., standard error of thecoefficient estimate) associated with the reported denitrification rates in these models as well as whether therates change in response to changes in water volume,flow, or depth. Concerns have been previously expressed(Beven 2002, Wade et al. 2002) about the uncertainties inthe predictions from detailed mechanistic models relatedto difficulties in obtaining unique parameter values forlarge numbers of process rates. Thus, it is unclear fromthe current literature how accurately mechanistic modelsseparate denitrification from autotrophic and heterotrophic uptake processes (Filoso et al. 2004). In general,the low rates of in-stream denitrification compared to
those for biotic uptake processes in many streams(Mulholland et al. 2004) may complicate the ability tostatistically resolve differences in these rates in complexmechanistic models, based solely on calibrations tomeasured N concentrations in streams without theadditional use of in-stream measurements of denitrification.
MASS-FLUX RATE EXPRESSIONS
Mass-flux rates have been most commonly used inempirical mass-transport models for lakes and reservoirsto quantify losses from denitrification and organic Nburial in the benthic sediments (Kelly et al. 1987,Chapra 1997). In quantifying N loss in reservoirs, amass-flux expression has been recently used in theSPARROW model (Alexander et al. 2002a, 2004,McMahon et al. 2003; mass-flux rate expressions havealso been developed for streams in SPARROW, seeSchwarz et al. 2006). The N mass flux at the outlet of areservoir segment i (that results exclusively from theeffects of in-stream loss processes acting on the N fluxentering from the upstream segment), NF, is estimated asa function of the upstream N flux entering segment ifrom segment j, NY, and an exponential function of thereciprocal of the areal hydraulic load (qi I
; units oflength time-1) in the reservoir, a mass-transfer coefficient (vR
; units of length time-I), and a water temperature Arrhenius expression, such that
R R 1 T'-20Ni = Nj ( R -1) e I •
1 + V qi
The areal hydraulic load is computed as the quotient ofthe outflow discharge to surface area of the impoundment and assumes that the surface area of the impoundment accurately reflects the surface area of the benthicsediments (this expression is equivalent to the ratio ofdepth to water time of travel, the reciprocal of the termin Eq. 4). In previous SPARROW N models, estimatedmass-transfer coefficients have ranged from 3 to 18 mjyr(Alexander et al. 2002a, McMahon et al. 2003) and arewithin the range typical for lakes (Howarth et al. 1996,Alexander et al. 2002a). This type of mass fluxexpression (without temperature) has been widely usedto model total phosphorus removal in lakes andreservoirs (Reckhow and Chapra 1982).
Two recent examples, where mass-flux expressionshave been applied to streams and rivers, include thequasi-process-based PolFlow model (de Wit 2001) andthe THMB (terrestrial hydrology model with biogeochemistry) hydrological model, formerly known asHYDRA (Donner et al. 2002). The former is a sourcetransport watershed model that has been used toquantify mean-annual total N flux in the watersheds ofthe Rhine and Elbe Rivers. PolFlow (de Wit 2000) wasrecently expanded to include water and nutrient routingcomponents similar to those of SPARROW (de Wit2001). The model accounts for various natural and

anthropogenic N sources, storage and permanent loss ofN in soils and shallow and deep groundwater, and Ndelivery to surface waters. In PolFlow, the N mass fluxat the outlet of reach segment i is estimated as a functionof the upstream N flux entering reach segment i fromsegment j and stream and reservoir loss processes, suchthat
where Si is the water-level gradient (i.e., channel slope)of the segment (a value of zero is used for reservoirs), qiis the areal hydraulic load (e.g., ratio of depth to watertime of travel) or specific discharge for the stream orreservoir associated with the reach, and af and b~ areestimated nutrient loss parameters. The estimates of Nloss refer to the total form (as in SPARROW), and thus,may include denitrification and sedimentation processesrelated to storage of organic N in streams, floodplains,and reservoirs. According to the PolFlow model,nitrogen loss in streams would be expected to decreaseas the channel slope or specific discharge increases.Because water depth generally increases at a faster ratethan the solute time of travel per unit of channel length(i.e., reciprocal velocity) longitudinally in streams(Leopold and Maddock 1952, Stream Solute Workshop1992), specific discharge would be expected to increaseand nitrogen loss decrease in higher-order streams (arelation that is consistent with the water time-of-traveldata and the functional relation for in-stream N lossused in SPARROW).
THMB is a mechanistic simulation model of largeriver systems that has been used recently, in combinationwith a dynamic terrestrial ecosystem model IBIS(Kucharik et al. 2000), to quantify nitrate flux in theMississippi River Basin (Donner et al. 2002, 2004a, b).The coupled models simulate time-varying flow andstorage of water and N in rivers, wetlands, andreservoirs at a 5° X 5° spatial scale for an hourly timestep, based on major source inputs, subsurface drainageand N leaching, topography, and precipitation andevaporation. Evaluations of the model in the Mississippibasin (Donner and Kucharik 2003) indicated that themodel accurately simulated inter-annual variability inthe water and N budget from 1960 to 1994, based onhistorical input datasets. In each river cell, the nitratemass removed per unit time, M~03 (kg/s), via denitrification in the benthic sediments in a given reach grid cell iis estimated as
M~03 = C~03Aivs(510o.o293T: (9)
where C~03 is the nitrate concentration (kg/m3) entering
grid cell i, Ai is the river bed area (m2), and vS is the
mass-transfer rate coefficient of 0.04 mid (based onpublished literatures rates for stream denitrificationfrom Howarth et al. 1996), and (5 is a discharge-related
adjustment to the mass-transfer coefficient [min((QcIQ),1.0); for Q, the river discharge, and Qc = 120 m3Is, themean discharge for a 2.5 m deep river] that reflects anassumed reduction in sediment contact time withincreases in discharge above 120 m3Is. This dischargeadjustment was used to simulate low N loss that istypical in large, deep rivers (Alexander et al. 2000). Theloss rate expression, coupled with the time-dependentsimulation of water and nitrate flux in each river celleffectively describes the fraction of water column nitrat~that contacts the sediments (C~03, AJ and the probability that the N03 which contacts the sediments isdenitrified (vs
(5, T). The estimates of nitrate loss instreams reflect the general relation with water residencetime and seasonal rates indicated in other studies(Donner et al. 2002, 2004a, b), though the mean nitrateloss rates tend to be lower than those estimated by theempirical models SPARROW (Alexander et al. 2000)and Riv-N (Seitzinger et al. 2002). A recent use ofTHMB to simulate the effects of annual changes instreamflow on N loss implies that the fraction of instream nitrogen removed in large river basins may bemuch lower during periods of higher rainfall (Donner etal. 2004b).
Mass-flux type expressions have also been used insimple empirical models of the literature measurementsof N removal rates in streams and lakes (Kelly et al.1987, Howarth et al. 1996, Seitzinger et al. 2002). Arecent version of this model (RivR-N; Seitzinger et al.2002) was applied to the data from 23 lakes and 10stream segments, based on measured denitrificationrates and mass balance studies. Estimates of the aquaticN loss rates, expressed as a percentage of the N input tothe water bodies, were regressed on measures of theareal hydraulic load, computed as the ratio of waterdepth to water travel time (Fig. 1). This expression of thehydraulic load has the same units as that in Eq. 7 andidentical functionality, although it is based on differentphysical properties. The regression relation accountedfor 73% of the variation in the observations of N loss.According to this expression, the N mass flux at theoutlet of a reach or reservoir segment i (that resultsexclusively from the effects of aquatic loss processesacting on the N flux entering from the upstreamsegment) can be estimated as a function of the upstreamN flux entering segment i from segment j, such that
where di is the water depth (units of meters) and TR i isthe water time of travel in days. This model provides agenerally consistent description of the rate of N loss inboth streams and lakes as a function of the hydraulicload. The functional relation of N transport to thehydraulic load is also generally consistent with that ofSPARROW and PolFlow given that lower hydraulicloads and higher N loss are generally observed in small

streams in comparison to that for large rivers (see theprevious comments on this relation in the discussion ofPolFlow). A mass-transfer coefficient is not explicitlyestimated in the RivR-N model, but the estimates of Nloss reflect a range of values that are implicit in the fittedrelation. In general, mass-transfer rates for streamstypically range from 20 to 50 m/yr and are higher by afactor of four to ten than those for lakes (5 to 20 m/yr);these higher areal denitrification rates may be explainedby the more organic enriched sediments in streams(Howarth et al. 1996). The RivR-N model was appliedto 16 northeastern U.S. watersheds with drainage sizesranging from 400 to 70000 km2
. The results indicatedthat from 37% to nearly 80% of the N inputs to streamswere removed during transport from headwaters tocoastal waters.
KEY UNCERTAINTIES AND NEEDS IN MODELING
AQUATIC DENITRIFICATION
The current methods for using empirically basedmodels to predict denitrification at reach and largerscales in aquatic ecosystems, including approaches for"scaling-up" measurements of denitrification rates, relyprimarily on knowledge of the spatial variability inhydrologic or abiotic controlling factors (e.g., streamflow, depth, velocity). These factors are readily generalized over broad spatial scales. Less is currently knownabout how the non-hydrologic or biotic factors thatcontrol the aquatic rates of denitrification vary acrossdifferent aquatic environments. Improved understanding depends, in part, on the development of morespatially continuous data on the distribution of nonhydrologic controls in streams, although detailed datamay be difficult to obtain for some of these factors (e.g.,organic C). Improvements may also come from theexplicit specification of these properties in mass-transferrate expressions and the development of experimentalinvestigations that are complementary of these modelenhancements.
One area of need is an improved understanding of thelinkages between denitrification and the production andcycling of organic N in aquatic ecosystems. Currently,the less complex aquatic models do not provide aseparate accounting of the fate of organic and inorganicN forms. For example, INCA and THMB only simulatenitrate transport in streams, whereas SPARROW andPolFlow only describe total N. The models of total N,SPARROW, and PolFlow, are mass balance and reflectlong-term, mean-annual conditions. Whereas this provides a complete accounting of the fate of N over longtime periods in aquatic ecosystems, the absence ofspecific N forms in these models limits their ability toidentify the specific mechanisms that are responsible forN losses, such as denitrification vs. the storage oforganic N in streams, reservoirs, and floodplains. Morecomplex mechanistic models, such as HSPF, describe Ncycling processes in detail over daily time periods, butare highly parameterized and have large uncertainties in
the estimated rates of denitrification and other Ntransformations. An improved quantification of theseuncertainties will require much more experimental dataon aquatic denitrification rates than currently exist andan expanded use of parameter estimation techniques inmodel calibrations to broaden understanding of the levelof complexity that can be accurately represented inmechanistic models of N transformations and cycling.Progress has been made in the measurement of Ntransformations in streams over relatively short timescales (e.g., Peterson et al. 2001, Hall and Tank 2003,Bohlke et al. 2004, Mulholland et al. 2004), butadditional work is needed at seasonal and longer timescales (e.g., Royer et al. 2004) and at reach and largerspatial scales (e.g., especially along stream gradients) tosupport the use of models to improve understanding ofN fate in streams. Advances in understanding thelinkages between denitrification and N cycling are alsodependent upon the inclusion of labile and refractory Cforms in aquatic models. In contrast to the terrestrialmodels, most aquatic models lack components todescribe the dynamic coupling of C and N transformations and provide no mechanisms to account forthe accumulation of C in streams. Explicit descriptionsof floodplain and riparian processes are also currentlylacking in all of the aquatic models reviewed here,although floodplains and riparian areas are recognizedas having important metabolically active zones capableof supporting denitrification (e.g., Hill 1996, Richardsonet al. 2004, Scott et al. 2004). The exclusion of theseprocesses in aquatic models can be explained, in part, bythe poor resolution of mapped information on thephysical and biochemical properties of stream riparianareas (e.g., Rosenblatt et al. 2001). However, moreexperimental observations are needed over space andtime in these environments with improved coupling inaquatic models to expand understanding of the separateeffects of riparian and in-stream denitrification ondownstream N conditions.
Uncertainties also exist in the first-order assumptionsthat are currently used in virtually all aquatic models toquantify the rates of denitrification. The few studies ofthe saturation kinetics of denitrification (Garcia-Ruiz etal. 1998) have reported evidence of concentrationlimitations, but additional research is needed to broadenunderstanding of these conditions in a range of aquaticecosystems. Nevertheless, these studies raise questionsabout how accurately the published denitrification ratesapply to streams with especially high nitrate concentrations, such as those found in agricultural watershedswhere saturation kinetics may potentially limit denitrification rates. One recent investigation (Royer et al.2004) of denitrification rates in agricultural catchmentswith high nitrate concentrations (>400 JlM) indicatesthat the rates of denitrification were one half or evensmaller (i.e., mass-transfer rates < 10 m/yr) than thosethat have been measured in streams draining lessdeveloped catchments (see also Bohlke et al. 2004).

Additional measurements of denitrification rates in thestreams draining highly developed watersheds areespecially needed to improve understanding of thesaturation kinetics of denitrification. Moreover, thereis a need to use existing aquatic and watershed models toempirically evaluate how estimated N loss rates changewith N concentrations in streams.
CONCLUSIONS
One of the largest uncertainties in knowledge of the Ncycle, at all scales, is the amount of reactive N that isconverted to N2 during the denitrification process(Galloway et al. 2004). We illustrate many of the currentmodeling approaches that are used to shed light on themagnitude of denitrification occurring in terrestrial andaquatic ecosystems. The examples presented here highlight impressive progress by the modeling community inrepresenting couplings among the C, N, and water cyclesthat control N loss rates. Nonetheless, the modelsprovide only simplified representations of the complexset of processes controlling denitrification, and modeledestimates of the magnitude of N losses via denitrificationremain highly uncertain.
It may seem strange to conclude with an observationthat future progress in modeling denitrification is verystrongly linked to the acquisition of new measurementdata and to new experimental work, but that, in ouropinion, is the state of the science. Though a sparsenumber of in-situ field observations and kinetic parameters observed in lab experiments provide some basis forparameterizing N 2 fluxes in models, a major limitationto modeling is a lack of measurements of denitrificationat appropriate field scales. Despite the wide range ofapproaches used to measure and characterize thedenitrification process at various scales (Groffman etal. 2006), the modeling community is unanimous instating that simulated magnitudes of the denitrificationtrace gas fluxes cannot be adequately calibrated andvalidated due to the lack of observational data overspace and time. There is generally no rigorous way tovalidate the large-scale terrestrial and aquatic models interms of their process identification.
To better evaluate model structures and performance,multidisciplinary studies are needed that are comprehensive in terms of measurements over regional spatialscales and long time scales. Detailed field studies areneeded where biogeochemical, microbiological, andhydrological measurements are quantified explicitlyand are well coordinated. In addition, research is neededthat targets an improved understanding of the complexand coupled set of processes controlling denitrificationover space and time. Many recent studies have shed newlight on mechanisms of N cycling in general, highlightingthe importance of aerobic denitrification, alternativedenitrification pathways, and other nitrogen loss mechanisms (Robertson et al. 1995, Silver et al. 2001,Thamdrup and Dalsgaard 2002, Davidson et al. 2003).These alternative denitrification and nitrogen loss path-
ways in the environment may be highly significant at thescale of large regions, and may need to be added to theconceptual paradigms represented in the various modeling schemes. Finally, advancing new methods to enhancethe direct measurement of N2 fluxes at regional scaleswill provide opportunities to refine estimates of themagnitude of N losses and to improve the capacity of allof the modeling approaches (Groffman et al. 2006).
Further field research and model development isneeded to advance scientific understanding of theimportance of denitrification along flow paths, and incharacterizing the heterogeneity and complexity ofsubsurface flows. Despite knowledge that N loss ingroundwater reservoirs is important in many environmental settings (Puckett 2004), there remain largechallenges in characterizing N losses along deep groundwater flowpaths and in aquifers. The highly uncertainquantification of N processes and the residence times ofwater and N in groundwater in all of the modelsreviewed here highlight the challenges faced in this area.Models are needed to quantify both the separate andcumulative effects of the rate-controlling properties onN losses at specific locations along both surface andground water flow paths throughout landscapes. Expanded capabilities for the modeling groundwater N areespecially needed because of the importance of subsurface pathways for N transport and denitrification atmultiple spatial scales (e.g., Seitzinger et al. 2006).
Advances in quantifying denitrification will also arisefrom further improvements in the accessibility andavailability of synoptic spatial databases providingdescriptions of landscape attributes over space and time.Progress in scaling from plot to larger scales has beenmade by relating N losses to characteristics of the localenvironmental setting, relating the potential for Nremoval (that is, N sinks) to characteristics such as thepresence of hydric soils for N losses in riparian zones(Gold et al. 2001), topography and soil texture for Nloss in large river floodplains (Pinay et al. 2000), andflow regime (as evidenced by stream depth and watertravel time) for N losses in streams corridors (Alexanderet al. 2000, Seitzinger et al. 2002). Within modelstructures, new or higher-resolution data sets may proveto be useful toward scaling of denitrification measurements to estimate N losses at regional spatial scales andlong temporal scales. These include maps of climate andmeteorological variables, soil wetness and moisture,nutrient (organic matter and N) status of soils andstreambed sediments, land cover and vegetation, landuse history and disturbance, the distribution of topography, geomorphology and flow characteristics ofstream reach networks, and flow paths and residencetimes of water within landscapes.
Recent developments in remote sensing technologywill continue to playa significant role in characterizingthe landscape and as a tool for modeling. For example,some noteworthy advances in spatial and temporalresolution of information relevant to modeling denitri-

fication at the landscape scale include the distribution ofprecipitation from the next generation radar (NEXRAD) sensors, the distribution of evaporation, photosynthesis, and primary productivity from moderateresolution imaging spectroradiometer (MODIS) sensors,and the distribution of terrain and geomorphology fromlight distance and ranging (LIDAR) sensors and airborne laser swath mapping (ALSM). Similarly, thedevelopment of other regional scale databases, such asthe description of river and reservoir networks providedby the national hydrologic data set (O.S. GeologicalSurvey 1999), provides an important hydrologic framework to assist with the coupling of terrestrial andaquatic modeling approaches. More systematic use ofstream networks by the research community (i.e., inreporting experimental observations) ~ould benefitsyntheses of the data across multiple sites and supportthe use of experimental data to calibrate and verifyregional-scale N models.
Further development and testing of model structuresis also needed. As evidenced by the approachesdescribed here, significant progress has been made incoupling various conceptualizations of the coupledrelationships between N, C, and water cycles. However,there remain huge opportunities for better integrationand formal coupling of terrestrial and aquatic conceptualizations in integrated and synthetic modeling frameworks, and developing model structures to make use ofnew information such as the synoptic databasesdescribed above. There is increasing interest in the useof spatially distributed models that include mass balanceconstraints and statistically estimated parameters, whichprovide an opportunity for the research community toformally test hypotheses about the large-scale importance of various hydrologic and biogeochemical controlson transport and fate of N, and testing of the level ofprocess complexity that is required to explain variationsin N export in space and time.' Analyses of errors anduncertainties in model predictions, especially comparisons with controlling variables (e.g., Alexander et al.2002b), may also help to identify ways to improve themodel specifications. Although there is not detailedinformation on the spatial distributions of all controllingvariables (i.e., organic C, and so on) that are needed to"scale-up" measurements of denitrification rates, modelers may be able to do selected comparisons of modelerrors in locations where data are available.
In summary, models will continue to serve as essentialtools for integrating the current understanding ofprocesses that control denitrification with broad-scalemeasurements of the rate-controlling properties so thatthe losses of N can be quantified at regional scales.Despite the uncertainties and model limitations described in this review, scientific information frommodeling investigations will continue to provide acritical window into questions of where, when, andhow much denitrification occurs in the landscape. Thedifferent modeling approaches described herein, though
exhibiting a very large range in complexity, all are inconsensus in identifying that denitrification is animportant and highly significant component of the Ncycle in both terrestrial and aquatic ecosystems atregional scales.
ACKNOWLEDGMENTS
This work was initiated at a denitrification workshopsponsored by the International Nitrogen Initiative; we thankSybil Seitzinger and Eric Davidson for hosting it, and for all ofthe good conversations that unfolded there and contributed tothis analysis. We also thank J. K. Bohlke, Larry Band, and ananonymous reviewer for their thorough review comments,which greatly improved the manuscript.
LITERATURE CITED
Aber, J. D., C. L. Goodale, S. V. Ollinger, M. L. Smith, A. H.Magill, M. E. Martin, R. A. Hallett, and J. L. Stoddard.2003. Is nitrogen deposition altering the nitrogen status ofNortheastern Forests? BioScience 23(4):375-390.
Alexander, R. B., J. W. Brakebill, R. E. Brew, and R. A. Smith.1999. ERF I-enhanced river reach file 1. 2. Open-FileReport 99-457. U.S. Geological Survey, Reston, Virginia,USA.
Alexander, R. B., A. H. Elliott, U. Shankar, and G. B.McBride. 2002a. Estimating the sources and transport ofnutrients in the Waikato River basin, New Zealand. WaterResources Research 38: 1268-1290.
Alexander, R. B., P. J. Johnes, E. W. Boyer, and R. A. Smith.2002b. A comparison of methods for estimating the riverineexport of nitrogen from large watersheds. Biogeochemistry57/58:295-339.
Alexander, R. B., R. A. Smith, and G. E. Schwarz. 2000. Effectof stream channel size on the delivery of nitrogen to the Gulfof Mexico. Nature 403:758-761.
Alexander, R. B., R. A. Smith, and G. E. Schwarz. 2004.Estimates of diffuse phosphorus sources in surface waters ofthe United States using a spatially referenced watershedmodel. Water Science and Technology 49:1-10.
Alexander, R. B., R. A. Smith, G. E. Schwarz, S. D. Preston,J. W. Brakebill, R. Srinivasan, and P. A. Pacheco. 2001.Atmospheric nitrogen flux from the watersheds of majorestuaries of the United States: an application of theSPARROW watershed model. Pages 119-170 in R. A.Valigura, R. B. Alexander, M. S. Castro, T. P. Meyers,H. W. Paerl, P. E. Stacey, and R. E. Turner, editors.Nitrogen loading in coastal water bodies: an atmosphericperspective. American Geophysical Union Monograph 57.American Geophysical Union, Washington, D.C., USA.
Arnold, J. G., J. R. Williams, A. D. Nicks, and N. B. Sammons.1990. SWRRB: a basin scale simulation model for soil andwater resources management. Texas A&M University Press,College Station, Texas, USA.
Band, L., D. Peterson, S. Running, J. Coughlan, R. Lammers,J. Dungan, and R. Nemani. 1991. Forest ecosystem processesat the watershed scale: basis for distributed simulation.Ecological Modeling 56:171-196.
Band, L. E., C. L. Tague, S. E. Brun, D. E. Tenebaum, andR. A. Fernandes. 2000. Modeling watersheds as spatial objecthierarchies: structure and dynamics. Transactions in GIS4(3): 181-196.
Band, L. E., C. Tague, P. Groffman, and K. Belt. 2001. Forestecosystem processes at the watershed scale: hydrological andecological controls of nitrogen export. Hydrological Processes 15:2013-2028.
Bashkin, V. N., S. U. Park, M. S. Choi, and C. B. Lee. 2002.Nitrogen budgets for the Republic of Korea and the YellowSea region. Biogeochemistry 57/58:387-403.

Beaujouan, V., P. Durand, and L. Ruiz. 2001. Modelling theeffect of the spatial distribution of agricultural practices onnitrogen fluxes in rural catchments. Ecological Modelling137:91-103.
Beaujouan, V., P. Durand, L. Ruiz, P. Aurousseau, and G.Cotteret. 2002. A hydrological model dedicated to topography-based simulation of nitrogen transfer and transformation: rationale and application to the geomorphologydenitrification relationship. Hydrological Processes 16:493507.
Bencala, K. E. 1993. A perspective on stream-catchmentconnections. Journal of the North American BenthologicalSociety 12(1):44-47.
Beven, K. 2002. Towards an alternative blueprint for aphysically based digitally simulated hydrologic responsemodeling system. Hydrological Processes 16: 189-206.
Beven, K., and M. Kirkby. 1979. A physically-based variablecontributing area model of basin hydrology. HydrologicScience Bulletin 24:43-69.
Bicknell, B. R., J. C. Imhoff, J. L. Kittle, Jr., T. H. Jobes, andA. S. Donigian, Jr. 2001. Hydrological simulation programFortran: HSPF version 12 user's manual. Aqua TerraConsultants, Mountain View, California, USA.
Bohlke, J. K., and J. M.' Denver. ·1995. Combined use ofground-water dating, chemical and isotopic analyses toresolve the history and fate of ground-water nitratecontamination in two agricultural watersheds, Atlanticcoastal plain, Maryland. Water Resources Research 31:2319-2339.
Bohlke, J. K., J. W. Harvey, and M. A. Voytek. 2004. Reachscale isotope tracer experiment to quantify denitrification andrelated processes in a nitrate-rich stream, mid-continentUSA. Limnology and Oceanography 49:821-838.
Boyer, E. W., C. L. Goodale, N. A. Jaworski, and R. W.Howarth. 2002. Anthropogenic nitrogen sources and relationships to riverine nitrogen export in the northeasternUSA. Biogeochemistry 57:137-169.
Brezonik, P. L., et al. 1999. Effects of reducing nutrient loads tosurface waters within the Mississippi River Basin and theGulf of Mexico. Topic 4, report for the integrated assessmenton hypoxia in the Gulf of Mexico. NOAA Coastal OceanProgram Decision Analysis Series No. 18. U.S. Departmentof Commerce, National Oceanographic and AtmosphericAdministration, Silver Spring, Maryland, USA.
Brisson, N., et al. 1998. STICS: a generic model for thesimulation of crops and their water and nitrogen balance. I.Theory and parameterization applied to wheat and corn.Agronomie 18:311-346.
Brown, L., B. Syed, S. C. Jarvis, R. W. Sneath, V. R. Phillips,K. W. T. Goulding, and C. Li. 2002. Development andapplication of a mechanistic model to estimate emission ofnitrous oxide from UK agriculture. Atmospheric Environment 36:917-928.
Cai, Z., T. Sawamoto, C. Li, G. Kang, J. Boonjawat, A.Mosier, R. Wassmann, and H. Tsuruta. 2003. Fieldvalidation of the DNDC model for greenhouse gas emissionsin East Asian cropping systems. Global BiogeochemicalCycles 17(4):1107. [doi:l0.1029/2003GB002046]
Cerco, C. F., and T. Cole. 1995. User's guide to the CE-QUALICM three-dimensional eutrophication model. Release version 1.0. Technical report EL-95-15. U.S. Army EngineersWaterways Experiment Station, Vicksburg, Mississippi,USA.
Chapra, S. C. 1997. Surface water-quality modeling. McGrawHill, New York, New York, USA.
Corre, M. D., C. van Kessel, and D. J. Pennock. 1996.Landscape and seasonal patterns of nitrous oxide emissionsin a semiarid region. Soil Science Society of America Journal60: 1806-1815.
Creed, I. E., and L. E. Band. 1998. Exploring similarity in theexport behavior of nitrate-H from forested catchments: amechanistic modeling approach. Water Resources Research34:3079-3093.
Davidson, E. A., J. Chorover, and D. B. Dail. 2003. Amechanism of abiotic immobilization of nitrate in forestecosystems: the ferrous wheel hypothesis. Global ChangeBiology 9:228-236.
Davidson, E. A., and J. P. Schimel. 1995. Microbial processesof production and consumption of nitric oxide, nitrous oxideand methane, in biogenic trace gases: measuring emissionsfrom soil and water. Pages 327-357 in P. A. Matson andR. C. Harriss. Biogenic trace gases: measuring emissionsfrom soil and water. Blackwell, Cambridge, Massachusetts,USA.
Del Grosso, S. J., A. R. Mosier, W. J. Parton, and D. S. Ojima.2005. DAYCENT model analysis of past and contemporarysoil N20 and net greenhouse gas flux for major crops in theUSA. Soil Tillage and Research 83:9-24.
Del Grosso, S. J., D. S. Ojima, W. J. Parton, A. R. Mosier,G. A. Peterson, and D. S. Schimel. 2002. Simulated effects ofdryland cropping intensification on soil organic matter andgreenhouse gas exchanges using the DAYCENT ecosystemmodel. Environmental Pollution 116:S75-S83.
Del Grosso, S. J., W. J. Parton, A. R. Mosier, M. D. Hartman,J. Brenner, D. S. Ojima, and D. S. Schimel. 2001. Simulatedinteraction of carbon dynamics and nitrogen trace gas fluxesusing the DAYCENT model. Pages 303-332 in M. Schaffer,L. Ma, and S. Hansen, editors. Modeling carbon andnitrogen dynamics for soil management. CRC Press, BocaRaton, Florida, USA.
Del Grosso, S. J., W. J. Parton, A. R. Mosier, D. S. Ojima,A. E. Kulmala, and S. Phongpan. 2000. General model forN20 and N2 gas emissions from soils due to denitrification.Global Biogeochemical Cycles 14: 1045-1060.
De Wit, M. J. M. 2000. Modeling nutrient fluxes from source toriver load: a macroscopic analysis applied to the Rhine andElbe basin. Hydrobiologia 410: 123-130.
De Wit, M. J. M. 2001. Nutrient fluxes at the river basin scale:1: the PolFlow model. Hydrological Processes 15:743-759.
Dillon, P. J., and L. A. Molot. 1990. The role of ammoniumand nitrate retention in the acidification of lakes and forestedcatchments. Biogeochemistry 11:23-43.
Donner, S. D., M. T. Coe, J. D. Lenters, T. E. Twine, and J. A.Foley. 2002. Modeling the impact of hydrological changes onnitrate transport in the Mississippi River Basin from 19551994. Global Biogeochemical Cycles 16:1043. [doi:l0.l02912001GB00396]
Donner, S. D., and C. J. Kucharik. 2003. Evaluating theimpacts of land management and climate variability on cropproduction and nitrate export across the Upper MississippiBasin. Global Biogeochemical Cycles 17: 1085. [doi: 10.102912001 G BOO 1808]
Donner, S. D., C. J. Kucharik, and J. A. Foley. 2004a. Impactof changing land use practices on nitrate export by theMississippi River. Global Biogeochemical Cycles 18:GBI028.[doi: 10.1029/2003GB002093]
Donner, S. D., C. J. Kucharik, and M. Oppenheimer. 2004b.The influence of climate on in-stream removal of nitrogen.Geophysical Research Letters 31:L20509. [doi: 10.102912004GL020477]
Driscoll, C. T., G. B. Lawrence, A. J. Bulger, T. J. Butler, C. S.• Cronan, C. Eagar, K. F. Lambert, G. E. Likens, J. L.
Stoddard, and K. C. Weathers. 2001. Acidic deposition in thenortheastern United States: sources and inputs, ecosystemeffects, and management strategies. BioScience 51: 180-198.
Duff, J. H., and F. J. Triska. 1990. Denitrification in sedimentsfrom the hyporheic zone adjacent to a small forested stream.Canadian Journal of Fisheries and Aquatic Sciences 46:22402247.

Farahbakhshazad, N., D. McLaughlin, D. L. Dinnes, D. B.Jaynes, and C. Li. 2002. A site-specific evaluation of a cropdenitrification/decomposition model based upon a U.S.midwestern row-crop field. Proceedings, International Conference on Precision Agriculture. Minneapolis, Minnesota, USA.
Fernandez, G. P., G. M. Chescheir, R. W. Skaggs, and D. M.Amatya. 2005. Development and testing of watershed scalemodels for poorly drained soils. Transactions of the ASAE48(2):639-652.
Filoso, S., J. Vallino, C. Hopkinson, E. Rastetter, and L.Claessens. 2004. Modeling nitrogen transport in the IpswichRiver Basin, Massachusetts, using a hydrological simulationprogram in Fortran (HSPF). Journal of the American WaterResources Association 40: 1365-1384.
Findlay, S. 1995. Importance of surface-subsurface exchange instream ecosystems: the hyporheic zone. Limnology andOceanography 40:159-164.
Firestone, M. K., and E. A. Davidson. 1989. Microbial basis ofNO and N20 production and consumption in soils. Pages 721 in M. O. Andreae and D. S. Schimel, editors. Exchange oftrace gases between terrestrial ecosystems and the atmosphere. John Wiley, New York, New York, USA.
Florinsky, 1. V., S. McMahon, and D. L. Burton. 2004.Topographic control of soil microbial activity: a case study ofdenitrifiers. Geoderma 119:33-53.
Galloway, J. N., et al. 2004. Nitrogen cycles: past, present andfuture. Biogeochemistry 70: 153-226.
Garcia-Ruiz, R., S. N. Pattinson, and B. A. Whitton. 1998.Kinetic parameters of denitrification in a river continuum.Applied and Environmental Microbiology 64:2533-2538.
Gold, A. J., P. M. Groffman, K. Addy, D. Q. Kellogg, M.Stolt, and A. E. Rosenblatt. 2001. Landscape attributes ascontrols on groundwater nitrate removal capacity of riparianzones. Journal of the American Water Resources Association37:1457-1464.
Grimvall, A., and P. Stalnacke. 1996. Statistical methods forsource apportionment of riverine loads of pollutants.Environmetrics 7:201-213.
Groffman, P. M. 1991. Ecology of nitrification and denitrification in soil evaluated at scales relevant to atmosphericchemistry. Pages 201-217 in J. E. Rogers and W. B.Whitman, editors. Microbial production and consumptionof greenhouse gases, methane, nitrogen oxides and halomethane. American Society of Microbiology, Washington,D.C., USA.
Groffman, P. M., M. A. Altabet, J. K. Bohlke, K. ButterbachBahl, M. B. David, M. K. Firestone, A. E. Giblin, T. M.Kana, L. P. Nielsen, and M. A. Voytek. 2006. Methods formeasuring denitrification: diverse approaches to a difficultproblem. Ecological Applications 16:2091-2122.
Groffman, P. M., and J. M. Tiedje. 1989a. Denitrification innorth temperate forest soils: relationships between denitrification and environmental factors at the landscape scale. SoilBiology and Biochemistry 21:621-626.
Groffman, P. M., and J. M. Tiedje. 1989b. Denitrification innorth temperate forest soils: spatial and temporal patterns atthe landscape and seasonal scales. Soil Biology andBiochemistry 21:613-620.
Hall, R. O. J., and J. L. Tank. 2003. Ecosystem metabolismcontrols nitrogen uptake in streams in Grand Teton NationalPark, Wyoming. Limnology and Oceanography 48: 11201128.
Harvey, J. W., and B. J. Wagner. 2000. Quantifying hydrologicinteractions between streams and their subsurface hyporheiczones. Pages 3-44 in J. A. Jones and P. J. Mulholland,editors. Streams and groundwaters. Academic Press, SanDiego, California, USA.
Hefting, M., J. C. Clement, D. Dowrick, A. C. Cosandey, S.Bernal, C. Cimpian, A. Tatur, T. P. Burt, and G. Pinay. 2004.Water table elevation controls on soil nitrogen cycling in
riparian wetlands along a European climatic gradient.Biogeochemistry 67: 113-134.
Hill, A. R. 1996. Nitrate removal in stream riparian zones.Journal of Environmental Quality 25(4):743-755.
Holmes, R. M., J. B. Jones, S. G. Fisher, and N. B. Grimm.1996. Denitrification in a nitrogen-limited stream ecosystem.Biogeochemistry 33: 125-146.
Hornberger, G. M., J. P. Raffensperger, P. Wiberg, and K.Eshleman. 1998. Elements of physical hydrology. JohnsHopkins University Press, Baltimore, Maryland, USA.
Howarth, R. W., et al. 1996. Regional nitrogen budgets andriverine Nand P fluxes for the drainages to the NorthAtlantic Ocean: natural and human influences. Biogeochemistry 35:75-139.
Howarth, R. W., E. W. Boyer, W. Pabich, and J. N. Galloway.2002. Nitrogen flux in the United States from 1961-2000 andpotential future trends. Ambio 31(2):88-96.
Jobson, H. E. 1996. Prediction of travel time and longitudinaldispersion in rivers and streams. Water-Resources Investigations Report 96-4013. U.S. Geological Survey, Reston,Virginia, USA.
Kelly, C. A., J. W. M. Hesslein, D. W. Schindler, P. J. Dillon,C. T. Driscoll, S. Gherini, and R. E. Hecky. 1987. Predictionof biological acid neutralization in lakes. Biogeochemistry 3:129-140.
Kelly, R. H., W. J. Parton, M. D. Hartman, L. K. Stretch, D. S.Ojima, and D. S. Schimal. 2000. Intra- and interannualvariability of ecosystem processes in shortgrass-steppe: newmodel, verification, simulations. Journal of GeophysicalResearch 105(D15):20093-20100.
Kesik, M., et al. 2005. Inventories of N20 and NO emissionsfrom European forest soils. Biogeosciences 2:353-375.
Knisel, W. G., editor. 1993. GLEAMS groundwater loadingeffects of agricultural management systems, Version 2.10.Department Publication No.5. Biological and AgriculturalEngineering Department, University of Georgia, CoastalPlain Experiment Station, Tifton, Georgia, USA.
Knowles, R. 1981. Denitrification. Ecological Bulletin 33:315329.
Kroes, J. G., and J. Roelsma. 1998. User's guide for theANIMO version 3. 5 nutrient leaching. Model. TechnicalDocument 46. DLO Winand Staring Centre, Wageningen,The Netherlands.
Kroeze, C., et al. 2003. Uncertainties in the fate of nitrogen I:an overview of sources of uncertainty illustrated with aDutch case study. Nutrient Cycling in Agroecosystems 66(1):43-69.
Kucharik, C. J., J. A. Foley, C. Delire, V. A. Fisher, M. T. Coe,J. Lenters, C. Young-MoIling, N. Ramankutty, J. M.Norman, and S. T. Gower. 2000. Testing the performanceof a dynamic global ecosystem model: water balance, carbonbalance and vegetation structure. Global BiogeochemicalCycles 14(3):795-825.
Laverman, A. M., H. R. Zoomer, H. W. van Verseveld, and H.A. Verhoef. 2000. Temporal and spatial variation of nitrogentransformations in a coniferous forest soil. Soil Biology andBiochemistry 32: 1661-1670.
Leffelaar, P. A., and W. W. Wessel. 1998. Denitrification in ahomogeneous, closed system: experiment and simulation.Soil Science 146:335-349.
Leonard, R. A., W. G. Knisel, and D. A. Still. 1987. GLEAMS:Groundwater loading effects on agricultural managementsystems. Transactions of the ASAE 30(5):1403-1428.
Leopold, L. B., and T. Maddock, Jr. 1953. The hydraulicgeometry of stream channels and some physiographicimplications. u.S. Geological Survey Professional Paper252. U.S. Geological Survey, Denver, Colorado, USA.
Li, C. 2001. Biogeochemical concepts and methodologies:development of the DNDC model. [in Chinese with Englishabstract.] Quaternary Sciences 21:89-99.

Li, C., J. Aber, F. Stange, K. Butterbach-Bahl, and H. Papen.2000. A process-oriented model of N20 and NO emissionsfrom forest soils: 1, model development. Journal of Geophysical Research 105(D4):4385-4398.
Li, C., S. Frolking, and T. A. Frolking. 1992. A model ofnitrous oxide evolution from soil driven by rainfall events: 1.Model structure and sensitivity. Journal of GeophysicalResearch, 97:9759-9776.
Li, C., V. Narayanan, and R. Harriss. 1996. Model estimates ofnitrous oxide emissions from agricultural lands in the UnitedStates. Global Biogeochemical Cycles 10:297-306.
Machefert, S. E., N. B. Dise, K. W. T. Goulding, and P. G.Whitehead. 2004. Nitrous oxide emissions from two riparianecosystems: key controlling variables. Water, Air and SoilPollution: Focus 4:427-436.
Marchetti, R., M. Donatelli, and P. Spallacci. 1997. Testingdenitrification functions of dynamic crop models. Journal ofEnvironmental Quality 26(2):394-401.
McClain, M. E., E. W. Boyer, C. L. Dent, S. E. Gergel, N. B.Grimm, P. M. Groffman, S. C. Hart, J. W. Harvey, C. A.Johnston, E. Mayorga, W. H. McDowell, and G. Pinay.2003. Biogeochemical hot spots and hot moments at theinterface of terrestrial and aquatic ecosystems. Ecosystems6(4):301-312.
McIsaac, G. F., M. B. David, G. Z. Gertner, and D. A.Goolsby. 2001. Eutrophication: nitrate flux in the MississippiRiver. Nature 414:166-167.
McMahon, G., R. B. Alexander, and S. Qian. 2003. Support ofTMDL programs using spatially referenced regressionmodels. ASCE Journal of Water Resource Planning andManagement 129:315-329.
Mearns, L. 0., T. Mavromatis, E. Tsvetsinskaya, C. Hays, andW. Easterling. 1999. Comparative responses of EPIC andCERES crop models to high and low spatial resolutionclimate change scenarios. Journal of Geophysical Research104(D6):6623-6646.
Moore, R. B., C. M. Johnston, K. W. Robinson, and J. R.Deacon. 2004. Estimation of total nitrogen and phosphorusin New England streams using spatially referenced regressionmodels, U.S. Geological Survey Scientific InvestigationsReport 2004-5012. U.S. Geological Survey, Pembroke,New Hampshire, USA.
Mosier, A. R., W. D. Guenzi, and E. E. Schweizer. 1986. Soillosses of dinitrogen and nitrous oxide from irrigated crops innortheastern Colorado. Soil Science Society of AmericaJournal 50:344-348.
Mosier, A., R. Wassmann, L. V. Verchot, J. King, and C. Palm.2004. Methane and nitrogen oxide fluxes in tropicalagricultural soils: sources, sinks and mechanisms. Environment, Development and Sustainability 6:11-49.
Mulholland, P. J., H. M. Valett, J. R. Webster, S. A. Thomas,L. W. Cooper, S. K. Hamilton, and B. J. Peterson. 2004.Stream denitrification and total nitrate uptake rates measured using a field 15N tracer addition approach. Limnologyand Oceanography 49:809-820.
National Research Council. 2000. Clean Coastal waters:understanding and reducing the effects of nutrient pollution.National Academy Press, Washington, D.C., USA.
Newbold, J. D., J. W. Elwood, R. V. O'Neill, and W. VanWinkle. 1981. Measuring nutrient spiraling in streams.Canadian Journal of Fisheries and Aquatic Sciences 38:860-863.
Nolan, J. V., J. W. Brakebill, R. B. Alexander, and G. E.Schwarz. 2002. Enhanced river reach file 2. U.S. GeologicalSurvey Open-File Report 02-40. U.S. Geological Survey,Reston, Virginia, USA.
Parton, W. J., M. D. Hartman, D. S. Ojima, and D. S. Schimel.1998. DAYCENT: its land surface submodel: description andtesting. Global and Planetary Change 19:35-48.
Parton, W. J., E. A. Holland, S. J. Del Grosso, M. D. Hartman,R. E. Martin, A. R. Mosier, D. S. Ojima, and D. S. Schimel.2001. Generalized model for NOx and N20 emissions fromsoils. Journal of Geophysical Research 106(D15):1740317420.
Parton, W. J., A. R. Mosier, D. S. Ojima, D. W. Valentine,D. S. Schimel, K. Weier, and K. E. Kulmala. 1996. Generalizedmodel for N2 and N 20 production from nitrification anddenitrification. Global Biogeochemical Cycles 10:401-412.
Parton, W. J., D. S. Ojima, C. V. Cole, and D. S. Schimel. 1994.A general model for soil organic matter dynamics: sensitivityto litter chemistry, texture and management. Pages 147-167in R. B. Bryant and R. W. Arnold, editors. Quantitativemodeling of soil forming processes. Soil Science Society ofAmerica, Madison, Wisconsin, USA.
Pathak, H., C. Li, and R. Wassmann. 2005. Greenhouse gasemissions from India rice fields: calibration and upscalingusing the DNDC model. Biogeosciences 2:113-123.
Paul, E. A., and F. E. Clark. 1989. Soil microbiology andbiochemistry. Second edition. Academic Press, San Diego,USA.
Pennock, D. J., C. Van Kessel, R. E. Farrel, and R. A.Sutherland. 1992. Landscape-scale variations in denitrification. Soil Science Society of America Journal 56:770-776.
Peterson, B. J., et al. 2001. Control of nitrogen export fromwatersheds by headwater streams. Science 292:86-90.
Pinay, G., V. J. Black, A. M. Planty-Tabacchi, B. Gumiero, andH. Decamps. 2000. Geomorphic control of denitrification inlarge river floodplain soils. Biogeochemistry 50(2): 163-182.
Puckett, L. J. 2004. Hydrogeologic controls on the transportand fate of nitrate in ground water beneath riparian bufferzones: results from thirteen studies across the United States.Water Science and Technology 49(3):47-53.
Rabalais, N. N. 2002. Nitrogen in aquatic ecosystems. Ambio31(2): 102-112.
Reckhow, K. H., and S. C. Chapra. 1982. Engineeringapproaches for lakes management. Volume 1: data analysisand empirical modeling. Butterworth Publishers, Boston,Massachusetts, USA.
Richardson, W. B., E. A. Strauss, L. A. Bartsch, E. M. Monroe,J. C. Cavanaugh, L. Vingum, and D. M. Soballe. 2004.Denitrification in the Upper Mississippi River: rates,controls, and contribution to nitrate flux. Canadian Journalof Fisheries and Aquatic Sciences 61: 1102-1112.
Robertson, L. A., T. Dalsgaard, N.-P. Revsbech, and J. G.Kuenen. 1995. Confirmation of "aerobic denitrification" inbatch cultures, using gas chromatography and 15N massspectrometry. FEMS Microbiology Ecology 18: 113-120.
Rosenberg, N. J., M. S. McKenney, W. E. Easterling, andK. M. Lemon. 1992. Validation of EPIC model simulationsof crop responses to current climate and CO2 conditions:comparisons with census, expert judgment and experimentalplot data. Agricultural and Forest Meteorology 59:35-51.
Rosenblatt, A. E., A. J. Gold, M. H. Stolt, and P. M.Groffman. 2001. Identifying riparian sinks for watershednitrate using soil surveys. Journal of Environmental Quality30: 1596-1604.
Royer, T. V., J. L. Tank, and M. B. David. 2004. The transportand fate of nitrate in headwater, agricultural streams inIllinois. Journal of Environmental Quality 33:1296-1304.
Running, S. W., and E. R. Hunt, Jr. 1993. Generalization of aforest ecosystem process model for other biomes, BIOMEBGC, and an application for global scale models. Pages 141158 in J. R. Ehleringer and C. Field, editors. Scalingphysiological processes leaf to globe. Academic Press, SanDiego, California, USA.
Saggar, S., R. M. Andrew, K. R. Tate, C. B. Hedley, N. J.Rodda, and J. A. Townsend. 2004. Modelling nitrous oxideemissions from New Zealand dairy grazed pastures. NutrientCycling in Agroecosystems 68:243-255.
Schwarz, G. E., A. B. Hoos, R. B. Alexander, and R. A. Smith.2006. SPARROW: concepts and user documentation for theSPARROW surface water-quality model. Techniques andMethods Report, Book 6, Chapter B3. U.S. GeologicalSurvey, Reston, Virginia, USA.
Schoumans, O. F., and M. Silgram, editors. 2003. Review andliterature evaluation of nutrient quantification tools. EUROHARP report 1-2003, NIVA report SNO 4739-2003. EUROHARP, Oslo, Norway.
Scott, D. T., J. W. Harvey, and G. Noe. 2004. Nitrogentransformations within a flooded riparian wetland in theSoutheastern United States. Eos Transactions AGU 85(17),Supplement, Abstract H43D-02, American GeophysicalUnion Joint Assembly, Montreal, Quebec, Canada.
Seitzinger, S. P. 1988. Denitrification in freshwater and coastalmarine ecosystems: ecological and geochemical significance.Limnology and Oceanography 33:702-724.
Seitzinger, S., J. A. Harrison, J. K. Bohlke, A. F. Bouwman, R.Lowrance, B. Peterson, C. Tobias, and G. Van Drecht. 2006.Denitrification across landscapes and waterscapes: a synthesis. Ecological Applications 16:2064-2090.
Seitzinger, S., R. V. Styles, E. W. Boyer, R. B. Alexander, G.Billen, R. W. Howarth, B. Mayer, and N. Van Breemen.2002. Nitrogen retention in rivers: model development andapplication to watersheds in the eastern U. S. Biogeochemistry 57: 199-237.
Sharpley, A. N., and J. R. Williams, editors. 1990. EPICerosion/productivity impact calculator: 1. model documentation. Technical Bulletin No. 1768. U.S. Department ofAgriculture, Temple, Texas, USA.
Shenk, G. W., L. C. Linker, and A. S. Donigian. 1998. TheChesapeake Bay program models. Proceedings of the firstfederal interagency hydrologic modeling conference. LasVegas, Nevada, USA.
Silver, W. L., D. J. Herman, and M. K. Firestone. 2001.Dissimilatory nitrate reduction to ammonium in tropicalforest soils. Ecology 82:2410-2416.
Skaggs, R. W. 1999. Drainage simulation models. Pages 469500 in R. W. Skaggs and J. van Schilfgaarde, editors.Agricultural drainage. Agronomy Monograph 38. SoilScience Society of America, Madison, Wisconsin, USA.
Smil, V. 1997. Global population and nitrogen cycle. ScientificAmerican 277(1):76-81.
Smith, R. A., G. E. Schwarz, and R. B. Alexander. 1997.Regional interpretation of water-quality monitoring data.Water Resources Research 33:2781-2798.
Smith, W. N., B. Grant, R. L. Desjardins, R. Lemke, B. Grant,and C. Li. 2004. Estimates of the interannual variations ofN 20 emissions from agricultural soils in Canada. NutrientCycling in Agroecosystems 68(1):37-45.
Stream Solute Workshop. 1990. Concepts and methods forassessing solute dynamics in stream ecosystems. Journal ofthe North American Benthological Society 9:95-119.
Stumm, W., and J. J. Morgan. 1981. Aquatic chemistry: anintroduction emphasizing chemical equilibria in naturalwaters. Second edition. John Wiley and Sons, New York,New York, USA.
Thamdrup, B., and T. Dalsgaard. 2002. Production of N2
through anaerobic ammonium oxidation coupled to nitratereduction in marine sediments. Applied and EnvironmentalMicrobiology 68(3):1312-1318.
Thomas, S. A., H. M. Valett, P. J. Mulholliand, C. S. Fellows,J. R. Webster, C. N. Dahm, and C. G. Peterson. 2001.Nitrogen retention in headwater streams: the influence ofgroundwater-surface water exchange. Scientific World I(S2):623-631.
Tiedje, J. M. 1988. Ecology of denitrification and dissimilatorynitrate reduction to ammonium. Pages 179-244 in A. J. B.Zehnder, editor. Biology of anaerobic microorganisms. JohnWiley and Sons, New York, New York, USA.
Townsend, A. R., et al. 2003. Human health effects of achanging global nitrogen cycle. Frontiers in Ecology and theEnvironment 1:240-246.
U.S. Geological Survey. 1999. The national hydrographydataset. 1999. U.S. Geological Survey Fact Sheet 106-99.U.S. Geological Survey, Reston, Virginia, USA.
Van Breemen, N., et al. 2002. Where did all the nitrogen go?Fate of nitrogen inputs to large watersheds in the northeastern USA. Biogeochemistry 57:267-293.
Van Egmond, N. D., A. H. M. Bresser, and A. F. Bouwman.2002. The European nitrogen case. Ambio 31:72-78.
Van Kessel, C., D. J. Pennock, and R. E. Farrel. 1993. Seasonalvariations in denitrification and nitrous oxide evolution. SoilScience Society of America Journal 57:988-995.
Vitousek, P. M., J. D. Aber, R. W. Howarth, G. E. Likens,P. A. Matson, D. W. Schindler, W. H. Schlesinger, and D. G.Tilman. 1997. Human alteration of the global nitrogen cycle:sources and consequences. Ecological Applications 7:737750.
Wade, A. J., P. Durand, V. Beaujouan, W. W. Wessel, K. J.Raat, P. G. Whitehead, D. Butterfield, K. Rankinen, and L.Lepisto. 2002. A nitrogen model for European catchments:INCA, a new model structure and equations. Hydrology andEarth System Sciences 6:559-582.
Wade, A. J., C. Soulsby, S. J. Langan, P. G. Whitehead, A. C.Edwards, D. Butterfield, R. P. Smart, Y. Cook, and R. P.Owen. 2001. Modelling instream nitrogen variability in theDee catchment, NE Scotland. Science of the Total Environment 265:229-252.
Weier, K. L.., J. W. Doran, J. F. Power, and D. T. Walters.1993. Denitrification and the dinitrogen/nitrous oxide rationas affected by soil water, available carbon, and nitrate. SoilScience Society of America Journal 57:66-72.
Whelan, M. J., and C. Gandolfi. 2002. Modelling of spatialcontrols of denitrification at the landscape scale. Hydrological Processes 16: 1437-1450.
Whitehead, P. G., E. J. Wilson, and D. Butterfield. 1998. Asemi-distributed integrated nitrogen model for multiplesource assessment in catchments (INCA). Part I: modelstructure and process equations. Science of the TotalEnvironment 210(1-6):547-558.
Wigmosta, M., L. Vail, and D. Lettenmaier. 1994. Distributedhydrology-vegetation model for complex terrain. WaterResources Research 30(6): 1665-1679.
Williams, J. R. 1995. The EPIC model. Pages 910-1000 in V. P.Singh, editor. Computer models of watershed hydrology.Water Resources Publications, Highlands Ranch, Colorado,USA.
Williams, J. R., C. A. Jones, and P. T. Dyke. 1984. A modelingapproach to determining the relationship between erosionand soil productivity. Transactions of ASAE 27:129-144.
Xing, G. X., and Z. L. Zhu. 2002. Regional nitrogen budgetsfor China and its major watersheds. Biogeochemistry 57(8):405-427.
Xu-Ri, M. Wang, and Y. Wang. 2003. Using a modified DNDCmodel to estimate N 20 fluxes from semi-arid grassland inChina. Soil Biology and Biochemistry 35:615-620.
Youssef, M. A. 2003. Modeling nitrogen transport and transformations in high water table soils. Dissertation. NorthCarolina State University, Department of Biological andAgricultural Engineering, Raleigh, North Carolina, USA.
Youssef, M. A., R. W. Skaggs, G. M. Chescheir, and J. W.Gilliam. 2005. The nitrogen simulation model, DRAINMOD-N II. Transactions of the American Society ofAgricultural Engineers 48(2):611-626.
Zhang, Y., C. Li, X. Zhou, and B. Moore, III.. 2002. A simulationmodel linking crop growth and soil biogeochemistry forsustainable agriculture. Ecological Modeling 151:75-108.
Zheng, X., C. Fu, X. Xu, X. Yan, G. Chen, S. Han, Y. Huang,and F. Hu. 2002. The Asian nitrogen case. Ambio 31(2): 19-87.
Related Documents