Modeling and Application of Catalytic Ignition in Internal Combustion Engines FINAL REPORT FEBRUARY 2004 Budget Number KLK312 N04-03 Prepared for OFFICE OF UNIVERSITY RESEARCH AND EDUCATION U.S. DEPARTMENT OF TRANSPORTATION Prepared by National Institute for Advanced Transportation Technology University of Idaho Judi Steciak and Steve Beyerlein

Welcome message from author
This document is posted to help you gain knowledge. Please leave a comment to let me know what you think about it! Share it to your friends and learn new things together.
Transcript
Modeling and Application of Catalytic Ignition in Internal Combustion Engines
FINAL REPORT FEBRUARY 2004
Budget Number KLK312
N04-03
Prepared for
OFFICE OF UNIVERSITY RESEARCH AND EDUCATION U.S. DEPARTMENT OF TRANSPORTATION
Prepared by
National Institute for Advanced Transportation Technology University of Idaho
Judi Steciak and Steve Beyerlein
TABLE OF CONTENTS
TABLE OF FIGURES............................................................................................................. iii
LIST OF TABLES.................................................................................................................... v
LIST OF TABLES.................................................................................................................... v
EXECUTIVE SUMMARY ...................................................................................................... 1
PART I. STEADY STATE DYNAMOMETER TESTING TO COMPARE OPERATION
ON GASOLINE AND AQUEOUS ETHANOL IN A PASSENGER VAN ........................... 3
I.A INTRODUCTION ........................................................................................................ 3
I.B DESCRIPTION OF PROBLEM................................................................................... 4
I.C APPROACH AND METHODOLOGY ....................................................................... 5
Benefits of Aqueous Fuel Combustion ......................................................................... 5
Catalytic Igniter Technology ........................................................................................ 6
Fuel Handling System................................................................................................... 7
Fuel Injection System ................................................................................................... 8
Test Protocol ............................................................................................................... 11
Dynamometer Testing................................................................................................. 13
I.D FINDINGS; CONCLUSIONS; RECOMMENDATIONS......................................... 16
Preliminary Results..................................................................................................... 16
Conclusions................................................................................................................. 17
Future Work ................................................................................................................ 18
Acknowledgements..................................................................................................... 18
PART II. MODELING CATALYTIC IGNITION CONDITIONS OF PROPANE/AIR
MIXTURES OVER PLATINUM WIRES ............................................................................. 19
II.A INTRODUCTION ...................................................................................................... 19
II.B DESCRIPTION OF PROBLEM................................................................................. 20
II.C APPROACH AND METHODOLOGY ..................................................................... 21
Pressurizable Plug--Flow Reactor............................................................................... 22
Experimental Determination of Surface Reaction Temperature................................. 24
Two-Dimensional Propane-Air Mixture Mixed Mode Heat Transfer Model ............ 24
Sensitivity Study (Fluid Flow).................................................................................... 26
Modeling and Application of Catalytic Ignition in Internal Combustion Engines i
Sensitivity Study (Catalyst Geometry) ....................................................................... 26
Sensitivity Study (Power Input).................................................................................. 27
Three-Dimensional FEA Model ................................................................................. 27
I.D FINDINGS; CONCLUSIONS; RECOMMENDATIONS......................................... 29
Comparisons of Two-Dimensional and Three-Dimensional Results with the
Experimental Results .................................................................................................. 29
Ongoing Research....................................................................................................... 30
Acknowledgments....................................................................................................... 30
PART III. THEORETICAL STUDY OF AQUEOUS ETHANOL-AIR COMBUSTION
IN PLUG FLOW..................................................................................................................... 31
III.A INTRODUCTION .................................................................................................. 31
III.B DESCRIPTION OF PROBLEM............................................................................. 32
III.C APPROACH AND METHODOLOGY ..................................................................... 33
Hydrodynamics, Combustion, and Transport (HCT) Code ........................................ 34
Theoretical Impact of Water on Gas-Phase Ethanol Combustion .............................. 35
III.D FINDINGS; CONCLUSIONS; RECOMMENDATIONS......................................... 47
Future Plans ................................................................................................................ 47
Acknowledgements..................................................................................................... 48
REFERENCES ....................................................................................................................... 49
Modeling and Application of Catalytic Ignition in Internal Combustion Engines ii
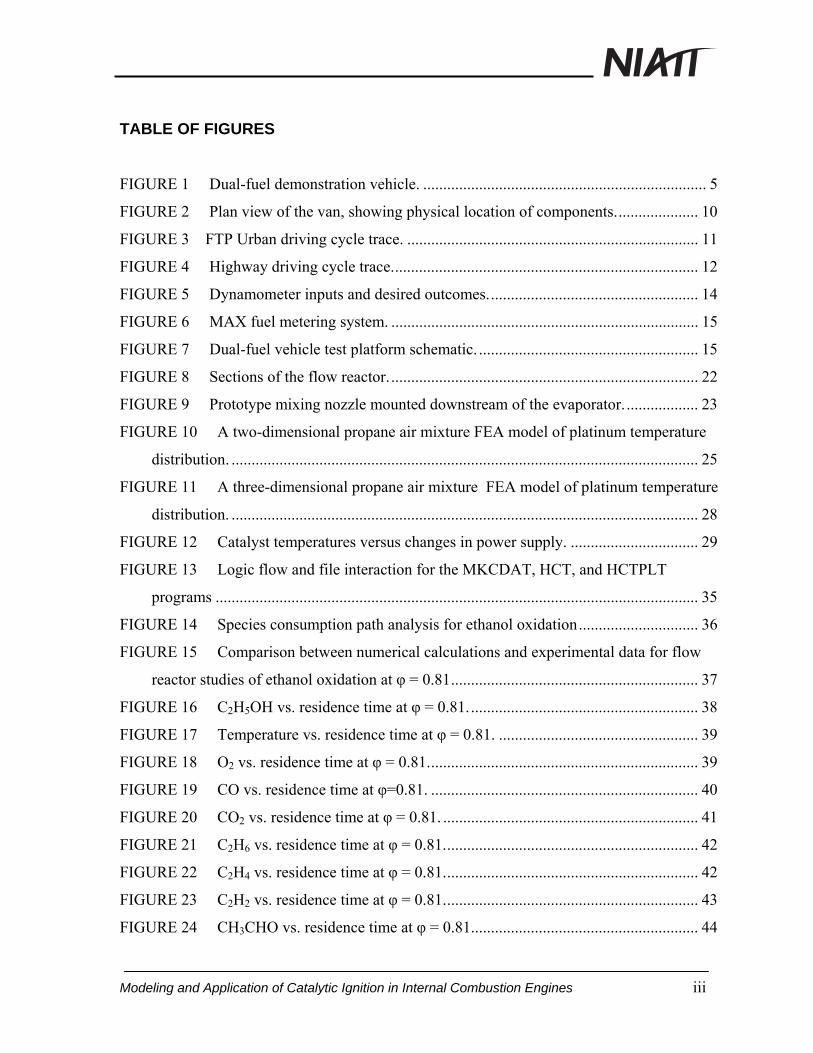
TABLE OF FIGURES
FIGURE 1 Dual-fuel demonstration vehicle. ....................................................................... 5
FIGURE 2 Plan view of the van, showing physical location of components..................... 10
FIGURE 3 FTP Urban driving cycle trace. ......................................................................... 11
FIGURE 4 Highway driving cycle trace............................................................................. 12
FIGURE 5 Dynamometer inputs and desired outcomes..................................................... 14
FIGURE 6 MAX fuel metering system. ............................................................................. 15
FIGURE 7 Dual-fuel vehicle test platform schematic. ....................................................... 15
FIGURE 8 Sections of the flow reactor. ............................................................................. 22
FIGURE 9 Prototype mixing nozzle mounted downstream of the evaporator. .................. 23
FIGURE 10 A two-dimensional propane air mixture FEA model of platinum temperature
distribution. ..................................................................................................................... 25
FIGURE 11 A three-dimensional propane air mixture FEA model of platinum temperature
distribution. ..................................................................................................................... 28
FIGURE 12 Catalyst temperatures versus changes in power supply. ................................ 29
FIGURE 13 Logic flow and file interaction for the MKCDAT, HCT, and HCTPLT
programs ......................................................................................................................... 35
FIGURE 14 Species consumption path analysis for ethanol oxidation.............................. 36
FIGURE 15 Comparison between numerical calculations and experimental data for flow
reactor studies of ethanol oxidation at φ = 0.81.............................................................. 37
FIGURE 16 C2H5OH vs. residence time at φ = 0.81.......................................................... 38
FIGURE 17 Temperature vs. residence time at φ = 0.81. .................................................. 39
FIGURE 18 O2 vs. residence time at φ = 0.81.................................................................... 39
FIGURE 19 CO vs. residence time at φ=0.81. ................................................................... 40
FIGURE 20 CO2 vs. residence time at φ = 0.81. ................................................................ 41
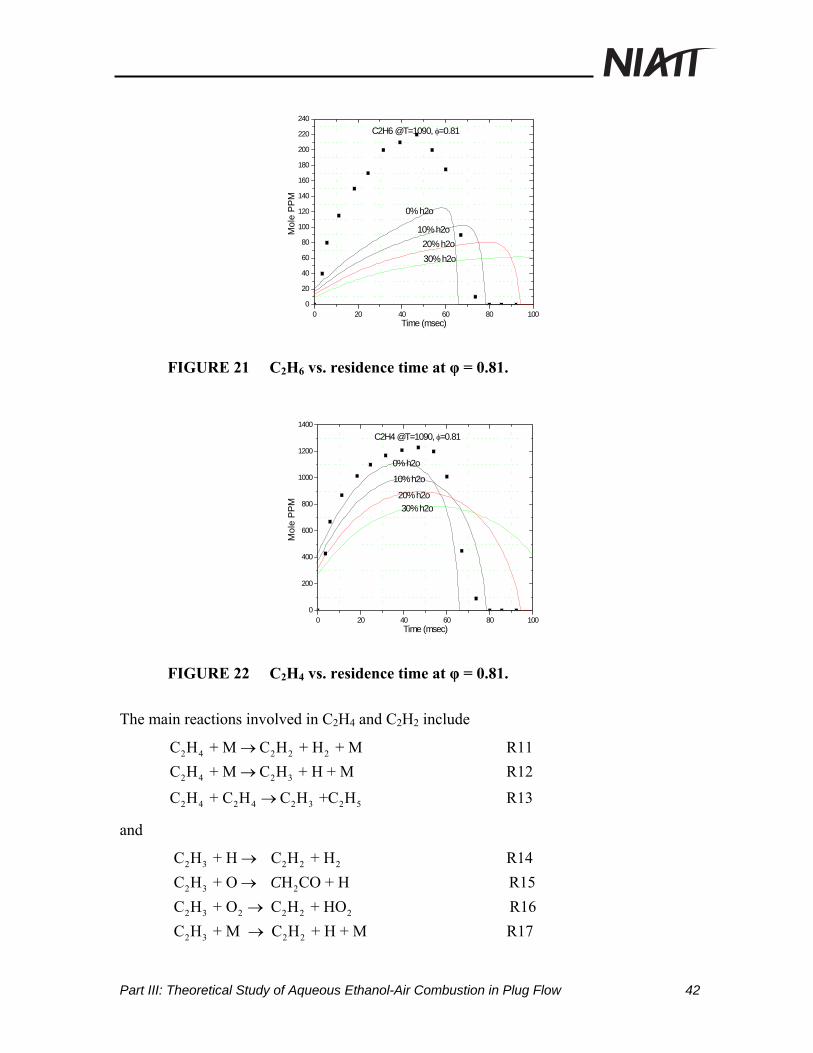
FIGURE 21 C2H6 vs. residence time at φ = 0.81................................................................ 42
FIGURE 22 C2H4 vs. residence time at φ = 0.81................................................................ 42
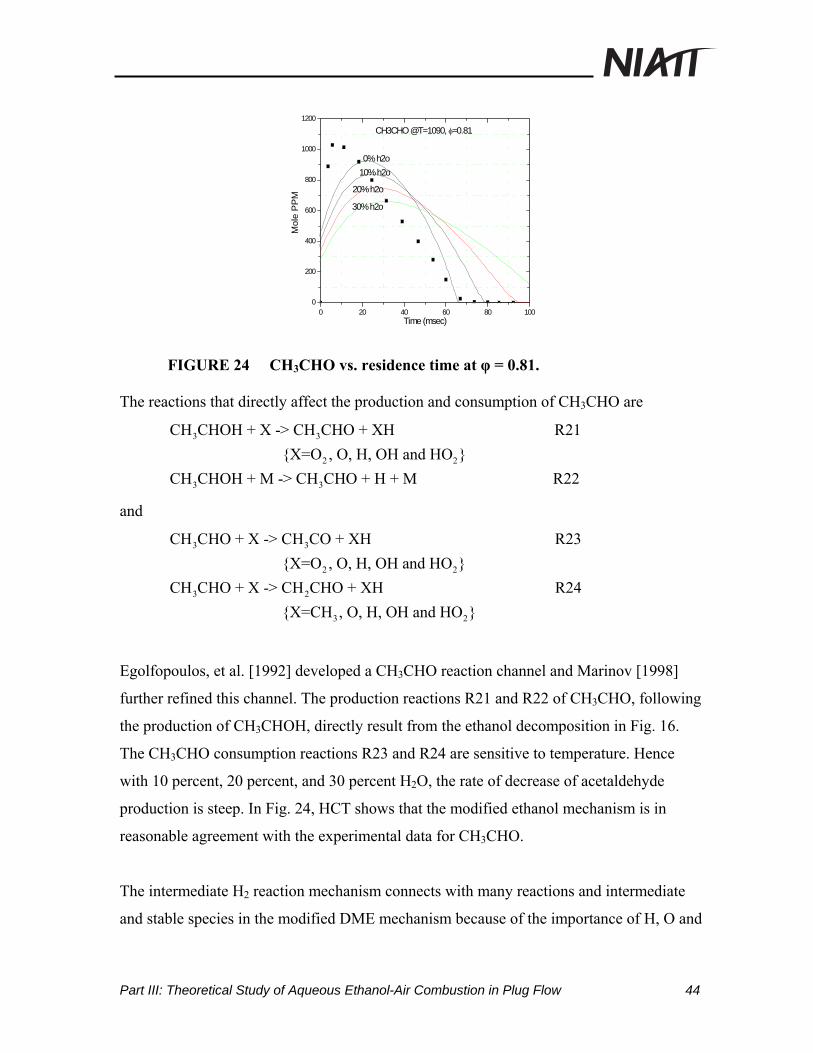
FIGURE 23 C2H2 vs. residence time at φ = 0.81................................................................ 43
FIGURE 24 CH3CHO vs. residence time at φ = 0.81......................................................... 44
Modeling and Application of Catalytic Ignition in Internal Combustion Engines iii

FIGURE 25 Water vs. residence time at φ = 0.81. ............................................................. 45
FIGURE 26 Water vs. residence time at φ = 0.81. ............................................................. 45
FIGURE 27 CH4 vs. residence time at φ =0.81. ................................................................. 46
Modeling and Application of Catalytic Ignition in Internal Combustion Engines iv
LIST OF TABLES
TABLE 1 Description of Six-Mode Points......................................................................... 12
TABLE 2 Five-Gas Emissions and Fuel Consumption at Six Modal Points for Gasoline. 16
TABLE 3 Torque and Phrottle Position.............................................................................. 17
TABLE 4 Design Features.................................................................................................. 17
TABLE 5 Sensitivity to Mesh Density ............................................................................... 24
TABLE 6 Effects of Fluid Velocity Changes on Catalyst Temperature ............................ 26
TABLE 7 Effects of Wire Diameter Changes on Average Catalyst Temperature. ............ 26
TABLE 8 Effects of Power Supply Changes on Average Catalyst Temperature............... 27
Modeling and Application of Catalytic Ignition in Internal Combustion Engines v
EXECUTIVE SUMMARY
We progressed towards our ultimate goal of developing catalytic igniters for aqueous
ethanol as a transportation fuel with three different actions: 1) developing a test matrix to
compare the performance of a passenger van operating with gasoline with the same van
operating with aqueous ethanol; 2) determining the average temperature when surface
reactions occur on a heated platinum wire catalyst; and 3) theoretically modeling the
impact of water on the gas-phase oxidation of ethanol.
We used a steady-state chassis dynamometer approximating urban and rural driving
cycles to develop our test matrix. We evaluated the matrix using a van fueled with
gasoline. The van was converted for dual-fuel use with a programmable dual fuel
computer and injectors replacing the carburetor, and catalytic igniters instead of
sparkplugs.
Ignition of fuel/oxygen/nitrogen mixtures over a platinum wire was studied using
microcalorimetry. Experimental results were compared with predictions from a steady-
flow finite element (FEA) model. The average catalyst wire temperatures obtained from a
three-dimensional FEA model over predicted the experimentally obtained temperatures
by only threepercent. The FEA analysis indicated that axial conduction dominated heat
losses from the Pt catalyst in comparison with radial convection.
The thermal decomposition and combustion kinetics of gas-phase ethanol oxidation were
modeled with a computer code. The output was compared with flow reactor data
available in the literature. Reasonable agreement was found between the model and data
for 100 percent ethanol oxidation.
The vehicle test matrix developed in this work makes it possible for us to compare
vehicle performance on gasoline and ethanol-water. Comparisons of alternative fuels
with conventional fuels fueling the same vehicle platform are required to quantify
differences in performance and emissions.
Modeling and Application of Catalytic Ignition in Internal Combustion Engines 1

The FEA modeling indicates that thermal breaks and/or substrates with lower thermal
conductivity will reduce heat losses from catalytic igniters, a concern during cold start.
Our new ability to model detailed combustion kinetics permits us to determine the
optimal ignition and combustion conditions needed to reduce the formation of toxins and
environmental contaminants from renewable transportation fuels.
Modeling and Application of Catalytic Ignition in Internal Combustion Engines 2
PART I. STEADY STATE DYNAMOMETER TESTING TO COMPARE OPERATION ON GASOLINE AND AQUEOUS ETHANOL IN A PASSENGER VAN
I.A INTRODUCTION
Comparisons of alternative fuels with conventional fuels fueling the same vehicle
platform are required to quantify differences in performance and emissions. To make
comparison tests possible, we developed a test matrix using a steady-state chassis
dynamometer approximating urban and rural driving cycles. The matrix was evaluated
using a passenger van operating with gasoline. The van was converted for dual-fuel use
with a programmable dual fuel computer and injectors replacing the carburetor, and
catalytic igniters instead of sparkplugs. The van conversion provided us with a robust,
reliable vehicle platform for evaluating alternative fuel handling system that shows no
sign of corrosion. Furthermore, gasoline fuel economy and emissions are far improved
over the original carbureted configuration with a 95 percent reduction in NOx and a 67
percent reduction in unburned hydrocarbons. The test matrix developed in this work will
be used to compare vehicle performance on gasoline and ethanol-water.
In the following sections, we summarize the progress of our research in this area.
Part I. Steady State Dynamometer Testing to Compare Operation on Gasoline and Aqueous Ethanol in a Passenger Van 3

I.B DESCRIPTION OF PROBLEM
Previous research on catalytic igniters and aqueous fueled engines showed potential for
lowering emissions and increasing engine efficiency over conventional engine
configurations. To quantify these improvements in a vehicle platform, we converted a
transit van owned by Valley Transit of Lewiston, Idaho, to operate on both gasoline and
aqueous fuels, with changeover possible in less than one hour.
Back to back comparisons of baseline engine and converted engine performance are
critical for documenting benefits of alternative fuel operation on the same vehicle. To
facilitate these comparisons, we developed a test matrix using a steady-state chassis
dynamometer approximating urban and rural driving cycles. Preliminary results for the
converted transit van using gasoline, which agree closely with driving cycle data from the
original vehicle, are presented in this report.
Part I. Steady State Dynamometer Testing to Compare Operation on Gasoline and Aqueous Ethanol in a Passenger Van 4
I.C APPROACH AND METHODOLOGY
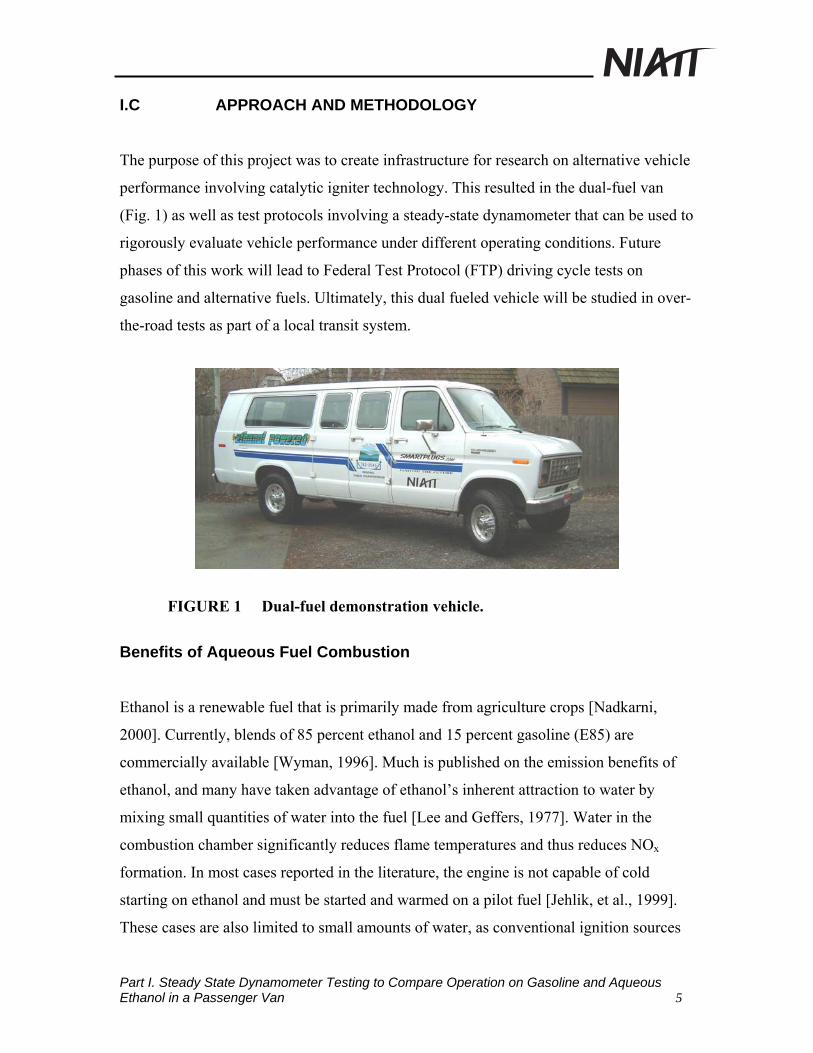
The purpose of this project was to create infrastructure for research on alternative vehicle
performance involving catalytic igniter technology. This resulted in the dual-fuel van
(Fig. 1) as well as test protocols involving a steady-state dynamometer that can be used to
rigorously evaluate vehicle performance under different operating conditions. Future
phases of this work will lead to Federal Test Protocol (FTP) driving cycle tests on
gasoline and alternative fuels. Ultimately, this dual fueled vehicle will be studied in over-
the-road tests as part of a local transit system.
FIGURE 1 Dual-fuel demonstration vehicle.
Benefits of Aqueous Fuel Combustion
Ethanol is a renewable fuel that is primarily made from agriculture crops [Nadkarni,
2000]. Currently, blends of 85 percent ethanol and 15 percent gasoline (E85) are
commercially available [Wyman, 1996]. Much is published on the emission benefits of
ethanol, and many have taken advantage of ethanol’s inherent attraction to water by
mixing small quantities of water into the fuel [Lee and Geffers, 1977]. Water in the
combustion chamber significantly reduces flame temperatures and thus reduces NOx
formation. In most cases reported in the literature, the engine is not capable of cold
starting on ethanol and must be started and warmed on a pilot fuel [Jehlik, et al., 1999].
These cases are also limited to small amounts of water, as conventional ignition sources
Part I. Steady State Dynamometer Testing to Compare Operation on Gasoline and Aqueous Ethanol in a Passenger Van 5
are unable to ignite blends of greater than 15 percent water. In all studies with spark
ignition, significant misfire or non-fire occurs above 10 percent water present in the fuel.
The University of Idaho and Automotive Resources, Inc., of Sandpoint, Idaho, have been
working with Aquanol fueled engines since 1996. Aquanol is a mix of 65 percent ethanol
and 35 percent water by volume. While this mixture has not been optimized, it provides a
good balance between NOx minimization and complete combustion of in-cylinder
hydrocarbons. Aquanol-fueled engines have run on mixtures up to 50 percent ethanol and
50 percent water, and shown cold starting capability [Morton, et al., 1999].
Catalytic Igniter Technology
The primary drawback in using Aquanol is the difficulty of initiating combustion.
Traditional means of spark ignition are insufficient to initiate flame propagation of
Aquanol-air mixtures [Cherry, et al., 1992]. An ignition source using a catalytic reaction
in a pre-chamber provides a high-power torch ignition that has proven successful at
igniting mixtures previously un-ignitable by spark or compression ignition [Gottschalk,
1995]. This ignition source is elementary when converting an engine to operate on
Aquanol.
Automotive Resources Inc. (ARI) has held the patent on catalytic ignition in a pre-
chamber since 1990 [Cherry, 1990]. Since then ARI has made many improvements in the
robustness and ignition control of the catalytic igniter. They have applied this technology
to improve performance and emissions of rotary engines, two-stroke engines and to
combust unconventional fuels in reciprocating internal combustion (IC) engines.
The University of Idaho began its first research project in 1966, converting aYanmar
three-cylinder, direct-injection, compression-ignition (CI) engine to run on Aquanol
[Morton, 2000]. Direct diesel injectors were replaced with catalytic igniters, and a
manifold fuel injection system was put in place for fuel delivery. This engine had no
throttle plate, so load was controlled only by the amount of fuel delivered to the engine.
Part I. Steady State Dynamometer Testing to Compare Operation on Gasoline and Aqueous Ethanol in a Passenger Van 6
Initial research showed that it was possible to burn high water content with ethanol in an
IC engine using catalytic ignition. Further testing was done to acquire full brake specific
fuel consumption and brake specific emissions maps on both a stock Yanmar diesel
engine and the Yanmar converted to Aquanol fuel [Clarke, 2001].
As expected, the emissions of NOx were reduced significantly, with slight increases in
CO and HC—both of which are easily reduced with exhaust after treatment. Net
indicated thermal efficiency increased from 35 percent on diesel to 42 percent on
Aquanol [Cordon, et al., 2002]. With the addition of an intake air pre-heater, the Yanmar
engine demonstrated cold-start and smooth idle capabilities on a 35 percent water/65
percent ethanol fuel, operating over air/fuel ratios between 8:1 and 45:1.
Fuel Handling System
One of the major systems unique to a flexible-fuel vehicle is fuel handling. This research
platform was designed to keep two different fuels onboard by installing individual
storage for gasoline and Aquanol. Nearly all fuel system components were designed to be
compatible with gasoline, since gasoline is the predominant fuel used in the United
States. Alcohol fuels are more corrosive than gasoline and the addition of water makes
them even more corrosive. Fuel handling components designed for gasoline are
susceptible to rapid corrosion when used with Aquanol.
The first Aquanol storage tank used in this research was made of steel with the interior
surface coated with Teflon. The Teflon was intended to act as a barrier against corrosion.
After two years of use, examination of the fuel tank showed the coating had failed and
particles were clogging the remainder of the fuel system. In addition, the fuel pickup and
fuel lines were not Aquanol compatible. Materials compatible with Aquanol are:
polypropylene, stainless steel, hard anodized aluminum, brass, Teflon, and most synthetic
rubbers.
That first handling system was removed and replaced with a pair of polypropylene fuel
tanks with anodized fuel pickups. The two Aquanol tanks combined have a capacity of 46
Part I. Steady State Dynamometer Testing to Compare Operation on Gasoline and Aqueous Ethanol in a Passenger Van 7
gallons, which yields a similar vehicle range as a 25-gallon tank of gasoline. The flexible
fuel lines, Earls Auto-Flex hose constructed of HTE synthetic rubber bonded to a braided
stainless steel shell, use hard-anodized Ano-Tuff hose ends. All the rigid fuel lines and
fittings are made of 304 stainless steel, with the exception of anodized aluminum pre-
filters.
Because of space limitations, only a single fuel injection system will fit on the engine.
Both fuels share a common fuel pump, high-pressure lines, injectors and regulator. To
accommodate this, a set of stainless valves is used to control the flow path of fuel. In fuel
injection systems the fuel tank has two lines. The suction line is connected to the fuel
pump where a constant flow and pressure is attained. Any fuel not used in the engine is
returned back to the fuel tank via a return line. Dual fuel tanks are common on large fuel
injected vehicles, and tank selector valves are available that switch both the suction and
return lines at once. These valves are not compatible with Aquanol. More importantly,
using such a valve will allow the fuel enclosed in the loop between the inlet and return
valves to contaminate the other fuel when switched. The set of fuel selector valves
designed for the van consists of a single T-ball valve that switches between the two
different fuel sources, and a valve body of three T-valves to handle flow of the return
line. All four valves are modular and made of 316 stainless with a Teflon seat. The three
valves are joined by half-inch stainless pipefittings coated with anti-seize compound to
prevent galling.
Fuel Injection System
Two principal design constraints for the fuel system were corrosion resistance and a wide
fuel metering capability. Conscientious material selection provides a solution to the first
constraint. Aquanol has 36 percent the energy per unit mass of gasoline (15.9 MJ/kg vs.
44.0 MJ/kg). Even though engines running Aquanol and catalytic igniters typically show
an increase in net indicated thermal efficiency, Aquanol still requires over twice the
volume flow rate of gasoline to maintain comparable performance. A careful balance of
shared components was necessary to ensure successful operation on both fuels.
Part I. Steady State Dynamometer Testing to Compare Operation on Gasoline and Aqueous Ethanol in a Passenger Van 8
The fuel injection system is responsible for precise metering of the fuel delivered to the
engine. CI engines control engine load by varying only the amount of fuel delivered to
the engine, and thus operate over a wide range of air/fuel ratios. This is the case for diesel
engines, and the Yanmar Aquanol conversion. Spark ignition (SI) engines control load by
throttling—restricting airflow to the engine. Ideally, SI engines will have a constant
air/fuel ratio, but the amount of air/fuel mixture will vary greatly throughout operating
conditions. The job of the fuel injection system is to meter the fuel flow to maintain a
consistent air/fuel ratio. This is done with a central electronic control module (ECM) that
sends and receives information from various engine components.
Using a programmable ECM allows injection components to be shared between both
fuels. This provides easy changing between fuels without the need for replacing fuel
hardware as would be necessary with carburetion. When switching fuels, a new fuel map
is uploaded to the ECM. The Haltec ECM interfaces with a laptop computer for making
changes to fuel parameters. When connected, the laptop is used to display sensor input
and output data. This data recorded on the laptop is particularly useful for diagnostics and
gathering information about engine load.
Fuel injection requires fuel pressures between 30 and 60 psi. Fuel flow rates must also be
considered when selecting a pump. At full speed and load, the fuel pump must be capable
of over 300 lbf/hour of Aquanol at 40 psi. Another major consideration for the fuel pump
is corrosion. Bosch is the only manufacturer that made a high-pressure automotive fuel
pump fully compatible with Aquanol. Unfortunately, due to low demand, that pump has
been discontinued. Aeromotive, Inc., makes a high quality, high flow pump that is
compatible with our requirements. The internal surfaces are stainless, brass, copper, and
bronze with an aluminum housing. The pump is capable of 450 lbf/hour at 45 psi. One of
the distinguishing features of this pump is that it can be easily disassembled for
inspection or maintenance. If a vehicle were to sit idle for more than a month when setup
for Aquanol use, it is recommended that the fuel loop be purged with gasoline.
Part I. Steady State Dynamometer Testing to Compare Operation on Gasoline and Aqueous Ethanol in a Passenger Van 9
Fuel injectors are simply inductance-activated solenoids with a needle and seat to control
fuel flow. The engine has eight injectors so each injector must be capable of 40 lbf/hour
flow. MSD makes a series of injectors that are fully stainless where in contact with the
fuel. Flow ratings were given at 35 psi, and injectors with a max flow rate of 38 lbf/hour
were selected. Running a fuel pressure of 40 psi provides adequate flow for peak
requirements on Aquanol. Larger injectors are available, but should not be used if dual
fuel capability is desired. An injector larger than 40 lbf/hour will not be capable of
accurately metering low gasoline flows at idle conditions.
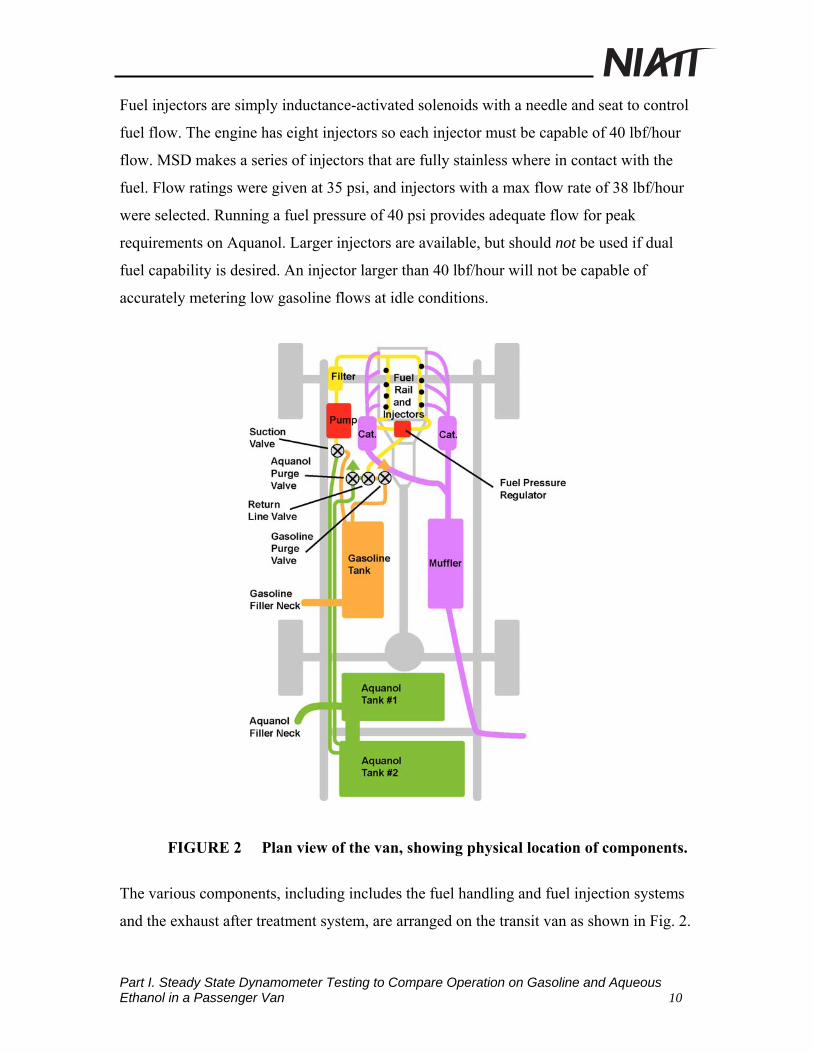
FIGURE 2 Plan view of the van, showing physical location of components.
The various components, including includes the fuel handling and fuel injection systems
and the exhaust after treatment system, are arranged on the transit van as shown in Fig. 2.
Part I. Steady State Dynamometer Testing to Compare Operation on Gasoline and Aqueous Ethanol in a Passenger Van 10
Test Protocol
A primary thrust of this research was to create a test protocol that would allow local
testing of the vehicle that would mimic the FTP driving cycles. This allowed preliminary
testing and comparisons of fuel economy and emissions between the two fuels.
Approximating a FTP driving cycle locally allows the fuel mapping and exhaust after
treatment to be evaluated and modified for best possible vehicle emissions and
performance.
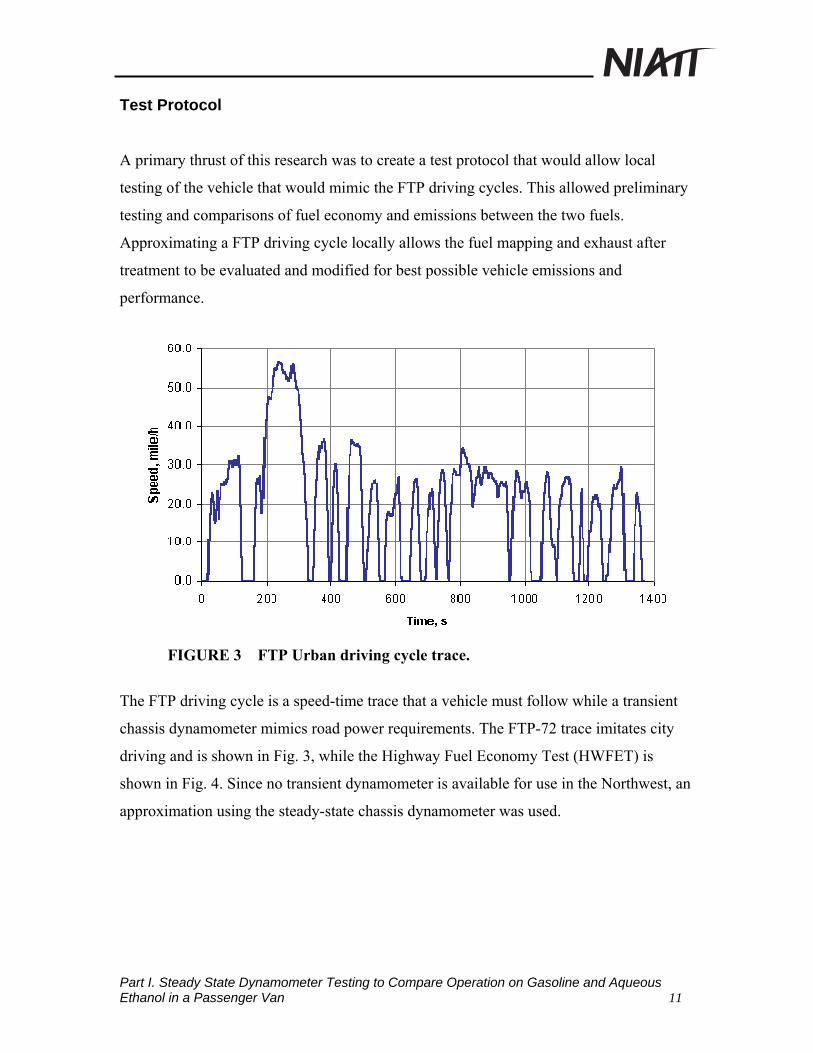
FIGURE 3 FTP Urban driving cycle trace.
The FTP driving cycle is a speed-time trace that a vehicle must follow while a transient
chassis dynamometer mimics road power requirements. The FTP-72 trace imitates city
driving and is shown in Fig. 3, while the Highway Fuel Economy Test (HWFET) is
shown in Fig. 4. Since no transient dynamometer is available for use in the Northwest, an
approximation using the steady-state chassis dynamometer was used.
Part I. Steady State Dynamometer Testing to Compare Operation on Gasoline and Aqueous Ethanol in a Passenger Van 11
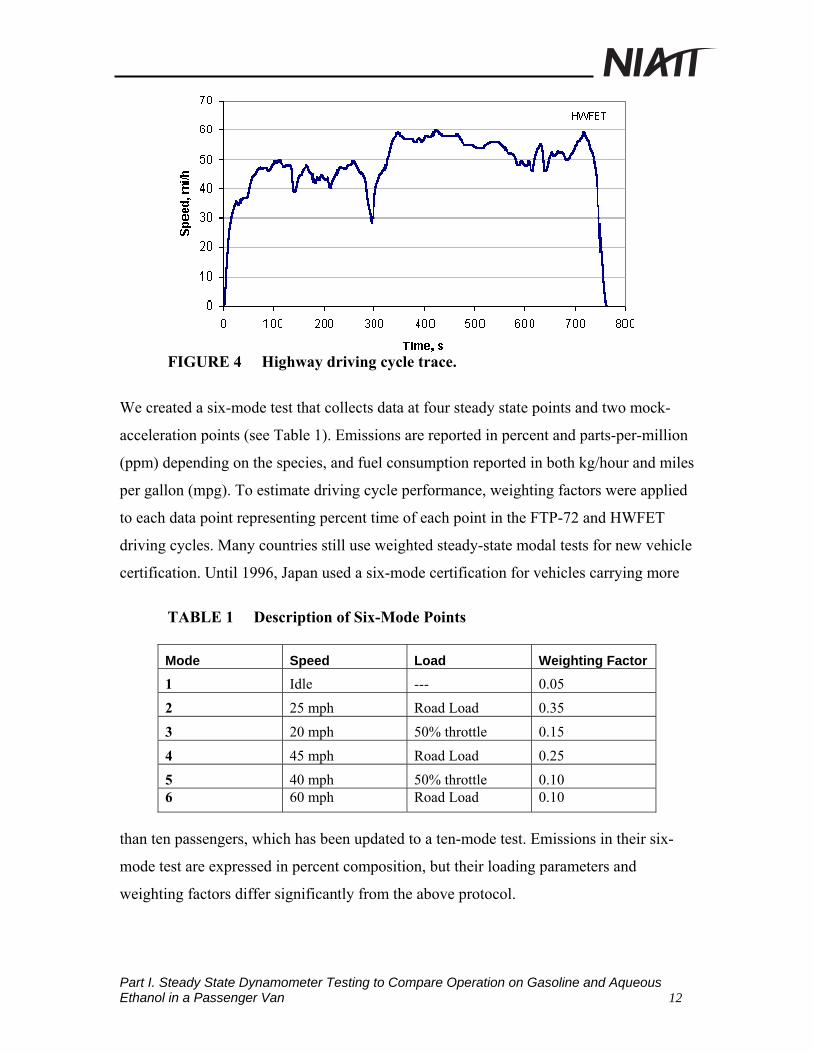
FIGURE 4 Highway driving cycle trace.
We created a six-mode test that collects data at four steady state points and two mock-
acceleration points (see Table 1). Emissions are reported in percent and parts-per-million
(ppm) depending on the species, and fuel consumption reported in both kg/hour and miles
per gallon (mpg). To estimate driving cycle performance, weighting factors were applied
to each data point representing percent time of each point in the FTP-72 and HWFET
driving cycles. Many countries still use weighted steady-state modal tests for new vehicle
certification. Until 1996, Japan used a six-mode certification for vehicles carrying more
TABLE 1 Description of Six-Mode Points Mode Speed Load Weighting Factor
1 Idle --- 0.05
2 25 mph Road Load 0.35
3 20 mph 50% throttle 0.15
4 45 mph Road Load 0.25
5 40 mph 50% throttle 0.10 6 60 mph Road Load 0.10
than ten passengers, which has been updated to a ten-mode test. Emissions in their six-
mode test are expressed in percent composition, but their loading parameters and
weighting factors differ significantly from the above protocol.
Part I. Steady State Dynamometer Testing to Compare Operation on Gasoline and Aqueous Ethanol in a Passenger Van 12
When preparing for chassis dynamometer testing, data was gathered about road load for
three points. The Haltec Halwin software and radar speed sensor was used for initial data
collection. As with roll-down testing, the data was collected on a flat, straight road and
verified multiple times in each direction. Before measuring road load, the vehicle
speedometer was first calibrated. The radar speed sensor was used to determine the
vehicle’s speedometer reading for each speed, and can vary with tire size and slightly
with tire pressure and wear. To measure road load, we drove the vehicle at a steady-state
speed, using the software to collect data on the engine speed, percent throttle, manifold
pressure, engine and air temperature, and injector duty cycle.
The data gathered on the above road testing was used to recreate the same conditions on
the chassis dynamometer. Once the vehicle is set up on the chassis dynamometer, we
began with some light driving to bring the engine to operating temperature. Once the
dynamometer control was stabilized, we adjusted the throttle to achieve the desired
manifold pressure associated with the given road load speed. After verifying that the
injector duty cycle matches the road load data, we collected data on emissions, fuel
consumption, engine and air temperature, and vehicle speed.
Dynamometer Testing
Chassis Dynamometer testing was conducted to establish baseline performance on
gasoline and to calibrate equipment. Figure 5 shows a diagram of the dynamometer
variables measured, identifying user inputs and desired outcomes.
Since performance measurements were dependent on the inputs of dynamometer speed
control and vehicle throttle position, a procedure was developed to calibrate wheel
speeds. First, a road test was performed. Throttle position readings were taken from an
onboard programmable control module while vehicle speed was calibrated as compared
to speed read from a Garmin E-trex GPS with an accuracy of +/- 0.1 mph. The van was
then run on the chassis dynamometer under no load conditions. Six calibrated speeds
Part I. Steady State Dynamometer Testing to Compare Operation on Gasoline and Aqueous Ethanol in a Passenger Van 13
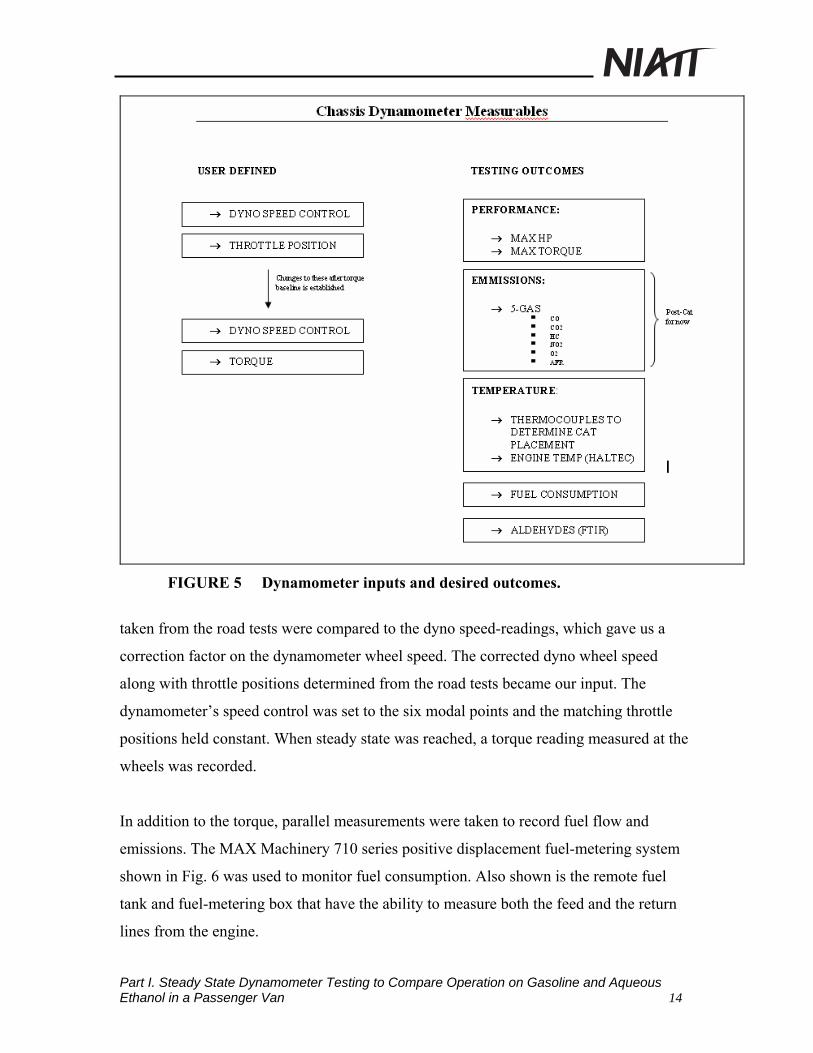
FIGURE 5 Dynamometer inputs and desired outcomes.
taken from the road tests were compared to the dyno speed-readings, which gave us a
correction factor on the dynamometer wheel speed. The corrected dyno wheel speed
along with throttle positions determined from the road tests became our input. The
dynamometer’s speed control was set to the six modal points and the matching throttle
positions held constant. When steady state was reached, a torque reading measured at the
wheels was recorded.
In addition to the torque, parallel measurements were taken to record fuel flow and
emissions. The MAX Machinery 710 series positive displacement fuel-metering system
shown in Fig. 6 was used to monitor fuel consumption. Also shown is the remote fuel
tank and fuel-metering box that have the ability to measure both the feed and the return
lines from the engine.
Part I. Steady State Dynamometer Testing to Compare Operation on Gasoline and Aqueous Ethanol in a Passenger Van 14
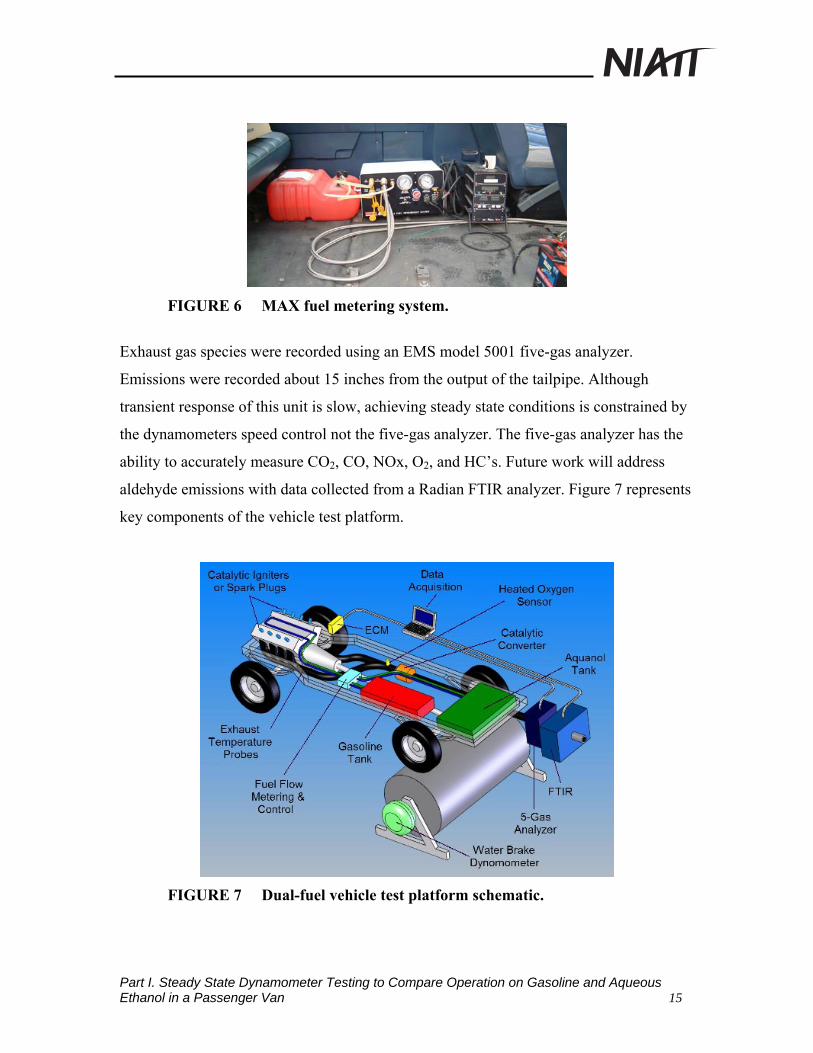
FIGURE 6 MAX fuel metering system.
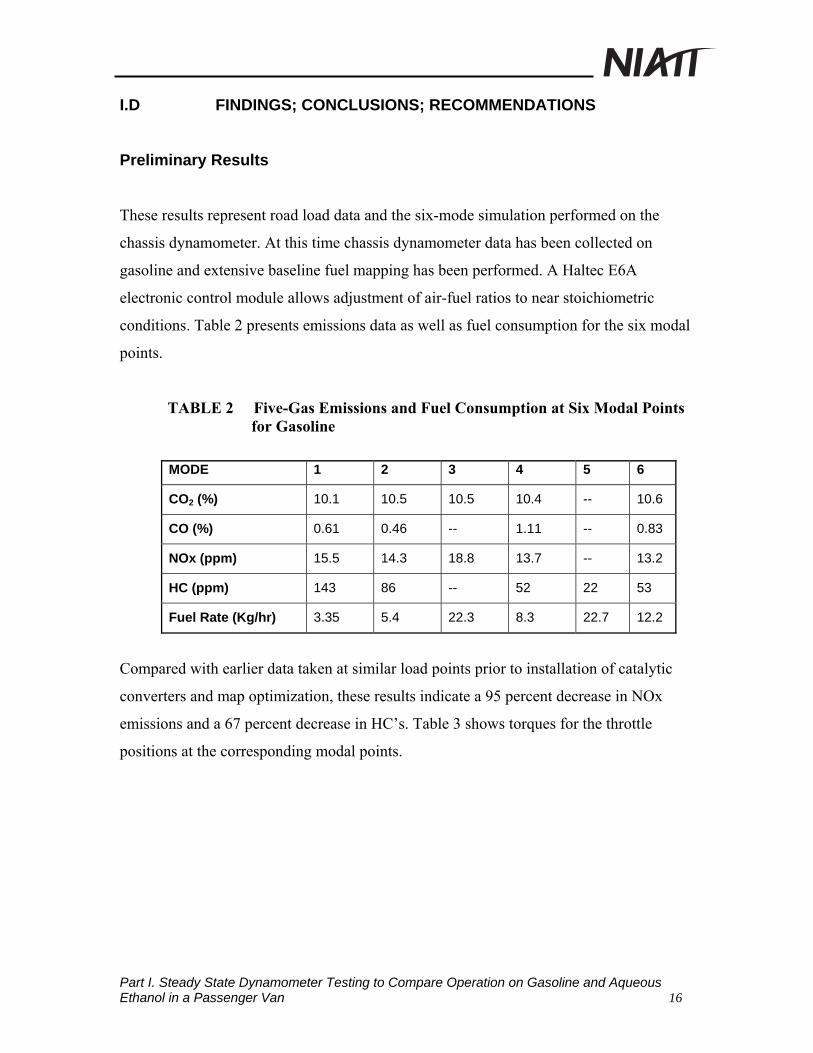
Exhaust gas species were recorded using an EMS model 5001 five-gas analyzer.
Emissions were recorded about 15 inches from the output of the tailpipe. Although
transient response of this unit is slow, achieving steady state conditions is constrained by
the dynamometers speed control not the five-gas analyzer. The five-gas analyzer has the
ability to accurately measure CO2, CO, NOx, O2, and HC’s. Future work will address
aldehyde emissions with data collected from a Radian FTIR analyzer. Figure 7 represents
key components of the vehicle test platform.
FIGURE 7 Dual-fuel vehicle test platform schematic.
Part I. Steady State Dynamometer Testing to Compare Operation on Gasoline and Aqueous Ethanol in a Passenger Van 15
I.D FINDINGS; CONCLUSIONS; RECOMMENDATIONS
Preliminary Results
These results represent road load data and the six-mode simulation performed on the
chassis dynamometer. At this time chassis dynamometer data has been collected on
gasoline and extensive baseline fuel mapping has been performed. A Haltec E6A
electronic control module allows adjustment of air-fuel ratios to near stoichiometric
conditions. Table 2 presents emissions data as well as fuel consumption for the six modal
points.
TABLE 2 Five-Gas Emissions and Fuel Consumption at Six Modal Points for Gasoline
MODE 1 2 3 4 5 6
CO2 (%) 10.1 10.5 10.5 10.4 -- 10.6
CO (%) 0.61 0.46 -- 1.11 -- 0.83
NOx (ppm) 15.5 14.3 18.8 13.7 -- 13.2
HC (ppm) 143 86 -- 52 22 53
Fuel Rate (Kg/hr) 3.35 5.4 22.3 8.3 22.7 12.2
Compared with earlier data taken at similar load points prior to installation of catalytic
converters and map optimization, these results indicate a 95 percent decrease in NOx
emissions and a 67 percent decrease in HC’s. Table 3 shows torques for the throttle
positions at the corresponding modal points.
Part I. Steady State Dynamometer Testing to Compare Operation on Gasoline and Aqueous Ethanol in a Passenger Van 16
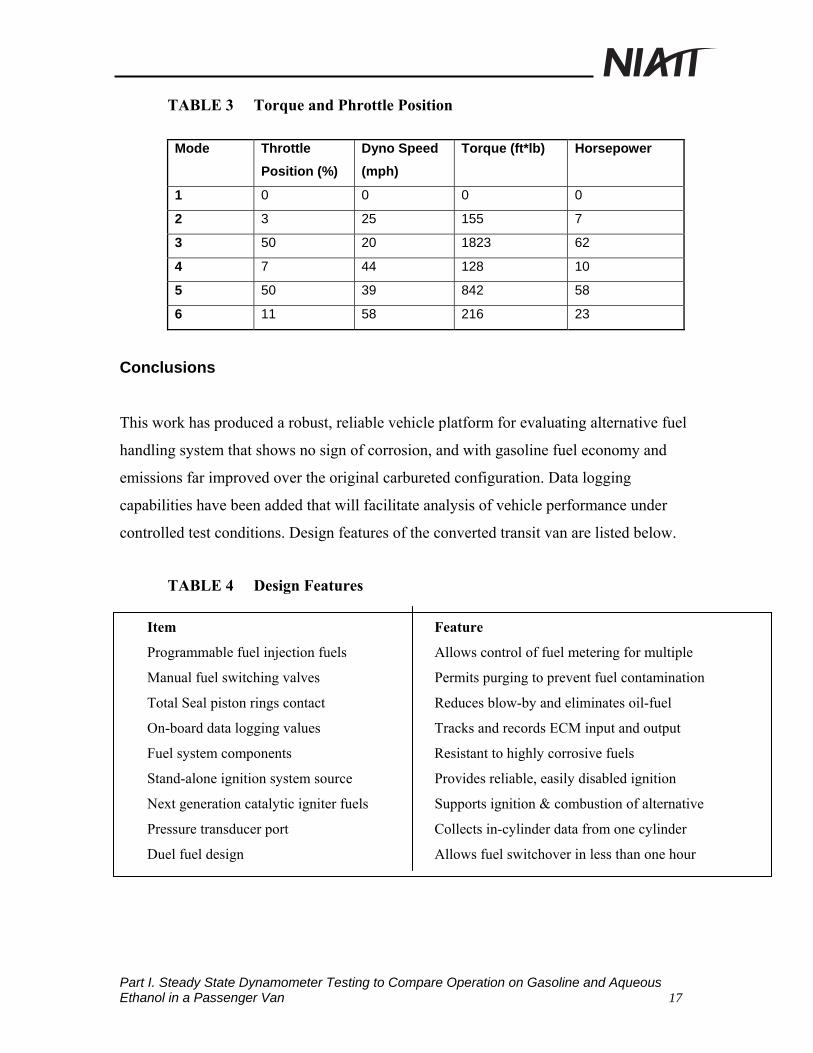
TABLE 3 Torque and Phrottle Position
Mode Throttle Position (%)
Dyno Speed (mph)
Torque (ft*lb) Horsepower
1 0 0 0 0
2 3 25 155 7
3 50 20 1823 62
4 7 44 128 10
5 50 39 842 58
6 11 58 216 23
Conclusions
This work has produced a robust, reliable vehicle platform for evaluating alternative fuel
handling system that shows no sign of corrosion, and with gasoline fuel economy and
emissions far improved over the original carbureted configuration. Data logging
capabilities have been added that will facilitate analysis of vehicle performance under
controlled test conditions. Design features of the converted transit van are listed below.
TABLE 4 Design Features
Item Feature
Programmable fuel injection fuels Allows control of fuel metering for multiple
Manual fuel switching valves Permits purging to prevent fuel contamination
Total Seal piston rings contact Reduces blow-by and eliminates oil-fuel
On-board data logging values Tracks and records ECM input and output
Fuel system components Resistant to highly corrosive fuels
Stand-alone ignition system source Provides reliable, easily disabled ignition
Next generation catalytic igniter fuels Supports ignition & combustion of alternative
Pressure transducer port Collects in-cylinder data from one cylinder
Duel fuel design Allows fuel switchover in less than one hour
Part I. Steady State Dynamometer Testing to Compare Operation on Gasoline and Aqueous Ethanol in a Passenger Van 17
Future Work
Research is currently underway to optimize fuel maps for 65 percent ethanol and 35
percent water blended fuel. Once this is complete, the test protocol developed in this
work will be used to compare vehicle performance on gasoline and ethanol-water. We
expect results to be similar to previous engine conversions at the University of Idaho
where NOx and CO were greatly reduced compared to gasoline combustion. An FTIR
system is currently being installed in our vehicle test cell to support unburned
hydrocarbon speciation monitoring during driving cycle simulations.
Acknowledgements This research is sponsored by the National Institute of Advanced Transportation
Technology (NIATT), the U.S. Department of Transportation, and the Idaho
Transportation Department. Special thanks also to Valley Transit for use of the commuter
van as a vehicle test platform.
Part I. Steady State Dynamometer Testing to Compare Operation on Gasoline and Aqueous Ethanol in a Passenger Van 18
PART II. MODELING CATALYTIC IGNITION CONDITIONS OF PROPANE/AIR MIXTURES OVER PLATINUM WIRES
II.A INTRODUCTION
Ignition of fuel/oxygen/nitrogen mixtures over a platinum wire was studied using
microcalorimetry. Experimental results were compared with predictions from a steady-
flow finite element (FEA) model. The average catalyst wire temperatures obtained from
both two- and three-dimensional FEA models over predicted the experimentally obtained
temperatures by 26 and 3 percent, respectively. Modeling assumptions (prescribed end
temperatures of the wire and negligible thermal radiation) and uncertainty in the
convective heat transfer coefficient contributed to the differences between model and
data.
The FEA analysis indicated that axial conduction dominated heat losses from the Pt
catalyst in comparison with radial convection. This finding suggested that thermal breaks
and/or substrates with lower thermal conductivity will reduce heat losses from catalytic
igniters. Future work will determine the threshold-heating rate of the Pt wire at which the
ignition of aqueous ethanol fuel-air mixtures occurs. This work is expected to support
design improvements for catalytic igniters to help alleviate cold starting problems.
Part II. Modeling Catalytic Ignition Conditions of Propane/Air Mixtures over Platinum Wires 19
II.B DESCRIPTION OF PROBLEM
The ignition of gas phase combustion by a heated catalytically active surface involves
coupling of transport processes and chemical kinetics. Cold starting is one of the least
understood aspects of igniter operation and has motivated the construction of a catalytic
plug flow reactor at the University of Idaho. A platinum catalyst inserted downstream of
a specially designed mixing nozzle preheats the fuel/air mixture and is a source of
chemical activation in a well-defined control volume. Ignition of propane/oxygen/
nitrogen mixtures over platinum is currently being studied using microcalorimetry.
Of particular interest is the temperature distribution along the length of the platinum
catalyst. In this work, experimental results are compared with predictions by a steady-
flow finite element model. Relative significance of fuel/air surface heating, axial
conduction to the catalyst supports, surface heat generation, supplemental electrical
heating, radiative losses, and convective losses have been documented from the finite
element studies and preliminary experiments.
Also of interest is the determination of minimum external heating required to achieve
catalytic ignition conditions. This work is expected to support design improvements for
catalytic igniters as well as the catalytic flow reactor, alleviating cold starting conditions.
Part II. Modeling Catalytic Ignition Conditions of Propane/Air Mixtures over Platinum Wires 20
II.C APPROACH AND METHODOLOGY
Lean mixtures in internal combustion engines are not readily ignited and are
characterized by a low flame propagation velocity. One effective method to improve
flame initiation is catalytic assistance of ignition and combustion. The transition state of
the molecule catalyst complex in this low energy configuration provides an easier route
for the reactants to proceed in subsequent reactions to form the final products. The fact
that the catalyst can have strong influence on the reaction mechanism, in addition to
lowering the overall activation energy, is suggested by the work of Patterson and Kembal
[1963], who obtained a negative reaction order in fuel for the oxidation of olefins on
platinum films. Similar findings have been reported by Moro-Ok, et al. [1967], Schwartz
et al. [1971], and Cardoso and Luss [1969].
Previous experimental research was conducted in a flow reactor to determine the axial
position at the end of a mixing nozzle for insertion of a platinum catalyst wire. For this
purpose, a hot-wire anemometer was used to obtain velocity profiles at various radial
positions and at different axial positions. The experimental results indicate that the
platinum catalyst can be inserted in a plug-flow region between 5.625 diameters and
11.625 diameters downstream of the mixing nozzle.
The primary purpose of the present investigation was to study the temperature
distribution along the length of the platinum catalyst experimentally and compare it with
the finite element (FEA) model developed using the software ALGOR. A finite element
sensitivity study was conducted to study the temperature variation with the changes in the
power supply. Research was performed to investigate the changes in wire temperature
with corresponding changes in the catalyst geometry and fluid (propane-air mixture) flow
conditions. Further, the ALGOR studies determined theoretically the minimum external
heating required to achieve catalytic ignition conditions; the analysis will be helpful for
determining the amount of heat power require to be supplied to the electrical system in
order to achieve a desired temperature. This ALGOR data was used for conducting the
microcalorimetry experiments.
Part II. Modeling Catalytic Ignition Conditions of Propane/Air Mixtures over Platinum Wires 21
In conventional design engines, excess fuel is supplied during cold starting. Studies in the
specially designed flow reactor aim at understanding the problems associated with cold
starting without the need to supply excess fuel.
Pressurizable Plug--Flow Reactor
A literature search for flow reactor systems provides information about standard designs
features of reactors for combustion studies. Mitchell, et al. [1992] used the flow reactor
described by Hoffman, et al. to compare the combustion of methanol in the reactor with
the combustion of methanol in a diesel engine [Hoffman, et al., 1991]. Another key point
from the literature involving safety, as discussed by Karim, et al. [1994] is that
experiments conducted in a highly lean environment (equivalence ratio of 0.05) offer less
potential for problems [Karim, et al., 1994]. Karim, Dryer [1972], Hoffman, Koert
[1990], Mao and Barat [1996], and Vermeercsh, et al. [1971] also discuss surface
reactions of catalysts and modeling the reactor system. The literature search provided
specifications for the University of Idaho reactor design, operating parameters and
introduced reactor hardware concepts used for previous research.
Propane)
F
Part II. Mo
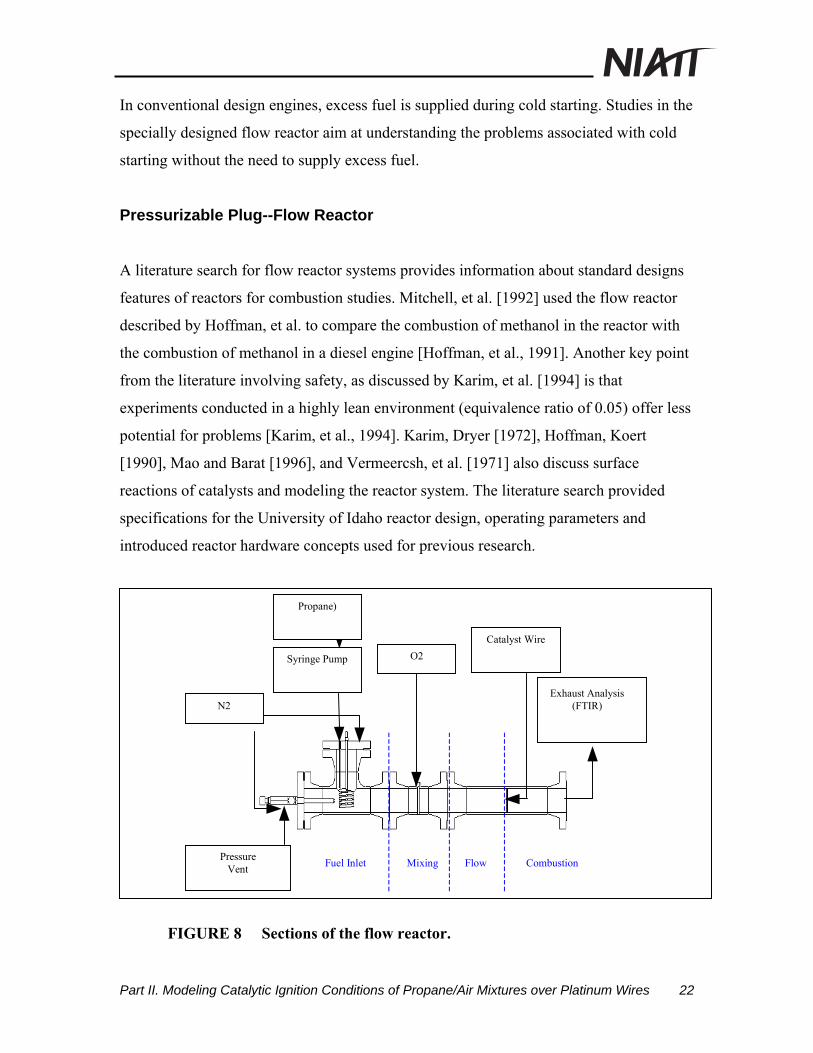
Fuel Inlet Mixing Flow Combustion
Exhaust Analysis(FTIR)
Syringe Pump O2
N2
Pressure Vent
Catalyst Wire
Exhaust Analysis (FTIR)
IGURE 8 Sections of the flow reactor.
deling Catalytic Ignition Conditions of Propane/Air Mixtures over Platinum Wires 22
First, the fuel—propane— is introduced into the fuel inlet section of the catalytic plug
flow reactor. Next, nitrogen carries the fuel from the inlet section to the mixing section,
where the fuel mixes with oxygen. A turbulence grid injection system is used as a mixing
nozzle. The mixing section is designed in such a manner that it minimizes the mixing
times and ensures complete mixing. In the mixing nozzle, the nitrogen-fuel mixture
tapers into a tube and is vented outward through six small holes, similar to a design
developed at Drexel University [Hoffman, et al., 1991]. Oxygen enters the middle ring
where it fills a large cavity and is mixed with N2 via 18 small holes. A sleeve creates the
outside wall of the cavity, forming a plenum, where oxygen enters.
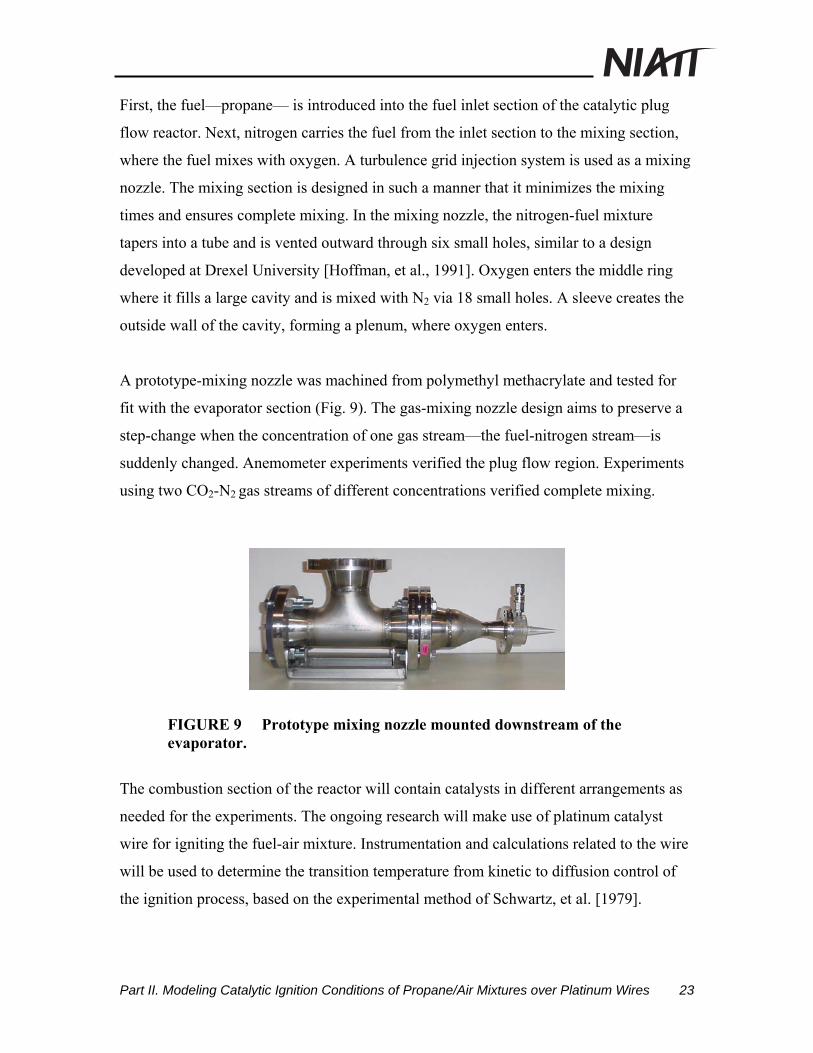
A prototype-mixing nozzle was machined from polymethyl methacrylate and tested for
fit with the evaporator section (Fig. 9). The gas-mixing nozzle design aims to preserve a
step-change when the concentration of one gas stream—the fuel-nitrogen stream—is
suddenly changed. Anemometer experiments verified the plug flow region. Experiments
using two CO2-N2 gas streams of different concentrations verified complete mixing.
FIGURE 9 Prototype mixing nozzle mounted downstream of the evaporator.
The combustion section of the reactor will contain catalysts in different arrangements as
needed for the experiments. The ongoing research will make use of platinum catalyst
wire for igniting the fuel-air mixture. Instrumentation and calculations related to the wire
will be used to determine the transition temperature from kinetic to diffusion control of
the ignition process, based on the experimental method of Schwartz, et al. [1979].
Part II. Modeling Catalytic Ignition Conditions of Propane/Air Mixtures over Platinum Wires 23
Experimental Determination of Surface Reaction Temperature
The electrical resistance of platinum varies as
R = Ro [1 + α (T --To) ],
where R is the electrical resistance at temperature T, Ro is the electrical resistance at
temperature To, and α is the coefficient of resistance for Pt, a property of the metal.
With the Pt wire connected to a variable power supply and with voltage monitored
separately, power to the wire was slowly increased as a propane-air mixture was passed
over it. When surface reactions began, the temperature of the wire increased abruptly as
indicated by a sudden change in voltage. The corresponding change in resistance was
calculated and the average wire temperature found from the equation above. The average
temperature obtained at the power level where surface reactions began was used for
comparison with the flow finite element (FEA) model results.
Two-Dimensional Propane-Air Mixture Mixed Mode Heat Transfer Model
A two-dimensional FEA model was generated to study the effects of conduction and
convection on the wire temperature. Initially, a lower mesh density, four-by-four nodes,
was selected, and gradually increased until the temperature remained constant. Table 4
shows the mesh sensitivity analysis.
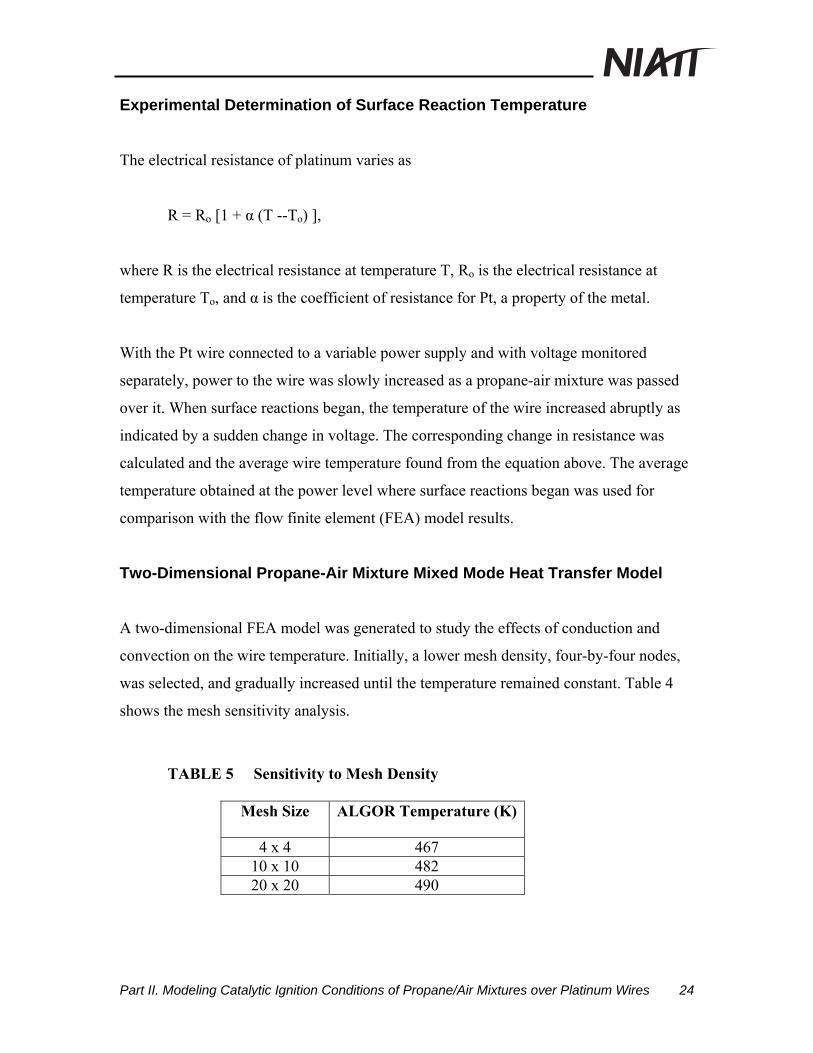
TABLE 5 Sensitivity to Mesh Density
Mesh Size ALGOR Temperature (K)
4 x 4 467 10 x 10 482 20 x 20 490
Part II. Modeling Catalytic Ignition Conditions of Propane/Air Mixtures over Platinum Wires 24
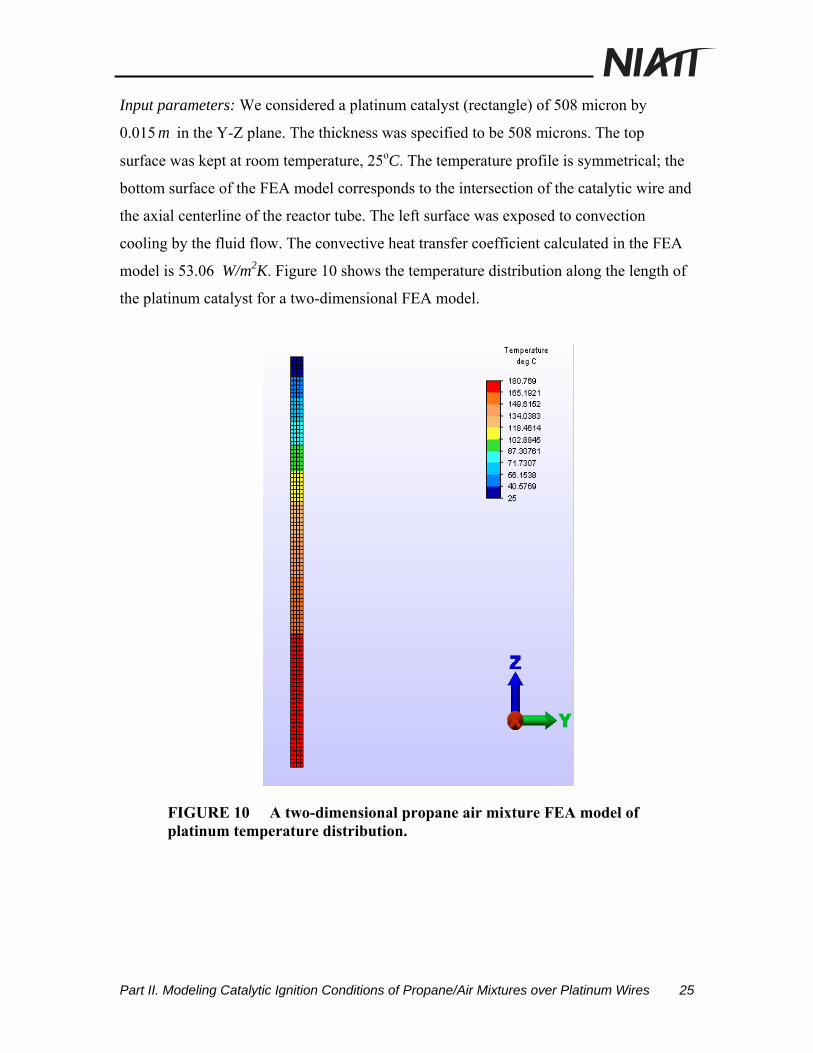
Input parameters: We considered a platinum catalyst (rectangle) of 508 micron by
0.015 m in the Y-Z plane. The thickness was specified to be 508 microns. The top
surface was kept at room temperature, 25oC. The temperature profile is symmetrical; the
bottom surface of the FEA model corresponds to the intersection of the catalytic wire and
the axial centerline of the reactor tube. The left surface was exposed to convection
cooling by the fluid flow. The convective heat transfer coefficient calculated in the FEA
model is 53.06 W/m2K. Figure 10 shows the temperature distribution along the length of
the platinum catalyst for a two-dimensional FEA model.
FIGURE 10 A two-dimensional propane air mixture FEA model of platinum temperature distribution.
Part II. Modeling Catalytic Ignition Conditions of Propane/Air Mixtures over Platinum Wires 25
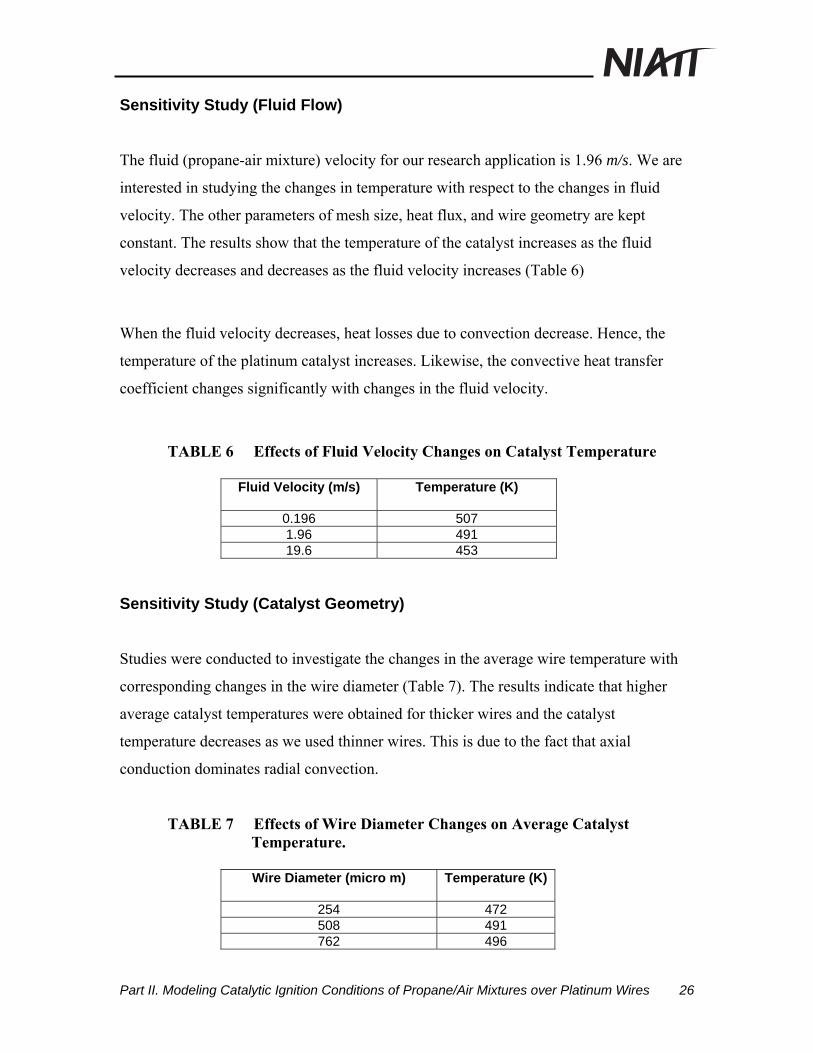
Sensitivity Study (Fluid Flow)
The fluid (propane-air mixture) velocity for our research application is 1.96 m/s. We are
interested in studying the changes in temperature with respect to the changes in fluid
velocity. The other parameters of mesh size, heat flux, and wire geometry are kept
constant. The results show that the temperature of the catalyst increases as the fluid
velocity decreases and decreases as the fluid velocity increases (Table 6)
When the fluid velocity decreases, heat losses due to convection decrease. Hence, the
temperature of the platinum catalyst increases. Likewise, the convective heat transfer
coefficient changes significantly with changes in the fluid velocity.
TABLE 6 Effects of Fluid Velocity Changes on Catalyst Temperature
Fluid Velocity (m/s) Temperature (K)
0.196 507 1.96 491 19.6 453
Sensitivity Study (Catalyst Geometry)
Studies were conducted to investigate the changes in the average wire temperature with
corresponding changes in the wire diameter (Table 7). The results indicate that higher
average catalyst temperatures were obtained for thicker wires and the catalyst
temperature decreases as we used thinner wires. This is due to the fact that axial
conduction dominates radial convection.
TABLE 7 Effects of Wire Diameter Changes on Average Catalyst Temperature.
Wire Diameter (micro m) Temperature (K)
254 472 508 491 762 496
Part II. Modeling Catalytic Ignition Conditions of Propane/Air Mixtures over Platinum Wires 26
Although this case study gives the expected results, one parameter, the heat transfer
coefficient, still puzzles us. The heat transfer coefficient remained the same for the three
wire diameters. According to convective heat transfer correlations for cross flow over
heated rods, we expect the heat transfer coefficient to change as wire diameter changes.
Further calculations were conducted by changing the wire diameter by a factor of 10, but
the same value of the heat transfer coefficient was obtained.
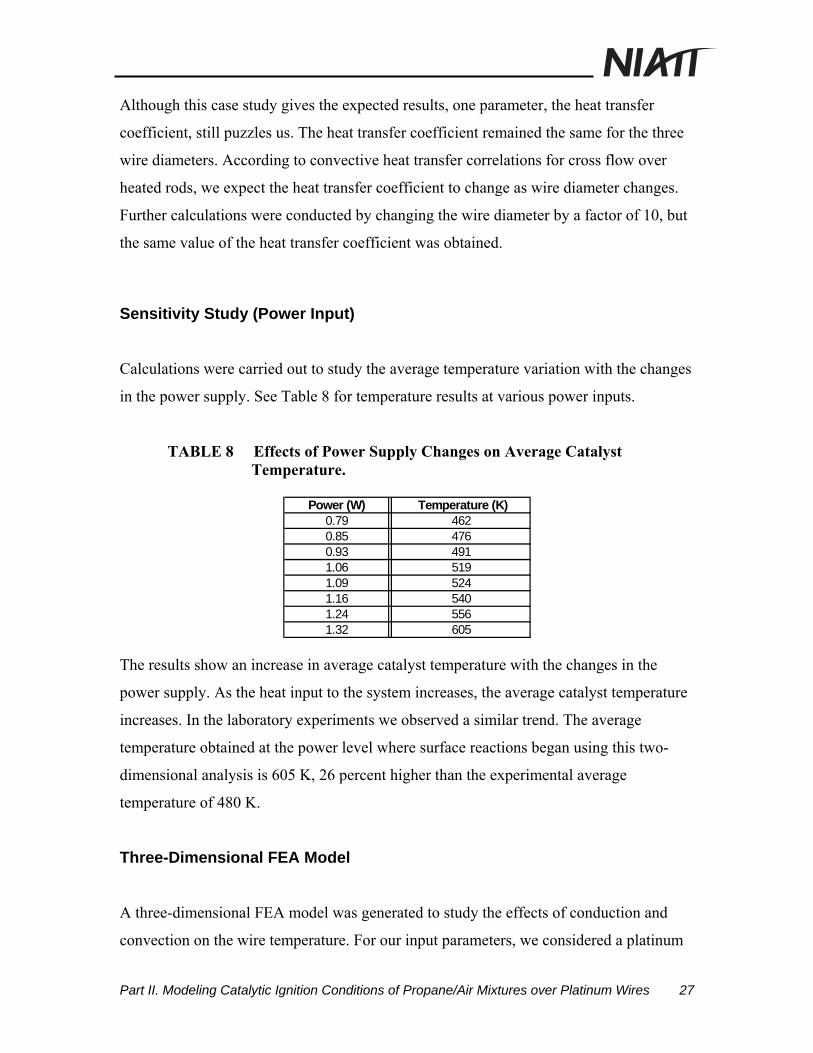
Sensitivity Study (Power Input)
Calculations were carried out to study the average temperature variation with the changes
in the power supply. See Table 8 for temperature results at various power inputs.
TABLE 8 Effects of Power Supply Changes on Average Catalyst Temperature.
Power (W) r Temperature (K)
0.79 4620.85 4760.93 4911.06 5191.09 5241.16 5401.24 5561.32 605
The results show an increase in average catalyst temperature with the changes in the
power supply. As the heat input to the system increases, the average catalyst temperature
increases. In the laboratory experiments we observed a similar trend. The average
temperature obtained at the power level where surface reactions began using this two-
dimensional analysis is 605 K, 26 percent higher than the experimental average
temperature of 480 K.
Three-Dimensional FEA Model
A three-dimensional FEA model was generated to study the effects of conduction and
convection on the wire temperature. For our input parameters, we considered a platinum
Part II. Modeling Catalytic Ignition Conditions of Propane/Air Mixtures over Platinum Wires 27
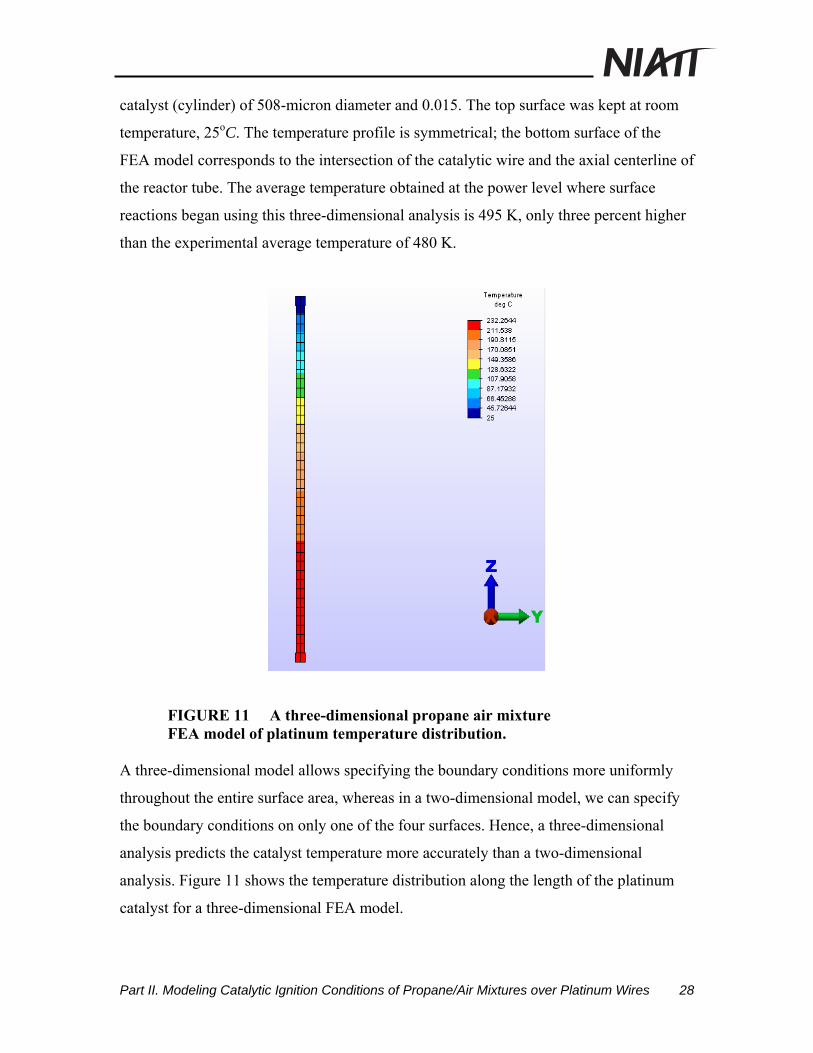
catalyst (cylinder) of 508-micron diameter and 0.015. The top surface was kept at room
temperature, 25oC. The temperature profile is symmetrical; the bottom surface of the
FEA model corresponds to the intersection of the catalytic wire and the axial centerline of
the reactor tube. The average temperature obtained at the power level where surface
reactions began using this three-dimensional analysis is 495 K, only three percent higher
than the experimental average temperature of 480 K.
FIGURE 11 A three-dimensional propane air mixture FEA model of platinum temperature distribution.
A three-dimensional model allows specifying the boundary conditions more uniformly
throughout the entire surface area, whereas in a two-dimensional model, we can specify
the boundary conditions on only one of the four surfaces. Hence, a three-dimensional
analysis predicts the catalyst temperature more accurately than a two-dimensional
analysis. Figure 11 shows the temperature distribution along the length of the platinum
catalyst for a three-dimensional FEA model.
Part II. Modeling Catalytic Ignition Conditions of Propane/Air Mixtures over Platinum Wires 28
I.D FINDINGS; CONCLUSIONS; RECOMMENDATIONS Comparisons of Two-Dimensional and Three-Dimensional Results with the Experimental Results
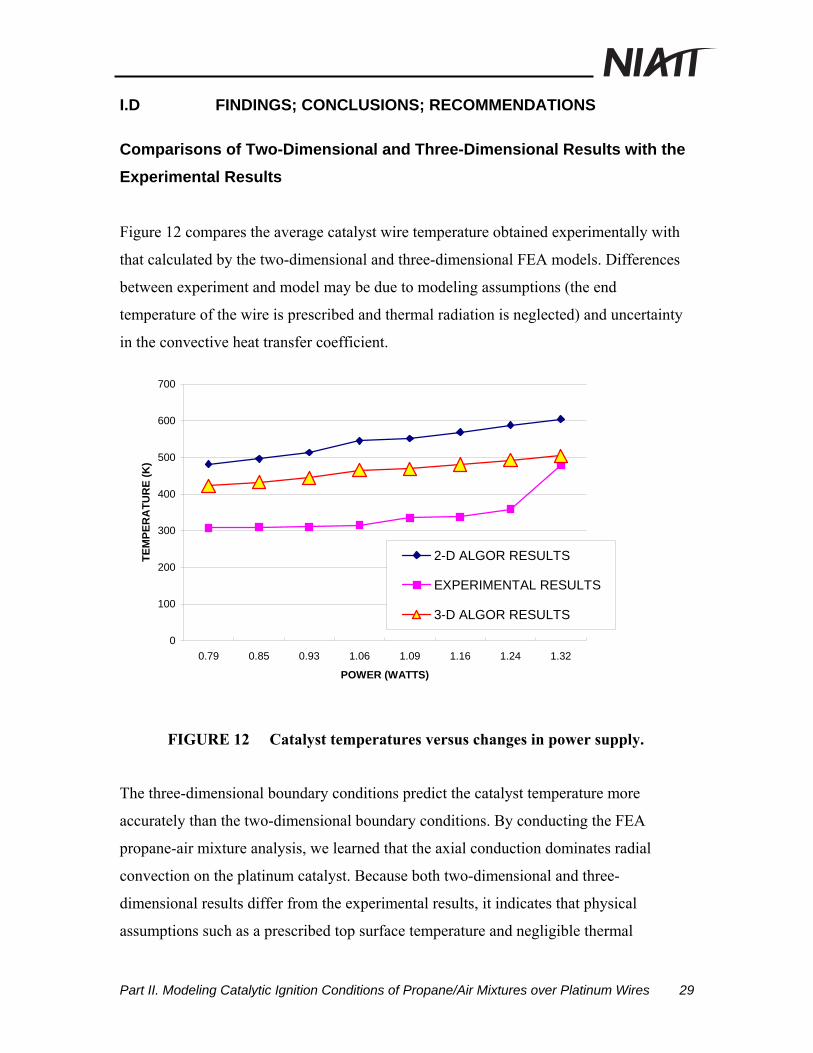
Figure 12 compares the average catalyst wire temperature obtained experimentally with
that calculated by the two-dimensional and three-dimensional FEA models. Differences
between experiment and model may be due to modeling assumptions (the end
temperature of the wire is prescribed and thermal radiation is neglected) and uncertainty
in the convective heat transfer coefficient.
0
100
200
300
400
500
600
700
0.79 0.85 0.93 1.06 1.09 1.16 1.24 1.32
POWER (WATTS)
TEM
PER
ATU
RE
(K)
2-D ALGOR RESULTS
EXPERIMENTAL RESULTS
3-D ALGOR RESULTS
FIGURE 12 Catalyst temperatures versus changes in power supply.
The three-dimensional boundary conditions predict the catalyst temperature more
accurately than the two-dimensional boundary conditions. By conducting the FEA
propane-air mixture analysis, we learned that the axial conduction dominates radial
convection on the platinum catalyst. Because both two-dimensional and three-
dimensional results differ from the experimental results, it indicates that physical
assumptions such as a prescribed top surface temperature and negligible thermal
Part II. Modeling Catalytic Ignition Conditions of Propane/Air Mixtures over Platinum Wires 29
radiation, and uncertainties in the convective heat transfer coefficient are critical for
matching experimental conditions.
Ongoing Research
The next step in the research is to include radiation losses in the three-dimensional model
that we have already generated, perform parametric studies for model sensitivity to a
prescribed end temperature and convective heat transfer coefficient, and compare with
the experimental results. Further efforts will be made to conduct transient heat transfer
analysis for this model using ALGOR. The basic aim will be to find a correlation
between the experimental wire temperatures achieved and FEA wire temperatures
calculated for the same power supply. The FEA propane air mixture analysis will be
helpful to determine the amount of power required to be supplied to the electrical system
in order to achieve a desired temperature. Further, the results of the FEA sensitivity
analysis will provide an insight into accommodating system modifications including
changing catalyst geometry, power supply and wall heating.
A platinum catalyst will be inserted into plug flow region, between 5.625 diameters and
11.625 diameters, identified by hot-wire analysis.
Future work will also include testing with other fuels including aqueous ethanol-air
mixtures. Data will be collected in order to determine the temperature of the platinum
catalyst required for ignition of a particular volumetric content of water in ethanol at a
specified equivalence ratio. Further investigation will be carried out in order to
understand the changes in ignition temperature for different volumetric concentrations of
aqueous ethanol at a constant excess air coefficient. This research aims at determining the
threshold point at which the ignition of aqueous ethanol fuel-air mixtures occur.
Acknowledgments In addition to a University Transportation Center grant from the US Department of
Transportation through NIATT, this research is sponsored by a DOD-EPSCOR grant.
Part II. Modeling Catalytic Ignition Conditions of Propane/Air Mixtures over Platinum Wires 30
PART III. THEORETICAL STUDY OF AQUEOUS ETHANOL-AIR COMBUSTION IN PLUG FLOW
III.A INTRODUCTION
The thermal decomposition and combustion kinetics of gas-phase ethanol oxidation were
modeled with a computer code. The output was compared with flow reactor data available
in the literature. Additional calculations were performed with different percentages of
water added to the fuel. Temperature, the consumption of ethanol, and the mole percent of
the major products carbon dioxide, water and excess oxygen (CO2, H2O and O2) and
intermediate species carbon monoxide, methane, acetylene, ethene, ethane, hydrogen, and
acetaldehyde (CO, CH4, C2H2, C2H4, C2H6, H2 and CH3CHO) were plotted as a function of
time. Reasonable agreement was found between the model and data for 100 percent ethanol
oxidation. Model results showed that combustion temperature dropped as water content
increased. Because dilution masked the impact of water on decomposition and combustion
kinetics, an analysis is underway to “dry” model results. The computer code is being
modified to include the kinetics of catalytic surface reactions.
Part III: Theoretical Study of Aqueous Ethanol-Air Combustion in Plug Flow 31
III.B DESCRIPTION OF PROBLEM
A detailed chemical kinetic mechanism developed for homogeneous ethanol oxidation was
examined using the HCT (Hydrodynamics, Combustion, and Transport) code developed at
Lawrence Livermore National Laboratory. The output was compared with combustion data
from a flow reactor available in the literature. Additional calculations were performed with
different percentages of water added to the fuel. Results show that combustion temperature
dropped as water content increased, with corresponding decreases in the rate of production
of stable intermediary species. The consumption of ethanol and the mole percent of major
products CO2, H2O and O2 and intermediate species CO, CH4, C2H2, C2H4, C2H6, H2 and
CH3CHO are plotted as a function of residence time. These calculations are a first step in
developing an understanding of cold starting and emissions from ethanol-water combustion
in air after catalytic ignition over platinum.
Part III: Theoretical Study of Aqueous Ethanol-Air Combustion in Plug Flow 32
III.C APPROACH AND METHODOLOGY
A catalytic igniter [Cherry, et al., 1990; Cherry, 1992; Cherry, et al., 1992] permits stable
combustion at fuel lean conditions in internal combustion engines [Morton, 2000]. The
igniter also supports combustion of high water content fuel, for example 70 percent
ethanol/30 percent water blends, and permits the combustion of heavy fuels in light
engines.
Water in fuel offers several advantages in lowering harmful combustion emissions. High
water content lowers combustion temperature, thus impeding the formation of thermal NO.
Due to the thermodynamics of CO oxidation, water also encourages the oxidation of CO to
CO2. Soot formation also appears to be inhibited in the presence of water [Hall-Roberts, et
al., 2000]. However, increased acetaldehyde emissions may be a problem during cold
starting since this species is a stable intermediary of the dominant path for gas-phase
ethanol combustion [Marinov, 1998; Egolfopoulos, et al., 1992; Norton and Dryer, 1992].
Our approach to assist in the development of the igniter takes three parallel paths:
a) Understanding the chemistry of catalytic ignition through detailed modeling and
plug-flow reactor studies
b) Working with stand-alone engines to improve igniter durability and
manufacturability, and modeling key characteristics for predicting future designs;
c) Creating demonstration vehicles for over-the-road testing and public outreach.
The work presented here describes our progress in modeling the impact of water on gas-
phase ethanol combustion. These calculations are a first step in developing an
understanding of ethanol water combustion after catalytic ignition over platinum. From
detailed modeling, a simplified model will be derived that improves a catalytic ignition-
timing model being developed to assist igniter designs for new engine applications.
Part III: Theoretical Study of Aqueous Ethanol-Air Combustion in Plug Flow 33
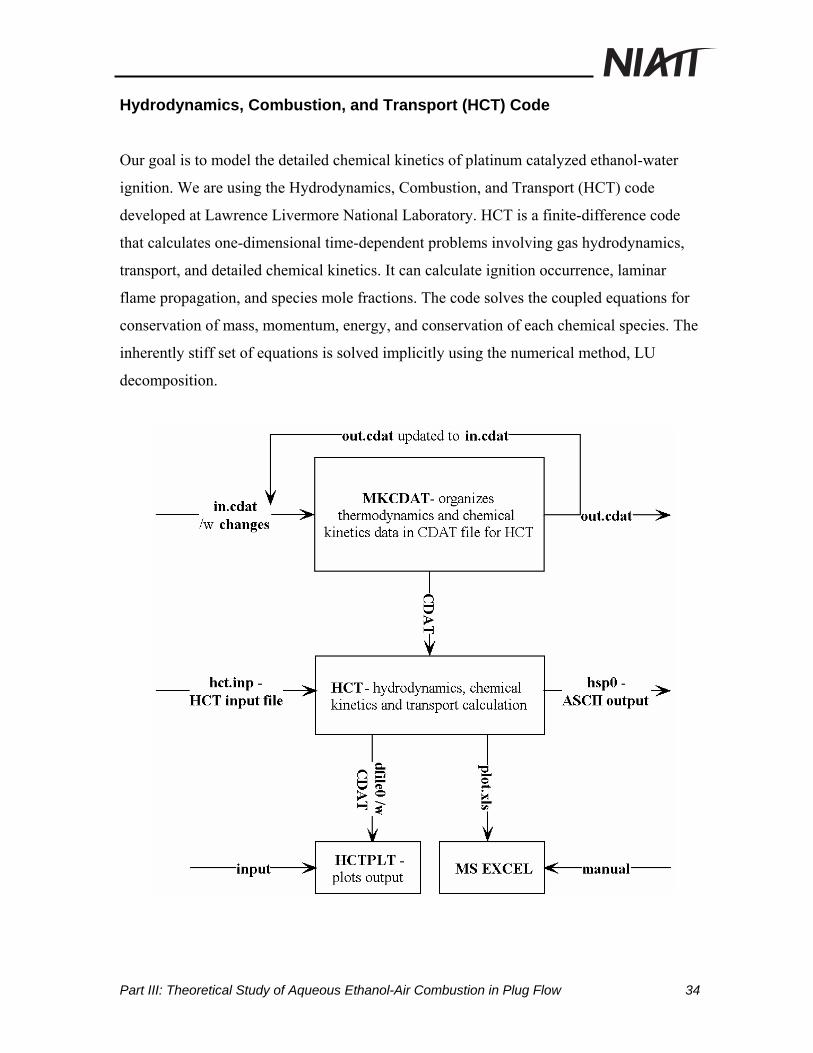
Hydrodynamics, Combustion, and Transport (HCT) Code
Our goal is to model the detailed chemical kinetics of platinum catalyzed ethanol-water
ignition. We are using the Hydrodynamics, Combustion, and Transport (HCT) code
developed at Lawrence Livermore National Laboratory. HCT is a finite-difference code
that calculates one-dimensional time-dependent problems involving gas hydrodynamics,
transport, and detailed chemical kinetics. It can calculate ignition occurrence, laminar
flame propagation, and species mole fractions. The code solves the coupled equations for
conservation of mass, momentum, energy, and conservation of each chemical species. The
inherently stiff set of equations is solved implicitly using the numerical method, LU
decomposition.
Part III: Theoretical Study of Aqueous Ethanol-Air Combustion in Plug Flow 34
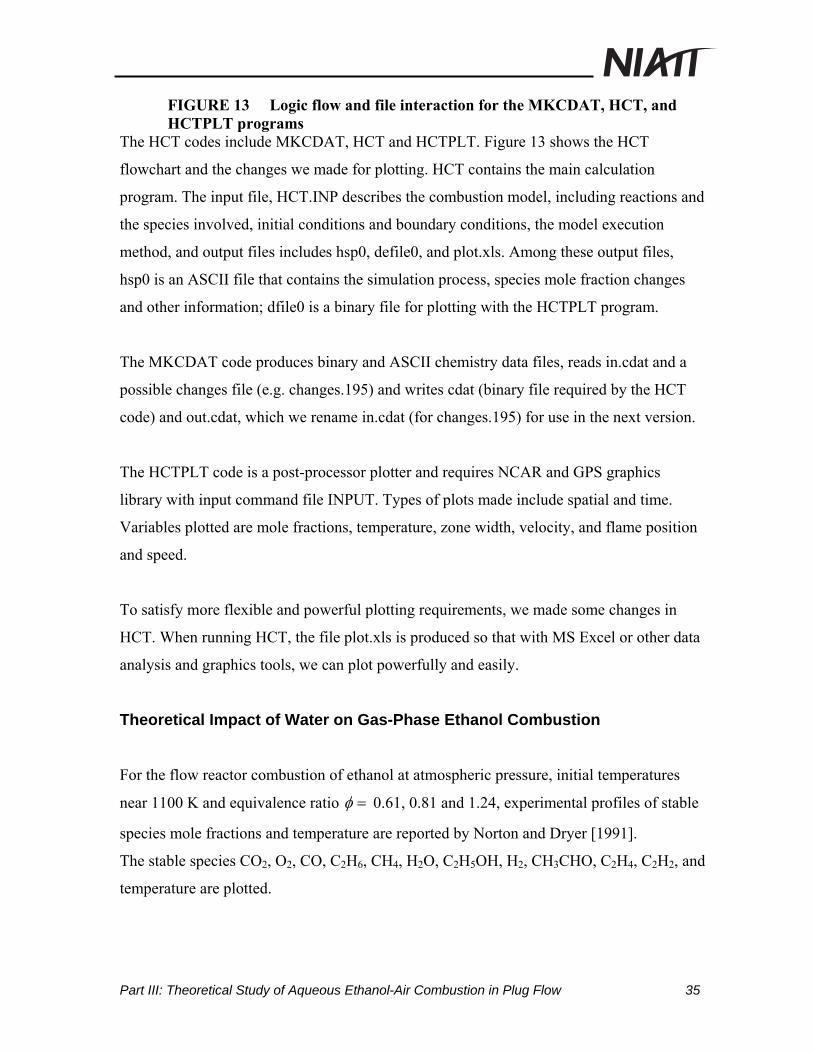
FIGURE 13 Logic flow and file interaction for the MKCDAT, HCT, and HCTPLT programs
The HCT codes include MKCDAT, HCT and HCTPLT. Figure 13 shows the HCT
flowchart and the changes we made for plotting. HCT contains the main calculation
program. The input file, HCT.INP describes the combustion model, including reactions and
the species involved, initial conditions and boundary conditions, the model execution
method, and output files includes hsp0, defile0, and plot.xls. Among these output files,
hsp0 is an ASCII file that contains the simulation process, species mole fraction changes
and other information; dfile0 is a binary file for plotting with the HCTPLT program.
The MKCDAT code produces binary and ASCII chemistry data files, reads in.cdat and a
possible changes file (e.g. changes.195) and writes cdat (binary file required by the HCT
code) and out.cdat, which we rename in.cdat (for changes.195) for use in the next version.
The HCTPLT code is a post-processor plotter and requires NCAR and GPS graphics
library with input command file INPUT. Types of plots made include spatial and time.
Variables plotted are mole fractions, temperature, zone width, velocity, and flame position
and speed.
To satisfy more flexible and powerful plotting requirements, we made some changes in
HCT. When running HCT, the file plot.xls is produced so that with MS Excel or other data
analysis and graphics tools, we can plot powerfully and easily.
Theoretical Impact of Water on Gas-Phase Ethanol Combustion
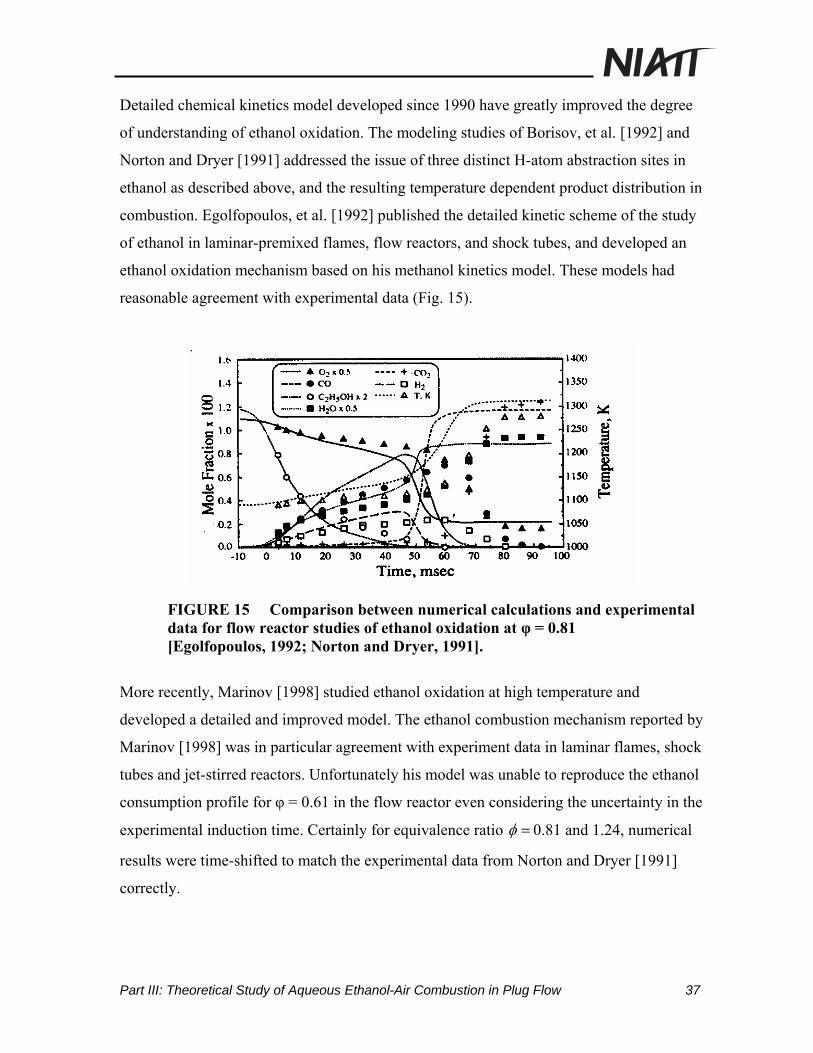
For the flow reactor combustion of ethanol at atmospheric pressure, initial temperatures
near 1100 K and equivalence ratio φ = 0.61, 0.81 and 1.24, experimental profiles of stable
species mole fractions and temperature are reported by Norton and Dryer [1991].
The stable species CO2, O2, CO, C2H6, CH4, H2O, C2H5OH, H2, CH3CHO, C2H4, C2H2, and
temperature are plotted.
Part III: Theoretical Study of Aqueous Ethanol-Air Combustion in Plug Flow 35
CH3CH2OCH2CH2OH CH3CHOH
C2H5OH
CH2OC2H4 CH3CHO
HO2
C2H3
CH3COHCO
CH3
CH2O
C2H6 CH2O CH3OCH4 CH3OH
FIGURE 14 Species consumption path analysis for ethanol oxidation [Egolfopoulos, 1992; Norton and Dryer, 1991].
The species decomposition paths for ethanol/air oxidation are shown in Fig. 14. We
developed these paths by integrating all reactions in the oxidation process and determining
the fraction of each species consumed by a particular reaction. C2H5OH is mainly attacked
by H, OH, O, CH3, C2H5 and HO2, which abstract H atom and produce three C2H5O
isomers CH3CHOH, CH2CH2OH and CH3CH2O:
C2H5OH + X -> {CH2CH2OH, CH3CHOH, CH3CH2O} +
XH {X = OH, H, CH3, HO2, C2H5} R1
The ethanol mechanism calculates the three distinct sites of hydrogen abstraction from the
ethanol molecule; subsequently the mechanism considers the reactions involving these
three isomers. CH3CHOH reacts with O, O2 and OH to produce acetaldehyde (CH3CHO).
CH2CH2OH decomposes to C2H4, which is the main step to produce ethane. CH3CH2O
thermally decomposes to CH3 with simultaneous product CH2O. The major products of
these three isomers reaction series and their subsequent reactions are expected to be
important in the mechanism.
Part III: Theoretical Study of Aqueous Ethanol-Air Combustion in Plug Flow 36
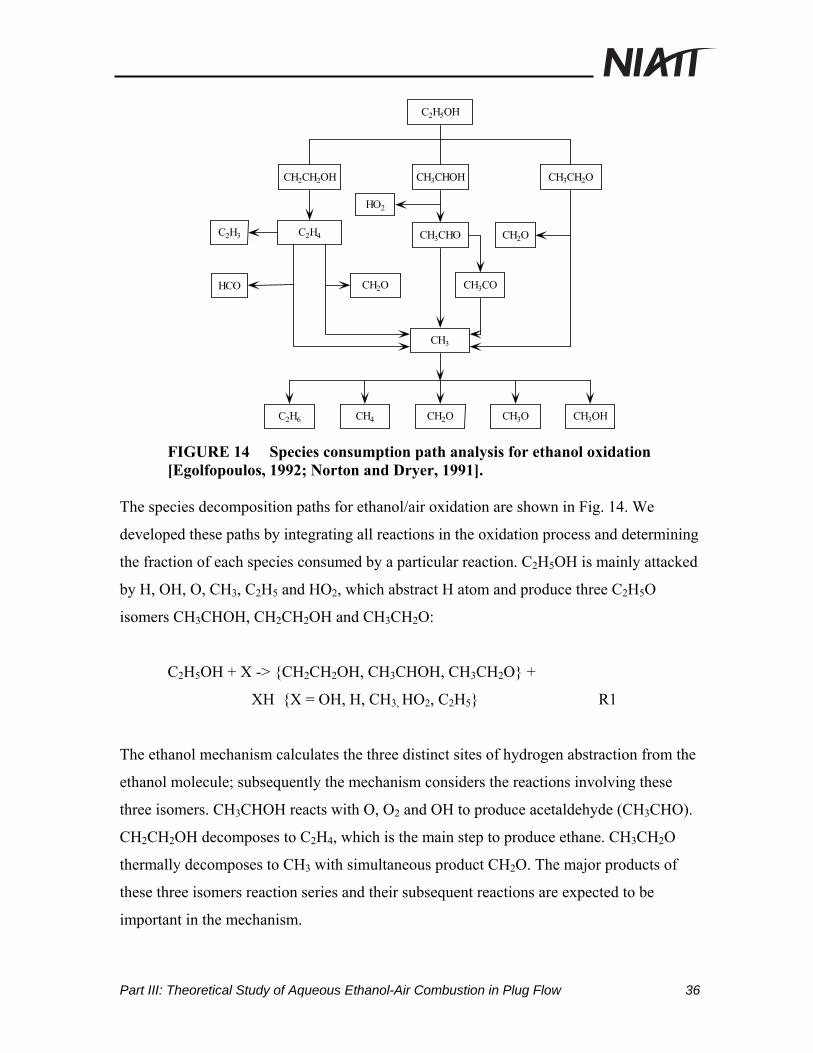
Detailed chemical kinetics model developed since 1990 have greatly improved the degree
of understanding of ethanol oxidation. The modeling studies of Borisov, et al. [1992] and
Norton and Dryer [1991] addressed the issue of three distinct H-atom abstraction sites in
ethanol as described above, and the resulting temperature dependent product distribution in
combustion. Egolfopoulos, et al. [1992] published the detailed kinetic scheme of the study
of ethanol in laminar-premixed flames, flow reactors, and shock tubes, and developed an
ethanol oxidation mechanism based on his methanol kinetics model. These models had
reasonable agreement with experimental data (Fig. 15).
FIGURE 15 Comparison between numerical calculations and experimental data for flow reactor studies of ethanol oxidation at φ = 0.81 [Egolfopoulos, 1992; Norton and Dryer, 1991].
More recently, Marinov [1998] studied ethanol oxidation at high temperature and
developed a detailed and improved model. The ethanol combustion mechanism reported by
Marinov [1998] was in particular agreement with experiment data in laminar flames, shock
tubes and jet-stirred reactors. Unfortunately his model was unable to reproduce the ethanol
consumption profile for φ = 0.61 in the flow reactor even considering the uncertainty in the
experimental induction time. Certainly for equivalence ratio φ = 0.81 and 1.24, numerical
results were time-shifted to match the experimental data from Norton and Dryer [1991]
correctly.
Part III: Theoretical Study of Aqueous Ethanol-Air Combustion in Plug Flow 37
Curran and Pitz [1997] modeled dimethyl ether CH3OCH3 (DME) combustion. This DME
kinetics model was rigorously tested through comparisons with experimental data. At high
temperature, the fuel consumption pathway for DME is similar to some degree to ethanol in
this model, since some dimethyl ether changes to ethanol at first, then ethanol reacts along
the reaction channels described by Norton and Dryer [1991], Egolfopoulos [1992],
Brorisov [1992], and Marinov [1998] (Fig. 13), while remaining DME reacts along its
decomposition channels. Hence, to some extent, this DME model can simulate ethanol
oxidation mechanism. However, the DME model is particularly developed for DME; using
it to predict ethanol oxidation requires additional effort. We modified the DME model with
more detailed ethanol decomposition reactions developed by Marinov [1998] and formed a
modified DME model. This model was used to simulate ethanol-water oxidation. The
results presented here show reasonably good agreement in comparison with plug-flow data
reported by Norton and Dryer [1991].
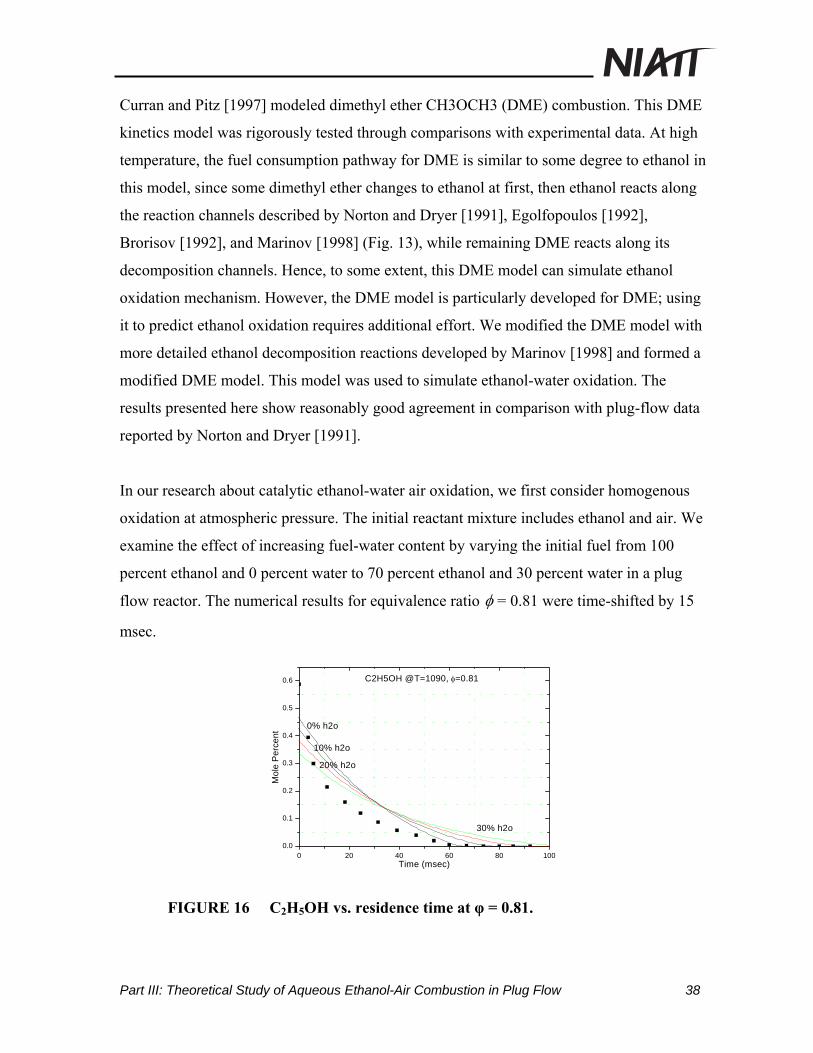
In our research about catalytic ethanol-water air oxidation, we first consider homogenous
oxidation at atmospheric pressure. The initial reactant mixture includes ethanol and air. We
examine the effect of increasing fuel-water content by varying the initial fuel from 100
percent ethanol and 0 percent water to 70 percent ethanol and 30 percent water in a plug
flow reactor. The numerical results for equivalence ratio φ = 0.81 were time-shifted by 15
msec.
0 20 40 60 80 1000.0
0.1
0.2
0.3
0.4
0.5
0.6
30% h2o
20% h2o
10% h2o
0% h2o
C2H5OH @T=1090, φ=0.81
Mol
e P
erce
nt
Time (msec)
FIGURE 16 C2H5OH vs. residence time at φ = 0.81.
Part III: Theoretical Study of Aqueous Ethanol-Air Combustion in Plug Flow 38
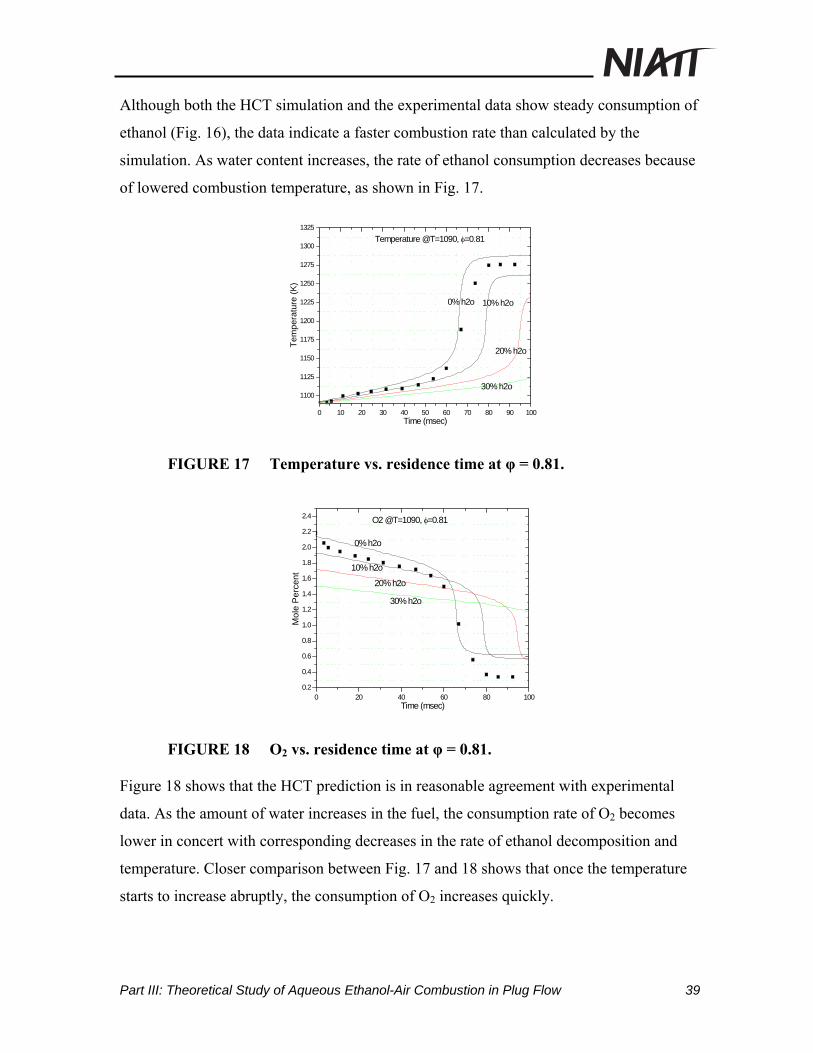
Although both the HCT simulation and the experimental data show steady consumption of
ethanol (Fig. 16), the data indicate a faster combustion rate than calculated by the
simulation. As water content increases, the rate of ethanol consumption decreases because
of lowered combustion temperature, as shown in Fig. 17.
0 10 20 30 40 50 60 70 80 90 100
1100
1125
1150
1175
1200
1225
1250
1275
1300
1325
30% h2o
20% h2o
10% h2o0% h2o
Temperature @T=1090, φ=0.81
Tem
pera
ture
(K)
Time (msec)
FIGURE 17 Temperature vs. residence time at φ = 0.81.
0 20 40 60 80 1000.2
0.4
0.6
0.8
1.0
1.2
1.4
1.6
1.8
2.0
2.2
2.4
30% h2o
20% h2o
10% h2o
0% h2o
O2 @T=1090, φ=0.81
Mol
e P
erce
nt
Time (msec)
FIGURE 18 O2 vs. residence time at φ = 0.81.
Figure 18 shows that the HCT prediction is in reasonable agreement with experimental
data. As the amount of water increases in the fuel, the consumption rate of O2 becomes
lower in concert with corresponding decreases in the rate of ethanol decomposition and
temperature. Closer comparison between Fig. 17 and 18 shows that once the temperature
starts to increase abruptly, the consumption of O2 increases quickly.
Part III: Theoretical Study of Aqueous Ethanol-Air Combustion in Plug Flow 39
0 20 40 60 80 1000.0
0.1
0.2
0.3
0.4
0.5
0.6
0.7
0.8
0.9
30% h2o
20% h2o
10% h2o
0% h2o
CO @T=1090, φ=0.81
Mol
e P
erce
nt
Time (msec)
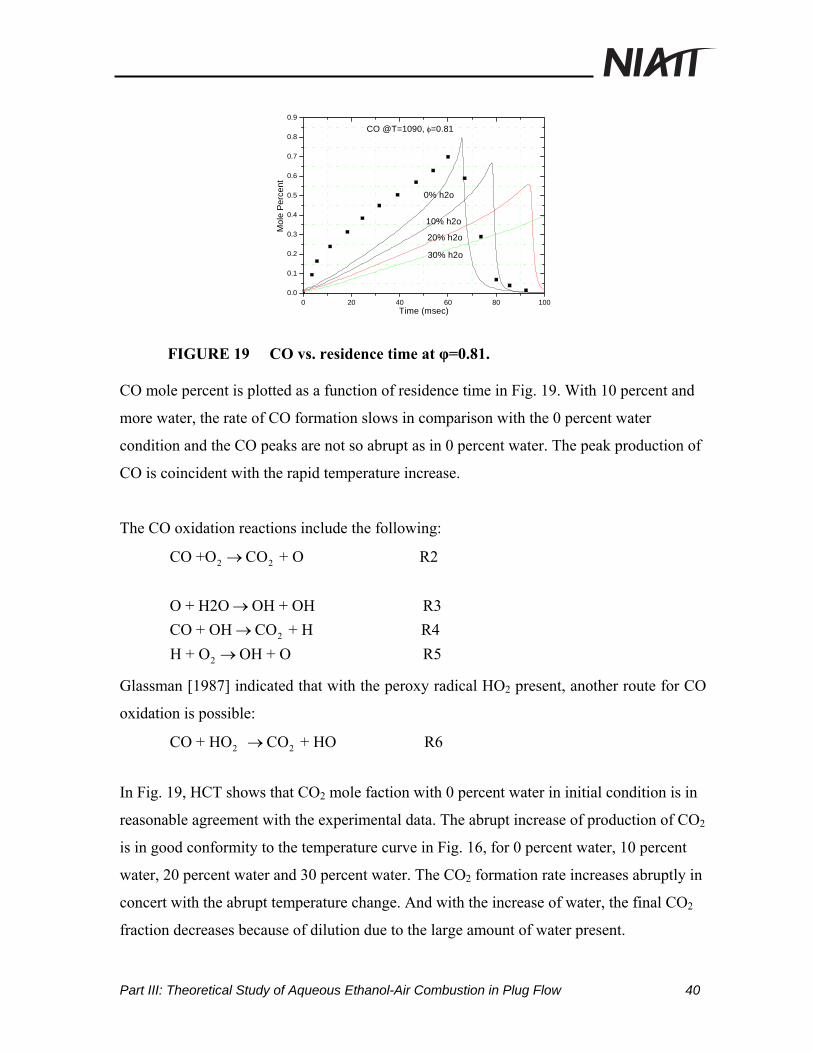
FIGURE 19 CO vs. residence time at φ=0.81.
CO mole percent is plotted as a function of residence time in Fig. 19. With 10 percent and
more water, the rate of CO formation slows in comparison with the 0 percent water
condition and the CO peaks are not so abrupt as in 0 percent water. The peak production of
CO is coincident with the rapid temperature increase.
The CO oxidation reactions include the following:
2 2CO +O CO + O R2→
2
2
O + H2O OH + OH R3CO + OH CO + H R4H + O OH + O R5
→→
→
Glassman [1987] indicated that with the peroxy radical HO2 present, another route for CO
oxidation is possible:
2 2CO + HO CO + HO R6→
In Fig. 19, HCT shows that CO2 mole faction with 0 percent water in initial condition is in
reasonable agreement with the experimental data. The abrupt increase of production of CO2
is in good conformity to the temperature curve in Fig. 16, for 0 percent water, 10 percent
water, 20 percent water and 30 percent water. The CO2 formation rate increases abruptly in
concert with the abrupt temperature change. And with the increase of water, the final CO2
fraction decreases because of dilution due to the large amount of water present.
Part III: Theoretical Study of Aqueous Ethanol-Air Combustion in Plug Flow 40
0 20 40 60 80 1000.0
0.2
0.4
0.6
0.8
1.0
1.2
1.4
30% h2o
20% h2o10% h2o
0% h2o
CO2 @T=1090, φ=0.81
Mol
e P
erce
nt
Time (msec)
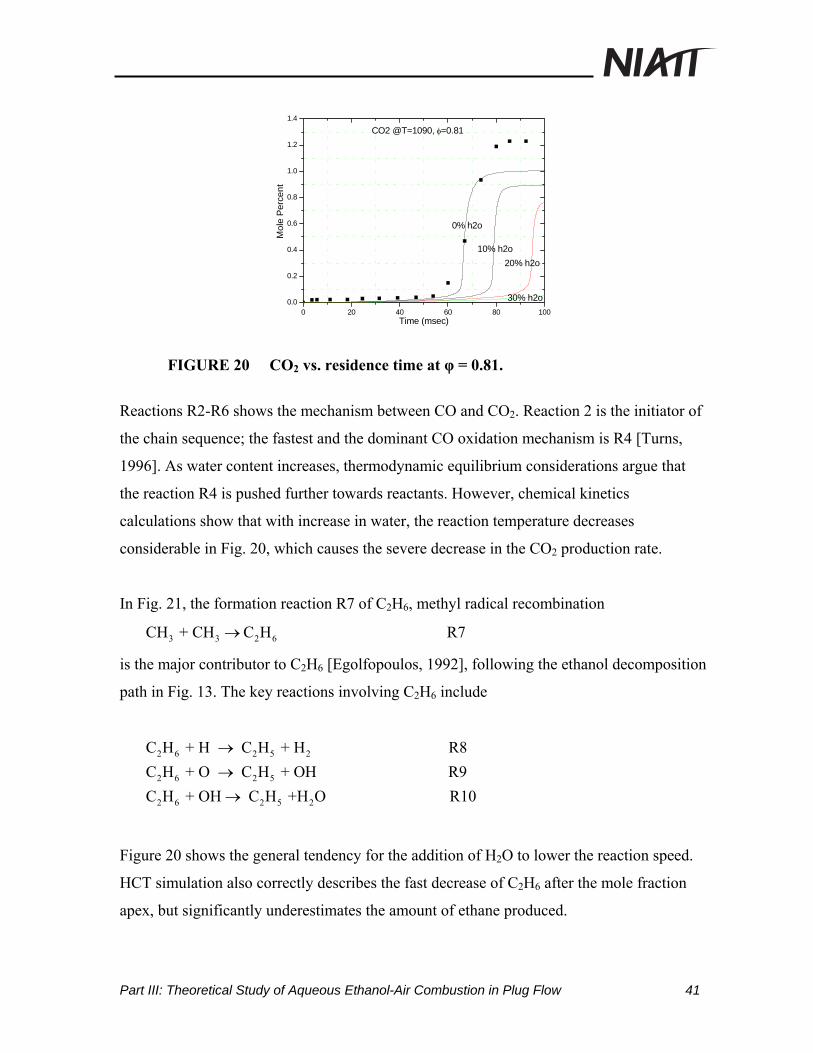
FIGURE 20 CO2 vs. residence time at φ = 0.81.
Reactions R2-R6 shows the mechanism between CO and CO2. Reaction 2 is the initiator of
the chain sequence; the fastest and the dominant CO oxidation mechanism is R4 [Turns,
1996]. As water content increases, thermodynamic equilibrium considerations argue that
the reaction R4 is pushed further towards reactants. However, chemical kinetics
calculations show that with increase in water, the reaction temperature decreases
considerable in Fig. 20, which causes the severe decrease in the CO2 production rate.
In Fig. 21, the formation reaction R7 of C2H6, methyl radical recombination
3 3 2 6CH + CH C H R7→
is the major contributor to C2H6 [Egolfopoulos, 1992], following the ethanol decomposition
path in Fig. 13. The key reactions involving C2H6 include
2 6 2 5 2
2 6 2 5
2 6 2 5 2
C H + H C H + H R8C H + O C H + OH R9C H + OH C H +H O R10
→→→
Figure 20 shows the general tendency for the addition of H2O to lower the reaction speed.
HCT simulation also correctly describes the fast decrease of C2H6 after the mole fraction
apex, but significantly underestimates the amount of ethane produced.
Part III: Theoretical Study of Aqueous Ethanol-Air Combustion in Plug Flow 41
0 20 40 60 80 1000
20
40
60
80
100
120
140
160
180
200
220
240
30% h2o20% h2o
10% h2o
0% h2o
C2H6 @T=1090, φ=0.81
Mol
e P
PM
Time (msec)
FIGURE 21 C2H6 vs. residence time at φ = 0.81.
0 20 40 60 80 1000
200
400
600
800
1000
1200
1400
30% h2o20% h2o
10% h2o
0% h2o
C2H4 @T=1090, φ=0.81
Mol
e P
PM
Time (msec)
FIGURE 22 C2H4 vs. residence time at φ = 0.81.
The main reactions involved in C2H4 and C2H2 include
2 4 2 2 2
2 4 2 3
2 4 2 4 2 3 2 5
C H + M C H + H + M R11C H + M C H + H + M R12
C H + C H C H +C H R13
→→
→
and
2 3 2 2 2
2 3 2
2 3 2 2 2 2
2 3 2
C H + H C H + H R14 C H + O H CO + H R15C H + O C H + HO R16C H + M C H
C→→→→ 2 + H + M R17
Part III: Theoretical Study of Aqueous Ethanol-Air Combustion in Plug Flow 42
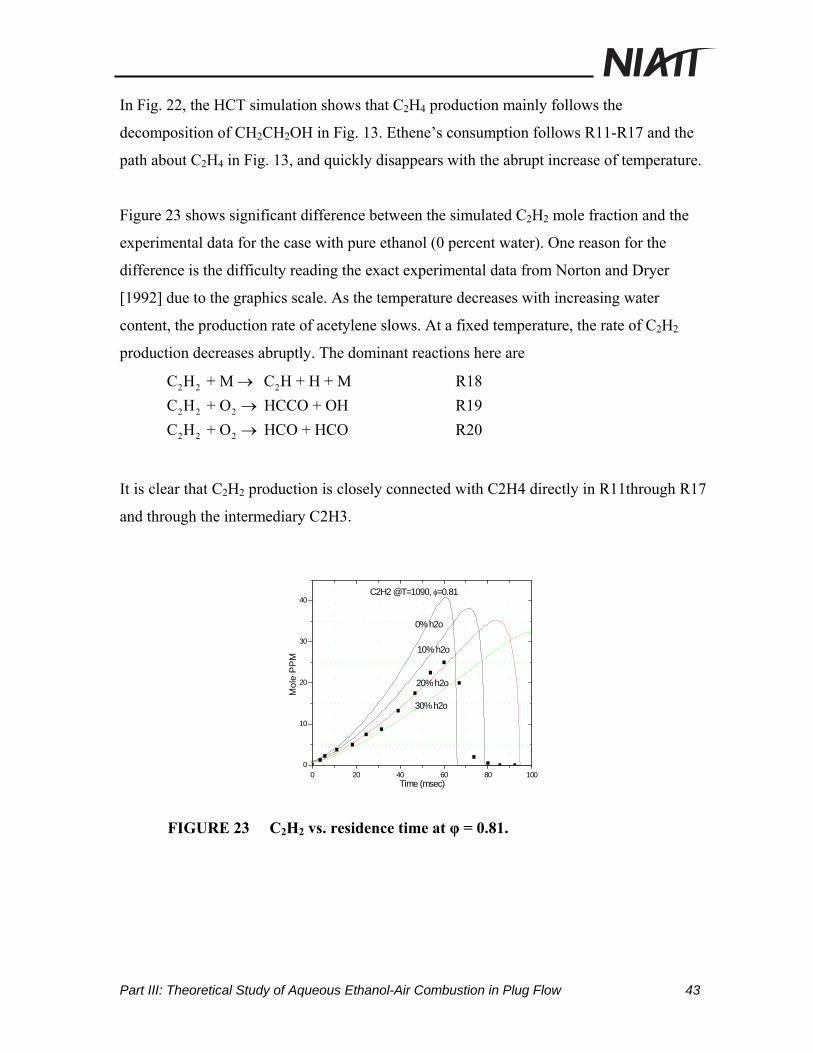
In Fig. 22, the HCT simulation shows that C2H4 production mainly follows the
decomposition of CH2CH2OH in Fig. 13. Ethene’s consumption follows R11-R17 and the
path about C2H4 in Fig. 13, and quickly disappears with the abrupt increase of temperature.
Figure 23 shows significant difference between the simulated C2H2 mole fraction and the
experimental data for the case with pure ethanol (0 percent water). One reason for the
difference is the difficulty reading the exact experimental data from Norton and Dryer
[1992] due to the graphics scale. As the temperature decreases with increasing water
content, the production rate of acetylene slows. At a fixed temperature, the rate of C2H2
production decreases abruptly. The dominant reactions here are
2 2 2
2 2 2
2 2 2
C H + M C H + H + M R18C H + O HCCO + OH R19C H + O HCO + HCO R20
→→→
It is clear that C2H2 production is closely connected with C2H4 directly in R11through R17
and through the intermediary C2H3.
0 20 40 60 80 1000
10
20
30
40
30% h2o
20% h2o
10% h2o
0% h2o
C2H2 @T=1090, φ=0.81
Mol
e P
PM
Time (msec)
FIGURE 23 C2H2 vs. residence time at φ = 0.81.
Part III: Theoretical Study of Aqueous Ethanol-Air Combustion in Plug Flow 43
0 20 40 60 80 1000
200
400
600
800
1000
1200
30% h2o
20% h2o
10% h2o0% h2o
CH3CHO @T=1090, φ=0.81
Mol
e P
PM
Time (msec)
FIGURE 24 CH3CHO vs. residence time at φ = 0.81.
The reactions that directly affect the production and consumption of CH3CHO are
3 3
2 2
3 3
CH CHOH + X -> CH CHO + XH R21 {X=O , O, H, OH and HO }CH CHOH + M -> CH CHO + H + M R22
and
3 3
2 2
3 2
CH CHO + X -> CH CO + XH R23 {X=O , O, H, OH and HO }CH CHO + X -> CH CHO + XH R24
3 2
{X=CH , O, H, OH and HO }
Egolfopoulos, et al. [1992] developed a CH3CHO reaction channel and Marinov [1998]
further refined this channel. The production reactions R21 and R22 of CH3CHO, following
the production of CH3CHOH, directly result from the ethanol decomposition in Fig. 16.
The CH3CHO consumption reactions R23 and R24 are sensitive to temperature. Hence
with 10 percent, 20 percent, and 30 percent H2O, the rate of decrease of acetaldehyde
production is steep. In Fig. 24, HCT shows that the modified ethanol mechanism is in
reasonable agreement with the experimental data for CH3CHO.
The intermediate H2 reaction mechanism connects with many reactions and intermediate
and stable species in the modified DME mechanism because of the importance of H, O and
Part III: Theoretical Study of Aqueous Ethanol-Air Combustion in Plug Flow 44
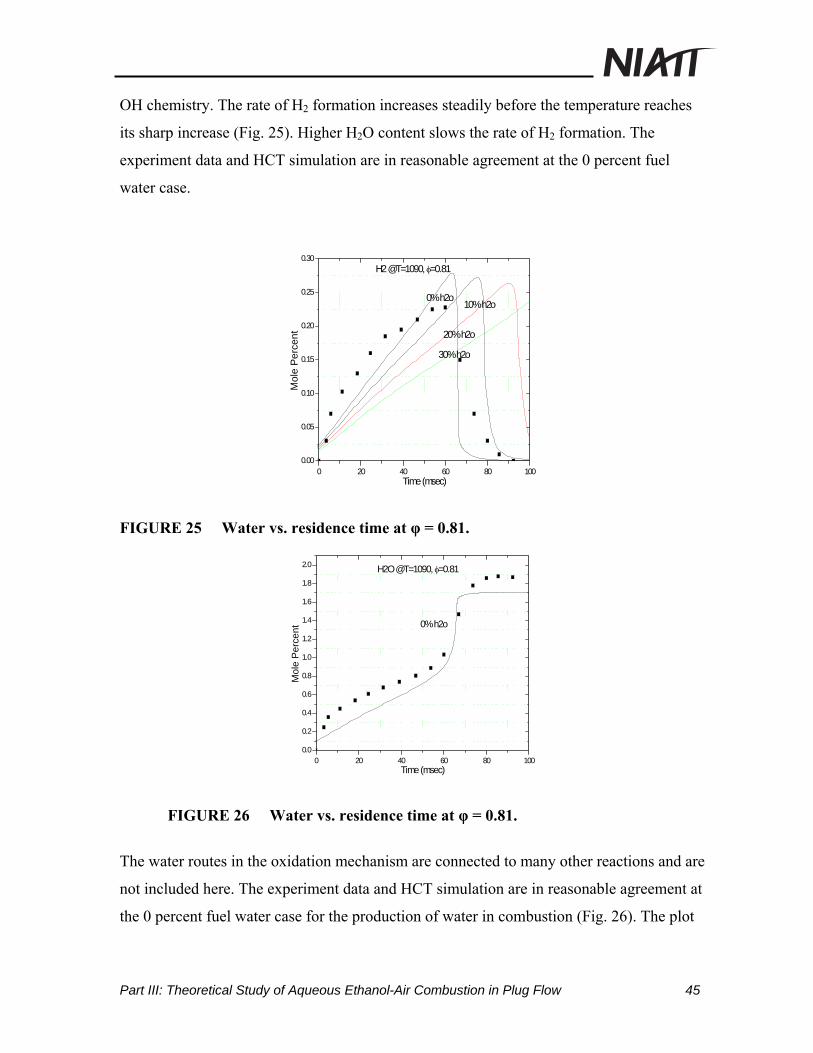
OH chemistry. The rate of H2 formation increases steadily before the temperature reaches
its sharp increase (Fig. 25). Higher H2O content slows the rate of H2 formation. The
experiment data and HCT simulation are in reasonable agreement at the 0 percent fuel
water case.
0 20 40 60 80 1000.00
0.05
0.10
0.15
0.20
0.25
0.30
30% h2o
20% h2o
10% h2o0% h2o
H2 @T=1090, φ=0.81
Mol
e P
erce
nt
Time (msec)
FIGURE 25 Water vs. residence time at φ = 0.81.
0 20 40 60 80 1000.0
0.2
0.4
0.6
0.8
1.0
1.2
1.4
1.6
1.8
2.0
0% h2o
H2O @T=1090, φ=0.81
Mol
e P
erce
nt
Time (msec)
FIGURE 26 Water vs. residence time at φ = 0.81.
The water routes in the oxidation mechanism are connected to many other reactions and are
not included here. The experiment data and HCT simulation are in reasonable agreement at
the 0 percent fuel water case for the production of water in combustion (Fig. 26). The plot
Part III: Theoretical Study of Aqueous Ethanol-Air Combustion in Plug Flow 45
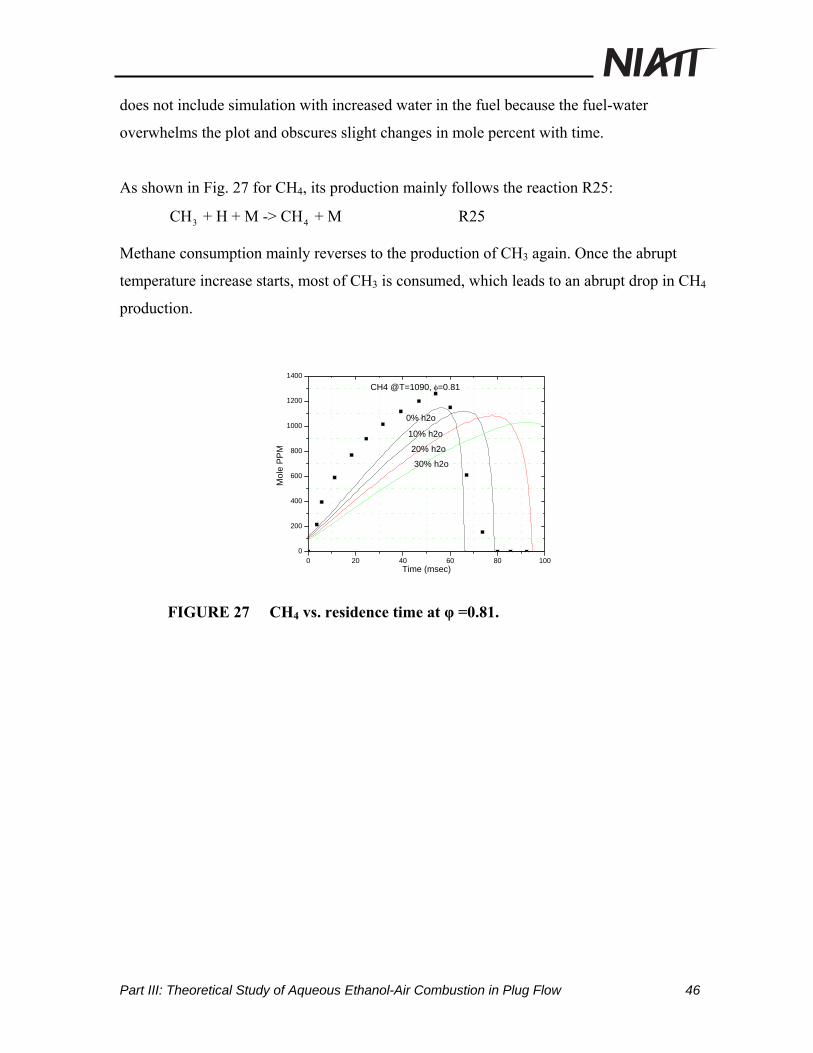
does not include simulation with increased water in the fuel because the fuel-water
overwhelms the plot and obscures slight changes in mole percent with time.
As shown in Fig. 27 for CH4, its production mainly follows the reaction R25:
3 4CH + H + M -> CH + M R25
Methane consumption mainly reverses to the production of CH3 again. Once the abrupt
temperature increase starts, most of CH3 is consumed, which leads to an abrupt drop in CH4
production.
0 20 40 60 80 1000
200
400
600
800
1000
1200
1400
30% h2o
20% h2o
10% h2o
0% h2o
CH4 @T=1090, φ=0.81
Mol
e P
PM
Time (msec)
FIGURE 27 CH4 vs. residence time at φ =0.81.
Part III: Theoretical Study of Aqueous Ethanol-Air Combustion in Plug Flow 46
III.D FINDINGS; CONCLUSIONS; RECOMMENDATIONS
The development of a catalytic igniter that permits stable combustion of high water-
content ethanol in internal combustion engines has promoted a need for fundamental
understanding of Pt-catalytic ethanol water ignition chemistry. As a first step in
developing a heterogeneous model, the HCT code was used with an ethanol oxidation
mechanism to model gas-phase ethanol-water-air combustion.
A modified ethanol mechanism was based on an existing dimethyl ether mechanism,
and included the species consumption path analysis for ethanol oxidation.To gain
confidence in the ethanol oxidation mechanism, simulated gas-phase ethanol-air
combustion was compared with experimental data from a plug flow reactor.
Due to the uncertainty in experimental induction time, the simulation results were
“time-shifted.” The calculations are in reasonable agreement with experimental data
obtained with 100 percent ethanol, with the exception of intermediate species C2H6,
(overperdicted) and C2H2 (underpredicted), and slower C2H5OH decomposition. The
simulation shows that as more water is added to ethanol, the reaction temperature
decreases and the rate of the oxidation process decreases. The addition of water results
in lower peak valued of intermediate species because of dilution.
Future Plans
1. Refine the ethanol-air combustion mechanism as new information and insights
become available to improve agreement with data at φ=0.81. Compare an improved
model with data available at φ=0.61 and 1.24.
2. Search for and evaluate hydrocarbon-Pt surface reaction data, especially that for
initial ethanol-Pt decomposition reactions. Find characteristics of Pt-hydrocarbon
oxidation that will be useful in developing a Pt-ethanol-water oxidation mechanism.
3. Develop a 1-D model for catalyst surface reactions through a literature search and
theoretical analysis of surface chemistry.
Part III: Theoretical Study of Aqueous Ethanol-Air Combustion in Plug Flow 47
4. Modify the HCT code to model the coupled homogeneous-heterogeneous
catalytically assisted ignition of ethanol-water fuel.
5. Compare the result with ethanol-water-air plug flow experiments in a reactor that is
being developed.
6. Derive simplifications that can be used to improve a catalytic ignition timing model
being developed to assist igniter designs for new engine applications
Acknowledgements
Drs. C. Westbrook, W. Pitz and L. Chase of Lawrence Livermore National Laboratory
provided valuable assistance understanding the operation of HCT and its application.
Part III: Theoretical Study of Aqueous Ethanol-Air Combustion in Plug Flow 48
REFERENCES
Borisov, A. A., V. M. Zamanskii, A. A., Konnov, V. V., Lisyanskii, S. A., Rusakov, and G. G. I. Skachkov, “A mechanism of high-temperature ethanol ignition,” Sov. J.Chem.Phys. 9:2527-2537, 1992.
Cardoso, M., and D. Luss, Chem. Eng. Sci. 24:1699-1710 (1969).
Cherry, M. A., “Catalytic-compression timed ignition,” US Patent 5,109,817, May 5, 1992.
Cherry, M., R. Morrisset, and N. Beck, “Extending lean limit with mass-timed compression ignition using a plasma torch,” SAE Paper 921556, 1992.
Cherry, M., Catalytic-Compression Timed Ignition, US Patent 5 109 817, December 18, 1990.
Cherry, M. A. and Elmore, C. L., “Timing chamber ignition method and apparatus,” US Patent 4,977, 873, December 18, 1990.
Clarke, E., “Characterization of Aqueous Ethanol Homogeneous Charge Catalytic Compression Ignition,” Masters Thesis, University of Idaho, 2001.
Cordon, D., E. Clarke, S. Beyerlein, J. Steciak, and M. Cherry, “Catalytic igniter to support combustion of ethanol-water/air mixtures in internal combustion engines,” SAE Paper 02FFL-46, 2002.
Curran, H.J. and Pitz W. J., “A wide range modeling study of dimethyl ether oxidation,” Int. J. Chem. Kin., Vol. 30, pp. 229-241, 1998.
Dryer, F. L., “High temperature oxidation of carbon monoxide and methane in a turbulent flow reactor,” AMS Report T-1034, 1972.
Egolfopolous, F. N., D. X. Du, and C. K. Law, “A study on ethanol oxidation kinetics in laminar premixed flames, flow reactors, and shock tubes,” Twenty-Fourth Symposium (International) on Combustion, The Combustion Institute, pp. 833-841, 1992.
Glassman, I., Combustion. 2nd Ed. Orlando: Academic Press, 1987.
Gottschalk, Mark A., “Catalytic ignition replaces spark plugs,” Design News, May 22, 1995.
Hall-Roberts, V. J., Hayhurst, A. N., Knight, D. E., Taylor, S. G., “Origin of soot in flames: is the nucleus an ion?” Combustion and Flame, vol. 120, No. 4, pp. 578-584, March, 2000.
Modeling and Application of Catalytic Ignition in Internal Combustion Engines 49
Hoffman, J. S., W. Lee, A. Litzinger, D. A. Santaciaa, and W. J. Pitz, “Oxidation of propane at elevated pressures: experiments and modeling,” Combustion Science and Technology, vol. 77, pg.95-125, 1991.
Jehlik, F., M. M. Jones, P. Shepherd, J. Norbeck, K. Johnson, and M. McClanahan, “Development of a low-emission, dedicated ethanol-fuel vehicle with cold-start distillation system,” SAE Paper 1999-01-0611, 1999.
Karim, H., L. D. Pfefferle, P. Markatou and M.Smooke, “Modeling heterogeneous/ homogeneous reactions and transport coupling of catalytic combustion of methyl chloride over a Mn-based catalyst,” Twenty-Fifth International Symposium on Combustion, pg.299-306, 1994.
Koert D. N., “Effects of pressure on hydrocarbon oxidation chemistry.” Ph.D. Dissertation, Drexel University, 1990.
Konnov, A.A., “Development and validation of a detailed reaction mechanism for the combustion of small hydrocarbons,” 28th Symposium (Int.) on Combustion, Edinburgh, Abstr. Symp. p. 317, 2000.
Lee, W., and Geffers, W., “Engine performance and exhaust emissions characteristics of spark ignition engines burning methanol and methanol mixtures,” A.I.Ch.E. Symposium Series #165, Vol. 73, 1977.
Lund, C. M., “HCT: A general computer program for calculating time-dependent phenomena involving one-dimensional hydrodynamics, transport, and detailed chemical kinetics,” revised by L. Chase, Lawrence Livermore National Laboratory, UCRL-52504, 1995.
Mao, F., and R. B. Barat, “Experimental and modeling studies of staged combustion using a reactor engineering approach,” Chemical Engineering Communications, vol.145, pg. 1-21, 1996.
Marinov, N. M., “A detailed chemical kinetic model for high temperature ethanol oxidation,” U.S. Department of Energy / Lawrence Livermore National Lab Contract W-7405-ENG-48, 1998.
Mitchell, W. L., T. A. Litzinger, and W.Lee, “Effects of in-cylinder catalysts on combustion and emissions of a D.I. diesel engine fueled on methanol,” Society of Automotive Engineers, Paper # 920688, 1992.
Morton, A. T., “Homogeneous charge combustion of aqueous ethanol in a high compression catalytic engine,” MS Thesis, University of Idaho, 2000.
Morton, A., M. Genoveva, S. Beyerlein, J. Steciak, and M. Cherry, “Aqueous ethanol-fueled catalytic ignition engine,” SAE Paper 1999-01-3267, 1999.
Modeling and Application of Catalytic Ignition in Internal Combustion Engines 50
Nadkarni, R. A., Guide to ASTM Test Methods for the Analysis of Petroleum Products and Lubricants. West Conshohocken, PA: ASTM Publishing, 2000.
Norton, T. S., and Dryer, F. L., “An experimental and modeling study of ethanol oxidation kinetics in an atmospheric pressure flow reactor,” International Journal of Chemical Kinetics, Vol. 24, pp.319-343, 1992.
Patterson, W.R., and Kemball, C., J. Catalysis 2:465-478 (1963).
Schwartz, A., L.L.Holbrook, H.Wise, “Catalytic oxidation studies with platinum and palladium,” Journal of Catalysis, Vol. 21, pg.199-207, 1971.
Turns, S. R., An Introduction to Combustion. New York: McGraw-Hill, Inc., 1996.
Vermeersch, M. L., T. J. Held, Y. Stein, and F. I. Dryer, “Auto-ignition chemistry studies of n-butane in a variable pressure flow reactor,” Society of Automotive Engineers, Paper # 912316, 1991.
Westbrook, C. K., and F. L. Dryer, “Chemical kinetic modeling of hydrocarbon combustion,” Prog. Energy Combust. Sci., Vol. 10, pp. 1-57, 1984
Wyman, C. E., Handbook on Bioethanol, Production and Utilization. National Renewable Energy Laboratory, NICH Report 24267 (424), 1996.
Modeling and Application of Catalytic Ignition in Internal Combustion Engines 51
Related Documents


