Hydrol. Earth Syst. Sci., 19, 747–770, 2015 www.hydrol-earth-syst-sci.net/19/747/2015/ doi:10.5194/hess-19-747-2015 © Author(s) 2015. CC Attribution 3.0 License. Model study of the impacts of future climate change on the hydrology of Ganges–Brahmaputra–Meghna basin M. Masood 1,2 , P. J.-F. Yeh 3 , N. Hanasaki 4 , and K. Takeuchi 1 1 International Centre for Water Hazard and Risk Management (ICHARM), PWRI, Tsukuba, Japan 2 National Graduate Institute for Policy Studies (GRIPS), Tokyo, Japan 3 National University of Singapore, Singapore 4 National Institute for Environmental Studies, Tsukuba, Japan Correspondence to: M. Masood ([email protected]) Received: 19 April 2014 – Published in Hydrol. Earth Syst. Sci. Discuss.: 2 June 2014 Revised: 28 December 2014 – Accepted: 7 January 2015 – Published: 4 February 2015 Abstract. The intensity, duration, and geographic extent of floods in Bangladesh mostly depend on the combined influ- ences of three river systems, the Ganges, Brahmaputra and Meghna (GBM). In addition, climate change is likely to have significant effects on the hydrology and water resources of the GBM basin and may ultimately lead to more serious floods in Bangladesh. However, the assessment of climate change impacts on the basin-scale hydrology by using well- calibrated hydrologic modeling has seldom been conducted in the GBM basin due to the lack of observed data for cali- bration and validation. In this study, a macroscale hydrologic model H08 has been applied over the basin at a relatively fine grid resolution (10 km) by integrating the fine-resolution DEM (digital elevation model) data for accurate river net- works delineation. The model has been calibrated via the analysis of model parameter sensitivity and validated based on long-term observed daily streamflow data. The impacts of climate change (considering a high-emissions path) on runoff, evapotranspiration, and soil moisture are assessed by using five CMIP5 (Coupled Model Intercomparison Project Phase 5) GCMs (global circulation models) through three time-slice experiments; the present-day (1979–2003), the near-future (2015–2039), and the far-future (2075–2099) pe- riods. Results show that, by the end of 21st century, (a) the entire GBM basin is projected to be warmed by ∼ 4.3 ◦ C; (b) the changes of mean precipitation (runoff) are projected to be +16.3 % (+16.2 %), +19.8 % (+33.1 %), and +29.6 % (+39.7 %) in the Brahmaputra, Ganges, and Meghna, respec- tively; and (c) evapotranspiration is projected to increase for the entire GBM (Brahmaputra: +16.4 %, Ganges: +13.6 %, Meghna: +12.9 %) due to increased net radiation as well as warmer temperature. Future changes of hydrologic vari- ables are larger in the dry season (November–April) than in the wet season (May–October). Amongst the three basins, the Meghna shows the highest increase in runoff, indicating higher possibility of flood occurrence. The uncertainty due to the specification of key model parameters in model predic- tions is found to be low for estimated runoff, evapotranspira- tion and net radiation. However, the uncertainty in estimated soil moisture is rather large with the coefficient of variation ranging from 14.4 to 31 % among the three basins. 1 Introduction Bangladesh is situated in the active delta of three of the world’s major rivers, the Ganges, Brahmaputra and Meghna. Due to its unique geographical location, the occurrence of water-induced disasters is a regular phenomenon. In addition, the anticipated change in climate is likely to lead to an inten- sification of the hydrological cycle and to have a major im- pact on the overall hydrology of these basins and ultimately lead to the increase in the frequency of water-induced disas- ters in Bangladesh. However, the intensity, duration and geo- graphic extent of floods in Bangladesh mostly depend on the combined influences of these three river systems. Previous studies indicated that flood damages have become more se- vere and devastating when more than one flood peak in these three river basins coincide (Mirza, 2003; Chowdhury, 2000). Published by Copernicus Publications on behalf of the European Geosciences Union.

Welcome message from author
This document is posted to help you gain knowledge. Please leave a comment to let me know what you think about it! Share it to your friends and learn new things together.
Transcript

Hydrol. Earth Syst. Sci., 19, 747–770, 2015
www.hydrol-earth-syst-sci.net/19/747/2015/
doi:10.5194/hess-19-747-2015
© Author(s) 2015. CC Attribution 3.0 License.
Model study of the impacts of future climate change on the
hydrology of Ganges–Brahmaputra–Meghna basin
M. Masood1,2, P. J.-F. Yeh3, N. Hanasaki4, and K. Takeuchi1
1International Centre for Water Hazard and Risk Management (ICHARM), PWRI, Tsukuba, Japan2National Graduate Institute for Policy Studies (GRIPS), Tokyo, Japan3National University of Singapore, Singapore4National Institute for Environmental Studies, Tsukuba, Japan
Correspondence to: M. Masood ([email protected])
Received: 19 April 2014 – Published in Hydrol. Earth Syst. Sci. Discuss.: 2 June 2014
Revised: 28 December 2014 – Accepted: 7 January 2015 – Published: 4 February 2015
Abstract. The intensity, duration, and geographic extent of
floods in Bangladesh mostly depend on the combined influ-
ences of three river systems, the Ganges, Brahmaputra and
Meghna (GBM). In addition, climate change is likely to have
significant effects on the hydrology and water resources of
the GBM basin and may ultimately lead to more serious
floods in Bangladesh. However, the assessment of climate
change impacts on the basin-scale hydrology by using well-
calibrated hydrologic modeling has seldom been conducted
in the GBM basin due to the lack of observed data for cali-
bration and validation. In this study, a macroscale hydrologic
model H08 has been applied over the basin at a relatively
fine grid resolution (10 km) by integrating the fine-resolution
DEM (digital elevation model) data for accurate river net-
works delineation. The model has been calibrated via the
analysis of model parameter sensitivity and validated based
on long-term observed daily streamflow data. The impacts
of climate change (considering a high-emissions path) on
runoff, evapotranspiration, and soil moisture are assessed by
using five CMIP5 (Coupled Model Intercomparison Project
Phase 5) GCMs (global circulation models) through three
time-slice experiments; the present-day (1979–2003), the
near-future (2015–2039), and the far-future (2075–2099) pe-
riods. Results show that, by the end of 21st century, (a) the
entire GBM basin is projected to be warmed by ∼ 4.3 ◦C;
(b) the changes of mean precipitation (runoff) are projected
to be+16.3 % (+16.2 %),+19.8 % (+33.1 %), and+29.6 %
(+39.7 %) in the Brahmaputra, Ganges, and Meghna, respec-
tively; and (c) evapotranspiration is projected to increase for
the entire GBM (Brahmaputra: +16.4 %, Ganges: +13.6 %,
Meghna: +12.9 %) due to increased net radiation as well
as warmer temperature. Future changes of hydrologic vari-
ables are larger in the dry season (November–April) than in
the wet season (May–October). Amongst the three basins,
the Meghna shows the highest increase in runoff, indicating
higher possibility of flood occurrence. The uncertainty due to
the specification of key model parameters in model predic-
tions is found to be low for estimated runoff, evapotranspira-
tion and net radiation. However, the uncertainty in estimated
soil moisture is rather large with the coefficient of variation
ranging from 14.4 to 31 % among the three basins.
1 Introduction
Bangladesh is situated in the active delta of three of the
world’s major rivers, the Ganges, Brahmaputra and Meghna.
Due to its unique geographical location, the occurrence of
water-induced disasters is a regular phenomenon. In addition,
the anticipated change in climate is likely to lead to an inten-
sification of the hydrological cycle and to have a major im-
pact on the overall hydrology of these basins and ultimately
lead to the increase in the frequency of water-induced disas-
ters in Bangladesh. However, the intensity, duration and geo-
graphic extent of floods in Bangladesh mostly depend on the
combined influences of these three river systems. Previous
studies indicated that flood damages have become more se-
vere and devastating when more than one flood peak in these
three river basins coincide (Mirza, 2003; Chowdhury, 2000).
Published by Copernicus Publications on behalf of the European Geosciences Union.
748 M. Masood et al.: Hydrology of Ganges–Brahmaputra–Meghna basin
The Ganges–Brahmaputra–Meghna (hereafter referred to
as GBM) basin with a total area of about 1.7 million km2
(FAO-AQUASTAT, 2014; Islam et al., 2010) is shared by a
number of countries (Fig. 1). The Brahmaputra River begins
in the glaciers of the Himalayas and travels through China,
Bhutan, and India before emptying into the Bay of Bengal in
Bangladesh. It is snow-fed braided river and it remains a nat-
ural stream with no major hydraulic structures built along its
reach. The Ganges River originates at the Gangotri glaciers
in the Himalayas and it passes through Nepal, China and
India and empties into the Bay of Bengal at Bangladesh.
It is snowmelt-fed river and its natural flow is controlled
by a number of dams constructed by the upstream coun-
tries. The Meghna River is a comparatively smaller, rain-fed,
and relatively flashier river that runs through a mountainous
region in India before entering Bangladesh. Major charac-
teristics of the GBM Rivers are presented in Table 1. This
river system is the world’s third largest freshwater outlet to
the oceans (Chowdhury and Ward, 2004). During extreme
floods, over 138 700 m3 s−1 of water flows into the Bay of
Bengal through a single outlet, which is the world largest
intensity, even exceeding that of the Amazon discharge by
about 1.5 times (FAO-AQUASTAT, 2014). The GBM basin
is unique in the world in terms of diversified climate. For
example, the Ganges River basin is characterized by low
precipitation (760–1020 mm year−1) in the northwestern up-
per region and high precipitation (1520–2540 mm year−1)
along the coastal areas. High precipitation zones and dry rain
shadow areas are located in the Brahmaputra River basin,
whereas the world’s highest precipitation (11 871 mm year−1
at Mawsynram, Meghalaya state, India) area is situated in the
Meghna River basin (FAO-AQUASTAT, 2014).
Several studies have focused on the rainfall and discharge
relationships in the GBM basin by (1) identifying and link-
ing the correlation between basin discharge and the El Niño–
Southern Oscillation (ENSO) and sea surface temperature
(SST) (Chowdhury and Ward, 2004; Mirza et al., 1998;
Nishat and Faisal, 2000), (2) analyzing available observed
or reanalysis data (Chowdhury and Ward, 2004, 2007; Mirza
et al., 1998; Kamal-Heikman et al., 2007), and (3) evaluat-
ing historical data of flood events (Mirza, 2003; Islam et al.,
2010). Various statistical approaches were used in the above
studies instead of using hydrologic model simulations. In re-
cent years, a number of global-scale hydrologic model stud-
ies (Haddeland et al., 2011, 2012; Pokhrel et al., 2012) have
been reported. Although their modeling domains include the
GBM basin, these global-scale simulations are not fully re-
liable due to the lack of model calibration at both the global
and basin scales.
Few studies have been conducted to investigate the impact
of climate change on the hydrology and water resources of
the GBM basin (Immerzeel, 2008; Kamal et al., 2013; Bie-
mans et al., 2013; Gain et al., 2011; Ghosh and Dutta, 2012).
In most of these studies, future streamflow is projected on
the basis of linear regression between rainfall and streamflow
derived from historical data (Immerzeel, 2008; Chowdhury
and Ward, 2004; Mirza et al., 2003). Immerzeel (2008) used
the multiple regression technique to predict streamflow at the
Bahadurabad station (the outlet of Brahmaputra Basin) un-
der future temperature and precipitation conditions based on
a statistically downscaled GCM (global circulation model)
output. However, since most hydrologic processes are non-
linear, they cannot be predicted accurately by extrapolating
empirically derived regression equations to the future projec-
tions. The alternative for the assessment of climate change
impacts on basin-scale hydrology is via well-calibrated hy-
drologic modeling, but this has rarely been conducted for the
GBM basin due to the lack of observed data for model cal-
ibration and validation. Ghosh and Dutta (2012) applied a
macroscale distributed hydrologic model to study the change
of future flood characteristics at the Brahmaputra Basin, but
their study domain is only focused on the regions inside In-
dia. Gain et al. (2011) estimated future trends of the low
and high flows in the lower Brahmaputra Basin using outputs
from a global hydrologic model (grid resolution: 0.5◦) forced
by multiple GCM outputs. Instead of model calibration, the
simulated future streamflow is weighted against observations
to assess the climate change impacts.
In this study, a hydrologic model simulation is conducted
in which the calibration and validation is based on a rarely
obtained long-term (1980–2001) observed daily streamflow
data set in the GBM basin provided by the Bangladesh Wa-
ter Development Board (BWDB). Relative to previous GBM
basin studies, it is believed that the availability of this unique
long-term streamflow data can lead to more precise estima-
tion of model parameters and hence more accurate hydro-
logical simulations and more reliable future projection of the
hydrology over the GBM basin.
The objective of this study is to (1) setup a hydrologic
model for the GBM basin and calibrate and validate the
model with the long-term observed daily streamflow data,
and (2) to study the impact of future climate changes on
the basin-scale hydrology. A global hydrologic model H08
(Hanasaki et al., 2008, 2014) is applied regionally over the
GBM basin at a relatively fine grid resolution (10 km) by
integrating the fine-resolution (∼ 0.5 km) DEM (digital el-
evation model) data for the accurate river networks delin-
eation. The hourly atmospheric forcing data from the Wa-
ter and Global Change (WATCH) model-intercomparison
project (Weedon et al., 2011) (hereafter referred to as WFD,
i.e., WATCH forcing data set) are used for the historical sim-
ulations. WFD is considered as one of the best available
global climate forcing data sets to provide accurate represen-
tation of meteorological events, synoptic activity, seasonal
cycles and climate trends (Weedon et al., 2011). The stud-
ies by Lucas-Picher et al. (2011) and Siderius et al. (2013)
found that for southern Asia and the Ganges, respectively, the
WFD rainfall is consistent with the APHRODITE (Yatagai et
al., 2012), a gridded (0.25◦) rainfall product for the southern
Asia region developed based on a large number of rain gauge
Hydrol. Earth Syst. Sci., 19, 747–770, 2015 www.hydrol-earth-syst-sci.net/19/747/2015/
M. Masood et al.: Hydrology of Ganges–Brahmaputra–Meghna basin 749
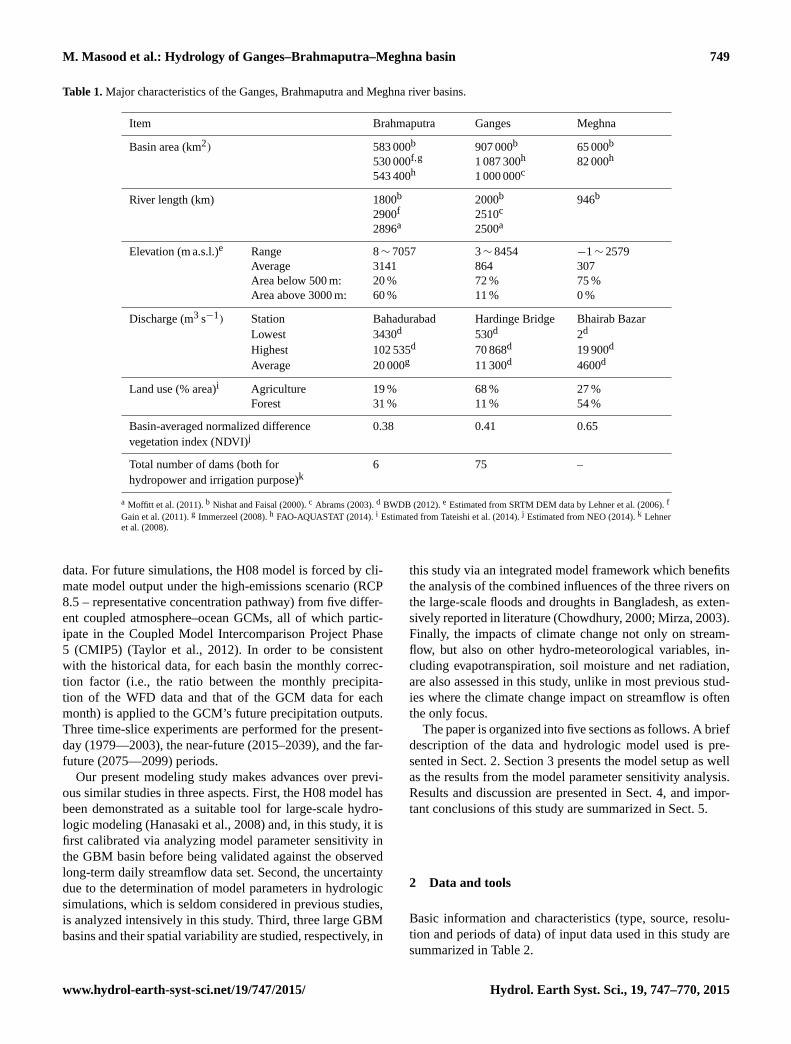
Table 1. Major characteristics of the Ganges, Brahmaputra and Meghna river basins.
Item Brahmaputra Ganges Meghna
Basin area (km2) 583 000b
530 000f,g
543 400h
907 000b
1 087 300h
1 000 000c
65 000b
82 000h
River length (km) 1800b
2900f
2896a
2000b
2510c
2500a
946b
Elevation (m a.s.l.)e Range 8∼ 7057 3∼ 8454 −1∼ 2579
Average 3141 864 307
Area below 500 m: 20 % 72 % 75 %
Area above 3000 m: 60 % 11 % 0 %
Discharge (m3 s−1) Station Bahadurabad Hardinge Bridge Bhairab Bazar
Lowest 3430d 530d 2d
Highest 102 535d 70 868d 19 900d
Average 20 000g 11 300d 4600d
Land use (% area)i Agriculture 19 % 68 % 27 %
Forest 31 % 11 % 54 %
Basin-averaged normalized difference 0.38 0.41 0.65
vegetation index (NDVI)j
Total number of dams (both for 6 75 –
hydropower and irrigation purpose)k
a Moffitt et al. (2011). b Nishat and Faisal (2000). c Abrams (2003). d BWDB (2012). e Estimated from SRTM DEM data by Lehner et al. (2006). f
Gain et al. (2011). g Immerzeel (2008). h FAO-AQUASTAT (2014). i Estimated from Tateishi et al. (2014). j Estimated from NEO (2014). k Lehner
et al. (2008).
data. For future simulations, the H08 model is forced by cli-
mate model output under the high-emissions scenario (RCP
8.5 – representative concentration pathway) from five differ-
ent coupled atmosphere–ocean GCMs, all of which partic-
ipate in the Coupled Model Intercomparison Project Phase
5 (CMIP5) (Taylor et al., 2012). In order to be consistent
with the historical data, for each basin the monthly correc-
tion factor (i.e., the ratio between the monthly precipita-
tion of the WFD data and that of the GCM data for each
month) is applied to the GCM’s future precipitation outputs.
Three time-slice experiments are performed for the present-
day (1979—2003), the near-future (2015–2039), and the far-
future (2075—2099) periods.
Our present modeling study makes advances over previ-
ous similar studies in three aspects. First, the H08 model has
been demonstrated as a suitable tool for large-scale hydro-
logic modeling (Hanasaki et al., 2008) and, in this study, it is
first calibrated via analyzing model parameter sensitivity in
the GBM basin before being validated against the observed
long-term daily streamflow data set. Second, the uncertainty
due to the determination of model parameters in hydrologic
simulations, which is seldom considered in previous studies,
is analyzed intensively in this study. Third, three large GBM
basins and their spatial variability are studied, respectively, in
this study via an integrated model framework which benefits
the analysis of the combined influences of the three rivers on
the large-scale floods and droughts in Bangladesh, as exten-
sively reported in literature (Chowdhury, 2000; Mirza, 2003).
Finally, the impacts of climate change not only on stream-
flow, but also on other hydro-meteorological variables, in-
cluding evapotranspiration, soil moisture and net radiation,
are also assessed in this study, unlike in most previous stud-
ies where the climate change impact on streamflow is often
the only focus.
The paper is organized into five sections as follows. A brief
description of the data and hydrologic model used is pre-
sented in Sect. 2. Section 3 presents the model setup as well
as the results from the model parameter sensitivity analysis.
Results and discussion are presented in Sect. 4, and impor-
tant conclusions of this study are summarized in Sect. 5.
2 Data and tools
Basic information and characteristics (type, source, resolu-
tion and periods of data) of input data used in this study are
summarized in Table 2.
www.hydrol-earth-syst-sci.net/19/747/2015/ Hydrol. Earth Syst. Sci., 19, 747–770, 2015
750 M. Masood et al.: Hydrology of Ganges–Brahmaputra–Meghna basin
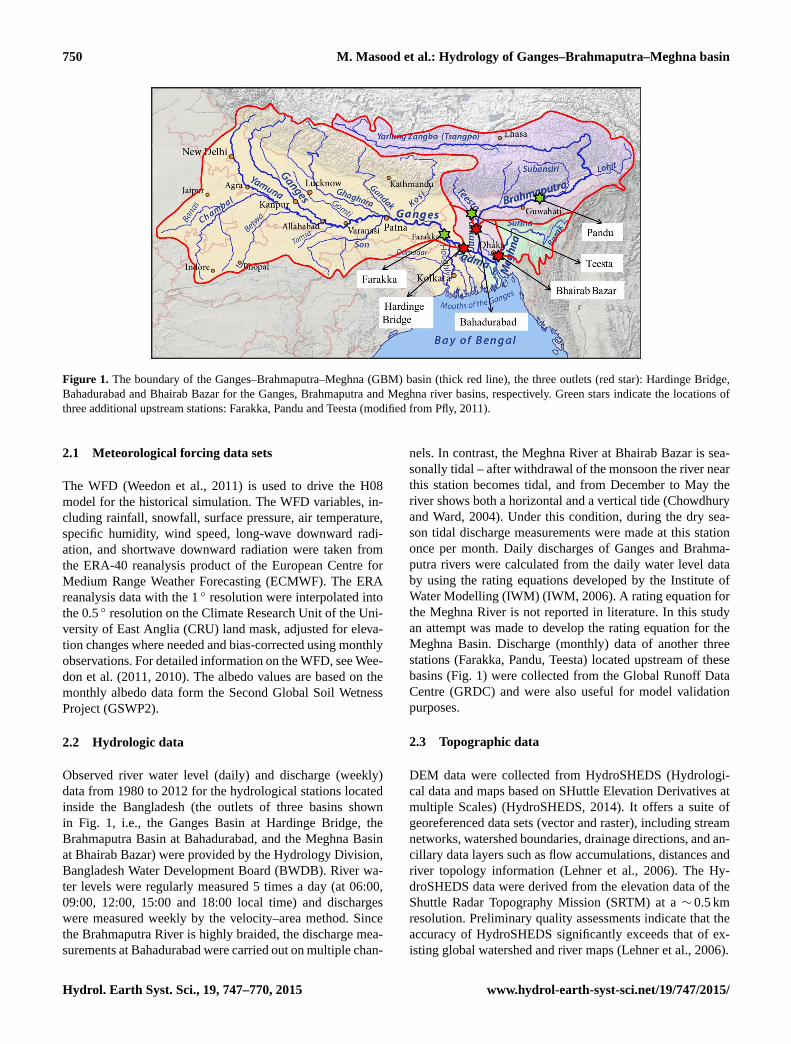
Figure 1. The boundary of the Ganges–Brahmaputra–Meghna (GBM) basin (thick red line), the three outlets (red star): Hardinge Bridge,
Bahadurabad and Bhairab Bazar for the Ganges, Brahmaputra and Meghna river basins, respectively. Green stars indicate the locations of
three additional upstream stations: Farakka, Pandu and Teesta (modified from Pfly, 2011).
2.1 Meteorological forcing data sets
The WFD (Weedon et al., 2011) is used to drive the H08
model for the historical simulation. The WFD variables, in-
cluding rainfall, snowfall, surface pressure, air temperature,
specific humidity, wind speed, long-wave downward radi-
ation, and shortwave downward radiation were taken from
the ERA-40 reanalysis product of the European Centre for
Medium Range Weather Forecasting (ECMWF). The ERA
reanalysis data with the 1 ◦ resolution were interpolated into
the 0.5 ◦ resolution on the Climate Research Unit of the Uni-
versity of East Anglia (CRU) land mask, adjusted for eleva-
tion changes where needed and bias-corrected using monthly
observations. For detailed information on the WFD, see Wee-
don et al. (2011, 2010). The albedo values are based on the
monthly albedo data form the Second Global Soil Wetness
Project (GSWP2).
2.2 Hydrologic data
Observed river water level (daily) and discharge (weekly)
data from 1980 to 2012 for the hydrological stations located
inside the Bangladesh (the outlets of three basins shown
in Fig. 1, i.e., the Ganges Basin at Hardinge Bridge, the
Brahmaputra Basin at Bahadurabad, and the Meghna Basin
at Bhairab Bazar) were provided by the Hydrology Division,
Bangladesh Water Development Board (BWDB). River wa-
ter levels were regularly measured 5 times a day (at 06:00,
09:00, 12:00, 15:00 and 18:00 local time) and discharges
were measured weekly by the velocity–area method. Since
the Brahmaputra River is highly braided, the discharge mea-
surements at Bahadurabad were carried out on multiple chan-
nels. In contrast, the Meghna River at Bhairab Bazar is sea-
sonally tidal – after withdrawal of the monsoon the river near
this station becomes tidal, and from December to May the
river shows both a horizontal and a vertical tide (Chowdhury
and Ward, 2004). Under this condition, during the dry sea-
son tidal discharge measurements were made at this station
once per month. Daily discharges of Ganges and Brahma-
putra rivers were calculated from the daily water level data
by using the rating equations developed by the Institute of
Water Modelling (IWM) (IWM, 2006). A rating equation for
the Meghna River is not reported in literature. In this study
an attempt was made to develop the rating equation for the
Meghna Basin. Discharge (monthly) data of another three
stations (Farakka, Pandu, Teesta) located upstream of these
basins (Fig. 1) were collected from the Global Runoff Data
Centre (GRDC) and were also useful for model validation
purposes.
2.3 Topographic data
DEM data were collected from HydroSHEDS (Hydrologi-
cal data and maps based on SHuttle Elevation Derivatives at
multiple Scales) (HydroSHEDS, 2014). It offers a suite of
georeferenced data sets (vector and raster), including stream
networks, watershed boundaries, drainage directions, and an-
cillary data layers such as flow accumulations, distances and
river topology information (Lehner et al., 2006). The Hy-
droSHEDS data were derived from the elevation data of the
Shuttle Radar Topography Mission (SRTM) at a ∼ 0.5 km
resolution. Preliminary quality assessments indicate that the
accuracy of HydroSHEDS significantly exceeds that of ex-
isting global watershed and river maps (Lehner et al., 2006).
Hydrol. Earth Syst. Sci., 19, 747–770, 2015 www.hydrol-earth-syst-sci.net/19/747/2015/

M. Masood et al.: Hydrology of Ganges–Brahmaputra–Meghna basin 751
2.4 GCM data
Climate data from five CMIP5 climate models – MIROC5,
MIROC-ESM, MRI-CGCM3, HadGEM2-ES (under the
RCP 8.5) and MRI-AGCM3.2S (under the SRES A1B – Spe-
cial Report on Emissions Scenarios) – are used in this study
as the forcing data for future hydrological simulations (see
Appendix B, Table B1). The climate data have been inter-
polated from their original climate model resolutions (rang-
ing from 0.25× 0.25◦ to 2.8× 2.8◦) to 5′× 5′ (∼ 10 km-
mesh) using linear interpolation (nearest four-point). In or-
der to be consistent with the historical simulation forced by
WFD, the precipitation forcing data in each GBM basin from
each GCM are corrected by multiplying a monthly correc-
tion factor, which is equal to the ratio between the basin-
averaged long-term mean precipitation from WFD and that
from each GCM for all the months. Among these GCMs,
MRI-AGCM3.2S (where the “S” refers to the “super-high
resolution”) provides higher-resolution (20 km) atmospheric
forcing data which shows improvements in simulating heavy
precipitation, global distribution of tropical cyclones, and the
seasonal march of the east Asian summer monsoon (Mizuta
et al., 2012). The MRI-AGCM3.2S forcing data set has been
used in several recent climate change impact studies focused
on southern Asia (Rahman et al., 2012; Endo et al., 2012;
Kwak et al., 2012).
2.5 Hydrologic model: H08
H08 is a macroscale hydrological model developed by
Hanasaki et al. (2008) which consists of six main modules:
land surface hydrology, river routing, crop growth, reservoir
operation, environmental flow requirement estimation, and
anthropogenic water withdrawal. For this study, only two
modules, the land surface hydrology and the river routing are
used. The land surface hydrology module calculates the en-
ergy and water budgets above and beneath the land surface as
forced by the high-temporal-resolution meteorological data.
The runoff scheme in H08 is based on the bucket model
concept (Manabe, 1969) but differs from the original formu-
lation in certain important aspects. Although runoff is gen-
erated only when the bucket is overfilled as in the origi-
nal bucket model, H08 uses a “leaky bucket” formulation
in which subsurface runoff occurs continually as a function
of soil moisture. Soil moisture is expressed as a single-layer
reservoir with the holding capacity of 15 cm for all the soil
and vegetation types. When the reservoir is empty (full), soil
moisture is at the wilting point (the field capacity). Evapo-
transpiration is expressed as a function of potential evapo-
transpiration and soil moisture (Eq. 2). Potential evapotran-
spiration and snowmelt are calculated from the surface en-
ergy balance (Hanasaki et al., 2008).
Potential evaporation EP is expressed in this model as
EP (TS)= ρCDU(qSAT (TS)− qa), (1)
where ρ is the density of air, CD is the bulk transfer coeffi-
cient, U is the wind speed, qSAT(TS) is the saturated specific
humidity at surface temperature, and qa is the specific hu-
midity. Evaporation from a surface (E) is expressed as
E = βEP(TS), (2)
where
β =
{1 0.75Wf ≤W
W/Wf W < 0.75Wf, (3)
where W is the soil water content and Wf is the soil water
content at field capacity (fixed at 150 kg m−2).
Surface runoff (Qs) is generated whenever the soil water
content exceeds the field capacity:
Qs =
{W − Wf Wf <W
0 W ≤Wf. (4)
Subsurface runoff (Qsb) is incorporated to the model as
Qsb =Wf
τ
(W
Wf
)γ, (5)
where τ is a time constant and γ is a parameter characteriz-
ing the degree of nonlinearity of Qsb. These two parameters
are calibrated in this study as described later in Sect. 3.1.
The river module is identical to the Total Runoff Integrat-
ing Pathways (TRIP) model (Oki and Sud, 1998). The mod-
ule has a digital river map covering the whole globe at a spa-
tial resolution of 1◦ (∼ 111 km). The land–sea mask is iden-
tical to the GSWP2 meteorological forcing input. Effective
flow velocity and meandering ratio are set as the default val-
ues at 0.5 m s−1 and 1.5, respectively. The module accumu-
lates runoff generated by the land surface model and routes
it downstream as streamflow. However, for this study a new
digital river map of the GBM basin with the spatial resolution
of ∼ 10 km is prepared. Effective flow velocity and mean-
dering ratio have been calibrated, respectively, for the three
basins.
3 Methodology: model setup and simulation
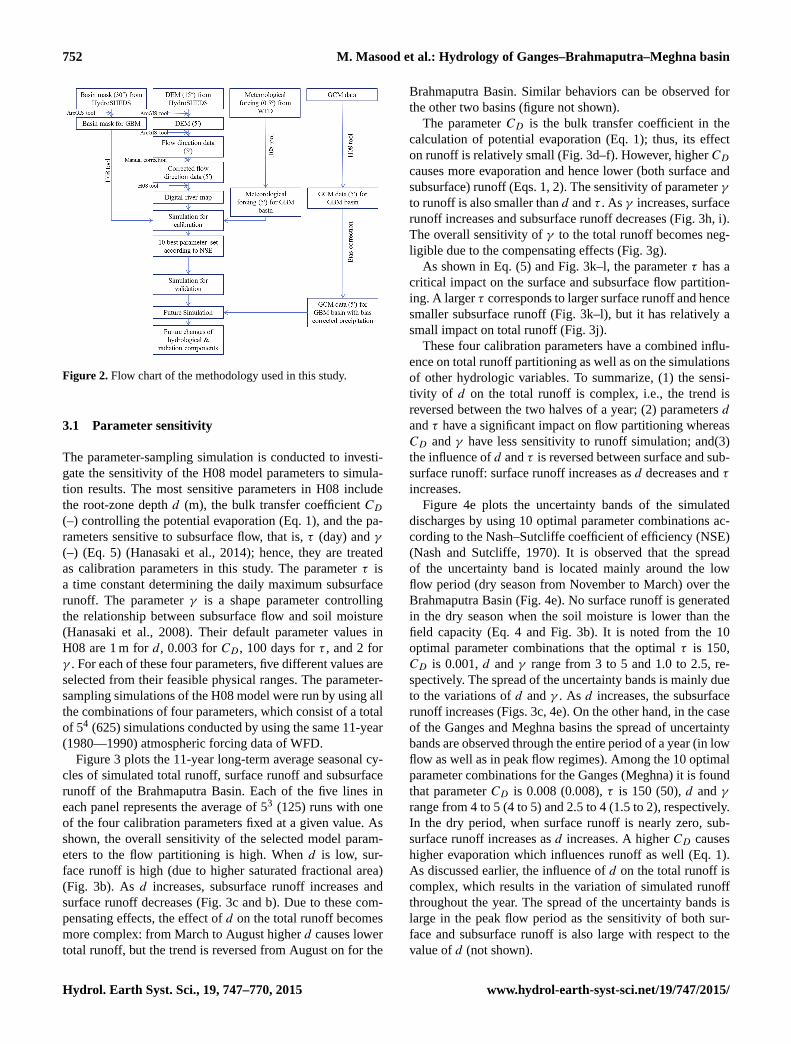
Figure 2 presents the methodology used in this study from
model setup to the historical and future simulations. The
H08 simulation with the 10 km (5′) resolution is calibrated
to find the optimal parameter sets by using the parameter-
sampling simulation technique, and validated with observed
daily streamflow data. The default river module of H08 uses
the digital river map from TRIP (Oki and Sud, 1998) with the
global resolution of 1◦ (∼ 111 km) which is too coarse for the
regional simulation in this study, which has the 10 km reso-
lution. Therefore, a new digital river map of the 10 km res-
olution is prepared for this purpose by integrating the finer-
resolution (∼ 0.5 km) DEM data.
www.hydrol-earth-syst-sci.net/19/747/2015/ Hydrol. Earth Syst. Sci., 19, 747–770, 2015
752 M. Masood et al.: Hydrology of Ganges–Brahmaputra–Meghna basin
Figure 2. Flow chart of the methodology used in this study.
3.1 Parameter sensitivity
The parameter-sampling simulation is conducted to investi-
gate the sensitivity of the H08 model parameters to simula-
tion results. The most sensitive parameters in H08 include
the root-zone depth d (m), the bulk transfer coefficient CD(–) controlling the potential evaporation (Eq. 1), and the pa-
rameters sensitive to subsurface flow, that is, τ (day) and γ
(–) (Eq. 5) (Hanasaki et al., 2014); hence, they are treated
as calibration parameters in this study. The parameter τ is
a time constant determining the daily maximum subsurface
runoff. The parameter γ is a shape parameter controlling
the relationship between subsurface flow and soil moisture
(Hanasaki et al., 2008). Their default parameter values in
H08 are 1 m for d, 0.003 for CD , 100 days for τ , and 2 for
γ . For each of these four parameters, five different values are
selected from their feasible physical ranges. The parameter-
sampling simulations of the H08 model were run by using all
the combinations of four parameters, which consist of a total
of 54 (625) simulations conducted by using the same 11-year
(1980—1990) atmospheric forcing data of WFD.
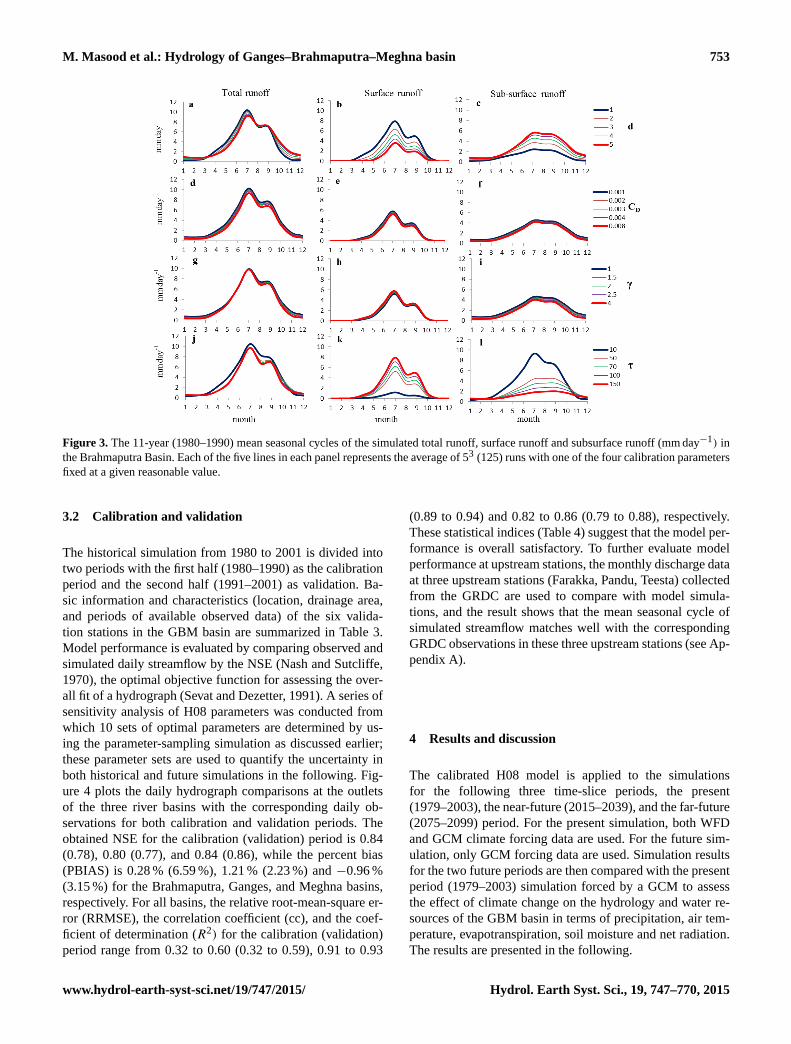
Figure 3 plots the 11-year long-term average seasonal cy-
cles of simulated total runoff, surface runoff and subsurface
runoff of the Brahmaputra Basin. Each of the five lines in
each panel represents the average of 53 (125) runs with one
of the four calibration parameters fixed at a given value. As
shown, the overall sensitivity of the selected model param-
eters to the flow partitioning is high. When d is low, sur-
face runoff is high (due to higher saturated fractional area)
(Fig. 3b). As d increases, subsurface runoff increases and
surface runoff decreases (Fig. 3c and b). Due to these com-
pensating effects, the effect of d on the total runoff becomes
more complex: from March to August higher d causes lower
total runoff, but the trend is reversed from August on for the
Brahmaputra Basin. Similar behaviors can be observed for
the other two basins (figure not shown).
The parameter CD is the bulk transfer coefficient in the
calculation of potential evaporation (Eq. 1); thus, its effect
on runoff is relatively small (Fig. 3d–f). However, higher CDcauses more evaporation and hence lower (both surface and
subsurface) runoff (Eqs. 1, 2). The sensitivity of parameter γ
to runoff is also smaller than d and τ . As γ increases, surface
runoff increases and subsurface runoff decreases (Fig. 3h, i).
The overall sensitivity of γ to the total runoff becomes neg-
ligible due to the compensating effects (Fig. 3g).
As shown in Eq. (5) and Fig. 3k–l, the parameter τ has a
critical impact on the surface and subsurface flow partition-
ing. A larger τ corresponds to larger surface runoff and hence
smaller subsurface runoff (Fig. 3k–l), but it has relatively a
small impact on total runoff (Fig. 3j).
These four calibration parameters have a combined influ-
ence on total runoff partitioning as well as on the simulations
of other hydrologic variables. To summarize, (1) the sensi-
tivity of d on the total runoff is complex, i.e., the trend is
reversed between the two halves of a year; (2) parameters d
and τ have a significant impact on flow partitioning whereas
CD and γ have less sensitivity to runoff simulation; and(3)
the influence of d and τ is reversed between surface and sub-
surface runoff: surface runoff increases as d decreases and τ
increases.
Figure 4e plots the uncertainty bands of the simulated
discharges by using 10 optimal parameter combinations ac-
cording to the Nash–Sutcliffe coefficient of efficiency (NSE)
(Nash and Sutcliffe, 1970). It is observed that the spread
of the uncertainty band is located mainly around the low
flow period (dry season from November to March) over the
Brahmaputra Basin (Fig. 4e). No surface runoff is generated
in the dry season when the soil moisture is lower than the
field capacity (Eq. 4 and Fig. 3b). It is noted from the 10
optimal parameter combinations that the optimal τ is 150,
CD is 0.001, d and γ range from 3 to 5 and 1.0 to 2.5, re-
spectively. The spread of the uncertainty bands is mainly due
to the variations of d and γ . As d increases, the subsurface
runoff increases (Figs. 3c, 4e). On the other hand, in the case
of the Ganges and Meghna basins the spread of uncertainty
bands are observed through the entire period of a year (in low
flow as well as in peak flow regimes). Among the 10 optimal
parameter combinations for the Ganges (Meghna) it is found
that parameter CD is 0.008 (0.008), τ is 150 (50), d and γ
range from 4 to 5 (4 to 5) and 2.5 to 4 (1.5 to 2), respectively.
In the dry period, when surface runoff is nearly zero, sub-
surface runoff increases as d increases. A higher CD causes
higher evaporation which influences runoff as well (Eq. 1).
As discussed earlier, the influence of d on the total runoff is
complex, which results in the variation of simulated runoff
throughout the year. The spread of the uncertainty bands is
large in the peak flow period as the sensitivity of both sur-
face and subsurface runoff is also large with respect to the
value of d (not shown).
Hydrol. Earth Syst. Sci., 19, 747–770, 2015 www.hydrol-earth-syst-sci.net/19/747/2015/
M. Masood et al.: Hydrology of Ganges–Brahmaputra–Meghna basin 753
Figure 3. The 11-year (1980–1990) mean seasonal cycles of the simulated total runoff, surface runoff and subsurface runoff (mm day−1) in
the Brahmaputra Basin. Each of the five lines in each panel represents the average of 53 (125) runs with one of the four calibration parameters
fixed at a given reasonable value.
3.2 Calibration and validation
The historical simulation from 1980 to 2001 is divided into
two periods with the first half (1980–1990) as the calibration
period and the second half (1991–2001) as validation. Ba-
sic information and characteristics (location, drainage area,
and periods of available observed data) of the six valida-
tion stations in the GBM basin are summarized in Table 3.
Model performance is evaluated by comparing observed and
simulated daily streamflow by the NSE (Nash and Sutcliffe,
1970), the optimal objective function for assessing the over-
all fit of a hydrograph (Sevat and Dezetter, 1991). A series of
sensitivity analysis of H08 parameters was conducted from
which 10 sets of optimal parameters are determined by us-
ing the parameter-sampling simulation as discussed earlier;
these parameter sets are used to quantify the uncertainty in
both historical and future simulations in the following. Fig-
ure 4 plots the daily hydrograph comparisons at the outlets
of the three river basins with the corresponding daily ob-
servations for both calibration and validation periods. The
obtained NSE for the calibration (validation) period is 0.84
(0.78), 0.80 (0.77), and 0.84 (0.86), while the percent bias
(PBIAS) is 0.28 % (6.59 %), 1.21 % (2.23 %) and −0.96 %
(3.15 %) for the Brahmaputra, Ganges, and Meghna basins,
respectively. For all basins, the relative root-mean-square er-
ror (RRMSE), the correlation coefficient (cc), and the coef-
ficient of determination (R2) for the calibration (validation)
period range from 0.32 to 0.60 (0.32 to 0.59), 0.91 to 0.93
(0.89 to 0.94) and 0.82 to 0.86 (0.79 to 0.88), respectively.
These statistical indices (Table 4) suggest that the model per-
formance is overall satisfactory. To further evaluate model
performance at upstream stations, the monthly discharge data
at three upstream stations (Farakka, Pandu, Teesta) collected
from the GRDC are used to compare with model simula-
tions, and the result shows that the mean seasonal cycle of
simulated streamflow matches well with the corresponding
GRDC observations in these three upstream stations (see Ap-
pendix A).
4 Results and discussion
The calibrated H08 model is applied to the simulations
for the following three time-slice periods, the present
(1979–2003), the near-future (2015–2039), and the far-future
(2075–2099) period. For the present simulation, both WFD
and GCM climate forcing data are used. For the future sim-
ulation, only GCM forcing data are used. Simulation results
for the two future periods are then compared with the present
period (1979–2003) simulation forced by a GCM to assess
the effect of climate change on the hydrology and water re-
sources of the GBM basin in terms of precipitation, air tem-
perature, evapotranspiration, soil moisture and net radiation.
The results are presented in the following.
www.hydrol-earth-syst-sci.net/19/747/2015/ Hydrol. Earth Syst. Sci., 19, 747–770, 2015

754 M. Masood et al.: Hydrology of Ganges–Brahmaputra–Meghna basin
Figure 4. The simulated discharges (red line) using the WFD forcing data (both calibration and validation period) compared with observations
(green line) at outlets of the (a) Brahmaputra, (b) Ganges, and (c) Meghna rivers, (d) mean monthly (1980–2001) simulated discharges
compared with those of observations at outlets; (e) simulated discharges by using the 10 optimal parameter sets (red line) and the associated
uncertainty bands (green shading) in a typical year (1985). NSE, PBIAS, RRMSE, cc and R2 for both calibration and validation periods are
noted at subplots (a), (b) and (c).
Hydrol. Earth Syst. Sci., 19, 747–770, 2015 www.hydrol-earth-syst-sci.net/19/747/2015/
M. Masood et al.: Hydrology of Ganges–Brahmaputra–Meghna basin 755
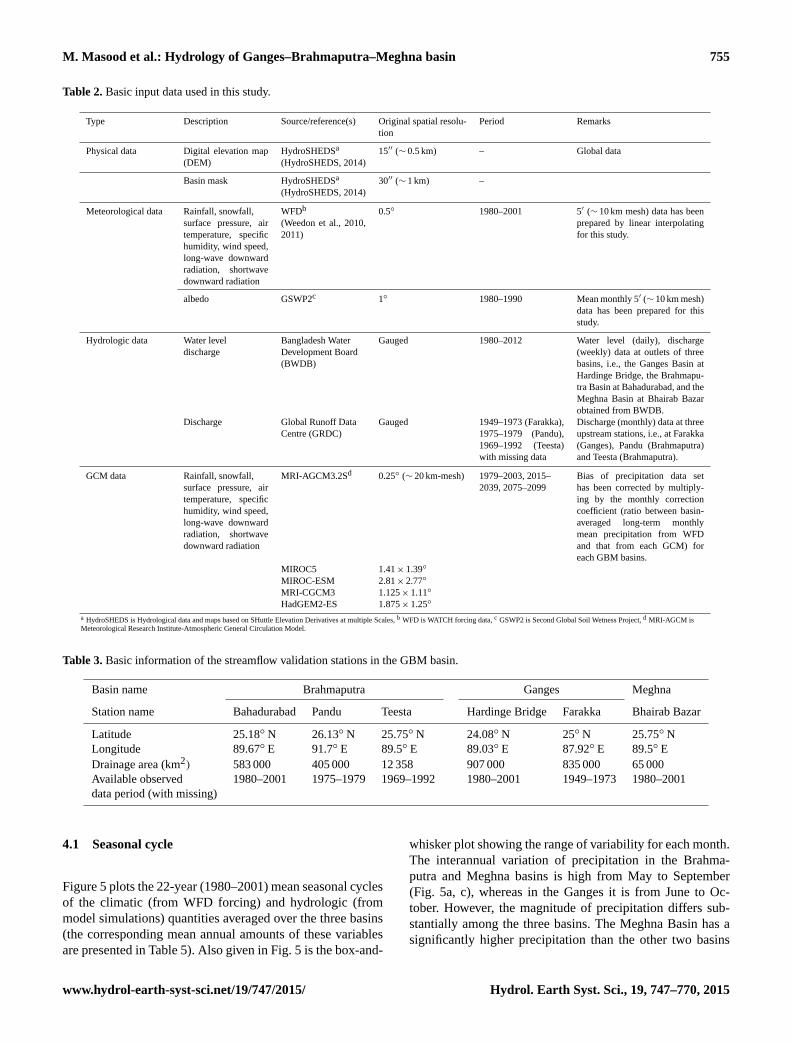
Table 2. Basic input data used in this study.
Type Description Source/reference(s) Original spatial resolu-
tion
Period Remarks
Physical data Digital elevation map
(DEM)
HydroSHEDSa
(HydroSHEDS, 2014)
15′′ (∼ 0.5 km) – Global data
Basin mask HydroSHEDSa
(HydroSHEDS, 2014)
30′′ (∼ 1 km) –
Meteorological data Rainfall, snowfall,
surface pressure, air
temperature, specific
humidity, wind speed,
long-wave downward
radiation, shortwave
downward radiation
WFDb
(Weedon et al., 2010,
2011)
0.5◦ 1980–2001 5′ (∼ 10 km mesh) data has been
prepared by linear interpolating
for this study.
albedo GSWP2c 1◦ 1980–1990 Mean monthly 5′ (∼ 10 km mesh)
data has been prepared for this
study.
Hydrologic data Water level
discharge
Bangladesh Water
Development Board
(BWDB)
Gauged 1980–2012 Water level (daily), discharge
(weekly) data at outlets of three
basins, i.e., the Ganges Basin at
Hardinge Bridge, the Brahmapu-
tra Basin at Bahadurabad, and the
Meghna Basin at Bhairab Bazar
obtained from BWDB.
Discharge Global Runoff Data
Centre (GRDC)
Gauged 1949–1973 (Farakka),
1975–1979 (Pandu),
1969–1992 (Teesta)
with missing data
Discharge (monthly) data at three
upstream stations, i.e., at Farakka
(Ganges), Pandu (Brahmaputra)
and Teesta (Brahmaputra).
GCM data Rainfall, snowfall,
surface pressure, air
temperature, specific
humidity, wind speed,
long-wave downward
radiation, shortwave
downward radiation
MRI-AGCM3.2Sd 0.25◦ (∼ 20 km-mesh) 1979–2003, 2015–
2039, 2075–2099
Bias of precipitation data set
has been corrected by multiply-
ing by the monthly correction
coefficient (ratio between basin-
averaged long-term monthly
mean precipitation from WFD
and that from each GCM) for
each GBM basins.
MIROC5 1.41× 1.39◦
MIROC-ESM 2.81× 2.77◦
MRI-CGCM3 1.125× 1.11◦
HadGEM2-ES 1.875× 1.25◦
a HydroSHEDS is Hydrological data and maps based on SHuttle Elevation Derivatives at multiple Scales, b WFD is WATCH forcing data, c GSWP2 is Second Global Soil Wetness Project, d MRI-AGCM is
Meteorological Research Institute-Atmospheric General Circulation Model.
Table 3. Basic information of the streamflow validation stations in the GBM basin.
Basin name Brahmaputra Ganges Meghna
Station name Bahadurabad Pandu Teesta Hardinge Bridge Farakka Bhairab Bazar
Latitude 25.18◦ N 26.13◦ N 25.75◦ N 24.08◦ N 25◦ N 25.75◦ N
Longitude 89.67◦ E 91.7◦ E 89.5◦ E 89.03◦ E 87.92◦ E 89.5◦ E
Drainage area (km2) 583 000 405 000 12 358 907 000 835 000 65 000
Available observed 1980–2001 1975–1979 1969–1992 1980–2001 1949–1973 1980–2001
data period (with missing)
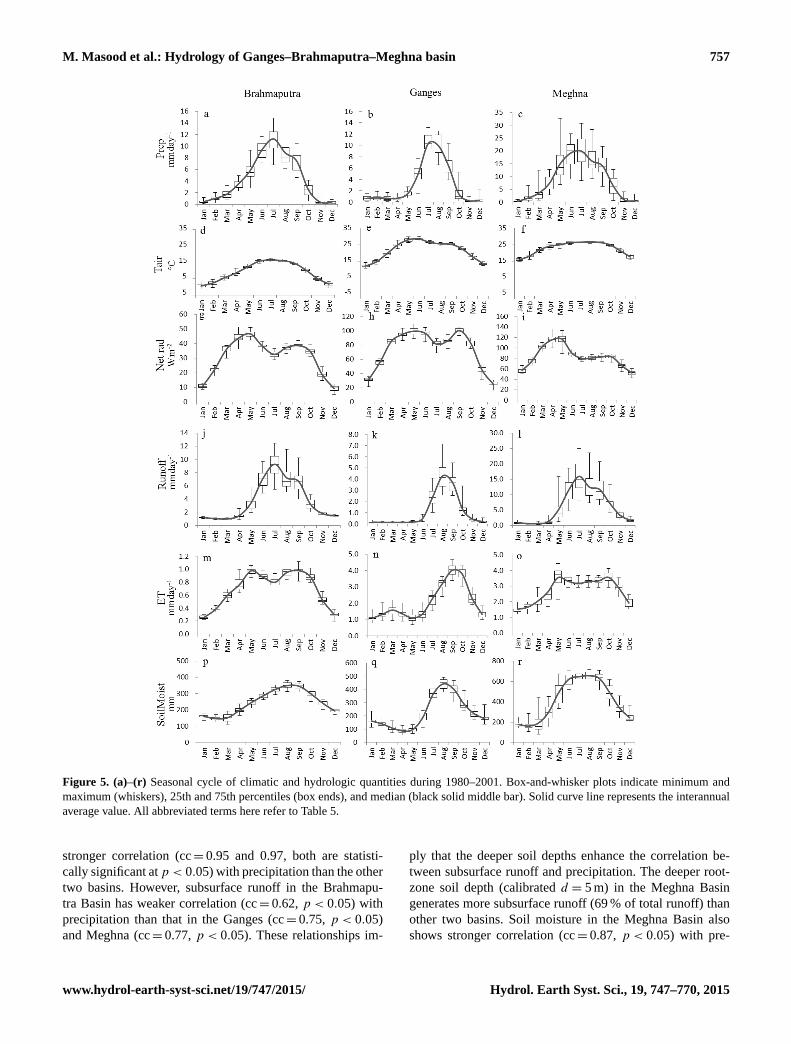
4.1 Seasonal cycle
Figure 5 plots the 22-year (1980–2001) mean seasonal cycles
of the climatic (from WFD forcing) and hydrologic (from
model simulations) quantities averaged over the three basins
(the corresponding mean annual amounts of these variables
are presented in Table 5). Also given in Fig. 5 is the box-and-
whisker plot showing the range of variability for each month.
The interannual variation of precipitation in the Brahma-
putra and Meghna basins is high from May to September
(Fig. 5a, c), whereas in the Ganges it is from June to Oc-
tober. However, the magnitude of precipitation differs sub-
stantially among the three basins. The Meghna Basin has a
significantly higher precipitation than the other two basins
www.hydrol-earth-syst-sci.net/19/747/2015/ Hydrol. Earth Syst. Sci., 19, 747–770, 2015
756 M. Masood et al.: Hydrology of Ganges–Brahmaputra–Meghna basin
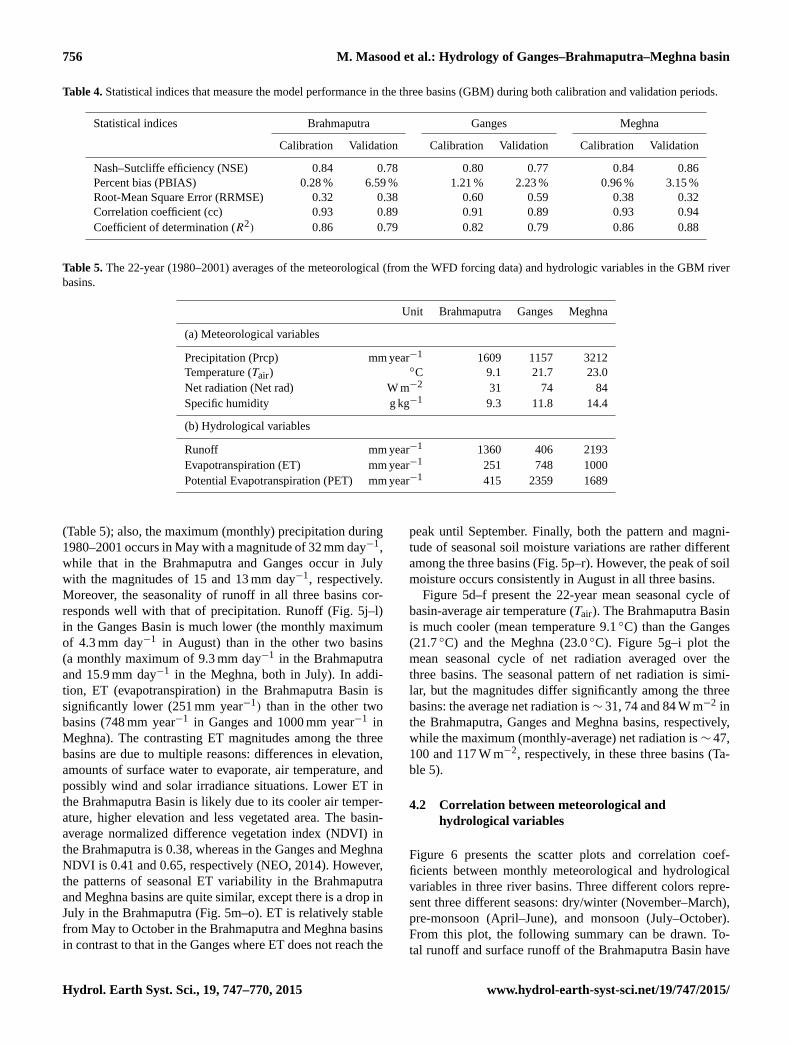
Table 4. Statistical indices that measure the model performance in the three basins (GBM) during both calibration and validation periods.
Statistical indices Brahmaputra Ganges Meghna
Calibration Validation Calibration Validation Calibration Validation
Nash–Sutcliffe efficiency (NSE) 0.84 0.78 0.80 0.77 0.84 0.86
Percent bias (PBIAS) 0.28 % 6.59 % 1.21 % 2.23 % 0.96 % 3.15 %
Root-Mean Square Error (RRMSE) 0.32 0.38 0.60 0.59 0.38 0.32
Correlation coefficient (cc) 0.93 0.89 0.91 0.89 0.93 0.94
Coefficient of determination (R2) 0.86 0.79 0.82 0.79 0.86 0.88
Table 5. The 22-year (1980–2001) averages of the meteorological (from the WFD forcing data) and hydrologic variables in the GBM river
basins.
Unit Brahmaputra Ganges Meghna
(a) Meteorological variables
Precipitation (Prcp) mm year−1 1609 1157 3212
Temperature (Tair)◦C 9.1 21.7 23.0
Net radiation (Net rad) W m−2 31 74 84
Specific humidity g kg−1 9.3 11.8 14.4
(b) Hydrological variables
Runoff mm year−1 1360 406 2193
Evapotranspiration (ET) mm year−1 251 748 1000
Potential Evapotranspiration (PET) mm year−1 415 2359 1689
(Table 5); also, the maximum (monthly) precipitation during
1980–2001 occurs in May with a magnitude of 32 mm day−1,
while that in the Brahmaputra and Ganges occur in July
with the magnitudes of 15 and 13 mm day−1, respectively.
Moreover, the seasonality of runoff in all three basins cor-
responds well with that of precipitation. Runoff (Fig. 5j–l)
in the Ganges Basin is much lower (the monthly maximum
of 4.3 mm day−1 in August) than in the other two basins
(a monthly maximum of 9.3 mm day−1 in the Brahmaputra
and 15.9 mm day−1 in the Meghna, both in July). In addi-
tion, ET (evapotranspiration) in the Brahmaputra Basin is
significantly lower (251 mm year−1) than in the other two
basins (748 mm year−1 in Ganges and 1000 mm year−1 in
Meghna). The contrasting ET magnitudes among the three
basins are due to multiple reasons: differences in elevation,
amounts of surface water to evaporate, air temperature, and
possibly wind and solar irradiance situations. Lower ET in
the Brahmaputra Basin is likely due to its cooler air temper-
ature, higher elevation and less vegetated area. The basin-
average normalized difference vegetation index (NDVI) in
the Brahmaputra is 0.38, whereas in the Ganges and Meghna
NDVI is 0.41 and 0.65, respectively (NEO, 2014). However,
the patterns of seasonal ET variability in the Brahmaputra
and Meghna basins are quite similar, except there is a drop in
July in the Brahmaputra (Fig. 5m–o). ET is relatively stable
from May to October in the Brahmaputra and Meghna basins
in contrast to that in the Ganges where ET does not reach the
peak until September. Finally, both the pattern and magni-
tude of seasonal soil moisture variations are rather different
among the three basins (Fig. 5p–r). However, the peak of soil
moisture occurs consistently in August in all three basins.
Figure 5d–f present the 22-year mean seasonal cycle of
basin-average air temperature (Tair). The Brahmaputra Basin
is much cooler (mean temperature 9.1 ◦C) than the Ganges
(21.7 ◦C) and the Meghna (23.0 ◦C). Figure 5g–i plot the
mean seasonal cycle of net radiation averaged over the
three basins. The seasonal pattern of net radiation is simi-
lar, but the magnitudes differ significantly among the three
basins: the average net radiation is∼ 31, 74 and 84 W m−2 in
the Brahmaputra, Ganges and Meghna basins, respectively,
while the maximum (monthly-average) net radiation is ∼ 47,
100 and 117 W m−2, respectively, in these three basins (Ta-
ble 5).
4.2 Correlation between meteorological and
hydrological variables
Figure 6 presents the scatter plots and correlation coef-
ficients between monthly meteorological and hydrological
variables in three river basins. Three different colors repre-
sent three different seasons: dry/winter (November–March),
pre-monsoon (April–June), and monsoon (July–October).
From this plot, the following summary can be drawn. To-
tal runoff and surface runoff of the Brahmaputra Basin have
Hydrol. Earth Syst. Sci., 19, 747–770, 2015 www.hydrol-earth-syst-sci.net/19/747/2015/
M. Masood et al.: Hydrology of Ganges–Brahmaputra–Meghna basin 757
Figure 5. (a)–(r) Seasonal cycle of climatic and hydrologic quantities during 1980–2001. Box-and-whisker plots indicate minimum and
maximum (whiskers), 25th and 75th percentiles (box ends), and median (black solid middle bar). Solid curve line represents the interannual
average value. All abbreviated terms here refer to Table 5.
stronger correlation (cc= 0.95 and 0.97, both are statisti-
cally significant at p < 0.05) with precipitation than the other
two basins. However, subsurface runoff in the Brahmapu-
tra Basin has weaker correlation (cc= 0.62, p < 0.05) with
precipitation than that in the Ganges (cc= 0.75, p < 0.05)
and Meghna (cc= 0.77, p < 0.05). These relationships im-
ply that the deeper soil depths enhance the correlation be-
tween subsurface runoff and precipitation. The deeper root-
zone soil depth (calibrated d = 5 m) in the Meghna Basin
generates more subsurface runoff (69 % of total runoff) than
other two basins. Soil moisture in the Meghna Basin also
shows stronger correlation (cc= 0.87, p < 0.05) with pre-
www.hydrol-earth-syst-sci.net/19/747/2015/ Hydrol. Earth Syst. Sci., 19, 747–770, 2015
758 M. Masood et al.: Hydrology of Ganges–Brahmaputra–Meghna basin
Brahmaputra Ganges Meghna
dry/winter (November-March)
pre-monsoon (April-June)
monsoon (July-October)
cc: 0.95 cc: 0.83 cc: 0.87
cc: 0.97 cc: 0.86 cc: 0.85
cc: 0.62 cc: 0.75 cc: 0.77
cc: 0.77 cc: 0.82 cc: 0.87
cc: 0.70 cc: 0.45 cc: 0.61
cc: 0.89 cc: 0.29 cc: 0.80
cc: 0.84 cc: 0.59 cc: 0.80
cc: 0.89 cc: 0.34 cc: 0.44
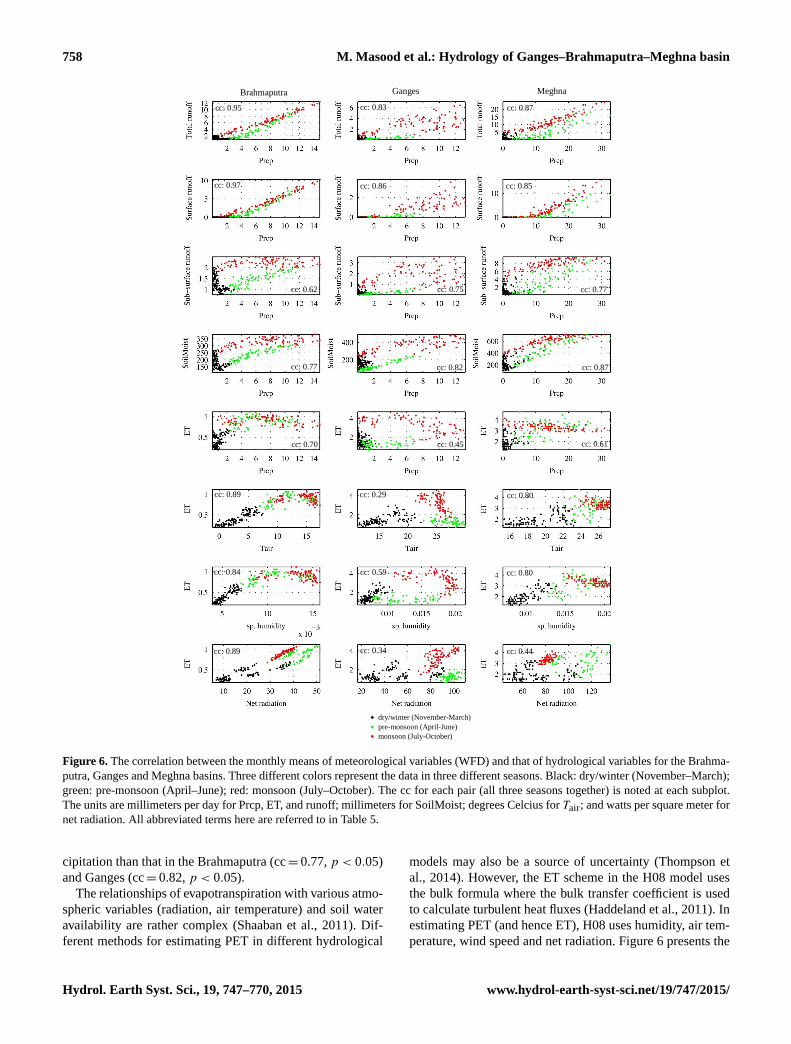
Figure 6. The correlation between the monthly means of meteorological variables (WFD) and that of hydrological variables for the Brahma-
putra, Ganges and Meghna basins. Three different colors represent the data in three different seasons. Black: dry/winter (November–March);
green: pre-monsoon (April–June); red: monsoon (July–October). The cc for each pair (all three seasons together) is noted at each subplot.
The units are millimeters per day for Prcp, ET, and runoff; millimeters for SoilMoist; degrees Celcius for Tair; and watts per square meter for
net radiation. All abbreviated terms here are referred to in Table 5.
cipitation than that in the Brahmaputra (cc= 0.77, p < 0.05)
and Ganges (cc= 0.82, p < 0.05).
The relationships of evapotranspiration with various atmo-
spheric variables (radiation, air temperature) and soil water
availability are rather complex (Shaaban et al., 2011). Dif-
ferent methods for estimating PET in different hydrological
models may also be a source of uncertainty (Thompson et
al., 2014). However, the ET scheme in the H08 model uses
the bulk formula where the bulk transfer coefficient is used
to calculate turbulent heat fluxes (Haddeland et al., 2011). In
estimating PET (and hence ET), H08 uses humidity, air tem-
perature, wind speed and net radiation. Figure 6 presents the
Hydrol. Earth Syst. Sci., 19, 747–770, 2015 www.hydrol-earth-syst-sci.net/19/747/2015/
M. Masood et al.: Hydrology of Ganges–Brahmaputra–Meghna basin 759
correlation of ET with different meteorological variables in
three basins. The ET in the Brahmaputra has a significant cor-
relation with precipitation, air temperature, specific humidity
and net radiation with the cc ranging from 0.70 to 0.89 (all
of which are statistically significant at p < 0.05). The cor-
relations of ET in the Meghna Basin with the meteorologi-
cal variables are also relatively strong (cc ranges from 0.61
to 0.80, p < 0.05) except for the net radiation (cc= 0.44,
p < 0.05). However, ET in the Ganges Basin has a weak cor-
relation with the meteorological variables (cc from 0.29 to
0.59, p < 0.05). A weaker correlation of ET with the mete-
orological variables is likely attributed to the overestimation
of actual ET in the Ganges Basin, because the upstream wa-
ter use (which is larger in the Ganges) may be incorrectly
estimated as ET by the H08 model to ensure water balance.
4.3 Interannual variability
Figure 7 presents the interannual variability of meteorologi-
cal and hydrologic variables from simulations driven by us-
ing five different GCMs and that of the multimodel mean
(shown by the thick blue line) for three basins. It can be seen
from the figure that the magnitude of interannual variations
of variables corresponding to individual GCMs are notice-
ably larger than that of the multimodel mean. However, the
long-term trends in the meteorological and hydrologic vari-
ables of the multimodel mean are generally similar to that of
each of the GCMs. Figure 7a1–a3 shows that the long-term
trend in precipitation is not pronounced in the Brahmaputra
and Meghna basins, but its interannual variability is rather
large for each GCM. Among the five GCMs used, the precipi-
tation of MRI-AGCM3 has the largest interannual variability
(particularly in the Ganges and Meghna basins). A clear in-
creasing trend in air temperature can be observed for all three
basins. As there is strong correlation between precipitation
and runoff (Fig. 6), the interannual variabilities of them are
similar. There is no clear trend for ET in each basin from the
present to the near-future periods. However, in the far-future
period a notable increasing trend is observed for all basins
(Fig. 7e1–e3). Figure 7f1–f3 plots the interannual variabil-
ity of soil moisture. Since there are no clear trends (from the
present to the near-future period) identified for precipitation
and evapotranspiration, the effect of climate change on soil
moisture is not pronounced.
4.4 Projected mean changes
The long-term average seasonal cycles of hydro-
meteorological variables in the two projected periods
(2015–2039 and 2075–2099) were compared with that in the
reference period (1979–2003). All the results presented here
are from the multimodel mean of all simulations driven by
the climate forcing data from five GCMs for both reference
and future periods. The solid lines in Fig. 8 represent the
monthly averages and the dashed lines represent the upper
and lower bounds of the uncertainty bands as determined
from the 10 simulations using the 10 optimal parameter
sets (identified by ranking the NSE). Figure 9 plots the
corresponding percentage changes and Table 6 summarizes
these relative changes in the hydro-meteorological variables
over the three basins on the annual and 6-month (dry season
and wet season) basis.
4.4.1 Precipitation
Considering a high-emissions scenario, by the end of 21st
century the long-term mean precipitation is projected to in-
crease by 16.3, 19.8 and 29.6 % in the Brahmaputra, Ganges
and Meghna basins, respectively (Table 6), in agreement with
previous studies which compared GCM simulation results
over these regions. For example, Immerzeel (2008) estimated
the increase of precipitation in the Brahmaputra Basin as 22
and 14 % under the SRES A2 and B2 scenarios, respectively.
Endo et al. (2012) considered the SRES A1B scenario and es-
timated the country-wise increase in precipitation as 19.7 and
13 % for Bangladesh and India, respectively. Based on the
present study, for the Brahmaputra and Meghna basins, the
changes in precipitation in the dry season (November–April)
are of 23 and 33.6 %, respectively; both are larger than the
change in wet season (May–October) (Brahmaputra: 15.1 %;
Meghna: 29 %) (Fig. 9b, c). However, the change of precipi-
tation in the dry season in the Ganges Basin (3.6 %) is lower
than that in wet season (21.5 %).
4.4.2 Air temperature
The GBM basin will be warmer by about 1 ◦C in the
near-future period (Brahmaputra: 1.2 ◦C; Ganges: 1.0 ◦C;
Meghna: 0.7 ◦C) and by about 4.3 ◦C in the far-future pe-
riod (Brahmaputra: 4.8 ◦C; Ganges: 4.1 ◦C; Meghna: 3.8 ◦C)
(Table 6). According to the projected changes, the cooler
Brahmaputra Basin will be significantly warmer, with the
maximum increase of up to 5.9 ◦C in February (Fig. 9d).
In Immerzeel (2008), the increase of air temperature in the
Brahmaputra Basin is projected (under the SRES A2 and B2
scenarios) as 2.3∼ 3.5 ◦C by the end of 21st century. How-
ever, the rate of increase over the year is not uniform for all
these basins. Temperature will increase more in winter than
in summer (Fig. 9d–f). Therefore, a shorter winter and an
extended spring can be expected in the future of the GBM
basin, which may significantly affect the crop growing sea-
son as well.
4.4.3 Runoff
Long-term mean runoff is projected to increase by 16.2,
33.1 and 39.7 % in the Brahmaputra, Ganges and Meghna
basins, respectively, by the end of the century (Table 6).
Percentage increase of runoff in the Brahmaputra will be
quite large in May (about 36.5 %), which may be due to
the increase of precipitation and also smaller evapotranspi-
www.hydrol-earth-syst-sci.net/19/747/2015/ Hydrol. Earth Syst. Sci., 19, 747–770, 2015

760 M. Masood et al.: Hydrology of Ganges–Brahmaputra–Meghna basin
MIROC-ESM
MIROC5 MRI-CGCM3
HadGEM2-ES
Multi-model mean
MRI-AGCM3.2S
Figure 7. (a1)–(f3) Interannual variation of mean of meteorological and hydrological variables of five GCMs for the present-day (1979–
2003), near-future (2015–2039) and far-future (2075–2099) periods. Thick blue lines represent the means of five GCMs.
ration caused by lower net radiation (Fig. 9g, m). In re-
sponse to seasonally varying degrees of changes in air tem-
perature, net radiation and evaporation, the changes of runoff
in the wet season (May–October) (Brahmaputra: 20.3 %;
Ganges: 36.3 %; Meghna: 41.8 %) are larger than in the
dry season (November–April) (Brahmaputra: 2.9 %, Ganges:
−2.3 %, Meghna: 24.2 %) (Fig. 9j, k). Runoff in the Meghna
Basin shows a larger response to precipitation increase,
which could lead to higher possibility of floods in this basin
and prolonged flooding conditions in Bangladesh. These
findings are in general consistent with previous findings.
Mirza (2002) reported that the probability of occurrence of
20-year floods is expected to be higher in the Brahmaputra
and Meghna rivers than in Ganges river. However, Mirza et
al. (2003) found that future change in the peak discharge of
the Ganges River (as well as the Meghna River) is expected
to be larger than that of the Brahmaputra River.
4.4.4 Evapotranspiration
It can be seen from Fig. 9m–o that the change of ET in
the near-future period is relatively low but increases to be
quite large by the end of the century (Brahmaputra: 16.4 %;
Ganges: 13.6 %; Meghna: 12.9 %). This is due to the in-
crease of net radiation (Brahmaputra: 5.6 %; Ganges: 4.1 %;
Meghna: 4.4 %) as well as the higher air temperature. Fol-
lowing the seasonal patterns of radiation (Fig. 9g–i) and
air temperature (Fig. 9d–f), the change of ET is expected
to be considerably larger in the dry season (November–
April) (Brahmaputra: 25.6 %; Ganges: 19.3 %; Meghna:
18.2 %) than that in wet season (May–October) (Brahmapu-
tra: 12.9 %; Ganges: 10.9 %; Meghna: 10.5 %).
Hydrol. Earth Syst. Sci., 19, 747–770, 2015 www.hydrol-earth-syst-sci.net/19/747/2015/
M. Masood et al.: Hydrology of Ganges–Brahmaputra–Meghna basin 761
CV (cu): 8.8%
CV (nf): 8.9%
CV (ff): 8.7%
CV (cu): 1.9%
CV (nf): 1.9%
CV (ff): 1.8%
CV (cu): 2.1%
CV (nf): 2.1%
CV (ff): 2.0%
CV (cu): 3.2%
CV (nf): 3.0%
CV (ff): 3.1%
CV (cu): 8.7%
CV (nf): 8.4%
CV (ff): 7.6%
CV (cu):6.0%
CV (nf):5.0%
CV (ff):4.5%
CV (cu): 8.0%
CV (nf): 8.0%
CV (ff): 8.0%
CV (cu): 3.8%
CV (nf): 3.9%
CV (ff): 3.9%
CV (cu): 11.2%
CV (nf): 10.7%
CV (ff): 9.9%
CV (cu):30.6%
CV (nf):30.5%
CV (ff):30.2%
CV (cu): 18.2%
CV (nf): 18.2%
CV (ff): 18.0%
CV (cu): 15.8%
CV (nf): 15.4%
CV (ff): 14.4%
mean (cu)
upper and lower bound of uncertainty band (cu) mean (nf)
mean (ff)
upper and lower bound of uncertainty band (nf)
upper and lower bound of uncertainty band (ff)
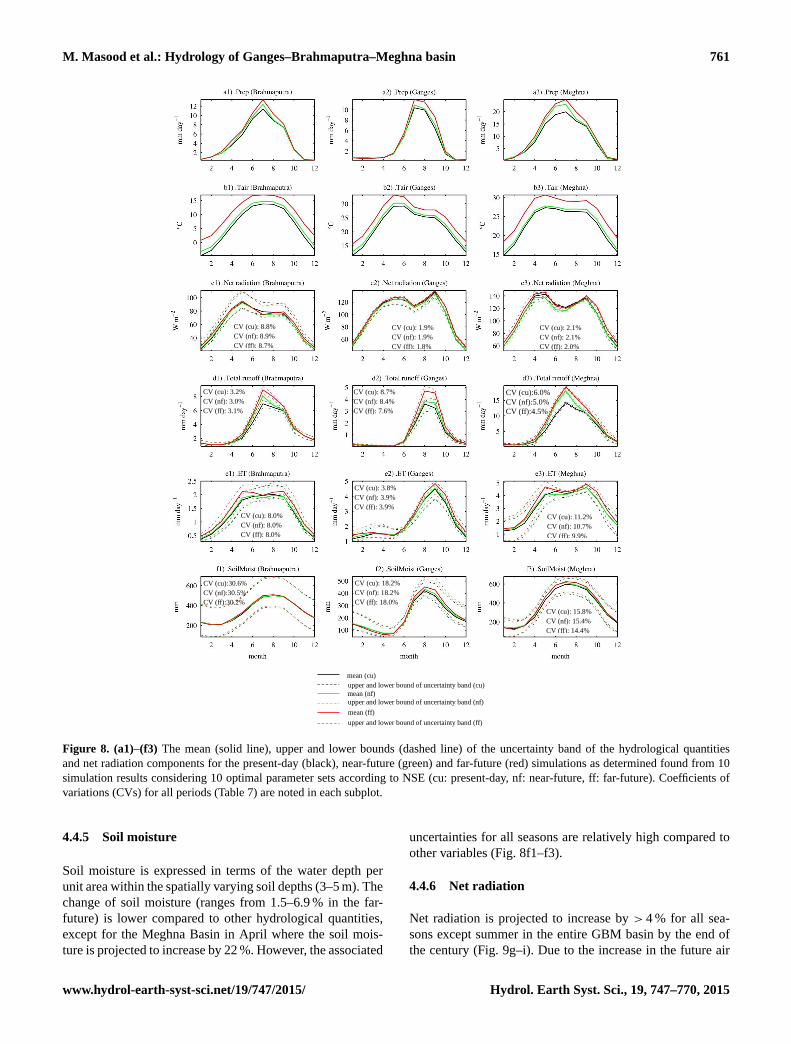
Figure 8. (a1)–(f3) The mean (solid line), upper and lower bounds (dashed line) of the uncertainty band of the hydrological quantities
and net radiation components for the present-day (black), near-future (green) and far-future (red) simulations as determined found from 10
simulation results considering 10 optimal parameter sets according to NSE (cu: present-day, nf: near-future, ff: far-future). Coefficients of
variations (CVs) for all periods (Table 7) are noted in each subplot.
4.4.5 Soil moisture
Soil moisture is expressed in terms of the water depth per
unit area within the spatially varying soil depths (3–5 m). The
change of soil moisture (ranges from 1.5–6.9 % in the far-
future) is lower compared to other hydrological quantities,
except for the Meghna Basin in April where the soil mois-
ture is projected to increase by 22 %. However, the associated
uncertainties for all seasons are relatively high compared to
other variables (Fig. 8f1–f3).
4.4.6 Net radiation
Net radiation is projected to increase by > 4 % for all sea-
sons except summer in the entire GBM basin by the end of
the century (Fig. 9g–i). Due to the increase in the future air
www.hydrol-earth-syst-sci.net/19/747/2015/ Hydrol. Earth Syst. Sci., 19, 747–770, 2015

762 M. Masood et al.: Hydrology of Ganges–Brahmaputra–Meghna basin
Table 6. The 10-simulation average of annual mean and percentage changes of hydrological and meteorological variables.
Variable Period Brahmaputra Ganges Meghna
% change (Tair:◦C) % change (Tair:
◦C) % change (Tair:◦C)
ann
ual
mea
n
dry
seas
on
(Novem
ber
–A
pri
l)
wet
seas
on
(May
–O
cto
ber
)
ann
ual
ann
ual
mea
n
dry
seas
on
(Novem
ber
–A
pri
l)
wet
seas
on
(May
–O
cto
ber
)
ann
ual
ann
ual
mea
n
dry
seas
on
(Novem
ber
–A
pri
l)
wet
seas
on
(May
–O
cto
ber
)
ann
ual
(a) Meteorological variables
Precipitation (mm year−1) present-day (1979–2003) 1632 – – – 1154 – – – 3192 – – –
near-future (2015–2039) 1720 4.2 5.6 5.4 1218 −0.1 6.2 5.6 3598 11.4 12.9 12.7
far-future (2075–2099) 1897 23.0 15.1 16.3 1383 3.6 21.5 19.8 4139 33.6 29.0 29.6
Tair (◦C) present-day (1979–2003) 5.5 – – – 21.7 – – – 23.0 – – –
near-future (2015–2039) 6.7 1.4 1.0 1.2 22.8 1.1 0.9 1.0 23.7 0.8 0.6 0.7
far-future (2075–2099) 10.3 5.5 4.1 4.8 25.9 4.6 3.7 4.1 26.8 4.3 3.4 3.8
Net radiation (W m−2) present-day (1979–2003) 63 – – – 97 – – – 114 – – –
near-future (2015–2039) 62 2.0 −1.6 −0.4 97 −0.2 −0.9 −0.7 112 −0.4 −2.2 −1.5
far-future (2075–2099) 66 10.3 3.1 5.6 101 5.3 3.4 4.1 119 6.5 3.0 4.4
(b) Hydrological variables
Total runoff (mm year−1) present-day (1979–2003) 1166 – – – 372 – – – 1999 – – –
near-future (2015–2039) 1244 0.5 8.6 6.7 414 2.5 12.1 11.3 2380 10.5 20.2 19.1
far-future (2075–2099) 1355 2.9 20.3 16.2 495 −2.3 36.3 33.1 2793 24.2 41.8 39.7
ET (mm year−1) present-day (1979–2003) 467 – – – 785 – – – 1193 – – –
near-future (2015–2039) 477 5.5 0.9 2.1 808 4.9 2.1 3.0 1216 5.2 0.4 1.9
far-future (2075–2099) 543 25.6 12.9 16.4 892 19.3 10.9 13.6 1347 18.2 10.5 12.9
Soil moisture (mm) present-day (1979–2003) 335 – – – 186 – – – 336 – – –
near-future (2015–2039) 338 0.4 1.2 0.9 192 2.7 3.4 3.1 354 6.6 5.1 5.5
far-future (2075–2099) 340 0.2 2.3 1.5 197 0.4 8.3 5.8 359 6.7 6.9 6.9
Table 7. Statistical indices (the CV and SD) of the uncertainty in model simulations due to the uncertainty in model parameters.
Variable Period Brahmaputra Ganges Meghna
Coefficient of Standard deviation Coefficient of Standard deviation Coefficient of Standard deviation
variation (CV) of (SD) of mean variation (CV) of (SD) of mean variation (CV) of (SD) of mean
mean (Fig. 8) (%) (Fig. 8) mean (Fig. 8) (%) (Fig. 8) mean (Fig. 8) (%) (Fig. 8)
Net radiation present-day 8.6 5.4 2.0 2.0 2.1 2.4
near-future 8.6 5.4 1.9 1.9 2.1 2.3
far-future 8.4 5.6 1.8 1.8 2.0 2.4
Total runoff present-day 3.2 0.1 7.6 0.1 6.7 0.4
near-future 3.0 0.1 7.2 0.1 5.4 0.4
far-future 3.1 0.1 6.6 0.1 4.6 0.4
ET present-day 7.9 0.1 3.6 0.1 11.3 0.4
near-future 7.9 0.1 3.7 0.1 10.6 0.4
far-future 7.8 0.1 3.7 0.1 9.7 0.4
Soil moisture present-day 31.0 103.7 18.5 34.5 15.9 53.5
near-future 30.8 104.1 18.5 35.5 15.4 54.5
far-future 30.5 103.7 18.3 36.1 14.4 51.6
temperature, the downward long-wave radiation would in-
crease accordingly and lead to the increase in net radiation.
However, the change of net radiation in the far-future period
is larger in the dry season (Brahmaputra: 10.3 %; Ganges:
5.3 %; Meghna: 6.5 %) than in the wet season (Brahmaputra:
3.1 %; Ganges: 3.4 %; Meghna: 3 %). For the near-future pe-
riod, net radiation is projected to decrease by < 1 % through
almost all seasons due to the smaller increase in air temper-
ature (∼ 1 ◦C) as well as decreased incoming solar radiation
(not shown) in this basin.
4.5 Uncertainty in projection due to model parameters
In recent decades, along with the increasing computational
power there has been a trend towards increasing complexity
Hydrol. Earth Syst. Sci., 19, 747–770, 2015 www.hydrol-earth-syst-sci.net/19/747/2015/
M. Masood et al.: Hydrology of Ganges–Brahmaputra–Meghna basin 763
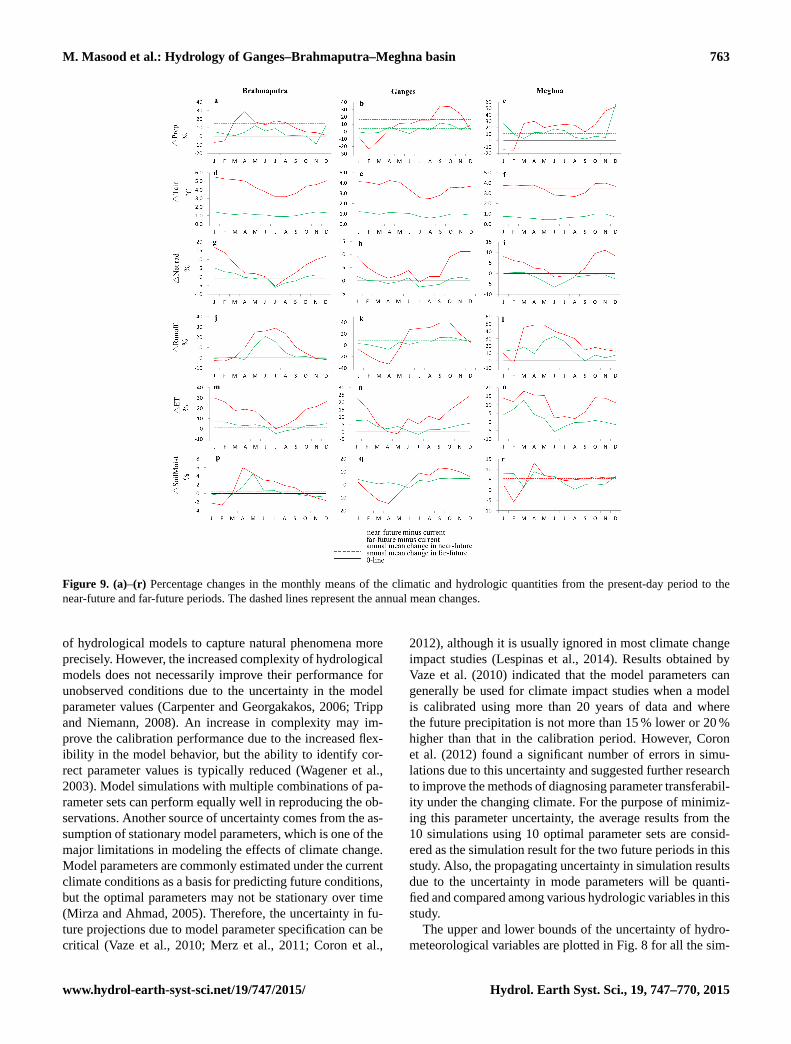
Figure 9. (a)–(r) Percentage changes in the monthly means of the climatic and hydrologic quantities from the present-day period to the
near-future and far-future periods. The dashed lines represent the annual mean changes.
of hydrological models to capture natural phenomena more
precisely. However, the increased complexity of hydrological
models does not necessarily improve their performance for
unobserved conditions due to the uncertainty in the model
parameter values (Carpenter and Georgakakos, 2006; Tripp
and Niemann, 2008). An increase in complexity may im-
prove the calibration performance due to the increased flex-
ibility in the model behavior, but the ability to identify cor-
rect parameter values is typically reduced (Wagener et al.,
2003). Model simulations with multiple combinations of pa-
rameter sets can perform equally well in reproducing the ob-
servations. Another source of uncertainty comes from the as-
sumption of stationary model parameters, which is one of the
major limitations in modeling the effects of climate change.
Model parameters are commonly estimated under the current
climate conditions as a basis for predicting future conditions,
but the optimal parameters may not be stationary over time
(Mirza and Ahmad, 2005). Therefore, the uncertainty in fu-
ture projections due to model parameter specification can be
critical (Vaze et al., 2010; Merz et al., 2011; Coron et al.,
2012), although it is usually ignored in most climate change
impact studies (Lespinas et al., 2014). Results obtained by
Vaze et al. (2010) indicated that the model parameters can
generally be used for climate impact studies when a model
is calibrated using more than 20 years of data and where
the future precipitation is not more than 15 % lower or 20 %
higher than that in the calibration period. However, Coron
et al. (2012) found a significant number of errors in simu-
lations due to this uncertainty and suggested further research
to improve the methods of diagnosing parameter transferabil-
ity under the changing climate. For the purpose of minimiz-
ing this parameter uncertainty, the average results from the
10 simulations using 10 optimal parameter sets are consid-
ered as the simulation result for the two future periods in this
study. Also, the propagating uncertainty in simulation results
due to the uncertainty in mode parameters will be quanti-
fied and compared among various hydrologic variables in this
study.
The upper and lower bounds of the uncertainty of hydro-
meteorological variables are plotted in Fig. 8 for all the sim-
www.hydrol-earth-syst-sci.net/19/747/2015/ Hydrol. Earth Syst. Sci., 19, 747–770, 2015
764 M. Masood et al.: Hydrology of Ganges–Brahmaputra–Meghna basin
ulation periods. It can be seen from the figure that the un-
certainty band of runoff is relatively narrow, which indicates
that future runoff is well predictable through model simula-
tions. The uncertainty due to model parameters in runoff pro-
jection is lower (the CV ranges between 3 and 7.6 % among
three basins) than that of other hydrologic variables (Table 7,
Fig. 8d1–d3). In addition, in Fig. 4e it is observed that there
is no significant uncertainty in simulated peak discharge for
the Brahmaputra and Meghna rivers. Lower uncertainty in
simulating runoff is highly desirable for climate change im-
pact studies; for instance, the flood risk assessment where the
runoff estimate (especially the peak flow) is the main focus.
However, a relatively wide uncertainty band of runoff can be
found in the Ganges Basin during the wet season (Fig. 8d2),
which might be due to the fact that the upstream water use
(diversion) in the Ganges was not well represented in the
model. Notice that the lower uncertainty in runoff projection
relative to other variables could be expected as the model was
calibrated and validated against observed streamflow at the
basin outlet. The uncertainty in ET projection is also lower
(CV: 3.6–11.3 %; SD: 0.1–0.4), which can be related to the
narrower uncertainty band of net radiation (CV: 1.8–8.6 %;
SD: 1.8–5.6). On the other hand, the projection of soil mois-
ture is rather uncertain for all three basins (CV: 14.4–31 %;
SD: 35–104). Large uncertainty in predicting soil moisture
can be a serious issue which is significant in land use man-
agement and agriculture. This emphasizes the critical signifi-
cance of (1) suitable parameterization of soil water physics in
the model, (2) a reliable regional soil map for the specifica-
tion of model parameters, and (3) soil moisture observations
for model calibration and validation.
5 Conclusions
This study presents model analyses of the climate change
impact on the Ganges–Brahmaputra–Meghna (GBM) basin
focusing on (1) the setup of a hydrologic model by integrat-
ing the fine-resolution (∼ 0.5 km) DEM data for the accurate
river network delineation to simulate at relatively fine grid
resolution (10 km) (2) the calibration and validation of the
hydrologic model with long-term observed daily discharge
data and (3) the impacts of future climate changes in the
basin-scale hydrology. The uncertainties in the future projec-
tion stemming from model parameters were also assessed.
The time-slice numerical experiments were performed using
the model forced by the climatic variables from five GCMs
(all participating in the CMIP5) for the present-day (1979–
2003), near-future (2015–2039) and the far-future (2075–
2099) periods.
The following findings and conclusions were drawn from
the model analysis:
– (a) The entire GBM basin is projected to be warmer,
in the range of 1–4.3 ◦C in the near-future and far-
future periods. The cooler Brahmaputra Basin will be
warmer than the Ganges and Meghna. (b) Consider-
ing a high-emissions scenario, by the end of 21st cen-
tury the long-term mean precipitation is projected to in-
crease by+16.3,+19.8 and+29.6 %, and the long-term
mean runoff is projected to increase by +16.2, +33.1
and +39.7 % in the Brahmaputra, Ganges and Meghna
basins, respectively. (c) The change of ET in the near-
future is relatively low, but increases to be quite large
by the end of the century due to the increase of net ra-
diation as well as the higher air temperature. However,
the change will be considerably larger in the dry season
than in the wet season. (d) The change of soil moisture
is lower compared to other hydrological quantities.
– Overall, it is observed that the climate change impact
on the hydrological processes of the Meghna Basin is
larger than that in the other two basins. For example,
in the near-future period runoff in the Meghna Basin
is projected to increase by 19.1 % whereas it is pro-
jected to increase by 6.7 and 11.3 % for the Brahma-
putra and Ganges, respectively. In the far-future period,
a larger increase of precipitation (29.6 %), lower in-
crease of ET (12.9 %) and consequently larger increase
of runoff (39.7 %) lead to a higher possibility of floods
in this basin.
– The uncertainty due to model parameters in runoff pro-
jection is lower than that of other hydrologic variables.
The uncertainty in ET projection is also lower, which
can be related to the narrower uncertainty band of net
radiation. On the other hand, the projection of soil mois-
ture is rather uncertain in all three basins, which can be
significant in land use management and agriculture in
particular. This emphasizes the significance of (1) suit-
able parameterization of soil water physics in the model,
(2) a reliable regional soil map for the specification of
model parameters, and (3) soil moisture observations
for model calibration and validation.
However, this study still has some limitations which can be
addressed in future research. (a) All results presented here are
basin-averaged. The basin-averaged large-scale changes and
trends are difficult to translate to regional- and local-scale
impacts. Moreover, the changes in averages do not reflect the
changes in variability and extremes, (b) anthropogenic and
industrial water use upstream are important factors in alter-
ing the hydrologic cycle; however, they were not considered
in the present study due to data constraints, (c) urbanizing
watersheds are characterized by rapid land use changes and
the associated landscape disturbances can shift the rainfall–
runoff relationships away from natural processes. Hydrolog-
ical changes in future can also be amplified by changing land
uses. However, in our study future changes of demography
and land uses were not considered.
Hydrol. Earth Syst. Sci., 19, 747–770, 2015 www.hydrol-earth-syst-sci.net/19/747/2015/
M. Masood et al.: Hydrology of Ganges–Brahmaputra–Meghna basin 765
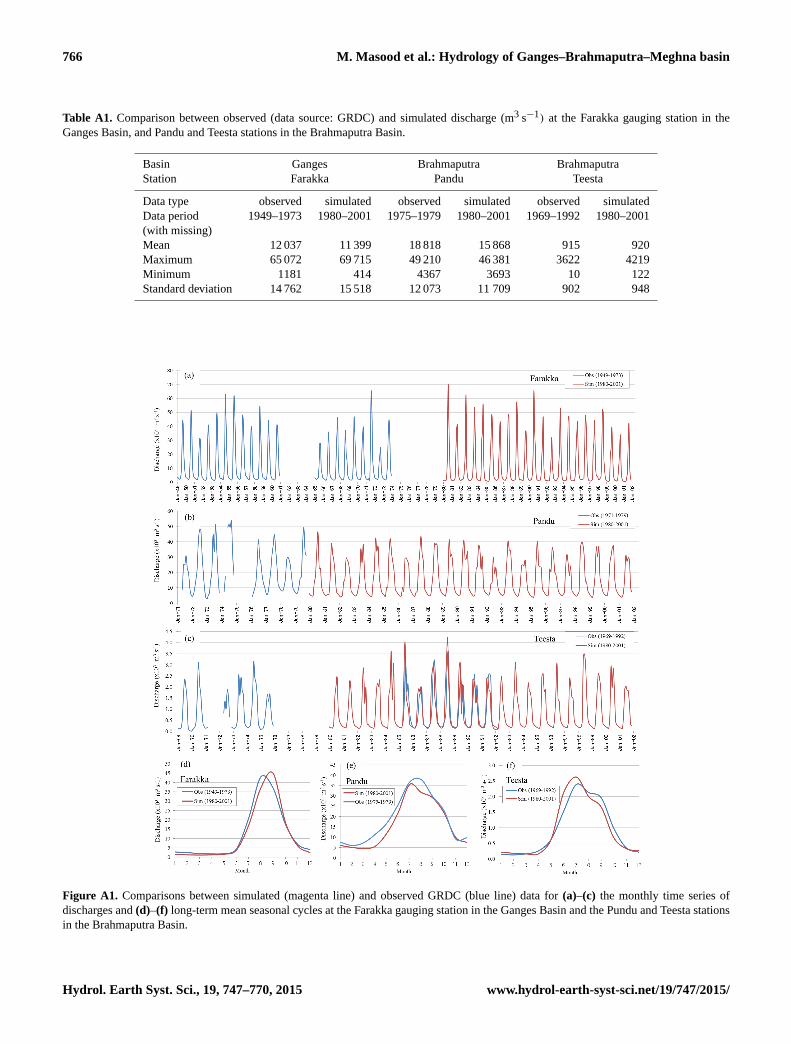
Appendix A: Model validation at three upstream station
The model performance was further evaluated by compar-
ing the simulated monthly streamflow with the observed data
from the Global Runoff Data Centre (GRDC) at three up-
stream gauging stations (Farakka, Pandu and Teesta) in the
GBM basin. The locations and drainage areas of these three
stations are summarized in Table 3. Although the available
data period does not cover the study period 1980–2001 (ex-
cept for the Teesta which has the data from 1985 to 1991),
the mean seasonal cycle and the mean, maximum, minimum,
and the standard deviation of the streamflow are compared in
Fig. A1 and Table A1. It can be seen that the mean seasonal
cycle of simulated streamflow matches well with the corre-
sponding GRDC data (Fig. A1d–f). Also, the agreement of
the simulated and observed 1985–1991 monthly streamflow
at the Teesta station of the Brahmaputra Basin is excellent
(Fig. A1c).
www.hydrol-earth-syst-sci.net/19/747/2015/ Hydrol. Earth Syst. Sci., 19, 747–770, 2015
766 M. Masood et al.: Hydrology of Ganges–Brahmaputra–Meghna basin
Table A1. Comparison between observed (data source: GRDC) and simulated discharge (m3 s−1) at the Farakka gauging station in the
Ganges Basin, and Pandu and Teesta stations in the Brahmaputra Basin.
Basin Ganges Brahmaputra Brahmaputra
Station Farakka Pandu Teesta
Data type observed simulated observed simulated observed simulated
Data period 1949–1973 1980–2001 1975–1979 1980–2001 1969–1992 1980–2001
(with missing)
Mean 12 037 11 399 18 818 15 868 915 920
Maximum 65 072 69 715 49 210 46 381 3622 4219
Minimum 1181 414 4367 3693 10 122
Standard deviation 14 762 15 518 12 073 11 709 902 948
Figure A1. Comparisons between simulated (magenta line) and observed GRDC (blue line) data for (a)–(c) the monthly time series of
discharges and (d)–(f) long-term mean seasonal cycles at the Farakka gauging station in the Ganges Basin and the Pundu and Teesta stations
in the Brahmaputra Basin.
Hydrol. Earth Syst. Sci., 19, 747–770, 2015 www.hydrol-earth-syst-sci.net/19/747/2015/
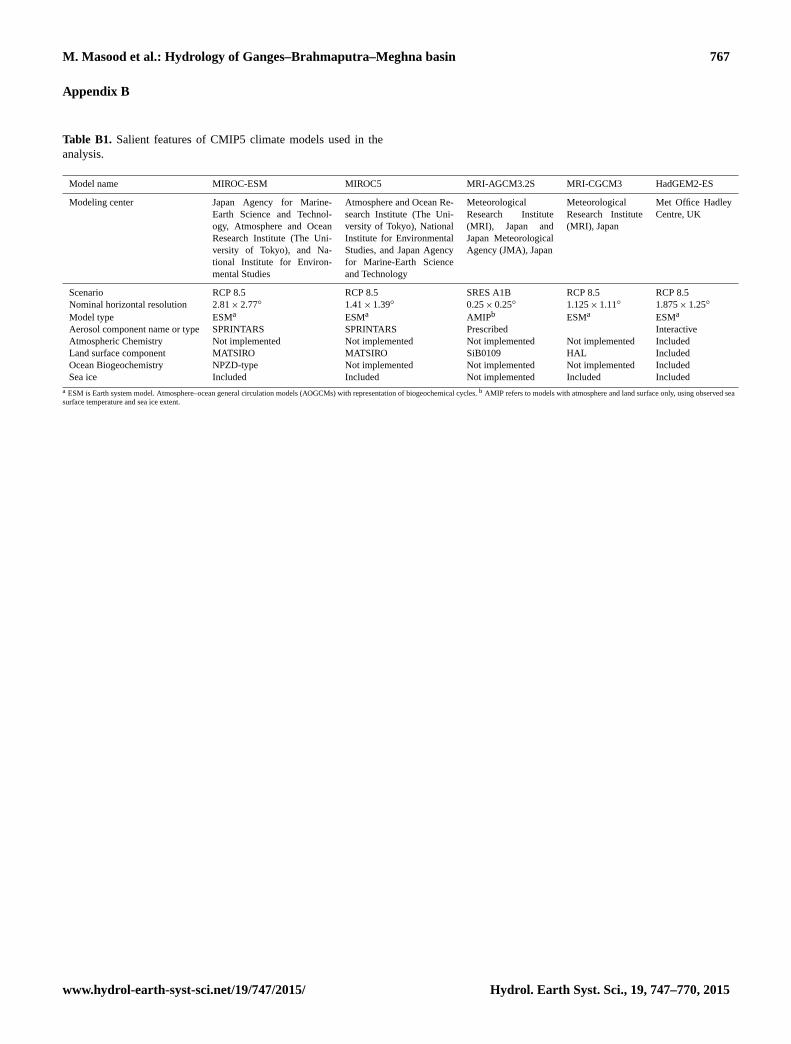
M. Masood et al.: Hydrology of Ganges–Brahmaputra–Meghna basin 767
Appendix B
Table B1. Salient features of CMIP5 climate models used in the
analysis.
Model name MIROC-ESM MIROC5 MRI-AGCM3.2S MRI-CGCM3 HadGEM2-ES
Modeling center Japan Agency for Marine-
Earth Science and Technol-
ogy, Atmosphere and Ocean
Research Institute (The Uni-
versity of Tokyo), and Na-
tional Institute for Environ-
mental Studies
Atmosphere and Ocean Re-
search Institute (The Uni-
versity of Tokyo), National
Institute for Environmental
Studies, and Japan Agency
for Marine-Earth Science
and Technology
Meteorological
Research Institute
(MRI), Japan and
Japan Meteorological
Agency (JMA), Japan
Meteorological
Research Institute
(MRI), Japan
Met Office Hadley
Centre, UK
Scenario RCP 8.5 RCP 8.5 SRES A1B RCP 8.5 RCP 8.5
Nominal horizontal resolution 2.81× 2.77◦ 1.41× 1.39◦ 0.25× 0.25◦ 1.125× 1.11◦ 1.875× 1.25◦
Model type ESMa ESMa AMIPb ESMa ESMa
Aerosol component name or type SPRINTARS SPRINTARS Prescribed Interactive
Atmospheric Chemistry Not implemented Not implemented Not implemented Not implemented Included
Land surface component MATSIRO MATSIRO SiB0109 HAL Included
Ocean Biogeochemistry NPZD-type Not implemented Not implemented Not implemented Included
Sea ice Included Included Not implemented Included Included
a ESM is Earth system model. Atmosphere–ocean general circulation models (AOGCMs) with representation of biogeochemical cycles. b AMIP refers to models with atmosphere and land surface only, using observed sea
surface temperature and sea ice extent.
www.hydrol-earth-syst-sci.net/19/747/2015/ Hydrol. Earth Syst. Sci., 19, 747–770, 2015
768 M. Masood et al.: Hydrology of Ganges–Brahmaputra–Meghna basin
Acknowledgements. This study is supported by the Public Works
Research Institute (PWRI), Japan. The first author is indebted to
the authority of Nippon Koei Co., Ltd., Japan, for the grant from
The Kubota Fund. Also, thanks are given to A. Hasegawa, and
T. Sayama for help in data preparation and for suggestions, and to
the Bangladesh Water Development Board (BWDB) for providing
observed hydrological data. Finally, the authors wish to thank
the editor and five anonymous reviewers for their constructive
comments and suggestions, which greatly improved the quality of
the paper.
Edited by: F. Tian
References
Abrams, P.: River Ganges, available at: http://www.africanwater.
org/ganges.htm (last access date: 13 July 2014), 2003.
Biemans, H., Speelman, L. H., Ludwig, F., Moors, E. J., Wiltshire,
A. J., Kumar, P., Gerten, D., and Kabat, P.: Future water resources
for food production in five South Asian river basins and potential
for adaptation – A modeling study, Sci. Total Environ., 468–469,
Supplement, S117–S131, doi:10.1016/j.scitotenv.2013.05.092,
2013.
BWDB: Rivers of Bangladesh, Bangladesh Water Development
Board, Dhaka, 2012.
Carpenter, T. M. and Georgakakos, K. P.: Intercomparison of
lumped versus distributed hydrologic model ensemble simula-
tions on operational forecast scales, J. Hydrol., 329, 174–185,
doi:10.1016/j.jhydrol.2006.02.013, 2006.
Chowdhury, M. R.: An Assessment of Flood Forecasting in
Bangladesh: The Experience of the 1998 Flood, Nat. Hazards,
139–163, 2000.
Chowdhury, M. R. and Ward, M. N.: Hydro-meteorological vari-
ability in the greater Ganges-Brahmaputra-Meghna basins, Int.
J. Climatol., 24, 1495–1508, doi:10.1002/joc.1076, 2004.
Chowdhury, M. R. and Ward, M. N.: Seasonal flooding in
Bangladesh – variability and predictability, Hydrol. Process., 21,
335–347, doi:10.1002/hyp.6236, 2007.
Coron, L., Andréassian, V., Perrin, C., Lerat, J., Vaze, J.,
Bourqui, M., and Hendrickx, F.: Crash testing hydrological
models in contrasted climate conditions: An experiment on
216 Australian catchments, Water Resour. Res., 48, W05552,
doi:10.1029/2011wr011721, 2012.
Endo, H., Kitoh, A., Ose, T., Mizuta, R., and Kusunoki, S.: Fu-
ture changes and uncertainties in Asian precipitation simulated
by multiphysics and multi–sea surface temperature ensemble ex-
periments with high-resolution Meteorological Research Insti-
tute atmospheric general circulation models (MRI-AGCMs), J.
Geophys. Res., 117, D16118, doi:10.1029/2012jd017874, 2012.
FAO-AQUASTAT: Ganges–Brahmaputra–Meghna River Basin,
available at: http://www.fao.org/nr/water/aquastat/basins/gbm/
index.stm, last access: 19 April 2014.
Gain, A. K., Immerzeel, W. W., Sperna Weiland, F. C., and
Bierkens, M. F. P.: Impact of climate change on the stream flow
of the lower Brahmaputra: trends in high and low flows based
on discharge-weighted ensemble modelling, Hydrol. Earth Syst.
Sci., 15, 1537–1545, doi:10.5194/hess-15-1537-2011, 2011.
Ghosh, S. and Dutta, S.: Impact of climate change on flood
characteristics in Brahmaputra basin using a macro-scale dis-
tributed hydrological model, J. Earth Syst. Sci., 121, 637–657,
doi:10.1007/s12040-012-0181-y, 2012.
Haddeland, I., Clark, D. B., Franssen, W., Ludwig, F., Voß, F.,
Arnell, N. W., Bertrand, N., Best, M., Folwell, S., Gerten, D.,
Gomes, S., Gosling, S. N., Hagemann, S., Hanasaki, N., Harding,
R., Heinke, J., Kabat, P., Koirala, S., Oki, T., Polcher, J., Stacke,
T., Viterbo, P., Weedon, G. P., and Yeh, P.: Multimodel Estimate
of the Global Terrestrial Water Balance: Setup and First Results,
J. Hydrometeorol., 12, 869–884, doi:10.1175/2011jhm1324.1,
2011.
Haddeland, I., Heinke, J., Voß, F., Eisner, S., Chen, C., Hagemann,
S., and Ludwig, F.: Effects of climate model radiation, humidity
and wind estimates on hydrological simulations, Hydrol. Earth
Syst. Sci., 16, 305–318, doi:10.5194/hess-16-305-2012, 2012.
Hanasaki, N., Kanae, S., Oki, T., Masuda, K., Motoya, K., Shi-
rakawa, N., Shen, Y., and Tanaka, K.: An integrated model for
the assessment of global water resources – Part 1: Model descrip-
tion and input meteorological forcing, Hydrol. Earth Syst. Sci.,
12, 1007–1025, doi:10.5194/hess-12-1007-2008, 2008.
Hanasaki, N., Saito, Y., Chaiyasaen, C., Champathong, A.,
Ekkawatpanit, C., Saphaokham, S., Sukhapunnaphan, T.,
Sumdin, S., and Thongduang, J.: A quasi-real-time hydrological
simulation of the Chao Phraya River using meteorological data
from the Thai Meteorological Department Automatic Weather
Stations, Hydrol. Res. Lett., 8, 9–14, doi:10.3178/hrl.8.9, 2014.
Hydrological data and maps based on SHuttle Elevation Deriva-
tives at multiple Scales, available at: http://hydrosheds.cr.usgs.
gov/hydro.php, last access: 19 April 2014.
Immerzeel, W.: Historical trends and future predictions of climate
variability in the Brahmaputra basin, I. J. Climatol., 28, 243–254,
doi:10.1002/joc.1528, 2008.
Inomata, H., Takeuchi, K., and Fukami, K.: Development of
a Statistical Bias Correction Method For Daily Precipitation
Data of GCM20, J. Japan Soc. Civil Eng., 67, I_247–I_252,
doi:10.2208/jscejhe.67.I_247, 2011.
Islam, A. S., Haque, A., and Bala, S. K.: Hydrologic characteris-
tics of floods in Ganges-Brahmaputra-Meghna (GBM) delta, Nat.
Hazards, 54, 797–811, 2010.
IWM: Updating and Validation of North West Region Model
(NWRM), Institute of Water Modelling, Bangladesh, 2006.
Kamal-Heikman, S., Derry, L. A., Stedinger, J. R., and Duncan, C.
C.: A Simple Predictive Tool for Lower Brahmaputra River Basin
Monsoon Flooding, Earth Inter., 11, 1–11, doi:10.1175/ei226.1,
2007.
Kamal, R., Matin, M. A., and Nasreen, S.: Response of River
Flow Regime to Various Climate Change Scenarios in Ganges-
Brahmaputra- Meghna Basin, J. Water Resour. Ocean Sci., 2, 15–
24, doi:10.11648/j.wros.20130202.12, 2013.
Kwak, Y., Takeuchi, K., Fukami, K., and Magome, J.: A new
approach to flood risk assessment in Asia-Pacific region
based on MRI-AGCM outputs, Hydrol. Res. Lett., 6, 70–75,
doi:10.3178/HRL.6.70, 2012.
Lehner, B., Liermann, C. R., Revenga, C., Vörösmarty, C., Fekete,
B., Crouzet, P., Döll, P., Endejan, M., Frenken, K., Magome, J.,
Nilsson, C., Robertson, J. C., Rödel, R., Sindorf, N., and Wisser,
D.: High-resolution mapping of the world’s reservoirs and dams
Hydrol. Earth Syst. Sci., 19, 747–770, 2015 www.hydrol-earth-syst-sci.net/19/747/2015/
M. Masood et al.: Hydrology of Ganges–Brahmaputra–Meghna basin 769
for sustainable river-flow management, Frontiers in Ecology and
the Environment, 9, 494–502, doi:10.1890/100125, 2011.
Lehner, B., Verdin, K., and Jarvis, A.: HydroSHEDS technical doc-
umentation v1.0, World Wildlife Fund US, Washington, DC, 1–
27, 2006.
Lespinas, F., Ludwig, W., and Heussner, S.: Hydrological
and climatic uncertainties associated with modeling the
impact of climate change on water resources of small
Mediterranean coastal rivers, J. Hydrol., 511, 403–422,
doi:10.1016/j.jhydrol.2014.01.033, 2014.
Lucas-Picher, P., Christensen, J. H., Saeed, F., Kumar, P., Asharaf,
S., Ahrens, B., Wiltshire, A. J., Jacob, D., and Hagemann, S.: Can
Regional Climate Models Represent the Indian Monsoon?, J. Hy-
drometeorol., 12, 849–868, doi:10.1175/2011jhm1327.1, 2011.
Manabe, S.: Climate and the ocean circulation – 1: The atmo-
spheric circulation and the hydrology of the Earth’s surface,
Mon. Weather Rev., 97, 739–774, 1969.
Merz, R., Parajka, J., and Blöschl, G.: Time stability of catchment
model parameters: Implications for climate impact analyses,
Water Resour. Res., 47, W02531, doi:10.1029/2010wr009505,
2011.
Mirza, M. M. Q., Warrick, R. A., Ericksen, N. J., and Kenny, G. J.:
Trends and persistence in precipitation in the Ganges, Brahmapu-
tra and Meghna river basins, Hydrol. Sci. J., 43, 345–858, 1998.
Mirza, M. M. Q.: Global warming and changes in the probability
ofoccurrence of floods in Bangladesh and implications, Global
Environ. Change, 12, 127–138, 2002.
Mirza, M. M. Q.: Three Recent Extreme Floods in Bangladesh:
A Hydro-Meteorological Analysis, Nat. Hazards, 28, 35–64,
doi:10.1023/A:1021169731325, 2003.
Mirza, M. M. Q., Warrick, R. A., and Ericksen, N. J.: The impli-
cations of climate change on floods of the Ganges, Brahmaputra
and Meghna rivers in Bangladesh, Clim. Change, 57, 287–318,
2003.
Mirza, M. M. Q. and Ahmad, Q. K.: Climate Change And Water
Resources, in: South Asia, edited by: Monirul Qader Mirza, M.,
Q. K. A., A. A. Balkema Publishers, Leiden, the Netherlands,
2005.
Mizuta, R., Yoshimura, H., Murakami, H., Matsueda, M., Endo, H.,
Ose, T., Kamiguchi, K., Hosaka, M., Sugi, M., Yukimoto, S.,
Kusunoki, S., and Kitoh, A.: Climate Simulations Using MRI-
AGCM3.2 with 20-km Grid, J. Meteorol. Soc. Japan, 90A, 233–
258, doi:10.2151/jmsj.2012-A12, 2012.
Nash, J. E. and Sutcliffe, J. V.: River flow forecasting through con-
ceptual models part I – a discussion of principles, J. Hydrol., 10,
282–290, 1970.
NEO: Vegetation Index [NDVI] (1 Month - Terra/Modis), available
at: http://neo.sci.gsfc.nasa.gov/view.php?datasetId=MOD13A2_
M_NDVI&year=2000, last access: 19 April 2014.
Nishat, A. and Faisal, I. M.: An assessment of the Institutional
Mechanism for Water Negotiations in the Ganges–Brahmaputra–
Meghna system, Int. Negotiations, 5, 289–310, 2000.
Nishat, B. and Rahman, S. M. M.: Water Resources Modeling of
the Ganges-Brahmaputra-Meghna River Basins Using Satellite
Remote Sensing Data, JAWRA J. Am. Water Resour. Assoc., 45,
1313–1327, doi:10.1111/j.1752-1688.2009.00374.x, 2009.
Oki, T. and Sud, Y. C.: Design of Total Runoff Integrating Pathways
(TRIP)-A Global River Channel Network, Earth Inter., 2, EI013,
1998.
Pfly: Ganges-Brahmaputra-Meghna basins.jpg, available at: http:
//en.wikipedia.org/wiki/File:Ganges-Brahmaputra-Meghna_
basins.jpg# (last access: April 2014), 2011.
Pokhrel, Y., Hanasaki, N., Koirala, S., Cho, J., Yeh, P. J. F., Kim, H.,
Kanae, S., and Oki, T.: Incorporating Anthropogenic Water Reg-
ulation Modules into a Land Surface Model, J. Hydrometeorol.,
13, 255–269, doi:10.1175/jhm-d-11-013.1, 2012.
Rahman, M. M., Ferdousi, N., Sato, Y., Kusunoki, S., and Kitoh,
A.: Rainfall and temperature scenario for Bangladesh using 20
km mesh AGCM, International J. Clim. Change Strat. Manage.,
4, 66–80, doi:10.1108/17568691211200227, 2012.
Sevat, E. and Dezetter, A.: Selection of calibration objective func-
tions in the context of rainfall-runoff modeling in a Sudanese
savannah area, Hydrological Sci. J., 36, 307–330, 1991.
Shaaban, A. J., Amin, M. Z. M., Chen, Z. Q., and Ohara, N.:
Regional Modeling of Climate Change Impact on Peninsular
Malaysia Water Resources, J. Hydrol. Eng., 16, 1040–1049,
doi:10.1061/(ASCE)HE.1943-5584.0000305, 2011.
Siderius, C., Biemans, H., Wiltshire, A., Rao, S., Franssen, W.
H., Kumar, P., Gosain, A. K., van Vliet, M. T., and Collins,
D. N.: Snowmelt contributions to discharge of the Ganges,
The Sci. Total Environ., 468–469 Supplement, S93–S101,
doi:10.1016/j.scitotenv.2013.05.084, 2013.
Taylor, K. E., Stouffer, R. J., and Meehl, G. A.: An overview of
CMIP5 and the experimental design, B. Am. Meteorol. Soc., 93,
485–498, doi:10.1175/BAMS-D-11-00094.1, 2012.
Tateishi, R., Hoan, N. T., Kobayashi, T., Alsaaideh, B.,
Tana, G., and Phong, D. X.: Production of Global Land
Cover Data – GLCNMO2008, J. Geogr. Geol., 6, 99–122,
doi:10.5539/jgg.v6n3p99, 2014.
Thompson, J. R., Green, A. J., and Kingston, D. G.: Potential
evapotranspiration-related uncertainty in climate change impacts
on river flow: An assessment for the Mekong River basin, J. Hy-
drol., 510, 259–279, doi:10.1016/j.jhydrol.2013.12.010, 2014.
Tripp, D. R. and Niemann, J. D.: Evaluating the parame-
ter identifiability and structural validity of a probability-
distributed model for soil moisture, J. Hydrol., 353, 93–108,
doi:10.1016/j.jhydrol.2008.01.028, 2008.
Vaze, J., Post, D. A., Chiew, F. H. S., Perraud, J. M., Viney, N.
R., and Teng, J.: Climate non-stationarity – Validity of calibrated
rainfall–runoff models for use in climate change studies, J. Hy-
dro., 394, 447–457, doi:10.1016/j.jhydrol.2010.09.018, 2010
Wagener, T., McIntyre, N., Lees, M. J., Wheater, H. S., and Gupta,
H. V.: Towards reduced uncertainty in conceptual rainfall-runoff
modelling: dynamic identifiability analysis, Hydrol. Process., 17,
455–476, doi:10.1002/hyp.1135, 2003.
Weedon, G. P., Gomes, S., Viterbo, P., Österle, H., Adam,
J. C., Bellouin, N., Boucher, O., and Best, M.: The
watch forcing data 1958–2001: A meteorological forc-
ing dataset for land surface- and hydrological-models,
WATCH Technical Report No. 22, available at: url:http:
//www.eu-watch.org/media/default.aspx/emma/org/10376311/
WATCH+Technical+Report+Number+22+The+WATCH+
forcing+data+1958-2001+A+meteorological+forcing+dataset+
for+land+surface-+and+hydrological-models.pdf, 22, 1–41,
2010.
www.hydrol-earth-syst-sci.net/19/747/2015/ Hydrol. Earth Syst. Sci., 19, 747–770, 2015

770 M. Masood et al.: Hydrology of Ganges–Brahmaputra–Meghna basin
Weedon, G. P., Gomes, S., Viterbo, P., Shuttleworth, J., Blyth, E.,
Osterle, H., Adam, J. C., Bellouin, N., Boucher, O., and Best,
M.: Creation of the WATCH Forcing Data and its use to as-
sess global and regional reference crop evaporation over land
during the twentieth century, J. Hydrometeorol., 12, 823–848,
doi:10.1175/2011JHM1369.1, 2011.
Yatagai, A., Kamiguchi, K., Arakawa, O., Hamada, A., Yasutomi,
N., and Kitoh, A.: APHRODITE: Constructing a Long-Term
Daily Gridded Precipitation Dataset for Asia Based on a Dense
Network of Rain Gauges, B. Am. Meteorol. Soc., 93, 1401–1415,
doi:10.1175/BAMS-D-11-00122.1, 2012.
Hydrol. Earth Syst. Sci., 19, 747–770, 2015 www.hydrol-earth-syst-sci.net/19/747/2015/
Related Documents