Model–Free Visualization of Suspicious Lesions in Breast MRI Based on Supervised and Unsupervised Learning Thorsten Twellmann a,b,c , Anke Meyer-Baese a , Oliver Lange a , Simon Foo a , and Tim W. Nattkemper b a Department of Electrical and Computer Engineering, Florida State University, Tallahassee, Florida 32310-6046 b Applied Neuroinformatics Group, Faculty of Technology, Bielefeld University, Bielefeld 33501, Germany c Biomedical Image Analysis Group, Department of Biomedical Engineering, Eindhoven University of Technology, the Netherlands Abstract Dynamic contrast-enhanced magnetic resonance imaging (DCE-MRI) has become an important tool in breast cancer diagnosis, but evaluation of multitemporal 3D image data holds new challenges for human observers. To aid the image analysis process, we apply supervised and unsupervised pattern recognition techniques for computing enhanced visualizations of suspicious lesions in breast MRI data. These techniques represent an important component of future sophisticated computer-aided diagnosis (CAD) systems and support the visual exploration of spatial and temporal features of DCE- MRI data stemming from patients with confirmed lesion diagnosis. By taking into account the heterogeneity of cancerous tissue, these techniques reveal signals with malignant, benign and normal kinetics. They also provide a regional subclassification of pathological breast tissue, which is the basis for pseudo-color presentations of the image data. Intelligent medical systems are expected to have substantial implications in healthcare politics by contributing to the diagnosis of indeterminate breast lesions by non-invasive imaging. Keywords Classification; clustering; computer–aided diagnosis; magnetic resonance imaging; breast 1 Introduction Breast cancer is the most common malignant disease among women, but has an encouraging cure rate if diagnosed in an early stage. Thus, early detection of breast cancer continues to be the key for effective treatment. Dynamic contrast-enhanced magnetic resonance imaging (DCE-MRI) has become a valuable tool for detection, diagnosis and management of breast cancer [1–3]. Yet, interpretation of the multitemporal 3D image data poses new challenges to radiologists. Email address: [email protected] (Thorsten Twellmann). Publisher's Disclaimer: This is a PDF file of an unedited manuscript that has been accepted for publication. As a service to our customers we are providing this early version of the manuscript. The manuscript will undergo copyediting, typesetting, and review of the resulting proof before it is published in its final citable form. Please note that during the production process errors may be discovered which could affect the content, and all legal disclaimers that apply to the journal pertain. NIH Public Access Author Manuscript Eng Appl Artif Intell. Author manuscript; available in PMC 2009 March 1. Published in final edited form as: Eng Appl Artif Intell. 2008 March ; 21(2): 129–140. doi:10.1016/j.engappai.2007.04.005. NIH-PA Author Manuscript NIH-PA Author Manuscript NIH-PA Author Manuscript

Welcome message from author
This document is posted to help you gain knowledge. Please leave a comment to let me know what you think about it! Share it to your friends and learn new things together.
Transcript

Model–Free Visualization of Suspicious Lesions in Breast MRIBased on Supervised and Unsupervised Learning
Thorsten Twellmanna,b,c, Anke Meyer-Baesea, Oliver Langea, Simon Fooa, and Tim W.Nattkemperb
aDepartment of Electrical and Computer Engineering, Florida State University, Tallahassee, Florida32310-6046 bApplied Neuroinformatics Group, Faculty of Technology, Bielefeld University, Bielefeld 33501,Germany cBiomedical Image Analysis Group, Department of Biomedical Engineering, Eindhoven Universityof Technology, the Netherlands
AbstractDynamic contrast-enhanced magnetic resonance imaging (DCE-MRI) has become an important toolin breast cancer diagnosis, but evaluation of multitemporal 3D image data holds new challenges forhuman observers. To aid the image analysis process, we apply supervised and unsupervised patternrecognition techniques for computing enhanced visualizations of suspicious lesions in breast MRIdata. These techniques represent an important component of future sophisticated computer-aideddiagnosis (CAD) systems and support the visual exploration of spatial and temporal features of DCE-MRI data stemming from patients with confirmed lesion diagnosis. By taking into account theheterogeneity of cancerous tissue, these techniques reveal signals with malignant, benign and normalkinetics. They also provide a regional subclassification of pathological breast tissue, which is thebasis for pseudo-color presentations of the image data. Intelligent medical systems are expected tohave substantial implications in healthcare politics by contributing to the diagnosis of indeterminatebreast lesions by non-invasive imaging.
KeywordsClassification; clustering; computer–aided diagnosis; magnetic resonance imaging; breast
1 IntroductionBreast cancer is the most common malignant disease among women, but has an encouragingcure rate if diagnosed in an early stage. Thus, early detection of breast cancer continues to bethe key for effective treatment. Dynamic contrast-enhanced magnetic resonance imaging(DCE-MRI) has become a valuable tool for detection, diagnosis and management of breastcancer [1–3]. Yet, interpretation of the multitemporal 3D image data poses new challenges toradiologists.
Email address: [email protected] (Thorsten Twellmann).Publisher's Disclaimer: This is a PDF file of an unedited manuscript that has been accepted for publication. As a service to our customerswe are providing this early version of the manuscript. The manuscript will undergo copyediting, typesetting, and review of the resultingproof before it is published in its final citable form. Please note that during the production process errors may be discovered which couldaffect the content, and all legal disclaimers that apply to the journal pertain.
NIH Public AccessAuthor ManuscriptEng Appl Artif Intell. Author manuscript; available in PMC 2009 March 1.
Published in final edited form as:Eng Appl Artif Intell. 2008 March ; 21(2): 129–140. doi:10.1016/j.engappai.2007.04.005.
NIH
-PA Author Manuscript
NIH
-PA Author Manuscript
NIH
-PA Author Manuscript
In DCE-MRI, multiple 3D T1-weighted magnetic resonance (MR) images of both breasts areacquired over a period of five to nine minutes while a contrast agent (CA) passes through thebreast tissue. A typical sequence of images consists of one precontrast image acquired beforeinjection of a CA bolus and a series of postcontrast images recorded afterwards over 1. Thus,a time–series signal, i.e. a vector reflecting the local signal intensities at the time points ofimage acquisition, is associated with each voxel. Due to characteristic changes in the structureof benign and malignant tissue influencing the flux of CA molecules between the blood pooland tissue, characteristic time–series signals can be observed for different tissue types.Interpretation of these time-series signals allows for detecting cancer with high sensitivity,even in the radio-opaque breast of young women, as well as for assessing the type of disordersin a non-invasive fashion. However, while the presence of a suspicious tissue disorder canalready be identified by means of a strong signal enhancement in an early postcontrast image,the course of the entire time–series signal has to be considered for differentiating benign andmalignant tissue (Figure 1) 2 [4].
In conventional X-ray mammography, computer-aided diagnosis (CAD) systems are beingdeveloped to expedite diagnostic and screening activities and are today moving from researchto application in daily clinical practice. With breast cancer being an issue of enormous clinicalimportance with obvious implications to healthcare politics, much effort is spent today onresearch of similar techniques to aid or even automate diagnosis in breast MRI. The computerassisted interpretation of time–series signals as measured during a DCE-MRI examination foreach image voxel represents one of the major steps in designing CAD systems for breast MRI.Kuhl et al. have shown that the shape of the time–series signals represents an important criterionin differentiating benign and malignant masses [4]. The results indicate that the enhancementkinetics, as represented by the time–series signals visualized in Figure 2, differ significantlyfor benign and malignant enhancing lesions and thus represent a basis for differential diagnosis:Plateau or washout-time courses (type II or III) prevail in cancerous tissue. Steadily progressivesignal intensity time courses (type I) are exhibited by benign enhancing lesions, albeit theseenhancement kinetics are shared not only by benign tumors but also by fibrocystic changes.
Even though the time–series signals enable radiologists to infer information about the tissuestate, assessing the signal characteristics is a time-consuming task which needs experience andexpertise. It becomes further complicated due to the heterogeneity of lesion tissue causing thesignal characteristics to vary spatially. Also these spatial variations of signal characteristicsreflect specific tissue properties and should be taken into account for assessing the state oflesions. Different computerized approaches have been proposed for enhanced visualization ofthe multitemporal image data, facilitating the assessment of the spatio-temporal appearancepatterns of lesions. Pixel-mapping functions are used to map individual time–series signals topseudo-colors which reflect dedicated features of the temporal signal. These signal featuresare derived from explicit mathematical models of the time–series signals, like in the three–time–points (3TP) method [14] illustrated in Figure 3, or from more sophisticatedpharmacokinetic models [16–18] describing the exchange of CA molecules between tissuecompartments over time. Beside these model-based approaches, an increasing number ofapplications apply pattern recognition methods to extract and to visually appreciate clinicallyrelevant information [5–11,13]. The conceptual difference between the application of patternrecognition methods like artificial neural networks or machine learning algorithms and model-based approaches is that the latter presuppose explicitly formulated models of the signaldomain, while in the former implicit signal models are derived during a data-driven adaptationprocess from the measured data themselves.
1The exact number of postcontrast images and their temporal spacing depends on the imaging protocol and typically varies from clinicalsite to site.2Color figures are also provided in digital form in a supplemental PDF file.
Twellmann et al. Page 2
Eng Appl Artif Intell. Author manuscript; available in PMC 2009 March 1.
NIH
-PA Author Manuscript
NIH
-PA Author Manuscript
NIH
-PA Author Manuscript
In this article, two approaches for computing enhanced visualizations of lesions based onsupervised and unsupervised pattern recognition techniques are investigated. The proposedapproaches focus strictly on the observed MRI time–series signals and allow for an initiallymodel–free and data–driven segmentation of manually marked region-of-interests (ROIs)enclosing suspiciously enhancing areas of tissue. Automatic selection of such ROIs is possible(see e.g. [26,12]), but not in the scope of this work. The time–series signals underlying themarked voxels are analyzed with respect to fine–grained differences in the amplitude anddynamics. In the supervised approach, the signals are classified by a multi-class support vectormachine (MSVM) into a set of predefined tissue classes. In the unsupervised approach, a fuzzy-clustering (FC) based on deterministic annealing is applied for grouping voxels with respectto similarities between the underlying time–series signals. In either case, the outcome of thevoxel-by-voxel assessment of tissue is depicted as a pseudo-color overlay e.g. in the precontrastimage. Therewith, temporal and spatial tissue characteristics of individual voxels or largersegments can be observed by means of a single 3D color image.
The inspection of these pseudo-color images represents an unique practical tool forradiologists, enabling fast scans of data sets for regional differences or abnormalities of tissueenhancement and, therewith, contributes to the diagnosis of indeterminate breast lesions bynon-invasive imaging.
2 Materials and Methods2.1 Patients
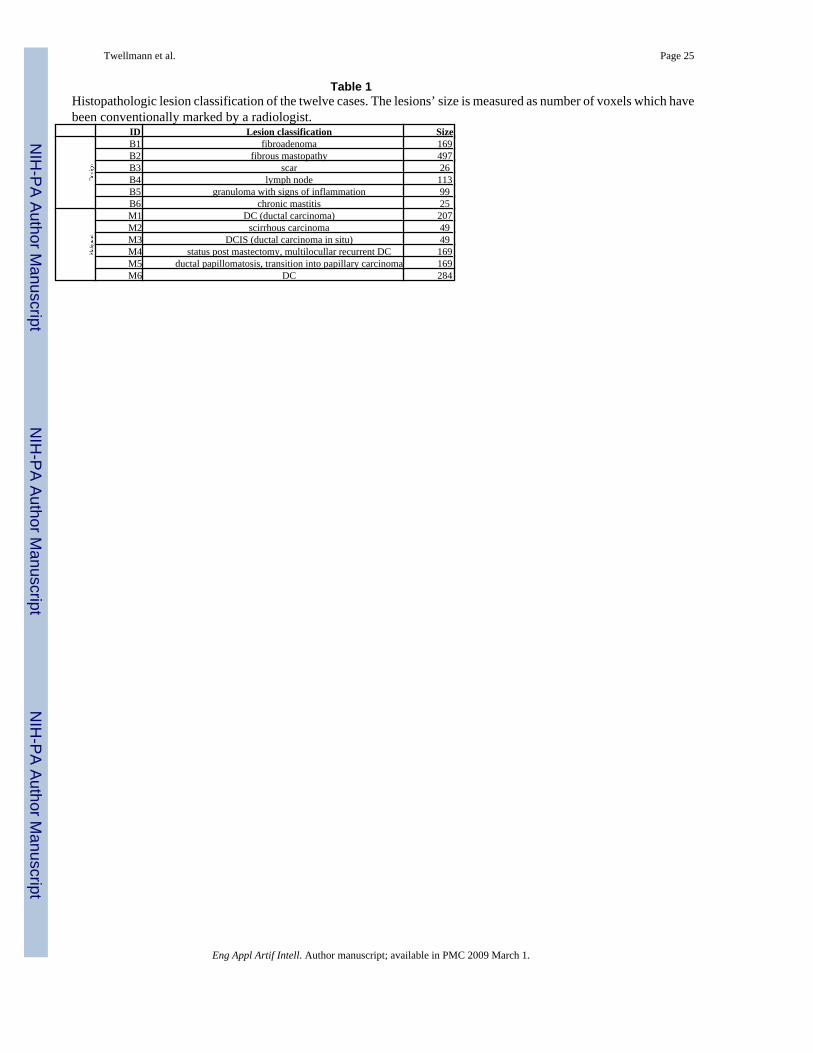
A total of 12 female patients (age range with 48–61) with solid breast tumors were examined.All patients had histopathologically confirmed diagnosis from needle aspiration/excisionbiopsy and surgical removal. Table 1 shows the histopathologic classification and the size ofthe lesions for the six women with malignant tumors and six women with benign lesions.
2.2 MR ImagingMR imaging was performed with a 1.5 T system (Magnetom Vision, Siemens, Erlangen,Germany) equipped with a dedicated surface coil to enable simultaneous imaging of bothbreasts. The patients were placed in a prone position to minimize motion artifacts. Only datasets that do not require additional registration, i.e. show a suffcient anatomical alignment overtime, are considered in this study. First, transversal images were acquired with a STIR (shortTI inversion recovery) sequence (TR=5600 ms, TE=60 ms, FA=90°, IT=150 ms, matrix size256×256 pixels, slice thickness 4 mm). Then a dynamic T1-weighted gradient echo sequence(3D fast low angle shot sequence, TR=12 ms, TE=5 ms, FA=25°) was performed in transversalslice orientation with a matrix size of 256×256 pixels and an effective slice thickness of 4 mm.
The dynamic study consisted of nS = 6 measurements with an interval of 110 s. The first imagewas acquired before injection of a paramagnetic contrast agent (Gadopentatate dimeglumine,0.1 mmol/kg body weight, Magnevist™, Schering, Berlin, Germany) immediately followedby the 5 other measurements. The initial localization of suspicious breast lesions was performedby inspection of the subtraction image based on the first and fourth acquisition.
The following preprocessing steps are applied before evaluation of the time–series signals withone of the pattern recognition techniques: For the fuzzy clustering, each time–series signal sis transformed into a relative enhancement curve (REC), resembling the signal representationthat is commonly used for manual signal evaluation in a clinical setting. The signal values arenormalized with respect to the first (the precontrast) signal value s0 leading to the correspondingfeature vector x ∈ X with
Twellmann et al. Page 3
Eng Appl Artif Intell. Author manuscript; available in PMC 2009 March 1.
NIH
-PA Author Manuscript
NIH
-PA Author Manuscript
NIH
-PA Author Manuscript
(1)
The multi-class support vector machine is applied to two different types of signalrepresentations. Next to the unprocessed time–series signal, referred to as raw feature, theallratios feature representation is considered consisting of all possible combinations of twosignal values measured at different time points.
2.3 Unsupervised Clustering of Time–Series SignalsThe employed unsupervised vector quantization (VQ) algorithm – a fuzzy clustering based ondeterministic annealing – is based on grouping of image voxels according to the similarity ofthe associated time–series signals.
Let nS denote the number of subsequent scans in a DCE-MRI study, and let nK denote thenumber of voxels in the marked ROIs. The time–series signals of the nK voxels, respectivelytheir representations as RECs, can be considered as a distribution of points in a nS-dimensionalfeature space X. Cluster analysis groups voxels together based on the similarity of their intensityprofiles in time, i.e. their Euclidean distance in X. Therewith, the entire feature space ispartitioned into clusters based on the proximity of the input data. These groups or clusters arerepresented by prototypical time–series signals called codebook vectors (CV) located at thecenter of the corresponding clusters. The CVs represent prototypical time–series signals eachrelated to a cluster of voxels sharing similar temporal characteristics.
VQ represents a fast clustering technique for feature vectors describing time–series signals inbreast MRI. The cluster centers represented by the codebook vectors wi are determined by aniterative adaptive update based on the equation [19]
(2)
where ε(t) represents the learning parameter, ai a codebook C(t) = {wi(t)} dependentcooperativity function, κ a cooperativity parameter, and x(t) a feature vector randomly chosenat iteration t.
In this paper, a fuzzy clustering based on deterministic annealing [20,21] is employed forclustering time–series signals. Its update equation for the CVs can be derived from equation(2). The cooperativity function ai is given by
(3)
with ρ(t) being the time dependent ”fuzzy range” of the model, which defines a length scalein X and which is annealed to repeatedly smaller values in the course of the training. In parlanceof statistical mechanics, ρ represents the temperature T of a multiparticle system by T = 2ρ2.This cooperativity function is the so–called softmax activation function, and accordingly theoutputs lie in the interval [0,1] and sum up to one.
The resulting learning rule for fuzzy clustering based on deterministic annealing is given as
(4)
Twellmann et al. Page 4
Eng Appl Artif Intell. Author manuscript; available in PMC 2009 March 1.
NIH
-PA Author Manuscript
NIH
-PA Author Manuscript
NIH
-PA Author Manuscript
This learning rule describes a stochastic gradient descent on an error function which is a freeenergy in a mean–field approximation. The algorithm starts with one cluster representing thecenter of the whole data set. As ρ decreases during the annealing process, the VQ procedureundergoes a sequence of cluster splitting phase transitions, until a fine–grained partition of thedata space is achieved. Cluster splitting occurs when a minimum of the error function (or freeenergy in a mean-field approximation) is transformed into a saddle point within the annealingprocess of the cooperativity parameter ρ. This parameter determines the amount of smoothing:for high values of ρ the clustering cost function contains only one global minimum, while forlow values, the structure of the original cost function is reflected by the free energy. Thus forρ → ∞, the free energy equals almost the original form of the clustering cost function. Therepetitive cluster splitting assembles in the course of simulations a tree of codebook vectorsand its resolution can be adapted according to the observer’s needs. This represents a majoradvantage over fuzzy c–means clustering since this algorithm does not employ prespecifiednumber of cluster codebook vectors.
The clustering procedure identifies groups of pixels sharing similar properties of signaldynamics, and thus enables the interpretation of the physiological part of the experiment. Themain differences between this method and Kohonen’s map are, as pointed in [21]: (1) thehierarchical and multiresolution aspect of data analysis, (2) monitoring based on differentcontrol parameters (free energy, entropy) facilitates straightforward cluster splitting, and (3)the learning rule based on a stochastic gradient descent on an explicitly given error function[27].
The exact number of clusters is usually determined by cluster validity techniques. In general,the higher the number the finer–grained the analyzed ROI is partitioned, however at the expenseof an increase in signal noise susceptibility, while a lower number leads to an oversight ofpertinent information. In our study, we have experimented with different cluster numbersranging from 4 to 8. Our simulation results demonstrated that four clusters are adequate for acorrect identification of the time–signal intensity curve types.
2.4 Classification of Time–Series SignalsIn the unsupervised analysis of lesions, the grouping of time–series signals is solely determinedby their distribution in X, and the diagnostic meaning of each signal cluster has to be determinedafter adaptation by interpreting the corresponding CVs. In contrast to that, supervised methodsallow for classification of time–series signals into a predetermined set of signal classes givenby a labeling of the training data by e.g. a human expert. Typically, each signal class reflectsa certain tissue type or state, so that pseudo-color visualizations of the classification outcomeare linked to a clear diagnostic meaning.
For the classification of DCE-MRI time–series signals we use the support vector machine(SVM) algorithm [23,22]. The SVM has been successfully applied to a wide range ofclassification problems and is employed for mapping DCE-MRI time–series signals to discreteclass labels respectively to vectors of confidence values reflecting the probabilities ofmembership in the considered classes.
The basic idea of the SVM algorithm is to construct a hyperplane(5)
with normal vector w ∈ X and bias b, which separates the labeled training data into two classeswith maximum-margin: given a set of N labeled training examples {(x; y)i}; i = 1,…,N, xi ∈X belonging to two different classes yi ∈ {−1, 1}, a maximum-margin hyperplane is determinedwhich separates the training examples of the two different classes so that the distance betweenthe hyperplane and the closest examples, the margin γ, is maximized. This hyperplane is fully
Twellmann et al. Page 5
Eng Appl Artif Intell. Author manuscript; available in PMC 2009 March 1.
NIH
-PA Author Manuscript
NIH
-PA Author Manuscript
NIH
-PA Author Manuscript

specified by a subset of the training examples representing those points that lie closest to thedecision surface and pose the biggest challenge in terms of classification.
Formally speaking, the margin of the hyperplane (5) is maximized by solving thefollowing constrained optimization problem:
(6)
(7)
This optimization problem is solved by employing the Lagrange-theory, leading to themaximum-margin hyperplane normal vector
(8)
with αi being the Lagrange-coefficients. In practice, the decision function
(9)
is frequently determined by only a small subset of training examples with αi > 0, the so calledsupport vectors, while the remaining examples with αi = 0 can be neglected.
If the two classes are not linearly separable, two modification are commonly made to theoriginal optimization problem. First, the constraints (7) are relaxed by introducing slackvariables ξi:
(10)
(11)
(12)
This soft-margin formulation of the support vector machine allows to tolerate a ceratin amountof margin violations, controlled by the regularization parameter C, and leads to reasonablelinear classification functions even in the presence of noise or class overlap.
The second modification introduces a non-linear transformation of the data. The inner productsxi · xj are replaced by a kernel function K(xi, xj) = Φ(xi) · Φ(xj), evaluating the inner productbetween two examples after transformation by a nonlinear function Φ(x). The hyperplane isnow optimized in a new feature space and corresponds to a nonlinear decision function in theoriginal data space. A frequently used nonlinear kernel function is the Gaussian kernel
(13)
In practice the regularization parameter C and the kernel bandwidth σ are varied in a widerange of values and the optimal performance is assessed on a separate validation set or usingthe cross-validation technique [22].
Solving multi-class problems with the SVM algorithm requires a suitable decomposition ofthe classification task into a sequence of binary subtasks, which each can be handled by
Twellmann et al. Page 6
Eng Appl Artif Intell. Author manuscript; available in PMC 2009 March 1.
NIH
-PA Author Manuscript
NIH
-PA Author Manuscript
NIH
-PA Author Manuscript

employing the standard SVM algorithm. The outputs of the binary classifiers are thenrecombined to the final multi–class prediction of the multi-class SVM (MSVM).
For the classification task at hand, three different tissue classes have to be distinguished. Eachtissue class is considered in one of the binary subtasks as the target class to be distinguishedfrom the union of the remaining classes (one-vs-all decomposition scheme). The MSVM thenreturns three-dimensional vectors with components reflecting the outcomes of the three binary SVMs. In order to increase the interpretability of the classification outcome,it is transformed into posteriori probabilities by postprocessing with a parameterized softmax-function
The parameters are estimated by minimizing the cross-entropy error on a subset of thetraining data.
2.4.1 Training Data—Training examples for benign time–series signals are sampled from aset of lesions which were manually segmented by a radiologist and subsequently classified asbenign according to the outcome of a histological examination. Training examples formalignant time–series signals are sampled from histologically classified malignant lesions,whereas examples for normal tissue are randomly selected from unmarked voxels. Becausethe histopathological classification can only be related to the entire lesion and provides nodetailed information about the signal characteristics of individual lesion voxels, a certainoverlap between the classes of benign and malignant training signals has to be assumed.
2.4.2 Evaluation—To evaluate the classifications of time–series signals associated withlesion voxels, a jackknife evaluation scheme is employed to the pool of 12 cases. The MSVMis adapted with a balanced set of labeled training examples sampled from eleven DCE-MRIdata sets and subsequently applied for classification of time–series signals of the lesion in theexcluded twelfth image sequence. This leave-one-case-out scheme is repeated twelve times sothat each sequence is excluded for testing once. Pseudo-color visualizations of the excludedlesion are computed by displaying each lesion voxel with a RGB color reflecting the three-dimensional vector of posteriori probabilities resulting from the classification of the underlyingtime–series signal. Next to the MSVM with linear kernel function (MSVM-L), application ofthe MSVM with the nonlinear Gaussian kernel function (MSVM-G) is considered.
Due to the lack of a reference label reflecting the biological truth for each individual lesionvoxel, the outcomes of the MSVM are compared with those of the 3TP technique, representinga clinically relevant and accepted diagnosis protocol. MSVM based visualizations are collatedwith those computed with 3TP, and a class label derived from the color hue assigned by 3TPto each lesion voxel serves as a ground truth for a quantitative evaluation of the MSVM basedsignal classification.
3 Visualization Results Based on Classification and Unsupervised ClusteringTechniques3.1 Results for Unsupervised Clustering of Time–Series Signals
In the following, we will present the segmentation method for the evaluation of time–seriessignals for the differential diagnosis of enhancing lesions in breast MRI.
Twellmann et al. Page 7
Eng Appl Artif Intell. Author manuscript; available in PMC 2009 March 1.
NIH
-PA Author Manuscript
NIH
-PA Author Manuscript
NIH
-PA Author Manuscript

A carefully chosen circular ROI is defined by taking into account the voxels whose intensityuptakes are above a radiologist defined threshold (> 50%) in the early postcontrast phase. Thespecific choice of this threshold is motivated by the relevant literature, e.g. [24], where theprobability of missing malignant lesions by excluding regions with a relative signal increaseof less than 50% is considered negligible. For all voxels belonging to this ROI an average time–series signal is computed. This averaged curve is then rated. This simple method is fast but isthreshold–limited. A detailed analysis of the intensity curves of all voxels is then performedby the fuzzy clustering technique based on deterministic annealing as a chosen clusteringmethod.
The obtained time–series signals of enhancing lesions were presented as relative enhancementcurves together with the corresponding quantities initial signal change (sai), i.e., the signalchange (in percent) between the precontrast and second postcontrast image, and the postinitialsignal change (svp) reflecting the signal change between the third and last postcontrast image(see e.g. Fig. 4–6). The diagrams were presented to two experienced radiologists who wereblinded to any clinical or mammographic information of the patients. The radiologists wereasked to rate the time courses as having a steady, plateau, or washout shape – type I, II, or III,respectively [4].
The classification of the lesions on the basis of the time course analysis was then comparedwith the lesions definitive diagnosis. The definitive diagnosis was obtained histologically bymeans of biopsy or by means of follow–up in the cases that, on the basis of history, clinical,mammographic, ultrasound, and breast MR imaging findings, were rated to be probably benign.
Figure 4–Figure 6 exemplify visualizations based on the outcome of the unsupervisedsegmentation for one benign and two malignant lesions. The images show the clusterdistribution for the given slices and at the same time the corresponding time–series signalprototype for each cluster. Thus, a very accurate representation is obtained revealing thenuances in tissue transition.
The shown images demonstrate clearly that the presented method, combining cluster analysisbesides conventional method of thresholding, allows for detecting lesions and analyzing theirarchitecture. The major advantage of the method is given by a differentiated examination oftissue changes yielding to an increase in sensitivity of breast MRI with respect to malignantlesions. Previous results of classification based either on the conventional method ofthresholding or on clustering of the whole breast voxels proved to lack this capability [25].
3.2 Results for Classification of Time–Series SignalsThe following figures exemplify the pseudo-color visualization of manually selected ROIsusing classification. Figure 7 depicts three different types of pseudo-color visualizations of thelesion of case B1. In the four adjacent image slices, only lesion voxels as marked by theradiologist are displayed with pseudo-colors. Non-lesion voxels are depicted with signalintensities of the precontrast image. In the left 2 × 2 image matrix, pseudo-colors reflect thecontinues values of posteriori probabilities P(classk|x) for the three tissue classes classk ∈{malignant, normal, benigng} Thus, bright red, green and blue voxels suggest high localprobabilities of malignant, normal and benign tissue, respectively. Combination of the threecolors are indicative of tissue exposing time–series signals with less distinct signalcharacteristics. A tissue classification according to the maximum posteriori probability(red=malignant, green=normal, blue=benign) is depicted in the middle 2 × 2 matrix of images.In order to demonstrate that the MSVM based approach, although not presupposing any modelassumptions about the signal, leads to a reasonable assessment of lesion voxels, the 3TP basedpseudo-coloring of the lesion is displayed in the right 2 × 2 image matrix. The same types of
Twellmann et al. Page 8
Eng Appl Artif Intell. Author manuscript; available in PMC 2009 March 1.
NIH
-PA Author Manuscript
NIH
-PA Author Manuscript
NIH
-PA Author Manuscript

pseudo-color images are shown for the benign case B4 and for the three malignant cases M1,M4 and M6 in Figure 8, Figure 9, Figure 10 and Figure 11, respectively.
The pseudo-color visualizations of all five lesion accentuate the heterogeneity of lesion tissue,stressing the requirement to analyze the enhancement kinetic of subregions of lesions insteadof whole-lesion ROIs. Lesion segments with different signal characteristics can be easilyidentified by means of collections of voxels displayed with similar pseudo-colors.
A comparison of the pseudo-color visualizations based on the MSVM with those based on 3TPsuggests a high concordance between both techniques regarding the localization of voxelsexposing benign (blue) and malignant (red) signal characteristics. Tissue compartmentsdisplayed bright green by 3TP, suggesting strong uptake but indistinct wash-out characteristicsof the underlying signals, are depicted purple in the MSVM based pseudo-color images.
3.2.1 Quantitative Evaluation—For assessing the classification performance of theMSVM quantitatively, the MSVM based voxel classification is compared with a referencelabel derived from 3TP. All voxels marked by the radiologist exhibit a significant signalenhancement and have to be regarded as suspicious lesion voxels. The marked voxels can befurther subclassified into three tissue classes according to the color hue of the pseudo–colorassigned by 3TP: red, blue and green voxels indicate malignant, benign and suspicious (withindistinct wash–out characteristics) time–series signals, respectively.
For the suspicious signal class of 3TP, no counterpart is provided by the MSVM. Nevertheless,to be able to assess the MSVM classification on the basis of the available ground truth, a 3 ×3 cost matrix (Table 2) is elaborated assigning a specific non-negative cost value to each pairingof 3TP (malignant, suspicious, benign) and MSVM (malignant, normal, benign) decision. Thecosts associated with a ”normal” classification of time–series signals by the MSVM are two,regardless of the 3TP outcome; all voxels have been marked by the radiologist as belongingto a lesion and thus have to be classified either as malignant or benign. The costs associatedwith the misclassification of benign as malignant and vice versa are assigned a value of one.There is zero costs if both techniques agree in their classification of signals as malignant orbenign, or if a signal which is classified by 3TP as suspicious with indistinct wash–out (green)is rated as malignant or benign by the MSVM.
For each of the twelve lesions, a 3×3 confusion matrix is computed by counting how often thedifferent decision pairings occur. Then, the costs for classifying the lesion voxel with MSVMare determined by adding up the entries of the confusion matrix multiplied by the correspondingentries of the cost matrix. The final sum is normalized by the corresponding maximum possiblecost, which is computed as the maximum entry of the cost matrix multiplied by the number oflesion voxels. The caused costs are visualized as a box plot in Figure 12. According to themedians and interquartile ranges, the best results are obtained for the MSVM–L by evaluatingthe raw–feature or allratios–feature representation of time–series signals. The median costscaused by classifying the twelve lesions with the MSVM-L are lower than that of the MSVM-G. Additionally, the costs for the individual lesions are much more concentrated around themedians indicating a lower inter-patient variance in the MSVM-L based cost values.
The qualitative and quantitative results for the comparison of the supervised tissueclassification with those of 3TP have to be interpreted with care. Even though 3TP is a clinicallyaccepted method for analyzing lesions in DCE-MRI data sets, it does not necessarily reflectthe true tissue state. Thus, it is questionable whether a perfect conformance between the MSVMand 3TP is desirable. Nevertheless, the comparison with 3TP illustrates how well the MSVMperforms compared with an established and clinically applied technique. A more detailed
Twellmann et al. Page 9
Eng Appl Artif Intell. Author manuscript; available in PMC 2009 March 1.
NIH
-PA Author Manuscript
NIH
-PA Author Manuscript
NIH
-PA Author Manuscript

analysis of the tissue classification requires, e.g., a histopathologically validated voxel labeling,which is difficult to obtain.
4 Conclusion and DiscussionWe presented two different approaches for accentuating the spatio-temporal appearance patternof lesions in DCE-MRI studies of breasts. Both techniques lead to visualizations of temporalimage sequences in which the pseudo-color of voxels reflects the temporal characteristic ofthe underlying tissue. Therewith, subregions with different enhancement kinetics can beidentified by means of a single 3D color image, exposing important information about thelesion architecture by the topological pattern of different tissue types in the heterogenous lesiontissue. Unlike the model-based 3TP method which only permits to consider data from oneprecontrast and two postcontrast images, the proposed techniques are capable of exploiting theinformation of the entire time–series signals. In consideration of the fact that a wide range ofimaging protocols with different spatial and temporal resolutions are used in clinical practice,this flexibility with respect to the input data is a beneficial feature of the adaptive approaches.
The unsupervised approach can directly be adapted on the time–series signals of the DCE-MRIstudy under investigation, which avoids the requirement of a larger set of (labeled) trainingdata. Furthermore, readaptation of the code-book vectors for each new patient allows for takinginto account interpatient variabilities of the signal data caused by e.g. variations in theplacement of patients in the scanner. However, the diagnostic meaning of the pseudo-colorsreflecting cluster indices may vary from patient to patient, and radiologists have to interpretthe codebook vectors for each case anew. At the expense of the requirement of a sufficient setof labeled training data, the pseudo-colors derived from the supervised classifier reflect definitesignal characteristics. Application of both methods to patient data does not delay the diagnosisprocess. The training of the supervised approach with data from several labeled cases has tobe executed only once, and evaluation of lesions of average size takes less than a minute. Theunsupervised approach has to be retrained for each new case, but the adaptation is fast due tothe typically small ROIs.
Future work will concentrate on establishing a ”digital atlas” for different lesion types as itwas demonstrated in traditional digital mammography. The assessment of the morphology inaddition to the temporal kinetics of lesions in a computerized fashion offers potential forsubstantial improvements in diagnostic accuracy and efficiency.
To extend this idea to breast MRI, we need to develop mathematical descriptors for the differentmorphologies, e.g., by employing shape models. Based on the combination of descriptors forthe temporal and spatial tissue characteristics, we will obtain a lesion classification and also asimilarity ranking within the medical image database. In summary, compact and efficient shapedescriptors will improve the quality of breast MR data analysis and implicitly that of existingCAD systems beyond the current level.
AcknowledgementThe authors would like to thank Dr. A. Wismüller from the Department of Radiology, University of Munich, Germany,for providing the image data.
References1. Yousef E, Duchesneau R, Alfidi R. Magnetic resonance imaging of the breast. Radiology 1984 Feb;
150:761–766. [PubMed: 6695077]2. Heywang S, Wolf A, Pruss E. MR imaging of the breast: Fast imaging sequences with and without
Gd-DTPA. Radiology 1989 Feb;171:95–103. [PubMed: 2648479]
Twellmann et al. Page 10
Eng Appl Artif Intell. Author manuscript; available in PMC 2009 March 1.
NIH
-PA Author Manuscript
NIH
-PA Author Manuscript
NIH
-PA Author Manuscript

3. Orel SG, Schnall MD. MR imaging of the breast for the detection, diagnosis, and staging of breastcancer. Radiology 2001;220:13–30. [PubMed: 11425968]
4. Kuhl CK, Mielcareck P, Klaschik S, Leutner C, Wardelmann E, Gieseke J, Schild H. Dynamic breastMR imaging: Are signal intensity time course data useful for differential diagnosis of enhancinglesions? Radiology 1999 Feb;211:101–110. [PubMed: 10189459]
5. Subramaninan KR, Brockway JP, Carruthers WB. Interactive detection and visualisation of breastlesions from dynamic enhanced MRI volumes. Computerized Medical Imaging and Graphics 2004Aug;28:435–444. [PubMed: 15541950]
6. Lucht E, Delorme S, Brix G. Neural network-based segmentation of dynamic (MR) mammographyimages. Magnetic Resonance Imaging 2002 Aug;20:89–94.
7. Abdolmaleki P, Buadu L, Naderimansh H. Feature extraction and classification of breast cancer ondynamic magnetic resonance imaging using artificial neural network. Cancer Letters 2001 Aug;171:183–191. [PubMed: 11520602]
8. Lucht E, Knopp M, Brix G. Classification of signal-time curves from dynamic (MR) mammographyby neural networks. Magnetic Resonance Imaging 2001 Aug;19:51–57. [PubMed: 11295347]
9. Torheim G, Godtliebsen F, Axelson D, Kvistad K, Haraldseth O, Rinck P. Feature extraction andclassification of dynamic contrast-enhanced T2-weighted breast image data. IEEE Transaction onMedical Imaging 2001 Dec;20:1293–1301.
10. Twellmann T, Saalbach A, Gerstung O, Leach MO, Nattkemper TW. Image fusion for dynamiccontrast-enhanced magnetic resonance imaging. BMC BioMedical Engineering OnLine 2004;3:35.
11. Twellmann T, Lichte O, Nattkemper TW. An adaptive tissue characterization network for model-freevisualization of dynamic contrast-enhanced magnetic resonance image data. IEEE Transaction onMedical Imaging 2005 Dec;24:1256–1266.
12. Twellmann T, Saalbach A, Müller C, Nattkemper TW, Wismüller A. Detection of suspicious lesionsin dynamic contrast-enhanced MRI data. Proceedings of EMBC 2004. 2004
13. Yoo SS, Choi BG, Han J-Y, Kim HH. Independent component analysis for the examination ofdynamic contrast-enhanced breast magnetic resonance imaging data. Investigative Radiology 2002Dec;37:647–654. [PubMed: 12446997]
14. Kelcz F, Furman-Haran E, Grobgeld D, Degani H. Clinical testing of high-spatial-resolutionparametric contrast-enhanced mr imaging of the breast. American Journal of Roentgenology 2002Jul;179:1485–1492. [PubMed: 12438042]
15. Weinstein D, Strano S, Cohen P, Fields S, Gomori JM, Degani H. Breast fibroadenoma: Mapping ofpathophysiologic features with three-time-point, contrast-enhanced MR imaging – pilot study.Radiology 1999;210:233–240. [PubMed: 9885614]
16. Tofts PS, Brix G, Buckley DL, Evelhoch JL, Henderson E, Knopp MV, Larrson HBW, Lee T-Y,Mayr NA, Parker GJM, Port RE, Taylor J, Weisskopf RM. Estimating kinetic parameters fromdynamic contrast enhanced T1-weighted MRI of a diffusible tracer: Standarized quantities andsymbols. Journal of Magnetic Resonance Imaging 1999;10:223–232. [PubMed: 10508281]
17. Hoffmann U, Brix G, Knopp MV, He T, Lorenz WJ. Pharamcokinetic mapping of the breast, A newmethod for dynamic MR mammography. Magnetic Resonance In Medicine 1995 Apr;33:506–514.[PubMed: 7776881]
18. Collins DJ, Padhani AR. Dynamic magnetic resonance imaging of tumor perfusion. IEEE Engineeringin Medicine and Biology Magazine 2004 May;23:65–83. [PubMed: 15565801]
19. Meyer-Bäse, A. Pattern Recognition for Medical Imaging. Elsevier Science/Academic Press; 2003.20. Rose K, Gurewitz E, Fox G. Vector quantization by deterministic annealing. IEEE Transaction on
Information Theory 1992 Mar;38:1249–1257.21. Wismüller A, Lange O, Dersch D, Leinsinger G, Hahn K, Pütz B, Auer D. Cluster analysis of
biomedical image time–series. International Journal on Computer Vision 2002 Feb;46:102–128.22. Cristiani, N.; Shawe-Taylor, J. An introduction to support vector machines and other kernel-based
learning methods. Cambridge Press; 2000.23. Vapnik, V. The nature of statistical learning theory. Springer; 1995.24. Fischer U, Heyden VD, Vosshenrich I, Vieweg I, Grabbe E. Signal characteristics of malignant and
benign lesions in dynamic 2D-MRI of the breast. RoeFo 1993;158:287–292.
Twellmann et al. Page 11
Eng Appl Artif Intell. Author manuscript; available in PMC 2009 March 1.
NIH
-PA Author Manuscript
NIH
-PA Author Manuscript
NIH
-PA Author Manuscript

25. Meyer-Bäse A, Wismüller A, Lange O, Leinsinger G. Computer-aided diagnosis in breast MRI basedon unsupervised clustering techniques. Intelligent Computing: Theory and Applications II.Proceedings of the SPIE 2005;5421:29–37.
26. Chen W, Giger ML, Bick U. A fuzzy c-means (FCM)-based approach for computerized segmentationof breast lesions in dynamic contrast-enhanced MR images. Academic Radiology 2006;13:63–72.[PubMed: 16399033]
27. Wismüller A, Meyer-Bäse A, Lange O, Schlossbauer T, Kallergi M, Reiser M, Leinsinger G.Segmentation and classification of dynamic breast magnetic resonance image data. Journal ofElectronic Imaging 2006;15(1)
Twellmann et al. Page 12
Eng Appl Artif Intell. Author manuscript; available in PMC 2009 March 1.
NIH
-PA Author Manuscript
NIH
-PA Author Manuscript
NIH
-PA Author Manuscript

Fig. 1.Example slices showing the enhancement of lesion tissue over time. The upper left image showsa typical field-of-view as it is used for simultaneous imaging of both breasts. The position of aregion-of-interest (ROI) in the right breast is depicted by a white box. The white circle indicatesthe position of the lesion, which segmentation is presented in white. The remaining imagesshow a magnified view of the ROI in the precontrast (upper right), first postcontrast (lowerleft) and fifth postcontrast (lower right) image. The lesion exposes a heterogeneousenhancement pattern: the intensity of the tissue in the lesion center continuously increases overtime, whereas tissue at the lesion border reaches its peak intensity in the early postcontrastimage and exposes lower intensity values in the late postcontrast image. These subtledifferences in the temporal characteristics of the tissue are difficult to recognize in the originalimages but nevertheless important for the differential diagnosis of tumors.
Twellmann et al. Page 13
Eng Appl Artif Intell. Author manuscript; available in PMC 2009 March 1.
NIH
-PA Author Manuscript
NIH
-PA Author Manuscript
NIH
-PA Author Manuscript
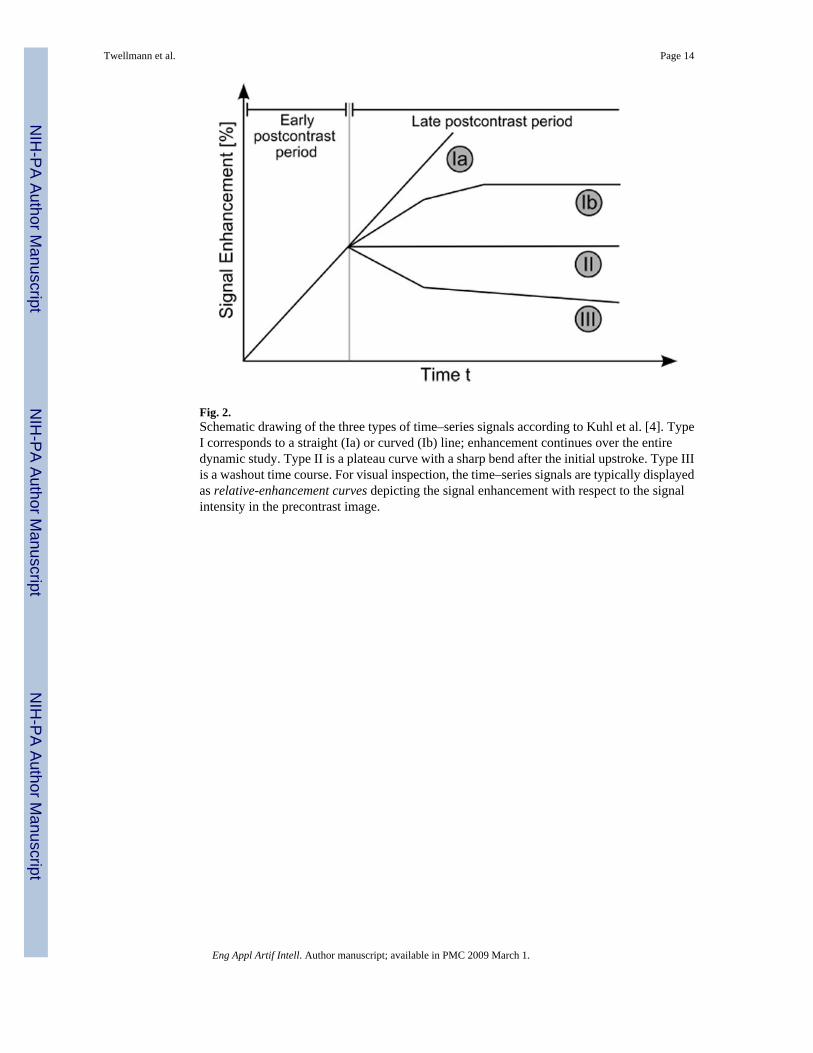
Fig. 2.Schematic drawing of the three types of time–series signals according to Kuhl et al. [4]. TypeI corresponds to a straight (Ia) or curved (Ib) line; enhancement continues over the entiredynamic study. Type II is a plateau curve with a sharp bend after the initial upstroke. Type IIIis a washout time course. For visual inspection, the time–series signals are typically displayedas relative-enhancement curves depicting the signal enhancement with respect to the signalintensity in the precontrast image.
Twellmann et al. Page 14
Eng Appl Artif Intell. Author manuscript; available in PMC 2009 March 1.
NIH
-PA Author Manuscript
NIH
-PA Author Manuscript
NIH
-PA Author Manuscript

Fig. 3.Model-based 3TP method [14,15] as the basis for pseudo-coloring of lesions voxels: theintensity of the pseudo-color represents the amount of signal uptake between the precontrastand the early postcontrast image. The presence or absence of a wash–out is associated with thecolor hue, yielding thus a simple lesions’ evaluation method which is capable to integrateinformation from exactly one precontrast and two postcontrast images.
Twellmann et al. Page 15
Eng Appl Artif Intell. Author manuscript; available in PMC 2009 March 1.
NIH
-PA Author Manuscript
NIH
-PA Author Manuscript
NIH
-PA Author Manuscript

Fig. 4.Segmentation method applied to data set B1 (benign lesion, fibroadenoma) and resulting infour clusters. The left image shows the cluster distribution for each slice ranging from 21 to23. The right image presents for each cluster the representative time–series signal (displayedas relative enhancement curves) and the corresponding quantities initial signal change (sai)and postinitial signal change (svp). The pseudo-color images indicate strong and steadyenhancing tissue in the lesion center and weakly enhancing tissue at the lesion border,suggesting an overall benign lesion.
Twellmann et al. Page 16
Eng Appl Artif Intell. Author manuscript; available in PMC 2009 March 1.
NIH
-PA Author Manuscript
NIH
-PA Author Manuscript
NIH
-PA Author Manuscript
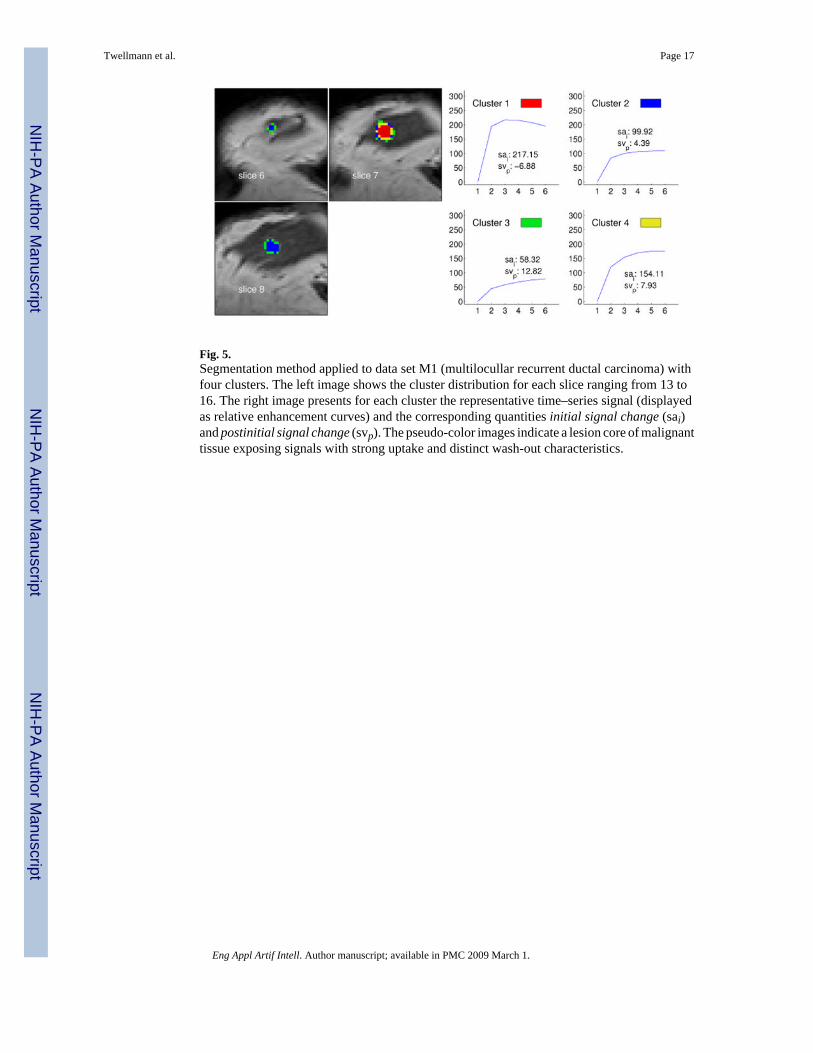
Fig. 5.Segmentation method applied to data set M1 (multilocullar recurrent ductal carcinoma) withfour clusters. The left image shows the cluster distribution for each slice ranging from 13 to16. The right image presents for each cluster the representative time–series signal (displayedas relative enhancement curves) and the corresponding quantities initial signal change (sai)and postinitial signal change (svp). The pseudo-color images indicate a lesion core of malignanttissue exposing signals with strong uptake and distinct wash-out characteristics.
Twellmann et al. Page 17
Eng Appl Artif Intell. Author manuscript; available in PMC 2009 March 1.
NIH
-PA Author Manuscript
NIH
-PA Author Manuscript
NIH
-PA Author Manuscript

Fig. 6.Segmentation method applied to data set M3 (malignant lesion, ductal carcinoma in situ) andresulting in four clusters. The left image shows the cluster distribution for each slice rangingfrom 6 to 8. The right image presents for each cluster the representative time–series signal(displayed as relative enhancement curves) and the corresponding quantities initial signalchange (sai) and postinitial signal change (svp). The pseudo-color images indicate a lesioncore of malignant tissue exposing signals with a strong uptake but weak wash-out. Voxels atthe lesion margin expose persistently enhancing time–signal intensity curves.
Twellmann et al. Page 18
Eng Appl Artif Intell. Author manuscript; available in PMC 2009 March 1.
NIH
-PA Author Manuscript
NIH
-PA Author Manuscript
NIH
-PA Author Manuscript

Fig. 7.Four different image slice showing the benign lesion B1 (fibroadenoma) with pseudo-colorsreflecting the local probability of malignant, benign and normal tissue (left 2 × 2 image matrix)or the local tissue classification as malignant (red), normal (green) or benign (blue) tissue(middle 2 × 2 image matrix). The 3TP based visualization of the lesion is presented in the right2 × 2 image matrix. Both techniques indicate benign tissue (blue) in the lesion center. Tissuerated as suspicious by 3TP (green) is displayed with shadings of purple and red in the MSVMbased visualization, also indicating suspicious signals with no distinct benign or malignantsignal characteristics.
Twellmann et al. Page 19
Eng Appl Artif Intell. Author manuscript; available in PMC 2009 March 1.
NIH
-PA Author Manuscript
NIH
-PA Author Manuscript
NIH
-PA Author Manuscript

Fig. 8.Same pseudo-color visualizations as described in Figure 7 but for the benign lesion B4 (lymphnode). Both techniques are concordant in the assessment of benign tissue regions. Voxels ofsuspicious tissue (3TP: green) are displayed with shadings of purple by the MSVM.
Twellmann et al. Page 20
Eng Appl Artif Intell. Author manuscript; available in PMC 2009 March 1.
NIH
-PA Author Manuscript
NIH
-PA Author Manuscript
NIH
-PA Author Manuscript

Fig. 9.Four adjacent image slices showing the malignant lesion M1 (ductal carcinoma) with pseudo-colors reflecting the local probability of malignant, benign and normal tissue (left 2 × 2 imagematrix) or the local tissue classification as malignant (red), normal (green) or benign (blue)tissue (middle 2 × 2 image matrix). The 3TP based visualization of the lesion is presented inthe right 2 × 2 image matrix. Both techniques indicate the same signal characteristics for mostvoxels.
Twellmann et al. Page 21
Eng Appl Artif Intell. Author manuscript; available in PMC 2009 March 1.
NIH
-PA Author Manuscript
NIH
-PA Author Manuscript
NIH
-PA Author Manuscript

Fig. 10.Same pseudo-color visualizations as described in Figure 10 but for the malignant lesion M4(multilocullar ductal carcinoma). All types of pseudo–color visualizations expose theheterogenous structure of the lesion tissue, with malignant tissue areas at the lesion margin andtissue with benign signal characteristics in the core and right part of the lesion.
Twellmann et al. Page 22
Eng Appl Artif Intell. Author manuscript; available in PMC 2009 March 1.
NIH
-PA Author Manuscript
NIH
-PA Author Manuscript
NIH
-PA Author Manuscript
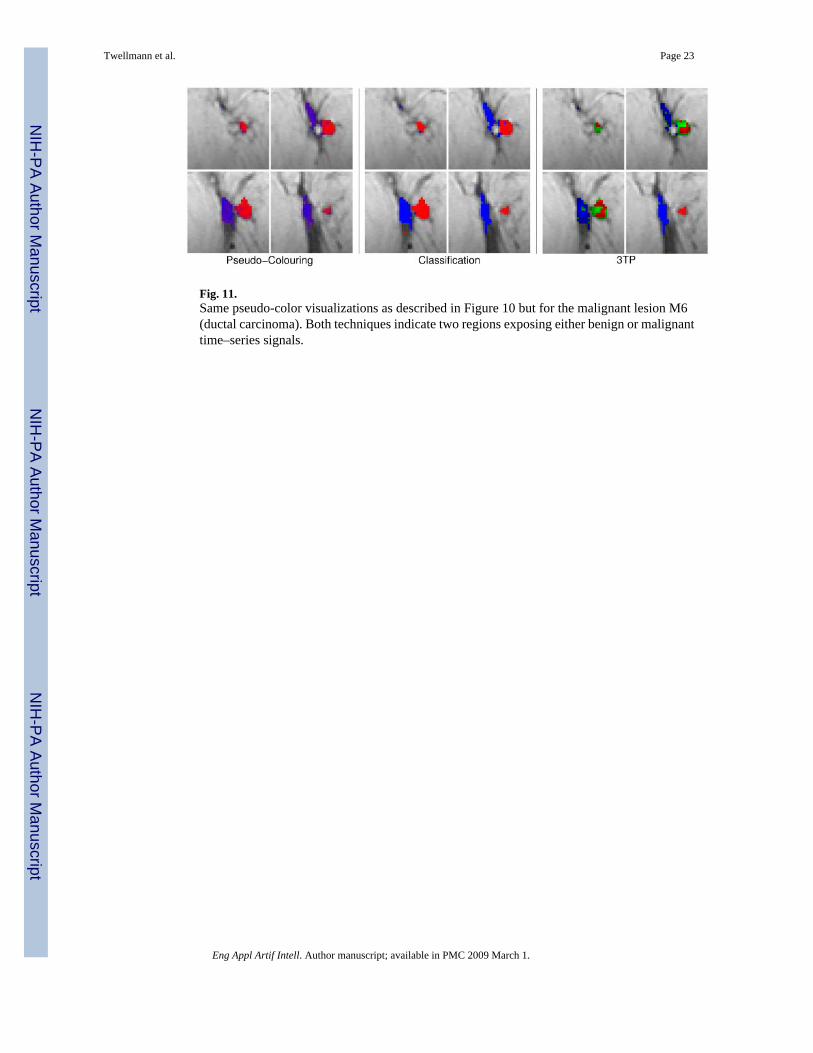
Fig. 11.Same pseudo-color visualizations as described in Figure 10 but for the malignant lesion M6(ductal carcinoma). Both techniques indicate two regions exposing either benign or malignanttime–series signals.
Twellmann et al. Page 23
Eng Appl Artif Intell. Author manuscript; available in PMC 2009 March 1.
NIH
-PA Author Manuscript
NIH
-PA Author Manuscript
NIH
-PA Author Manuscript
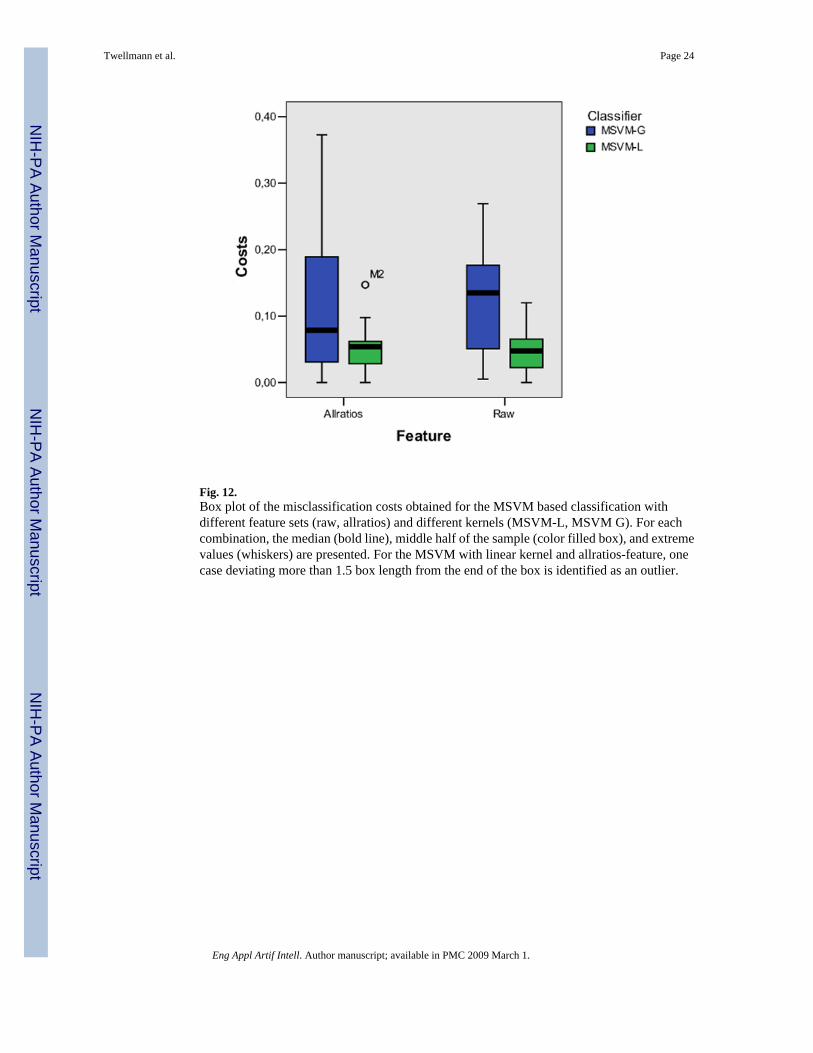
Fig. 12.Box plot of the misclassification costs obtained for the MSVM based classification withdifferent feature sets (raw, allratios) and different kernels (MSVM-L, MSVM G). For eachcombination, the median (bold line), middle half of the sample (color filled box), and extremevalues (whiskers) are presented. For the MSVM with linear kernel and allratios-feature, onecase deviating more than 1.5 box length from the end of the box is identified as an outlier.
Twellmann et al. Page 24
Eng Appl Artif Intell. Author manuscript; available in PMC 2009 March 1.
NIH
-PA Author Manuscript
NIH
-PA Author Manuscript
NIH
-PA Author Manuscript
NIH
-PA Author Manuscript
NIH
-PA Author Manuscript
NIH
-PA Author Manuscript
Twellmann et al. Page 25
Table 1Histopathologic lesion classification of the twelve cases. The lesions’ size is measured as number of voxels which havebeen conventionally marked by a radiologist.
ID Lesion classification SizeB1 fibroadenoma 169B2 fibrous mastopathy 497B3 scar 26B4 lymph node 113B5 granuloma with signs of inflammation 99B6 chronic mastitis 25M1 DC (ductal carcinoma) 207M2 scirrhous carcinoma 49M3 DCIS (ductal carcinoma in situ) 49M4 status post mastectomy, multilocullar recurrent DC 169M5 ductal papillomatosis, transition into papillary carcinoma 169M6 DC 284
Eng Appl Artif Intell. Author manuscript; available in PMC 2009 March 1.

NIH
-PA Author Manuscript
NIH
-PA Author Manuscript
NIH
-PA Author Manuscript
Twellmann et al. Page 26
Table 2Cost matrix representing the loss associated with the different pairings of MSVM and 3TP decisions.
MSVMMalignant Normal Benign
Malignant 0.0 2.0 1.0Suspicious 0.0 2.0 0.0
Benign 1.0 2.0 0.0
Eng Appl Artif Intell. Author manuscript; available in PMC 2009 March 1.
Related Documents


![Position-based modeling of lesion displacement in ... · Image-guided breast biopsy is the standard procedure to evaluate symptomatic and screening-detected suspicious lesions [1].](https://static.cupdf.com/doc/110x72/6064b89f3a466f05ad65ec83/position-based-modeling-of-lesion-displacement-in-image-guided-breast-biopsy.jpg)
