•

Welcome message from author
This document is posted to help you gain knowledge. Please leave a comment to let me know what you think about it! Share it to your friends and learn new things together.
Transcript
Loughborough UniversityInstitutional Repository
Model for performance basedland area and water
allocation within irrigationschemes
This item was submitted to Loughborough University's Institutional Repositoryby the/an author.
Citation: GORANTIWAR, S.D. and SMOUT, I.K. 2006. Model for perfor-mance based land area and water allocation within irrigation schemes. Irrigationand Drainage Systems, 20, pp.345-360. [DOI 10.1007/s10795-006-9012-0]
Additional Information:
• This is a journal article. The original publication is available atwww.springerlink.com
Metadata Record: https://dspace.lboro.ac.uk/2134/3673
Publisher: c© Springer Verlag
Please cite the published version.

This item was submitted to Loughborough’s Institutional Repository by the author and is made available under the following Creative Commons Licence
conditions.
For the full text of this licence, please go to: http://creativecommons.org/licenses/by-nc-nd/2.5/

Model for performance based land area and water allocation within
irrigation schemes
S.D.GORANTIWAR1 & I.K.SMOUT2
1Associate Professor, Department of Irrigation and Drainage Engineering, Mahatma
Phule Agricultural University, Rahuri, Maharashtra, India and currently Academic
Visitor, Water, Engineering and Development Centre, Loughborough University,
Leicestershire, LE11 3TU, UK ([email protected]);
2Director, Water, Engineering and Development Centre, Loughborough University,
Leicestershire, LE11 3TU, UK (email: [email protected])
Corresponding Author: I. K. Smout

2
Abstract: This paper focuses on irrigation schemes under rotational water supply in arid
and semiarid regions. It presents a methodology for developing plans for optimum
allocation of land area and water, considering performance measures such as productivity,
equity and adequacy. These irrigation schemes are characterized by limited water supply
and heterogeneity in soils, crops, climate and water distribution network etc. The
methodology proposed in this paper, therefore, uses a previously developed simulation-
optimization model (Area and Water Allocation Model, AWAM) that considers the
heterogeneity of the irrigation scheme in the allocation process, and modifies this to take
account of equity and adequacy of supply to irrigated areas. The AWAM model has four
phases to be executed separately for each set of irrigation interval over the irrigation
season: 1. generation of irrigation strategies for each crop-soil-region combination (CSR
unit), 2. preparation of irrigation programmes for each irrigation strategy, 3. selection of
specified number of irrigation programmes for each CSR unit and 4. optimum allocation of
land area and water to different parts of the irrigation scheme (allocation units) for
maximizing productivity. In the modified AWAM model, the adequacy is included at
Phase-2 (by including only the irrigation programmes for full irrigation of each CSR unit)
and equity is included at Phase-4 (by including the constraints for equity). The paper
briefly discusses the applicability of the modified AWAM model for a case study of
Nazare medium irrigation scheme in Southern India. The results of the case study indicated
that the performance measures of productivity, equity and adequacy conflict with each
other.
Keywords: water allocation; irrigation; optimization; surface irrigation; performance;
productivity; equity; adequacy

3
Introduction
During the past several decades, increasing water demand for irrigation has been met by
developing new sources of water. However, the technical, economic and environmental
costs associated with the continued development of new sources make this approach
undesirable for fully meeting future growth. On the other hand, in many countries the
allocation of water for irrigation is viewed as a low priority. As a result, more recently,
irrigation has received a reduced share of the total supply due to increased demand from
higher valued uses such as industrial, domestic and recreational. For example, in
developing countries the share of water for agricultural uses was 90% in 1995 and is
expected to reduce to 70% in 2020 (Pinstrup-Andersen et al., 1997). Constantly increasing
population in these countries also increases the pressure on irrigated agriculture to produce
more food, especially in view of the 2 to 3 times greater productivity of irrigated
agriculture than rainfed agriculture. Hence there is a need to work towards making
available water supplies for irrigation more efficient and productive.
This work is concerned with the efficient management of water in irrigation
schemes where water flows by gravity through an extensive network of canals to large
irrigation areas measuring thousands of hectares. In these schemes water is centrally
managed, and the control over the resource is quite easily achievable.
There are many ways to improve the efficiency of use of available water to increase
agricultural production in an irrigation scheme. These include improving hardware of the
scheme (reservoir desedimentation, raising the dam height, developing the catchment area,
lining of canal network, installation of water regulatory and measurement structures,
repairing and enhancing maintenance of existing water delivery system, development of
onfarm structures, land leveling, automation etc.), adopting water saving irrigation

4
methods (pressurized irrigation methods such as sprinkler and drip, improvements in
traditional irrigation methods such as skip furrow irrigation method, surge flow irrigation
etc ) and improving software of the scheme (adoption of appropriate water distribution
methods such as rotational water supply or on demand water supply, developing optimum
allocation plans for land and water resources to different crops in the irrigation scheme,
institutional reforms, improving capital related activities, improving crop related
management practices, etc). These options are generally not alternatives but often applied
together. In the late 1970’s ‘hardware’ related options dominated irrigation schemes
(Hennessy, 1993), but now this option can provide only marginal increases in water
availability. Recently there has been greater interest in 'software' related options that focus
on using every drop of available water to its maximum potential. This paper deals with one
such ‘software’ related option i.e. optimum allocation of land and water resources in the
irrigation scheme.
The practice of spreading water over a large area has always been a strategy of
irrigation in many developing countries, mainly to provide protective irrigation, alleviate
famine and raise rural living standards. As a result of this, water is relatively shorter in
supply than land and most cultivable command areas do not get enough water (adequate
irrigation depth). Water scarcity in these schemes may make deficit irrigation or deliberate
stressing to the crops more profitable (English & Nuss, 1982; Hargreaves & Samani, 1984;
Trimmer 1990; Keller et al., 1992 and Gorantiwar & Smout, 2003). It is thus important to
consider deficit irrigation and to allocate land area and water resources optimally from a
water use efficiency point of view to different crops cultivated in different parts of the
irrigation scheme (optimum allocation plan) and produce corresponding water delivery
schedules.
5
Previously several researchers developed methodologies to produce optimum
allocation plans (Matanga & Marino, 1979; Yaron & Dinar, 1982; Sritharan et al., 1988;
Vedula & Mujumdar 1992; Shyam et al., 1994 and Onta et al., 1995; Mainuddin et al.,
1996; Sunantara & Ramirez, 1997; Wardlaw & Barnes 1999; Paul et al., 2000 and Sahoo et
al., 2001). But these studies were mainly concerned with maximizing the benefits of
agricultural production from the irrigation schemes (i.e. productivity) and did not address
the issues of distributing the water to farmers in different parts of the command area of
irrigation schemes. However as the benefits of irrigation are widely recognized in
developing countries, farmers in the command areas of irrigation schemes are concerned
about getting an equitable share of water and adequate supply of water (to fill the root zone
to field capacity) in addition to maximizing the net benefits. These concerns can be
indicated by performance measures of equity, adequacy and productivity, respectively
(Gorantiwar and Smout, 2005).
As explained by Abernethy (1986); Bos (1997) and Gorantiwar and Smout (2005),
the productivity is related to output from the system (in this case benefits or crop
production) in response to the input added to the system (in this case water); equity is the
allocation of land area and water among the users in a fair manner (for example
proportionate to total land holding or cultivable command area of each farmer) and
adequacy deals with matching water supply to the crop grown by each farmer relative to its
demand over the irrigated land area. Equitable and adequate water supplies are also
necessary to reduce the conflicts at micro levels (i.e. within irrigation scheme). Thus it is
important for managers of irrigation schemes to develop allocation plans that optimize
productivity, equity and adequacy.
Currently, in the traditional Warabandi systems (North India and Pakistan) and
rigid Shejapali systems (Southern India), the irrigation authorities attempt to achieve equity
6
by allocating water in proportion to farmers’ area or demand (Malhotra, 1982 and
Mandavi, 1998). However failure to consider conveyance and field losses, soil type etc.,
make the allocation inequitable and water delivery schedules unreliable (Latif & Sarwar,
1994; Khepar et al., 2000 and Smout & Gorantiwar, 2005). For example, the equitable
allocation of water to different outlets at the canal headworks on the basis of the cultivable
area of each outlet will result in inequitable distribution of water as the outlets towards the
head of the canal will be supplied with a higher proportion compared to outlets towards the
tail of the canal because of the losses of water in the process of conveyance. Hence it is
necessary to develop an optimum allocation plan and water delivery schedules that include
the aforesaid performance measures. This paper presents the methodology to include
equity and adequacy while developing the optimum allocation plans.
The inclusion of equity and adequacy requires models that develop the optimum
allocation plans considering the heterogeneous nature of the irrigation schemes (i.e. large
schemes with varied climate, soils and cropping patterns, different characteristics of water
distribution systems, water scarcity etc.). Earlier mentioned studies that aimed at producing
optimum allocation plans did not consider all these complexities together. Previous studies
produced optimum allocation plans either by considering the entire irrigation scheme as a
single field model (Matanga & Marino, 1979; Yaron & Dinar, 1982; Mainuddin et al.,
1996; Sahoo et al., 2001; Sunantara & Ramirez, 1997 and Paul et al., 2000) or multi-field
models where both land and water resources were not optimised (Sritharan et al., 1988;
Shyam et al., 1994 and Onta et al., 1995). Therefore these methodologies can not produce
the allocation plans that optimize productivity, equity and adequacy. The simulation-
optimization model (Area and Water Allocation Model, AWAM) developed by Gorantiwar
(1995) and Smout & Gorantiwar (2005) for producing the optimum allocation plans and
water delivery schedules for irrigation schemes takes account of these complexities.

7
Therefore AWAM was chosen to examine the methodology for including equity and
adequacy in the allocation process.
The paper briefly explains the model, AWAM, used for including the performance
measures followed by the section explaining the methodology developed for inclusion of
equity and adequacy while allocating land area and water to different crops cultivated in
different parts of the irrigation scheme. The paper further explains the case study used for
describing the applicability of the developed methodology followed by discussion on
results obtained for the case study.
Description of model- AWAM
The AWAM model (Gorantiwar, 1995 and Smout & Gorantiwar, 2005) allocates the land
area and available surface water to different crops cultivated in different parts of the
irrigation scheme to maximize the net benefits from the irrigation. AWAM model was
developed for the irrigation schemes which operate under rotational water supply and not
for the schemes where in water is delivered on demand. AWAM model has the following
four phases and is executed for each irrigation interval or a set of irrigation intervals over
the irrigation season or year.
1. Generation of irrigation strategies 2. Preparation of irrigation programmes
3. Selection of irrigation programmes 4. Optimum allocation of resources
Generation of irrigation strategies
The area of an irrigation scheme with similar climate (Region), soil (Soil group) and crop
is termed as Crop-Soil-Region (CSR) unit (but this is not a physical division of the

8
irrigation scheme). As stated earlier, water scarcity in these schemes may make deficit
irrigation more profitable. There are several ways to provide deficit irrigation in irrigation
scheme for a specified CSR unit. The optimal way has to be selected by considering all
CSR units, water availability and characteristics of the command area of the irrigation
scheme together (Keller et al., 1992 and Gorantiwar & Smout, 2003). Hence optimal
allocation of water requires estimates of the outputs obtained from several possible
strategies that are based on different combinations of deficit (percentage moisture stress in
the soil root zone on the day of irrigation) over all the irrigation periods (Gorantiwar &
Smout, 2003). In this phase (Phase 1) irrigation strategies are generated for each CSR unit
for a specified set of irrigation intervals. This results in several irrigation strategies for each
CSR unit, each with variable deficit for each irrigation.
Preparation of irrigation programme
In this phase an irrigation programme that consists of information on yield/benefits and
irrigation requirement (depth) per irrigation is prepared for each irrigation strategy of each
CSR unit for a specified set of irrigation intervals. The irrigation programme is prepared
from the following two sub-models.
• SWAB: In response to deficit over each irrigation (specified in irrigation strategy), this
sub-model simulates daily soil moisture in the soil root zone, estimates daily actual
crop evapotranspiration, the irrigation requirement (depth) per irrigation and the other
related parameters.
• CRYB: This sub-model estimates crop yield from the actual evapotranspiration
estimated in SWAB sub-model and computes net benefits.

9
Selection of irrigation programmes
Phase 2 may generate many irrigation programmes of which several may not be important.
For example the irrigation programmes generated with irrigation strategies having full
deficit for successive irrigations may simulate zero yield or the irrigation programmes
generated with irrigation strategies having no deficit for successive irrigations may
simulate maximum yield but with excessive irrigation water requirement. Moreover some
of these programmes may not be optimal and even if included in the optimization model of
the fourth phase will not appear in the solution. Incorporation of all these programmes in
the optimization model may also make the problem computationally infeasible to solve.
Therefore the number of irrigation programmes for the given unit is restricted by selecting
only optimal irrigation programmes. Thus the purpose of this phase (Phase-3) is to select
for each CSR unit a specified number of irrigation programmes, which are both optimal
and efficient according to specified criteria.
Optimum allocation of resources
This phase (Phase-4) of the model allocates land and water resources optimally to different
crops cultivated on different soils in different allocation units. It utilizes the selected
irrigation programmes generated in Phase 3.
The entire irrigation scheme is physically divided into a number of smaller units called
“Allocation Units” (AU) over which land and water resources are allocated. These units
may include different soils and crops however the climate is assumed to be uniform over a
particular AU. Note that, the climatic conditions may vary across different AUs.

10
The need to divide the irrigation scheme into several AUs arises from the
heterogeneous nature and large extent of the irrigation scheme. By dividing the scheme in
this way it is possible to make allocation of resources, water delivery schedules and
management of the irrigation scheme efficient. The largest possible size of an AU is the
size of the irrigation scheme itself and the smallest size of an AU is an individual farm.
The intermediate sizes are the command areas of the secondary, tertiary and quaternary
canals or groups of these canals.
Phase 4 of the model allocates land and water resources optimally to Crop-Soil (CS)
units of each AU. A CS unit is a unit with similar crop and soil properties within an AU.
This phase performs the allocation in three stages.
• Stage-1: The phase-3 selects the specified number of irrigation programmes for
each CSR unit. In this stage of Phase-4, each CS unit of an AU is assigned with the
irrigation programmes of CSR unit having the same crop, soil and climate. As
stated earlier CSR unit is not a physical division of the irrigation scheme and hence
the distribution and conveyance efficiencies can not be considered while working
out the irrigation requirements for each irrigation. The AU is a physical division of
the irrigation scheme and hence these efficiencies are included at this stage by
determining the irrigation requirements for each irrigation appropriately.
• Stage-2: In this stage, the resources are allocated to each CS unit of each AU for
the chosen objective (maximization of net benefits) and constraints (resource
availability, physical and output requirement) with the Resource Allocation (RA)
sub model. The RA sub model is solved by linear programming. The decision
variables are the areas to be irrigated under different crops on each soil type (CS) of
each AU and following different irrigation scheduling as used in irrigation
programmes prepared for the corresponding CS of AU (see equation 1). Note that

11
these irrigation programmes are prepared in Phase-2; screened in Phase-3 and
modified in Stage-1 of Phase-4. The output of the model is thus the area to be
irrigated under different crops cultivated on each soil type of AU and the
corresponding irrigation programme. Thus this stage gives optimum allocation
plan.
• Stage-3: In this stage, the water release schedule for the canal system for the
optimum allocation plan is prepared by knowing the irrigation scheduling of the
selected irrigation programme for each CS unit of AU (obtained in Stage 2 of Phase
4).
Modified model for performance based land area and water allocation plans
The AWAM Model (Gorantiwar, 1995 and Smout & Gorantiwar, 2005) described in the
previous section maximizes the net benefits and thus in turn maximizes the productivity. In
this section the methodology is proposed to include maximization of equity and adequacy
in the AWAM model (Figure 1). The objective function proposed in AWAM for the
maximization of the net benefits is given below by equation (1). The readers are advised to
refer to Gorantiwar (1995) and Smout & Gorantiwar (2005) for details of the constraints.
∑∑∑ ∑= = = =
=na
1a
ns
1s
nc
1cpcsa
np
1ppcsa
a sa csa
ANBOBJMax (1)
where a = index for AU, s = index for soil group in allocation unit, c = index for crop in
soil group (sth soil group of ath allocation unit), p = index for irrigation programme for crop
(cth crop in sth soil group of ath allocation unit), na = total number of allocation units, nsa =
total number of soil groups in ath allocation unit., ncsa = total number of crops in sth soil
12
group of ath allocation unit, nspcsa = total number of irrigation programmes of cth crop in sth
soil group of ath allocation unit, OBJ = the value of objective function (currency unit), NB
= net benefits obtained from cth crop irrigated with pth irrigation programme on sth soil of
ath allocation unit (currency unit/ha), A = Area to be allocated to cth crop irrigated with pth
irrigation programme on sth soil of ath allocation unit (ha).
Inclusion of equity
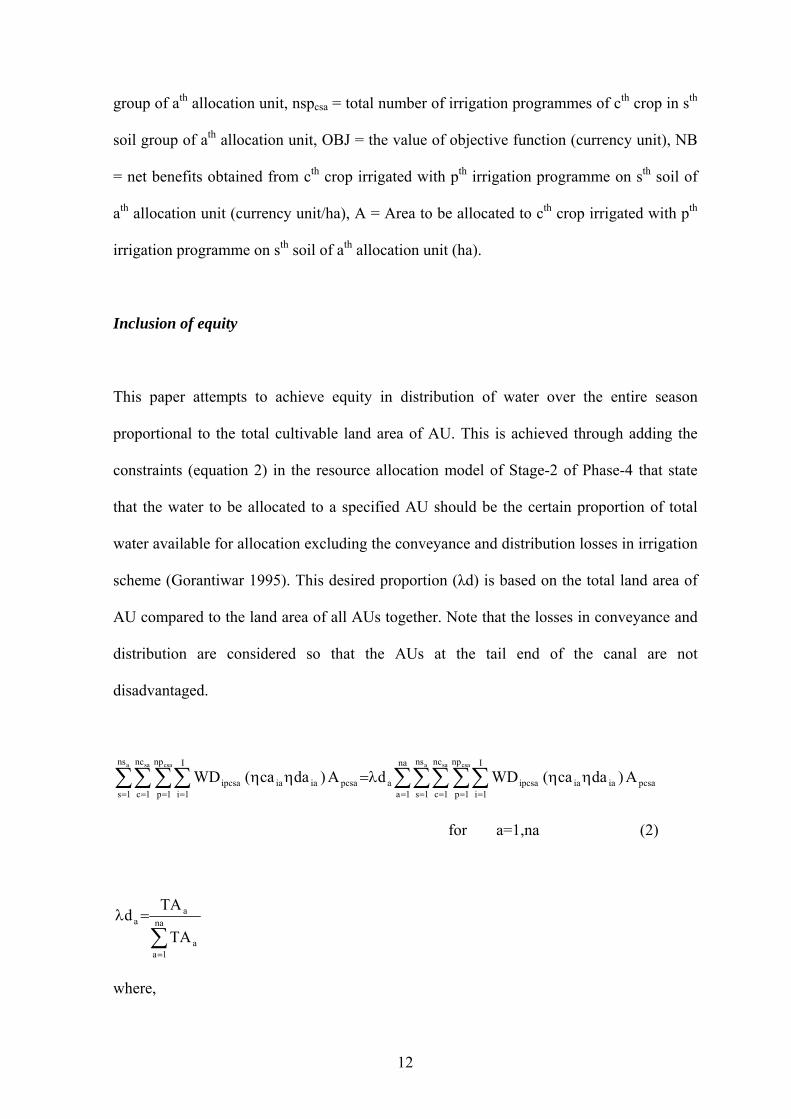
This paper attempts to achieve equity in distribution of water over the entire season
proportional to the total cultivable land area of AU. This is achieved through adding the
constraints (equation 2) in the resource allocation model of Stage-2 of Phase-4 that state
that the water to be allocated to a specified AU should be the certain proportion of total
water available for allocation excluding the conveyance and distribution losses in irrigation
scheme (Gorantiwar 1995). This desired proportion (λd) is based on the total land area of
AU compared to the land area of all AUs together. Note that the losses in conveyance and
distribution are considered so that the AUs at the tail end of the canal are not
disadvantaged.
∑∑∑∑∑∑∑∑∑= = = = == = = =
ηηλ=ηηna
1a
ns
1s
nc
1c
np
1p
I
1ipcsaiaiaipcsaa
ns
1s
nc
1c
np
1p
I
1ipcsaiaiaipcsa
a sa csaa sa csa
A)daca(WDdA)daca(WD
for a=1,na (2)
∑=
=λ na
1aa
aa
TA
TAd
where,

13
i = index for irrigation, I = total number of irrigations, WDipcsa = the depth of water to be
delivered from the headworks to cth crop irrigated with pth irrigation programme on sth soil
of ath allocation unit for ith irrigation (m), iacaη = conveyance efficiency of canal network
for ith irrigation for ath allocation unit (fraction), iadaη = distribution efficiency for ith
irrigation of ath allocation unit (fraction), TAa is the total cultivable area or land holding of
ath allocation unit (ha).
Inclusion of adequacy
As stated earlier, adequacy deals with matching water supply to the crop grown by each
farmer relative to its demand. The AWAM model while allocating land area and water
resources makes use of several irrigation programmes corresponding to irrigation strategies
that are based on deficit irrigation and finally selects one for each CS unit of AU. The
irrigation scheduling corresponding to a selected irrigation programme may not match the
crop water demand and hence the water deliveries (obtained from Stage-3 of Phase-4) may
not be adequate. Therefore when adequacy is to be maximized, it is proposed to obtain in
Phase-2, only one irrigation programme for each CS unit that schedules the water
deliveries matching the crop water demand (i.e. to deliver the depth of water to CS unit of
AU such that at every irrigation the soil moisture in the root zone of the crop is raised to
field capacity) and consider this irrigation programme for optimization in Phase 3. The
allocation plan obtained from RA sub model, in this case, will schedule the water
deliveries according to crop water demand on the allocated land area to the different crops
in AU. This allocation plan may give lower total net benefits from the irrigation scheme
compared to the allocation plan that considers several irrigation strategies based on deficit
irrigation. This is because deficit irrigation would allow available water in an irrigation

14
scheme to spread over a larger area and hence, though the net benefits per unit area are
decreased, the total net benefits from the irrigation scheme may be greater when compared
to full irrigation. It is to be noted here that the water deliveries are adequate over the area
which is allocated for irrigation and this area is obtained from RA sub model.
Different scenarios resulting from combination of productivity, equity and adequacy and
their quantification
As stated earlier, the AWAM model presented with modifications in this paper optimizes
the productivity performance measure, while maximizing the other two performance
measures of equity and adequacy. This results in the following four scenarios (Figure 1).
1. Optimization of productivity
2. Optimization of productivity for maximum equity of supply to irrigated areas
3. Optimization of productivity for maximum adequacy of supply to irrigated
areas
4. Optimization of productivity for maximization of equity and adequacy
Productivity is quantified as the ratio of the output (measured as net benefits in
monetary units) to the maximum output attainable from the resources available (land and
water). Equity is related to the distribution of water to different allocation units based on
cultivable command area (CCA) and can be quantified by allocation ratios of different
AUs as proposed by Gorantiwar (1995) and Gorantiwar & Smout (2005). The allocation
ratio for a specified AU is the ratio of actual allocation proportion as a result of allocation
of water to desired allocation proportion for this AU (λd). The interquartile allocation ratio
(IQAR) is used as the measure of equity. IQAR is defined as “the average allocation ratio

15
of the poorest quarter divided by the average allocation ratio of the best quarter”
(Gorantiwar, 1995 and Gorantiwar & Smout 2005). Adequacy is the ratio of water
allocated and the maximum water demand for a particular set of irrigation intervals.
The maximum productivity is obtained by generating several irrigation strategies
that allocate water optimally. Thus the performance measure of productivity is addressed
in Phase-1 and Stage-2 of Phase-4 of the model. In the modified AWAM model
maximization of equity is addressed in Stage-2 of Phase-4 of the model by allocating water
to each AU proportional to CCA of the AU. The maximum adequacy is obtained by
irrigating the CSR unit to its field capacity (full irrigation) and thus this issue is addressed
in Phase-2. It should be noted here that in addition to the constraints for equity, other
constraints are also included to account for total water use, physical capacity, resource
availability and output requirements. The details can be found in Gorantiwar (1995) and
Smout & Gorantiwar (2005).
Case study irrigation scheme
In this paper, the applicability of modified AWAM model to obtain the performance based
land area and water allocation plans is demonstrated with the help of case study on the
“Nazare Medium Irrigation Scheme” in a semi-arid region of Maharashtra State of India.
This irrigation scheme is representative of storage reservoir irrigation schemes that operate
under rotational water supply in south Asia.
There are three distinct crop seasons within the irrigation scheme: winter (Rabi),
15th October to 14th February; summer, 15th February to 14 June; and rainy (Kharif), 15th
June to 14th October. As little rainfall is received in the Rabi season, the crops grown is
this season are supplied with irrigation water. In the summer, there is no rainfall and

16
evapotranspiration is high, therefore irrigations are applied to a limited extension. Most of
the rainfall is received in the Kharif (monsoon) season. Therefore crops grown in this
season need one or two irrigations (protective irrigations) only. The irrigations during
Kharif season are of little interest in this study as the reservoir fills during this season.
Therefore in this study, the irrigation season was considered to spread over Rabi and
summer crop seasons only. Normally the irrigation interval in Rabi season is 21 days and
in summer season is 14 days.
The gross capacity and dead storage capacity of the reservoir are 22.31 and 5.68
Mm3, respectively. One main canal originates from the headworks. The full supply
discharge and the length of the main canal are 1.53 m3/s and 3.05 km, respectively. One
distributory canal with carrying capacity of 1.53 m3/s emerges from the main canal, the
length of which is 11.75 Km. Some of the outlets are provided with screw type gates and
some are without gates. However, the screw type gates are being considered for all the
outlets. The cultural command area (CCA) of the irrigation scheme is 3539 ha. There are
28 direct outlets (4 on the main canal and 24 on the distributory canal) and four minors (all
on distributory canal) with 9 outlets. The details of the outlets on the minors could not be
obtained and therefore CCA of all 28 outlets and 4 minors were considered as allocation
units, resulting in 32 AUs. The data related to allocation units interms of different
efficiencies (application, distribution and conveyance); soil types etc were obtained from
different sources (Stofkoper & Tilak, 1992 and Irrigation Research Development, 1992)
The climatological data were collected from the daily records of the Meteorological
Observatory of the nearest agricultural university (Mahatma Phule Agricultural University,
Rahuri). The same data series was used for the reservoir (for estimating the water
evaporation) and command area (for estimating the reference crop evapotranspiration and
bare soil evaporation). The climate over the entire command area was assumed as uniform
17
and thus there was only one 'Region'. The command area is characterized with four
different types of soils. In the present study as two crop seasons formed the irrigation
season, gram, sorghum, onion, wheat (Rabi crops), groundnut and sunflower (summer
crops) were considered in the analysis. Based on the previous trend in the irrigation
scheme, a fixed cropping distribution was assumed of gram-25%, sorghum-20%, onion-
10% and wheat-15 % in Rabi and Sunflower –10 % and groundnut-20% in summer season.
This fixed cropping distribution was considered for investigating the issues under
consideration in this paper, though the AWAM model can also consider the free cropping
distribution in which the model is free to select any crops depending on which crops
produce maximum total net benefits from the irrigation scheme (refer to Gorantiwar, 1995
and Smout and Gorantiwar, 2005).
Results
The allocation plans and water delivery schedules were obtained for the four scenarios
stated earlier. For each scenario, seven sets of irrigation interval were considered. These
were: 14 days (I-14); 21 days (I-21); 28 Days (I-28); 35 days (I-35) {both Rabi and
summer seasons}; 21 in Rabi and 14 in summer (I-21-14); 28 in Rabi and 21 in summer (I-
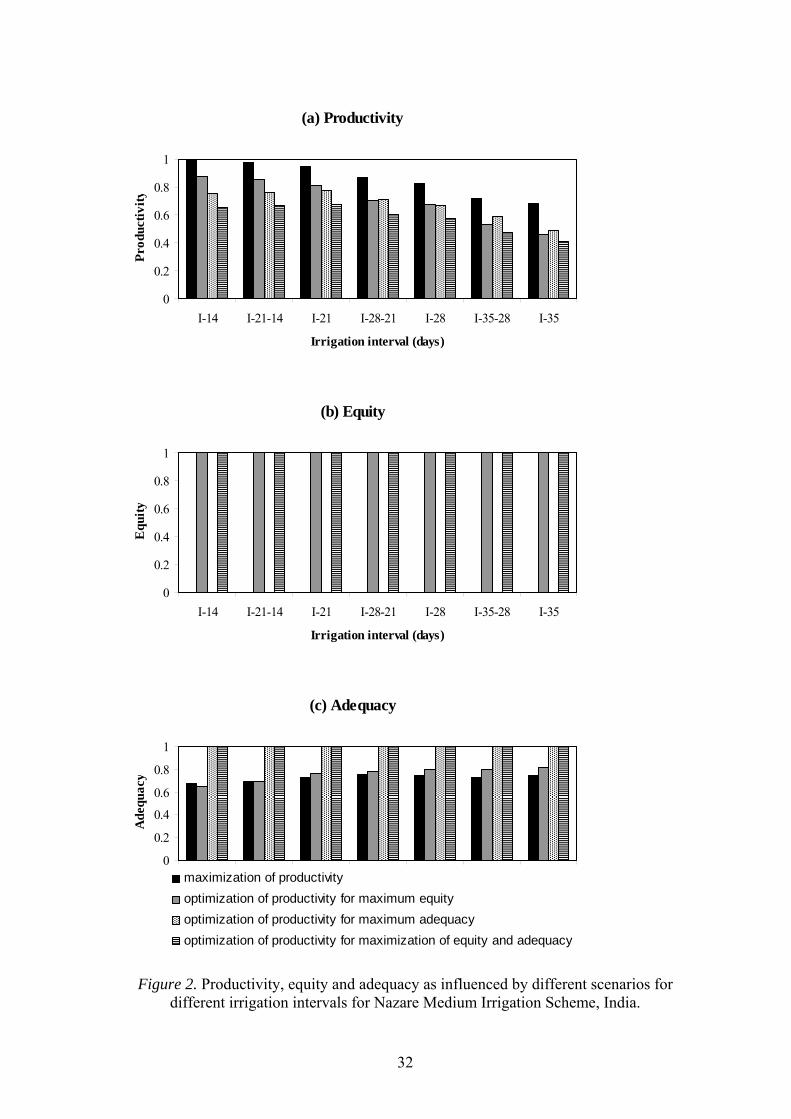
28-21); and 35 in Rabi and 21 in summer (I-35-21). The productivity, equity and adequacy
values associated with the allocation plans and water delivery schedules, for the four
scenarios and seven sets of irrigation interval are presented in Figure 2.
The maximum net benefit Bmax, was obtained for the irrigation interval of 14 days
under the “optimizing productivity” scenario. Hence the productivity values for different
scenarios and irrigation intervals were computed with reference to Bmax by considering this
value as the maximum attainable.
18
Figure 2 (a) shows that the irrigation interval influences the productivity. However,
the trend of influence depends on the scenarios. It is observed from Figure 2 (a) that the
productivity values decrease with the irrigation interval for both “optimizing productivity”
and “optimizing productivity for maximum equity” scenarios. This is due to the
consideration of several irrigation strategies based on the deficit irrigation in the model for
optimum productivity. According to this approach, deficit irrigation is followed by an
optimum combination of skipping the irrigation and applying lower irrigation depths (less
than the full irrigation depths). The smaller irrigation interval adds to the flexibility in
skipping the irrigations for a particular crop-soil-region unit and hence optimizes the use of
water more efficiently than the larger irrigation interval.
In the scenarios of “optimizing productivity for maximum adequacy” and “optimizing
productivity for maximum adequacy and equity”, the productivity values marginally
increase with irrigation interval until an irrigation interval of 21 days after which it drops
drastically. These scenarios use a single irrigation strategy of full irrigation i.e. providing
the irrigation to raise the soil moisture in the root zone to field capacity. According to this
strategy, the irrigation interval of 14 days gives maximum net returns per unit area for most
of the crops considered in this study (Gorantiwar, 1995). Prolonging the interval to 21 days
causes the deficit irrigation i.e. irrigating a larger area and giving slightly higher total net
returns. However when the irrigation interval is further prolonged from 21 days to 35 days,
the crops were subjected to excessive stress with drastic yield reduction and thus reducing
the productivity greatly. In Figure 2 (a), on comparing productivity values between the
“optimizing productivity” and “optimizing productivity for maximum equity” scenarios
and the “optimizing productivity for maximum adequacy” and “optimizing productivity for
maximum adequacy and equity” scenarios, it is seen that the productivity values are lower

19
for the scenarios for maximum equity. This is due to the fact that for maximum equity less
productive allocation units are also allocated with water and thus reducing the productivity.
As expected the equity is 1.0 for the scenarios of maximum equity. However it should
be noted that for the scenarios that do not include maximum equity, the resulting equity is
zero (Figure 2 (b)). Note that since equity is zero, none of the two columns for the options
"maximization of productivity" and "optimization of productivity for maximum adequacy"
appear in the Figure 2 (b). This indicates that the resources are getting allocated to only
highly productive allocation units (with no concern for equity).
Similarly adequacy is 1.0 for the scenarios of maximum adequacy. For the scenarios
that do not include maximum adequacy, adequacy ranges from 0.6 to 0.8 (Figure 2 (c)),
and there is a trend of slight increase in adequacy with the increase in irrigation interval.
This indicates that for scenarios that do not include maximum adequacy, when irrigation
intervals are increased, the depth of irrigation tends towards the full irrigation depth but
over the lesser land area (for obtaining maximum productivity) compared to when
irrigation intervals are smaller. This in turn reduces productivity and increases adequacy
for larger irrigation intervals.
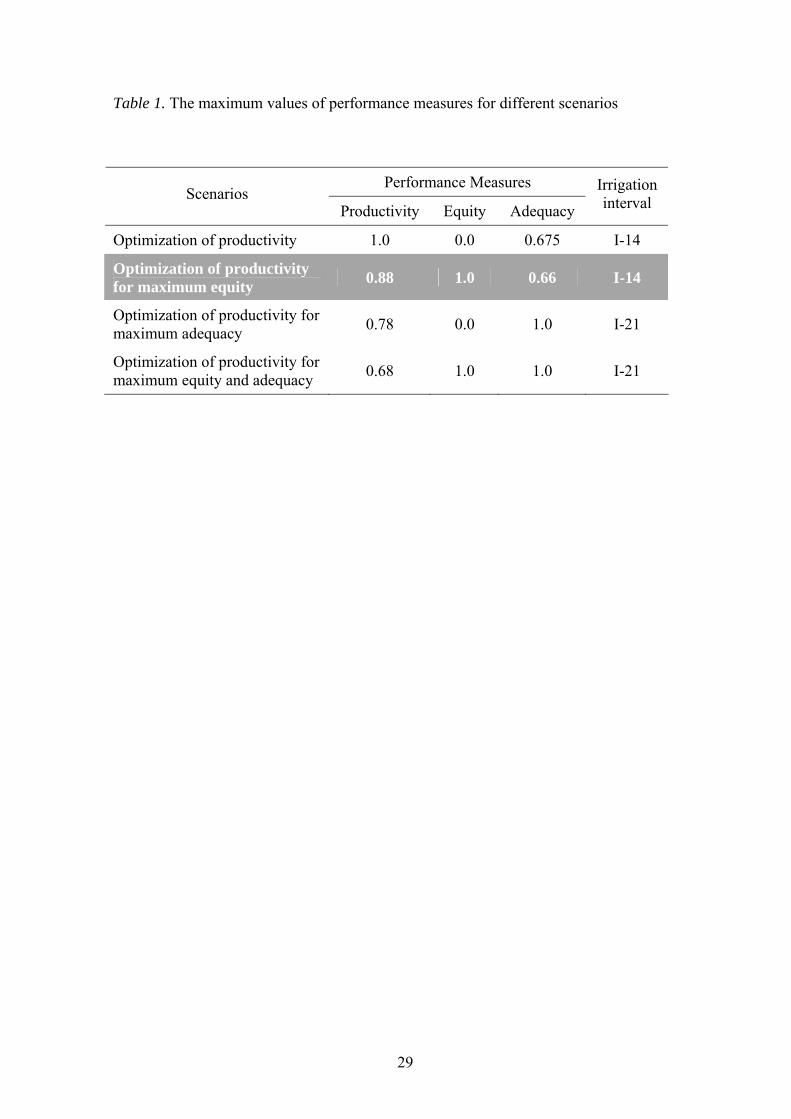
Table 1 summarizes the performance measures of the optimal solution (amongst
different sets of irrigation interval) obtained for each scenario. It can be seen from Table 1
that the reduction in productivity between scenarios ‘optimization of productivity’ and
‘optimization of productivity for maximum equity’; ‘optimization of productivity’ and
‘optimization of productivity for maximum adequacy’; and ‘optimization of productivity’
and ‘optimization of productivity for maximum equity and adequacy’ is 12, 22, and 32 per
cent respectively. This indicates the loss in productivity for ensuring maximum adequacy,
maximum equity and both respectively. It can also be observed from the first and second
rows of Table 1 that when ensuring maximum equity, there is a reduction in productivity.

20
This can be explained by the fact that for maximum equity, resources are allocated equally
to all the allocation units irrespective of their productivity.
Similarly the first and third rows of Table 1 indicate that when ensuring maximum
adequacy, there is a reduction in productivity. This is because in the process of ensuring
maximum adequacy, less area is allocated for irrigation. Thus lower total net benefits are
obtained from the irrigation scheme (hence reduction in productivity) though the adequate
irrigation gives higher net benefits per unit area compared to when maximum productivity
is achieved (by adopting deficit irrigation).
The Table 1 also indicates that when adequacy is maximum i.e. 1.0, then equity is 1.0
and 0.0 and when adequacy is minimum (i.e. 0.66-0.68), then also equity is 1.0 and 0.0.
This is because of the fact that the adequacy is computed over the land area which is
allocated for irrigation and the model attempts to achieve equity (or inequity) for
maximum adequacy or maximum productivity (minimum adequacy). Thus clearly the
three performance measures of productivity, equity and adequacy are in conflict with each
other.
For this case study of Nazare Irrigation Scheme, where the objective is to achieve
maximum equity with the productivity, the allocation plan for the scenario of maximum
equity would be useful (shown in shaded portion of Table 1). The details of this allocation
plan are presented in Table 2 (see the Area and Water columns of ‘Allocation by proposed
methodology’). The Table 2 also presents the allocation by current practice (see the Area
and Water columns of ‘Allocation by current practice’). As stated earlier the current
practice allocates the resources without considering the irrigation losses. These losses are
different for different AUs. If we compare the allocation ratios of current practice and
proposed methodology (presented in Table 2), it is clearly seen that the current practice
allocates more than desired water to the AUs near the head of the canal and less to the AUs
21
at the tail of the canal (allocation ratios vary from 1.47 to 0.73), whereas the proposed
methodology allocates water resources equitably (allocation ratio is 1.0 for all AUs). This
is also reflected in the value of equity which is 1.00 for the proposed methodology and
0.58 for the current practice (however current practice increased the productivity slightly
i.e. by 2.5%). This type of inequitable distribution by current practice will not give
confidence to the farmers and hence farmers will tend to draw as much water as possible
whenever they get water and thus the entire schedule becomes unreliable. Hence the need
to consider the schedule obtained by proposed methodology which is equitable.
Figure 3 shows the relationship between productivity and equity for the irrigation
interval of 14 days (adequacy is not considered in the development of this relationship). It
is observed that with the increase in equity, the productivity decreases. Note that the
productivity is high when equity is low as water is not allocated to less productive units
such as units at tail end and units with less productive soils. However for high equity,
water spreads proportionally over all the units, thus making water allocation to less
productive units. This is in contrast to Abernethy (1986) and Khepar et al. (2000) who
argued that the equitable distribution of water is also necessary for maximizing
productivity. Their argument was based on the notion that the farmers at head apply more
water than is needed for potential yield and excess water will not improve the productivity
but will reduce it. Had that excess water been diverted to other parts of the scheme
requiring water the production would have increased. However when water is scarce and
managed optimally, the productivity and equity are conflicting issues, as found in this
study.
Conclusions

22
Irrigation schemes in the semi arid and arid regions in developing countries are
characterized by water scarcity, the heterogeneity in soils, crops, climate, and water
distribution network and the large number of users. Therefore the development of optimum
land and water allocation plans and operable water delivery schedules that consider these
aspects are valuable for these irrigation schemes. Earlier studies aimed at producing the
optimum allocation plans but did not consider the complexities associated with water
scarcity; the heterogeneity in soils, crops, climate; water distribution network etc. The
simulation-optimization model (Area and Water Allocation Model, AWAM) produces the
optimum allocation plans and water delivery schedules for the irrigation schemes with
limited water and under rotational water supply. This model considers all associated
complexities.
According to the local situation, the performance objectives of productivity, equity or
adequacy may be appropriate. Thus it is important that irrigation managers have access to
allocation plans and schedules that optimize these performance measures. The previous
studies did not incorporate these performance measures together. This study developed the
methodology to include these performance measures while developing the optimum
allocation plans, and incorporated this methodology into the AWAM model. The inclusion
of these performance measures enables the irrigation authorities to select the appropriate
allocation plans depending on the local situation and to match the performance of the
irrigation scheme to the objectives/goals of the irrigation scheme.
The allocation plans and the water delivery schedules were obtained for the case study
of Nazare Irrigation Scheme, Maharashtra, India for different sets of irrigation intervals
and for four different scenarios: optimization of productivity; optimization of productivity
for maximum equity of supply to irrigated areas; optimization of productivity for

23
maximum adequacy of supply to irrigated areas; and optimization of productivity for
maximization of equity and adequacy. The results indicated that:
• Productivity values decrease with the irrigation interval for both “optimizing
productivity” and “optimizing productivity for maximum equity” scenarios.
• In the case of “optimizing productivity for maximum adequacy” and “optimizing
productivity for maximum adequacy and equity” scenarios the productivity values
marginally increase with irrigation interval until an irrigation interval of 21 days.
Beyond this productivity drops drastically.
• Productivity values are lower for the scenarios for maximum equity, as water is also
allocated to less productive allocation units.
• For scenarios with maximum equity, equity is 1.0. For scenarios that do not include
maximum equity the resulting equity is zero. This shows resources are being allocated
to only highly productive allocation units (no concern for equity).
• Adequacy is 1.0 for scenarios of maximum adequacy. For the other scenarios that do
not include adequacy, adequacy ranges from 0.6 to 0.8.
In general, the results indicated that the performance objectives of productivity, equity
and adequacy conflict with each other, if the water resources are allocated optimally. For
the irrigation schemes where water resources are limited such as Nazare Irrigation Scheme,
India, where the objective is to achieve maximum equity with the productivity, the
allocation plan for the scenario of maximum equity that can be obtained with the modified
AWAM model would be useful. It should be noted here that this paper only considers
methodology for optimum water allocation for canal irrigation schemes under rotational
water supply from water sources such as a storage reservoir. In some circumstances
however optimum water allocation plan may entail combining the use of canal water with

24
pond water and groundwater (wells). However the issue of conjunctive use of water for
irrigation is not investigated in this paper.
25
References
Abernethy, C.L. 1986. Performance Measurement in Canal Water management: A
Discussion. ODI-IIMI Irrigation Management Network Paper 86/2d, pp. 25.
Bos, M.G. 1997. Performance indicators for irrigation and drainage. Irrigation and
Drainage Systems 11: 119–137.
English, M. & Nuss, G. S. 1982. Designing for Deficit Irrigation. Journal of Irrigation and
Drainage Engineering, ASCE 108(IR2):91-106.
Gorantiwar, S. D. 1995. A Model for Planning and Operation of Heterogeneous Irrigation
Schemes in Semi-Arid Regions under Rotational Water Supply A Ph. D. Thesis,
Loughborough University of Technology, Loughborough, Leicestershire, UK.
Gorantiwar, S.D. & Smout, I. K. 2005. Performance assessment of irrigation water
management of heterogeneous irrigation schemes: 1. A framework for evaluation.
Irrigation and Drainage Systems 19:1-36.
Gorantiwar, S.D. & Smout, I.K. 2003. Allocation of scarce water resources using deficit
irrigation in rotational systems. Journal of Irrigation and Drainage Engineering,
ASCE 29(3):155-163.
Hargreaves, G. H. & Samani, Z. A. 1984. Economic Considerations of Deficit Irrigation.
Journal of Irrigation and Drainage Engineering, ASCE 110(4):343-358.
Hennessy, J. 1993. Water Management in the 21st Century. In: Proceedings of the 15th
Congress on Irrigation and Drainage: Water Management in the Next Century held at
the Hague, the Netherlands, 1-J, pp. 1-31.

26
Irrigation Research Development. 1992. Report of Pre-Irrigation Soil Survey of the
Command of Nazare Medium Irrigation Project, Dist.: Pune. Irrigation Research
Development, Department of Irrigation, Pune, Maharashtra State, India.
Keller, J., Sivanappan, R. K. & Varadan, K. M. 1992. Design Logic for Deficit Drip
Irrigation of Coconut Trees. Irrigation and Drainage Systems 6:1-7.
Khepar, S.D., Gulati, H.S., Yadav, A.K. & Brar, T.P.S. 2000. A Model for Equitable
Distribution for Canal Water. Irrigation Science 19:191-197.
Latif, M. & Sarwar, S. 1994. Proposal for Equitable Water Allocation for Rotational
Irrigation in Pakistan. Irrigation and Drainage Systems 8:35-48.
Mainuddin, M., Gupta A.D., & Onta, P.R. 1996. Optimal Crop Planning Model for an
Existing Groundwater Irrigation Project in Thailand. Agricultural Water
Management 33:43-62.
Malhotra, S.P. 1982. The Warabandi System and its Infrastructure. Central Board of
Irrigation and Power, New Delhi, India.
Mandavi, A.B. 1998. Modernization of Irrigation System Operational Management by
Way of Canal Automation in India. In: Modernization of Irrigation System
Operations: Proceedings of the 5th ITIS Network International Meeting,
Aurangabad, India, 28-30 October 1998, the Food and Agriculture Organization of
the United Nations, Regional Office for Asia and the Pacific, Maliwan Mansion, 39
Phra Athit Road Bangkok 10200, Thailand.
Matanga, G. B. & Marino, M. A. 1979. Irrigation Planning 1. Cropping Pattern. Water
Resources Research 15(3):672-678.
Onta, P. R., Loof, R. & Banskota, M. 1995. Performance Based Irrigation Planning under
Water Shortage. Irrigation and Drainage Systems 9:143-162.

27
Paul, S., Panda, S.N. & Nagesh Kumar, D. 2000. Optimal irrigation allocation: A
multilevel approach. Journal of Irrigation and Drainage Engineering, ASCE 126(3):
149-156.
Pinstrup-Andersen, P., Pandya-Lorch, R. & Rosegrant, M.W. 1997. The world food
situation: recent developments, emerging issues, and long- term prospects. Food
Policy Report, International Food Policy Research Institute, Washington, D.C.,
December 1997, 36pp.
Sahoo, G.B., Loof, R., Abernethy, C.L. & Kazama, S. 2001. Reservoir Release Policy for
Large Irrigation System. Journal of Irrigation and Drainage Engineering, ASCE
127(5):302-310.
Shyam, R., Chauhan, H. S. & Sharma, J. S. 1994. Optimal Operation Scheduling Model for
a Canal System. Agricultural Water Management 26:213-225.
Smout, I.K. & Gorantiwar, S.D. 2005. A Multilevel Approach for Optimizing Land and
Water Resources and Irrigation Deliveries for Tertiary Units in Large Irrigation
Schemes: 1.Method. Journal of Irrigation and Drainage Engineering, ASCE 131(3):
254-263.
Sritharan, S. I., Clyma, W. & Richardson, E. V. 1988. On-farm Application System Design
and Project-Scale Water Management. Journal of Irrigation and Drainage
Engineering, ASCE 114(4):622-643.
Stofkoper, J. & Tilak, M.B.G. 1992. A Report on Action Research Program in Nazare
Medium Irrigation Project, Maharashtra State. Pune Irrigation Division, Pune, India.
Sunantara, J.D. & Ramirez, J.A. 1997. Optimal Stochastic Multicrop Seasonal and
Intraseasonal Irrigation Control. Journal of Water Resources Planning and
Management, ASCE 123(1):39-48.
28
Trimmer, W. L., 1990. Applying Partial Irrigation in Pakistan. Journal of Irrigation and
Drainage Engineering, ASCE 116(3):342-353.
Vedula S., & Mujumdar, P.P. 1992. Optimal Reservoir Operation for Irrigation of Multiple
Crops. Water Resource Research 28(1):1-9.
Wardlaw, R. & Barnes, J. 1999. Optimal Allocation of Irrigation Water Supplies in Real
Time. Journal of Irrigation and Drainage Engineering, ASCE 125(6):345-354.
Yaron, D. & Dinar, A. 1982. Optimum Allocation of Farm Irrigation Water during Peak
Seasons. American Journal of Agricultural Economics 64 (November):681-689.
29
Table 1. The maximum values of performance measures for different scenarios
Performance Measures Scenarios
Productivity Equity Adequacy
Irrigation interval
Optimization of productivity 1.0 0.0 0.675 I-14
Optimization of productivity for maximum equity 0.88 1.0 0.66 I-14
Optimization of productivity for maximum adequacy 0.78 0.0 1.0 I-21
Optimization of productivity for maximum equity and adequacy 0.68 1.0 1.0 I-21

30
Table 2. Land area and water allocation plans by current practice and proposed methodology
Allocation by current practice Allocation by proposed methodology AU CCA
of AU (ha) Area
(ha) Water (ha-m)
Allocation ratio
Area (ha) Water (ha-m)
Allocation ratio
1 39 27.29 11.82 1.47 18.55 8.04 1.00 2 36 22.83 10.83 1.46 15.59 7.42 1.00 3 8 5.02 2.38 1.44 3.47 1.65 1.00 4 27 16.15 7.66 1.38 11.73 5.56 1.00 5 395 194.44 108.10 1.33 146.38 81.38 1.00 6 33 18.89 8.99 1.32 14.29 6.80 1.00 7 59 31.77 15.07 1.24 25.62 12.16 1.00 8 22 11.54 5.48 1.21 9.55 4.53 1.00 9 211 86.58 51.44 1.18 73.31 43.47 1.00 10 68 34.75 16.49 1.18 29.53 14.01 1.00 11 62 30.83 14.63 1.14 26.93 12.77 1.00 12 142 55.34 32.88 1.12 49.24 29.26 1.00 13 127 61.96 29.40 1.12 55.15 26.17 1.00 14 81 38.39 18.21 1.09 35.18 16.69 1.00 15 217 102.85 48.79 1.09 94.24 44.71 1.00 16 82 38.89 17.30 1.02 37.99 16.89 1.00 17 145 62.92 30.63 1.03 61.36 29.87 1.00 18 147 60.96 29.68 0.98 62.20 30.29 1.00 19 118 50.15 23.79 0.98 51.25 24.31 1.00 20 661 205.91 125.33 0.92 223.76 136.19 1.00 21 65 25.47 12.12 0.91 28.14 13.39 1.00 22 156 61.13 29.09 0.91 67.54 32.14 1.00 23 30 10.68 5.20 0.84 12.69 6.18 1.00 24 37 13.17 6.41 0.84 15.66 7.62 1.00 25 89 31.33 15.26 0.83 37.66 18.34 1.00 26 93 32.74 15.94 0.83 39.35 19.16 1.00 27 115 38.62 18.81 0.79 48.66 23.69 1.00 28 30 9.98 4.86 0.79 12.69 6.18 1.00 29 32 10.64 5.18 0.79 13.54 6.59 1.00 30 87 27.37 13.33 0.74 36.81 17.92 1.00 31 35 10.76 5.24 0.73 14.81 7.21 1.00 32 90 27.67 13.47 0.73 38.08 18.54 1.00
Total 3539 1457.02 753.81 0.58* 1410.95 729.15 1.00* (Note: *-These are equity values)

31
Figure 1. The flowchart of the modified Area and Water Allocation Model (AWAM)
For each Crop-Soil -Region (CSR)unit
Input data (crop, soil, climate, irrigation scheme &other)
Phase-1: Generation of irrigation strategies
Phase-2: Preparation of irrigation programmes with SWAB-CRYB sub model for each irrigation strategy generated in Phase-1
Phase-3: Selection of optimal and efficient irrigation programmes from those prepared in Phase-2
Phase-4
Stage-2: Allocation of the land and water resources to each CS unit of each allocation unit with objective of maximizing productivity and constraints with the Resource Allocation (RA) sub
Include equity constraints for maximizing equity
Output: Land area and water allocation plan and water delivery schedule
Stage-1: Preparation of irrigation programmes for each Crop-Soil (CS) unit of each allocation unit by modifying the irrigation programmes of the corresponding CSR
Stage-3: Preparation of canal water release schedules
Preparation of irrigation programmes with SWAB-CRYB sub models for the irrigation strategy of full irrigation for each CSR unit for maximization of adequacy
32
(a) Productivity
0
0.2
0.4
0.6
0.8
1
I-14 I-21-14 I-21 I-28-21 I-28 I-35-28 I-35
Irrigation interval (days)
Prod
uctiv
ity
(b) Equity
0
0.2
0.4
0.6
0.8
1
I-14 I-21-14 I-21 I-28-21 I-28 I-35-28 I-35
Irrigation interval (days)
Equ
ity
(c) Adequacy
0
0.2
0.4
0.6
0.8
1
I-14 I-21-14 I-21 I-28-21 I-28 I-35-28 I-35Irrigation interval (days)
Ade
quac
y
maximization of productivityoptimization of productivity for maximum equityoptimization of productivity for maximum adequacy optimization of productivity for maximization of equity and adequacy
Figure 2. Productivity, equity and adequacy as influenced by different scenarios for different irrigation intervals for Nazare Medium Irrigation Scheme, India.

33
0
0.2
0.4
0.6
0.8
1
0.84 0.88 0.92 0.96 1
Productivity
Equ
ity
Figure 3. The relationship between productivity and equity for irrigation interval of 14 days for Nazare Medium Irrigation Scheme, India
Related Documents