Heredity (1978),41 (3), 249-320 MODEL-FITTING APPROACHES TO THE ANALYSIS OF HUMAN BEHAVIOUR L. J. EAVES, KRYSTYNA A. LAST, P. A. YOUNG and N. G. MARTIN· Department of Genetics, University of 8irmingham, 8irmingham 815 2TT Received 10.i.78 1. Choice of Data Summary .' 2. The: Study of Twins. (i) Problems of the twin method (ii) The use of twins in tests of scale , (iii) Testing basic assumptions: the simple model (iv) Sex interactions (v) Testing assumptions about the environment (vi) Are there cultural effects? (vii) Competition, co-operation and the genetic environment (viii) The place and power of the twin. study 3. Towards a General Model: Alternatives to Twins (i) Parent-offspring studies (ii) The adoption study' (iii) The offspring and spouses of twins 4. The Analysis of Extended Data Sets . (i) The analysis of balanced pedigrees (ii) Environmental models in balanced pedigrees (iii) Model-fitting to unbalanced pedigrees 5. Longitudinal Studies 6. The Analysis of Multiple Variables Testing a psycho-genetical theory 7. Analysis of Specific Items: The Threshold Model (i) Item profiles (ii) Specific items 251 · 253 254 255 · 257 262 264 265 · 268 276 278 · 278 280 280 281 282 287 290 301 304 · 306 · 308 · 308 · 310 8. Discussion 9. References 313 . 316 SUMMARY Model-fitting methods are now prominent in the analysis of human behavioural variation. Various ways of specifying models have been proposed. These are identical in their simplest form but differ in the emphasis given to more subde sources of variation. The biometrical genetical approach allows flexi- bility in the specification of non-additive factQrs. Given additivity; the Present address: Department of Population Biology, Research School of Biological Sciences,' Australian National University, Canberra 2600, Australia. 41/3---A 249

Welcome message from author
This document is posted to help you gain knowledge. Please leave a comment to let me know what you think about it! Share it to your friends and learn new things together.
Transcript

Heredity (1978),41 (3), 249-320
MODEL-FITTING APPROACHES TO THE ANALYSIS OF HUMAN BEHAVIOUR
L. J. EAVES, KRYSTYNA A. LAST, P. A. YOUNG and N. G. MARTIN· Department of Genetics, University of 8irmingham, 8irmingham 815 2TT
Received 10.i.78
1. Choice of Data Summary .' 2. The: Study of Twins.
(i) Problems of the twin method (ii) The use of twins in tests of scale
, (iii) Testing basic assumptions: the simple model (iv) Sex interactions (v) Testing assumptions about the environment
(vi) Are there cultural effects? (vii) Competition, co-operation and the genetic environment
(viii) The place and power of the twin. study
3. Towards a General Model: Alternatives to Twins (i) Parent-offspring studies
(ii) The adoption study' (iii) The offspring and spouses of twins
4. The Analysis of Extended Data Sets . (i) The analysis of balanced pedigrees
(ii) Environmental models in balanced pedigrees (iii) Model-fitting to unbalanced pedigrees
5. Longitudinal Studies
6. The Analysis of Multiple Variables Testing a psycho-genetical theory
7. Analysis of Specific Items: The Threshold Model (i) Item profiles
(ii) Specific items
251
· 253 254 255
· 257 262 264 265
· 268 276
278 · 278
280 280
281 282 287 290
301
304 · 306
· 308 · 308 · 310
8. Discussion
9. References
313
. 316
SUMMARY
Model-fitting methods are now prominent in the analysis of human behavioural variation. Various ways of specifying models have been proposed. These are identical in their simplest form but differ in the emphasis given to more subde sources of variation. The biometrical genetical approach allows flexibility in the specification of non-additive factQrs. Given additivity; the
Present address: Department of Population Biology, Research School of Biological Sciences,' Australian National University, Canberra 2600, Australia.
41/3---A 249

250 L. J. EAVES, K. A. LAST, P. A. YOUNG, N. G. MARTIN
approach of path analysis may be used to specify several environmental models in the presence of assortative mating. In many cases the J]lethods should yield identical conclusions.
Several statistical methods have been proposed for parameter estimation and hypothesis testing. The most suitable rely on the method of maximum likelihood for the estimation of variance and covariance components. Any multifactorial model can be formulated in these terms. The choice of method will depend chiefly on the design of the experiment and the ease with which a data summary can be obtained without significant loss of information.
Examples are given in which the causes of variation show different degrees of detectable complexity. A variety of experimental designs yield behavioural data which illustrate the contribution of additive and non-additive genetical effects, the mating system, sibling and cultural effects, the interaction of genetical effects with age and sex. The discrimination betwec;:n alternative hypotheses is often difficult. The extension of the approach to the analysis ·of multiple measurements and discontinuous traits is considered.
THE scientific understanding of many issues in the social and behavioural sciences depends upon our ability to discern the causes of individual differences. The faznilial aggregation of mental disorders is well-known and has been' analysed in genetical terms with varying degrees of success (Slater and Cowie, 1971). The social and economic inequalities in several societies are strikingly apparent but less well understood. In England, Rutter and Madge (1976) ·have exposed the continuitY of deprivation between generations .. In the United States, Jencks et at. (1972) considered inequality in attainments, income and status, concluding that little of the variation could be explained by measurable inequalities in environmental factors. On the other hand, tables in Jencks' book (p. 337) suggest that the most marked associations are familial, although their source is uncertain.
The great novelty of Jencks' approach, as f~r as sociology was concerned, was his proposition that part of the observed inequality might be due to inherited differences in ability. Although he conceded that differences in ability were partly inherited, he concluded that their contribution to the overall pattern ofinequality was fairly small. Jencks did not speculate about additional genetical factors responsible for specific aspects of social inequality but more recently the economists Behrman, Taubman and Wales (1977) have presented twin data which are consistent with the inheritance of differences underlying inequalities in income.
Such claims engender criticism. Jinks and Eaves (1974) argued that genetical non-additivity might explain inconsistencies in data relating to intelligence and that alternative models for the family environment should also be considered. Other authors (Rao et at., 1974) whilst showing greater agreement with Jencks' own formulation of the model, also demurred at Jencks' inefficient estimation procedure. Subsequently the critics themselves have been chastised for carelessness (Goldberger, 1977a, b). Rao et at. (1974) had tried to estimate inseparable parameters and Jinks and Eaves (1974) proposed an inconsistent alternative model for the family environment by omitting the contribution of.the family environment to the similarity of spouses. The interpretation of Behrman et at. 's work has also been challenged by Goldberger (1977c) on the more familiar grounds that unsupported twin data may give misleading estimates 'of population parameters and that an alternative parameterisation can be provided which excludes genetical factors entirely.

ANALYSIS OF HUMAN BEHAVIOUR 251
In our view, such criticism does not obscure the basic importance of the fact that social scientists are considering genetical factors alongside the other possible causes of variation, and are prepared to countenance the heuristic value of genetical theory for traits of social significance, or that geneticists are now considering more flexible models for environmental factors.
Behind the controversial postures in the literature there has been a substantial change of outlook. Whatever the shortcomings of present data, there is no substitute for a model-fitting approach which tries to predict the findings for multiple biological and non-biological relationships from a consistent and parsimonious theory. Furthermore, there is now serious recognition that social scientists who ,ignore genetical factors are no less naive than geneticists who disregard culture.
Within the broad framework of the model-fitting approach there have been three principal strands of development:
-(a) The specification of more flexible models for the effects of genes
and environment; (b) The development (or" rediscovery ") of more appropriate statistical
and numerical methods for their resolution; (c) An increased awareness of the problems of experimental design.
This paper makes no pretence at'being a historical review. We attempt to outline the principal strands of thought and controversy by reference to key papers and illustrate the principles by examples of data analysis employing current models and methods. We have not tried to describe all the work currently in progress in human behavioural genetics since cataloguing genetical diversity is not our primary interest. We have adopted a stratified approach in which we describe and illustrate ideas which have been important to us.
Alihough the issue of inequality has generated the greatest interest and controversy, the field cannot be viewed.in isolation from the growing recognition of the potential significance of genetical factors in the determination of other types of behavioural variation, including personality, interests, (see e.g. Loehlin and Nichols, 1976) and social attitudes (e.g. Eaves and Eysenck, 1974).
Whatever traits are studied, the ground of behavioural genetics is exploration of the limits to which genetical theory can be exploited in accounting for the distribution of human differences. The fundamental position is not any desire to see genetical theory vindicated in the behavioural domain but the conviction that any theory of individual differences must be quantitative to be testable. Indeed, as we shall show, there are a great many instances in which a simple genetical theory fails to account for the observed pattern of variation. In such cases the task of the behaviour geneticist or the social scientist is to determine what quantitative theory can be advanced to account for behavioural diversity.
1. CHOICE OF DATA SUMMARY
. Most analyses of human behaviour begin when the experimental subject makes marks on paper. A model is implicit in any subsequent summary of the data, although in genetical studies the psychological model ~ed in summarising a subject's behaviour is seldom explicit. Some of the diverse
252 L. J. EAVES, K. A. LAST, P. A. YOUNG, N. G. MAR TIN
psychological models employed in representing behaviour are considered by Lord and Novick (1968). The geneticist or sociologist usually begins with data which have already been transformed or summarised to reflect a particular theory of measurement. Such transformations will often condition broad features of the subsequent analysis (Mather and Jinks, 1971; Eaves et at., 1977).
Even when the scale of measurement for each subject has been agreed, there is still uncertainty about the appropriate place to begin causal analysis. Three starting points have been considered: the raw scores (e.g. Lange et at., 1976b); the correlations between relatives (e.g. Rao et at., 1974); the mean squares of the analysis of variance (e .. g. Jinks and Fulker, 1970). In this paper we also consider a fourth, where appropriate: matrices of covariances between relatives.
Analysis of the raw scores may be necessary, especially when the data comprise pedigrees of variable composition. The price in terms of computer time is high and the approach does not usually yield different' answers from alternative cheaper methods when a convenient appropriate data summary can be generated.
Any data summary discards some information as irrelevant to subsequent analyses. The analysis of second-degree statistics usually begins after subgroup means are shown to be the same. Mean differences between subgroups may indicate biases in sampling or failure of the assumptions of a particular model (Jinks and Fulker, 1970). The correlation coefficient is the least desirable second-degree statistic, since both mean differences, and differences in variance are treated as irrelevant to the analysis of causes. However, some information about effects of interest is retained in the standardised coefficients. The Hawaii group (see Elston and Rao, 1978) introduce a parameter which corrects for the biases introduced into parameter estimates by genotype-environment covariation, but does not recover
'information lost by' discarding differences in total variance between natural and foster-children. If the total variances of different twin groups differ for systematic reasons, e.g. due to sex interactions or sibling effects, transformation to correlations may obscure the very anomalies in the data which might yield greater understanding of the mechanisms of heredity. The loss of information will be minimal if such effects are absent, but since the original variances are required to test this assumption, these might easily be used throughout. .
The usual twin study comprises five groups (MZ female, MZ male, DZ female, DZ male and opposite-sex DZ pairs), which, summarised by separate analyses of variance, yield 10 mean squares. Recognising possible differences in mean and variance between first- and second-born twins, by adopting the covariance matrix for each twin type as the basic data summary, provides 15 raw statistics. Using the analysis of variance as a starting point for model-fitting has several practical advantages. The mean squares are statistically independent so that conventional linear regression techniques, such as weighted least squares, can be employed. Even on a desk calculator, the operations are not tedious and the method has an appealing intuitive rationale. A disadvantage is the potential loss of information in pooling data on the first and second twins. For example, if there are sex interactions, some information about the basis of the sex difference in gene action is lost in the analysis of variance of unlike-sex DZ pairs. Such problems are
ANALYSIS OF HUMAN BEHAVIOUR 253
overcome by calculatiJlg a separate variance for male and female twins of the opposite-sex pairs and representing the similarity between them by a covariance. However, since the three statistics chosen to represent the data in this type of summary are not independent, the analysis becomes tedious because correlations between the statistics have to appear in the information matrix (e.g. Cooke et at., 1962).
The data summary we choose depends on how much information we are prepared to lose in particular instances. We can often afford to lose the information contained in the unsummarised data except where the unbalanced nature of the study precludes any coherent data summary. However, the use of correlations seems pointless since the computations are not easier than with variances and covariances and more information is lost. The distributional properties· of the statistics are, if anything, worse and also we may actually delude ourselves into believing that the world is simpler than it really is. We realise that there is no perfect data summary combining ease of analysis whilst retaining all the information we might need, but it is important to recognise that critical information might be lost if the causes of variation are not simple.
2. THE STUDY OF TWINS
The classical twin method rests on the comparison of the degree of SImilarity of identical (monozygotic or MZ) twin pairs and non-identical (dizygotic or DZ) pairs. Similarity may be assessed by concordance between the members ofa pair for the case of discontinuous variables, or by the intraclass correlation coefficient for continuous variables. In the first instance, any excess similarity of MZ over DZ twins is usually taken to indicate the presence of genetical factors producing variation in the trait concerned, although in the majority of studies the twins are reared together, making it impossible to discriminate· between certai?- genetical and environmental components of variation between pairs. In order to overcome this problem, several investigators (e~g. Vandenberg, 1966) have used comparisons of the intra-pair variances for the two twin types, thereby estimating only the contributions of genetical differences segregating within families and environmental effects not shared by both members of a pair. This approach makes no attempt to consider the causes of variation in the population as a whole, thus sidestepping the problem of the sources of variation between families, wherein lie most of the genetical and environmental effects of greatest interest. At best, it can only sugge!'t that genetical factors may be a significant source of variation within families. It makes no provision for predicting findings for other types of relative.
Other attempts to estimate the proportion of variation due to genetical factors, have led to the proliferation of formulae using various combinations of twin variances and correlations. The diversity of estimators of genetic variance from twin data is apparent in Christian et at. (1974). Jinks and Fulker (1970), in their critical review of the key suggestions for estimating heritability, showed that most estimates from twin studies are limited in their predictive validity and make no attempt to test the assumptions implicit in their formulation and application. They provided a detailed consideration of the difficulties associated with conventional approaches to the analysis of the classical twin study.

254 L. J. EAVES, K. A. LAST, P. A. YOUNG, N. G. MAR TIN
However, it is now so generally recognised as to be trivial, that the similarity of identical twins is significantly greater than that of fraternal twins for a wide range of behavioural traits, including measures of cognitive ability, attainments, personality, social attitudes, preferences, habits and various disorders, i.e. the entire spectrum of behavioural differences. A recent abstract of the twin literature (Breland, 1978) establishes, almost beyond doubt, the generality of this finding, even allowing for the possible under-reporting of non-significant results. Therefore, if we subscribe to the basic assumption of the twin method, that such differences in similarity indicate the presence of genetical variation, few could doubt the generality of genetical factors in determining human behavioural differences.
Howev~r, the twin method would be a limited tool, which should give way to better designs, if it _could yield only this information. We would like to explore the mechanisms· of gene action and environmental effects in greater detail. Whilst the twin study is not the ideal for investigating gene action (Eaves, 1972; Martin et at., 1978), it can provide a unique opportunity to elucidate certain relationships between the action of genetic and environmental factors. In the remainder of this section, we consider the range of hypotheses which can be tested using twin data, and indeed, in some cases we will find that twins provide an efficient design for initial investigation of sex interactions of gene expression or of the environmental effect of one sibling upon another. However, first we will briefly consider several criticisms of the twin lI1ethod.
(i) Problems of the twin- method.
Criticisms concerning methods of analysis have been mentioned and the main part of this section is devoted to the illustration of possible models for twin data and methods for testing the assumptions on which they are based. Other ·sources of criticism command sufficient empirical substance to demand that findings from the twin study are tested by predictions made for other types of relationship. These concern specific "features of twin data, such as the unusual pre-natal and post-natal environmental influences on twins which may make twins atypical of the population as a whole. Sources of bias are potentially many and include the unusual circumstances of twin pregn~cy, birth and development, the possibility that the environments of MZ twins may be more alike than those of DZ twins and the possibly false assumptions that there are only two types of twin-MZ and DZ. Other authors (e.g. Price, 1950; Kempthorne and Osborne, 1961; Lilienfeld, 1961; Koch, 1964; Allen, 1965; Breland, 1973; Matheny et al., 1976; Plomin et al., 1976; Lytton, 1977) have reviewed such problems at great length, making any further review of the established literature a formality.
However, since the twin method depends on comparisons of MZ and DZ twin correlations, it is pertinent to make several comments on the diagnosis of zygosity. It is widely accepted that zygosity can be diagnosed by blood-typing with great reliability, given that an adequate range of blood anti-sera are employed (e.g. Allen, 1968; Wilson, 1970). However, such assessments are expensive and impracticable on a large scale necessitating the use of cheaper alternatives, especially for use in studies where questionnaires are the main measuring instrument. Questionnaires concerning the childhood similarity of twins have been shown to yield zygosity diagnoses which compare very favourably with the result based on blood-typing

ANALYSIS OF HUMAN BEHAVIOUR 255
(Cederlof et al., 1961; Kasriel and Eaves, 1976), although the results of Smith (1965) and Scarr (1968) suggest that care in the formulation of zygosity questionniares is important. In general, some kind of zygosity diagnosis is a prerequisite for the genetic analysis of populations, although several studies have attempted to avoid zygosity diagnosis by comparing the similarity of like- and unlike-sex twin pairs. This method not· only assumes that unlike-sex pairs give a generally valid estimate of the genetically determined similarity between siblings (i.e. that there is no sex linkage or sex limitation but, even if the assumptions underlying the method aTe not violated, requires samples at least three times as large as those needed when zygosity is known exacdy, in order to provide equally powerful inferences (Eaves and Jinks, 1972).
Most twin studies attempt zygosity diagnoSIS, and several large studies are now in progress which use the questionnaire method (e.g. Cederlof et al., 1977). These would be much more difficult if blood samples were required for the more conventional method of zygosity determination. Conventionally, errors of diagnosis are presumed to reduce the apparent genetical variation, since misclassification is supposed to be reciprocal: some MZ twins being mistaken for DZ and vice versa (e.g. Eysenck, 1952, 1973; Scarr, 1968). However, another equally plausible model of misclassification suggests that the apparent heritable component might be increased by classifying the most similar DZ twins as MZ and the most discordant MZ twins as DZ. The only solution is to take steps to minimise misclassification.
(li) The use of twins in tests of scale
Twins provide the best experimental design for some purposes. The detection of genotype-environment (G x E) interaction usually requires the replication of genotypes either in the same or in different environments. Thus·, identical twins form a natural experiment for studying some kinds of G x E. More generally th~y also enable us to look at the properties of the scale of measurement.
These and other related problems were discussed by Eaves et al. (1977) who distinguished between " systematic" and " unsystematic" sources of non-additivity. Systematic non-additive effects included genetical nonadditivity (e.g. directional dominance, in which the non-additive effects of loci operate to enhance the expression of the trait in a uniform direction, as might be expected for a trait showing a linear relationship with reproductive fitness) and genotype' environmental-interactions, in which sensitivity to environmental factors is related in a systematic way to the average performance of the genotypes in a range of environments. Although both types of directional non-additivity can result in skewness in the distribution of phenotypes in a population, their effects may, under some circumstances, be separable with twin data.
Jinks and Fulker (1970) suggested that systematic genotype-environment .. interactions might be detected by investigating the form of any relationship
between the mean scores of monozygotic twin pairs and either the withinpair standard deviations (i.e. the absolute intra-pair differences) or the variances. Ideally, the relationship should be examined with twins reared apart to prevent the confounding of genotype-environment interactions with interactions between environmental differences within pairs and the

256 L. J. EAVES, K. A. LAST, P. A. YOUNG, N. G. MARTIN
family environment but, since such pairs are rare, we usually have to be satisfied with tests based on twins reared together.
Since the variation within pairs also reflects errors of measurement, an examination of the mean-standard deviation relationship for MZ twins is of psychometric interest because significant trends may indicate the points on a chosen scale of measurement where discrimination is most or least effective. Very few raw scales of psychological measurement are free of some kind of systematic non-additivity. This may be attributable to the inability of the test to discriminate effectively between individuals at certain points on the scale, often at the extremes.
Many standard personality tests, tests of cognitive ability and virtually every type of questionnaire measurement, yield scales which, in their raw form at least, display heteroscedasticity which could lead the therapist or the behavi'our geneticist to conclude that environmental factors are much more important at some points of the scale than at others. The neuroticism scale of the Eysenck Personality Questionnaire, for example, reveals substantial "ceiling" and "floor" effects because the collection of binary items does not discriminate as effectively in the tails of the distribution as in its centre. In this example of a common finding, environmental variation is apparently much more marked in the mid-point of the scale than in the tails. To dismiss such interactions as " scalar" is to avoid a crucial issue. If the scales are used for prediction, predictions must take account of the fact that i~dividuals at the mid-point of the scale are going to be more labile than individuals in the extreme groups. It does not mean that their behaviour is necessarily going to be more amenable to manipulation because it may well be that the greater variability observed in the middle of the scale is simply a function of the greater opportunity for random fluctuations in behaviour. Indeed, in many instances this appears to be the case because employing a transformation, which assumes that the relationship depends upon a fundamental property of measurement error, removes the genotypeenvironmental interaction for behavioural measurements of this type. For example, in the case of the neuroticism scale, transforming the scores to angles yields a scale on which the intra-pair standard deviations are virtually independent of the pair means. This can be explained if the scale consists of items of approximately equal difficulty and a subject with a given degree of neuroticism distributes his responses independently with a probability dependent on his neuroticism score over the available items of the scale. Thus, the pattern of non-additivity observed for such traits is inherent in the design of the questionnaire.
Since this genotype-environmental interaction can be removed by transformations which consider only the form of the random component of variation, we have little evidence so far to support the general conclusion that sensitivity to environmental experiences is a simple systematic function of the mean expression of the genotype. However, this sort of analysis does reveal very simply some of the more obvious problems associated with the use of scales in counselling· and prediction.
Unsystematic interactions between genetic and environmental factors are less tractable unless we can measure relevant environmental factors. Jinks and Fulker have shown that any interactions of genotype and withinfamily environmental differences, without the systematic component described above, are inevitably confounded with the environmental variation
ANALYSIS OF HUMAN BEHAVIOUR 257
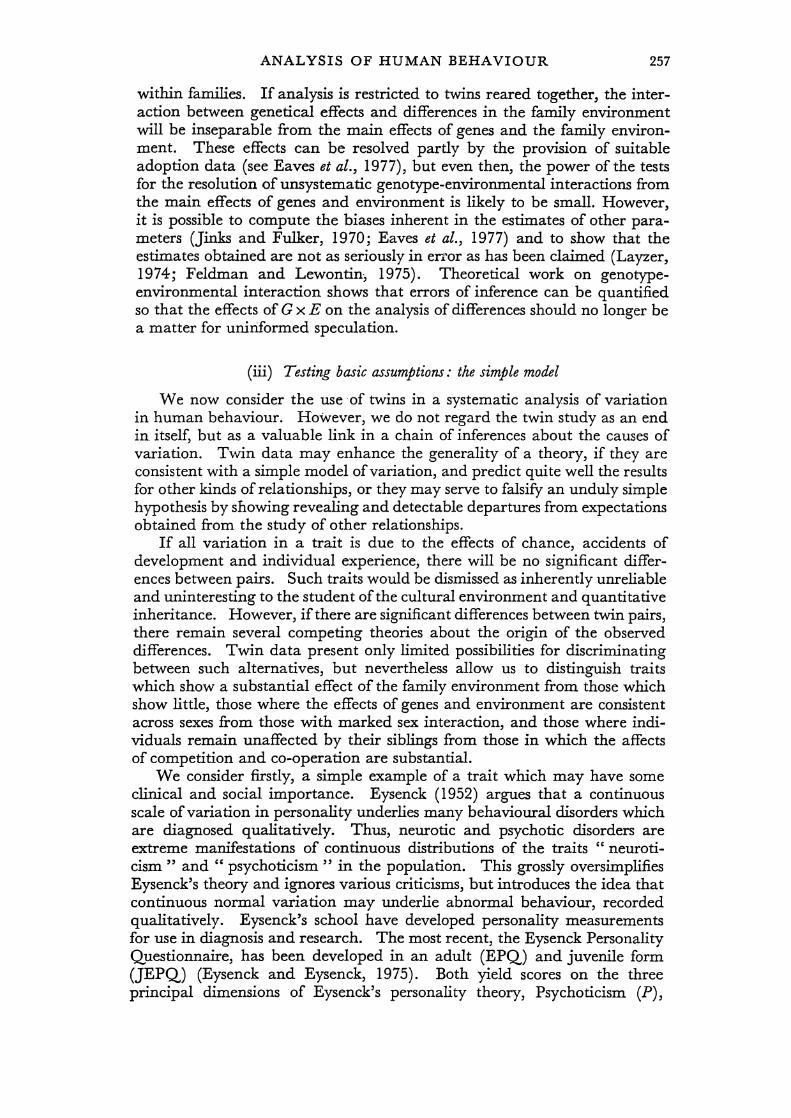
within families. If analysis is restricted to twins reared together, the interaction between genetical effects and differences in the family environment will be inseparable from the main effects of genes and the family environment. These effects can be resolved partly by the provision of suitable adoption data (see Eaves et al., 1977), but even then, the power of the tests for the resolution of unsystematic genotype-environmental interactions from the main effects of genes and environment is likely to be small. However, it is possible to compute the biases inherent in the estimates of other parameters (Jinks and Fulker, 1970; Eaves et al., 1977) and to show that the estimates obtained are not as seriously in error as has been claimed (Layzer, 1974; Feldman and Lewontin, 1975). Theoretical work on genotypeenvironmental interaction shows that errors of inference can be quantified so that the effects of G x E on the analysis of differences should no longer be a matter for uninformed speculation.
(iii) Testing basic assumptions: the simple model
We now consider the use ·of twins in a systematic analysis of variation in human behaviour. However, we do not regard the twin study as an end in itself, but as a valuable link in a chain of inferences about the causes of variation. Twin data may enhance the generalitY of a theory, if they are consistent with a simple model of variation, and predict quite well the results for other kinds of relationships, or they may serve to falsify an unduly simple hypothesis by showing revealing and detectable departures from expectations obtained from the study of other relationships.
If all variation in a trait is due to the effects of chance, accidents of development and individual experience, there will be no significant differences between pairs. Such traits would be dismissed as inherently unreliable and uninteresting to the student of the cultural environment and quantitative inheritance. However, if there are significant differences between twin pairs, there remain several competing theories about the origin of the observed differences. Twin data present only limited possibilities for discriminating between such alternatives, but nevertheless allow us to distinguish traits which show a substantial effect of the family environment from those which show little, those where the effects of genes and environment are consistent across sexes from those with marked sex interaction, and those where individuals remain unaffected by their siblings from those in which the affects of competition and co-operation are substantial.
We consider firstly, a simple example of a trait which may have some clinical and social importance. Eysenck (1952) argues that a continuous scale of variation in personality underlies many behavioural disorders which are diagnosed qualitatively. Thus, neurotic and psychotic disorders are extreme manifestations of continuous distributions of the traits "neuroticism " and " psychoticism " in the population. This grossly oversimplifies Eysenck's theory and ignores various criticisms, but introduces the idea that continuous normal variation may underlie abnormal behaviour, recorded qualitatively. Eysenck's school have developed personality measurements for use in diagnosis and research. The most recent, the Eysenck Personality Questionnaire, has been developed in an adult (EPQ) and juvenile form (JEPQ) (Eysenck and Eysenck, 1975). Both yield scores on the three principal dimensions of Eysenck's personality theory, Psychoticism (P),

258 L. J. EAVES, K. A. LAST, P. A. YOUNG, N. G. MARTIN
Extraversion (E) and Neuroticism (X). A fourth scale is included, the so-called" Lie" scale, which reflects either actual behavioural honesty, or the subject's wish to present a socially desirable face to the tester.
Psychoticism is, perhaps, the most controversial of the three personality scales, but many studies corroborate the view that high psychoticism scores are more frequently associated with less " socially desirable" attitudes and behaviour and less apparent regard for the feelings of others. A recent twin study in the London area, yielded EPQ responses for a large number of twin volunteers. The study is open to the usual criticisms of sampling bias. There is an excess of females in,. the sample, probably because volunteers were ascertained through appeals in the press, and magazines and on radio. Psychoticism scores were derived from the raw responses. There
TABLE 1
Ana~ses of variance for psychoticism scores of twins
Twin type
MZ/
MZm
DZ/
DZm
DZm/
Item
Between pairs Within pairs Between pairs Within pairs Between pairs Within pairs Between pairs Within pairs Between pairs Within pairs
Degrees of Mean freedom
231 233 . 68 70
123 125 45 47 66 67
square
0·033 0·014 0·046 0·014 0·039 0·019 0·029 0·019 0·035 0·022
are relatively few people who will admit to the lack of feelings, implied by such items· as "Would it upset you to see a child or animal suffer? ", so that the mean psychoticism scores, based on 25 similar items, are very low, although they are somewhat higher for males than females.
Eaves and Eysenck (1977) showed that such scales yield raw scores for which the absolute intra-pair differences {a measure of the effect of environmental differences) are linearly related to the pair mean, suggesting that the environment is far more important for those genotypes who display a high psychotic predisposition than for those who are more" normal" . A square root transformation removed most of this non-additivity, suggesting that the interaction is a feature of the random error component rather than of the interaction of external environmental factors with genetical differences. A subject of" low psychotic predisposition" has a small probability of responding to any item, so the error variance of his total score is small, compared with the " more psychotic" person who distributes his responses at random over the available psychoticism items with a greater probability of endorsement.
The mean squares for the five types' of twin in our sample are given in table 1. The sample consisted of adult twins with ages from 18 to 84 years. A correction was made for a general linear trend of decreasing psychoticism with age, by extracting the contribution of the regression sum of squares on age from the between-pairs sums of squares. Thus, for X pairs there are X - 2 degrees of freedom between pairs rather than X-I.

ANALYSIS OF HUMAN BEHAVIOUR 259
A preliminary examination of the mean squares for psychoticism shows that certain hypotheses are untenable. The significant differences between twin pairs lead us to reject the suggestion that variation in psychoticism is produced solely by errors of measurement or differences in individuals' specific experiences. Furthermore, the fact that the within-pair differences for DZ twins are uniformly greater than those for MZ twins is consistent with a hypothesis involving genetical segregation.
In table 2, we give the coefficients of the parameters of a simple linear genotype-environmental model for the observed mean squares. The model
TABLE 2
Expectations for twin f!Uan squares for a simple model
Expected mean square A
Twin type
MZf
MZm
DZf
DZm
DZmf
Mean square
Between pairs Within pairs Between pairs Within pairs Between pairs Within pairs Between pairs Within pairs Between pairs Within pairs
El 1 1 1 1 1 1 1 1 1 1
assumes that mating is random, that gene action is additive, that there are no sex interaction effects, that there are no family environmental effects and that the within-family environmental effects are comparable for all types of twin in the study. The model predicts that the total variances for the different twin groups will be the same and that the covariance of DZ twins will be half that of MZ twins.
The predictions are embodied in the coefficients of the within-family environmental component (El) and the additive genetical component (DR) in the model. In terms of the components of variance (rather than mean squares) we may write:
a~MZ = tDR
a;MZ = E1
a;DZ = iDR
a;DZ = tDR +E1
To obtain the coefficients of the parameters in the mean squares, we recognise that the mean square between twin pairs is equal to a~+2a~. So, for DZ twins the mean square between twin pairs is:
MSbDZ = !DR + E1
Having formulated this, or a similar model, we require estimates of the parameters and a test of the assumptions where possible. The method of weighted least squares is practicable (for individual variables at least) even with a desk calculator. Rather than settle on estimates based on the

260 L. J. EAVES, K. A. LAST, P. A. YOUNG, N. G. MARTIN
most obvious combinations of statistics the method yields that combination of the observed mean squares which, whilst giving unbiased estimates of the paremeters, makes the greatest possible use of the information from all the statistics in the data summary. Thus, the estimates have the minimum possible variance and the approach provides the most powerful tests of the parameters of the model. Furthermore, the method offers automatic compensation for the different degrees of precision with which the observed statistics are known, because mean squares based on fewer degrees of freedom playa proportionately smaller role in the determination of the final solution. The method of weighted least squares is identical to that of regression analysis except that the coefficients of the model are the "predictors " in the regression equation and the observed mean squares are the" criterion-". In additioJ1., each observa~on receives a weight which is the reciprocal of its variance. Writing Xi for the ith mean square, we have the corresponding weight, Wi = Ni/2(Exi)2, where Ni are the d.f. for the ith mean square.
Since the expected mean squares are unknown until the estimates of the parameters have been obtained, an iterative procedure has to be adopted in which the observed mean squares are employed initially to generate weights. When the estimates using these weights are obtained, they are used to provide expected mean squares which can then be substituted in the above formula to generate new weights. The procedure is repeated, using each new set of estimates to generate new weights, until the successive parameter ~stimates agree to a satisfactory convergence criterion.
Employing the iterative WLS approach outlines above the estimates of the parameters are:
DR = 0·0246 ± 0·0028
E1 = 0·0139 ± 0·0010
The standard errors are obtained as the square roots of the diagonal elements of the covariance matrix of the estimates and are appropriate when the model fits. Given that the original scores were nbrmally distributed, the method of WLS gives the maximum likelihood estimates of the parameters. Perhaps the simplest way to test the model is to compute the weighted sum of squared deviations of the expected mean squares from their observed values. This statistic is distributed approximately as chi-square for 8 d.f., there being 10 mean squares from which two parameters are being estimated. Alternatively, following Nelder and Wedderburn (1972), we may compute the log likelihood ratio for comparing the two-parameter model with an alternative which assigns a separate parameter to every mean square (i.e. which equates each expected mean square to its observed value). Twice the log likelihood ratio is again distributed approximately as chi-square with 8 degrees of freedom. The weighted sum of squared residuals and twice the logarithm of the likelihood ratio are similar (7 ·19 and 7·04 respectively), showing close agreement between the two methods of assessing the adequacy of the two-parameter model, as is usually the case when the model fits. Since the chi-square is close to its expected value, the 10 mean squares can be summarised economically in terms of the two-parameter model and no further hypotheses are necessitated by the data. The conclusion from this twin analysis of psychoticism is very strong and, therefore, valuable in making -predictions beyond twin data, although the possibility of mistaken inference always remains because factors present in the popula-

ANALYSIS OF HUMAN BEHAVIOUR 261
tion may go undetected by chance, or because the size of study may be insufficient. From these data, however, we would infer that variation in psychoticism, as measured by the P scale of the EPQ, is consistent with a mechanism of additive gene action with the distribution of the alleles unaffected by assortative mating. There is little reason to suppose that the family environment contributes significantly to variation in psychoticism, because then our simple model would have failed to represent all the data satisfactorily. Eaves and Eysenck (1977) discuss . the implications of this finding in far greater detail for behavioural research and therapy. At their face value, the parameter estimates imply that 47 per cent of the variation in psychoticism is attributable to additive genetic effects, the balance being due to environmental differences -within families. The key to the kinds of environmental factors involved does not lie in the treatments shared by members of a twin pair, because these would contribute to twin covariance, but in the individual's unique environmental experiences and the accidents of his own development. A similar conclusion is reached for other dimensions of personality in Loehlin and Nichol's analysis of data from the National Merit Twin Study (1976). One of the surprises of much twin reserach, certainly in the domain of personality, is that the family environment does not appear to contribute significantly to twin similarity.
For psychoticism, over half of the total variation reflects individual environmental experiences. However, not all such influences are open to manipulation. In particular, part of the variation contributing to E1 in the above model is due to errors of measurement. For many psychological tests, we can assess the contribution of errors of measurement to test variation, either experimentally by repeated measurements (on different occasions or by dividing the test material into two or more equivalent parts) or theoretically from the knoWn properties of the scale of measurement. Psychoticism shows a linear relationship between the intra-pair variance and the proportion of " psychotic" responses, suggesting a measurement which may conform closely to the properties of the Poisson distribution (individual psychotic responses being distributed randomly with low probability). Employing this model of psychotic responses, Eaves and Eysenck (1977) estimated that the theoretical error variance applicable to the transformed P scores was 0·011. This is hardly smaller than the estimate of the within-family environmental component of variance and implies that differences in the psychoticism scores of identical twins are no greater than the differences which would be found between the scores of the same individual measured on different occasions. Similarly, it is frequently reported (e.g. Husen, 1960) that the IQcorrelations ofMZ twins are comparable with the test-retest correlations, suggesting that much apparent environmental variation in IQ within families is due to the inherent imprecision of the test instrument rather than actual treatment differences. Such a model for psychoticism suggests that psychologists would be wasting their time dissecting the environment of psychotics to discern the causes of their disorder. In so far as parents influence the development of psychoticism in their children, it appears that such influence is largely hereditary.
The finding that a large proportion of environmental variation is without apparent measurable cause is not general for behavioural traits. Estimates of theoretical error for other scales of the EPQ, especially extraversion and neuroticism, are substantially less than the observed variation within MZ
262 L. J. EAVES, K. A. LAST, P. A. YOUNG, N. G. MARTIN
twin pairs suggesting that, in principle, upwards of 30 per cent of the variation attributed to £1 could be assigned ultimately to detectable individual experiences.
(iv) Sex interactions
Most analyses of twin data assum~ that a score on a given test reflects the same underlying causes in both sexes. However, ifwe tried to determine the mode of inheritance of chest girth in man, we would be surprised if the same genetical mechanism were responsible for variation in the trait in males and females. Ther~ have been few systematic studies of the phenomenon of sex' dependence of gene expression in human quantitative inheritance, although several authors (e.g. Loehlin and Nichols, 1976) report separate heritability estimates for the sexes. Several studies (e.g. Stafford, 1961; Bock and Kolakowski, 1~73) have suggested that mean differences in perfoqnance on spatial visualisation tests might be determined by sex-linkeq. ,loci, because, father-son correlations for these tests have generally been near zero whilst other types of parent-offspring correlation have not. Unfortunately, the sample sizes involved in such inves4;:igations have been small and at least one recent study on a much larger sample does not replicate the earlier finding (Defries et al., 1976).
There is little hope that twin data, by themselves, will resolve all the nuances of mechanisms of determination which depend on sex, of which classical sex-linkage is but one possibilitY. However, a properly designed and analysed twin study may indicate the existence of sex interactions. The key to the detection of such interactions lies with the unlike-sex twin pairs which should be comparable in their similarity with DZ twins of like sex if a similar mechanism is accounting for the variation in the trait in males and females. Many twin studies in the past have deliberately excluded unlike-sex twins, presumably out of a mistaken belief that concentrating on like-sex pairs "controls" for the effect of sex. In reality, exactly the reverse is true. Omission of unlike-sex pairs removes the most important tool for the early identification of sex-dependent mechanisms of determination.
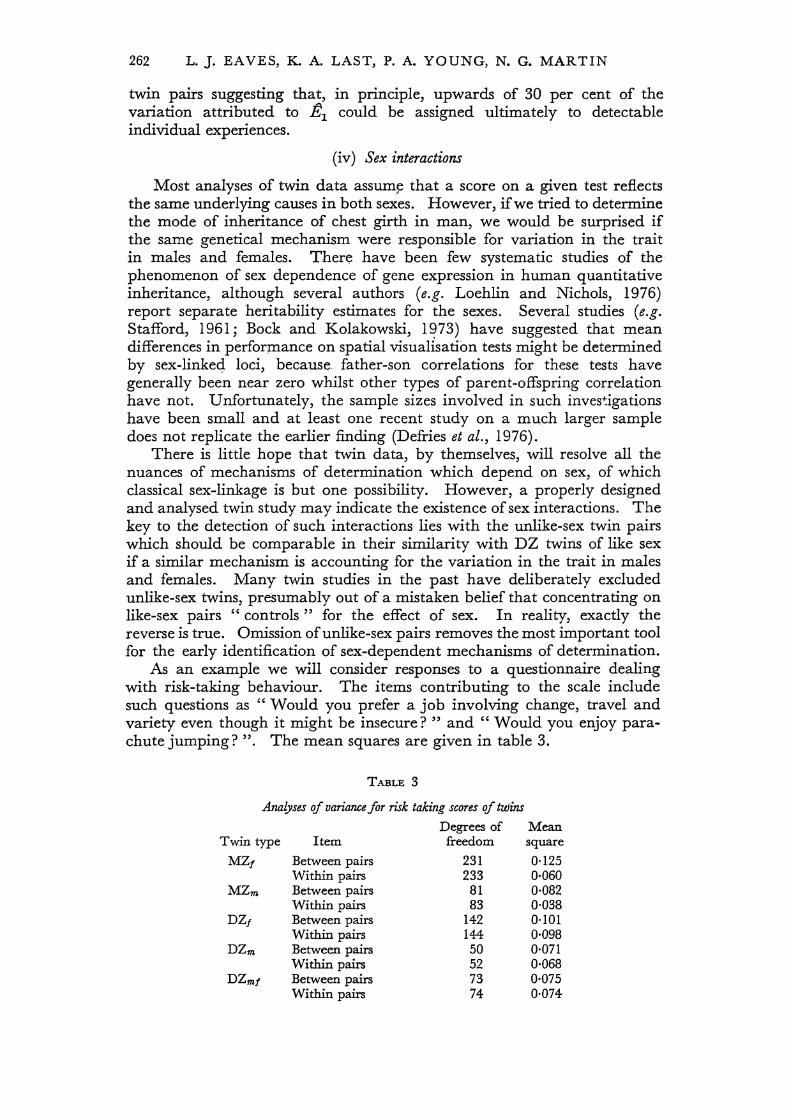
As an example we will consider responses to a questionnaire dealing with risk-taking behaviour. The items contributing to the scale include such questions as "Would you prefer a job involving change, travel and variety even though it might be insecure? " and" Would you enjoy parachute jumping? ". The mean squares are given in table 3.
TABLE 3
AnalYses of variance for risk taking scores of twins
Twin type
MZj
DZj
DZm
DZmj
Item
Between pairs Within pairs Between pairs Within pairs Between pairs Within pairs Between pairs Within pairs Between pairs Within pairs
Degrees of Mean freedom
231 233
81 83
142 144 50 52 73 74
square
0·125 0·060 0·082 0·038 0·101 0·098 0·071 0·068 0·075 0·074
ANALYSIS OF HUMAN BEHAVIOUR 263
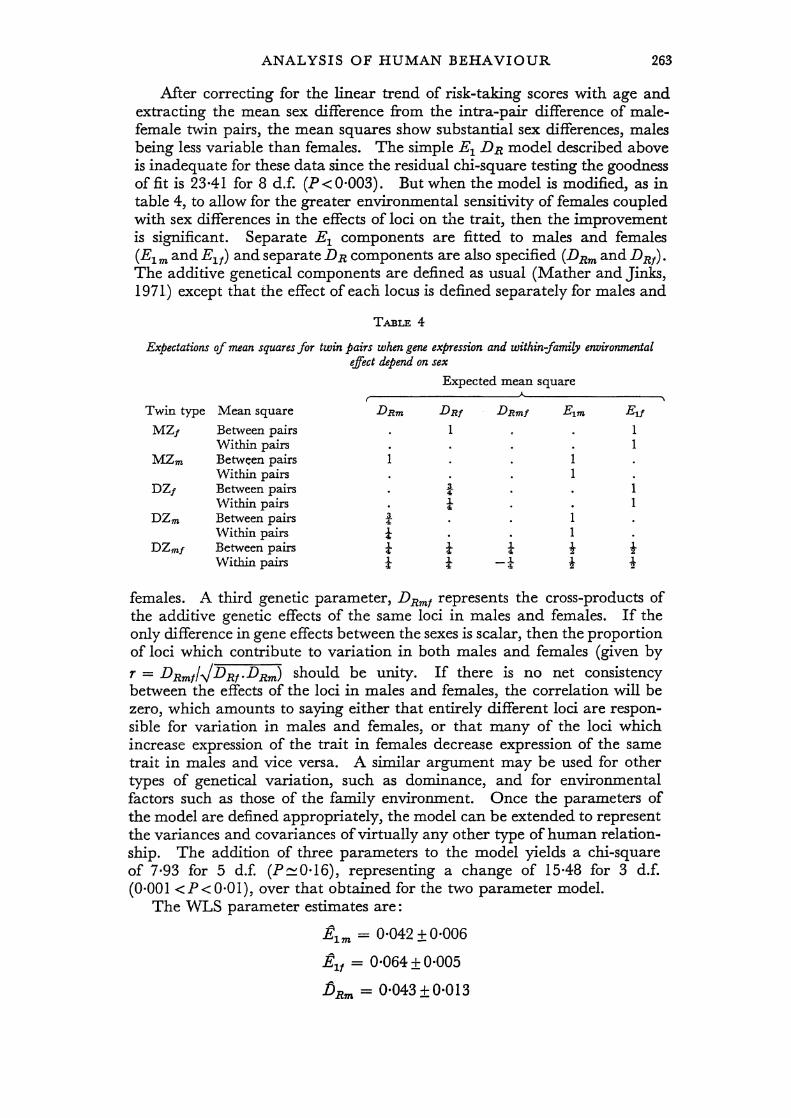
After correcting for the linear trend of risk-taking scores with age and extracting the mean sex difference from the intra-pair difference of malefemale twin pairs, the mean squares show substantial sex differences, males being less variable than females. The simple E1 DR model described above is inadequate for these data since the residual chi-square testing the goodness of fit is 23·41 for 8 d.f. (P<0·003). But when the model is modified, as in table 4, to allow for the greater environmental sensitivity of females coupled with sex differences in the effects of loci on tt~e trait, then the improvement is significant. Separate E1 components are fitted to males and females (E1 m and Elf) and separate DR components are also specified (DRm and DR!)' The additive genetical components are defined as usual (Mather and Jinks, 1971) except that the effect of eacli locus is defined separately for males and
TABLE 4
Expectations of mean squares for twin pairs when gene expression and within-family environmental effect depend on sex
Expected mean square A
Twin type Mean square DRm DR! DRm! Elm Elf
MZ! Between pairs 1 1 Within pairs 1
MZm Between pairs 1 Within pairs 1
DZ! Between pairs i 1 Within pairs t 1
DZm Between pairs t 1 Within pairs t 1
DZm! Between pairs i- t t t t Within pairs t t -i- t t
females. A third genetic parameter, DRm! represents the cross-products of the additive genetic effects of the same loci in males and females. If the only difference in gene effects between the sexes is scalar, then the proportion of loci which contribute to variation in both males and females (given by r = DRm!I..jDR!.DRm) should be unity. If there is no net consistency between the effects of the loci in males and females, the correlation will be zero, which amounts to saying either that entirely different loci are responsible for variation in males and females, or that many of the loci which increase expression of the trait in females decrease expression of the same trait in males and vice versa. A similar argument may be used for other types of genetical variation, such as dominance, and for environmental factors such as those of the family environment. Once the parameters of the model are defined appropriately, the model can be extended to represent
. the variances and covariances of virtually any other type of human relationship. The addition of three parameters to the model yields a chi-square of 7·93 for 5 d.f. (P~0'16), representing a change of 15·48 for 3 d.f. (0·001 <P< 0·01), over that obtained for the two parameter model.
The WLS parameter estimates are:
:E = 0·042 + 0·006 1m -
:Elf = 0·064 ± 0·005
fJRm = 0·043 ± 0·013

264 L. J. EAVES, K. A. LAST, P. A. YOUNG, N. G. MARTIN
fJR! = 0·061 ± 0·012
fJRm! = 0·002±0·037
All but fJRm!are significant at the 0·001 level. The correlation (r = 0·038) is close to zero, implying that a completely different mechanism is producing variation in males and females. These results are unfortunately not compelling because the raw intra-class correlations for like-sex DZ twins are also very low. Most of the information about DRm! comes from a comparison of the two mean squares for DZm! pairs. On the other hand, the bulk of the information about D Rm and DR! comes from comparing the mean squares of MZ twins, with :the contribution of DZ twins being substantially smaller, so that the sources o(information about the covariance parameter are not strictly comparable. Thus, although the data are consistent with a model which assumes that different genes contribute to male and female variation, the data do not provide a particularly powerful basis for rejecting alterna~ive explanations.
(v) Testing assumptions about the environment
Many models for twin differences assume that environmental factors are simple.. In both the examples above we assumed that the environmental variation was due to differences in the unique environmental experiences of individuals which were neither shared with, nor dependent on, other members of the family. Furthermore, we specified an equal environmental correlation (zero) for MZ and DZ twins and assumed that the environmental variance is equal in both types of twin. The weight of many published criticisms of the twin-method is often placed upon the presumed inadequacy of such assumptions (e.g. Goldberger, 1977c), although it is often difficult to discern the precise alternative model that critics envisage. The most serious criticism of twin methodology arises from the hypothetical situation in which the variance of environmental factors is constant between MZ and DZ twins but in which the correlation between the environments of DZ twins is less than that for MZ twins. Under such circumstances the phenotypic variances and covariances simulate those obtained under conditions of genetic controL Such environmental factors would tend to reduce the power of the twin study, but do not necessarily invalidate it.
Generally, factors such as assortative mating and family environmental effects, which tend to increase the similarity of MZ and DZ correlations, are more easily detected than non-additive effects and environmental effects which tend to reduce the relative correlation of DZ twins. Certain combinations of these effects may result in the acceptance of a model which is too simple (see Martin et al., 1978) or produce biased parameter estimates if the power of the test of the model is too low to detect their presence. In many instances, however, we cari say whether the assumptions of a simple model are violated using twin data, although it may be more difficult to determine the precise cause of the failure.
Many critical reviewers fail to make any precise commitment to a quantitative or causal model for environmental effects. In the case of the postulated excess similarity in the environments of MZ twins, for example, we require a mechanism which ensures the same variance of environments but achieves a different environmental covariance for the two groups of twins.

ANALYSIS OF HUMAN BEHAVIOUR 265
A possible mechanism involves genotype-environmental covariance of the first type described by Eaves et al. (1977), in which twins are treated by others on the basis of their genotype or in which twins themselves select their environment on the basis of their genotype. Such environmental effects will inevitably be correlated with, and generally confounded with, estimates of genetical parameters (Jinks and Fulker, 1970). An alternative mechanism specifies that a· mother selects the environment of her twin offspring by sampling from the same population. of environmental effects as any other mother, including the mother of DZ twins, but applies the same environmental treatment to both MZ twins because they are identical. Scarr (1968) showed for a small sample that the similarity of twin environments did not depend on parental beliefs about the zygosity of their twins. However, a parent's behaviour, though not conditioned by belief, may still be affected by observation. Mothers observing the similarity of their twins might be tempted to treat them similarly. Such effects cannot be resolved finally by model-fitting to single variables, although the adequacy of a simple model may leave little reason to suspect their importance, provided that the sample is large enough. Proof that such factors· are important lies in studies of the consequences of measured environmental treatment differences for intra-pair variation in MZ twins. The issue may n~ver be finally resolved because advocates of an environmental theory can always claim that the" right" environment has still to be measured, and supporters of a partly genetical interpretation can take the view that a particular environment is a secondary consequence of (inherited?) developmental differences between the twins concerned. If there is any way of resolving the issue it is likely to come through a detailed analysis of the similarities and differences of twins for carefully chosen" treatment" differences along the lines followed by Lytton (1977), using a larger sample. In a detailed. ethological study of twins . and singleton male infants, Lytton distinguished operationally between treatments which were " parent-initiated" and those which were parental responses to behaviour in offspring. The former actions were those which were not preceded by any action on the part of the children; the latter were those which were immediately preceded· by action by the twins. The basic finding was that MZ and DZ twins were equally alike for" parent-initiated" actions. That is, when the parent was not responding to actions of the twins she did not discriminate between twins on the basis of the actual genetical differences between them. However, when the mother was responding to the behaviour of the twins, her behaviour towards MZ twins was more alike than that towards DZ twins. Thus, there is evidence that parents may treat their offspring on the basis of genetical differences between· them, but that this may be confined to responses to actual behavioural differences rather than to any general tendency to treat MZ twins more alike simply because they are alike.
(vi) Are there cultural effects?
It has long been recognised (Cattell, 1960; Jinks and Fulker, 1970) that there might be environmental differences between families which might covary with genetical differences. Recently, environmental models have been made more parsimonious. Cavalli-Szforza and Feldman (1973) provided a basic framework for the consideration of cultural transmission

266 L. J. EAVES, K. A. LAST, P. A. YOUNG, N. G. MARTIN
by representing the degree of transmission of information from parent to offspring in terms of a regression of offspring environment on parental phenotype. Subsequently, Eaves (1976b) used this approach for the case of polygenic inheritance in randomly mating populations, specifying both the contribution of between-family environmental differences and the covariance of genotype and environment. He showed that whilst nonadditive genetical effects would be reflected in the magnitude of the betweenfamily environmental component, the> genotype-environmental covariance would reflect only the additive effects of gene loci, since only additive effects normally contribute to the genetical similarity of parent and offspring. Falconer (1964) offered a sir¢lar model for maternal effects which antedates those of both Cavalli-Szforza· and Feldman, and Eaves. Other major
TABLE 5
Anabses of variance of conservatism scores of twins from three studies of social attitudes
Hewitt Martin Last A A
Twin type Item d.f. M.S. d.f. M.S. d.r. M.S.
MZf Between pairs 323 8·36 93 338 231 1·13 Within pairs 324 1·91 95 62 233 0·25
MZm Between pairs 119 10·36 37 357 81 1-14 Within pairs 120 1·53 39 49 83 0·30
DZf Between pairs 193 9·51 52 365 145 1·22 Within pairs 194 2·89 54 101 147 0·39
DZm Between pairs 58 9·82 15 272 50 1·25 Within pairs 59 3·18 17 82 52 0·45
DZmf Between pairs 127 10·07 39 351 70 1·28 Within pairs 127 3·23 41 129 72 0·49
contributions in this area have been made by the path analysis school, who, whilst eschewing the precise specification of non-additive effects, have shown how cultural effects can be specified empirically using a regression approach (Rao, Morton and Yee, 1976). All these authors agree about the importance of adoption data for the resolution of genetic and cultural inheritance, although they may differ in their view of the practical feasibility of the enterprise and about the precise technicalities of the data analysis. Cavalli-Szforza and Feldman (1973) have been largely concerned with different mechanisms of cultural inheritance. The emphasis of the Birmingham and Hawaii schools has been on devising models which, whilst not representing all the conceivable subtleties of the action and interaction of genes and environment, do represent their broad features in a form applicable to real data. Unfortunately, real data of adequate structure and magnitude are scarce. The family environment and the covariance of genetical and environmental factors between families cannot be resolved with twin data alone, though their joint effects may be detected and we can decide whether particular bodies of data display any characteristics of cultural inheritance.
In table 5, we present mean squares from three studies of the social attitudes dimension" conservatism ", measured by three different scales. The twins are all volunteers from the Institute of Psychiatry Twin Register, and there is some overlap between the twins participating in the three studies-certain twins have completed all three questionnaires, and some only one. The data analysed by Martin and Eysenck (1976) are anonymous

ANALYSIS OF HUMAN BEHAVIOUR 267
so we cannot correlate the replies across occasions for these twins. The twins in the studies summarised by Hewitt (1974) and Last (1978) are uniquely identified and can be used in an analysis of repeated measurements. These three studies are remarkably consistent, even though the questionnaires given were quite different in format. The three" conservatism" scales represent the first major factor which emerges from virtually any study of social attitudes. This dimension discriminates between subjects who adopt more ' traditional ' and ' conservative ' views on social, political, religious and moral values and those who hold less traditional, more radical values. The scale, called" conservatism" by Eysenck (1951), correlates with voting behaviour. Hewitt et al. (1977) -showed that the original factor structure postulated by Eysenck is appropriate for contemporary samples using the
TABLE 6
Expectations for twin mean squares when there are cultural differences between families
Expected mean square A
Twin type Mean square El DR B
MZ/ Between pairs 1 1 2 Within pairs 1
MZm Between pairs 1 1 2 Within pairs 1
DZ/ Between pairs 1 1- 2 Within pairs 1 t
DZm Between pairs 1 1- 2 Within pairs 1 t
DZm/ Between pairs 1 1- 2 WithiIi pairs 1 t
original questionnaire. The mean squares superficially resemble those reported for psychoticism. However, the simple El DR model used in the analysis of psychoticism does not adequately explain variation in all three data sets (X: = 23·4, 7·7 and 14·3 respectively, corresponding to probabilities of 0·003, 0'463, 0·074). The small sample size in Martin's study does not permit detection of departures from this simple model, but its failure becomes apparent as the sample size (and power of the test) increases in the two larger studies. If we speculate that social attitudes are influenced by peers and parental behaviour, it is not surprising that the model, which assumes these effects are unimportant, is unsatisfactory.
An alternative model (Eaves, 1977) is given in table 6. A parameter, B, has been added to the expectation for between-families variance, to provide for the effects of the twins' shared environment. The following effects are confounded in B: 1, between-families environmental differences; 2, their covariance with genetical differences between families; 3, their interaction with genetical differences between families; 4, additional additive genetical variation due to assortative mating. We cannot, therefore, attribute a significant 13 to any specific effect. However, the demonstration that the mechanism may not be simple is important for the development of a theory of cultural variation. Genetical non-additivity will lead to underestimation of B, because dominance and epistatic effects tend to inflate the relative contribution of genetical effects within families. However, if 13 proves to be significant, some combination of the effects enumerated could be producing variation in conservatism.

268 L. J. EAVES, K. A. LAST, P. A. YOUNG, N. G. MARTIN
In all three studies (see table 7), the addition of B substantially improves the fit of the model and gives significant estimates. This suggests that some mechanism other than simple additive gene action is responsible for variation between families. The mechanism could be cultural transmission of attitudes from parents to offspring or the influence of peers shared by twins of a pair. We must also consider the possibility of a purely genetical basis to the additional variation as a result of linkage disequilibrium caused by assortative mating. There is certainly detectable covariation between spouses for conservatism, estimates of the correlation between spouses ranging from about 0·4 to 0·6 (Insel, 1974; Last, 1978). Using these values in conjunction with the estimated contribution from additive genetical effects provides some limits to the contribution of the genetical consequences of assortative mating to B. Assuming that the phenotypic correlation between spouses
TABLE 7
Summary of sources of variation in conservatism in three twin studies, including estimated contribution of assortative mating (V AM) andfamily environment (E2) for two marital correlations (fJ-)
Contribution (%) ~ ______ ~A~ ______ ~
Contribution (%) Test of model fJ- = 0·4 fJ- = 0·6 I
A , ~ ~ ,--A-----.. Study £1 tDR fJ x: P% VAM E2 VAM E2
Hewitt 31·4 40·1 28·8 10·08 18 10·1 18·8 27·2 1·6 Martin 27·4 44·3 28·4 3·26 78 13·2 15·1 28'4* 0 Last 35·1 37·6 27·3 6·20 52 8·5 18·8 19·8 7·5
* Maximum possible value, corresponds to fJ- = 0·54.
is primary and that the genetical correlation (A) is secondary, we have, following Fisher (1918): A = f-Lhj.,. Appended to table 7, are estimates of the contribution of assortative mating to 13 for the two extreme values of the marital correlation. The limits of this contribution are wide, but suggest that about half of the additional variance between families which cannot be ascribed to additive genetical effects is probably due to assortative mating. These data provide no test of this aspect of the model. They are introduced to i111J.Strate the fact that a simple explanation can fail to predict the similarities 'and differences of twins and lead to more detailed and informed speculation about the likely mechanism of variation. Eventually, conclusions based on the twin study must be examined against the background of other types of relationships.
(vii) Competition, co-operation and the genetic environment
The emerging discipline of sociobiology (E. O. Wilson, 1975; Dawkins, 1976) has accumulated much criticism for its attempt to relate aspec1s of social organisation to the evolutionary process. The chief postulate of sociobiology is that individuals influence other individuals, and if such influence has a genetic basis it may lead to evolutionary change. The mathematical basis of sociobiology is provided by the theory of kin selection (e.g. Hamilton, 1 964a, b; Maynard Smith, 1964) which recognises that alleles may have effects, through social interaction, on the phenotypes of individuals who do not carry them. Darlington (1969, 1971) introduced

ANALYSIS OF HUMAN BEHAVIOUR 269
the notion of the "genetic environment" to represent the effect of the genes of one individual on the phenotype of another. Sociobiology is largely concerned with the examination of species characteristics by relating species differences in. social organisation to differences in genetical structure of the population. Litde attention has been paid to intra-specific variation, nor t? the detection of those aspects of behaviour in man which display the effect of the genetic environment. The model of Cavalli-Szforza and Feldman (1973) and its various simplifications and variations (Eaves, 1976b; Rao et al., 1976) provide the analytical basis for the detection of the environmental consequen.ces of genetical .differences segregating in the parents of a generation. Such models might ·be appropriate in the investigation of maternal behaviour.
Eaves (1976a) suggested that the effects of sibling co-operation and competition, which are also important theoretically in evaluating the role of the genetic environm.ent in evolution, might be detectable in twin data, if their effects are due to genetically determined behavioural differences. Just as we define a parameter, DR, to repres~nt the additive effects of gene loci, so the model for individual differences can be extended to include the contribution of gene effects to the sibling environment. Three parameters are required to .represent the basic components of the sibling effects model when gene action is additive. The first is the ad<#tive genetical component (DR); the two others represent the additional environmental variation due to the effects of the segregating genes on siblings and the covariation of genetical effects with the environmental influences provided by siblings. Eaves (l976a) called these parameters Di and D~ respectively. The model (see table 8) shows that, whenever the same genes contribute directly to phenotyic deviations and to a change in the phenotype of any sibling who is exposed to their environmental effect, there will be a systematic difference between the total variances ofMZ and DZ twins. Eaves (l976a) defined as "co-operation" the case where an allele which increases the expression of a trait in its bearer also leads, through the sibling environment, to an increase in the expression of the trait in a sibling. The converse situation, in which an increasing allele exercises a decreasing environmental effect on a sibling, was defined as " competition ".
Both co-operation and competition will produce additional "environmental" variation in twins, compared with individuals reared in conditions of reduced density (i.e. singletons). Therefore, Di will be positive. However, since the coefficients of Di are identical to those of DR for individuals reared at constant density, the contributions of direct genetic effects and those of the genetic environment are inseparable in twin data (table 8). Nevertheless, if there is systematic genotype-environmental covariation due to sibling effects (because the same alleles are responsible for the variation contributing to DR and Di), then D~ will differ from zero, being negative if there is competition and positive if there is co-operation. Under these circumstances, the El DR model will fail to account for the characteristic pattern of variation in twins. The total variances of MZ and DZ twins will differ. Competition will tend to make the total variance ofMZ twins less than that ofDZ twins, whilst co-operation will produce the reverse effect. Also, the twin covariances will no longer display the pattern expected under the additive model. Competition will tend to make the covariance of DZ twins less than half that for MZ twins

270 L. J. EAVES, K. A. LAST, P. A. YOUNG, N. G. MARTIN
TABLE 8
The specification of additive genetic eJfocts in the presence of co-operation or competition, omitting other environmental effects
Mean square
Between MZ pairs Within MZ pairs Between DZ pairs Within DZ pairs Singletons
Genetic DR
1
! t i
Parameter
" Environmental " D" R
1
\
Genotype-environmental covariance
D' R 2
Ii -i
(thus introducing iI).to the twin correlations, a superficial resemblance to the effects of genetical non-additivity), whereas co-operation will tend to inflate the covariance of DZ twins relative to that of MZ twins, thus introducing a superficial resemblance to the consequences of the shared environment. Such similarities are superficial and would only mislead those who continue to work with correlations with no consideration of the information obtained from total variances because neither the effects of the family environment nor those of dominance could, by themselves, lead to differences between the total variances of MZ and DZ twins. In the case of competition, the confusion with dominance is unlikely to occur when competitive effects are marked, since, unlike dominance,_ competition between twins can result in negative covariance between DZ t~ins which would be inconceivable under the classical genotype-environmental model. The effects of sibling cooperation are more likely to be mistaken for those of the ordinary family environment in twin data because both increase twin similarity. The attraction of a simple model, such as that specified in table 8, is that it establishes criteria to be sought in empirical studies, and it provides the basis for a more general theoretical formulation which can be employed in predicting the results for other types of relationship. Eaves extended the sibling effects model to include the expectations for singletons and unrelated individuals reared together. The expectations can easily be extended still further to specify the similarity between parents and offspring under a variety of conditions of sibling density in the parental and offspring generations.
The competition model formulated in table 8 conceives of competitive effects as functions only of the genetical similarities and differences between individuals reared in the same family. Models of competition and cooperation can equally well be formulated in which the primary source of these effects is environmental. In twins, however, the environmental effects of co-operation are indistinguishable from those which assume that the variation is determined solely by chance and cultural effects without the intervention of sibling interactions. Environmental competitive effects could be inferred if both MZ and DZ covariances are negative (which cannot happen under a purely genetical hypothesis about competition) and if the total variances are homogeneous.
In a recent study of sexual attitudes (Martin and Eysenck, 1976), twin volunteers completed questionnaires which yielded scores on a scale of sexual satisfaction. The authors have reservations about the quality of their

ANALYSIS OF HUMAN BEHAVIOUR 271
sample in view of the heavy selection which is likely to be imposed in studies of these particular components of behaviour, but the results obtained from female twins for this scale illustrate many of the features of data in which competitive effects are important. The mean squares of female MZ and DZ twins are given in table 9. A simple DR E1 model barely fits the data although the likelihood ratio chi,.square (X~ = 4·91, 0·05 < P < 0·10) is not significant. Fitting the competition model, based on additive genetical differences (see expectations in table 8) gives a significant change in the likelihood of obtaining the mean squares (X~ = 4·90), although the exceptionally good fit (X~ = 0·005) of the competition model would lead us to
TABLE 9
Mean squares obtainedfrom analysis of sexual satisfaction scores infemale twins
Twin type Item d.f. Mean square
MZ Be.tween pairs 93 269·0 Within pairs 95 140·9
DZ Between pairs 52 240·9 Within pairs 54 274·6
suspect, quite correctly, that this is a chosen example for the purposes of illustration rather than a simple independent and unexpected example of the phenomenon of competition or co-operation. The parameter estimates are:
A (DR+DR) = 331'8+118'9, 21 = 141'1+20·4, fj~ = -101'2+55·5.
The negative value of the genotype-environment covariance parameter, DR" implies that competitive effects, based on genetical differences between female twins, are contributing to reported sexual satisfaction. If such a finding were replicable, it would suggest that there is competition for sexual partners based on genetical differences, perhaps because of genetical variation in perception of the characteristics of an acceptable partner.
The real key to the analysis of sibling effects is the inclusion of family density as a parameter in behaviour-genetic studies. The conventional twin study does not control for family density effects, so it will not detect sibling effects which have no genetical basis or which show no covariance between the gene effects contributing to the genetical variance (DR) and those contributing to the "genetic" environmental variance (D~). For example, the inclusion of singleton controls is a desirable procedure when the traits concerned could be subject to sibling effects. Differences between the variances (and the means) of twins and singletons could indicate the
_. importance of sibling effects and enhance the power of the classical twin study. In a study (Young, 1977) of the personality characteristics of juveniles using the junior form of the EPQ, mean squares were obtained for the lie scale after correction for age and sex. An angular transformation was conducted to remove heteroscedasticity of the raw scores prior to analysis of variance. Further details of the data and subsequent analyses are reported in Young et ale (in preparation). The mean squares for twins are given in table 10. These data, whilst being consistent across sexes, give no support to the view that genetical factors contribute to variation in the lie scores of juveniles although there are significant differences between families.

272 L. J. EAVES, K. A. LAST, P. A. YOUNG, N. G. MARTIN
TABLE 10
Data summary for "lie" scores oftlze JEPQ*
Group Item d.f. Mean square
MZm Between pairs 64 0·062 Within pairs 65 0·018
MZ, Between pairs 53 0·051 Within pairs 54 0·020
DZm Between pairs 43 0·053 Within pairs 44 0·014
DZ, Between pairs 41 0·078 Within pairs 42 0·025
DZmf Between pairs 81 0·067 Within pairs 82 0·026
Singleton m Total variance 102 0·029 Singletonf Total variance 107 0·032
JEPQ = Juvenile form of the Eysenck Personality Questionnaire.
Indeed; the data suggest that there is a significant effect of the family environment. When a model which assumes that the only sources of variation are the within-family environment (El) and the between-family environme.nt (E2) is fitted, the residual chi-square is not significant (X~ = 8·4, P = 0·39). There is no further significant increase in the likelihood when additive genetical factors are included in the model (X~ = 0·79, P < 0'50). An analysis based on twin data alone would be forced to stop at this point. However, since the study was designed with the possibility of detecting sibling effects in mind, a sample of singleton subjects was included. The variance of singleton males was 0·0288 and that· of singleton females was 0·0322. In both cases the variance of singletons is less than that of twins (although there is no difference in means), suggesting that there is an additional source of variation in twins, possibly because the behaviour of one twin affects that of the other. Since the lie scores of the twins show a uniformly significant positive correlation, we would conclude that the sibling effects were" co-operative" rather than" competitive": twins who are" truthful " tend to reinforce one another's " truthfulness", whereas those who do not admit to common failings tend to support one another in this behaviour. The hypothesis can be formalised in terms of the following linear model
2 2 = 2E' (J" BMZ = (J" BDZ
(J"~MZ = (J"~DZ = E+E"-2E'
where E represents specific environmental effects (i.e. the environmental variation which would persist even if individuals were reared as singletons) which are initially uncorrelated between twins, E" is the additional environmental variance due to the interaction between twins and E' is the covariance between the environmental effects on an individual and effects of the same environmental factors on his/her co-twin. In terms of this model the variance of singletons, a: = E. The expectations of E, E' and E" will depend on the original environmental correlation of the twins but no more parameters can be estimated.
On fitting the linear co-operation-competition model to the twin and singleton data for the lie scale oftheJEPQ, we found that the model provided a satisfactory fit to the lO mean squares for twins and the additional two

ANALYSIS OF HUMAN BEHAVIOUR 273
variances for singletons (X: = 8·76, P ~ 0·46). Furthermore, the parameter. estimates:
E = 0·0306 ± 0·0029
E' = 0·0104±0·0014
En = 0·0112 ± 0·0040 ~
are all highly significant. As we might expect, the bulk of the variation is attributable to the direct influence of environmental factors which do not depend on the presence of a twin since E is substantially larger than En. However, the data on the lie scale are consistent with the existence of a large effect of the environment provided by a co-twin. If all environmental causes were contributing to co-operative effects, we would expect E' / v' (E. En) = 1. This is not the case. One interpretation is that there are environmental factors such as experiences and errors of measurement which contribute to individual differences but do not contribute to sibling effects. This means that E = V + V', where Y is the variance due to environmental factors which can produce sibling effects and V' is the contribution from other factors. If we allow that the twin environments are uncorrelated apart from the effects of co-operation and competition and let E'/-y'CV.E") = 1, we have the contribution of random environmental effects, V' = E-E'2/E" = 0·0209. Thus, given that the basic model is appropriate, about two-thirds of the variation in singletons is due to environmental factors, including errors of measurement, which in no way contribute to the influence of one twin upon another.
Much of human behavioural genetics has involved the use of questionnaires or pencil and paper tests to assess behaviour. This approach is needed to obtain data on sufficiently large numbers of subjects to provide small enough errors for parameter estimates. There have been relatively few attempts to combine a more ethological approach to behavioural measurement with the advantages of a quantitative theory and methodology for the analysis of human differences. Lytton et al. (1977) offered one example of such a study which involved tantalisingly small numbers, and like a great many ethological studies the number of variables studied exceeded the number of subjects in the survey. Data were obtained on the proportion of time individual 2-year-old twin and singleton boys spent in play with their fathers. The means and mean squares for the three groups of subjects, MZ and DZ twins, and singleton controls are given in table 11. The means and variances of singletons on this scale are greater than the corresponding statistics for twins. One interpretation of this observation is that singletons are able to extract proportionately more of their fathers' attention than twins, for whom there is likely to be much more competition. We may postulate an empirical competition parameter, p, say, which is the ratio of resources extracted on average by singletons in comparison with twins. The parameter, p, is thus the ratio of the means of singletons to twins. How does competition affect the variances of such a trait? We must consider two factors. Firstly there is the scale factor, related to p, which would represent the fact that the same source of variability (genetical differences, for example) is likely to be magnified when the competitive restrictions of the twin situation are removed. If we assume that the resources extracted by a singleton are a multiple, p, of what he would obtain if he were a twin,

274 L. J. EAVES, K. A. LAST, P. A. YOUNG, N. G. MAR TIN
then the variance of singletons is expected to be p2 times the variance of twins. We will adopt this as a working hypothesis for the data on play with father. Secondly, we must also recognise the possibility that the ability of twins to extract a given amount of paternal attention may depend upon genetical factors and thus be also influenced by competitive effects such as those considered earlier and in the paper by Eaves (1976a). The model for means and variances in table 12 attempts to combine the competitionco-operation model of Eaves (1976a) with the restricted resources model. Using the method of WLS this model was fitted to the data on play with father, weighting the means by the inverse of their expected variances. Using the residual chi-square criterion of goodness of fit, the model gave a
, remarkably close fit and yielded parameter values all of which are significant at the 5 per cent level or approach significance at the 5 per cent level on the basis of the c test, (p being tested for difference from unity). The expected values and the parameter estimates are given with the observed data in table 11. The expectations for singletons agree exactly with the observations since the mean of singletons is a direct estimate of mp, whilst the variance of singletons IS the only statistic which contributes to the separation of DR and DR.
TABLE 11
Observed and expected statistics for child's play withfather
Statistic N (d.f.) Observed value Expected value*
MZmean DZ mean Singleton mean M.S. between MZ pairs M.S. within MZ pairs M.S. between DZ pairs M.S. within DZ pairs Singleton variance
30 2·51 2·50 46 2·49 2·50 44 4·23 4·23 14 14·23 17·45 15 0·91' 0·98 ~ 14~ 1~~ 23 12·76 12·76 43 22·50 22·50
* Computed using expectations in table 12.
Parameter
Mean 21 fJR fJ"R jJ'R
P
Estimate
2·501 ± 0·181 0·975± 0·356
13·766± 6·738 18·031 ± 10·269
-7·664± 3·898 J·692± 0·311
TABLE 12
Model for competitive effects for child's play with father
Parameter ~ ______________ ~A~ ____________ ~
Statistic m El DR DnR D'R
MZmean 1 DZ mean 1 Singleton mean p M.S. between MZ 1 I 1 2 M.S. within MZ 1 M.S. between DZ 1 ! t II M.S. within DZ 1 * * -! Singleton variance p2 Ipt
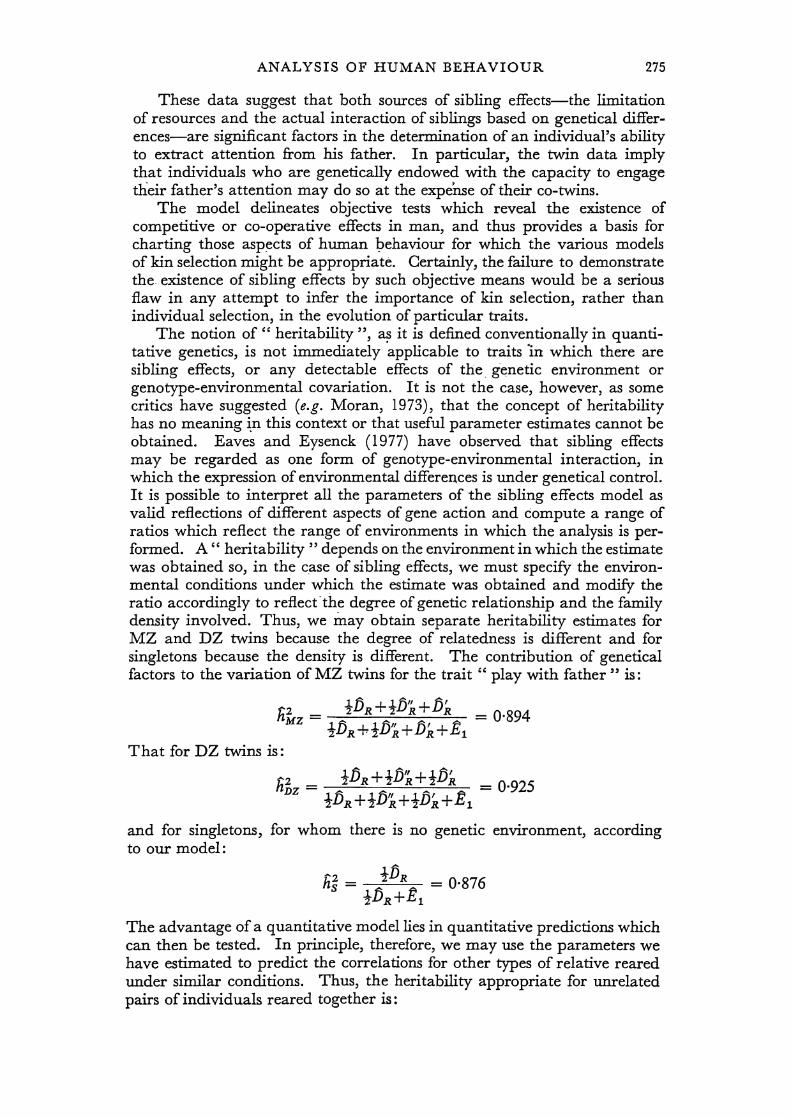
ANALYSIS OF HUMAN BEHAVIOUR 275
These data suggest that both sources of sibling effects-the limitation of resources and the actual interaction of siblings based on genetical differences-are significant factors in the determination of an individual's ability to extract attention from his father. In particular, the twin data imply that individuals who are genetically endowed with the capacity to engage their father's attention may do so at the expense of their co-twins.
The model delineates objective tests which reveal the existence of competitive or co-operative effects in man, and thus provides a basis for charting those asp~cts of human ~ehaviour for which the various models of kin selection might be appropriate. Certainly, the failure to demonstrate the-:existence of sibling effects by such objective means would be a serious flaw in any attempt to infer the importance of kin selection, rather than individual selection, in the evolution of particular traits.
The notion of " heritability", a~ it is defined conventionally in quantitative genetics, is not immediately applicable to traits 'in which there are sibling effects, or any detectable effects of the, genetic environment or genotype-environmental covariation. It is not the case, however, as some critics have suggested (e.g. Moran, 1973), that the concept of heritability has no meaning ~n this context or that useful parameter estimates cannot be obtained. Eaves and Eysenck (1977) have observed that sibling effects may be regarded as one form of genotype-environmental interaction, in which the expression of environmental differences is under genetical control. It is possible to interpret all the parameters of the sibling effects model as valid reflections of different aspects of gene action and compute a range of ratios which reflect the range of environments in which the analysis is performep.. A" heritability" depends on the environment in which the estimate was obtained so, in the c,ase of sibling effects, we must specify the environmental conditions under which the estimate was obtained and modify the ratio accordingly to reflect' the degree of genetic relationship and the family density involved. Thus, we may obtain separate heritability estimates for MZ and DZ twins because the degree of relatedness is different and for singletons because the density is different. The contribution of genetical factors to the variation of MZ twins for the trait " play with father" is:
ti2 = t1JR +t1JR + 1JR = 0'894 MZ t1JR +t1JR+1JR+.t:1
That for DZ twins is:
ti2 = t1JR +t1JR+t1JR = 0.925 DZ t1JR +tDR+t1JR+.E1
and for singletons, for whom there is no genetic environment, according to our model:
The advantage of a quantitative mode1lies in quantitative predictions which can then be tested. In principle, therefore, we may use the parameters we have estimated to predict the correlations for other types of relative reared under similar conditions. Thus, the heritability appropriate for unrelated pairs of individuals reared together is:

276 L J. EAVES, K. A. LAST, P. A. YOUNG, N. G. MAR TIN
h2 = tlJR +tlJR = 0.942 UT !DR +tDR+E1
Since there is apparently so little variation in this trait as a result of environmental factors which do not depend on sibling effects, the above heritability estimates are all very high and the differences between the estimates for different types of relationship are small. This will not always be the case and it may be expected in principle that sibling effects could require quite different estimates for different individual cases.
Singletons and multiple births represent the two extremes of density which might be experienced. in the human family and we have concentrated on these because they may provide the most direct evidence-of the importance of sibling and density factors on behaviour. However, there is a continuum of density which may depend on such factors as family size and spacing of siblings which might be exploited in the development of models for social ir},teractions. Inevitably, extraneous genetic and social factors correlated with the trait under study (especially when the trait concerned is human intelligence) make foolproof analysis of such systems difficult, but with care such resolution may be possible along the lines suggested. Indeed, in the case of human intelligence, Zajonc (1976) has already proposed a quantitative envh-onmental model for the relationship between such factors as density and intelligence. At the level of finer analysis, other workers (e.g. Corey et al., 1976) have suggested that, even within the two main groups of twins, the environmental factors and the competitive circumstances may not be entirely homogeneous since different types of placentation (whether monochorionic or dichorionic, whether the developing twins have separate or partly anastomosed placental vascular systems) may affect certain early characteristics of twins. It remains to be seen whether such early differences can be shown convincingly to have long-term consequences for measured behaviour.
(viii) The place and power of the twin study-
Since the early 1950's every conceivable type of psychological test has been applied to at least some twins. The substantive finding is that MZ twins are more similar than DZ twins for virtually any measurable behavioural trait. Little light has been shed upon the detailed causes of variation. This is partly because the twin method is inherently unsuitable for such resolution and partly because the analysis even of twin data has usually stopped with the detection of a genetic component to individual differences. There is little doubt, for all its weakness, that the twin method has contributed more than any other to a growing awareness of the importance of genetical factors in psychological measurements and to the recognition that a psychology, which ignores man's evolutionary past and the biological basis of his present differences, is barren.
The examples we have chosen are not selected at random. In the vast majority of cases twin data are consistent with a very simple model. We have emphasised the exceptions to show that the twin study is by no means impotent but can reveal patterns of variation which require further explanation. The twin study, for example, can draw our attention to the existence of cultural factors for a particular trait, suggest the importance of sibling effects or sex-dependence of gene expression.

ANALYSIS OF HUMAN BEHAVIOUR 277
If the twin study is to have a future in human quantatitive genetics, it will no longer be as the mainstay of an investigation of the "heritability " of a heterogeneous collection of behavioural measurements. Twins are going to be chosen as part of a wider strategy for the analysis of selected measurements which are believed to have properties of particular interest. Either $eir use illustrates a principle important to our scientific understanding of man-as in the case of the effects of the perSonal environment provided by parents and siblings--or the chosen trait has a particular social importance as in the study of Behrman et al. (1977). In either case, twins are not an end in themselves_ since the twin _study cannot constitute a definitive basis for genetic analysis. The use of twins in epidemiological research is becoming more widespread because of the opportunity they.provide of separating some of the constitutional and environmental factors in the aetiology of disease. The controversial relationship between smoking and morbidity (Cedetlof et al., 1977) has been the object of twin research which provides substantial support for the View that the tendency to smoke is one constitutional factor among several which may lead to. an individual subjecting himself to a damaging environment.
The twin method has positive value in providing necessary information about scaling a~d the likely importance of certain genetical and environmental factors, including sex interactions and sibling effects. It may, therefore, help prune a morass of behavioural measurements to a few reliable traits which illustrate particular features of determination, significant for psychological or sociobiological theory.
In particular, the replicated finding that there are differences between families, which cannot be simply attributed to the additive effects of genes in a randomly mating population, draws attention to the domain of social attitudes as one in which cultural factors, or the effects of the mating system, may be especially important.
Martin et al. (1978) show how to quantify the primary areas of weakness in the twin study. Their approach recognised two main justifications for the criticism of particular designs. The first is that particular effects may be formally inseparable no matter how large the study. The second criticism is statistical; namely that the sampling errors attached to parameter estimates may be so large for a particular study, that even if certain parameters could be estimated in principle, the actual sample sizes are too small to permit gross effects to be detected. Virtually any study can be criticised on one or both of these grounds. We have shown how twin data are often ambiguous once the simple DR, El model has failed. Thus, in the case of social attitudes, we showed that additional variation between families was present, but were unable to discriminate, with the twin design, between its genetic and environmental components. No twin study, however large, could permit such discrimination.
The presence of genetic dominance could, in theory, lead to rejection of the simple model providing that the relative reduction in DZ twin similarity is not offset by a corresponding relative increase due to the family environment or assortative mating (see e.g. Jinks and Fulker, 1970). However, even when dominance is complete, the actual contribution of dominant gene action to variation is small compared with additive effects, so that twin studies would need to be prohibitively large, or the trait measured unusually heritable, to permit the detection of dominance (Martin et at.,

278 L. J. EAVES, K. A. LAST, P. A. YOUNG, N. G.MARTIN
1978). The difficulty associated with the detection of non-additive effects is not confined to the twin study (Eaves, 1972).
The study of Martin et at., and those of other authors (Eaves, 1972; Eaves and Jinks, 1972; Klein, 1974; Eaves et al., 1977) make criticism quantitative rather than verbal. They allow estimation of the errors of inference inherent in a particular design, and permit the power of given studies to be specified precisely. In the case of the detection of non-additive factors, or in the comparison of statistics from different populations (Eaves and Jinks, 1972), the power of the twin study is low. In other cases, for example in the rejection of the DR, El model (Martin et al., 1978), the findings lead to cautious optimism.
3. TOWARDS A GENERAL MODEL: ALTERNATIVES TO TWINS
Eventually the results of the twin study must be tested by examining the wider predictive validity of the twin model. No single extension of the twin study is foolproof, but we may distiriguish three broad strategies: the parent-offspring study; the adoption study; the study of half-siblings and offspring ofMZ twins.
(i) Parent-offspring studies
The strategy of parent-offspring study has grown up in human genetics around the analysis of morphological traits like dermatoglyphics, for which the assumptions of an unsupported parent-offspring study are most likely to be met. The principal untestable assumption of the parent-offspring study is that the m-echanism of transfer of information from parent to offspring is entirely genetic. On the other hand, comparison of parentoffspring similarity with the similarity of siblings will permit basic assumptions to be tested, whatever the primary mechanism of inter-generational transfer. In particular, the differences between parent-offspring and sibling similarity may reveal genetical non-additivity (although the power of the test is still low) or show that there are environmental differences between sibling families which do not depend simply on the parental phenotype. Many of the largest bodies of data for human traits still consist of parentoffspring measurements.
The parent-offspring study is useful when there is already substantial evidence of a genetic component to provide a more precise estimate of additive genetical variation and to permit more reliable separation of the contribution of genetical non-additivity by comparison with the results of sibling and twin data. A large parent-offspring study also permits a test for sex interactions. A recent large study of measures of ability (Defries et al., 1976) in parents and offspring confirms earlier findings and gives estimates of the narrow heritability for intelligence which are comparable with those reported by earlier workers (Jinks and Fulker, 1970). Furthermore, their data generally confirm the equality of maternal and paternal contributions to parent-offspring similarity and, thus, give no reason to suppose that there are sex-dependent mechanisms in operation as far as the determination of abilities is concerned.
Parent-offspring data do not always vindicate models based on twin data. This would surprise few plant geneticists who have been forced to' grow parents and offspring in different years. I t is a common finding that
ANALYSIS OF HUMAN BEHAVIOUR 279
the parent-offspring covariance underestimates the contribution of additive genetical factors because of genotype-environmental interaction; different genetical effects being expressed in different years of measurement. Perhaps the surprising fact is that the analyses of parent-offspring data on intelligence yield results which are generally so comparable with the findings from other types of relationship. Thus, for example, Jinks and Fulker (1970) and Eaves (1975) showed how the parent-offspring data for general intelligence appeared to fit well to the pattern of variation deducible from other relationships and vice versa. However, there are several reasons for caution. Firstly, the similarity of adopted individuals and their foster-parents is not zero either in the earlier studies (Burt, 1966; Jencks et at., 1972) nor in the more recerit studies of Scarr and Weinberg (1976). If such similarity is not entirely due to placement, then there must be environmental factors in parentoffspring similarity which will lead to the natural parent-offspring correlation being an overestimate of the hereditary simil~ty of parents and offspring. Correcting for this will lead t~ a smaller ~arrQw. h~tability and consequently to a significantly larger estimate of the 'contribution of non-additive genetical factors if twins and siblings provide most of the information about the broad heritability.
Exactly how the environmental similarity of parents and offspring is to be regarded is still a source of disagreement. Eaves1 (1975) reanalysis of the correlations of Burt (1966) demonstrated that there was little reason to treat the small foster-parent-foster-child correlation as differing significantly from zero and thus to regard the whole of the natural parent-child similarity as an estimate of genetical covariation. All family environmental effects on siblings and twins were thereby assigned to factors which did not depend on the IQofparents.. . .
Several alternative hypotheses have been advanced to summarise the environmental similarity of parents and offspring for IQ, given that there is such. The Hawaii group (Rao et at., 1976) have argued that there is non-genetic transfer of information from pM'ent to offspring which produces the environmental similarity between parents and offspring. The Birmingham group (Jinks and Eaves, 1974; Eaves 1975) considered both sibling similarity and parent-offipring similarity as a joint consequence of the social and physical proximity which goes with living in a common environment rather than as a direct causal consequence of parental intelligence. This model is analogous to recognising the family environment as a transient partition of the total environment. An extreme example would be the environmental correlation introduced by testing all members of a family on the same day.
Neither approach has survived criticism unscathed. Goldberger (1977a) .' has claimed that the Hawaii group made an error in specifying their path
model for the effects of genes and environment which resulted in the mistaken resolution of inseparable paths. Eaves (1975) omitted the environmental covariance from the model for marital correlation, thus, overestimating the genetical' consequences of assortative mating. The precise consequences of correcting these errors have not been determined, though Goldberger has argued that the Hawaii model now yields nonsensical parameter estimates. The alternative specifications of the family environment may be beyond resolution with the data currently available. However, the model of Rao et at. (1976) predicts environmental similarity for relationships more distant

280 L. J. EAVES, K. A. LAST, P. A. YOUNG, N. G. MAR TIN
than parents and offspring and siblings, whereas the model proposed by Eaves (1975) would not do so.
One thing, however, is quite clear. The data which are currently available have neither been collected nor presented in a sufficiently uniform way to leave the contribution of cultural factors to variation in human intelligence beyond dispute.
(ii) The adoption study
As . a strategy for the estimation of family environmental effects, the adoption study has long been· recognised as the most powerful in principle but the most difficult to execute effectively in practice; There are two main problems in conducting adoption studies. The first is identifying the appropriate subjects with the severe strictures of confidentiality surrounding the practice of adoption. The second problem is sampling and pl~cement. The extent to which· children offered for adoption are a random sample of the population of genetic and environmental effects is as questionable for this group as for any other type of human subject. Furthermore, the similarity between foster-parent and foster-child may be due partly to conscious <?r unconscious selection which places more gifted adoptees in the homes of more intelligent parents. There is evidence of placement for cognitive traits. Jencks (1972) cites the similarity between the educational levels of foster and natural parents as one index of placement in adoption studies. Shields (1962), in his exhaustively documented case histories of separated twins, records numerous instances of twin pairs in which one member of the pair has been reared by a relative.
Most critici~ms of the adoption study, which are usually taken as grounds for dismissing such studies entirely, appear to miss the fundamental point that placement is going to lead to the overestimation of the environmental similarity between unrelated individuals reared or living together and to overestimation of the genetic similarity of related individuals reared apart. Placement does not preclude any legitimate attempt to infer the degree of causal environmental similarity between relatives, provided the researcher is prepared to postulate the mechanism on which placement is achieved.
(iii) The offspring and spouses of twins
A third attractive possibility is the study of the offspring and spouses of twins. The method, applied to the families ofMZ twins, has been dubbed the "MZ half-sib method" (Nance and Corey, 1976), but there are advantages to extending the design to include the families of DZ twins (or siblings). Although the design is based initially on the selection of twins, the method combines a great many powerful features and is able to test certain assumptions implicit in the analysis of other designs. The design can detect the effects of the maternal genotype without the difficulty of parity effects and other environmental complications which attend halfsibling studies. Since the offspring of female MZ twins are, genetically speaking, maternal half-siblings and the offspring of male MZ twins are paternal half-siblings, the coventional half-sibship analysis will yield tests of maternal effects. Since the mothers and fathers are twins, however, the only maternal effects contributing to maternal half-sibship similarity will

ANALYSIS OF HUMAN BEHAVIOUR 281
be those which depend either on the family environment or the genotype of the mother. As in other half-sibship designs, maternal effects will also contribute to the differences between sibships within paternal half-sibships.
Simultaneously the design yields data on parents and offspring. Since MZ twins are genetically identical each offspring can be paired with its natural parent and with the parent's MZ twin, who is genetically related as parent but who has played no direct parental role. At first glance it would seem that the design, therefore, generates parents and offspring reared apart who are almost impossible to ascertain in large numbers through the conventional adoption study. In the adoption study, however, the natural and foster-parents are-normally regard.ed as unrelated. In the MZ half-sibling design the formal equivalent of natural and foster-parents are genetically identical and may share many important cultural features. In terms of the adoption study, therefore, the MZ half-sib design is maximising the effects of placement for related individuals reared apart and, thus, underestimating the contribution of cultural effects if a simple genetical model is fitted. Some of these difficulties would be overcome by :the inclusion of DZ (or sibling) parents, since the additional relationships -would provide further information for the discrimination between alternative hypotheses.
A further attractive feature of the design, especially in its extended form, is the information provided for the direct resolution of alternative models of assortative mating. In addition to the direct phenotypic correlation of spouses, the design provides correlations between an individual and the spouse of his/her MZ co-twin. Under certain conditions this will be a direct estimate of the genotypic component of assortative mating. In general, the design should strengthen the tests of assumptions underlying models for the mating system.
So far, only relatively small studies have been published employing this approach (e.g. Christian and Kang, 1977) and there has been no systematic analysis of all the relationships inherent in the design. Much larger studies are needed if the design is to make its full impact on the field, and the current restriction of the design to the offspring of MZ twins reduces its general predictive power. No design entirely escapes criticism. Many of the difficulties associated with the analysis of parent-offspring data, for example, do not disappear in the ascertainment of the families of twins. However, as we shall see, the models and methods for the analysis of such data are now available. Indeed, as Elston and Rao (1978) have observed, "The most useful advances, however, can be expected to arise as a result of deficiencies noted in the application of current models in the analysis of bodies of real data rather than as a result of model building divorced from data analysis". With this view we heartily concur. What we need now are the data. The only long-term hope for the resolution of the manifold primary sources of variation lies in simultaneous model-fitting to data collected on a wide variety of relationships.
4. THE ANALYSIS OF EXTENDED DATA SETS
The attraction of the twin study is the independence of the summary statistics for each type of twin. As long as the study consists entirely of families in which each individual only enters into one relationship, the analysis of variance offers a convenient data summary and the method of
41/3-0
282 L. J. EAV~S, K. A. LAST, P. A. YOUNG, N. G. M;ARTIN
weighted least squares, with a diagonal weight matrix, an effective basis for model-fitting. Most of the data collected in human studies, however, cannot be summarised conveniently in the form of analyses of variance or independent correlations since the same individual enters into many different relationships. Early studies of the similarity between relatives have assumed that the repeated use ofinformation in different statistics is no serious problem. For this reason attempts to reanalyse early studies have to assume that the observed statistics (usually correlations) are independent (Eaves, 1975), although it is highly unlikely that this is really the case. It is impossible to recover the raw data behind such studies and make the necessary correction. In practice, moderate correlations between the statistics of the data summary do not lead to serious errors in the parameter estimates but they may lead to errors in the variances of the estimates and in the tests of the model.
There are .several ways of extending the model-fitting procedure to encompass more extensive oodies of data in which there are correlations between the observed statistics. We distinguish two main types of data: (i) balanced pedigrees; (ii) unbalanced pedigrees.
(i) The analysis of balanced pedigrees
When data may be grouped into several basic types of pedigree involving the same set of relationships and the same number of individuals, we have a "balanced pedigree". A design which involved the measurement of pairs of-twins and their parents, for example, would yield balanced pedigrees of four individuals, each consisting of a pair of twins with their mother and father. If there were five classifications of twin type recognised in the study, there would be five independent types of pedigree. However the data are summarised for each type of pedigree, the statistics for parents and offspring will not be independent of those for twins, so the analysis must recognise that every individual contributes to three relationships in a pedigree of this type.
The weighted least squares procedure may be adapted. to the estimation of genetic and environmental components from correlated statistics, by modifying the weight matrix to include the covariances between the observed statistics. The method is described in Mather and Jinks (1971). Eaves and Gale (1974) used a similar approach in estimating the components of variance and covariance in a multivariate genetical model. The practical advantage of weighted least squares is retained for linear models but once the model involved is non-linear it is probably no less tedious to maximise the likelihood directly using, e.g. Fisher's scoring method.
We illustrate the analysis of balanced pedigrees by reference to a study of personality of adults and juveniles by Young et al. (in preparation). The data consist of responses of juvenile twins and singletons to the junior version of the Eysenck Personality Questionnaire. In addition, the parents of the twins and singletons completed the adult version of the EPQ, and there was also a large sample of adult twins for whom EPQresponses were available. Young et al. analysed the scores of the three personality scales of Eysenck's theory, psychoticism, extraversion and neuroticism, together with the lie scale. Adult and juvenile data were transformed separately to secure uniform error variance throughout the range. Adults and juveniles were corrected separately for the linear effects of age.
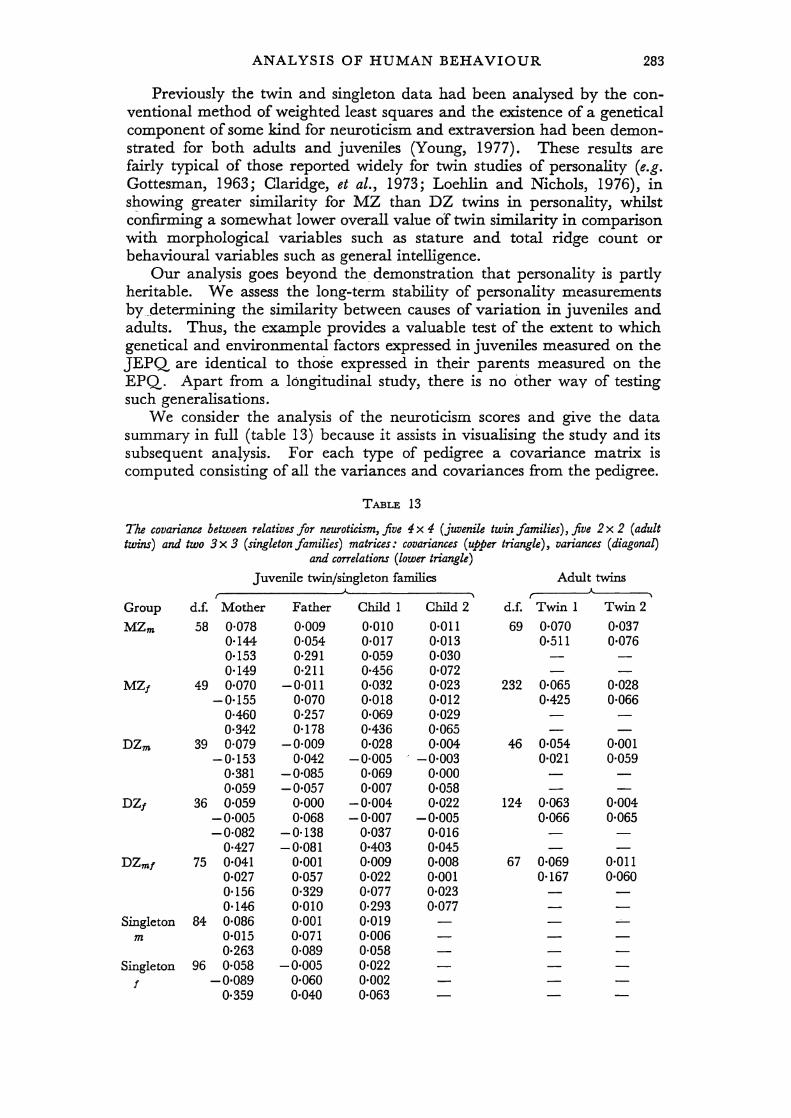
ANALYSIS OF HUMAN BEHAVIOUR 283
Previously the twin and singleton data had been analysed by the conventional method of weighted least squares and the existence of a genetical component of some kind for neuroticism and extraversion had been demonstrated for both adults and juveniles (Young, 1977). These results are fairly typical of those reported widely for twin studies of personality (e.g. Gottesman, 1963; Claridge, et al., 1973; Loehlin and Nichols, 1976), in sl:owing greater similarity for MZ than DZ twins in personality, whilst confirming a somewhat lower overall value cif twin similarity in comparison with morphological variables such as stature and total ridge count or· behavioural variables such as general intelligence.
Our analysis goes beyond the_demonstration that personality is pardy heritable. We assess the long-term stability of personality measurements by __ determining the similarity between causes of variation in juveniles and adults. Thus, the example provides a valuable test of the extent to which genetical and environmental factors expressed in juveniles measured on the JEPQ are identical to those expressed in their parents. measured on the EPQ. Apart from a longitudinal study, there is no other way of testing such generalisations-,
We consider the analysis of the neuroticism scores and give the data summary in full (table 13) because it assists in visualising the study and its subsequent anaJysis. For each type of pedigree a covariance matrix is computed consisting of all the variances and covariances from the pedigree.
TABLE 13
The covarianu between relatives for neurotidsm, five 4 X 4 (juvenile twin families), five 2 x 2 (adult twins) and two 3 x 3 (singleton families) matrices: covariances (upper triangle), variances (diagonal)
and correlations (lower triangle)
Juvenile twin/singleton families Adult twins f
J..
Group d.f. Mother Father Child 1 Child 2 d.f. Twin 1 Twin 2
MZm 58 0·078 0·009 0·010 0·011 69 0·070 0·037 0·144 0·054 0·017 0·013 0·511 0·076 0·153 0·291 0·059 0·030 0·149 0·211 0·456 0·072
MZ/ 49 0·070 -0·011 0·032 0·023 232 0·065 0·028 -0·155 0·070 0·018 0·012 0·425 0·066
0·460 0·257 0·069 0~029 0·342 0·178 0·436 0·065
DZm 39 0·079 -0·009 0·028 0·004 46 0·054 0·001 -0·153 0·042 -0·005 . -0·003 0·021 0·059
0·381 -0·085 0·069 0·000 0·059 -0·057 0·007 0·058
DZ/ 36 0·059 0·000 -0·004 0·022 124 0·063 0·004 ..:..0·005 0·068 -0·007 -0·005 0·066 0·065 -0·082 -0·138 0·037 0·016
0·427 -0·081 0·403 0·045 DZm/ 75 0.041 0·001 0·009 0·008 67 0·069 0·011
0·027 0·057 0·022 0·001 0·167 0·060 0·156 0·329 0·077 0·023 0·146 0·010 0·293 0·077
Singleton 84 0·086 0·001 0·019 -m 0·015 0·071 0·006
0·263 0·089 0·058 Singleton 96 0·058 -0·005 0·022
/ -0·089 0·060 0·002 0·359 0·040 0·063
284L. J. EAVES, K. A. LAST, P. A. YOUNG, N. G. MAR TIN
Each pedigree type of n individuals yields in(n+ 1) different statistics, so the entire data summary consists of 77 statistics. In this case, we begin building a model with the observation that the twin and juvenile data are consistent with the assumption of random mating, additive gene action, and environmental differences within twin pairs only.
However, since this model has been developed separately for adults and juveniles, there is no reason to supppse that the genes whose effects are assessed in juveniles are the same as those eXpressed in parents, although it would be a vindication of the neuroticism scales of the two questionnaires if this were indeed the case.
The parameters of the model are similar to those used to represent sex interactions in the case of risk-taking. We represent the additive genetical variation in adults by the parameter D RA and the additive genetical variation in juveniles by DRJ. Each parameter is defined in terms of the additive genetic deviations ap.~ allele frequencies as usual (Mather and Jinks, 1971). Neither of these p~l.r(imeters, however, can be used to represent the genetic part of the parent-offspring covariance since we are postulating different gene effects in adults and juveniles. Instead, we introduce the parameter D RAJ which represents the covariance of gene effects in adults and juveniles. If there is no dominance:
DRAJ = 4 L: UaVadaAd-ah a
Ua = I-Va is the frequency of the increasing allele at locus a; daA is the additive genetic effect at that locus in adults; and daJ the additive effect at that locus in juveniles. The parameters can be "modified, if desired, to incorporate the effects of dominance but the resolution of dominance is unlikely in" the case of age dependence of gene expression since both dominance and genotype x age interactions will tend to reduce the parent offspring correlation" relative to the correlation of, for example, siblings, when parents and offspring are measured at different ages. If D RAJ turns out to be zero, there is no evidence that the genes contributing to juvenile variation are also being expressed in adults and vice versa. On the other hand, if DRAJ/(DRA.DRJ)* does not differ significantly from unity, we may assume that exactly the same gene effects are manifest in adults and juveniles and that any difference between D RA and D RJ is merely a matter of scale.
Since the model for neuroticism does not incorporate family environmental effects, we have not made any allowance for non-hereditary transfer of information from parent to child. For this reason the only environmental components in the model are "within family" environmental effects: ElA
for adults and ElJ for juveniles. No attempt has been made to constrain these to be equal since the tests were different and allowance has to be made for associated differences in errors of measurement.
The simple model, therefore, involves five parameters which are used to construct the expectations for the variances and covariances between relatives given in table 14.
The maximum likelihood estimates of the parameters are those which maximise:
m
L = -t L: Nj[ln I ~i I +tr(Si~il)]+constant i = 1

ANALYSIS OF HUMAN BEHAVIOUR 285
where Si is the ith observed covariance matrix, based on Hi d.f. and :Ei is the corresponding expected covariance matrix, obtained by substituting the current parameter estimates in the expectations of table 14. In practice we minimise F = -L. Since the function to be minimised is non-linear, an iterative procedure must be employed. A variety of such methods are available of which Fisher's scoring method (e.g. Bailey, 1961) is perhaps the most familiar to geneticists and requires the computation of the first and second derivatives of the log-likelihood,with respect to the parameters.
TABLE 14
Expectations of varianc.es and corwariances for neuroticism
Relationship Statistic Expectation
Adult individuals Variance tDR4 +E14 Juvenile individuals Variance tDRJ+ElJ Mother-father Covariance Parent-offspring . Covariance Juvenile MZ twin Covariance Juvenile DZ twin Covariance Adult MZ twin Covariance Adult DZ twin Covariance
!DRM tDRJ !DRJ tDR4 !DR4
The algebraic evaluation of such derivatives is often tedious and a deterrent to developing and testing new models. For this reason we have employed numerical differentiation throughout and find that the results are generally satisfactory. The actual numerical analysis was conducted using a program written by ourselves, which incorporated the Numerical Alogrithms Group sub-routine E04HAF for non-linear and constrained minimisation (N.A.G., 1974).
The parameter estimates are:
J)RJ = 0·057 ±0·010
Eu = 0·036 ± 0·004
Jj RA = 0·053 ± 0·006
ElA = 0·038 ± 0·003
J)RAJ = 0·046 ± 0·007
The standard errors are obtained as the square roots of the diagonal elements of the covariance matrix of the estimates. This was obtained as the inverse of the matrix of second partial derivatives ofF at the minimum. Although the derivatives were obtained numerically, we believe that the approximation is sufficiendy close for the construction of significance tests, etc.
The adequacy of the model may be tested by comparing the log-likelihood of obtaining the observed covariance matrices, given the current model (L l ), with that of obtaining the same covariance matrices, given that each statistic was represented by a separate parameter (Lo). The latter is simply:
m
Lo = -t L Ni[ln I Si I +vj]+constant i= 1

286 L. J . EAVES, K. A. LAST, P. A. YOUNG, N. G.MAR TIN
where we have m matrices and Vi is the order of the ith matrix. The statistic
s = 2 (Lo-L1)
is approximately chi-square for k-p d.f., k being the number of statistics, andp the number of parameters estimated: In this case we find, X~2 = 87'2, 0·1 <p < 0·2. The non-significant chi-square confirms that the five parameter model is as likely to yield the observations as many more complex alternatives. A wide range of alternative summary statistics may be provided once an adequate model has been determined and parameter estimates have been obtained. The narrow heritability of neuroticism in adults is estimated to be:
1i2 = 0'41 +0'04 II,A -
and for juveniles:
1i2 = 0.44+0·07 IIJ -
The additive genetic correlation between ~he adult and juvenile measures of neuroticism is:
D r = RAJ = 0·84+0'14
G,AJ (D' D )1 -RA.· RJ
The fact that the correlation is large and differs little from unity is a strong indication of the long-term consistency of the neuroticism scales of the EPQ and JEPQ. That is, neuroticism differences measured in juveniles are reflecting the effects of the same genes as measurements made on adults. As well as illustrating a method of analysis, therefore, the data reveal a surprising consistency in the determination of individual differences in measured neuroticism which could otherwise only be detected by a longterm study of the same individuals.
Although the analysis provides evidence of substantial genetical stability of neuroticism over time, we are unable to say anything about the continuity of environmental influences since these have been shown to be of a largely specific nature and do not, therefore, contribute to parent-offspring similarity. The discrimination between short-term and long-term environmental effects can only be undertaken in the context of a longitudinal study.
Had the genetical correlation, rGAJ, been markedly different from unity, we would conclude that there was either genetical non-additivity or that quite different loci were contributing to variation in adults and juveniles. Young et al. (in preparation) report that the same model gave an adequate fit to EPQandJEPQdata on extraversion, but thatrGAJwas onlyO·44±O·II, indicating that much of the gene expression was "generation specific" either due to dominance or genotype x environment interaction of the type we have been considering. We favour the latter explanation because analysis of adult data on extraversion does not support the hypothesis of genetic non-additivity (section 4 (ii)). On the other hand, further analysis of neuroticism (section 4 (ii)) lends some support to the hypothesis of dominance in adult scores.
For psychoticism the situation is even more extreme since, after allowance for assortative mating, approximately 90 per cent of the genetical variation expressed in juveniles is quite unrelated to that which would be expressed

ANALYSIS OF HUMAN BEHAVIOUR 287
in the same individuals as adults. This provides little genetical support for a claim that current measurements of juvenile psychoticism will be effective predictors of adult psychotic behaviour.
(ii) Environmental models in bfjJanced pedigrees
Although the analysis of twin pairs may confirm that an environmental model is required and suggest certain types of environmental hypothesis, a more precise resolution of environmental factors requires additional data. In the demonstrable absence ot genetic effects such resolution may be achieved with ordinary family data. If there are genetical effects, farily data may be supplemented with adoption data.
Young et al. pursued the analysis of the lie scale presented above (section 2 (vii)) by considering jointly the lie scales of the EPQ and JEPQ. The covariance matrices for the lie scale are presented in table 15. The analysis of juvenile twins and singletons discussed earlier suggested that there were no genetic effects on juvenile twins, but that there was substantial environmental covariation between twin pairs. The adult twins, however, showed evidence of ge~etical effects. Furthermore, there was a significant correlation between spouses for lie scores and the correlation between the EPQ lie scores of parents and theJEPQlie scores of their children was significant. The essential features of any model, therefore, must be:
1. genetical and environmental variation in adults; 11. no genetical variation in juveniles;
111. co-operative effects in twins; IV. correlation between the lie scores of adults and juveniles; v. assortative mating in adults.
Since there is no apparent genetical variation in the juvenile lie scores, the correlation between parent and offspring must be environmental, and must contribute in part to the variation and covariation of twin pairs. Since there is a significant correlation between spouses' phenotypes, it is necessary to consider the consequences of assortative mating, both for the distribution of genetical differences in the parents and for the distribution of familial environmental influences in the offspring.
Young et al. showed that the simple model, which had given an adequate explanation of the variation in neuroticism, came nowhere near explaining the lie scale data (X~2 = 145·46, P < 0·0001). They thus proposed a model which incorporates all the above features. Their model is best described in stages.
Considering first the adult variation, Young et al. argued that Fisher's (1918) model for assortative mating could be applied as a first approximation. They assumed, in addition, that there were no effects of the family environment and that dominance effects were negligible.
Letting V p be the phenotypic variance of adults we thus have:
Vp = t(_l_)DRA+Eu . l-A
DBA is the additive genetic component in adults, Eu the within-family environmental component of variance in adults. A is Fisher's assortative
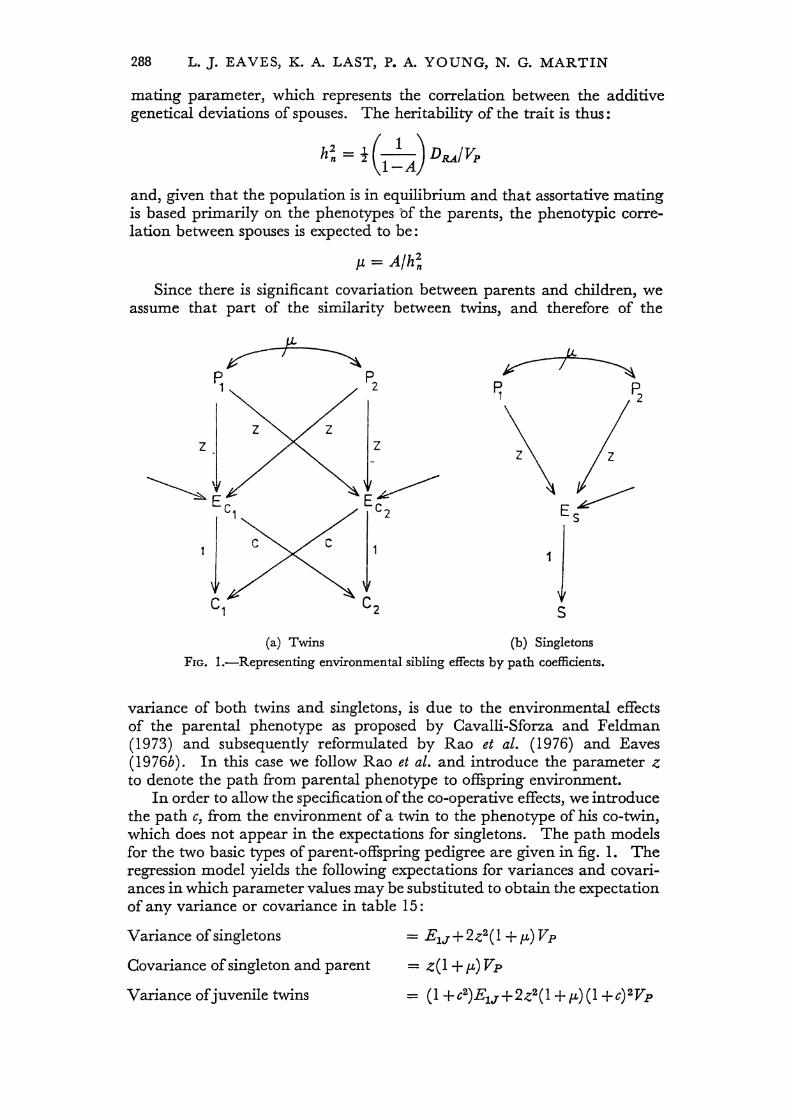
288 L. J. EAVES, K. A. LAST, P. A. YOUNG, N. G. MARTIN
mating parameter, which represents the correlation between the additive genetical deviations of spouses. The heritability of the trait is thus:
h~ = t(_1_) DlU./Vp 1-A
and, given that the population is in equilibrium and that assortative mating is based primarily on the phenotypes bf the parents, the phenotypic correlation between spouses is expected to be:
Since there is significant covariation between parents and children, we assume that part of the similarity between twins, and therefore of the
z z
~E
Ij"' E~
r C1 C2 5
(a) Twins (b) Singletons
FIG. I.-Representing environmental sibling effects by path coefficients.
variance of both twins and singletons, is due to the environmental effects of the parental phenotype as proposed by Cavalli-Sforza and Feldman (1973) and subsequently reformulated by Rao et ale (1976) and Eaves (1976b). In this case we follow Rao et ale and· introduce the parameter Z
to denote the path from parental phenotype to offspring environment. In order to allow the specification of the co-operative effects, we introduce
the path c, from the environment of a twin to the phenotype of his co-twin, which does not appear in the expectations for singletons. The path models for the two basic types of parent-offspring pedigree are given in fig. 1. The regression model yields the following expectations for variances and covariances in which parameter values may be substituted to obtain the expectation of any variance or covariance in table 15:
Variance of singletons
Covariance of singleton and parent
Variance of juvenile twins
= EIJ+2z2(1 + fL) Vp
= z(l + "') Vp
= (1 +c2)EIJ+2z2(1 + fL)(1 +c)2Vp

ANALYSIS OF HUMAN' BEHAVIOUR 289
Covariance of juvenile twin and parent = z(1 +c)(l + p.) Vp
Covariance of juvenile twins = 2cElJ+2z2(1 +c)2(1 + p.) Vp_
E1J is used to denote the variance of random environmental effects which do not depend on the parents and which are not primarily correlated in twins_
~ »
TABLE 15
Covariances and correlations between relatives for the EPQ and JEPQ cc lie " scales
Juvenile twin/singleton families Adult twins J.
Group d_f. Mother Father Child 1 Child 2 d.f. Twin 1 Twin 2
MZm 58 0·035 0·016 0·012 0·011 69 0-055 0-027 0-399 0·044 0·012 0·013 0-513 0·051 0·347 0·311 0-034 0-023 0·285 0·294 0·588 0·045
MZ/ 49 0·037 0·009 0·010 0·003 232 0·044 0·022 0·271 0·032 0·010 0·009 0·516 0·042 0·297 0·300 0·033 0·017 0·090 0·239 0-460 0·040
DZm 39 0·025 0·014 0·007 0·003 46 0·025 -0·001 0·404 0·046 0·005 -0·003 -0·041 0·035 0·209 0·123 0·038 0·021 0·123 -0·081 0·647 0·029
DZ/ 36 0·047 0·011 0-029 0·005 124 0·047 0·020 0-299 0·028 0-016 0·006 0·429 0·045 0·525 0·366 0-067 0·031 0-104 0·164 0·549 0-048
DZm/ 75 0·035 0·012 0-009 0·013 67 0·051 0·008 0·355 0·034 0·009 0·009 0·170 0·039 0-229 0-233 0·048 0-022 0·304 0·209 0·442 0·050
Singleton 84 0·032 0·012 0·002 m 0·328 0·045 0·002
0·083 0·048 0·028 Singleton 96 0·036 0·008 0-008
/ 0·215 0·039 0·004 0-251 0·112 0·028
The model thus involves six parameters: DRA; Eu; A; Z; ElJ and c_ We employed numerical differentiation in the scoring procedure to obtain the following parameter estimates and standard errors:
2u = 0·0211 ± 0-0014
fJ RA = 0-0330 ± 0-0025
:BlJ = 0·0346 ± 0-0019
A = 0-164±0-024
z = 0-140 ± 0-023
e = O·244±O·027.
The chi-square testing the goodness of fit of this model was X~ = 88-08 (p = 0·08) showing that the data are consistent with the hypothesis implied by the model. This does not exclude other plausible, more complex alternatives including models involving juvenile genetic variation. On the other hand, many simpler models may be shown to yield a poor fit to the data.
290 L. J. EAVES, K. A. LAST, P. A. YOUNG, N. G. MAR TIN
All the parameters are highly significant, confirming that co-operative effects and non-genetic influences of parent on child have a substantial, if transient, effect on the reported standards of behaviour in juveniles. The model assumes that all the similarity between twins is due to the effects of competition and the lie scores of the parents. We have considered a modification of the model which allows for some of the twins' shared environmental experiences to be independent of the parental lie scores but to contribute to the variance of offspring and be augmented by the effects of co-operation in twins. The extension of the model allows the additional sources of twin similarity to' be estimated. In fact, it is shown that the contribution of such factors does not differ significantly from zero and inclusion of the additional environmental parameter does not improve the fit of the model.
The analyses of neuroticism and the lie scale represent two extremes. The first analysis shows what might be expected for a trait in which there is great stability in gene expression throughout-development. The analysis of the lie scale, on the other hand, shows what might be expected from a trait whose expression is extremely labile. . .. The lie scale is characteristic of a measure in which environmental factors play a paramount role. More than this, all the significant sources of environmental similarity between relatives can be shown to depend on identifiable features of the interpersonal environment. It will be recalled that all the measured similarity between juvenile twins could be explained in terms of the lie scores of the parents and the effects of co-operation between twins. There is no suggestion at all in the data that there are significant features of the family environment which do not depend either on the effects of siblings, or on the lie scores of the parents. In t.qis model genetical factors play only an incidental role in determination of variation in adults. Variation among offspring is entirely environmental although partly conditioned by genetical differences in parents. There may be two reactions to this claim. One is scepticism founded either on the lack of replication or upon the inability of the model-fitting procedure to discriminate between all the possible alternatives. We have suggested previously that co-operation based on genetical factors may simulate the effects of the family environment. The second response is to look again at the lie scale as an index of the socialisation of the developing child and of the way in which development is determined by social interactions between children, parents and siblings.
(iii) Model-fitting to unbalanced pedigrees
The quantitative geneticist is frequently presented with haphazard data which comprise a collection of family studies consisting of whatever constellation of relatives happen to be both alive and co-operative. Such unbalanced data do not allow the simple data summaries considered above.
Recently, Lange et ale (1976b) have shown how the maximum likelihood approach is applied to the estimation of variance components from such unbalanced pedigree data. Their paper emphasises the more conveiItional assumptions of quantitative genetics including random mating, absence of familial environmental components, etc., although their model allows for the effects of inbreeding. A subsequent paper (Spence et al., 1977) shows how such models may be fitted to dermatoglyphic data and includes the specification of a family environmental component. In their initial formu-

ANALYSIS OF HUMAN BEHAVIOUR 291
lation, these authors rely on algebraic differentiation of the likelihood function, which may deter newcomers from attempting to specify their own models. As we have seen, such refinements are unnecessary in a great many practical applications.
The approach of Lange et ale (1976h) assumes that- the distribution of scores in a pedigree is multivariate normal. This will be approximately u:ue for polygenic systems in which there is no directional genetical nonadditivity or genotype-environmental interaction and can, in any case, usually be achieved by transformation. For a given pedigree of n individuals, we define a vector of observed scores x, and a corresponding vector of expected values, ex. The value~ of the elements of Ex will depend on such factors as age and sex, except where prior correction has been made when the expected values will be the same for all individuals in the pedigree.
Similarly, we define the expected covariance matrix,I:, of individuals in the pedigree. The elements of I: will depend on the relationships between members of the pedigree and on the causal model assumed for the trait under study. Thus, we-may regard a pair of MZ twins as a pedigree of two individuals with expected covariance matrix:_
:E = (!DR+El !DR) !DR !DR+El
under a model which assumes random mating, additive gene action and no family environmental effects. Similar expectations may be written for other types of relationship or under other sets of assumptions. For a given Ex, and I:, the log likelihood of obtaining the pedigree of individuals of given observation vector x is:
L = -t In I :E I --!(x-Ex)':E-1(x-Ex)+constant.
The joint log-likelihood of obtaining p pedigrees of different size and composition is simply the sum of the log-likelihoods of the individual pedigrees. Estimation involves the selection of parameter values under a given hypothesis which maximise the joint likelihood of observing the given set of pedigrees. Conventional methods of minimisation may be employed to minimise F = - L.
The expected covariance matrices must be positive definite for the likelihood to be defined. Although this constraint should always be met for consistent models which incorporate some error variation in the diagonal elements of I:, the minimisation procedure may attempt to pass through a region in which the current parameter values yield non-positive definiteI:. A proper choice of trial values will usually avoid this difficulty, although a penalty function technique (Lootsma, 1972) might be invoked to constrain the estimates to lie in a region for which I: is positive definite. We have found the simple unconstrained procedure robust for simple models but the condition of positive definiteness becomes increasingly difficult to satisfy with more intricate models. Under these circumstances we have found estimates froni a related but simpler model often provide satisfactory trial values.
As Lange et ale (I 976h) point out, there is no simple test of the model with this approach, although by comparing the likelihoods obtained under hypotheses of differing complexity it may be possible to falsify simpler

292 L. J. EAVES, K. A. LAST, P. A. YOUNG, N. G. MAR TIN
explanations. In theory it is possible to estimate separate empirical covariances for every conceivable type of biological and non-biological relationship in the data and use the likelihood under this model as a base line for comparison of more parsimonious alternatives. This would be analogous to the" goodness of fit " test uied in weighted least squares and in the analysis of balanced pedigrees. There are, however, many non-biological relationships in large pedigrees for which unique specifications ought ideally to be given. This results in the absurd situation that the model in which we have least interest is that which involves the largest number of parameters and consumes a disproportionate amount of effort and resources for estimation. Attempts to fit such an extensive empirical model to large bodies of pedigree data have, with our current nUIherical procedures, proved fruitless.
TABLE 16
Sample sizes (diagonal and lower triangle) and phenotypic correlations (upper triangle) for adoption study of conservatism
'"' u rIO ....... u '- fo5 o :J
u "; '"' C d ::I ". - E Q.)
'"' (U CIS CIS ..c Q.)
o Q.) -09-Type of individual S ~ "0 ..c rIO lii
-s:l, - ". S
... (U Q.)
13 -0 ~ (U I U ". u'" U I I .... Q.) .~ (g ... ... '"' t3 bO ... ~ ... s:l, s:l, ~ o rIO
0 0 .... 0"£ -'--0 -0 til
~ o 0 0 iiS iiS < < ~ ~
Adopted male 31 0·32 0·52 Adopted female 0 239 0·34 0·07 0·36 0·45 Foster-mother 9 40 77 0·40 0·76 0·37 Foster-father 5 34 47 62 0·51 Biological son of
foster-parents 0 8 3 2 12 Biological daughter of
foster-parents 1 .. 8 5 5 1 13
The approach is illustrated by analysis of twin and adoption data from a version of the Wilson conservatism scale (G. Wilson, 1975). Three twin studies of questionnaire data relating to attitudes led to the rejection of a DR El model for the conservatism dimension and suggested that either assortative mating or cultural effects might explain the departures of observed c'ovariances between twins from their expected values under the random mating model which assumed no family environment effects. In an attempt to discriminate between these alternatives and to provide more precise estimates of the contribution of cultural factors, data were collected on adult volunteers who were adopted in the first few months of life, together with certain of their foster-relatives. The study yielded responses on an additional 445 individuals in a variety of pedigrees ranging from individual adopted subjects with no foster-relatives, to families in which there were both foster-parents and additional natural or foster-children. We give the number of pairs contributing to each possible type of relationship (table 16), but since many individuals enter into several relationships these pairs will not be independent.
The adoption data were included with the twin data and a general conservatism factor was extracted from the 68 questionnaire items. The factor scores for males and females were corrected separately for the linear

ANALYSIS OF HUMAN BEHAVIOUR 293
increase in conservatism with age. As an approximate guide to the likely findings of the analysis, correlation coefficients were calculated for each type of relationship. These are also given in the table.
Examination of the numbers or correlational pairings makes us cautious about expecting too much from the analysis. The correlations between adopted child and foster-relatives are based on relatively small numbers so that the twin data will still carry most of the weight in the analysis. However, the relatively large number of adopted individuals, even though they have no other relatives participating in the study, yield the total variance of individuals reared by foster-parents and provide information about the likelihood of cultural effects which depend partly on genetical differences between parents. Jinks and Fulker (1970) and Eaves (l976b) showed how genotype-environmental covariation due to genetical and environmental differences between families (one of the consequences of cultural transmission) would lead to differences between the total variances of natural and adopted children since, in the case of the latter, the association between parental genotype and offspring's environment would be broken by fostering. For the conservatism scores, the total variance of adopted individuals is 0·845 which is slightly, but not significantly greater than that for individuals reared by their natural parents (F (281, 1619) = 1·06; P = 0'25). Thus, we might conclude that adult variation in conservatism is not influenced greatly by the environmental effects .of genetically determined differences in parents. This finding is supported slightly by the non-significant correlation between foster-parents and their adopted children (table 16). On the other hand there is significant husband-wife similarity, suggesting that assortative mating may affect the distribution of genetic and environmental effects in the population. . Many models may befitted to these data once we allow for the various possible sources of environmental differences between families. It suffices here to concentrate on a few typical hypotheses and show to what extent they can be distinguished.
We already know from the twin data alone that a model assuming additive gene action, random mating and within-family environmental effects does not explain the observed pattern of variation in conservatism. Fitting this model to the full data set by the Lange approach gives the following estimates:
DR = 1·1O±0·07
£1 = 0·26 ± 0·02
and a log-likelihood of -517·97. There is no simple test of this model but additional parameters might be included to detect gross changes in the likelihood. Inclusion of Fisher's assortative mating parameter, A, for example, as described earlier, (section 4 (i)), increases the log-likelihood to -510,24. The parameters are now:
DR = 0·81 ± 0·07
£1 = 0·26 ± 0·02
A = 0·26 ± 0·06
suggesting that there is more support for a hypothesis involving assortative mating. This model is identical to the path model of Rao et ale (1976) in

294 L. J. EAVES, K. A. LAST, P. A. YOUNG, N. G. MAR TIN
the absence of cultural effects and family environmental influences the two approaches yield identical results with the same data and method of analysis. The chief divergence between the biometrical genetical school and the path coefficients school has been in the relative theoretical importance attached to the analysis of non-additive effects compared with additive environmental effects. The biometrical genetical school emphasised the potential practical and theoretical importance of non-additive effects, such as dominance and genotype-environmental interaction. "Also, following in the tradition of Fisher, it has sought for a theoretical formulation of variation in terms of the effects and correlation of individual polygenic loci prior to the attempt to explain actual data. The path coefficient approach, since it is essentially a form of regression analysis-, has concentrated on the estimation of empirical additive genetical and environmental parameters at the expense of interactions which are difficult, if not impossible, to specify in a regression model. There are cases in which the conventional path analytic approach can yield no obvious solution, whereas there are others in which path coefficients are an effective way of representing the principal relations between components of the data. In many more cases the two approaches will lead to identical conclusions, providing the same data are analysed with the same statistical procedure.
The model for conservatism so far makes no allowance for family environmental effects, although it does include the effects of assortative mating. Once we consider the inclusion of the family environment, a variety of possible explanations might be considered which are unlikely to be resolved with the present body of data. We concentrate on two of these because they represent extreme positions of some theoretical importance. The first hypothesis might be that the environment shared by twins, siblings, or foster-siblings does not depend on the parents' conserVatism scores at all but is simply the result of environmental circumstances outside the family (schooling, peers etc.) which individuals share when raised together, or to aspects of parental behaviour which are independent of their degrees of conservatism. In this case we simply add to our expectations for all the covariances of twins, siblings and· foster-siblings, the component, Es, to denote the contribution of shared environmental influences to their covariation.
The expectations of variances and covariances under this model are given in table 17. Since this type of environmental causation generates no covariance between individuals' genotypes and environments, the total variances of natural and foster-children are expected to be identical.
Parameter estimates are:
DR = 0·65 ±0·13
£1 = 0·27 ± 0·02
A = 0·17 ±0·07
£2 = 0·15 ± 0·10
and the likelihood does not increase significantly over the previous value which assumes no family environmental effects. The value of 22 is numerically positive, though not statistica~y significant, confirming that about half of the additional variation between twin pairs previously assigned to "B"

ANALYSIS OF HUMAN BEHAVIOUR
TABLE 17
Expected variances and covariances for conservatism under tuJo models
Additive
Variances
Parents (Vp )
Natural children Adopted children
Covariances MZ DZ (and siblings) Spouses Parent-offspring
biometrical-genetical modd Path model
t(lj(l-A»DR+El +Es t(lj(l-A»DR+El +E2 t(lj(l-A»DR+El +Es
t(1/(1-A»DR+E2 -i-DR(l +A)j(l-A) +E2 2A(I-A) Vp2/DR '-":..;....-----Hlj(l-A»DR+tAVp .1i:'a.
Vp (h2 +e2+2 ehs) Vp (h2 +e2+2 ehs') Vp (h2 +e2)
Vp (h2+2 ehs'+e2(3) Vp (h2a:+2 ehs' +e2(3) VpfL Vp (th2(1 +y) +teh(s+ 8) +
295
. ez (1 +hSy+2 eh8+e2e» Adoptive parent
offspring Unrelated individuals
reared together
Vp (es(l+h2y+2eh8+e2e»
(section 2 (vi» could be due to the family environment but there is almost as much support for the hypothesis that it is all due to additional genetical variation resulting from linkage disequilibrium caused by assortative mating.
, The second broad hypothesis which we explore is the " cultural transmission" hypothesis which has appeared in a variety of guises since the first publication of Cavalli-Szforza and Feldman (1973). This hypothesis stipulates that non-hereditary transmission of parental 'differences to offspring takes place, giving rise to non-gen~tic c<?variation between parents and offspring and between individuals raised in the same family. Subsequently, others have formulated the original model in simplified forms which are likely to be testable. in practice. Eaves (1976b) followed a biometrical genetical approach, assuming random mating but including the effects of dominance. Rao et ale (1976) adopted a path analytic model, which ignored the effect of dominance but included assortative mating. Since the data on conservatism offer no indication of dominance, but show assortative mating, we illustrate the path coefficients approach using a simple form of their model.
We regard the following parameters as fundamental:
1. the means of male and female individuals (approximately zero in our case, since the scores have been standardised);
2. the path from genotype to phenotype (h); 3. the path from parental genotype to offspring genotype (l); 4. the marital correlation (p.); 5. the environmental path from parental phenotype to offspring
environment (z); 6. the correlation between the genotypes and environments of individuals
(s) ; 7. the total variance of the population of the parental generation, (V p) •
The paths may be represented in diagrammatic form (fig. 2). Several correlations may be derived from the path diagram, employing standard regression theory. Of particular interest is the correlation, s', which is
_ , that between genotype and environment of offspring reared by their natural

296 L. J. EAVES, K. A. LAST, P. A. YOUNG, N. G. MAR TIN
€
c FIG. 2.-The environmental effect of the parental phenotype: a simplified path model.
parents. At equilibrium, when assortative mating and cultural transmission are constant between generations, it is expected that s' = s.
Our model assumes that assortative mating is based primarily on the phenotype with respect to conservatism. The correlations y, Sand 8 on the diagram are then given in terms of the marital correlation and the other parameters as follows:
y = p.(h+es)2
S = p.(hs+e) (h+es)
8 = p.(e+hs)2.
For our model, the expectations of variances and covariances for all the types of relative in our pedigrees are given in table 17. The principal difference between our model and those of Rao et al. (1976) is that ours is simpler. There is little point in attempting more general solutions before elementary ones have been found wanting. The principal difference in estimation procedure is that we are employing the method of maximum likelihood applied to the original observations, whereas Rao et al. work with transformed correlations. Thus) our model specifies variances and

ANALYSIS OF HUMAN BEHAVIOUR 297
covariances whereas that of Rao et al. begins with correlations. We have already considered the potential loss of information which is involved in discarding the total variances. In this case the loss is potentially more acute since the model actually predicts differences in the total variances between natural and foster-children. Rao et al. mo?ify their expected correlations by introducing a scaling factor, 8, to differentiate between correlations involving natural children from those involving foster children, but this only allows for differences in the total variances which might be predicted from variation among the correlations. It does not allow the total variances themselves to determine whether particular paths should be other than zero, nor does it allow differences in the total variances to contribute to the values of the paths, except in so far as they lead to perturbations in the correlations.
The paths and correlations of this model are empirical, in the sense that the paths do not bear any direc~ simple relationship t9 the mechanism of gene action and the. genetical component is necessarily assumed to be additive. The method will be inappropriate when there are substantial non-additive components of variation. In the past (e.g. Jencks et al., 1972), it has been assumed that, in the presence of genetical non-additivity, the path between genotypes of parent and offspring will be other than -t. This is not the case. Under any model of gene action the path will be t. The confusion may arise because under circumstances in which the additive model fails, allowing the path to take its own value may lead to a better fit to the data. However, under these circumstances, there is no general theoretical value for the estimate that will be obtained, since it will depend on the particular constellation of relationships from which the genetical path is estimated. When the additive model fails, there is no alternative but to modify the expectation for each genetical variance and covariance to incorporate the contributions of non-additive effects as they might be represented by genetical theory. When the path model above is fitted using the maximum likelihood approach the log-likelihood increases to -510·05, indicating that the modified theory receives no more support than the original model in which cultural effects were assumed to be absent. However, the numerical estimates of the parameters are of interest.
The basic parameters of the model for variation are:
Vp = 0·82±0·09
!z = 0·79 ± 0·06
Z = 0·04 ± 0·07
! = 0·05±0·13
fl =0·37±0·10.
From these we can derive summary statistics including the path, e, and further correlations implied by the model:
e = 0·57
~ = 0·25
$ = 0·19
~ = 0·14.

298 L. J. EAVES, K. A. LAST, P. A. YOUNG, N. G. MARTIN
In this instance it has been assumed that s-s' = 0, i.e. that the population is in equilibrium under assortative mating and cultural transmission.
The hypothesis of cultural equilibrium can be tested by letting s' and s take their own values. Applying this test to the attitudes data does not increase support for the new model, the log-likelihood being increased only to -508·63. Under the unconstrairu:d model the parametsrs s, s' and z altered to 0·28, 0·00 and 0·00 respectively. Although these changes are not significant, they illustrate the great variability of important parameters under modifications of the model and show how difficult it is to discriminate between alternative hypotheses with these data. The path from parental phenotype to offspring's environment (z) is of particular theoretical interest, since this is the" cultural transmission" parameter, representing the amount of information passed from parent to offspring by non-genetic means. Of equal importance is the genotype-environmental correlation, s, since this is a guide to the magnitude of the ". genetic environment": the extent to which genotypic differences between parents are being perpetuated in their descendants by cultural rather than genetical means. Both parameters are close to zero, suggesting that non-hereditary transfer of attitudes is not implicated by these data.
The evident weakness of the design based on small samples does little to strengthen confidenc:e in this conclusion. Also, although the twin data give reason to include genetical factors in the model we have not considered other possible sources of failure of the model, including sampling effects and non-additivity. Since the method does not yield a direct test of the model, the only way of exploring these factors is through examination of summary statistics or· through fitting more complex models. However, a larger study should be able to discriminate more effectively between the social and genetical components of differences between families. The models we consider represent some of the major variants that might be examined. They should stimulate the development of new scales for the measurement of culture-dependent behaviour to illustrate the mechanism ofnon-hereditary transmission between generations.
The above analysis has been confined to close relatives. Even more extensive data are now available on personality measurements, collected by the Institute of Psychiatry, London using the EPQ. The entire sample includes the adult twins considered earlier, together with a large number of non-twin families and adoption families. Altogether 2469 individuals responded which yielded the sample structure given in table 18.
The extended data provided an opportunity to test the simple models for extraversion and neuroticism which fitted the balanced pedigree data in section 4 (i). Since the subjects are adUlts, there is no initial need to consider differences in scale between adults and juveniles.
Using Lange et ai's approach, we first fitted the basic DR, El model to the entire data set for both traits. Subsequently the models were modified by the inclusion of dominance (HR) and the family environment (E2). No allowance was made for assortative mating since there was no evidence of marital similarity for either trait. The results of fitting the successive models are given in table 19. The findings for extraversion are remarkably stable. Inclusion of dominance and the family environment have almost no effect on the likelihood and the estimates of the additive genetical component and the within-family environmental co~ponent do not change
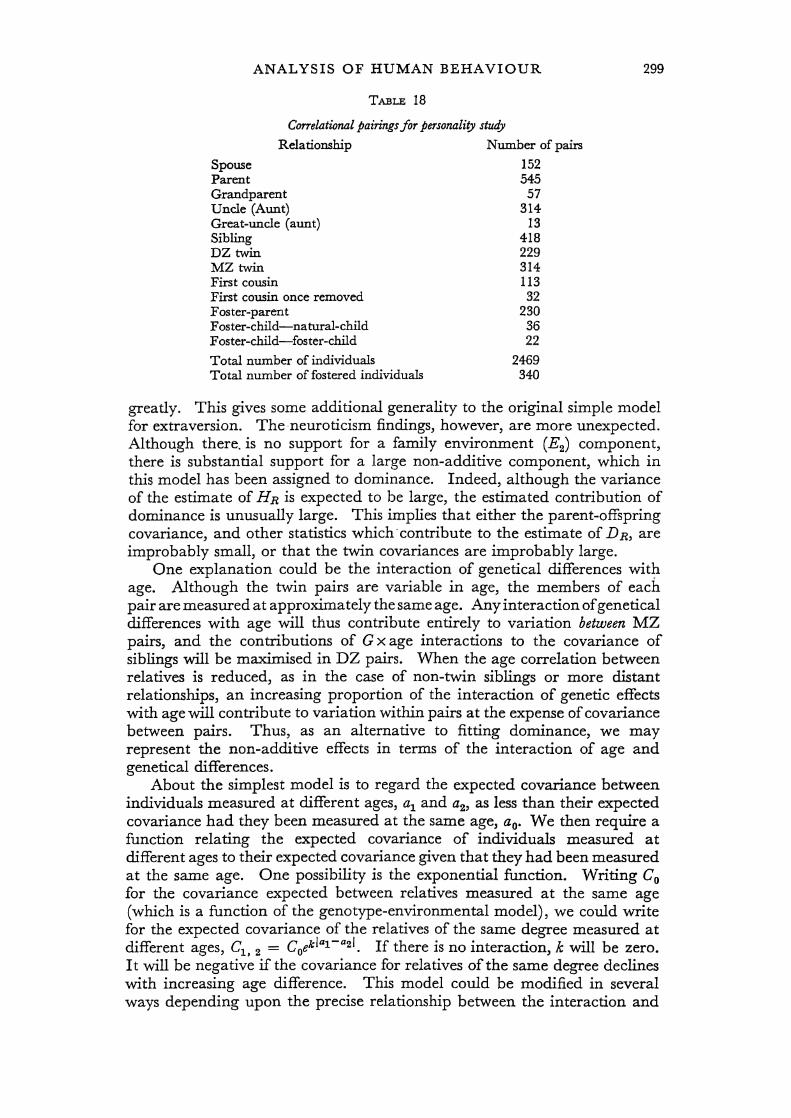
ANALYSIS OF HUMAN BEHAVIOUR
TABLE 18
Correlationtd pairings for personality study
Relationship
Spouse Parent Grandparent Uncle (Aunt) Great-uncle (aunt) Sibling DZtwin MZ twin First cousin First cousin once removed Foster-parent Foster-child-natural-child F oster-child-foster-child
Total number of individuals Total number of fostered individuals
Number of pairs
152 545
57 314
13 418 229 314 113 32
230 36 22
2469 340
299
greatly. This gives some additional generality to the original simple model for extraversion. The ·neuroticism findings, however, are more unexpected. Although there. is no support for a family environment (E2) component, there is substantial support for a large non-additive component, which in this model has been assigned to dominance. Indeed, although the variance of the estimate of HR is expected to be large, the estimated contribution of dominance is unusually large. This implies that either the parent-offspring covariance, and other statistics which' contribute to the estimate of DR, are improbably small, or that the twin covariances are improbably large.
One explanation could be the interaction of genetical differences with age. Although the twin pairs are variable in age, the members of each pair are measured at approximately the same age. Any interaction of genetical differences with age will thus contribute entirely to variation between MZ pairs, and the contributions of G x age interactions to the covariance of siblings will be maximised in DZ pairs. When the age correlation between relatives is reduced, as in the case of non-twin siblings or more distant relationships, an increasing proportion of the interaction of genetic effects with age will contribute to variation within pairs at the expense of covariance between pairs. Thus, as an alternative to fitting dominance, we may represent the non-additive effects in terms of the interaction of age and genetical differences.
About the simplest model is to regard the expected covariance between individuals measured at different ages, al and a2, as less than their expected covariance had they been measured at the same age, ao• We then require a function relating the expected covariance of individuals measured at different ages to their expected covariance given that they had been measured at the same age. One possibility is the exponential function. Writing Co for the covariance expected between relatives measured at the same age (which is a function of the genotype-environmental model), we could write for the expected covariance of the relatives of the same degree measured at different ages, Cl • 2 = Coeklal-a21. If there is no interaction, k will be zero. I t will be negative if the covariance for relatives of the same degree declines with increasing age difference. This model could be modified in several ways depending upon the precise relationship between the interaction and

TABLE 19
Unbalanced pedigree ana{ysis of neuroticism and extraversion in adults
Extraversion ). \,
Parameter Parameter ). A
(
Model DR. HR. El E" k L+c Xl d.f. P% DR. HR. El Ea DR., El 70 65 8·9 58 55 DR., HR., El 84 -32 67 9·4 1 I 30 16 112 48 DR., Eu Ea 62 65 5 9·4 1 1 30 56 55. 1 DR., HR., Eu E" 78 -60 69 8 10·4 3 2 20 20 120 47 -5 DR., Eu k 62 65 9 x 10⁻⁴. 9·0 0 1 >90 66 50 DR., HR., Eu k -26 80 46
* Qompared with DR., HR, El model. t Compared with DR, Eu k model.
Neuroticisrp. ).
k L+c X" d.f.
1·3 7·9 13 1 2·5 2·5 1 8·4 1* 1
4·25 x 10-1 6·6 11 1 1·61 x 10-1 8·6 4t 1
P%
<1 10 30
<1 5
CJ:)
8
~ t;-c tr:I > <: tr:I JIl
~ ?> t'"4 > C/.l
!-3 !'d ?> I<! o c:: 2': 9 :z p ~ > ~ ., '"'"' 2':
ANALYSIS OF HUMAN BEHAVIOUR 301
age which is envisaged, and upon the actual factors (genetic or environmental) expected to interact with age.
Since each individual pair of relatives has its own pair of ages, this model could not be fitted without recourse to the original observations and the method outlined by Lange et ale (1976b). Since the ages of our subjects were recorded, it is possible to modify the DB, El model to include the genotype x age interaction and decide whether the age interaction hypothesis is supported better than the dominance hypothesis. The extraversion data give absolutely no indication of age interactions. The estimate of k is numerically small and the values of DB and El do not alter. The situation for neuroticism is· different since the likelihood increases significantly when k is incorporated in the model and the value of k is now quite large and negative. The estimate of k implies that a IO-year interval between relatives measured as adults leads to a reduction of 35 per cent in their similarity.
Comparison with the results for the dominance model in table 19 shows that the present study is unable to resolve the source of non-additivity since there is no clear difference between the likelihood under the alternative. hypotheses involving dominance or age interactions although those with dominance are somewhat larger. The analysis of neuroticism data suggests that factors such as age interaction, which are frequently ignored in the analysis of human traits, may be prevalent but are not intractable. Such effects are not removed by conventional age corrections since these are based on population trends that ignore the specific ageing characteristics of the individual. The possibility of age interaction does question the fundamental generality of the twin method in behavioural and clinical research of this type. Just as twins of unlike-sex are frequently neglected in twin studies, through a mistaken desire to " control " for the effects of sex, so the opportunity which the twin study provides to " control" for differences in age may, in some instances, avoid bringing to the investigator's attention a basic factor in the maintenance of variation.
5. LONGITUDINAL STUDIES
Several studies have shown how long-term predictions of behaviour are likely to be undermined· because of changes in gene expression with age. That such developmental changes can and do occur is well documented in animal studies (Broadhurst and Jinks, 1966).
In man there has been a growing interest in the influence of genetical factors on the profile of behavioural development. Wilson (1972), for example, has shown how the profile of mental development of MZ twins tested on successive occasions are more alike than those of DZ twins and . concludes that genetical factors influence the timing of stages of development as well as the overall level of final performance.
Eaves and Eysenck (1976a) showed that the changes of the neuroticism scores of MZ and DZ twins over a 2-year period were uncorrelated over twin .pairs. They concluded that short-term fluctuations in behaviour, although significantly greater than chance fluctuations, were due to the specific environmental experiences of individual twins. There was no suggestion that the family environment or genetical factors were involved in the determination of short-term changes. On the other hand, in a study employing an early version of the neuroticism scale of the EPQ, the same

302 L. J. EAVES, K. A. LAST, P. A. YOUNG, N. G. MARTIN
authors (1976b) showed that the absolute intra-pair differences for DZ twins correlated significantly with age whilst the intra-pair differences for the MZ twins did not .. This finding suggested that in the longer term genetical factors wl?re becoming more marked with increasing age. Dworkin et at. (1976), using an analysis similar to that of Eaves and Eysenck (1976a), showed that changes in personality of twins over a 12-year period using the Minnesota Multiphasic Personality Inyentory, were more consistent for MZ than DZ twins and argued for the involvement of genetical factors in the long-term changes in behaviour as much as in the overall personality score.
In spite of the detectable interactions between genotypes and occasions of testing, there remain stable patterns of behaviour which are in part under genetical control. Several authors (e.g. Fischbein, 1978) have drawn attention to changes in MZ and DZ correlations with time. Several have considered behaviour profiles in the context of the twin study, but virtually no one has offered a systematic methodology for fitting genetical and environmental models to repeated measurements. What is clearly needed is a formulation of genotype-environmental models that express hypotheses about the basis of the behavioural changes in an algebraic and testable form. Merely to demonstrate a change in twin correlation with time or to show that MZ twins resemble one another more than DZ twins for a particular profile of measurements is to recognise a problem but not to offer a solution.
In two of the studies of conservatism cited earlier, we identified twin pairs who had completed both the original social attitudes inventory (i.e. that analysed by Hewitt, 1974) and the modified form of the Wilson conservatism scale analysed by Last (1978). The interval between tests was approximately 3 years. The questions on the two tests are quite different and the test format requires different types of response, so there is very little overlap of material between the two occasions. The covariance matrices between twins on the two occasions are given (table 20). Since there are two occasions and two twins, each matrix is 4 x 4. The d.£ are smaller than in either of the two component studies since not all twins participated in both. The model proposes that there is additive genetical variation for both occasions (DB;J. and DR2), within-family environmental differences (Ell and E12) and between-family effects (BI and B 2), which might be due to assortative mating or the family environment or both. In addition, since all three major sources of variation may contribute to the covariation between scores on the two occasions of testing, we use D B;J.2, Ell2, and B12 to represent the additive genetic, within-family environmental and additional between-family components of covariance. The coefficients of the components in the expectations of the variances and covariances are those of the components of variance and the total phenotypic variance of the twin model. Thus, the expected matrix of MZ twin covariances is:
I!MZ =
tDRI +E11 +Bl tDR12+E112+B12 !DRl +Bl tDR12 +B12
tDR12+E112+B12 tDR2 +E12 +Bl tDR12 +B12 tDR2 +B2
tDRl +Bl !DR12+B12 tDRl +E11 +Bl tDR12+E112+B12
tDR12 +B12 !DR2 +B2 tDR12 + E112 + B12 tDR2 +E12 +B2

ANALYSIS OF HUMAN BEHAVIOUR 303
TABLE 20
Twin covariances and correlations for repeated measures qf conservatism
Twin 1 Twin 2 Occasion Occasion
Twin A A
type d.f. 1 2 1 2
MZf 181 69·90 3·91 45·27 3·03 0·55 0·72 3·80 0·46 0·59 0·49 84·42 4·64 0·43 0·64 0·60 0·71
MZm 53 61·92 4·17 50·63 3·40 0·63 0·71 3·50 0·40 0·74 0·48 76·12 3·79 0·50 0·55 0·50 0·74
DZf 97 119·27 6·33 60·87 5·01 0·64 0·81 3·89 0·42 0·58 0·45 91·96 6·96 0·47 0·47 0·74 0·97
DZm 21 123·21 6·52 ,32·69 2·33 0·61 0·93 1·95 0·08 0·31 0·21 89·54 4·07 0·26 0-10 0-53 0-65
DZmf 39 86-13 4-52 15-23 2-18 0-53 0-83 2-32 0-25 0-18 0-28 84-64 4-27 0-29 0-34 0-57 0-66
Note: Correlations are given in the lower triangle_
Similar expectations may be written for the DZ covariances by substituting the coefficient, i, for the additive genetic contribution in the between-twin covariances where t appears in the above_ The IIl;ethod of estimating the parameters is exactly the same as that used in the analysis of balanced pedigrees, except that we are now dealing with covariances between occasions rather than between generations. It is found necessary to set the correlation of the additional between-family effects to unity to prevent violation of the constraint that ~ 1 < B12/ (Bl • B2) t < 1. This may be done by substituting (Bl .B2)t for B12 in the above expectations. The chi-square for testing the adequacy of the model (X~2 = 44·78; 0·3 <p<O-4) confirms that the model which explains each of the studies separately is capable of doing so jointly. The estimates are:
fjm. = 82 ±22 fjR2 = 0·79±0·18 fjRl2 - 5·8± 1·6
£11 = 30±3 £12 = 0·28±0·03 £U2 = O·78±0·19
131 = 16 ± 10 132 = 0·1O±0·08
Thus, within-family environmental influences contribute but little to the covariation between occasions since EU2 is close to zero. The genetic correlation between the test scores on the two occasions, however, is substantial (rg = 0·72) and the correlation of the additional between-family effects contributing to B is necessarily constrained to its upper limit of unity by the data. This finding is remarkable in view of the assumed instability of attitudes. Whatever factors contribute to the overall changes in individuals' attitudes with time, it is quite clear that two distinct tests of conservatism given at 3-year intervals show a remarkable consistency in the

304 L. J. EAVES, K. A. LAST, P. A. YOUNG, N. G. MARTIN
ranking of individuals' attitudes. Thus, whatever other criticisms may be levelled at attempts to study behaviour by questionnaire, it is quite clear that stable results can be obtained and that such repeatability is partly dependent on genetical differences. Since the correlation of the "B" effects is unity, the factors which contribute to additional between-family differences, i.e. the family environment and assortative mating, are even more stable with time. This implies that the genes involved in the choice of spouse and the influences of the family environment on development are the most lasting and constant in their effect on this particular aspect of behaviour.
6. THE ANALYSIS OF MULTIPLE VARIABLES
The elusive task of behavioural measurement has been the definition of reproducible dimensions of behaviour which summarise ,the consistency of subjects' responses in diverse situations. For this reason,' a great deal of behavioural research has been founded on the hope that such consistencies may appear and be measurable through the simultaneous study of multiple variables. The corner stone of multivariate research has been the technique of factor analysis which see~ to resolve the relationships between multiple variables in 'terms of (hopefully few) underlying variables-the hypothesised " factors" . Factor analysis has concentrated chiefly on the description of phenotypic variation and has, therefore, had little interest for the behavioural geneticist except as a tool for reducing the number of measurements for genetic analysis or as a source of speculation about the likely genetical significance of " factors ".
Covariation between traits, like variation within traits, may have both genetical and environmental cauSes resolvable by analysis of appropriately designed studies. No matter how many measurements are made, no analysis of phenotYPic covariation can ever test the hypothesis that a given association between traits is genetic. Two basic approaches were prevalent in the 1960's. The first approach, suggested initially by Tukey (1951), is to estimate the matrices of environmental and genetical components of variance and covariance and subject these to factor analysis. This is the method employed by Loehlin and Vandenberg (1968) in their analysis of inherited abilities. There are two difficulties with this approach. Firstly the component matrices obtained in this way are rarely positive definite and so do not permit the usual factor decomposition. Secondly, there is no simple combination of covariance matrices readily obtainable from human relatives which yields a direct estimate of the total genotypic covariance matrices. All the approximations which have been suggested require certain untested assumptions about the mechanism of gene action or the origins of environmental variation. A second approach which avoids the statistical problems but does not answer the genetical criticisms is to base the analysis on canonical analysis and seek the linear combination of observed variables which maximises Vandenberg's F ratio of the intra-pair DZ variance to the intra-pair MZ variance (Vandenberg, 1965; Bock and Vandenberg, 1968). This approach has many attractions for its simplicity, but is not a general method which employs all the data available from a particular data set (in the case of twins) nor does it extend readily to encompass multiple sets of data or different types of relative. Furthermore, the method extends to the multivariate case all the problems inherent in

ANALYSIS OF HUMAN BEHAVIOUR 305
the corresponding analysis of single variables, chiefly the absence of any test of the underlying genetical model.
The work ofJoreskog (e.g. 1973) has provided a more general framework for the analysis of trait covariation which can be applied to the analysis of twin and family data. The approach, baseGl on th.e principle of maximum likelihood, includes conventional ML factor analysis as a special case, but permits specific models for trait covariation, including the developmental models discussed earlier, to be tested. Several genetical applications of the approach are now in the literature. Behrman et at. (1977) have applied Joreskog's method tot1ie analysis of the interrelationships between abilities, attainments and income in a large sample of middle-aged veteran twins in the U.S. The application of the twin method to multiple measurements does not overcome the inherent problems of the twin design but, nevertheless, the work of Behrman et al. does reveal that the basic traits measured are consistent with a model which assumes that the variation and covariation of the measurements is partly under genetic controL
Martin and Eaves (1977) applied a similar approach to the factor analysis of ability data. Their analysis confirmed the findings of the original authors (Loehlin and Vandenberg, 1968) and those of Eaves and Gale (1974) using weighted least squares, that the covariation between abilities depended hardly at all on environmental differences within families, but somewhat more on genetical differences segregating in the population. Under the linear factor model it appeared that some of the genetical variation was trait specific. As might be expected for traits for which mating is assortative, the simple model, which omitted the contribution of assortative mating and cultural effects to differences between families, gave a poor fit which was significantly improved by allowing for these additional effects. A similar conclusion also follows from the data of Behrman et al. It is tantalising that the twin study does not permit the resolution of these two sources of variation, since it is becoming clear from such studies that the effects of culture andJorassortative mating are most highly correlated across traits of this type, whilst the effects of genetical segregation are substantially, though not exclusively, trait specific and those of the within-family environment almost entirely trait specific. If the additional effects between families are due to the mating system, then. these early findings suggest that individuals are integrating their potential mate's performance over a wide range of abilities with the result that disequilibrium has been established between loci responsible for variation in different traits. If these effects are cultural, then the results suggest that the influence of cultural differences are far more generalised than those of specific environmental experiences within families.
The method of maximum likelihood, as formulated in the work of Joreskog, allows far greater flexibility in the specification and testing of models for trait covariation and removes the uncertainties and constraints in the conventional formulations of factor analysis. Eaves, Martin and Eysenck (1977), for example, have applied the method to the analysis of scales which were believed to represent dimensions of impulsiveness. The models used permitted trait-specific sex interactions to be specified and allowed the detection of genetic environmental effects common to the component traits and consistent over sexes.
All the published applications of the approach in behavioural genetics have involved a fairly small number of traits. Increasing the number of

306 L. J. EAVES, K. A. LAST, P. A. YOUNG, N. G. MARTIN
variables beyond five or six produces problems which have become familiar in the application of the approach to phenotypic variation (Joreskog, 1969), especially the difficulty in finding a model which actually "fits" the multivariate data. However, it is regularly possible to show that major changes in likelihood accompany theoretically significant changes in the basis of the model, and thus, to provide a powerful basis for discrimination between equally plausible alternatives. The chief advantage of the approach is that the researcher can specify his expectations for trait covariation in advance and subject such hypotheses to rigorous test. Virtually any consistent model can be tested in this way. There is no restriction to the conventional factor analysis models. Models for longitudinal data, family data, models in which the structure of trait covariation is specified in advance are all within the scope of this approach, providing only that the e.xperimental design is capable in principle of resolving the necessary genetical and environmental components.
Testing a psycho-genetical theory
The analysis of multiple variables is likely to be most powerful when applied to variables chosen with a particular hypothesis in mind rather than for unstructured collections of variables. Thus, Behrman et al. chose variables with a direct bearing on the issue of inequality of income. A further illustration is provided by an attempt to test Eysenck's personality theory in the domains of impulsiveness and sensation-seeking. It has been argued that the hereditary basis of the three principal dimensions of personality, psychoticism, extraversion and neuroticism, affects more general aspects of behaviour .. By combining measures of the three factors with other variables in a genetical study, it is possible to test this theory. Martin et al. (in preparation) analysed the genetical and environmental covariances of 12 measures: the P, E, N, and L scales of the EPQ; four measures of impulsiveness (Eysenck and Eysenck, 1977) and four measures of sensationseeking (Zuckerman, 1971). Various models were fitted, but the most critical is that which defines four genetical factors in terms of P, E, N, and L and examines their contribution to the other behavioural measurements. I t is then possible to assess the proportion of the variance in a particular measure that can be explained by genetical variation in the dimensions of Eysenck's personality theory. A similar model is fitted simultaneously to the environmental variation, but in this case, allowance is made for the specific contribution of errors of measurement etc. to all traits including the four primary scales, P, E, N, and L.
The model was fitted to twin data of both sexes simultaneously but making allowance for sex differences in the trait-specific additive genetic variance. The results are summarised for females in table 21, which gives the percentage contribution of the hypothesised factors to the total variance of each variable. Examination of the genetic contributions shows that genetical differences of the four factors individually contribute very little to the total variation in the dependent traits. When taken together all four factors contribute quite significantly to the genetical variation in individual measurements. The largest contributions are those of extraversion and the lie scale to the sensation-seeking variables. Of particular interest from the standpoint of Eysenck's theory are the contributions of extraversion

TABLE 21
Contributions (per cent) to total variance in 12 personality variables measured infemale twins from thefour Eysenckfactors and trait specific components qf within-family environmental and additive genetic sources of variation
Personality
Impulsivensss
Sensation seeking
I
Psychoticism Extraversion Neuroticism Lie Impulsiveness Risk-taking Non-planning Liveliness Disinhibi tion Thrill seeking Experience seeking Boredom susceptibility
Explained by within-family environment
Factors (El ) A Trait \
I (P) II (E) III (N) IV (L) specific A
8 0* 0* 0* 50 0* 80 0* 0* 0 0* 0* 5 0* 54 0* 0* 0* 2 78
16 11 49 2 0 54 3 0 IS 7 9 0 3 0 49 4 10 2 0 58
23 0 6 20 3 12 1 0 3 47 3 0 1 1 41 8 0 0 1 50
* Parameter fixed to zero.
X:eo = 963; (P< 10-8).
I
Explained by additive genetic effects
Factors (DR) A Trait \
I (P) II (E) III eN) IV (L) specific A
42 0* 0* 0* 0* 0* 20 0*, 0* 0* 0* 0* 41 0* 0* 0* 0* 0* 20 0* 5 2 3 2 10 1 6 0 1 13
13 5 4 2 15 0 6 6 0 14 1 24 7 6 10 0 2 5 18 12 4 8 2 25 15 6 14 1 0 20
Total
100 100 100 100 100 100 100 100 100 100 100 100
> Z > t"I ~ C/.l H C/.l
o ITj
::r: c:: ~ > Z ttl tJ:j
::r: > -< H
o c:: ?:1
t>:l o '-I

308 L. J. EAVES, K. A. LAST, P. A. YOUNG, N. G. MARTIN
to disinhibition and boredom-susceptibility since an important component of Eysenck's psycho-physiological theory of extraversion is the relationship between cortical inhibition and extraversion, demonstrated behaviourally in the association between measures of extraversion and boredom or disinhibition (Eysenck, 1967).
Unfortunately, as is frequently the case in multivariate studies, the model fails badly to account for the observed pattern of covariation between traits for the five groups of twins in the sample (X:so = 963; P< 10-8). Several factors could cause this including failure of the basic genotype-environmental model for any of the reasons discussed in the context of twin data, or failure of the psychological modeI to explain all the observed genetical covariation between the dependent measures. Improvement can be achieved by relaxing the very stringent model for the genetical covariation, but the statistical test of such extended models suggests that the improvement is far from sufficient to account for all the residual covariance between measures and twins. Nevertheless, our model predicts a matrix of phenotypic correlations between the variables which departs substantively from the observed correlations in only a few places. '
Thus, by the criterion of the statistical test of the model, the four dimensions of Eysenck's personality theory do not exhaust all the genetical covariatiori between the measurements of impulsiveness and sensation seeking, although they do contribute significantly and in a predictable fashion to measurements of sensation seeking. This brief treatment cannot examine all the alternative models which might be proposed for the relationship between personality and other measures of behaviour, but it suffices to illustrate the principle that a rigorous test can be provided of a model whose form is dictated by both genetical and psychological considerations, with the consequent reduction of a very large number of variances and covariances to a few basic causal principles. .
7 . .ANALYSIS OF SPECIFIC ITEMS: THE THRESHOLD MODEL
(i) Item profiles
All the previous examples employ continuous or quasi-continuous measurements. Test scores are obtained by summing over a number of discrete item responses and the resultant scales are often either approximately normal of can be shown to have satisfactory properties for the purposes of biometrical genetical analysis. Some loss of information is involved, which is normally offset by the consistency and predictive validity of the findings using the composite scales. We now ask: "What type of information is being lost in the analysis of composite scales? ". We may either devise a measure of the information which is not contained in the composite score of a test, or conduct an analysis of the individual items of the test to determine the extent to which they reflect the properties found for the entire scale. Eaves and Eysenck (1976a) considered the former approach by studying the similarities and differences of twins for the items x subjects interaction of a short neuroticism scale. Just as the variability in total scores on a scale can be partitioned into that due to differences between and within twin pairs, so can the interaction of subjects and test items, representing the variability in the unique profiles of individuals' responses around their mean

ANALYSIS OF HUMAN BEHAVIOUR 309
response for all the items of the test. The subject x items interaction mean squares for the five twin groups studied by Eaves and Eysenck (1976a) are reproduced in table 22. The disadvantage of this type of summary is that the general "interaction" does not give much information about the actual types of profile contributing to it. The subject x items interaction is often employed as an estimate of error va;iance in psychometric studies. The analysis presented in the table suggests that this is not justified for this trait, if by "error" we mean" sampling variance "in the strict sense. The interaction variance between twin pairs is significant and the variance within DZ pairs exceeds that within MZ pairs. Indeed, for the item specific interactions as for many other more general dimensions of measured
TABLE 22
Twin mean squares for inconsistency of neuroticism scale
Twin type Item d.f. Mean square
MZ, Between pairs 2010 29 Within pairs 2020 16
MZm Between pairs 500 27 Within pairs 510 18
DZ! Between pairs 1030 27 Within pairs 1040 22
DZm Between pairs 240 27 Within pairs 250 22
DZm! Between pairs 580 25 Within pairs* 580 20
Pooled Errort 10
* Corrected for sex differences. t (Subjects x items x occasions).
behaviour, genetical factors seem to playa significant role in the determination of quite specific behaviour profiles. It would seem to be generally true that genetical differences contribute to item profiles as well as to composite scores. Hewitt (1974), for example, conducted a similar analysis of social attitudes items and showed that there is significant genetical heterogeneity of item response profiles among" conservatism" items after extraction of a composite conservatism score. This finding was contrary to intuition since we had speculated that the more measurements approached the subjects' attitudes on separate issues the more likely it was that chance and cultural factors would play a significant role in the determination of individual responses.
In fact, the apparent familial environmental component, which was a marked feature of the three studies of radicalism-conservatism reported above, was not obvious once the common factor of conservatism had been extracted from the item responses, suggesting that the family environment (or assortative mating) is exercising a generalised effect on item covariation.
Such findings remind the behaviour geneticist that almost any trait, no matter how apparently trivial or specific, can display a genetical component and that the mere demonstration· that a trait is pardy inherited should not, by itself, be a cause for rejoicing in some new-found evolutionary "significance" for behaviour. The important factors which govern such statements are the nature of the gene action, the genetical consequences of

310 L. J. EAVES, K. A. LAST, P. A. YOUNG, N. G. MARTIN
the mating system, and the environmental effects of genetical differences as in the case of cultural and sibling effects. Many of these specific genetical factors could be merely bypro ducts of genes whose main contributions to fitness lie elsewhere.
(ii) Specific items
The analysis of individual items "raises the more general issue of the analysis of discontinuous variation when the discontinuities represent the arbitrary decision of the experimental subject to endorse one category of response rather than another or of the clinician who assigns a patient to one category of-disorder rather-than another.
There are three basic approaches to the analysis of such traits. The first is to consider the ability of a single gene model, with or without reduced penetrance, to explain the observations. This approach is suggested by e.g. Elston and Campbell (1970). The second approach, due to Falconer (1965), is to regard the obse~ed phenotypic discontinuity as a manifestation of one extreme of an underlying continuous distribution of liability which may itself be affected by polygenic factors. These two approaches represent the two extremes of model which might conceivably be fitted to discontinuous variation. C. Smith (1971) has demonstrated powerfully that the task of discriminating between the two alternatives is prohibitive even when the complications of G x E and the family environment are discounted, except when the penetrance (or heritability) is high. The latter effectively precludes a great many of the traits of psychological and clinical significance from the domain wherein the number of loci might be inferred reliably by population studies. The third approach, that of segregation analysis (Morton, 1969), has some attractions- for the analysis of traits about which little is known because it concentrates primarily on the estimation of empirical parameters to summarise the risk to relatives without any necessary reliance on any specific theory of causation. The disadvantage of the empirical approach, -as Morton (1976) himself stresses, is the inability of empirical models to do more than explain existing data. It is only when a sound theoretical basis for the observed risks can be provided that general predictions may be made.
For many traits the number of loci is still elusive largely because there is imprecise information even about the degree of genetic determination and more especially about the environmental causes of variation. Any approach which yields such information effectively and simply will be attractive. Falconer's threshold model offers a conceptual basis for the analysis of such traits, although modifications may be made to the model and methods of analysis in the light of more recent developments. Falconer (1965) considers a continuous distribution of liability in which there is a threshold beyond which individuals display a particular category of response. Edwards (1969) has questioned the validity of the sharp threshold of discontinuity but the alternative model, assuming a cumulative distribution of liability, is formally indistinguishable (C. Smith, 1971). Edwards pointed out that the threshold model for pairs of relatives had much in common with the model underlying the tetrachoric correlation coefficient, namely that an arbitrary dichotomy was imposed upon each margin of a bivariate normal distribution, to yield the observed table of concordances for the dichotomous trait in pairs of relatives. The problem of estimation, in the first instance, reduces to estimating the position of the threshold in standard
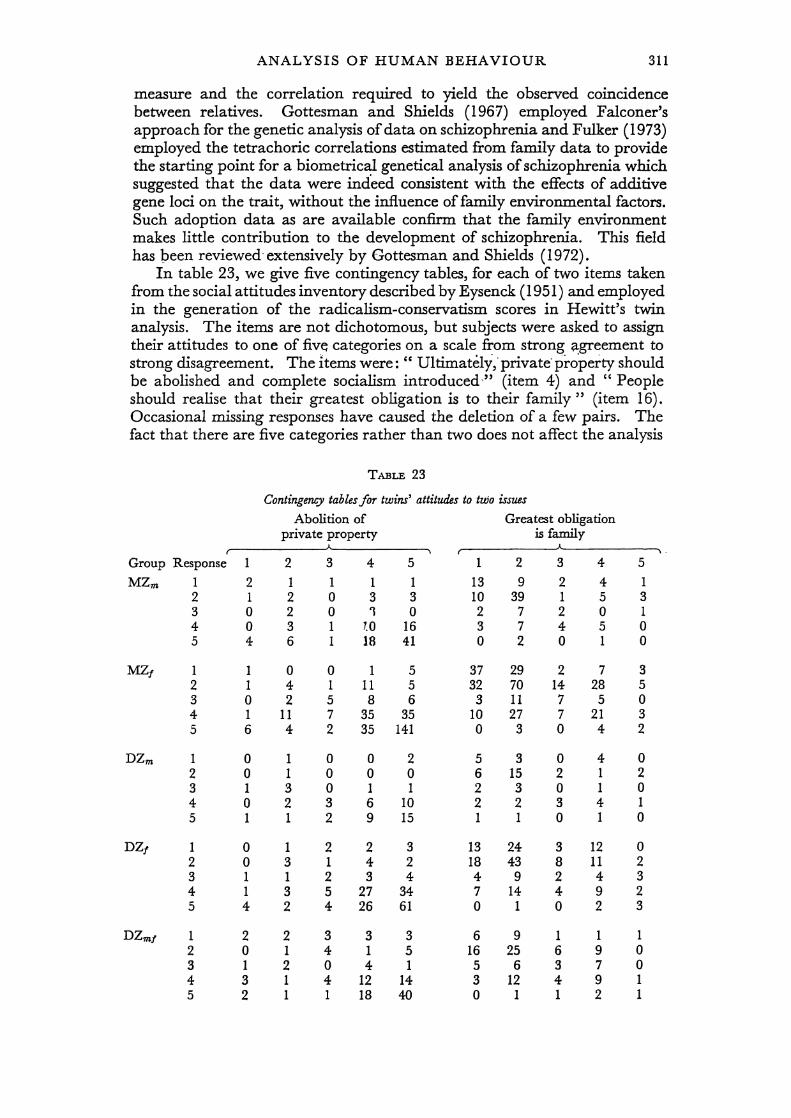
ANALYSIS OF HUMAN BEHAVIOUR 311
measure and the correlation required to yield the observed coincidence between relatives. Gottesman and Shields (1967) employed Falconer's approach for the genetic analysis of data on schizophrenia and Fulker (1973) employed the tetrachoric correlations estimated from family data to provide the starting point for a biometrical genetical analysis of schizophrenia which suggested that the data were indeed consistent with the effects of additive gene loci on the trait, without the influence of family environmental factors. Such adoption data as are available confirm that the family environment makes little contribution to the development of schizophrenia. This field has peen reviewed'extensively by Gottesman and Shields (1972).
In table 23, we give five contingency tables, for each of two items taken from the social attitudes inventory described by Eysenck (1951) and employed in the generation of the radicalism-conservatism scores in Hewitt's twin analysis. The items are not dichotomous, but subjects were asked to assign their attitudes to one of fiv~ categories on a scale from strong agreement to strong disagreement. The Items were: " Ultimately; private" property should be abolished and complete socialism introduced'" (item. 4) and "People should realise that their greatest obligation is to their family " (item 16). Occasional missing responses have caused the deletion of a few pairs. The fact that there are five categories rather than two does not affect the analysis
TABLE 23
Contingency tables for twins' attitudes to two issues
Abolition of Greatest obligation private property is family
{~ ________ ~A A
Group Response
MZm 1
DZm
DZ/
DZm/
2 3 4 5
1 2 3 4 5
1 2 3 4 5
1 2 3 4 5
1 2 3 4 5
1
2 1 o o 4
1 1 o 1 6
o o 1 o 1
o o 1 1 4
2 o 1 3 2
2 1 2 2 3 6
o 4 2
11 4
1 1 3 2 1
1 3 1 3 2
2 1 2 1 1
3
1 o o 1 1
4 5
1 1 3 3
" 0 7.0 16 18 41
015 1 11 5 586 7 35 35 2 35 141
002 000 011 3 6 10 2 9 15
223 1 4 2 234 5 27 34 4 26 61
333 415 o 4 1 4 12 14 1 18 40
1 2 13 9 10 39 2 7 3 7 o 2
37 29 32 70 3 11
10 27 o 3
5 3 6 15 2 3 2 2 1 1
13 24 18 43 4 9 7 14 o 1
6 9 16 25 5 6 3 12 o 1
3
2 1 2 4 o
4
4 5 o 5 1
2 7 14 28 7 5 7 21 o 4
o 4 2 1 o 1 3 4 o 1
3 12 8 11 2 4 4 9 o 2
1 1 6 9 3 7 4 9 1 2
5 1 3 1 o o
3 5 o 3 2
o 2 o 1 o
o 2 3 2 3
1 o o 1 1
, .

312 L. J. EAVES, K. A. LAST, P. A. YOUNG, N. G. MARTIN
but merely illustrates its greater generality. We require the process which could generate the observed contingency tables. Tallis (1962) considers the estimation of correlations from contingency tables. Writing Pii for the expected proportion of pairs in cell ij of the two-way tables, and nij for the observed number of twin pairs in that cell, then the log-likelihood of observing the given two-way table is:,
L = L nij In Pij. i, j
The log-~elihood of obse~ving all the tables is the sum of the component log-likelihoods. The analytical problem is finding an appropriate model for the Pii for each table and obtaining the parameter estimates which maximise the likelihood. In the model, foUowing Falconer, we regard each category as bounded by a lower threshold (tl) and an upper threshold (t2) on a standard normal scale of liability. In the case of the extreme classes, either tl or t2 will be infinite. Thus, in the case of a 5 x 5 table, there will be four finite boundaries delineating the classes. In the absence of sex and birth order effects, and any effects which· contribute to differences in total variance between MZ and DZ twins, the thresholds should be the same for all five tab~es for a given questionnaire item. The expected proportion of individuals, Pii' is thus:
Jt21 f,t2J <I>(x, y, p )dydx tu tlJ
where tli' t2i, tli and t2i are the upper and lower boundaries on the standard normal scale of liability delineating cells on the ith row andjth column of the tables. <I>(x, y, p) is the standard bivariate normal distribution with correlation p. The value of p will depend on the particular theory for differences in liability. Since there is some evidence of additional nongenetic similarity between the attitudes of relatives from the earlier analyses of composite attitudes scales, we shall pursue the same model for the component items and write:
Pm: = tDR+B; Pd: = tDR+B.
The model for the five tables thus involves six parameters: four threshold values plus DR and B. Since the total variance in liability is constrained to be unity in each group, the contribution of within-family environmental factors is obtained by differences: 21 = l-i.DR-B. Allowing for the arbitrary total number in each of the tables, there are 5 x 24 = 120 d.f. altogether, leaving 114 d.f. for testing the model by the Pearsonian chisquare. Since the numbers observed are often small this may not be a reliable test.
Several factors, apart from the failure of the basic genotype-environmental model, might contribute to failure of this model e.g. failures of the basic scaling assumption that the categories are ordered in a linear sequence from strong agreement to strong disagreement.
As an illustration the six-parameter model was fitted to the data tabulated for the two social attitude items. For item 4 the fit of the model was poor, suggesting that substantial residual effects, including those of sex and scaling, may need to be resolved for the individual items. The test of the model for the individual items is therefore more demanding than a

ANALYSIS OF HUMAN BEHAVIOUR 313
test based on composite scores because analysis of the latter proceed from data which have been subjected to greater preliminary reduction. The actual parameter values are:
Item 4 Item 16
~ = -1·723 -0·735
£2 = -1·233 0·453
13 = -0·959 0·745
14 - -0·0~5 1·799
tJR - 0·266 0·306
13 - 0·280 0·178
Xf14 = 169·76 128·38
p = <0·001 0·17
Thus, the contribution of both genetical and cultural factors to the individual items can be assessed. In general, the items of the scale show great variation in the adequacy of the model and in parameter estimates.
Although it is difficult to generalise, it appears that attitudes on economic issues display greater cultural determination whilst attitudes towards criminals and minority groups display greater genetic variation.
Clearly, the method of maximum likelihood in this context is not confined solely to the analysis of twin data using the threshold model but may be applied to other degrees of relationship. Furthermore, the variety of models is just as great as those which can be applied to continuous traits using the methods outlined earlier. There is no reason why the threshold model is necessarily confined to simple additive genetic systems when adequate family data can be obtained. The main numerical difficulty encountered in the application of model-fitting techniques to pedigrees of more than two individuals is the increase in the dimensionality of the normal probability integral which needs to be evaluated in order to obtain the expected proportions. Lange et al. (1976a) have outlined procedures which might be used in applying the threshold model to unbalanced pedigrees and show how these might be employed for the computation of likelihoods. It is not yet clear how practicable the approach would be for parameter estimation when the method has to be implelnented with large pedigrees or with more complex models, such as those involved in the previous examples of the analysis of continuous traits. For the case oflarger balanced pedigrees, however, in which the multivariate normal probability integral need be computed only for a certain number of fixed family types, the analysis appears practicable.
8. DISCUSSION
The examples· illustrate growing flexibility in the formulation of models for human behavioural variation. Social scientists are more aware of the potential importance of genetical factors and geneticists attempt to include cultural and social factors in models for individual differences. Much of the new flexibility stems from advances in statistics and computing, especially
41/3-E

314 L. J. EAVES, K. A. LAST, P. A. YOUNG, N. G. MAR TIN
in the field of numerical optimisation, which enables more imaginative models to be tested.
Theory and method have currently outrun knowledge for want of data. The requirement for new data is urgent. Few studies combine all the features desirable for an adequate resolution of cultural and biological factors. The problem is heightened by the choice of idiosyncratic measures relating neither to a clearly defined theory of individual differences nor to a definite educational, clinical or social problem. This is due to disagreement about what is worth measuring, to the absence of centralised data collection, and to lack of consultation between geneticists and social scientists about the design of surveys. In spite of many short-comings a pattern is emerging which could govern present research into individual differences. Unless the twin method is generally misleading there is substantial evidence that genetical differences lead to behavioural variation in man. The role is quite general-involving abilities, personality, attitudes, attainments and even income-and appli~s as much to individual profiles of behaviour as to the most general measurable dimensions of human variation. Alternative environmental interpretations are possible' involving new principles which simulate inheritance. At the level of twin research of individual variables, model-fitting has clarified many important anomalies in twin data and provided a theoretical basis for their interpretation, as in the case of sibling effects. In addition, simulation and data analysis have charted more clearly the areas in which errors of inference are most likely (Eaves, 1972; Eaves et at., 1977; Martin et at., 1978), and provided a quantitative basis for experimental design.
Of all factors, a basic understanding of the mechanism of gene action is elusive since many behavioural traits are not so overwhelmingly heritable as to permit the reliable determination of gene action by biometrical genetical methods based on second-degree statistics, still less by analysis in terms of one or two loci. This does not preclude the worthwhile analysis of individual differences since model-fitting methods are capable of revealing factors which have merely been subjects of speculation in the past, including the environmental effects of genetical differences and the interaction of genetical differences with age. Once research into individual differences is sufficiently established to go beyond the measurement of one or two types ofindividual on collections of unrelated variables, there is no alternative to some variant of the procedure as a rational basis for discriminating between plausible and probable hypotheses. More traditional ad hoc methods do not provide this and, at best, can only magnify weaknesses inherent in the model-fitting approach.
Environmental differences within families play a significant role in the determination of variation although this role is exceedingly small in the case of general measures of ability. Part of this variation is attributable to measurement error. In a few cases, of which Eysenck's Psychoticism scale is one, the majority of the environmental variation within families could be attributed to errors of measurement. The problem remains of resolving the precise causes of intra-family environmental variation not due to error. Studies of repeated measures over a short interval, in the case of neuroticism, suggest that many of these differences reflect transient environmental experiences. Studies of multiple measures suggest that the within-family environment is trait-specific in its action. These considerations

ANALYSIS OF HUMAN BEHAVIOUR 315
imply that population studies of the within-family environment are not going to reveal major new insights into the causes of behavioural variation in general. A trait-specific approach will be required, needing the comparison of the environment of individuals showing a particular disability or disease with their normal identical co-twins. Research of this type has already become established in the study of smoking and morbidity (e.g. Cederlof et at., 1977).
The role of the family environment, with or without.the addedcomplications of genotyp~-environment ~ovariance is still controversial. Many of the doubts expressed about particular bodies of data relating to intelligence (e.g. by Kamin, 1974) have been dispelled (e.g. by Fulker, 1975) but unresolvable doubts remain which can only be settled by the collection of new and more extensive data. Since the majority of large twin and sibling studies give consistent results (e.g. Record et at., 1970), the weight now resides with adoption studies with greater attention paid to the estimation of placement effects which lead to overestimation of the familial environment .
. An essential distinction has been made ben-veen personal and impersonal aspects of the environment in which individuals develop. Models for cultural transmi~sion and co-operation or competition recognise that the environment of man is largely personal because he is a social organism with a defined family structure. In specifying the effects of the personal environment, the genetic basis of variation is considered and the notion of gene expression is extended to include the influence of one phenotype upon another. The recognition of the personal and possibly genetic basis of the environment in social organisms has provided stimulus for the growing discipline of sociobiology (e.g. E. O. Wilson, 1975; Dawkins, 1976). It is premature to suppose that the study of human differences has made any significant contribution to this area, but some criteria for detecting the behavioural effects of social interactions have been established. We may now be able to discriminate between those traits which are primarily individual and those which are influenced by factors in the interpersonal environment. In so far as natural selection operates upon the former it will do so on an individual basis, in so far as it affects the latter, changes
. in gene frequency will depend upon the effect of genetical differences on the social environment (Hamilton, 1964a, h; Maynard Smith, 1964).
We have said little about the concept of " heritability". We agree with Feldman and Lewontin (1975) that behavioural genetics has suffered a " heritability hang-up" but do not see this as any grounds for dismissing human behaviour as a worthy object of genetical research. As the above
. analyses have shown, the concept of " heritability" plays only a subsidiary role in human psychogenetics. It is of pressing scientific interest to resolve competing claims about the basis of behavioural variation in man and to delineate those areas of human behaviour where social and personal factors are paramount. In our view the issue should be decided on the basis of data and not on philosophy, politics or prejudice. The model-fitting approach will not avoid human error nor preclude controversy, but provides' a scientific basis for resolving competing claims and for quantifying our degree of ignorance.
Acknowledgements.-This work forms part of a research programme in Psychogenetics supported by the M.R.C. Krystyna Last is an Honorary Research Fellow on secondment
316 L. J. EAVES, K. A. LAST, P. A. YOUNG, N. G. MARTIN
from the Testing and Evaluation Center, University of Georgia. P. A. Young is the recipient of an S.R.C. CASE Studentship.
We appreciate the continued encouragement of Professor J. L. Jinks. We thank D. W. Fulker and P. O. White for helpful discussion and our collaborators H. J. Eysenck and H. Lytton for illustrative data.
9. REFERENCES
ALLEN, G. 1965. Twin research: problems and prospects. Progress in Medical Genetics, 4, 242-269'0
ALLEN, G. 1968. Diagnostic efficiency of finger print and blood group differences in a series of twins. Acta. Genet. Med. Gemell., 17,359.
BAILEY, N. T. J. 1961. Introduction to the Mathematical Theory of Genetic Linkage. Oxford University Press, Oxford.
BEHRMAN, J., TAUBMAN, P., AND WALES, T. 1977. Controlling for and measuring the effects of genetic and family environment in equations for schooling and labour market success. In Kinometrics, ed. P. Taubman. North Holland: Amsterdam.
BOCK, R. D., AND KOLAKOWSKI, D. 1973. Further evidence of sex-linked major gene influence on human spatial visualising ability. Amer. ].' Human Genet., 25, 1-14.
BOCK, R. D., AND VANDENBERG, S. G. 1968. Components of heritable variation in mental test scores. In Progress in Human Behavior Genetics, ed. S. G. Vandenberg. Johns Hopkins.Press, Baltimore, Maryland.
BRELAND, N. s. 1973. A test of a primary bias in twin studies with respect to measured ability. Behavior Genetics, 4, 101-109.
BRELAL'ID, N. s. 1978. Twin correlations published between 1875 through 1971. In Twin Studies of Ability, Personality and Interests, ed. R. C. Nichols. Homo (in press).
BROADHURST, P. L., AND JINKS, J. L. 1966. Stability and change in the inheritance ofbehaviour in rats. A further analysis of statistics from dialleI cross. Proc. Roy. Soc., B., 165,450-472.
BURT, c. 1966. The genetic determination of differences in intelligence: a study of monozygotic twins reared together and apart. Brit. J. Psychol., 57, 137-153.
CA'ITELL, R. B. 1960. The multiple abstract variance analysis equations and solutions for nature: nurture research on continuous variables. Psychol. Rev., 67,353-372.
CAVALLI-SFORZA, L. L., AND FELDMAN, M. w. 1973. Cultural versus biological inheritance: phenotypic transmission from parents to children (a theory of the effect of parental phenotypes on children's phenotypes). Amer. J. Human Genet., 25, 618-637.
CEDERLOF, R., FRIBERG, L., JONSSON, E., AND KAIJ, L. 1961. Studies on similarity diagnosis in twins with the aid of mailed questionnaires. Acta Genetica et Statistica Medica, (Base!), 11, 338-362.
CEDERLOF, R., FRIBERG, L., AND LUNDMAN, T. 1977. The interactions of smoking, heredity and environment and their implications for disease etiology. Acta Medica Scandinavica, Suppl., 612.
CHRISTIAN, J. C., AND KANG, K. w. 1977. Maternal influence on plasma cholesterol variation. Amer. J. Human Genet., 20,462-467.
CHRISTIAN, J. C., KANG, K. W., AND NORTON, J. A. 1974. Choice of an estimate of genetic variance from twin data. Amer. J. Human Genet., 26, 154-161.
CLARIDGE, G., CANTER, S., AND HUME, W. I. 1973. Personality DijJerences and Biological Variations: A Study of Twins. Pergamon Press, Oxford.
COOKE, P., MORLEY JONES, R., MATHER, K., BONSALL, G. W., AND NELDER, J. A. 1962. Estimating the components of continuous variation. 1. Statistical. Heredity, 17, 211-236.
COREY, L. A., KANG, K. W., CHRISTIAN, J. C., NORTON, J. A. JR., HARRIS, R. E., AND NANCE,
W. E. 1976. Effects of chorion type on variation in cord blood cholesterol of mono-zygotic twins. Amer. J. Human Genet., 28,433-441. .
DARLINGTON, C. D. 1969.· Evolution.of Man and Society. Allen and Unwin, London. DARLINGTON, C. D. 1971. Axiom and process in genetics. Nature, 234, 521-525. DAWKINS, R. 1976. The Selfish Gene. Oxford University Press, Oxford. DEFRlES, J. C., ASHTON, G. C., JOHNSON, R. C., KUSE, A. R., MCCLEAR, G. E., MI, M. P., RASHAD,
M. N., VANDENBERG, S. G., AND WILSON, J. R. 1976. Parent-offspring resemblance for specific cognitive abilities in two ethnic groups. Nature, 261, 131-133.
DWORKIN, R. H., BURXE, B. W., AND MAHER, B. A. 1976. A longitudinal study of the genetics of personality. Journal of Personality and Social Psychology, 34, 510-518.

ANALYSIS OF HUMAN BEHAVIOUR 317
EAVES, L. J. 1972. Computer simulation of sample size and .experimental design in human psychogenetics. Psychological Bulletin, 77, 144-152.
EAVES, L. J. 1975. Testing models for variation in intelligence. Heredity, 34, 132-136. EAVES, L. J. '1976a. A model for sibling effects in man. Heredity, 36,205-215. EAVES, L. J. 1976b. The effect of cultural transmission on continuous variation. Heredity,
37,41-57. EAVES, L. J. 1977. Inferring the causes of human variation. J. Roy. Stat. Soc. Ser. A., 140,
324-355. EAVES, L. J., AND EYSENCK, H. J. 1974. Genetics and the development of social attitudes.
Nature, 249, 288-289. EAVES, L. J., AND EYSENCK, H. J. 1976a. Genetical and environmental components of
inconsistency anq. unrepeatability iJ:? twins' responses to a neuroticism questionnaire. Behavior Genetics, 6, 145-160.
EAVES, L. J., AND EYSENCK, H. J. 1976b. Genotype x Age interaction for neuroticism. Behavior Genetics, 6, 359-362.
EAVES, L. J., AND EYSENCK, H. J. 1977. A genotype-environmental model for psychoticism. Advances in Behaviour Research and Tlzerapy, 1,5-26.
EAVES, L. J., AND GALE, J. s. 1974. A method for analysing the genetic basis of covariation. Behavior Genetics, 4, 253-267.
EAVES, L. J., AND JINKS, J. L. 1972. Insignificance of evidence for differences in heritability of IQ between races and social classes. Nature, 240, 84-88.
EAVES, L. J., LAST, KRYSTYNA, MARTIN, N. G., AND JINKS, J. L. 1977. A progressive approach to non-additivity and genotype-environmental covariance in the analysis of human differences. Brit. J. Math. Statist. Psychol., 30, 1-42.
EAVES, L. J., MARTIN, N. G., AND EYSENCK, S. B. G. 1977. An application of the analysis of covariance structures to the psychogenetical study of impulsiveness. Brit. J. Math. Statist. Psychol., 30, 185-197.
EDWARDS, J. H. 1969. Familial predisposition in man. Brit. Med. Bull., 25, 58-63. ELSTON, R. c., AND CAMPBELL, M. A. 1970. Schizophrenia: evidence for the major gene
hypothesis. Behavior Genetics, 1, 3-10. ELSTON, R. c., AND RAO, D. c. 1978. Statistical modelling and analysis in human genetics.
, Ann. Rev. Biophys. Bioeng., 7, 253-286. EYSENCK, H. J. 1951. Primary social attitudes as related to social class and political party.
Brit. J. Sociol., 2, 198-209. EYSENCK, H. J. 1952. The Scientific Study of Personality. Routledge and Kegan Paul, London. EYSENCK, H. J. 1967. The Biological Basis of Personality. Thomas Springfield, Illinois. EYSENCK, H. J. 1973. The Inequality of Man. Temple Smith, London. EYSENCK, s. B. G., AND EYSENCK, H. J. 1975. Manual of the EPQ (Eysenck Personality Qpestion
naire). University of London Press, London. EYSENCK, s. B. G., AND EYSENCK, H. J. 1977. The place of impulsiveness in a dimensional
system of personality description. Brit. J. Soc. Clin. Psychol., 16,57-68. FALCONER, D. s. 1964. Maternal effects and selection response. Genetics Today. Proceedings
of the XI International Congress of Genetics, The Hague, Netherlands, September 1963. Pergamon Press, Oxford.
FALCONER, D.S. 1965. The inheritance of liability to certain diseases estimated from the incidence among relatives. Ann. Human Genet. (Lorulon), 29, 51-76.
FELDMAN, H. W., AND LEWONTIN, R. c. 1975. The heritability hang-up. Science, 190, 1163-1168.
FISCHBEIN, s. 1978. Intra-pair similarity in physical growth of monozygotic and of dizygotic twins during puberty. Ann. Human BioI., 4,417-430 ..
FISHER, R. A. 1918. The correlation between relatives on the supposition of Mendelian inheritance. Trans. ROJI. Soc. Edinburgh, 52, 399-433.
FISHER., R. A., IMMER, F. R., AND TEDIN, D. 1932. The genetical interpretation of statistics 'of the third degree in the study of quantitative inheritance. Genetics, 17, 107-124.
FULKER, D. w. 1973. A biometrical genetical approach to intelligence and schizophrenia. Social Biology, 20, 266-275.
FOLKER, D.· W. 1975. Review of " The science and politics of IQ". Amer. J. Psychol., 88,505-519.
GOLDBERGER, A. s. 1977a. The non-resolution of inheritance by path analysis. University of Wisconsin-Madison, Social Systems Research Institute Workship Services, Number 7709.
GOLDBERGER, A. s. 1977b. Models and methods in the IQ debate: Part I. University of Wisconsin-Madison, Social Systems Research Institute Workshop Series, Number 7710
318 L. J. EAVES, K. A. LAST, P. A. YOUNG, N. G. MARTIN
GOLDBERGER, A. S. 1977c. Twin methods: a skeptical view. In Kinometrics, ed. P. Taubman. North-Holland, Amsterdam.
GOTI'ESMAN, I. I. 1963. Heritability of. personality: a demonstration. Psychological Monographs,77.
GOTI'ESMAN, I. I., AND SHIELDS, J. 1967. A polygenic theory of schizophrenia. Proc. Nat. Acad. Sci., U.S.A., 58, 199-205.
GOTI'ESMAN, I. I., AND SHIELDS, J. 1972. Schizophrenia and Genetics. Academic Press, New York. HAMILTON, W. D. 1964a. The genetical evollltion of social behaviour. I. J. Theoret. BioI.,
7, 1-16. HAMILTON, W. D. 1964b. The genetical evolution of social behaviour. II. J. Theoret.
BioI., 7, 17-52. HEWITT, J. 1974. An analysis of data from a twin study of social attitudes. Ph.D. thesis,
University of Birmingham. -HEWITT, J. K., EYSENCK, H. J., AND EAVES, L. J. 1977. Structure of social attitudes after 25
years: a replication. Psychological Reports, 40, 183-188. HUSEN, T. 1960. Abilities of twins. Scand. J. Psychol., 1, 125-135. INSEL, P. M. 1974.Ma~e~.effe~ts in personality .. Behavior qenetiqs, 4, 133-143. JENCKS, c. et ale 1972. Inequality:' A teassess11ient qfthe Effict of Family and Schooling in America .
. Basic Books, New York. JINKS, J. L., AND EAVES, L. J. 1974. IQ and inequality. Nature, 248, 287-289. JINKS, J. L., AND FULKER, D. w. 1970. Comparison C?f the biometrical genetical, MA VA and
classical approaches to the analysis of human behavior. Psychol. Bull., 73,311-349. JORESKOG, K. G. 1969. A general approach to confirmatory maximum likelihood factor
analysis. Psychometrika, 34, 183-202. JORESKOG, K. G. 1973. Analysis of covariance structures. In Multivariate Analysis, III,
ed. P. R. Krishnaiah. Academic Press, New York. KAMIN, L. J. 1974. The Science and Politics qf 10... Lawrence Erlbaum Associates, Potomac,
Maryland. KASRIEL, J., AND EAVES, L. J. 1976. The zygosity of twins: further evidence on the agreement
between diagnosis by blood groups and written questionnaires. Journal qf Biosocial Science, 8, 263-266.
KEMPTHORNE, 0., MTD OSB.oRNE, R. H. 1961. The interpretation of twin data. Ann. Human Genet., 13, 320-329.
KLEIN, T. w. 1974. Heritability and genetic correlation: statistical power, population comparisons and sample size. Behavior Genetics, 4, 171-189.
KOCH, HELEN L. 1964. A study of twins born at different levels of maturity. Child Development, 35, 1265-1282.
LANGE, K., WESTLAKE, J., AND SPENCE, M. A. 1976a. Extensions to pedigree analysis. II. Recurrence risk calculation under the polygenic threshold model. Human Heredity, 26,337-348.
LANGE, K., WESTLAKE, J., AND SPENCE, M. A. 1976b. Extensions to pedigree analysis. III. Variance components by the scoring method. Ann. Human Genet. (London), 39,485-491.
LAST, K. A. 1978. Genetical aspects of human behaviour. Ph.D thesis, University of Birmingham.
LAYZER, D. 1974. Heritability analysis ofIQscores: SClence or numerology. Science, 183, 1259-1266.
LILIENFELD, A. 1961. Problems and areas in genetic-epidemiological field studies. Ann. N.T. Acad. Sci., 91, 797-805.
LOEHLIN, J. C., AND NICHOLAS, R. c. 1976. Heredity, Environment and Personality. A study qf 850 sets of Twins. University of Texas Press, Austin and London.
LOEHLIN, J. C., AND VANDENBERG, S. G. 1968. Genetic and environmental components in the covariation of cognitive abilities: an additive model. In Progress in Human Behavior Genetics, ed. S. G. Vandenberg. Johns Hopkins Press, Baltimore, Maryland.
LOOTSMA, F. A. 1972. A survey of methods for solving constrained minimisation problems via unconstrained minimisation, In Numerical Methods for Non-linear Optimisation. Academic Press, London.
LORD, F. M., AND NOVICK, M. R. 1968. Statistical Theories qf Mental Test Scores. AddisonWesley, Reading, Massachusetts.
LYTI'ON, H. 1977. Do parents create or respond to differences in twins? DeTJelopmental Psychology, 13, 456-459.
LYTI'ON, H., CONWAY, D., AND SAUVE, R. 1977. The impact of twinship on parent-child interaction. J. Pers. Soc. Psychol., 35, 97-107.

ANALYSIS OF HUMAN BEHAVIOUR 319
MARTIN, N. G., AND EAVES, L. J. 1977. The genetical analysis of covariance structure. Heredity, 38, 79-95.
MARTIN, N. G., EAVES, L. J., KEARSEY, M. J., AND DAVIES, P. 1978. The power of the classical twin study. Heredity, 40, 97-116.
MARTIN, N. G., AND EYSENCK, H. J. 1976. Genetic factors in sexual behaviour. In Sex and Personality, Chapter 6, H. J. Eysenck. Open Books, London.
MATHENY, A. P. JR., WILSON, R. S., AND DOLAN, A. B. 1976. Relations between twins' similarity , of appearance and behavioural similarity: testing·an assumption. Behavior Genetics, 6,
343-351. MATHER, K., AND JINKS, J. L. 1971. Biometrical Genetics. Chapman and Hall, London. MAYNARD SMITH, J. 1964. Group selection and kin selection. Nature, 201, 1145-1147. MORAN, P. A. P. 1973. A note on heritability and the correlation between relatives. Ann.
Human Genet., 37, 217. . MORTON, N. E. 1969. Segregation analysis. In Computer Applications in Genetics, ed. N. E.
'Morton. University of Hawaii Press, Honolulu. MORTON, N. E. 1976. Heritability of IQ (Letter). Science, 194, 9-10. NANCE, w. E., AND COREY, L. 1976. Genetic models for the analysis of data from the families
of identical twins. Genetics, '83, 811-826. NELDER, J. A., AND WEDDERBURN, R. W. M. 1972. Generalised linear models. J. Roy.
Statist. Soc., A, 135, 370-384. NUMERICAL ALGORITHMS GROUP. 1974. E04HAF, N.A.G. Library Manual, Mark IV.
N.A.G. Central Office, Oxford University, Oxford. PLOMIN, R., WILLERMAN, L., AND LOEHLIN, J. c. 1976. Resemblance in appearance and the
equal environ~ents assumption in twin studies of personality traits. Behavior Genetics, 6,43-52.
PRICE, B. 1950. Primary biases in twin studies: a review of pre-natal and natal differenceproducing factors in monozygotic pairs. Amer. J. Human Genet., 2, 293-352.
RAO, D. c., MORTON, N. E., AND YEE, s. 1974. Analysis of family resemblance. II. A linear model for familial correlation. Amer. J. Human Genet., 26,331-359.
RAO, D. C., MORTON, N. E., AND YEE, s. 1976. Resolution of cultural and biological inheritance by path analysis. Amer. J. Human Genet., 28, 228-242.
RECORD, R. G., MCKEOWN, T., AND EDWARDS, J. H. 1970. An investigation of the difference in measured intelligence between twin and single births. Ann. Human Genet. (London), 34, 11-20.
RUTrER, M., AND MADGE, N. 1976.' Cycles of Disadvantage. Heinemann, London. SCARR, s. 1968. Environmental bias in twin studies. Eugenics Quarterly, 15, 34-40. SCARR, 5., AND WEINBERG, R. A. 1976. IQ test performance of black children adopted by
white families. American Psychologist, 31, 726-739. SHIELDS, J. 1962. Monozygotic Twins: Brought Up Apart and Brought Up Together. Oxford
University Press, London. SLATER, E., AND COWIE, v. 1971. The Genetics of Mental Disorders. Oxford University Press,
Oxford. SMITH, c. 1971. Discriminating between different modes of inheritance in genetic disease.
Clinical Genetics, 2, 303-313. SMITH, R. T. 1965. A comparison of socio-environmental factors in monozygotic and
dizygotic twins, testing an assumption. In Methods and Goals in Human Behavior Genetics, ed. S. G. Vandenberg. Academic Press, New York.
SPENCE, M. A., WESTLAKE, J., AND LANGE, K. 1977. Estimation of variance components for dermal ridge count. Ann. Human Genet., 41, 111-115.
STAFFORD, R. E. 1961. Sex differences in spatial visualisation as evidence of sex-linked inheritance. Perceptual and Motor Skills, 13,428.
TALLIS, G. M. 1962. The maximum likelihood estimation of correlation from contingency tables. Biometrics, 18, 342-353.
TUKEY, J. w. 1951. Components in regression. Biometrics, 7, 33-69. VANDENBERG, s. G. 1965. Multivariate analysis of twin differences. In Methods and Goals
in Human Behavior Genetics, ed. S. G. Vandenberg. Academic Press, New York. VANDENBERG, S. G. 1966. Contributions of twin research to psychology. Psychol. Bull., 66,
327-352. WILSON, E. o. 1975. Sociobiology: The New Synthesis. Harvard University Press, Cambridge,
Massachusetts. WILSON, G. 1975. Manual for the Wilson-Patterson Attitude Inventory. N.F.E.R. Publishing
Co., London.

320 L. J. EAVES, K. A. LAST, P. A. YOUNG, N. G. MAR TIN
wn.sON, R. S., 1970. Blood typing and twin zygosity. Human Heredity, 20, 30-56. wn.sON, R. s. 1972. Twins: early mental development. Science, 175,914-917. YOUNG, P. A. 1977. The causes of differences injuveniJe perso1Ullity. M.Sc. thesis, University of
Birmingham. ZA]ONC, R. B. 1976. Family configuration and intelligence. Science, 192, 227-236. ZUCKERMAN, M. 1971. Dimensions of sensation seeking. J. consult. elin. Psychol., 36, 45-52.
Related Documents