Model-Driven Assessment of Use Cases for Dependable Systems Sadaf Mustafiz, Ximeng Sun, J ¨ org Kienzle, Hans Vangheluwe School of Computer Science, McGill University Montreal, Quebec, Canada {sadaf, xsun16, joerg, hv} @cs.mcgill.ca Abstract. Complex real-time systems need to address dependability require- ments early on in the development process. This paper presents a model-based approach that allows developers to analyze the dependability of use cases and to discover more reliable and safe ways of designing the interactions with the system and the environment. We use a probabilistic extension of statecharts to model the system requirements. The model is then evaluated analytically based on the success and failure probabilities of events. The analysis may lead to further refinement of the use cases by introducing detection and recovery measures to en- sure dependable system interaction. A visual modelling environment for our ex- tended statecharts formalism supporting automatic probability analysis has been implemented in AToM 3 , A Tool for Multi-formalism and Meta-Modelling. Our approach is illustrated with an elevator control system case study. 1 Introduction Complex computer systems are increasingly built for highly critical tasks from military and aerospace domains to industrial and commercial areas. Failures of such systems may have severe consequences ranging from loss of business opportunities, physical damage, to loss of human lives. Systems with such responsibilities should be highly dependable. On the software developer’s part, this involves acknowledging that many exceptional situations may arise during the execution of an application, and providing measures to handle such situations to maintain system reliability and safety. Any such exception that is not identified during requirements elicitation might potentially lead to an incomplete system specification during analysis, and ultimately to an implementation that behaves in an unreliable way. Rigorous requirements elicitation methods such as the exceptional use case approach we proposed in [1] lead the analyst to define handler use cases that address exceptional situations that threaten system reliability and safety. These handler use cases allow exceptional interactions that require several steps of han- dling to be described separately from the normal system behavior. But is it enough to only define handlers for exceptions that can interrupt the normal system functionality? What about exceptions that interrupt the handlers themselves? Do we need handlers for handlers? To answer this question there must be a way to assess the reliability and safety of a system. For this purpose, this paper proposes a model-driven approach for assessing and refining use cases to ensure that the specified functionality meets the dependability

Welcome message from author
This document is posted to help you gain knowledge. Please leave a comment to let me know what you think about it! Share it to your friends and learn new things together.
Transcript

Model-Driven Assessment of Use Casesfor Dependable Systems
Sadaf Mustafiz, Ximeng Sun, Jorg Kienzle, Hans Vangheluwe
School of Computer Science, McGill UniversityMontreal, Quebec, Canada
{sadaf, xsun16, joerg, hv} @cs.mcgill.ca
Abstract. Complex real-time systems need to address dependability require-ments early on in the development process. This paper presents a model-basedapproach that allows developers to analyze the dependability of use cases andto discover more reliable and safe ways of designing the interactions with thesystem and the environment. We use a probabilistic extension of statecharts tomodel the system requirements. The model is then evaluated analytically basedon the success and failure probabilities of events. The analysis may lead to furtherrefinement of the use cases by introducing detection and recovery measures to en-sure dependable system interaction. A visual modelling environment for our ex-tended statecharts formalism supporting automatic probability analysis has beenimplemented in AToM3, A Tool for Multi-formalism and Meta-Modelling. Ourapproach is illustrated with an elevator control system case study.
1 Introduction
Complex computer systems are increasingly built for highly critical tasks from militaryand aerospace domains to industrial and commercial areas. Failures of such systemsmay have severe consequences ranging from loss of business opportunities, physicaldamage, to loss of human lives. Systems with such responsibilities should be highlydependable. On the software developer’s part, this involves acknowledging that manyexceptional situations may arise during the execution of an application, and providingmeasures to handle such situations to maintain system reliability and safety. Any suchexception that is not identified during requirements elicitation might potentially lead toan incomplete system specification during analysis, and ultimately to an implementationthat behaves in an unreliable way. Rigorous requirements elicitation methods such asthe exceptional use case approach we proposed in [1] lead the analyst to define handleruse cases that address exceptional situations that threaten system reliability and safety.These handler use cases allow exceptional interactions that require several steps of han-dling to be described separately from the normal system behavior. But is it enough toonly define handlers for exceptions that can interrupt the normal system functionality?What about exceptions that interrupt the handlers themselves? Do we need handlersfor handlers? To answer this question there must be a way to assess the reliability andsafety of a system.
For this purpose, this paper proposes a model-driven approach for assessing andrefining use cases to ensure that the specified functionality meets the dependability

requirements of the system. To carry out the analysis, the use cases are mapped to DA-Charts, a probabilistic extension of part of the statecharts formalism. The assessment isthen based on a tool that performs probability analysis of the model.
The paper is organized as follows: Section 2 provides background information ondependability, use cases, and the exceptional use cases approach in [1]. Section 3 de-scribes our model-driven process for assessing and refining use cases. Section 4 presentsour probabilistic statecharts formalism used for dependability analysis. Tool supportfor our formalism is discussed in Sect. 5. Section 6 illustrates our proposed process bymeans of an elevator control case study. Section 7 presents related work in this area andSect. 8 discusses future work and draws some conclusions.
2 Background2.1 Dependability
Dependability [2] is that property of a computer system such that reliance can justifi-ably be placed on the service it delivers. It involves satisfying several requirements:availability, reliability, safety, maintainability, confidentiality, and integrity. The de-pendability requirement varies with the target application, since a constraint can beessential for one environment and not so much for others. In this paper, we focus on thereliability and safety attributes of dependability. The reliability of a system measuresits aptitude to provide service and remain operating as long as required [3]. The safetyof a system is determined by the lack of catastrophic failures it undergoes [3].
Fault tolerance is a means of achieving system dependability. As defined in [4],fault tolerance includes error detection and system recovery. At the use case level, errordetection involves detection of exceptional situations by means of secondary actorssuch as sensors and time-outs. Recovery at the use case level involves describing theinteractions with the environment that are needed to continue to deliver the currentservice, or to offer a degraded service, or to take actions that prevent a catastrophe. Theformer two recovery actions increase reliability, whereas the latter ensures safety.
2.2 Use Cases
Use cases are a widely used formalism for discovering and recording behavioral re-quirements of software systems [5]. A use case describes, without revealing the detailsof the system’s internal workings, the system’s responsibilities and its interactions withits environment as it performs work in serving one or more requests that, if success-fully completed, satisfy a goal of a particular stakeholder. The external entities in theenvironment that interact with the system are called actors.
Use cases are stories of actors using a system to meet goals. The actor that wantsto achieve the goal is referred to as the primary actor. Entities that the system needsto fulfill the goal are called secondary actors. Secondary actors include software orhardware that is out of our control. The system, on the other hand, is the software thatwe are developing and which is under our control.
2.3 Exceptions and Handlers in Use Cases
In [1] we proposed an approach that extends traditional use case driven requirementselicitation, leading the analyst to focus on all possible exceptional situations that caninterrupt normal system interaction.
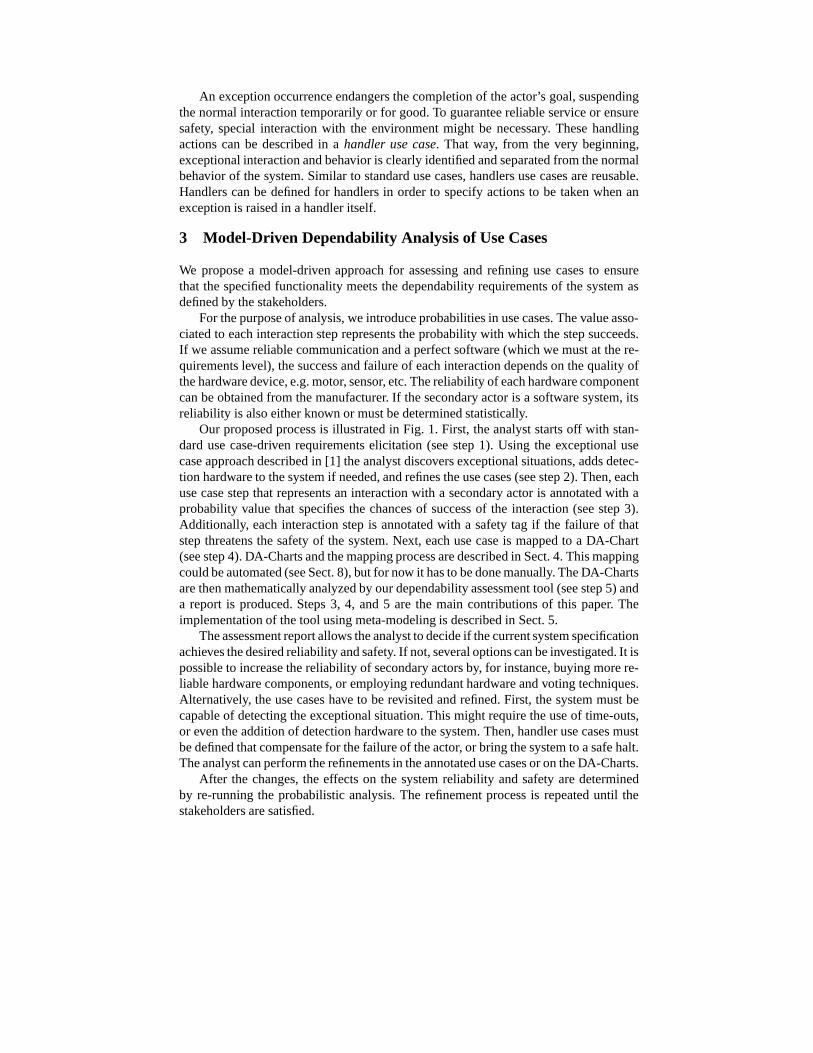
An exception occurrence endangers the completion of the actor’s goal, suspendingthe normal interaction temporarily or for good. To guarantee reliable service or ensuresafety, special interaction with the environment might be necessary. These handlingactions can be described in a handler use case. That way, from the very beginning,exceptional interaction and behavior is clearly identified and separated from the normalbehavior of the system. Similar to standard use cases, handlers use cases are reusable.Handlers can be defined for handlers in order to specify actions to be taken when anexception is raised in a handler itself.
3 Model-Driven Dependability Analysis of Use Cases
We propose a model-driven approach for assessing and refining use cases to ensurethat the specified functionality meets the dependability requirements of the system asdefined by the stakeholders.
For the purpose of analysis, we introduce probabilities in use cases. The value asso-ciated to each interaction step represents the probability with which the step succeeds.If we assume reliable communication and a perfect software (which we must at the re-quirements level), the success and failure of each interaction depends on the quality ofthe hardware device, e.g. motor, sensor, etc. The reliability of each hardware componentcan be obtained from the manufacturer. If the secondary actor is a software system, itsreliability is also either known or must be determined statistically.
Our proposed process is illustrated in Fig. 1. First, the analyst starts off with stan-dard use case-driven requirements elicitation (see step 1). Using the exceptional usecase approach described in [1] the analyst discovers exceptional situations, adds detec-tion hardware to the system if needed, and refines the use cases (see step 2). Then, eachuse case step that represents an interaction with a secondary actor is annotated with aprobability value that specifies the chances of success of the interaction (see step 3).Additionally, each interaction step is annotated with a safety tag if the failure of thatstep threatens the safety of the system. Next, each use case is mapped to a DA-Chart(see step 4). DA-Charts and the mapping process are described in Sect. 4. This mappingcould be automated (see Sect. 8), but for now it has to be done manually. The DA-Chartsare then mathematically analyzed by our dependability assessment tool (see step 5) anda report is produced. Steps 3, 4, and 5 are the main contributions of this paper. Theimplementation of the tool using meta-modeling is described in Sect. 5.
The assessment report allows the analyst to decide if the current system specificationachieves the desired reliability and safety. If not, several options can be investigated. It ispossible to increase the reliability of secondary actors by, for instance, buying more re-liable hardware components, or employing redundant hardware and voting techniques.Alternatively, the use cases have to be revisited and refined. First, the system must becapable of detecting the exceptional situation. This might require the use of time-outs,or even the addition of detection hardware to the system. Then, handler use cases mustbe defined that compensate for the failure of the actor, or bring the system to a safe halt.The analyst can perform the refinements in the annotated use cases or on the DA-Charts.
After the changes, the effects on the system reliability and safety are determinedby re-running the probabilistic analysis. The refinement process is repeated until thestakeholders are satisfied.

Fig. 1. Model-Driven Process for Assessment and Refinement of Use Cases
Elevator System Case Study. We demonstrate our approach by applying it to an el-evator control system case study. An elevator system is a hard real-time applicationrequiring high levels of dependability.
For the sake of simplicity, there is only one elevator cabin that travels between thefloors. The job of the development team is to decide on the required hardware, and toimplement the elevator control software that processes the user requests and coordinatesthe different hardware devices. Initially, only “mandatory” elevator hardware has beenadded to the system: a motor to go up, go down or stop; a cabin door that opens andcloses; floor sensors that detect when the cabin is approaching a floor; two buttons oneach floor to call the elevator; and a series of buttons inside the elevator cabin.
Standard use case-driven requirements elicitation applied to the elevator controlsystem results in the use case model shown in Fig. 2. In the elevator system there isinitially only one primary actor, the User. A user has only one goal with the system: totake the elevator to go to a destination floor. The primary actor (User) is the one thatinitiates the TakeLift use case. All secondary actors (the Door, the Motor, the Exteriorand Interior Floor Buttons, as well as the Floor Sensors) that collaborate to provide theuser goal are also depicted. Due to space constraints, we only discuss the subfunctionlevel use case ElevatorArrival (shown in Fig. 3) in detail.
To ride the elevator the User enters the cabin, selects a destination floor, waits untilthe cabin arrives at the destination floor and finally exits the elevator.
Fig. 2. Standard Elevator Use Case Diagram
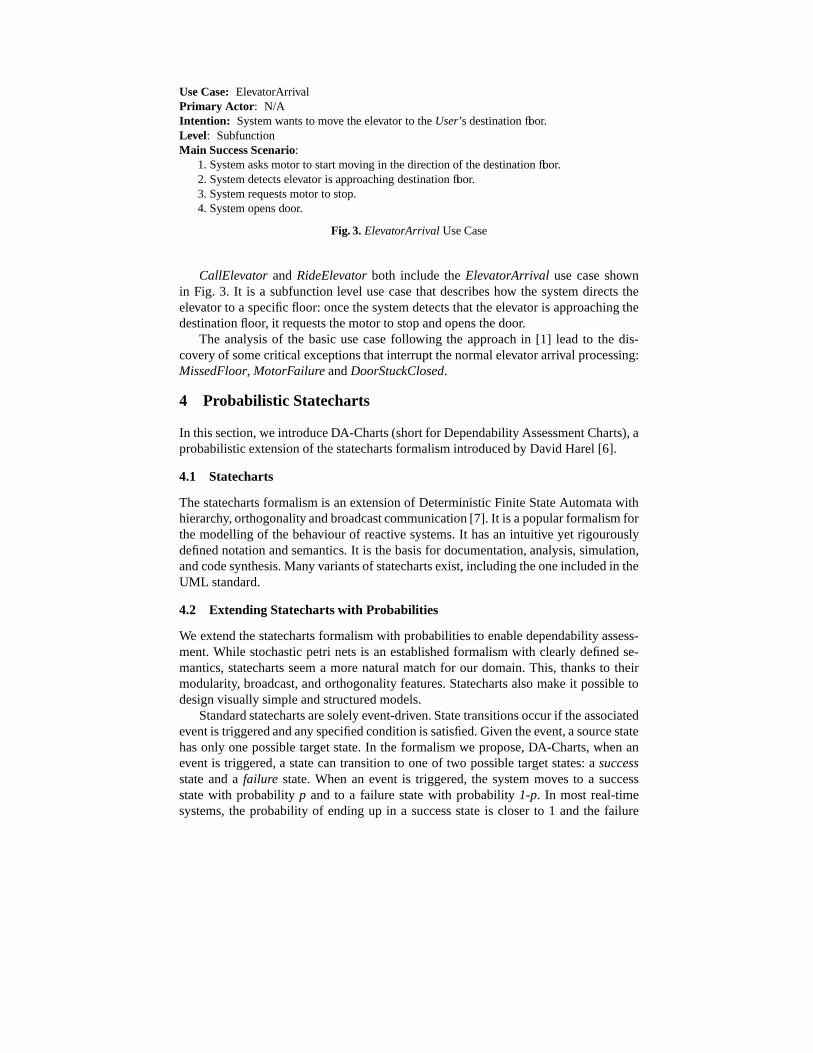
Use Case: ElevatorArrivalPrimary Actor: N/AIntention: System wants to move the elevator to the User’s destination floor.Level: SubfunctionMain Success Scenario:
1. System asks motor to start moving in the direction of the destination floor.2. System detects elevator is approaching destination floor.3. System requests motor to stop.4. System opens door.
Fig. 3. ElevatorArrival Use Case
CallElevator and RideElevator both include the ElevatorArrival use case shownin Fig. 3. It is a subfunction level use case that describes how the system directs theelevator to a specific floor: once the system detects that the elevator is approaching thedestination floor, it requests the motor to stop and opens the door.
The analysis of the basic use case following the approach in [1] lead to the dis-covery of some critical exceptions that interrupt the normal elevator arrival processing:MissedFloor, MotorFailure and DoorStuckClosed.
4 Probabilistic Statecharts
In this section, we introduce DA-Charts (short for Dependability Assessment Charts), aprobabilistic extension of the statecharts formalism introduced by David Harel [6].
4.1 Statecharts
The statecharts formalism is an extension of Deterministic Finite State Automata withhierarchy, orthogonality and broadcast communication [7]. It is a popular formalism forthe modelling of the behaviour of reactive systems. It has an intuitive yet rigourouslydefined notation and semantics. It is the basis for documentation, analysis, simulation,and code synthesis. Many variants of statecharts exist, including the one included in theUML standard.
4.2 Extending Statecharts with Probabilities
We extend the statecharts formalism with probabilities to enable dependability assess-ment. While stochastic petri nets is an established formalism with clearly defined se-mantics, statecharts seem a more natural match for our domain. This, thanks to theirmodularity, broadcast, and orthogonality features. Statecharts also make it possible todesign visually simple and structured models.
Standard statecharts are solely event-driven. State transitions occur if the associatedevent is triggered and any specified condition is satisfied. Given the event, a source statehas only one possible target state. In the formalism we propose, DA-Charts, when anevent is triggered, a state can transition to one of two possible target states: a successstate and a failure state. When an event is triggered, the system moves to a successstate with probability p and to a failure state with probability 1-p. In most real-timesystems, the probability of ending up in a success state is closer to 1 and the failure
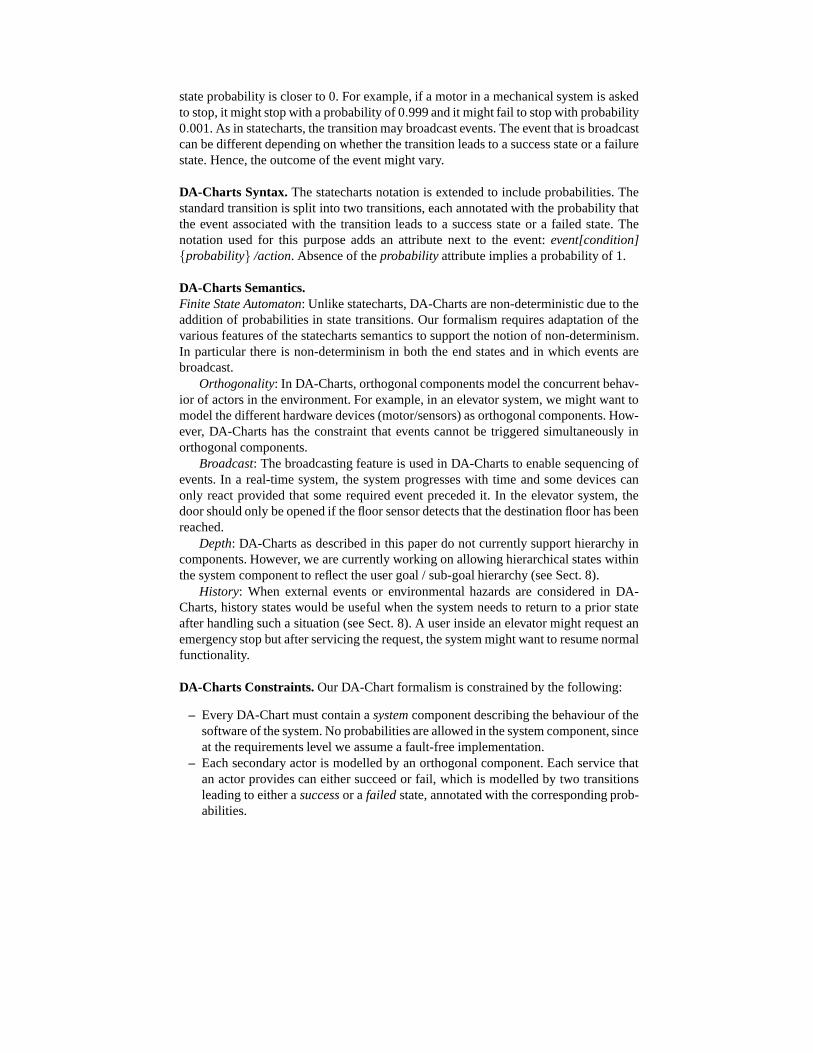
state probability is closer to 0. For example, if a motor in a mechanical system is askedto stop, it might stop with a probability of 0.999 and it might fail to stop with probability0.001. As in statecharts, the transition may broadcast events. The event that is broadcastcan be different depending on whether the transition leads to a success state or a failurestate. Hence, the outcome of the event might vary.
DA-Charts Syntax. The statecharts notation is extended to include probabilities. Thestandard transition is split into two transitions, each annotated with the probability thatthe event associated with the transition leads to a success state or a failed state. Thenotation used for this purpose adds an attribute next to the event: event[condition]{probability} /action. Absence of the probability attribute implies a probability of 1.
DA-Charts Semantics.Finite State Automaton: Unlike statecharts, DA-Charts are non-deterministic due to theaddition of probabilities in state transitions. Our formalism requires adaptation of thevarious features of the statecharts semantics to support the notion of non-determinism.In particular there is non-determinism in both the end states and in which events arebroadcast.
Orthogonality: In DA-Charts, orthogonal components model the concurrent behav-ior of actors in the environment. For example, in an elevator system, we might want tomodel the different hardware devices (motor/sensors) as orthogonal components. How-ever, DA-Charts has the constraint that events cannot be triggered simultaneously inorthogonal components.
Broadcast: The broadcasting feature is used in DA-Charts to enable sequencing ofevents. In a real-time system, the system progresses with time and some devices canonly react provided that some required event preceded it. In the elevator system, thedoor should only be opened if the floor sensor detects that the destination floor has beenreached.
Depth: DA-Charts as described in this paper do not currently support hierarchy incomponents. However, we are currently working on allowing hierarchical states withinthe system component to reflect the user goal / sub-goal hierarchy (see Sect. 8).
History: When external events or environmental hazards are considered in DA-Charts, history states would be useful when the system needs to return to a prior stateafter handling such a situation (see Sect. 8). A user inside an elevator might request anemergency stop but after servicing the request, the system might want to resume normalfunctionality.
DA-Charts Constraints. Our DA-Chart formalism is constrained by the following:
– Every DA-Chart must contain a system component describing the behaviour of thesoftware of the system. No probabilities are allowed in the system component, sinceat the requirements level we assume a fault-free implementation.
– Each secondary actor is modelled by an orthogonal component. Each service thatan actor provides can either succeed or fail, which is modelled by two transitionsleading to either a success or a failed state, annotated with the corresponding prob-abilities.
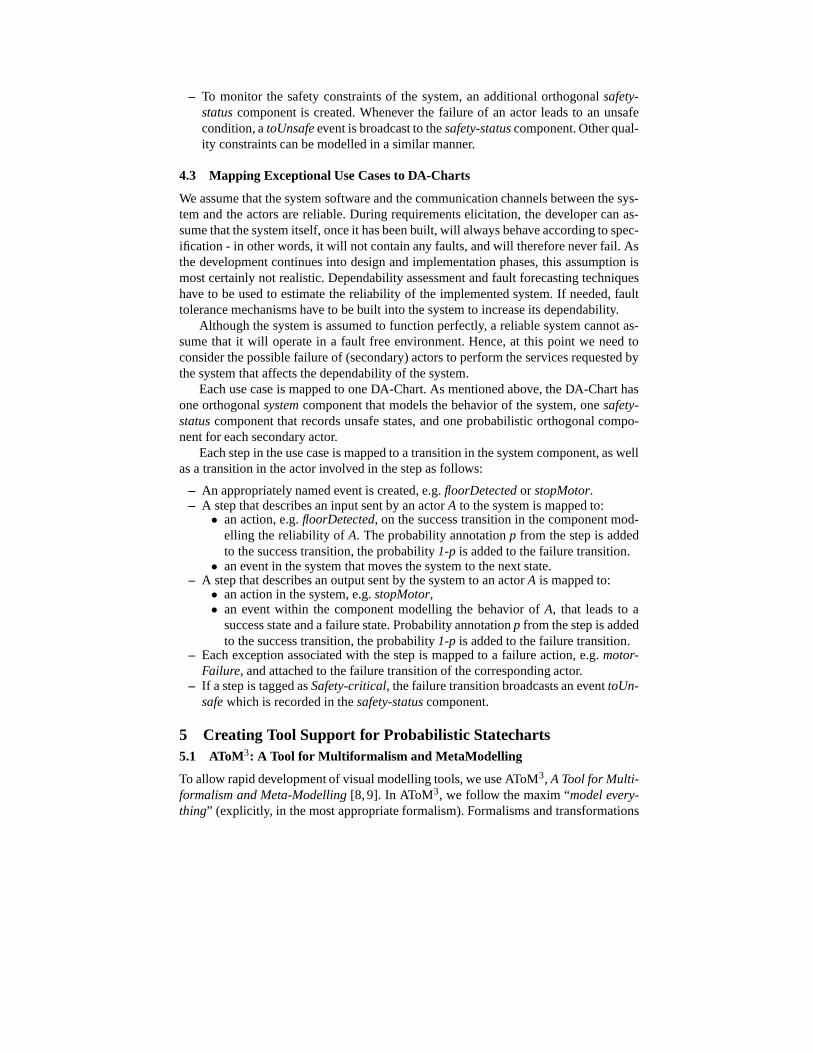
– To monitor the safety constraints of the system, an additional orthogonal safety-status component is created. Whenever the failure of an actor leads to an unsafecondition, a toUnsafe event is broadcast to the safety-status component. Other qual-ity constraints can be modelled in a similar manner.
4.3 Mapping Exceptional Use Cases to DA-Charts
We assume that the system software and the communication channels between the sys-tem and the actors are reliable. During requirements elicitation, the developer can as-sume that the system itself, once it has been built, will always behave according to spec-ification - in other words, it will not contain any faults, and will therefore never fail. Asthe development continues into design and implementation phases, this assumption ismost certainly not realistic. Dependability assessment and fault forecasting techniqueshave to be used to estimate the reliability of the implemented system. If needed, faulttolerance mechanisms have to be built into the system to increase its dependability.
Although the system is assumed to function perfectly, a reliable system cannot as-sume that it will operate in a fault free environment. Hence, at this point we need toconsider the possible failure of (secondary) actors to perform the services requested bythe system that affects the dependability of the system.
Each use case is mapped to one DA-Chart. As mentioned above, the DA-Chart hasone orthogonal system component that models the behavior of the system, one safety-status component that records unsafe states, and one probabilistic orthogonal compo-nent for each secondary actor.
Each step in the use case is mapped to a transition in the system component, as wellas a transition in the actor involved in the step as follows:
– An appropriately named event is created, e.g. floorDetected or stopMotor.– A step that describes an input sent by an actor A to the system is mapped to:
• an action, e.g. floorDetected, on the success transition in the component mod-elling the reliability of A. The probability annotation p from the step is addedto the success transition, the probability 1-p is added to the failure transition.
• an event in the system that moves the system to the next state.– A step that describes an output sent by the system to an actor A is mapped to:
• an action in the system, e.g. stopMotor,• an event within the component modelling the behavior of A, that leads to a
success state and a failure state. Probability annotation p from the step is addedto the success transition, the probability 1-p is added to the failure transition.
– Each exception associated with the step is mapped to a failure action, e.g. motor-Failure, and attached to the failure transition of the corresponding actor.
– If a step is tagged as Safety-critical, the failure transition broadcasts an event toUn-safe which is recorded in the safety-status component.
5 Creating Tool Support for Probabilistic Statecharts5.1 AToM3: A Tool for Multiformalism and MetaModelling
To allow rapid development of visual modelling tools, we use AToM3, A Tool for Multi-formalism and Meta-Modelling [8, 9]. In AToM3, we follow the maxim “model every-thing” (explicitly, in the most appropriate formalism). Formalisms and transformations

are modelled using meta-models and graph grammar models respectively. Also, com-posite types and the user interfaces of the generated tools are modelled explicitly. Thetool has proven to be very powerful, allowing the meta-modelling of known formalismssuch as Petri Nets [10]. More importantly, many new formalisms were constructed us-ing the tool, such as the Traffic formalism [11].
5.2 DA-Charts Implementation in AToM3
DA-Charts is a simple extension of the statechart syntax: a simple edge is extendedby adding a probability attribute which becomes a P-Edge, so the action and the targetdepend on the outcome of a probabilistic experiment. A traditional edge can be seen asa P-Edge whose probability is 1.
We implement tool support for DA-Charts by extending the meta-model of theDCharts formalism (a variant of Statecharts) described in [12]. This is done in threesteps as follows. First, probability is added as a float attribute to the Hyperedge re-lationship of the existing DCharts meta-model (an Entity-Relationship diagram). Thedefault value of probability is 1. Two constraints are added. One constraint allows usersto only set the probability of a transition to a maximum of 1; the other one checks if thetotal probability of all transitions from the same source node and triggered by the sameevent is 1. AToM3 allows for the subsequent synthesis of a visual DA-Charts modellingenvironment from this meta-model. Second, a Probability Analysis (PA) module whichcan compute probabilities of reaching a target state is implemented. The algorithm isdescribed in the next section. Lastly, a button which invokes the PA module is added tothe visual modelling environment.
The semantics of a DA-Chart are described informally as follows. When an eventoccurs, all P-Edges which are triggered by the event and whose guards hold are taken.The system then leaves the source node(s), chooses one of those P-Edges probabilisti-cally, executes the action of the chosen P-Edge, and enters the target node(s).
5.3 Probability Analysis of DA-Charts in AToM3
Given a source state (consisting of a tuple of source nodes) and a target state, the proba-bility to reach the target from the source is computed by finding all paths that lead fromthe source to the target state. The probability of each path is calculated as the prod-uct of all transition probabilities. The total probability is then computed by adding theprobabilities of all paths.
A probabilistic analysis algorithm based on the above observations has been imple-mented in AToM3. It reads three arguments, model M containing all elements, such ascomponents, nodes and edges, a tuple of node names of the source state S, and a tupleof node names of the target state T. It then produces a float value in the range [0,1]. Thedetails of the algorithm are omitted here for space reasons.
An analyst wanting to compute, for instance, the reliability of the system has tofirst press the PA button, and then select the target state that symbolizes the successfulcompletion of the goal, after which a pop-up dialog shows the result and all possiblepaths leading to the target state are highlighted in the model.
Fig. 4 shows an example DA-Chart model in AToM3. The model consists of threecomponents: System, D1 and D2. The default state is (s5, s1, s8) and the only transition
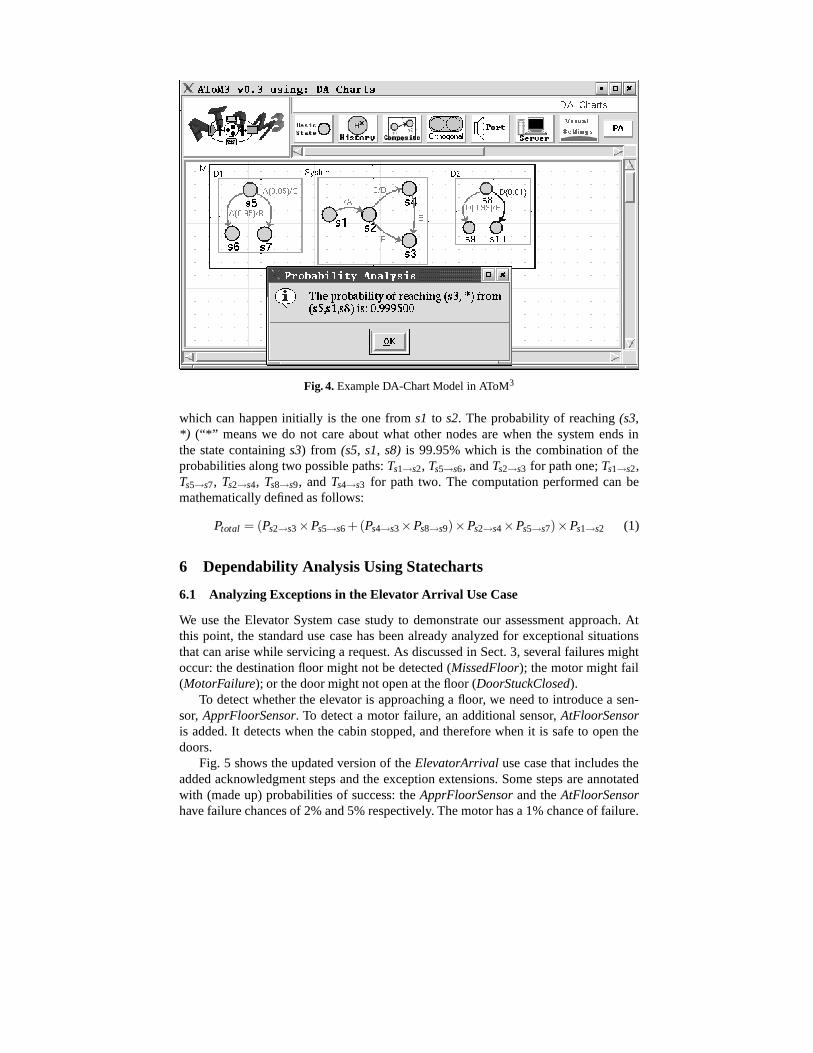
Fig. 4. Example DA-Chart Model in AToM3
which can happen initially is the one from s1 to s2. The probability of reaching (s3,*) (“*” means we do not care about what other nodes are when the system ends inthe state containing s3) from (s5, s1, s8) is 99.95% which is the combination of theprobabilities along two possible paths: Ts1→s2, Ts5→s6, and Ts2→s3 for path one; Ts1→s2,Ts5→s7, Ts2→s4, Ts8→s9, and Ts4→s3 for path two. The computation performed can bemathematically defined as follows:
Ptotal = (Ps2→s3 ×Ps5→s6 +(Ps4→s3×Ps8→s9)×Ps2→s4×Ps5→s7)×Ps1→s2 (1)
6 Dependability Analysis Using Statecharts
6.1 Analyzing Exceptions in the Elevator Arrival Use Case
We use the Elevator System case study to demonstrate our assessment approach. Atthis point, the standard use case has been already analyzed for exceptional situationsthat can arise while servicing a request. As discussed in Sect. 3, several failures mightoccur: the destination floor might not be detected (MissedFloor); the motor might fail(MotorFailure); or the door might not open at the floor (DoorStuckClosed).
To detect whether the elevator is approaching a floor, we need to introduce a sen-sor, ApprFloorSensor. To detect a motor failure, an additional sensor, AtFloorSensoris added. It detects when the cabin stopped, and therefore when it is safe to open thedoors.
Fig. 5 shows the updated version of the ElevatorArrival use case that includes theadded acknowledgment steps and the exception extensions. Some steps are annotatedwith (made up) probabilities of success: the ApprFloorSensor and the AtFloorSensorhave failure chances of 2% and 5% respectively. The motor has a 1% chance of failure.

Use Case: ElevatorArrivalIntention: System wants to move the elevator to the User’s destination floor.Level: SubfunctionMain Success Scenario:
1. System asks motor to start moving towards the destination floor.2. System detects elevator is approaching destination floor. Reliability:0.98 Safety-critical3. System requests motor to stop. Reliability:0.99 Safety-critical4. System receives confirmation elevator is stopped at destination floor. Reliability:0.955. System requests door to open.6. System receives confirmation that door is open.
Extensions:2a. Exception{MissedFloor}4a. Exception{MotorFailure}6a. Exception{DoorStuckClosed}
Fig. 5. Updated ElevatorArrival Use Case
For space reasons, we assume that the motor always starts and the door always opens.In addition, each step is tagged as Safety-critical if the failure of that step threatens thesystem safety.
6.2 The DA-Charts Model of the Basic Elevator Arrival System with Failures
We first model the initial ElevatorArrival use case shown in Sect. 6.1 as a DA-Chart ac-cording to the process described in Sect. 4.3. The result is shown in Fig. 6. The modelconsists mainly of four orthogonal components which model the behaviour of the sys-tem (System), a motor (Motor), and two sensors (ApprFloorSensor and AtFloorSen-sor). An additional orthogonal component is used to monitor the safety outcome of thesystem. Note that the system has no randomness.
To clarify the model, one of the components is briefly explained here. The Mo-tor is initially ready (in the mtr ready state). After it is triggered by the System (bythe start event), it acknowledges the System’s request (by broadcasting startAck) andgoes into running mode (by transitioning to the mtr started state). When the motor isasked to stop (by the stop event), the Motor will either stop itself successfully (goingto mtr stopped) and send an acknowledgement (by broadcasting stopAck), or fail tostop (going to mtr failed and broadcasting motorFailure and toUnsafe). The chances ofsuccess and failure are 99% and 1% respectively.
6.3 Evaluating Dependability of the System
Safety Analysis. We want to ensure the safety levels maintained by the elevator arrivalsystem. The system is unsafe if the approaching floor sensor fails to detect the destina-tion floor (because then the system never tells the motor to stop), or if the motor failsto stop when told to do so. This is why the failure transition in the ApprFloorSensorcomponent, as well as the failure transition in the Motor component broadcast a toUn-safe event that is recorded in the Status component. It is interesting to note that actuallyachieving the goal of the use case has nothing to do with safety. Our tool then calculatesthat the probability of reaching the state safe from the initial system state (sys ready) is97.02%, which is the combination of the probabilities along two possible paths.

Elevator_I
mtr_ready
mtr_started
mtr_stoppedmtr_failed
sys_ready
sys_started
sys_stopped
goalSuccess
apFlrSnsr_ready
apFlrSnsr_ack
sys_missed_floor
goalFailure
apFlrSnsr_failed
atFlrSnsr_ready
atFlrSnsr_ack atFlrSnsr_failedsafe
normal
unsafe
Motor System ApprFloorSensor
AtFloorSensor
Status
startAck{0.98}/apFlrSnsrD
stopAck{0.05}/atFlrSnsrFailure;toSafeatFlrSnsrFailure
/startstart/startAck
stop{0.99}/stopAckapFlrSnsrDetected/stop
stop{0.01}/motorFailure;toUnsafe
startAck{0.02}/missedFloor;toUnsafe
floorReached/openDoor
toUnsafe
toSafe
missedFloor
motorFailure stopAck{0.95}/floorReached;toSafe
Fig. 6. DA-Chart Model of the Elevator Arrival Use Case with Failures
Reliability Analysis. Our tool calculates a reliability (probability of reaching the goal-Success state) of 92.169%. Although we assume that the door is 100% reliable, a failureof the AtFloorSensor would prevent the system from knowing that the destination flooris reached, and hence the system cannot request the door to open. The person riding theelevator would be stuck inside the cabin, and hence the goal fails.
6.4 Refining the Elevator Arrival Use Case
For a safety-critical system like the elevator control system, a higher level of safetyis desirable. Safety can be increased by using more reliable or replicated hardware,but such hardware might not be available or might be too costly. Another possibilityis to initiate an action that can prevent catastrophes from happening. To illustrate thisapproach, we focus on the motor failure problem. To remain in a safe state even if themotor fails, it is necessary to use additional hardware like an emergency brake. Thisbehavior is encapsulated in the EmergencyBrake safety handler (shown in Fig. 7).
6.5 The DA-Charts Model of the Safety-Enhanced Elevator Arrival Use Case
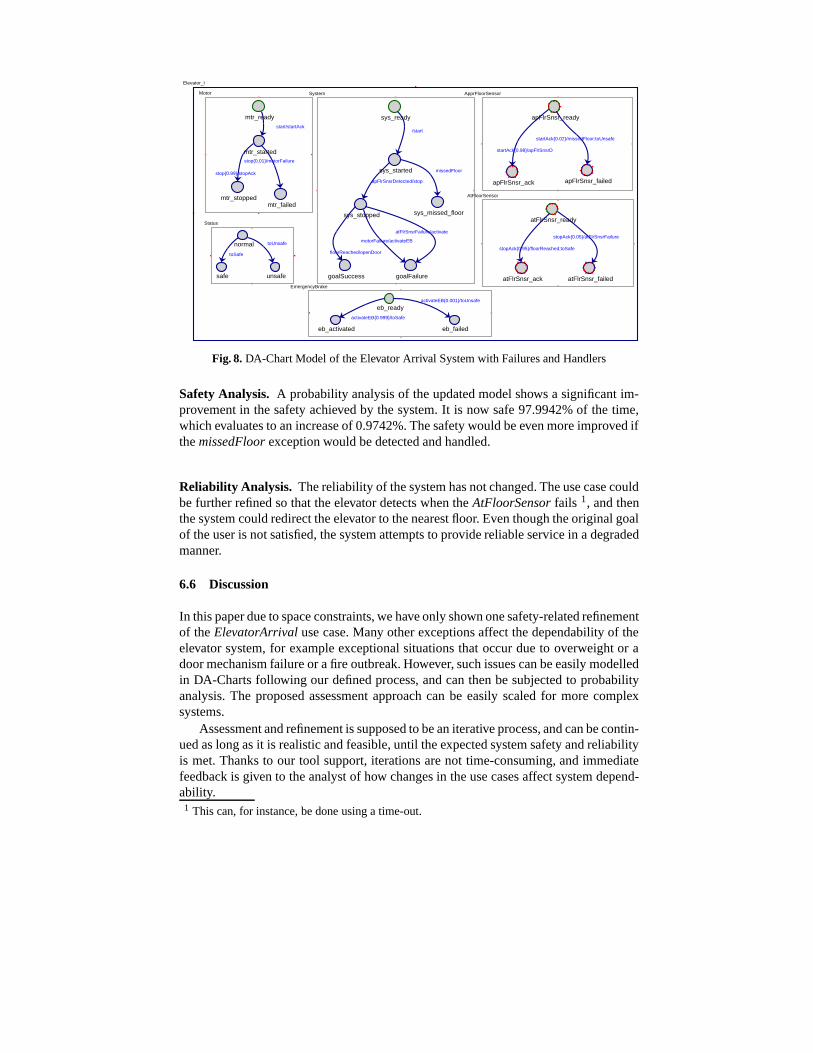
The DA-Chart model of the elevator arrival system is updated to reflect the use of emer-gency brakes (see Fig. 8). Another orthogonal component to model the behaviour of theemergency brakes is added. The brake used has a 99.9% chance of success.
Handler Use Case: EmergencyBrakeHandler Class: SafetyContext & Exception: ElevatorArrival{MotorFailure}Intention: System wants to stop operation of elevator and secure the cabin.Level: SubfunctionMain Success Scenario:
1. System stops motor.2. System activates the emergency brakes. Reliability:0.999 Safety-critical3. System turns on the emergency display.
Fig. 7. EmergencyBrake Handler Use Case
Elevator_I
mtr_ready
mtr_started
mtr_stoppedmtr_failed
sys_ready
sys_started
sys_stopped
goalSuccess
apFlrSnsr_ready
apFlrSnsr_ack
sys_missed_floor
goalFailure
apFlrSnsr_failed
atFlrSnsr_ready
atFlrSnsr_ack atFlrSnsr_failedsafe
normal
unsafe
eb_ready
eb_activated eb_failed
Motor System ApprFloorSensor
AtFloorSensor
Status
EmergencyBrake
floorReached/openDoor
start/startAck
missedFloor
apFlrSnsrDetected/stop
startAck{0.02}/missedFloor;toUnsafe
stopAck{0.05}/atFlrSnsrFailure
toSafe
activateEB{0.999}/toSafe
stop{0.01}/motorFailure
/start
stop{0.99}/stopAck
toUnsafe
atFlrSnsrFailure/activate
motorFailure/activateEB
activateEB{0.001}/toUnsafe
stopAck{0.95}/floorReached;toSafe
startAck{0.98}/apFlrSnsrD
Fig. 8. DA-Chart Model of the Elevator Arrival System with Failures and Handlers
Safety Analysis. A probability analysis of the updated model shows a significant im-provement in the safety achieved by the system. It is now safe 97.9942% of the time,which evaluates to an increase of 0.9742%. The safety would be even more improved ifthe missedFloor exception would be detected and handled.
Reliability Analysis. The reliability of the system has not changed. The use case couldbe further refined so that the elevator detects when the AtFloorSensor fails 1, and thenthe system could redirect the elevator to the nearest floor. Even though the original goalof the user is not satisfied, the system attempts to provide reliable service in a degradedmanner.
6.6 Discussion
In this paper due to space constraints, we have only shown one safety-related refinementof the ElevatorArrival use case. Many other exceptions affect the dependability of theelevator system, for example exceptional situations that occur due to overweight or adoor mechanism failure or a fire outbreak. However, such issues can be easily modelledin DA-Charts following our defined process, and can then be subjected to probabilityanalysis. The proposed assessment approach can be easily scaled for more complexsystems.
Assessment and refinement is supposed to be an iterative process, and can be contin-ued as long as it is realistic and feasible, until the expected system safety and reliabilityis met. Thanks to our tool support, iterations are not time-consuming, and immediatefeedback is given to the analyst of how changes in the use cases affect system depend-ability.
1 This can, for instance, be done using a time-out.

7 Related Work
Research has been carried out on analyzing quality of requirements mostly using for-mal requirements specification, that is, requirements written in specification languages,and model checking techniques. Bianco et al. [13] presents an approach for reasoningabout reliability and performance of probabilistic and nondeterministic systems usingtemporal logics for formal specification of system properties and model-checking algo-rithms for verifying that the system satisfies the specification. Automatic verification ofprobabilistic systems using techniques of model checking are also covered in [14].
Atlee et al. [15] demonstrates a model-checking technique used to verify safetyproperties of event-driven systems. The formal requirements are transformed to state-based structures, and then analyzed using a state-based model checker.
Huszerl et al. [16] describes a quantitative dependability analysis approach targetingembedded systems. The system behaviour is specified with guarded statechart modelsand then mapped to timed, stochastic petri nets to carry out performance evaluation.
Jansen et al. [17] proposed a probabilistic extension to statecharts, P-Statecharts,similar to our DA-Charts formalism to aid in formal verification of probabilistic tempo-ral properties. The probability concept in P-Statecharts has two facets: environmentalrandomness and system randomness. In our work, we focus on dependable systems inwhich randomness only comes from the environment the system is exposed to, ratherthan from the system itself. Unlike their formalism, DA-Charts allows different actionsto be taken (events to be broadcasted) depending on the probabilistically chosen targetstate, not just on the event which initiates the transition. Based on the work in [17],they later proposed the StoCharts approach [18] which extends UML-statecharts withprobabilities and stochastic timing features to allow for QoS modelling and analysis.
Vijaykumar et al. [19] proposed using a probabilistic statechart-based formalism torepresent performance models. The model specified using statecharts is used to generatea Markov chain from which steady-state probabilities are obtained. Their approach isconcerned with evaluating general performance of models, such as system productivity.
Blum et al. [20] presents the System Availability Estimator (SAVE) package thatis used to build and analyze models to enable prediction of dependability constraints.A SAVE model is constructed as a collection of components, each of which can besubject to failure and repair. The high-level model is then automatically transformed toa Markov chain model.
Bavuso et al. [21] introduce the Hybrid Automated Reliability Predictor (HARP)tool developed for prediction of reliability and availability of fault-tolerant architec-tures. It is Markov model-based, and provides support for coverage modelling and au-tomatic conversion of fault trees to Markov models.
Our approach is different in the sense that we begin with informal requirementsspecification, namely use cases, apply a model-driven process to map the requirementsto statecharts to evaluate the safety and reliability achieved by the system, followedby revisiting and refining the use cases if necessary. Developers do not require ex-pertise in specification languages to determine the quality of their requirements. Also,communicating with end-users is simpler with use cases. The probability analysis iscompletely automated and allows quick generation of dependability-related statistics.Our model-based assessment is similar to model-checking since we attempt to verify

that dependability constraints hold. However, the goal of our work is to evaluate andrefine the requirements of the system, and model analysis is carried out only to servethis purpose.
8 Conclusion and Future Work
We have proposed a model-based approach for analyzing the safety and reliability ofrequirements based on use cases. The contribution mainly lies in the combined useof exceptional use cases, probabilities, statecharts, and dependability analysis means.Each interaction step in a use case is annotated with a probability reflecting its chancesof success, and a safety tag if the failure of the step hampers the system safety. The usecases are then mapped to DA-Charts, a probabilistic extension of the statechart model.Precise mapping rules have been suggested. We have implemented our formalism inthe AToM3 tool to provide support for automatic dependability analysis. The tool alsoverifies the formalism constraints and ensures that the mapping rules are adhered to.Based on path analysis, the tool quantitatively determines probabilities of reaching safeor unsafe states. The assessment allows the analyst to decide if the dependability con-straints of the system are met. If not, the use cases have to be refined. This impliesintroducing additional interaction steps, discovering exceptions and applying handlersthat dictate the system behavior in such situations [1]. At each refinement step, our toolprovides immediate feedback to the analyst on the impact of the changes on systemdependability.
Based on our dependability focused use cases, a specification that considers all ex-ceptional situations and user expectations can be elaborated during a subsequent analy-sis phase. This specification can then be used to decide on the need for employing faultmasking and fault tolerance techniques when designing the software architecture andduring detailed design of the system.
So far, our assessment technique only considers exceptions that threaten the relia-bility and safety of the system. In the future, we want to extend our approach to alsobe able to handle exceptions in the environment that change user goals. For instance,a person riding an elevator might feel unsafe and request an emergency stop. Oncethe situation is resolved, normal service should continue where it was interrupted. Tomodel such a situation, we are currently working on integrating hierarchy and historyinto DA-Charts.
We also aim to automate the process of mapping use cases to DA-Charts (and vice-versa). This would be a highly desirable feature, ultimately allowing developers to workwith the model (use cases or statecharts, or maybe even sequence diagrams) that bestsuits them. Our tool can then ensure that all representations are consistently updated.Any changes made to one model would automatically be reflected in the other models.
Finally, we intend to extend our process to address other dependability constraintslike availability, timeliness, and usability.
References
1. Shui, A., Mustafiz, S., Kienzle, J., Dony, C.: Exceptional use cases. In Briand, L.C.,Williams, C., eds.: MoDELS. Volume 3713 of Lecture Notes in Computer Science., Springer(2005) 568–583

2. Laprie, J.C., Avizienis, A., Kopetz, H., eds.: Dependability: Basic Concepts and Terminol-ogy. Springer-Verlag New York, Inc., Secaucus, NJ, USA (1992)
3. Geffroy, J.C., Motet, G.: Design of Dependable Computing Systems. Kluwer AcademicPublishers (2002)
4. Avizienis, A., Laprie, J., Randell, B.: Fundamental concepts of dependability (2001)5. Larman, C.: Applying UML and Patterns: An Introduction to Object-Oriented Analysis and
Design and the Unified Process. 2nd edn. Prentice Hall (2002)6. Harel, D.: Statecharts: A visual formalism for complex systems. Science of Computer
Programming 8(3) (1987) 231–2747. Harel, D.: On visual formalisms. Communications of the ACM 31(5) (1988) 514–5308. de Lara, J., Vangheluwe, H.: Defining visual notations and their manipulation through meta-
modelling and graph transformation. Journal of Visual Languages and Computing 15(3 - 4)(2004) 309–330 Special Issue on Domain-Specific Modeling with Visual Languages.
9. de Lara, J., Vangheluwe, H.: AToM3: A tool for multi-formalism and meta-modelling. In:ETAPS, FASE. LNCS 2306, Springer (2002) 174 – 188 Grenoble, France.
10. de Lara, J., Vangheluwe, H.: Computer aided multi-paradigm modelling to process petri-netsand statecharts. In: International Conference on Graph Transformations (ICGT). Volume2505 of Lecture Notes in Computer Science., Springer (2002) 239–253 Barcelona, Spain.
11. Juan de Lara, H.V., Mosterman, P.J.: Modelling and analysis of traffic networks based ongraph transformation. Formal Methods for Automation and Safety in Railway and Automo-tive Systems (December 2004. Braunschweig, Germany) 11
12. Feng, T.H.: DCharts, a formalism for modeling and simulation based design of reactivesoftware systems. M.Sc. dissertation, School of Computer Science, McGill University (2004)
13. Bianco, A., de Alfaro, L.: Model checking of probabalistic and nondeterministic systems.In Thiagarajan, P.S., ed.: FSTTCS. Volume 1026 of Lecture Notes in Computer Science.,Springer (1995) 499–513
14. Hinton, A., Kwiatkowska, M., Norman, G., Parker, D.: PRISM: A tool for automatic verifi-cation of probabilistic systems. In: Proc. 12th International Conference on Tools and Algo-rithms for the Construction and Analysis of Systems (TACAS’06). (2006) To appear.
15. Atlee, J.M., Gannon, J.: State-based model checking of event-driven system requirements.IEEE Transactions on Software Engineering 19(1) (1993) 24–40 Special Issue on Softwarefor Critical Systems.
16. Huszerl, G., Majzik, I., Pataricza, A., Kosmidis, K., Cin, M.D.: Quantitative analysis ofUML statechart models of dependable systems. Comput. J 45(3) (2002) 260–277
17. Jansen, D.N., Hermanns, H., Katoen, J.P.: A probabilistic extension of uml statecharts: spec-ification and verification. In Damm, W., Olderog, E.R., eds.: Formal techniques in real-timeand fault-tolerant systems: FTRTFT. Volume 2469 of Lecture Notes in Computer Science.,Berlin, Germany, Springer (2002) 355–374
18. Jansen, D.N., Hermanns, H.: QoS modelling and analysis with UML-statecharts: thestocharts approach. SIGMETRICS Performance Evaluation Review 32(4) (2005) 28–33
19. Vijaykumar, N.L., de Carvalho, S.V., de Andrade, V.M.B., Abdurahiman, V.: Introducingprobabilities in statecharts to specify reactive systems for performance analysis. Computers& OR 33 (2006) 2369–2386
20. Blum, A.M., Goyal, A., Heidelberger, P., Lavenberg, S.S., Nakayama, M.K., Shahabuddin,P.: Modeling and analysis of system dependability using the system availability estimator.In: FTCS. (1994) 137–141
21. Bavuso, S., Dugan, J.B., Trivedi, K.S., Rothmann, B., Smith, E.: Analysis of typical fault-tolerant architectures using HARP. IEEE Transactions on Reliability (1987)
Related Documents