Model Complexes of Cytochrome P450 Nitric Oxide Reductase by Lauren E. Goodrich A dissertation submitted in partial fulfillment of the requirements for the degree of Doctor of Philosophy (Chemistry) in The University of Michigan 2012 Doctoral Committee: Associate Professor Nicolai Lehnert, Chair Professor Mark M. Banaszak Holl Assistant Professor Mi Hee Lim Professor Yoichi Osawa

Welcome message from author
This document is posted to help you gain knowledge. Please leave a comment to let me know what you think about it! Share it to your friends and learn new things together.
Transcript
Model Complexes of Cytochrome P450 Nitric Oxide Reductase
by
Lauren E. Goodrich
A dissertation submitted in partial fulfillment of the requirements for the degree of
Doctor of Philosophy (Chemistry)
in The University of Michigan 2012
Doctoral Committee: Associate Professor Nicolai Lehnert, Chair Professor Mark M. Banaszak Holl
Assistant Professor Mi Hee Lim Professor Yoichi Osawa

© Lauren E. Goodrich
2012
ii
To my grandparents:
Vern and Thelma Meyer
Jack and Audrey Goodrich
Claire VanZant

iii
Acknowledgements
The Lehnert Group, thanks for all the laughs over the years. Don’t forget: 6pm on
Friday is quitting time! Nicolai, your mentorship has been invaluable. I think you are
teaching us to be the right kind of scientists. Thanks for always pushing us and
expecting our best. Your patience is something I still aspire to.
Mom and Dad, thank you for all the encouragement over the years. I love you! You
taught me to believe in myself. Because of your support I have always thought that I
can accomplish anything I put my mind to—that is priceless. To all five of my
grandparents, I could not ask for a more extraordinary family. Your enthusiasm for
life is beyond inspiring.
Tim, I love you and could not have made it through this process without your
unwavering support and friendship. Here’s to new adventures and many more years
of laughter!
iv
Table of Contents
Dedication ................................................................................................................. ii
Acknowledgements ................................................................................................... iii
List of Tables ............................................................................................................. vi
List of Figures ............................................................................................................ ix
List of Schemes ....................................................................................................... xix
Abstract ................................................................................................................... xxi
Chapter 1 .................................................................................................................. 1
Introduction ....................................................................................................... 1
1.1. Nitric Oxide Biosynthesis and Sensing ........................................................ 1
1.2. Detoxification of NO in Biological Systems .................................................. 2
1.3. Fungal NO Reductase (P450nor) ................................................................ 4
1.4. Scope of Thesis ........................................................................................ 23
Chapter 2 ............................................................................................................... 32
Six-Coordinate Ferric Porphyrin Nitrosyl Complexes .................................. 32
2.1. Ferric Heme-Nitrosyls with Thiolate Coordination ..................................... 34
2.2. The Phenolate Ligand: A More Stable Alternative to Thiolate Ligation in
Ferric Heme-Nitrosyls? ............................................................................. 60
2.3. The Effect of Axial Ligand Strength in Ferric Heme-Nitrosyls .................... 69
v
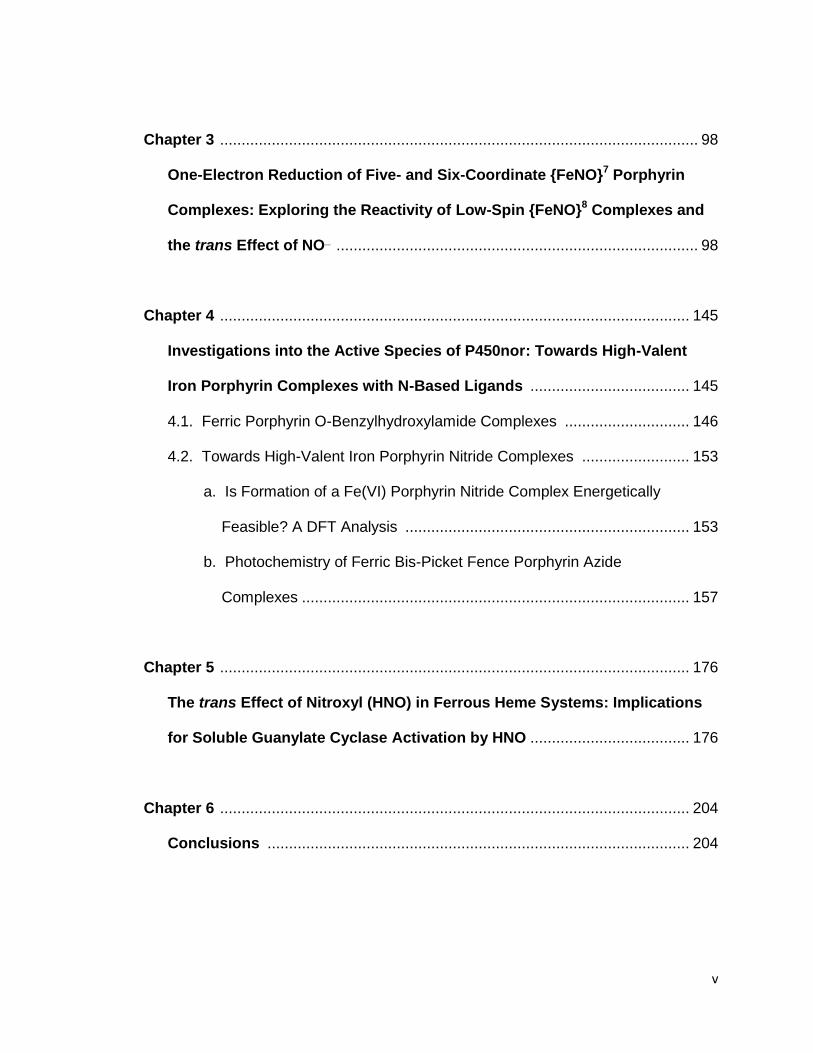
Chapter 3 ............................................................................................................... 98
One-Electron Reduction of Five- and Six-Coordinate {FeNO}7 Porphyrin
Complexes: Exploring the Reactivity of Low-Spin {FeNO}8 Complexes and
the trans Effect of NO¯ .................................................................................... 98
Chapter 4 ............................................................................................................. 145
Investigations into the Active Species of P450nor: Towards High-Valent
Iron Porphyrin Complexes with N-Based Ligands ..................................... 145
4.1. Ferric Porphyrin O-Benzylhydroxylamide Complexes ............................. 146
4.2. Towards High-Valent Iron Porphyrin Nitride Complexes ......................... 153
a. Is Formation of a Fe(VI) Porphyrin Nitride Complex Energetically
Feasible? A DFT Analysis .................................................................. 153
b. Photochemistry of Ferric Bis-Picket Fence Porphyrin Azide
Complexes .......................................................................................... 157
Chapter 5 ............................................................................................................. 176
The trans Effect of Nitroxyl (HNO) in Ferrous Heme Systems: Implications
for Soluble Guanylate Cyclase Activation by HNO ..................................... 176
Chapter 6 ............................................................................................................. 204
Conclusions .................................................................................................. 204
vi
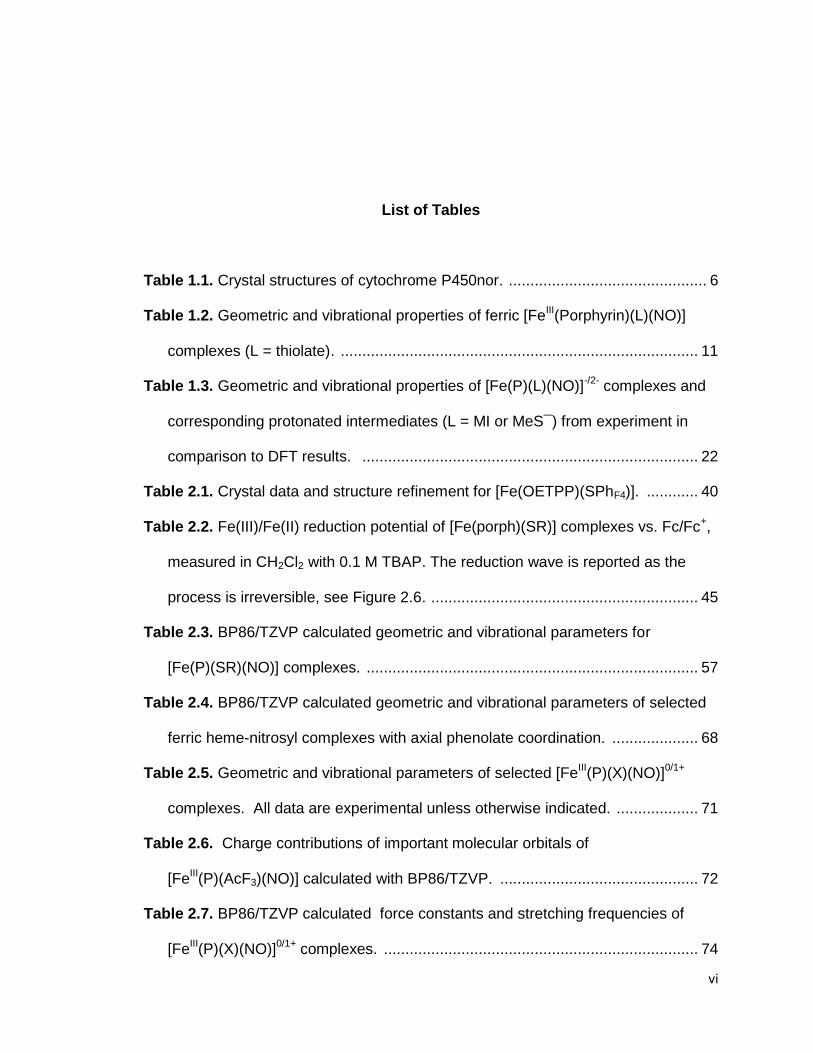
List of Tables
Table 1.1. Crystal structures of cytochrome P450nor. .............................................. 6
Table 1.2. Geometric and vibrational properties of ferric [FeIII(Porphyrin)(L)(NO)]
complexes (L = thiolate). ................................................................................... 11
Table 1.3. Geometric and vibrational properties of [Fe(P)(L)(NO)]-/2-
complexes and
corresponding protonated intermediates (L = MI or MeS¯) from experiment in
comparison to DFT results. .............................................................................. 22
Table 2.1. Crystal data and structure refinement for [Fe(OETPP)(SPhF4)]. ............ 40
Table 2.2. Fe(III)/Fe(II) reduction potential of [Fe(porph)(SR)] complexes vs. Fc/Fc+,
measured in CH2Cl2 with 0.1 M TBAP. The reduction wave is reported as the
process is irreversible, see Figure 2.6. .............................................................. 45
Table 2.3. BP86/TZVP calculated geometric and vibrational parameters for
[Fe(P)(SR)(NO)] complexes. ............................................................................. 57
Table 2.4. BP86/TZVP calculated geometric and vibrational parameters of selected
ferric heme-nitrosyl complexes with axial phenolate coordination. .................... 68
Table 2.5. Geometric and vibrational parameters of selected [FeIII(P)(X)(NO)]
0/1+
complexes. All data are experimental unless otherwise indicated. ................... 71
Table 2.6. Charge contributions of important molecular orbitals of
[FeIII(P)(AcF3)(NO)] calculated with BP86/TZVP. .............................................. 72
Table 2.7. BP86/TZVP calculated force constants and stretching frequencies of
[FeIII(P)(X)(NO)]
0/1+ complexes. ......................................................................... 74

vii
Table 2.8. Charge contributions of important molecular orbital of [FeIII(P)(X)(NO)]
0/1+
calculated with BP86/TZVP. .............................................................................. 75
Table 3.1. Crystallographic data for compound [Fe(3,5-Me-BAFP)(NO)] (1-NO). . 103
Table 3.2. Crystallographic parameters ([Å] and [o]) of selected five-coordinate
ferrous porphyrin nitrosyls. .............................................................................. 103
Table 3.3. Fe-NO and N-O stretching frequencies of selected five- and six-
coordinate {FeNO}7 and {FeNO}
8 iron porphyrin nitrosyls. .............................. 106
Table 3.4. Half wave potentials (in V vs. Fc/Fc+) for the first reduction of ferrous
porphyrin nitrosyls. .......................................................................................... 109
Table 3.5. Equilibrium constants, Keq [M-1
], and free reaction energies, ΔG
(kcal/mol), for the reaction of [Fe(TPP*)(NO)] + MI ⇄ [Fe(TPP*)(MI)(NO). ..... 118
Table 3.6. BP86/TZVP calculated geometric and vibrational parameters of five- and
six-coordinate {FeNO}7 and {FeNO}
8 heme complexes. .................................. 119
Table 3.7. Charge contributions of key σ bonding orbitals for [Fe(P)(MI)(NO)]0/1-
.
Calculated with B3LTP/TZVP from BP86/TZVP optimized structures. ............ 126
Table 4.1. Potentials [V vs. Fc/Fc+] of various ferric bis-picket fence porphyrin
complexes. Measured in THF with 0.1 M TBAP at 100 mV/sec. ..................... 152
Table 4.2. BP86/TZVP calculated geometric parameters of various Fe(II)-NHO and
Fe(VI)-nitride porphyrin complexes. ................................................................ 155
Table 4.3. B3LYP/TZVP calculated free energies (ΔG) for reaction of five- (without
SR-H1¯) and six-coordinate [Fe(P)(SR-H1)(NHO)]¯ + H+ → [Fe(P)(SR-H1)(N)] +
H2O at 298.15 K in toluene. ............................................................................. 156
Table 4.4. Asymmetric azide N-N stretch in five-coordinate [Fe(porphyrin)(N3)] and
six-coordinate [Fe(porphyrin)(MI)(N3)] complexes measured in a KBr matrix. . 160

viii
Table 5.1. Experimental and calculated geometric parameters of [Fe(P)(X)] and
[Fe(P)(MI)(X)], where X = NO, HNO, CO, and MI. .......................................... 181
Table 5.2. Reaction Energies (kcal/mol) for [Fe(P)(X)] +MI ⇄ [Fe(P)(X)(MI)] at
298.15K. ......................................................................................................... 184
Table 5.3. Binding constants (M-1
) for [Fe(P)(X)] + MI ⇄ [Fe(P)(X)(MI)] at 298.15 K.
Keq is calculated using the listed method on BP86/TZVP geometries. ............. 186
Table 5.4. Relative binding constants (M-1
) for [Fe(P)(X)] + MI ⇄ [Fe(P)(X)(MI)] at
298.15 K. Keq values are taken from Table 5.3. ............................................... 192
Table 5.5. Charge contributions of the key Fe-X σ-bonding orbitals for [Fe(P)(MI)(X)]
calculated with B3LYP/TZVP. ......................................................................... 195

ix
List of Figures
Figure 1.1. Overlay of B’, F, G, and I helices and the Cys ligand loop in cytochromes
P450nor (blue) and P450cam (green). The B’, F, and G helices are flipped up in
cytochrome P450nor, resulting in a more open distal pocket than observed in
P450cam. The image was generated using PyMOL from PDB code 1ROM (blue)
and 1PHC (green). .............................................................................................. 7
Figure 1.2. Crystal structure of the NO complex of ferric cytochrome P450nor. The
image was generated using PyMOL from PDB code 1CL6. .............................. 10
Figure 1.3. Structure of the ferric NO complex of the cytochrome P450nor active
site. The image was generated using PyMOL from PDB code 1CL6. ............... 13
Figure 1.4. Ferric heme-thiolate NO complexes as models of P450nor. (a) Crystal
structure of [Fe(OEP)(SR-H2)(NO)] (SR-H2 = S-2,6-(CF3CONH)2C6H3), the only
structurally characterized ferric heme-nitrosyl with thiolate coordination; (b)
schematic representation of a ferric porphyrin benzylthiolate model complex with
bound NO, [FeIII(SPorph)(NO)]. ......................................................................... 15
Figure 2.1. EPR spectra of [Fe(TPP)(SPhF4)(THF)] (top, red) and [Fe(To-
F2PP)(SPhF4)] (bottom, black) measured at 10 K. ............................................. 36
Figure 2.2. EPR spectrum of [Fe(OETPP)(SPhF4)] (black) in toluene, recorded at 10
K, and simulation (red) generated using the program Spin Count. Fit parameters
are gx = 1.95, gy = 2.02, gz = 2.02, D > 10 cm-1
, E/D = 0.0234,
E/D-strain = -0.12. ............................................................................................. 38
x
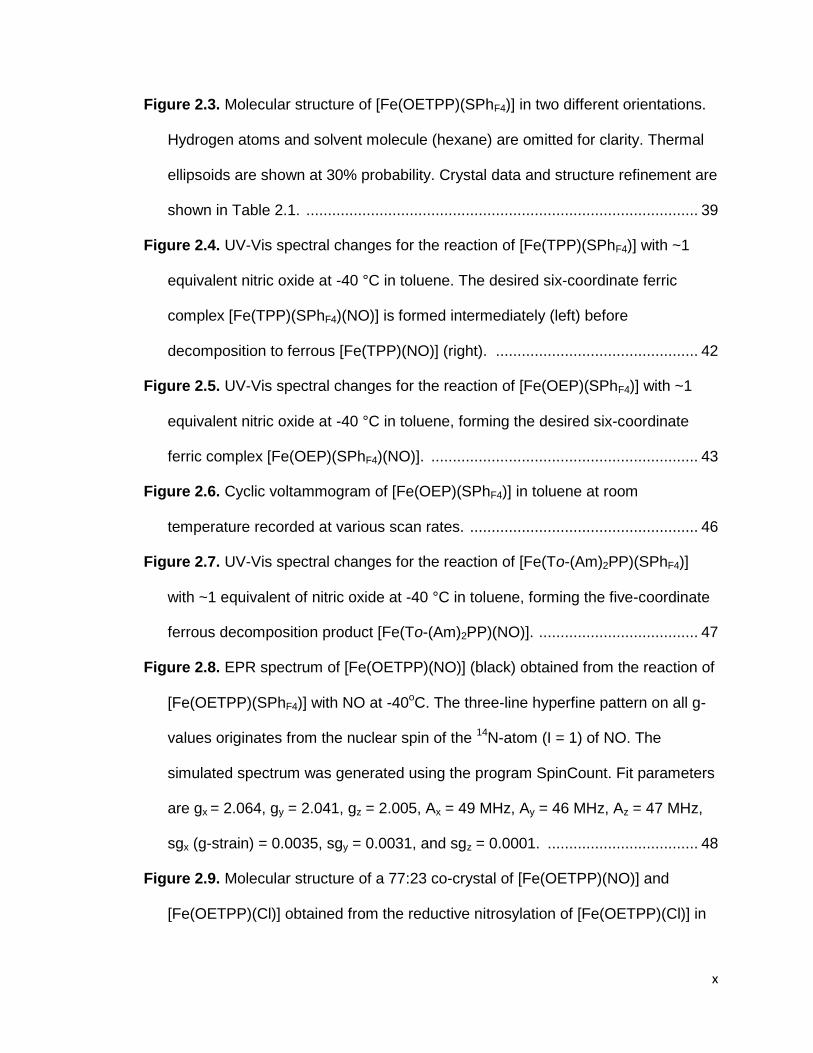
Figure 2.3. Molecular structure of [Fe(OETPP)(SPhF4)] in two different orientations.
Hydrogen atoms and solvent molecule (hexane) are omitted for clarity. Thermal
ellipsoids are shown at 30% probability. Crystal data and structure refinement are
shown in Table 2.1. ........................................................................................... 39
Figure 2.4. UV-Vis spectral changes for the reaction of [Fe(TPP)(SPhF4)] with ~1
equivalent nitric oxide at -40 °C in toluene. The desired six-coordinate ferric
complex [Fe(TPP)(SPhF4)(NO)] is formed intermediately (left) before
decomposition to ferrous [Fe(TPP)(NO)] (right). ............................................... 42
Figure 2.5. UV-Vis spectral changes for the reaction of [Fe(OEP)(SPhF4)] with ~1
equivalent nitric oxide at -40 °C in toluene, forming the desired six-coordinate
ferric complex [Fe(OEP)(SPhF4)(NO)]. .............................................................. 43
Figure 2.6. Cyclic voltammogram of [Fe(OEP)(SPhF4)] in toluene at room
temperature recorded at various scan rates. ..................................................... 46
Figure 2.7. UV-Vis spectral changes for the reaction of [Fe(To-(Am)2PP)(SPhF4)]
with ~1 equivalent of nitric oxide at -40 °C in toluene, forming the five-coordinate
ferrous decomposition product [Fe(To-(Am)2PP)(NO)]. ..................................... 47
Figure 2.8. EPR spectrum of [Fe(OETPP)(NO)] (black) obtained from the reaction of
[Fe(OETPP)(SPhF4)] with NO at -40oC. The three-line hyperfine pattern on all g-
values originates from the nuclear spin of the 14
N-atom (I = 1) of NO. The
simulated spectrum was generated using the program SpinCount. Fit parameters
are gx = 2.064, gy = 2.041, gz = 2.005, Ax = 49 MHz, Ay = 46 MHz, Az = 47 MHz,
sgx (g-strain) = 0.0035, sgy = 0.0031, and sgz = 0.0001. ................................... 48
Figure 2.9. Molecular structure of a 77:23 co-crystal of [Fe(OETPP)(NO)] and
[Fe(OETPP)(Cl)] obtained from the reductive nitrosylation of [Fe(OETPP)(Cl)] in
xi
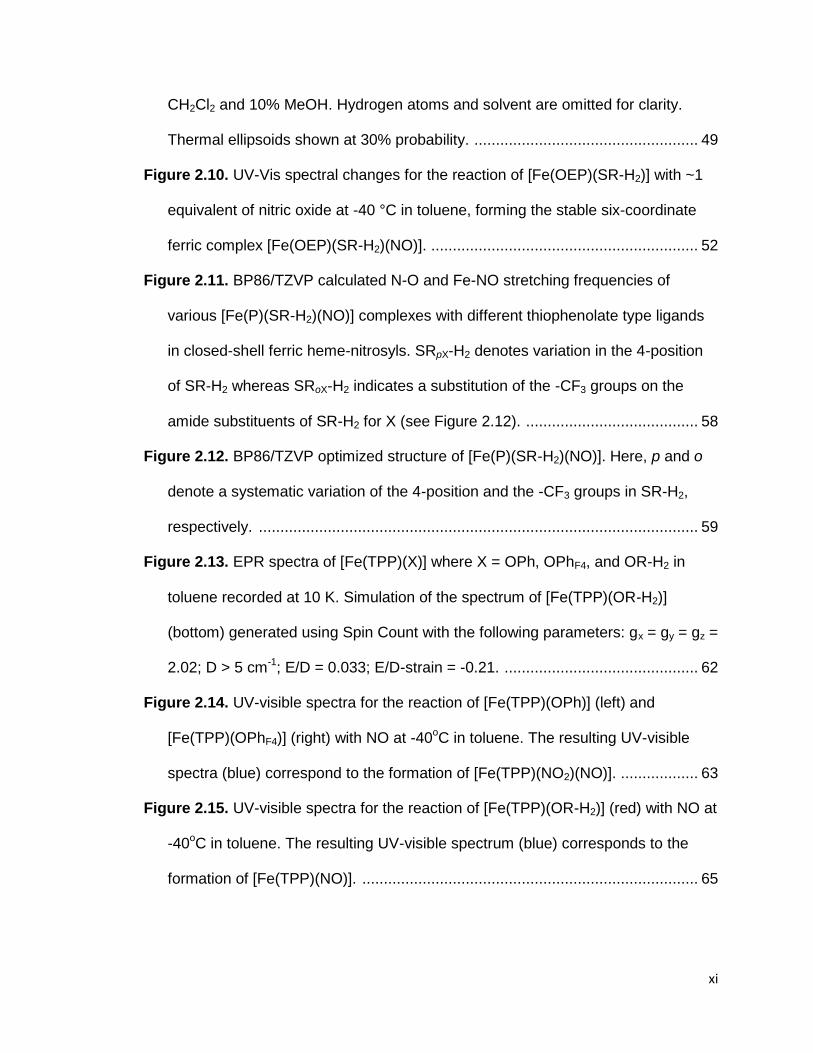
CH2Cl2 and 10% MeOH. Hydrogen atoms and solvent are omitted for clarity.
Thermal ellipsoids shown at 30% probability. .................................................... 49
Figure 2.10. UV-Vis spectral changes for the reaction of [Fe(OEP)(SR-H2)] with ~1
equivalent of nitric oxide at -40 °C in toluene, forming the stable six-coordinate
ferric complex [Fe(OEP)(SR-H2)(NO)]. .............................................................. 52
Figure 2.11. BP86/TZVP calculated N-O and Fe-NO stretching frequencies of
various [Fe(P)(SR-H2)(NO)] complexes with different thiophenolate type ligands
in closed-shell ferric heme-nitrosyls. SRpX-H2 denotes variation in the 4-position
of SR-H2 whereas SRoX-H2 indicates a substitution of the -CF3 groups on the
amide substituents of SR-H2 for X (see Figure 2.12). ........................................ 58
Figure 2.12. BP86/TZVP optimized structure of [Fe(P)(SR-H2)(NO)]. Here, p and o
denote a systematic variation of the 4-position and the -CF3 groups in SR-H2,
respectively. ...................................................................................................... 59
Figure 2.13. EPR spectra of [Fe(TPP)(X)] where X = OPh, OPhF4, and OR-H2 in
toluene recorded at 10 K. Simulation of the spectrum of [Fe(TPP)(OR-H2)]
(bottom) generated using Spin Count with the following parameters: gx = gy = gz =
2.02; D > 5 cm-1
; E/D = 0.033; E/D-strain = -0.21. ............................................. 62
Figure 2.14. UV-visible spectra for the reaction of [Fe(TPP)(OPh)] (left) and
[Fe(TPP)(OPhF4)] (right) with NO at -40oC in toluene. The resulting UV-visible
spectra (blue) correspond to the formation of [Fe(TPP)(NO2)(NO)]. .................. 63
Figure 2.15. UV-visible spectra for the reaction of [Fe(TPP)(OR-H2)] (red) with NO at
-40oC in toluene. The resulting UV-visible spectrum (blue) corresponds to the
formation of [Fe(TPP)(NO)]. .............................................................................. 65
xii
Figure 2.16. DFT optimized structures of (a) [Fe(P)(OPh)(NO)], (b) [Fe(P)(OR-
H1)(NO)], and (c) [Fe(P)(OR-H2)(NO)] calclulated with BP86/TZVP. Bond lengths
and angles are provided in Table 2.4. ............................................................... 67
Figure 2.17. Molecular structure of [Fe(TPP)(AcF3)(NO)] with thermal ellipsoids
drawn at 35%. Hydrogen atoms have been omitted for clarity. The compound
was prepared by Nan Xu and the structure was solved by Douglas R. Powell
from the University of Oklahoma. ...................................................................... 70
Figure 2.18. Important molecular orbitals of [FeIII(P)(AcF3)(NO)] calculated with
BP86/TZVP. (a) and (b) correspond to the strong π backbonding interactions, (c)
to the weak sigma interaction, and (d) to the anitbonding σ*_dz2 type interaction
involved in the bending of the Fe-N-O unit. ....................................................... 72
Figure 2.19. Optimized geometric parameters of [Fe(P)(X)(NO)]0/1+
calculated with
BP86/TZVP. ...................................................................................................... 74
Figure 2.20. 1H NMR spectrum of 4-methyl-2,6-dinitro-1-S-trityl-benzene (11) in
DMSO-d6. .......................................................................................................... 88
Figure 2.21. 1H NMR spectrum of 4-methyl-2,6-dinitro-thiophenol (12) in CDCl3. .. 88
Figure 2.22. 1H NMR spectrum of bis(2,6-dinitro-4-methylphenyl) disulfide (13) in
CDCl3. ............................................................................................................... 90
Figure 2.23. 1H NMR spectrum of bis(2,6-di(trifluoracetylamino)-4-methylphenyl)
disulfide (15) in DMSO-d6. ................................................................................. 90
Figure 3.1. Crystal structure of [Fe(3,5-Me-BAFP)(NO)] (1-NO), hydrogen atoms are
omitted for clarity. Selected bond lengths and angles are summarized in Table
3.2. Thermal ellipsoids are shown at 30% probability. ..................................... 102
xiii
Figure 3.2. EPR spectrum of [Fe(3,5-Me-BAFP)(NO)] (1-NO) recorded at 77 K in
frozen toluene. The spectrum shows typical g-values indicative of ferrous heme-
nitrosyls with S = 1/2 ground state. The three-line hyperfine pattern on the
smallest g-value, gz, originates from the nuclear spin of the 14
N-atom (I = 1) of
NO. The hyperfine coupling constant, Az, is 50 MHz in toluene. ..................... 104
Figure 3.3. Vibrational density of states (VDOS) for [57
Fe(3,5-Me-BAFP)(NO)] (1-
NO, red) and [57
Fe(3,5-Me-BAFP)(15
N18
O)] (1-15
N18
O, black) calculated from raw
nuclear resonance vibrational spectroscopy (NRVS) data. ............................. 105
Figure 3.4. EPR spectrum of [Fe(To-F2PP)(NO)] (2-NO) recorded at 77 K in frozen
toluene. The three-line hyperfine pattern on all g-values originates from the
nuclear spin of the 14
N-atom (I = 1) of NO. The simulated spectrum was
generated using the program SpinCount. Fit parameters are gx = 2.109, gy =
2.0375, gz = 2.003, Ax = 39 MHz, Ay = 46 MHz, Az = 47 MHz, sgx (g-strain) =
0.0025, sgy = 0.0035, and sgz = 0.002. ........................................................... 107
Figure 3.5. EPR spectra of [Fe(Tper-F5PP)(NO)] (3-NO) and [Fe(To-(NO2)2-p-
tBuP)(NO)] (4-NO) recorded at 77K in frozen toluene. The spectra show typical
g-values indicative of ferrous heme-nitrosyls with S=1/2 ground state. The
hyperfine coupling constant, Az, for 3-NO and 4-NO is 47 MHz. ..................... 108
Figure 3.6. Cyclic voltammograms for [Fe(3,5-Me-BAFP)(NO)] (1-NO) in THF at
various scan rates. .......................................................................................... 108
Figure 3.7. Infrared spectra from the spectroelectrochemical reduction of [Fe(3,5-
Me-BAFP)(NO)] (top, 1-NO) and [Fe(3,5-Me-BAFP)(15
N18
O)] (middle, 1-15
N18
O)
in 1,2-DCE-d4. The asterisk (*) indicates poor subtraction of a porphyrin band at
1450 cm-1
. The estimated isotope shift (by DFT) of the N-O stretch in the NO¯
complex is 61
xiv
cm-1
, indicating that the 1450 cm-1
feature in the reduced compound is too high in
energy to be the v(15
N-18
O) stretch. ................................................................. 110
Figure 3.8. UV-visible absorption spectra from the spectroelectrochemical reduction
of [Fe(3,5-Me-BAFP)(NO)] (1-NO, red to green), obtained by sweeping from -0.4
V to -1.8 V vs. Ag wire at a rate of 10 mV/s in a 0.1 M TBAP solution in dry (top)
1,2-DCE and (bottom) THF. The reaction is completely reversible upon sweeping
from -1.8 V to -0.4 V vs. Ag wire (inset). .......................................................... 112
Figure 3.9. Reversible electrochemical reduction of [Fe(3,5-Me-BAFP)] to [Fe(3,5-
Me-BAFP)] in an OTTLE UV-vis cell, taken in 0.1 M TBAP solution in dry THF.
The working electrode is Pt mesh. .................................................................. 113
Figure 3.10. UV-visible absorption spectra from the spectroelectrochemical
reduction of [Fe(To-F2PP)(NO)] (red to green), obtained by sweeping from 0 V to
-1 V at a rate of 10 mV/s in a 0.1 M TBAP solution in dry 1,2-DCE. The reaction
is completely reversible upon sweeping from -1 V to 0 V. Asterisk indicates a
small amount of [Fe(To-F2PP)] impurity that reduces at ~ 200 mV vs.
Ag wire. ........................................................................................................... 114
Figure 3.11. Infrared spectra from the spectroelectrochemical reduction of [Fe(To-
F2PP)(NO)] (top, 2-NO) and [Fe(To-F2PP)(15
N18
O)] (bottom, 2-15
N18
O) in 1,2-
DCE-d4. Difference spectra are provided in Figure 3.14. ................................. 115
Figure 3.12. Comparison of N-O stretching frequencies in {FeNO}7 and {FeNO}
8
porphyrin complexes. ...................................................................................... 115
Figure 3.13. Solution IR spectra of [Fe(3,5-Me-BAFP)(NO)] (red, top) and [Fe(3,5-
Me-BAFP)(NO)] with the addition of 15 μL MI (green, bottom). Incomplete
conversion is observed from the five-coordinate species to the six-coordinate
xv
complex [Fe(3,5-Me-BAFP)(MI)(NO)] which has a N-O stretching frequency of
1630 cm-1
. ....................................................................................................... 116
Figure 3.14. NO – 15
N18
O IR difference spectra from the spectroelectrochemical
reduction of [Fe(To-F2PP)(NO)] in the absence (A: {FeNO} in , C: {FeNO}8) and
presence (B: {FeNO}7, D: {FeNO}
8) of MI. ....................................................... 119
Figure 3.15. The model system [Fe(P)(MI)(NO)]¯, where P = porphine2-
and MI =
1=methylimidazole, and applied coordinate system. The structure shown is
calculated using BP86/TZVP. ......................................................................... 120
Figure 3.16. Key π*h_dz2/dxz molecular orbitals of (left) [Fe(P)(MI)(NO)] and (right)
[Fe(P)(MI)(NO)]¯ which defines the thermodynamic σ-trans effect in ferrous
porphyrin systems. Calculated with B3LYP/TZVP on BP86/TZVP optimized
structures. ....................................................................................................... 126
Figure 3.17. UV-vis spectra from the one-electron reduction of [Fe(To-F2PP)] (2,
blue) to [Fe(To-F2PP)]¯ (2¯, purple), shown left, and subsequent reaction with 10
μL NO (g) (right, orange) in THF at room temperature. ................................... 129
Figure 3.18. UV-visible spectra for the reaction of [Fe(To-F2PP)]¯ (2¯, purple) with
NO to generate [Fe(To-F2PP)(NO)]¯ (2-NO¯, green) in THF at room
temperature. .................................................................................................... 130
Figure 3.19. UV-visible spectra for the reaction of [Fe(To-F2PP)(NO)]¯ (2-NO¯,
green) with 5 equivalents of acetic acid in THF at room temperature. The
resulting spectrum (red) is in agreement with formation of [Fe(To-F2PP)(NO)] (2-
NO). ................................................................................................................ 131
Figure 3.20. UV-vis spectra from the one-electron reduction of [Fe(3,5-Me-BAFP)]
(1, blue) to [Fe(3,5-Me-BAFP)]¯ (2¯, red), shown at left, and subsequent reaction
xvi
with 100 μL NO (g) in THF at room temperature resulting in formation of [Fe(3,5-
Me-BAFP)(NO)]¯ (right, green). ........................................................................ 132
Figure 3.21. UV-visible spectra for the reaction of [Fe(3,5-Me-BAFP)(NO)]¯ (1-NO¯,
green) with 5 equivalents of acetic acid in THF at room temperature. The
resulting spectrum is shown in purple. ............................................................ 133
Figure 3.22. 1H NMR of 3,5-methyl-Bis(Aryloxy)-FencePorphyrin, H2[3,5-Me-BAFP]
in CDCl3. ......................................................................................................... 136
Figure 4.1. UV-visible spectra of [Fe(3,5-Me-BAFP)(ClO4)] (black) and of the product
of the reaction of this complex with excess NH2OBn (blue) in toluene at room
temperature. .................................................................................................... 148
Figure 4.2. EPR spectra of [Fe(3,5-Me-BAFP)(ClO4)] (black) and of the product of
the reaction of this complex with excess NH2OBn (blue) in toluene. Spectra
measure at 10 K. ............................................................................................. 149
Figure 4.3. Crystal structure of [Fe(3,5-Me-BAFP)(NH3)2]. Hydrogen atoms and a
solvent molecule (toluene) are omitted for clarity. Thermal ellipsoids are shown at
30%. The structure was obtained by Ashley McQuarters. ............................... 150
Figure 4.4. UV-visible spectra of [Fe(3,5-Me-BAFP)(ClO4)] (black) and of the product
of the reaction of this complex with excess K[NHOBn] (red) in toluene at room
temperature. .................................................................................................... 151
Figure 4.5. EPR spectra of [Fe(3,5-Me-BAFP)(ClO4)] (black) and of the product of
the reaction of this complex with excess K[NHOBn] (red) in toluene. Measure at
77 K. ............................................................................................................... 151
Figure 4.6. Cyclic volatmmogram of a solution of [Fe(3,5-Me-BAFP)(ClO4)] and
K[NHOBn]. Measured at 100 mV/sec in THF with 0.1 M TBAP. ...................... 153
xvii
Figure 4.7. BP86/TZVP optimized structures of [Fe(P)(SR-H1)(NHO)]¯(S = 0) and
[Fe(P)(SR-H1)(N)] (S = 0) used to calculate ΔG for the reaction above. .......... 154
Figure 4.8. UV-visible spectra of [Fe(3,5-Me-BAFP)(Cl)] and [Fe(3,5-Me-BAFP)(N3)]
in CH2Cl2. ........................................................................................................ 158
Figure 4.9. Preliminary crystal structure of [Fe(3,5-ME-BAFP)(N3)]. Thermal
ellipsoids are shown at 30% probability and hydrogen atoms are omitted for
clarity. ............................................................................................................. 159
Figure 4.10. IR spectra (KBr pellets) of [Fe(3,5-Me-BAFP)(N3)] before (blue) and
after (red) UV irradiation for 25 minutes. ......................................................... 162
Figure 4.11. UV-visible spectral changes after UV irradiation of [Fe(3,5-Me-
BAFP)(N3)] in 2-MeTHF for 3.5 minutes at room temperature. ........................ 162
Figure 4.12. EPR spectra of 2 mM [Fe(Im-BAFP)(N3)] (blue), indicative of a high-
spin ferric complex (S = 5/2), and of the EPR silent photolysis product (red) after
25 minutes of UV irradiation in 2-MeTHF at room temperature. EPR spectra were
recorded at 10 K. ............................................................................................ 163
Figure 4.13. UV-visible spectrum of [Fe(3,5-Me-BAFP)] in 2-MeTHF prepared
through the reduction of [Fe(3,5-Me-BAFP)(ClO4)] with 1 equivalent of KC8. .. 163
Figure 4.14. UV-visible spectra of [Fe(Im-BAFP)(N3)] (blue) and of the photolysis
product (red) after 1.5 minutes of UV irradiation in 2-MeTHF at room
temperature. .................................................................................................... 165
Figure 4.15. EPR spectra of 2 mM [Fe(Im-BAFP)(N3)] (blue), indicative of a low-spin
ferric complex (S = 1/2), and of the EPR silent photolysis product (red) after 25
minutes of UV irradiation in 2-MeTHF at room temperature. EPR spectra were
recorded at 77 K. ............................................................................................ 165

xviii
Figure 4.16. 1H NMR spectrum of NO2-BAFP in CDCl3. Top portion of spectrum is
intensified x 3. ................................................................................................. 169
Figure 4.17. 1H NMR spectrum of Im-BAFP in CDCl3. Top portion of spectrum is
intensified x 3. ................................................................................................. 171
Figure 5.1. The model system [Fe(P)(MI)(X)], where P = porphine2-, MI =
1=methylimidazole, and X = NHO, and applied coordinate system. The structure
shown is calculated with BP86/TZVP. ............................................................. 180
Figure 5.2. Experimental and DFT free energies (kcal/mol) for the reaction:
[Fe(P)(X)] + MI ⇄ [Fe(P)(MI)(X)] where X = NO and MI at 298.15 K. All
calculations were performed on BP86/TZVP structures. ................................. 188
Figure 5.3. Relevant molecular orbitals of (a) [FeII(P)(NO)(MI)], (b)
[FeII(P)(NHO)(MI)], and (c) [Fe
II(P)(CO)(MI)] which define the thermodynamic σ-
trans effect in these ferrous porphyrin systems. Calculated with B3LYP/TZVP on
the BP86/TZVP optimized structures. ............................................................. 194
xix
List of Schemes
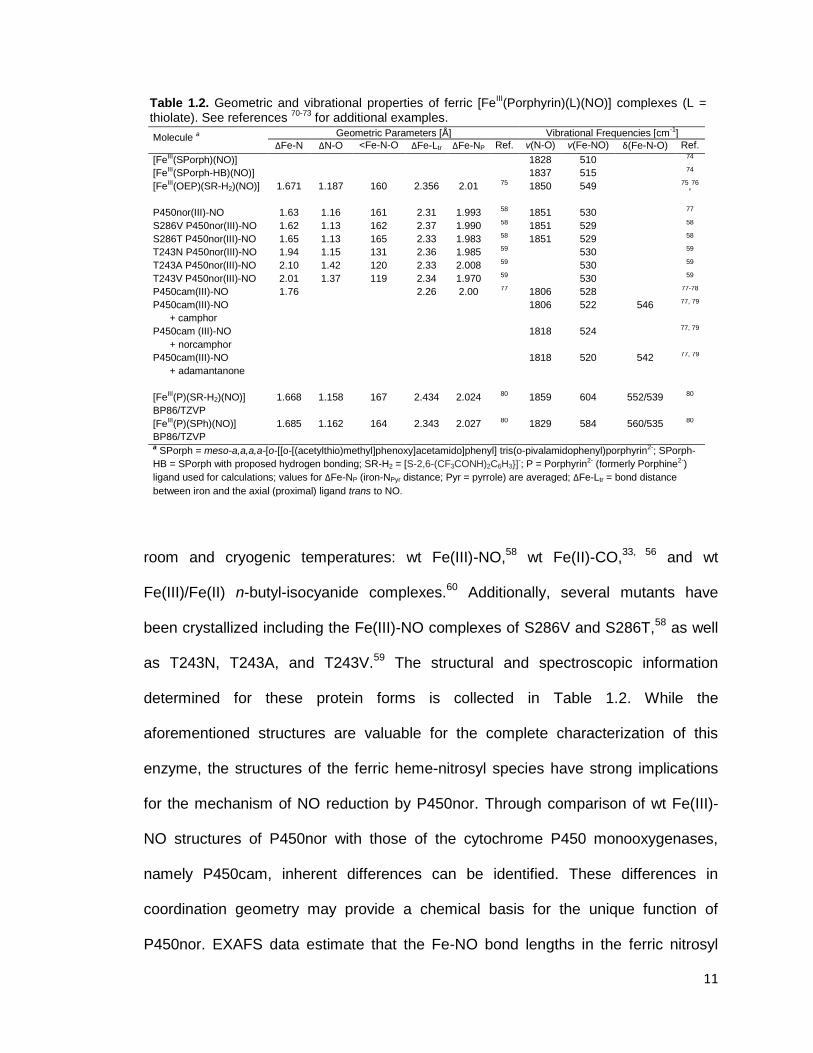
Scheme 1.1. Proposed reaction cycle for the reduction of two molecules of NO to
N2O by cytochrome P450nor. ............................................................................ 14
Scheme 1.2. Calculated mechanism of P450nor. Free energies, ΔG, are given
relative to complex 3a (set to 0.0 kcal/mol). ...................................................... 21
Scheme 2.1. Porphyrin and thiolate ligands. .......................................................... 37
Scheme 2.2. Saddling versus ruffling distortions in heme systems. (Reprinted with
permission from reference 69. Copyright 1998 American Chemical Society). ... 41
Scheme 2.3. Proposed reaction mechanisms of [Fe(porph)(SR)] complexes
with NO. ............................................................................................................ 44
Scheme 2.4. Original synthesis of the hydrogen-bond stabilized thiolate ligand,
SR-H2¯. ............................................................................................................. 55
Scheme 2.5. Alternate synthesis of the hydrogen-bond stabilized thiolate ligand,
SR-H2¯. ............................................................................................................. 55
Scheme 3.1. Molecular orbitals proposed to be involved in the σ-trans effect of NO
in six-coordinate ferrous heme-nitrosyls complexes. ....................................... 122
Scheme 3.2. Electronic structures of low-spin {FeNO}7 and {FeNO}
8 complexes. 127
Scheme 4.1. Two possible mechanistic pathways for N2O production
by P450nor. ..................................................................................................... 145
Scheme 4.2. Target complex, [Fe(3,5-Me-BAFP)(NHOBn)], for modeling the
proposed Fe(IV)-NHOH intermediate in the catalytic cycle of P450nor. .......... 147
xx
Scheme 4.3. [Fe(3,5-Me-BAFP)(N3)] (left) and [Fe(Im-BAFP)(N3)] (right). ........... 158
Scheme 5.1. The key Fe-NO σ-bonding orbital of six-coordinate ferrous heme-
nitrosyls. .......................................................................................................... 178
Scheme 5.2. Possible route for sGC activation by HNO through deprotonation
strong hydrogen bonding to HNO. ................................................................... 196
xxi
Abstract
It came as quite a surprise when it was discovered in the 1980s that the toxic
molecule nitric oxide (NO) is a signaling molecule in mammals responsible for nerve
signal transduction, blood pressure control, and immune response. Unfortunately,
overproduction of NO in the blood stream due to a bacterial infection can lead to
septic shock and organ degradation, both of which can be fatal. Thus, the need to
develop a method by which to detoxify NO from biological systems is of critical
importance. Cytochrome P450nor, a NO reductase, represents one way to achieve
this detoxification. The active site of this fungal cytochrome P450-type enzyme
contains a ferric heme with proximal cysteinate ligation. P450nor plays a vital role in
the fungal denitrification by catalyzing the reduction of NO to N2O through a two
electron reduction of the initially formed ferric heme-nitrosyl by NADH. In order to
fully elucidate the mechanism of this enzyme, stable model complexes are
necessary. In this dissertation, small molecule synthetic models of intermediates in
the catalytic cycle of P450nor have been prepared. First, a series of ferric heme-
nitrosyl complexes with thiolate coordination have been synthesized employing
substituted porphyrins and a series of thiolate ligands. This has allowed us to
determine the key characteristics required to form these highly unstable ferric
nitrosyls. In conjunction with density functional theory (DFT) calculations, we have
now been able to gain detailed insight into the electronic structures and
spectroscopic properties of these species as a function of the axial ligand donor
strength. The second intermediate in the catalytic cycle of P450nor, a ferrous heme-
xxii
nitroxyl complex, has been prepared and its fundamental properties and reactivity
explored. Then, using a bis-picket fence porphyrin we work towards synthesis of
high-valent iron complexes with N-based ligands as models for the key intermediate
in the catalytic cycle of P450nor responsible for the critical N-N bond formation in the
reduction of NO to N2O. Finally, the trans effect of HNO in ferrous heme complexes
and the implications for soluble guanylate cyclase activity has been investigated
using DFT calculations.
1
Chapter 1
Introduction
For decades, the free radical nitric oxide (NO) was viewed exclusively as a
toxin and environmental pollutant. As a byproduct of fossil fuel combustion in air, NO
and its homologue nitrogen dioxide (NO2) are key contributors smog. Interestingly,
NO is also naturally produced by lightning during electrical storms. Since the
gaseous diatomic is poisonous to humans in concentrations as low as ~100 ppm in
air (μM in blood), it came as quite a surprise when it was discovered in the 1980s
that NO is a signaling molecule in biological systems at low (sub-nanomolar)
concentrations. NO is produced in mammals for the purpose of blood pressure
control, nerve signal transduction, and (less surprisingly) immune defense.1-4
This
remarkable contradiction resulted in NO being named “Molecule of the Year” in 1992
by Science Magazine.5 Six years later, Furchgott, Ignarro, and Murad received the
1998 Nobel Prize in Medicine for the discovery of NO as a signaling molecule in the
cardiovascular system.6-8
1.1. Nitric Oxide Biosynthesis and Sensing
The biosynthesis of NO in mammals is performed by the nitric oxide synthase
(NOS) family, a class of enzymes similar in active site structure to cytochrome P450
proteins. All NOS isozymes catalyze the generation of NO through the oxidation of L-
arginine to L-citrulline by O2 at the heme thiolate active site.9-13
There are three

2
classes of NOS proteins found throughout the human body. The first type, inducible
NOS (i-NOS) is located in macrophages and is involved in immune defense against
various pathogens.14-16
Unfortunately, overproduction of NO by i-NOS, as in the case
of a severe bacterial infection, results in nitrosative stress. Nitrosative stress, like
oxidative stress, can be detrimental to health resulting in septic shock, organ
degradation, and initiation of cancer. Endothelial NOS (e-NOS) and neuronal NOS
(n-NOS) are involved in signaling in the endothelial cells lining the arteries and in
neuronal cells, respectively, for blood pressure control and nerve signal
transduction.17
The produced NO diffuses from the endothelium (in the case of e-NOS) to
smooth muscle tissue, and is detected by the ferrous heme enzyme soluble
guanylate cyclase (sGC) which catalyzes the conversion of guanosine triphosphate
(GTP) to the secondary messenger molecule cyclic guanosine monophosphate
(cGMP).18
Through the strong thermodynamic σ-trans effect (also called trans
“interaction”) of NO, binding of nitric oxide at the distal side of the ferrous heme
center with proximal hisitdine ligation induces cleavage of the Fe-NHis bond, forming
a five-coordinate ferrous nitrosyl complex in the NO sensing domain of the protein.19-
21 This induces a conformation change in the enzyme which activates the catalytic
domain of the enzyme for production of cGMP. Once produced, cGMP activates a
cascade of biological events inculding vasodilation, prevention of blood coagulation,
and inhibition of smooth muscle contraction.
1.2. Detoxification of NO in Biological Systems
Due to the fact that NO is toxic at high (micromolar) concentrations, it is
crucial that mechanisms are in place to detoxify NO in biological systems. In
3
mammals, the elimination of NO is accomplished predominantly through the
oxidation of NO to nitrate, NO3-, by oxyhemoglobin (and to a small extent
oxymyoglobin).22-24
However, this oxidation is easily overwhelmed leading to
undesired side effects including septic shock and organ degradation as a result of
excess NO accumulation. For this reason, there is a great need to explore the
catalytic degradation of noxious NO to less harmful compounds. Interestingly, both
bacteria and fungi reduce NO to nitrous oxide (N2O) as a part of the denitrification
process where NO3- is reduced in a stepwise fashion to either N2 (bacteria) or N2O
(fungi), as shown below.25
NO3- → NO2
- → NO → N2O → N2
While denitrification is a means of anaerobic respiration in fungi and bacteria, the
reduction of NO, interestingly, does not contribute to the proton gradient and instead
serves to eliminate toxic NO from the system. Here, NO is catalytically reduced to
N2O by a class of enzymes called nitric oxide reductases (NOR), which catalyze the
following reaction:
2 NO + 2 e- + 2 H
+ → N2O + H2O
There are two main types of bacterial NORs—FNOR, a flavodiiron protein, and
NorBC, a dinuclear heme/non-heme enzyme.26
In contrast to the bi-metallic active
sites found in bacterial NORs, fungal NOR (P450nor), a cytochrome P450-type
enzyme, contains a single heme thiolate active site.27-28
Fungal P450nor is
discussed in great detail in Section 1.3,29
and modeling intermediates of NO
reduction by this enzyme is the focus of this thesis.
4
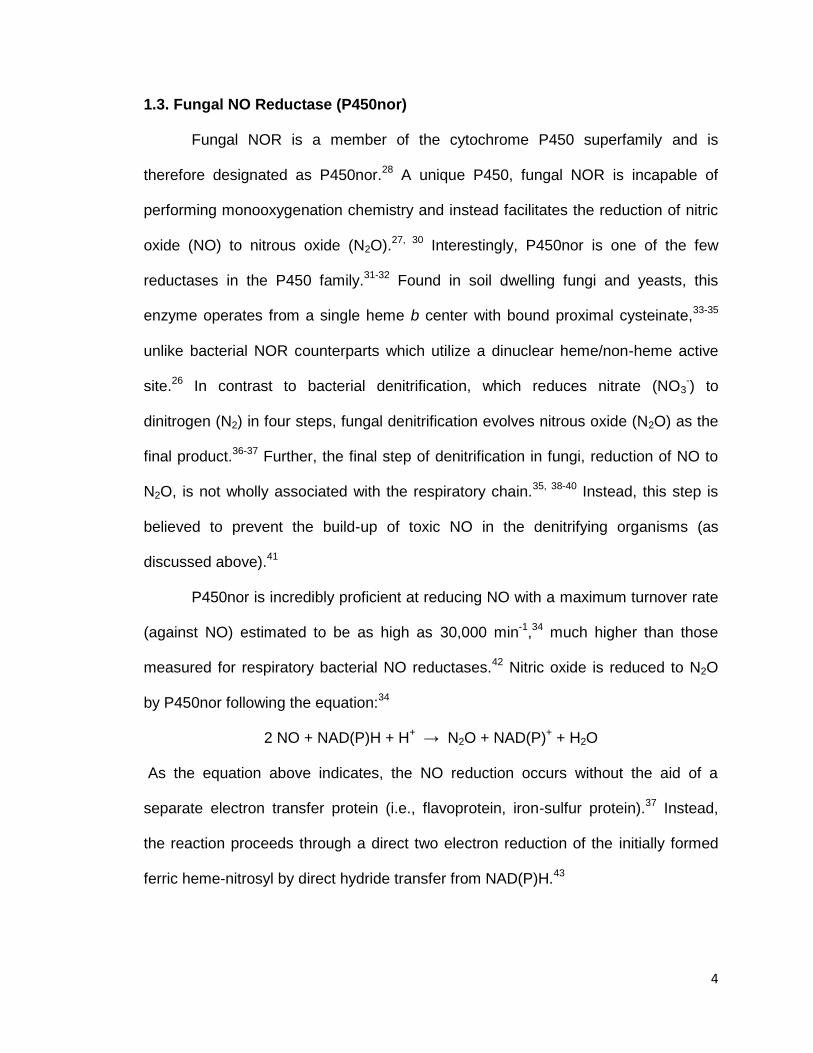
1.3. Fungal NO Reductase (P450nor)
Fungal NOR is a member of the cytochrome P450 superfamily and is
therefore designated as P450nor.28
A unique P450, fungal NOR is incapable of
performing monooxygenation chemistry and instead facilitates the reduction of nitric
oxide (NO) to nitrous oxide (N2O).27, 30
Interestingly, P450nor is one of the few
reductases in the P450 family.31-32
Found in soil dwelling fungi and yeasts, this
enzyme operates from a single heme b center with bound proximal cysteinate,33-35
unlike bacterial NOR counterparts which utilize a dinuclear heme/non-heme active
site.26
In contrast to bacterial denitrification, which reduces nitrate (NO3-) to
dinitrogen (N2) in four steps, fungal denitrification evolves nitrous oxide (N2O) as the
final product.36-37
Further, the final step of denitrification in fungi, reduction of NO to
N2O, is not wholly associated with the respiratory chain.35, 38-40
Instead, this step is
believed to prevent the build-up of toxic NO in the denitrifying organisms (as
discussed above).41
P450nor is incredibly proficient at reducing NO with a maximum turnover rate
(against NO) estimated to be as high as 30,000 min-1
,34
much higher than those
measured for respiratory bacterial NO reductases.42
Nitric oxide is reduced to N2O
by P450nor following the equation:34
2 NO + NAD(P)H + H+ → N2O + NAD(P)
+ + H2O
As the equation above indicates, the NO reduction occurs without the aid of a
separate electron transfer protein (i.e., flavoprotein, iron-sulfur protein).37
Instead,
the reaction proceeds through a direct two electron reduction of the initially formed
ferric heme-nitrosyl by direct hydride transfer from NAD(P)H.43
5
Protein Sequences and Gene Structure of Fungal NOR
P450nor has been isolated and purified from several fungi including Fusarium
oxysporum,35, 44
Cylindrocarpon tonkinense,45-46
and Trichosporon cutaneum.47-48
However, genome analysis shows the presence of P450nor enzymes in many
fungi.49-50
Isozymes of P450nor show 65-83% sequence identity with each other and
an average of 25% (up to 40%) sequence identity with the cytochrome P450
monooxygenases.28
Interestingly, all known genes of the fungal NOR family exhibit
higher sequence homologies with bacterial than eukaryotic P450s, suggesting that
lateral gene transfer from bacteria to fungi occurred very early during evolution.51
P450nor enzymes can be found in either the mitochondria, P450norA, or
cytosol, P450norB, of the cell.52
The mitochondrial form, P450norA, contains 26
additional amino acids at the N-terminus not found in P450norB. In P450nor from F.
oxysporum, the two forms are both encoded by a single gene, CYP 55. Examination
of the amino acid sequence of this gene revealed the presence of two separate
initiation codons for translation.48, 52-53
Of the two resulting genetic codes, one
(P450norA) contains an extension sequence at the N-terminus characteristic of a
targeting sequence for transportation to the mitochondria. Likewise, the N-terminus
in P450norB contains an acetylated alanine which indicates post- or co-translational
elimination of a methionine residue.53
Cytosolic and mitochondrial forms of P450nor
were also isolated from C. tonkinense, but in this case, two separate genes (CPY
55A2 and CYP 55A3) were found to code for the two differing forms.46
Interestingly,
P450norB shows increased selectivity for NADPH over NADH, suggesting P450nor
could act as an electron sink to allow NADP+ formation as a substrate for the
pentose-phosphate cycle.54
6
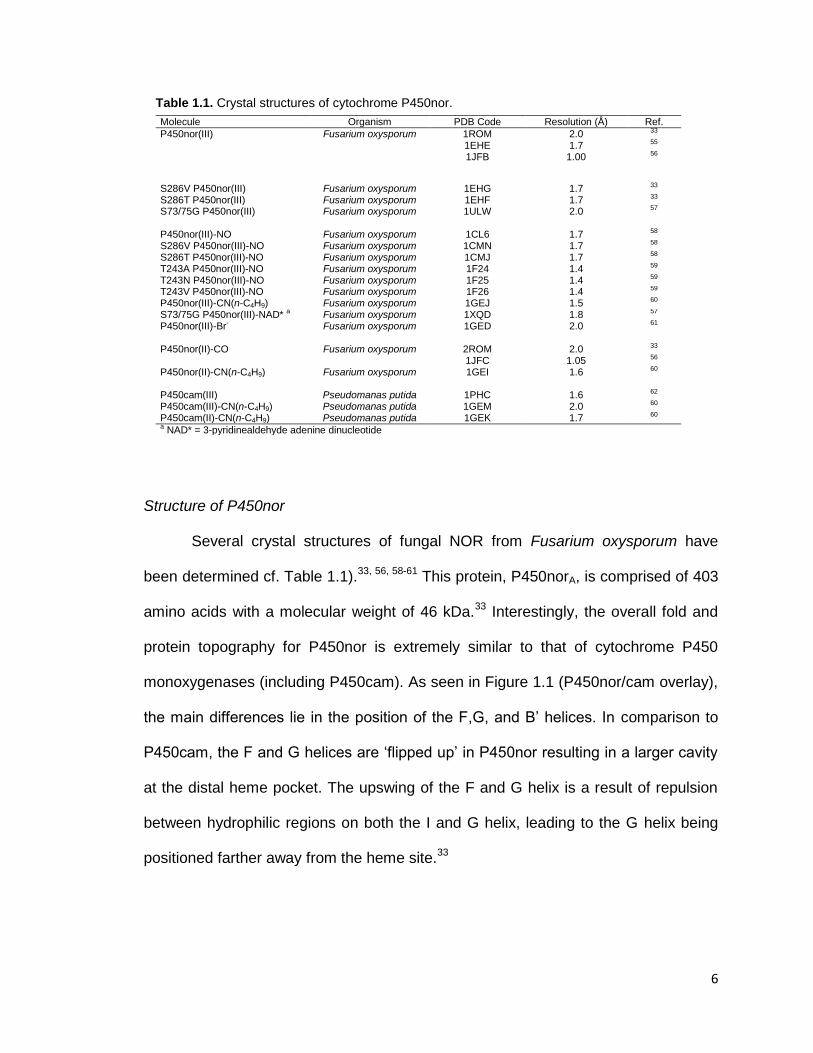
Table 1.1. Crystal structures of cytochrome P450nor.
Structure of P450nor
Several crystal structures of fungal NOR from Fusarium oxysporum have
been determined cf. Table 1.1).33, 56, 58-61
This protein, P450norA, is comprised of 403
amino acids with a molecular weight of 46 kDa.33
Interestingly, the overall fold and
protein topography for P450nor is extremely similar to that of cytochrome P450
monoxygenases (including P450cam). As seen in Figure 1.1 (P450nor/cam overlay),
the main differences lie in the position of the F,G, and B’ helices. In comparison to
P450cam, the F and G helices are ‘flipped up’ in P450nor resulting in a larger cavity
at the distal heme pocket. The upswing of the F and G helix is a result of repulsion
between hydrophilic regions on both the I and G helix, leading to the G helix being
positioned farther away from the heme site.33
Molecule Organism PDB Code Resolution (Å) Ref.
P450nor(III) Fusarium oxysporum 1ROM 1EHE 1JFB
2.0 1.7
1.00
33 55 56
S286V P450nor(III) Fusarium oxysporum 1EHG 1.7 33 S286T P450nor(III) Fusarium oxysporum 1EHF 1.7 33 S73/75G P450nor(III) Fusarium oxysporum 1ULW 2.0 57 P450nor(III)-NO Fusarium oxysporum 1CL6 1.7 58 S286V P450nor(III)-NO Fusarium oxysporum 1CMN 1.7 58 S286T P450nor(III)-NO Fusarium oxysporum 1CMJ 1.7 58 T243A P450nor(III)-NO Fusarium oxysporum 1F24 1.4 59 T243N P450nor(III)-NO Fusarium oxysporum 1F25 1.4 59 T243V P450nor(III)-NO Fusarium oxysporum 1F26 1.4 59 P450nor(III)-CN(n-C4H9) Fusarium oxysporum 1GEJ 1.5 60 S73/75G P450nor(III)-NAD* a Fusarium oxysporum 1XQD 1.8 57 P450nor(III)-Br- Fusarium oxysporum 1GED 2.0 61 P450nor(II)-CO Fusarium oxysporum 2ROM
1JFC 2.0
1.05
33 56
P450nor(II)-CN(n-C4H9) Fusarium oxysporum 1GEI 1.6 60 P450cam(III) Pseudomanas putida 1PHC 1.6 62 P450cam(III)-CN(n-C4H9) Pseudomanas putida 1GEM 2.0 60 P450cam(II)-CN(n-C4H9) Pseudomanas putida 1GEK 1.7 60 a NAD* = 3-pyridinealdehyde adenine dinucleotide
7
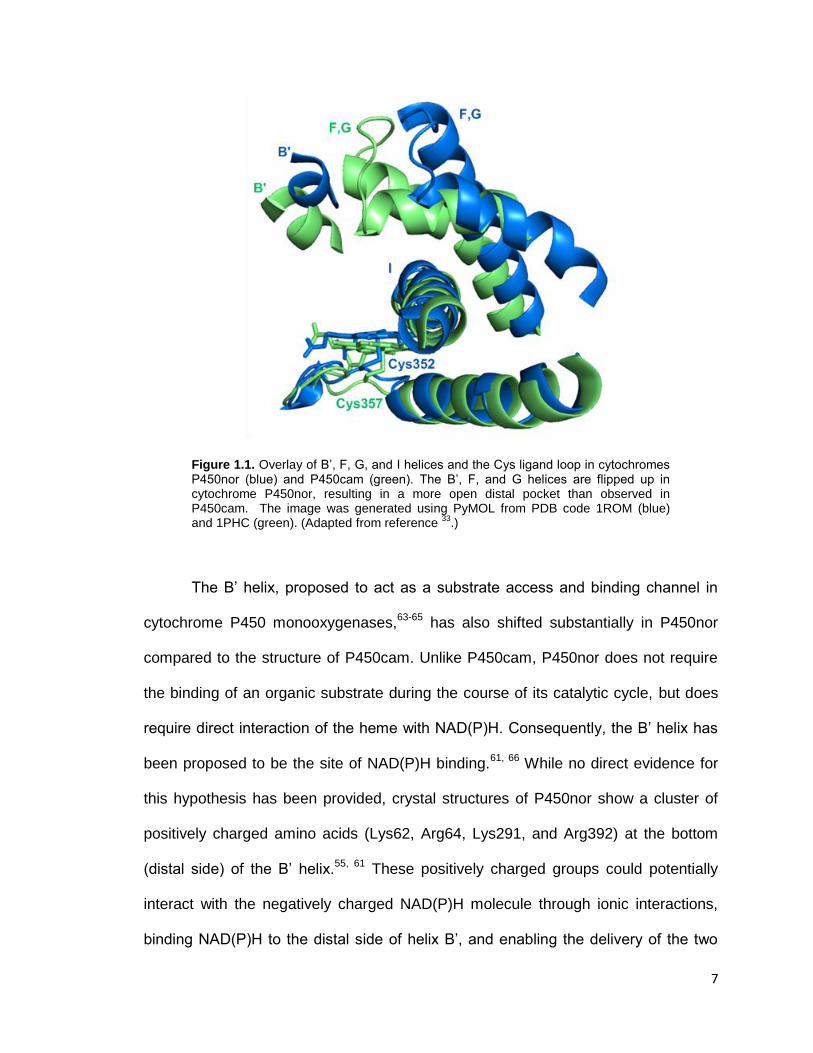
Figure 1.1. Overlay of B’, F, G, and I helices and the Cys ligand loop in cytochromes P450nor (blue) and P450cam (green). The B’, F, and G helices are flipped up in cytochrome P450nor, resulting in a more open distal pocket than observed in P450cam. The image was generated using PyMOL from PDB code 1ROM (blue) and 1PHC (green). (Adapted from reference
33.)
The B’ helix, proposed to act as a substrate access and binding channel in
cytochrome P450 monooxygenases,63-65
has also shifted substantially in P450nor
compared to the structure of P450cam. Unlike P450cam, P450nor does not require
the binding of an organic substrate during the course of its catalytic cycle, but does
require direct interaction of the heme with NAD(P)H. Consequently, the B’ helix has
been proposed to be the site of NAD(P)H binding.61, 66
While no direct evidence for
this hypothesis has been provided, crystal structures of P450nor show a cluster of
positively charged amino acids (Lys62, Arg64, Lys291, and Arg392) at the bottom
(distal side) of the B’ helix.55, 61
These positively charged groups could potentially
interact with the negatively charged NAD(P)H molecule through ionic interactions,
binding NAD(P)H to the distal side of helix B’, and enabling the delivery of the two

8
electrons required for NO reduction directly from the distal site to the heme. As
expected, site directed mutagenesis of this region indicates that NAD(P)H binding
depends directly on the steric bulk and charge distribution of the B’ helix.66
Although
lack of a NAD(P)H-bound crystal structure makes it very difficult to definitively
determine the role of the B’ helix, a crystal structure has been solved with bound
bromide ions.61
This structure shows Br¯ bound to the proposed NAD(P)H binding
site, providing evidence that the negatively charged NAD(P)H molecule could in fact
interact directly with the B’ helix.
Additionally, the B’ helix has been shown to provide cofactor specificity
between NADH and NADPH.66
F. oxysporum utilizes only NADH,34
whereas T.
cutaneum and C. tonkinense P450nor can employ either NADH or NADPH as
electron donors.45-46, 48
To date, there are no P450nor enzymes that reduce NO only
in the presence of NADPH. Examination of the B’ helix shows that the amino acid
residues at the distal side of the helix provide more steric bulk in P450nor from F.
oxysporum than the corresponding residues in T. cutaneum or C. tonkinense.66
Further studies have shown that NADPH is able to bind to the B’ helix of P450nor
from F. oxysporum, but electron transfer is blocked by Ser75, resulting in a lack of
N2O formation.66
As expected, mutation of Ser75 to the smaller Gly residue
significantly improves the overall NADPH dependent activity of P450nor from F.
oxysporum. Therefore, the B’ helix also seems crucial for determining NAD(P)H
specificity.
Equally important as the electron transfer for the reduction of NO by P450nor
is the proton delivery pathway. Crystal structures of P450nor at cryogenic
temperatures have located the precise position of water molecules in the protein
structure.58-59
One of these water molecules adjacent to the iron, Wat99, forms a
9
hydrogen bonding network with Ser286, Thr243, and Asp393, which has been
proposed to be essential for proton delivery. Mutation of Ser286 to Val or Thr has
been shown to disrupt the hydrogen bonding network and, thus, no reduction of NO
occurs.58
This mutation does not, however, decrease the rate constant for formation
of the Fe(III)-NO species, as will be discussed later. Additionally, site directed
mutagenesis studies that replace Thr243 show significantly reduced rates of NADH
consumption, the formation of a 444 nm intermediate, and N2O release.59, 67-68
The
levels of NO reduction by T243N, T243V, and T243A are 2%, 0.01%, and 3%,
respectively (wt = 100%).59
These mutation studies suggest that both Ser286 and
Thr243 are crucial for the delivery of protons to the active site. The fact that neither
the hydrogen bonding network nor the accumulation of positively charged residues
on the B’ helix is observed in cytochrome P450 monooxygenases suggests their
importance in the unique function of P450nor.30
Moving closer to the active site, the I helix is situated directly next to the
heme center in the distal pocket and spans the length of the enzyme, defining the
heme pocket (see Figure 1.2).33
While this helix is conserved among all cytochrome
P450s, its usual function is to stabilize O2 in the binding pocket.69
As P450nor does
not show monooxygenase activity, it is surprising that this region is conserved.
Importantly, the I helix contains the previously mentioned Thr243 necessary for
proton delivery to the active site and this is assumed to be its main function.59
Additionally, the I helix in P450nor is more stretched than that of P450cam. The
stretched helix is stabilized by Wat63 and Wat72, which provides a strong structural
hydrogen bonding network from Thr243 to Ala239.33
However, these water
molecules are believed to be purely structural and not part of the proton delivery
pathway.
10
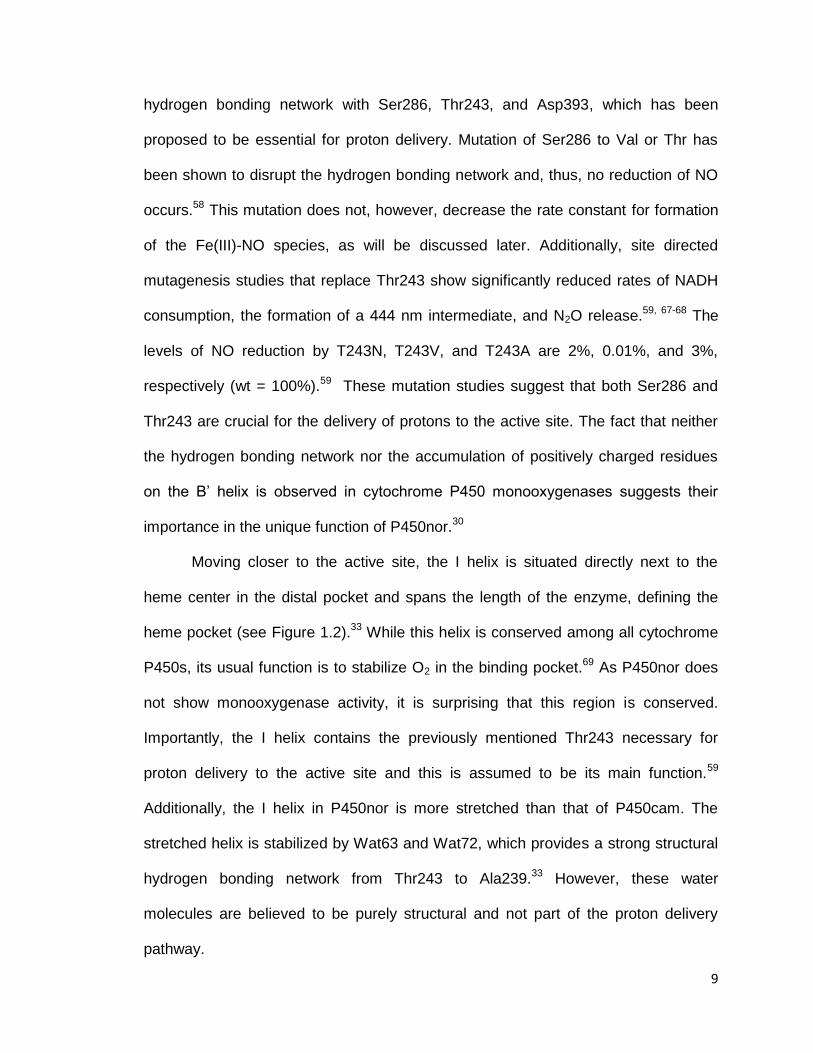
Figure 1.2. Crystal structure of the NO complex of ferric cytochrome P450nor. The image was generated using PyMOL from PDB code 1CL6.
Upon examination of the gene sequence of fungal NORs, a highly conserved
region around Cys352 has been identified as the heme binding site.28
Crystal
structures of P450nor from F. oxysporum confirm this result.33
These structures
show a heme b with axial cysteinate coordination from Cys352 as illustrated in
Figure 1.2, where the Fe-S bond distance is 2.17 Å in the 5C high-spin ferric resting
state of the enzyme. The heme group is embedded between the distal I and proximal
L helices with the proximal face of the heme around 8 Å away from the surface of the
protein.
Characterization of the Fe(III)-NO Complex
In addition to the previously mentioned crystal structures of the ferric resting
state, structures of P450nor have been solved for the following 6C wild-type forms at
11
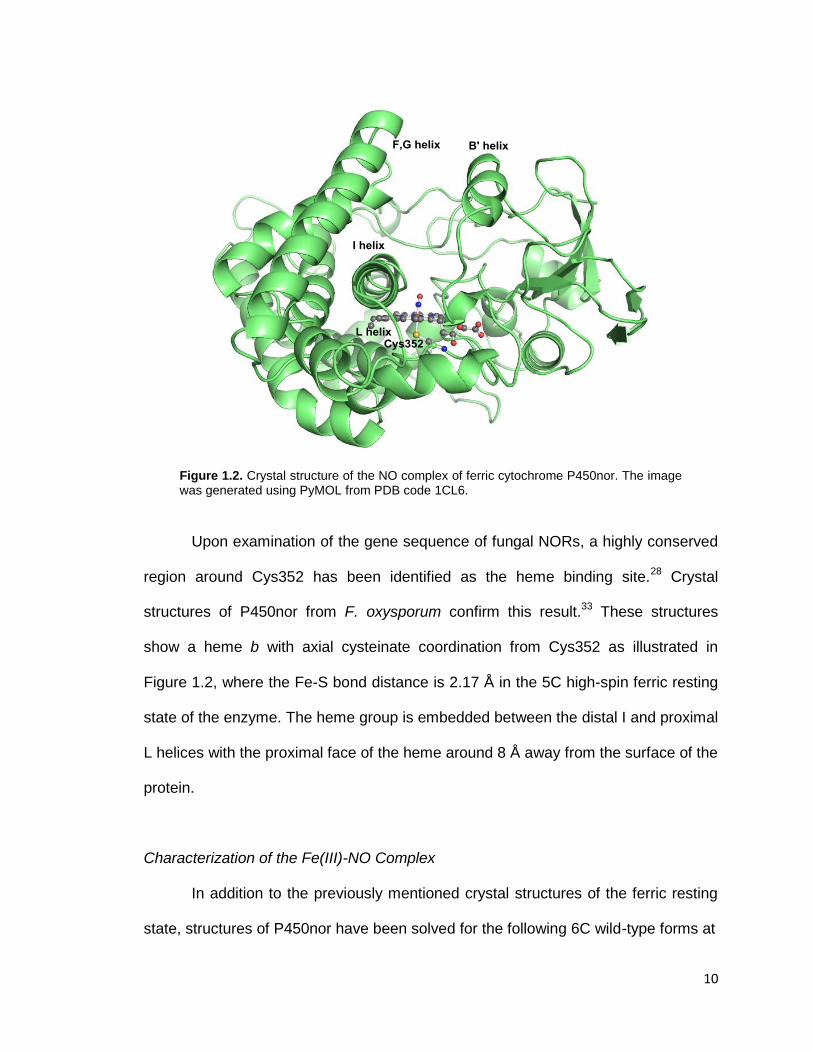
Table 1.2. Geometric and vibrational properties of ferric [FeIII(Porphyrin)(L)(NO)] complexes (L =
thiolate). See references 70-73
for additional examples.
room and cryogenic temperatures: wt Fe(III)-NO,58
wt Fe(II)-CO,33, 56
and wt
Fe(III)/Fe(II) n-butyl-isocyanide complexes.60
Additionally, several mutants have
been crystallized including the Fe(III)-NO complexes of S286V and S286T,58
as well
as T243N, T243A, and T243V.59
The structural and spectroscopic information
determined for these protein forms is collected in Table 1.2. While the
aforementioned structures are valuable for the complete characterization of this
enzyme, the structures of the ferric heme-nitrosyl species have strong implications
for the mechanism of NO reduction by P450nor. Through comparison of wt Fe(III)-
NO structures of P450nor with those of the cytochrome P450 monooxygenases,
namely P450cam, inherent differences can be identified. These differences in
coordination geometry may provide a chemical basis for the unique function of
P450nor. EXAFS data estimate that the Fe-NO bond lengths in the ferric nitrosyl
Molecule a Geometric Parameters [Å] Vibrational Frequencies [cm-1]
ΔFe-N ΔN-O <Fe-N-O ΔFe-Ltr ΔFe-NP Ref. ν(N-O) ν(Fe-NO) δ(Fe-N-O) Ref.
[FeIII(SPorph)(NO)] 1828 510 74
[FeIII(SPorph-HB)(NO)] 1837 515 74
[FeIII(OEP)(SR-H2)(NO)] 1.671 1.187 160 2.356 2.01 75 1850 549 75,76
P450nor(III)-NO 1.63 1.16 161 2.31 1.993 58 1851 530 77
S286V P450nor(III)-NO 1.62 1.13 162 2.37 1.990 58 1851 529 58
S286T P450nor(III)-NO 1.65 1.13 165 2.33 1.983 58 1851 529 58
T243N P450nor(III)-NO 1.94 1.15 131 2.36 1.985 59 530 59
T243A P450nor(III)-NO 2.10 1.42 120 2.33 2.008 59 530 59
T243V P450nor(III)-NO 2.01 1.37 119 2.34 1.970 59 530 59
P450cam(III)-NO 1.76 2.26 2.00 77 1806 528 77-78
P450cam(III)-NO
+ camphor
1806 522 546 77, 79
P450cam (III)-NO
+ norcamphor
1818 524 77, 79
P450cam(III)-NO
+ adamantanone
1818 520 542 77, 79
[FeIII(P)(SR-H2)(NO)]
BP86/TZVP
1.668 1.158 167 2.434 2.024 80 1859 604 552/539 80
[FeIII(P)(SPh)(NO)]
BP86/TZVP
1.685 1.162 164 2.343 2.027 80 1829 584 560/535 80
a SPorph = meso-a,a,a,a-[o-[[o-[(acetylthio)methyl]phenoxy]acetamido]phenyl] tris(o-pivalamidophenyl)porphyrin2-; SPorph-
HB = SPorph with proposed hydrogen bonding; SR-H2 = [S-2,6-(CF3CONH)2C6H3}]-; P = Porphyrin2- (formerly Porphine2-)
ligand used for calculations; values for ΔFe-NP (iron-NPyr distance; Pyr = pyrrole) are averaged; ΔFe-Ltr = bond distance
between iron and the axial (proximal) ligand trans to NO.

12
complexes of P450nor and P450cam are 1.66 ± 0.02 Å and 1.76 ± 0.02 Å,
respectively.77
This is in good agreement with the wt Fe(III)-NO crystal structure of
P450nor which reports an Fe-NO bond length of 1.63 Å (as shown in Table 1.2).58
These data suggest a stronger Fe-NO bond in P450nor than in P450cam, and this
trend is reproduced by the Fe-NO and N-O vibrational data listed in Table 1.2. The
N-O and Fe-NO stretching frequencies are found at 1851 and 530 cm-1
, respectively,
for P450nor.77, 81
The corresponding values for P450cam are 1806 and 522 cm-1
,
respectively.77-78
As the authors claim,77
the shorter Fe-NO distance in P450nor
facilitates the electron transfer from the singly-occupied π* orbital of NO to the Fe
center, formally creating an Fe(II)-NO+ complex. This species would be more
susceptible to reduction by direct hydride donation from NAD(P)H. Another key
observation from the Fe(III)-NO crystal structure of P450nor is the Fe-N-O bond
angle as illustrated in Figure 1.3. Most known Fe(III)-NO complexes show a linear
Fe-NO unit.82-85
While the Fe-N-O bond angle of 161° observed in P450nor is still
considered “linear” in terms of Fe-N-O unit classification, there is a significant bend
from linearity in this case.58
Additionally, the Fe-NO bond vector is displaced by 9°
from the heme normal towards the β-meso direction. The central question with
respect to these findings is whether these are due to a structural effect of the protein
active site (via steric interactions) or an electronic effect. Examination of the distal
binding pocket shows a fairly open environment, making structural crowding unlikely.
Therefore, the effect must be purely electronic. This hypothesis is confirmed by the
crystal structure of a ferric heme-thiolate model complex, [Fe(OEP)(SR-H2)(NO)]
(SR-H2 = S-2,6-(CF3CONH)2C6H3).75
This model system shows an Fe-N-O bond

13
Figure 1.3. Structure of the ferric NO complex of the cytochrome P450nor active site. The image was generated using PyMOL from PDB code 1CL6.
angle of 159.6° and a tilt of 9.1° of the Fe-NO axis, confirming that this must be
caused by an electronic effect.
Mechanism NO Reduction by Cytochrome P450nor
The catalytic cycle of P450nor starts from the ferric heme-thiolate resting
state as illustrated in Scheme 1.1. From EPR studies, it is known that this species
contains a high- and low-spin fraction where the latter is caused by coordination of
water.86
The g values for the high-spin complex are 7.97, 4.12, and 1.75. The low-
spin component shows g values of 2.442, 2.260, and 1.911. This is further confirmed
by single crystal EPR results at 10 K.87
UV-Visible absorption spectroscopy also
shows a mixture of high- and low-spin states for resting P450nor.34, 88
The g values
are typical for cytochrome P450s, and are in good agreement, for example, with the
high- and low-spin components of P450cam.89
The ratio of high- to low-spin complex
14
Scheme 1.1. Proposed reaction cycle for the reduction of two molecules of NO to N2O by cytochrome P450nor.
43
has been proposed to be of critical importance for the high catalytic activity of NO
reduction by P450nor. Substitution of the native protoheme with a 2,4-
diacetyldeuteroheme gives rise to a completely 6C low-spin ferric heme center, as
evidenced by UV-Visible and resonance Raman spectroscopy.90
Accordingly, the kon
rate for the formation of the ferric nitrosyl complex is significantly decreased to 0.24 x
107 M
-1s
-1 in this case, and the turnover rate dropped to 5,052 min
-1, as compared to
1.90 x 10⁷ M
-1s
-1 and 12,650 min
-1 for the reconstituted native form, respectively.
While the resting state shows a mixture of high- and low-spin species, the 5C
high spin form (S = 5/2) is catalytically active, i.e. the water molecule must dissociate
before NO can bind to the ferric 5C form of the enzyme. Studies on the association
of NO with P450cam and corresponding model complexes by van Eldik and
coworkers illustrate this point.91-94
The model complex [FeIII(SPorph)(NO)] shown in
Figure 1.4, right, when solvated in methanol, displays large positive values of ΔH‡
and ΔS‡, accompanied by a positive activation volume. This suggests that the rate-

15
determining step in the binding of NO to the corresponding ferric precursor is
dominated by the dissociation of a solvent (methanol) molecule.92
Additionally, rates
of NO binding to P450cam are highly dependent on the presence of camphor. The
camphor-free (6C, water bound) and camphor-bound (5C) kon rates are 3.2 x 10⁵ and
3.45 x 10⁷, respectively, indicating a much slower association when a water
molecule is bound to the sixth coordination site of the heme.91
The Fe(III)/Fe(II)
Figure 1.4. Ferric heme-thiolate NO complexes as models of P450nor. (a) Crystal structure of [Fe(OEP)(SR-H2)(NO)] (SR-H2 = S-2,6-(CF3CONH)2C6H3), the only structurally characterized ferric heme-nitrosyl with thiolate coordination
75 (Reprinted with permission from reference
75.
Copyright 2006 Royal Society of Chemistry); (b) schematic representation of a ferric porphyrin benzylthiolate model complex with bound NO, [Fe
III(SPorph)(NO)].
74 (Reprinted with
permission from reference 74
. Copyright 2000 American Chemical Society).
redox potential for P450nor is quite different than that of the cytochrome P450
monooxygenases.86, 95-96
The redox potential of fungal NOR is extremely negative at
-307 mV, suggesting the possibility of reductive activation of the nitrosyl ligand. It is
known that the Fe(II) form is not involved in the catalytic cycle of P450nor, as the
reaction is not inhibited by CO.34
Binding of one molecule of NO to the catalytically
active, ferric form of P450nor then leads to a six-coordinate low-spin ferric heme-
nitrosyl complex as the first intermediate (cf. Scheme 1.1).34, 43, 77, 86, 90
The Soret
band shifts from 414 nm to 431 nm upon NO binding,43
and the Fe-NO and N-O
(a) (b)
16
stretching frequencies of the resulting species are 530 cm-1
and 1851 cm-1
,
respectively.77
Flash photolysis determined the kon rate for Fe(III)-NO formation to be
2.6 x 10⁷ M
-1s
-1 at 10°C.
43 Binding of NO activates P450nor for reaction with
NAD(P)H, which does not react with the 5C ferric ligand-free form of this enzyme.
Stopped-flow kinetic investigations have demonstrated that the 6C Fe(III)-NO
species undergoes a two-electron reduction with NADH forming the so-called
‘intermediate I’, as identified by a shift of the Soret band to 444 nm.43
The second
order rate constant for this reduction has been estimated to be 0.9 x 10⁶ M
-1s
-1 at
10°C. This result was reproduced using a chemical hydride donor, sodium
borohydride (NaBH4), indicating that the most likely mechanism is a direct hydride
donation from NADH to the ferric heme-nitrosyl.97
Using a synthetic analogue of
NADH, 4,4-2H,
2H-NADH, a kinetic isotope effect of 3.8 ± 0.2 has been determined
for NADH oxidation,97
indicating that the rate limiting step in the reduction of NO by
P450nor is the hydride transfer from NADH to the ferric heme-nitrosyl complex. With
a lifetime of around 100 ms, intermediate I is challenging to study and thus, its exact
nature is unknown. Resonance Raman indicates an Fe-N stretching frequency of
596 cm-1
, which likely corresponds to an iron(II)-nitroxyl or iron(I)-NO complex.81
This
is in agreement with the fact that NADH generally performs two electron reductions.
As such, formation of an Fe(II)-NO complex as intermediate I is unlikely, since this
would correspond to a one-electron reduction. In addition, the Fe(II)-NO complex of
P450nor prepared independently shows a Soret band at 434 nm rather than at 444
nm like intermediate I,43
and the (potential) Fe-NO stretching frequency of this
species is observed at 543 cm-1
by resonance Raman.81
This vibrational frequency is
also not in agreement with ν(Fe-N) of intermediate I as mentioned above. Therefore,

17
the Fe(III)-NO complex of P450nor undergoes direct hydride donation from NADH to
form an unknown intermediate I, which is not an Fe(II)-NO complex. The nature of
this species is discussed in greater detail below.
As shown in Scheme 1.1, reaction of intermediate I with a second molecule of
NO then closes the catalytic cycle.43
The unimolecular rate constant for the
spontaneous decay of intermediate I in the absence of NO back to the ferric resting
state has been estimated to be 0.027 s-1
at 10°C. This rate constant, however, is too
small to account for the large turnover number of this enzyme. Therefore, it is
important to note that the formation of N2O from intermediate I must be highly
accelerated by excess NO. Finally, the following kinetic parameters have been
determined for the total reaction: KM = 113 nM and Vmax ≥ 1200 s-1
.34, 43
The most important question with respect to the mechanism of P450nor
concerns the exact nature of intermediate I.27
Recently, strong evidence has been
presented that this species is actually protonated.97-98
Pulse radiolysis of H2NOH has
been shown to generate •NHOH and water at a rate of 9.5 x 10⁹ M
-1s
-1.99
Upon
irradiation of H2NOH and ferric P450nor, a single Soret band was generated around
444 nm, exactly the wavelength of intermediate I.97
Based on this result, the species
at 444 nm should correspond to an [Fe-NHOH]3+
complex; more specifically, either a
ferryl heme with bound hydroxylamine anion or a ferric heme with a bound
hydroxylamine radical. In addition, the molecular mechanism of P450nor has been
elucidated using density functional theory (DFT) computations as discussed in
greater detail below.98, 100-103
Recent DFT results support these experimental
findings.98
To truly understand the exact nature of intermediate I, model complexes will
need to be employed. Unfortunately, model complex studies on P450nor suffer
18
greatly from the instability of the Fe-S bond in corresponding ferric heme-nitrosyls
(vide infra).92
Only two moderately stable ferric heme-thiolate NO model complexes
have been synthesized so far, both of which are incapable of catalyzing the
reduction of NO (Figure 1.4).74-75
In fact, reduction of the ferric heme-nitrosyl model
complex [FeIII(SPorph)(NO)] prepared by Suzuki et al. with NaBH4 led to the
formation of the corresponding six-coordinate ferrous heme-nitrosyl, as evident from
EPR. Interestingly, the formation of the initial Fe(III)-NO complex with thiolate
coordination is a completely reversible process.74
Proposed Intermediates in the Catalytic Mechanism of Cytochrome P450nor
Using DFT calculations, a number of mechanisms have been postulated for
cytochrome P450nor,100-101, 103
based on the experimentally derived, kinetic scheme
shown in Scheme 1.1. Tsukamoto et al. postulated an unusual mechanism where
the initial Fe(III)-NO complex is one-electron reduced by NADH, generating the
corresponding ferrous heme-nitrosyl and an NADH●+
radical.101
NO then dissociates
from the ferrous heme, and reacts with the NADH●+
radical to generate free nitroxyl,
NO¯. Finally, the nitroxyl anion combines with the previously generated NAD+ to form
(NAD)(NOH) in close proximity to the heme site. The second molecule of NO then
enters the active site to form N2O. However, considering the stability of ferrous
heme-nitrosyls, this is not a very likely scenario as fast NO dissociation from the
ferrous heme is unlikely.104
In fact, it could be envisioned that the sole reason for the
use of the two-electron reductant (hydride donor) NADH (compared to two individual
one-electron reductions) in P450nor catalysis is to avoid formation of a stable ferrous
heme-nitrosyl complex. Additionally, this mechanism fails to address the
experimentally observed properties of intermediate I, which does not correspond to a
19
Fe(II)-NO complex. In conclusion, the mechanism proposed by Tsukamoto et al. is
highly unrealistic.
Cytochrome P450nor has also been proposed to reduce NO via the formation
of an Fe(VI)-nitride complex100
in analogy to compound I in classic cytochrome P450
dioxygen activation chemistry. A mechanism for the formation of an Fe(VI)-nitride
intermediate could be imagined as follows: after nitrosylation to form the Fe(III)-NO
species, a two-electron reduction results in an Fe(II)-NO¯ complex, which could then
be doubly protonated. After heterolytic N-O bond cleavage, a formally Fe(VI)-nitride
intermediate is generated along with a water molecule. Reaction of the Fe(VI)-nitride
species with a second molecule of NO would then generate N2O. Finally, loss of N2O
from the heme completes the catalytic cycle. However, there is no experimental
evidence to support the formation of an Fe(VI)-nitride complex in the catalytic cycle
of cytochrome P450nor. In particular, the Fe-N stretching frequency of intermediate I
has been observed at 596 cm-1
, which is incompatible with an Fe(VI)-nitride
complex.105
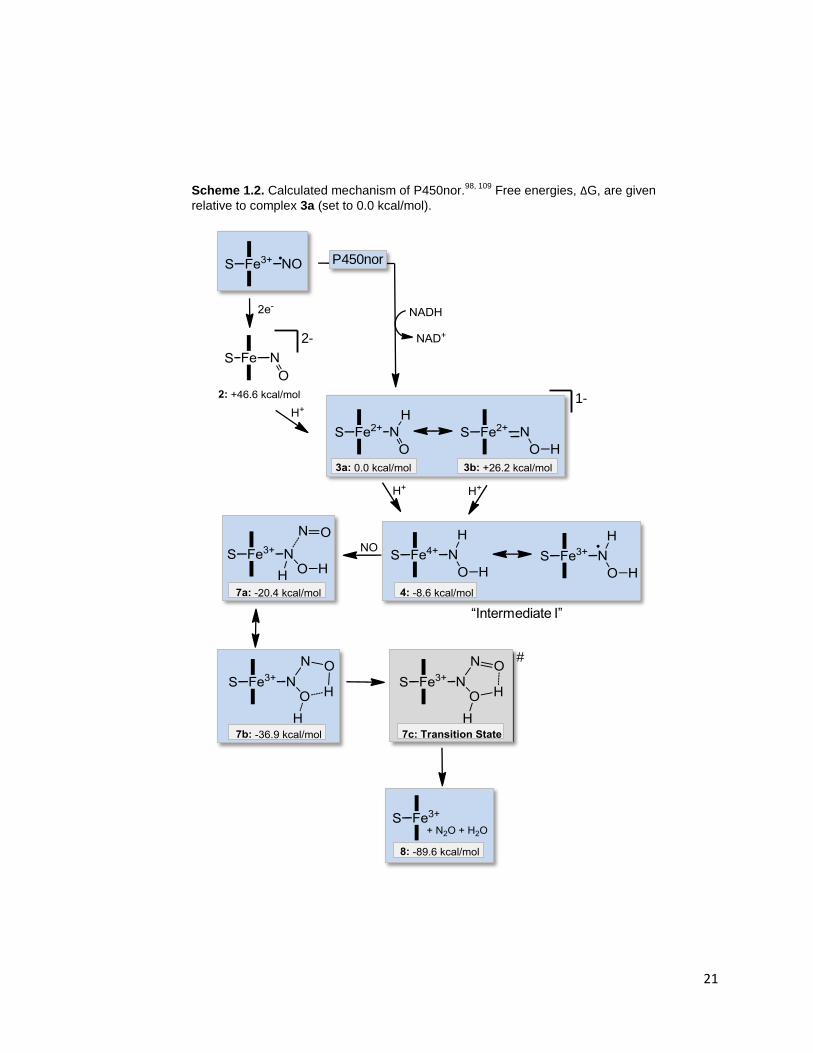
DFT calculations have also been used to evaluate the relative free energies
of potential intermediates of P450nor catalysis, leading to the postulated mechanism
shown in Scheme 1.2.98
After initial formation of the ferric heme-nitrosyl complex, a
two-electron reduction by NADH occurs, leading to a formal Fe(II)-nitroxyl complex,
2, which is very basic and immediately picks up a proton. This means that the
reaction of the Fe(III)-nitrosyl with NADH has to be considered as a hydride transfer
(see also reference 97
). The resulting protonated species can exist in the form of two
tautomers; however, the DFT calculations show that the N-protonated complex (3a)
is 26.2 kcal/mol more favorable than the O-protonated form (3b), indicating that this
species is most likely N-protonated.98
This is in agreement with results from Farmer
20
and coworkers, who studied the ferrous nitroxyl complex of Mb.106-107
In this case,
spectroscopic studies clearly indicate N-protonation of the Fe(II)-NHO species.
Vibrational data show ν(N-O) at 1385 and ν(Fe-NO) at 651 cm-1
, respectively, for
Mb(II)-NHO as listed in Table 1.3.108
In the case of P450nor, the DFT calculations
predict that the generated Fe(II)-NHO complex is still basic enough to pick up an
additional proton from aqueous solution. This finding offers an attractive explanation
for the function of the cysteinate in the active site of P450nor: the presence of the
proximal thiolate ligand increases the basicity of the Fe(II)-NHO complex, and in this
way, enables the second protonation.98
This leads to the generation of a formally
Fe(IV)-NHOH intermediate (4), which is energetically favored by 8.6 kcal/mol over
the Fe(II)-NHO species. The Fe(IV)-NHOH complex is ideally set up for the following
reaction with the second molecule of NO, which can be interpreted as a two-step
process. First, outer sphere electron transfer takes place from the incoming NO to
reduce the formally Fe(IV) center.98
This generates NO+ that then attacks the bound
NHOH¯ ligand, leading to N-N bond formation (species 7a in Scheme 1.2). This
species rearranges subsequently, forming the hyponitrous acid complex Fe(III)-
N2H2O2 (7b). Interestingly, this species is predicted to be quite stable by the DFT
calculations. Decomposition of 7b then produces N2O and water, closing the
catalytic cycle. Importantly, this process is exergonic by 53 kcal/mol and, therefore,
has a strong thermodynamic driving force.98
One of the most important questions with respect to the mechanism of
P450nor is the exact nature of intermediate I. Lehnert and coworkers believe that
intermediate I as defined in the original mechanism in Scheme 1.1 corresponds to
the doubly-protonated NHOH complex,686
in agreement with additional experimental
evidence.27, 97
Experimentally, vibrational spectroscopy could be used to determine
21
Scheme 1.2. Calculated mechanism of P450nor.98, 109
Free energies, ΔG, are given
relative to complex 3a (set to 0.0 kcal/mol).
#
“Intermediate I”
1-
2-
P450nor
22
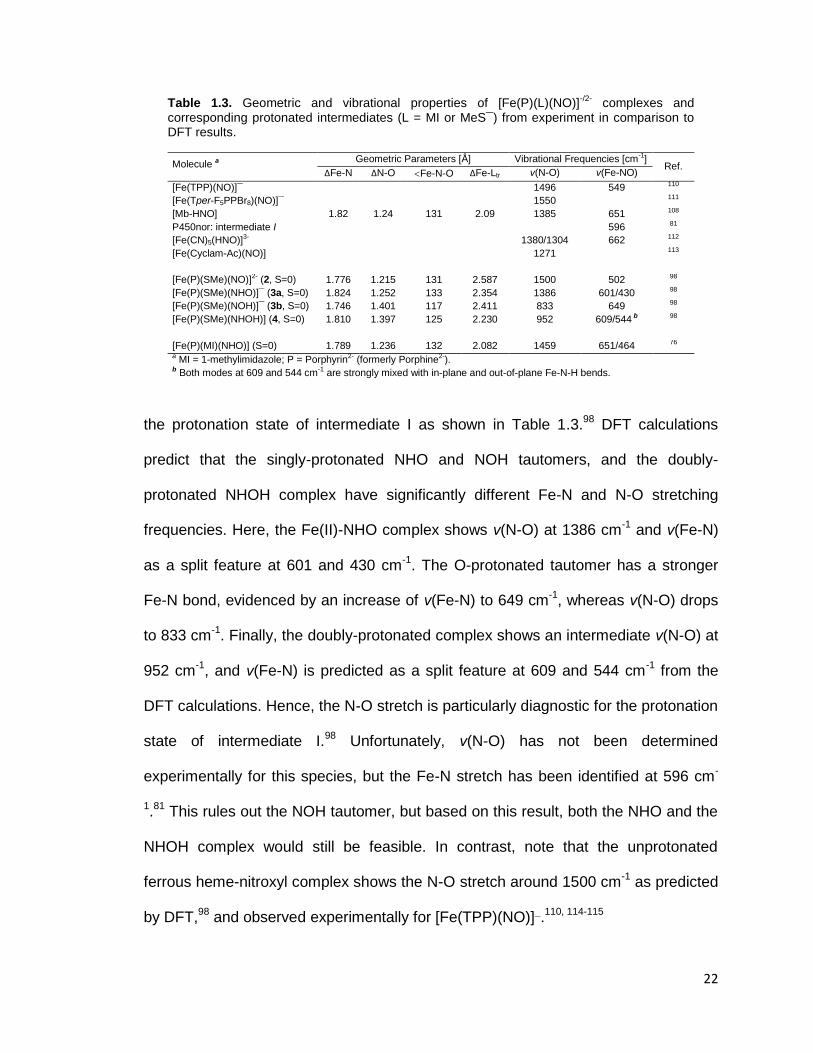
Table 1.3. Geometric and vibrational properties of [Fe(P)(L)(NO)]-/2-
complexes and corresponding protonated intermediates (L = MI or MeS¯) from experiment in comparison to DFT results.
Molecule a Geometric Parameters [Å] Vibrational Frequencies [cm-1]
Ref. ΔFe-N ΔN-O Fe-N-O ΔFe-Ltr ν(N-O) ν(Fe-NO)
[Fe(TPP)(NO)]¯ 1496 549 110
[Fe(Tper-F5PPBr8)(NO)]¯ 1550 111
[Mb-HNO] 1.82 1.24 131 2.09 1385 651 108
P450nor: intermediate I 596 81
[Fe(CN)5(HNO)]3- 1380/1304 662 112
[Fe(Cyclam-Ac)(NO)] 1271 113
[Fe(P)(SMe)(NO)]2- (2, S=0) 1.776 1.215 131 2.587 1500 502 98 98 98 98
[Fe(P)(SMe)(NHO)]¯ (3a, S=0) 1.824 1.252 133 2.354 1386 601/430
[Fe(P)(SMe)(NOH)]¯ (3b, S=0) 1.746 1.401 117 2.411 833 649
[Fe(P)(SMe)(NHOH)] (4, S=0) 1.810 1.397 125 2.230 952 609/544 b
[Fe(P)(MI)(NHO)] (S=0) 1.789 1.236 132 2.082 1459 651/464 76 a MI = 1-methylimidazole; P = Porphyrin2- (formerly Porphine2-). b Both modes at 609 and 544 cm-1 are strongly mixed with in-plane and out-of-plane Fe-N-H bends.
the protonation state of intermediate I as shown in Table 1.3.98
DFT calculations
predict that the singly-protonated NHO and NOH tautomers, and the doubly-
protonated NHOH complex have significantly different Fe-N and N-O stretching
frequencies. Here, the Fe(II)-NHO complex shows ν(N-O) at 1386 cm-1
and ν(Fe-N)
as a split feature at 601 and 430 cm-1
. The O-protonated tautomer has a stronger
Fe-N bond, evidenced by an increase of ν(Fe-N) to 649 cm-1
, whereas ν(N-O) drops
to 833 cm-1
. Finally, the doubly-protonated complex shows an intermediate ν(N-O) at
952 cm-1
, and ν(Fe-N) is predicted as a split feature at 609 and 544 cm-1
from the
DFT calculations. Hence, the N-O stretch is particularly diagnostic for the protonation
state of intermediate I.98
Unfortunately, ν(N-O) has not been determined
experimentally for this species, but the Fe-N stretch has been identified at 596 cm-
1.81
This rules out the NOH tautomer, but based on this result, both the NHO and the
NHOH complex would still be feasible. In contrast, note that the unprotonated
ferrous heme-nitroxyl complex shows the N-O stretch around 1500 cm-1
as predicted
by DFT,98
and observed experimentally for [Fe(TPP)(NO)]¯.110, 114-115
23
Similar to the molecular mechanism of P450nor discussed above, Hillier and
coworkers concluded that intermediate I corresponds to the doubly protonated
complex, Fe(IV)-NHOH, using DFT calculations.102
Intermediate I then reacts with
another molecule of NO to form a species that is similar to 7a in Scheme 1.2. At this
point the two mechanisms divert, as Hillier and coworkers predict that N2O2H2
dissociates from the iron center, and subsequently decomposes. While this
mechanism is plausible, it has been shown that the tautomerization of 7a to 7b is
energetically more favorable than loss of N2O2H2 from heme as discussed above.
Finally, computational studies on NO binding to ferric P450cam,116
and on the
properties of the reduced and protonated species shown in Scheme 1.2 with
different axial ligands to heme103, 117
have also been published.
1.4. Scope of Thesis
This thesis focuses on the generation of small molecule models of
intermediates in the catalytic cycle of P450nor. Chapter 2 focuses on modeling the
first intermediate, a six-coordinate ferric heme-nitrosyl with axial thiolate ligation. In
Section 2.1, porphyrins (including bis-picket fence porphyrins) and axial thiolate
ligands have been screened to determine the key factors for the formation of stable
ferric porphyrin nitrosyl complexes with thiolate coordination. Additionally, due to the
reactivity of the Fe-S bond towards NO, the formation and properties of six-
coordinate Fe(III) porphyrin nitrosyl complexes with alternative anionic phenolate
and acetate (O-donor) ligands are reported in Section 2.2 and Section 2.3,
respectively. The complexes [Fe(OEP)(SR-H2)], [Fe(OEP)(SR-H1)], and
[Fe(TPP)(AcF3)(NO)] were provided by our collaborator, Geroge B. Richter-Addo, at
the University of Oklahoma. Section 2.2 was completed with undergraduate student
24
Breana Siljander. Section 2.1 is reported, in part, in Inorganic Chemistry: Goodrich,
L.E.; Paulat, F.; Praneeth, V.K.K.; Lehnert, N. Inorg. Chem. 2010, 49, 6293-6316.
Section 2.3 has been submitted for publication: Xu, N.; Goodrich, L.E.; Lehnert, N.;
Powell, D.; Richter-Addo, G.B. 2012.
In Chapter 3, ferrous heme-nitroxyl complexes are studied. In P450nor, a
Fe(II)-NHO complex is formed through direct hydride transfer from NAD(P)H to a
ferric heme-nitrosyl. An alternate synthetic pathway can be envisioned where a
Fe(II)-NO complex is reduced by one electron to the corresponding Fe(II)-NO¯
species followed by protonation to form the desired Fe(II)-NHO complex. Here, the
one-electron reduction of Fe(II)-NO complexes has been studied using
spectroelectrochemistry and density functional theory (DFT) calculations.
Additionally, the reactivity of heme Fe(II)-NO¯ complexes with NO and acid have
been explored. Dr. Saikat Roy (Matzger Laboratory) performed X-ray crystallography
on [Fe(3,5-Me-BAFP)(NO)]. A manuscript is in preparation: Goodrich, L.E.; Saikat,
Roy; Matzger, A.J.; Lehnert, N. 2012, to be submitted.
Chapter 4 describes initial attempts at modeling the active species
(Intermediate I) in P450nor. From enzymatic studies, this key complex is proposed
for form the important N-N bond by reaction with a second NO molecule. Proposals
for the structure of this species include a (formally) Fe(IV)-NHOH complex or, upon
loss of H2O, a Fe(VI)-N species. Section 4.1 focuses on synthesis of Fe(III)-NHOR
bis-picket fence porphyrin complexes with the eventual goal of one-electron
oxidation to the desired ferryl complex. Section 4.2 is focused on high-valent heme-
nitride complexes. Here, the likelihood of formation of a Fe(VI)-nitride complex in the
catalytic cycle of P450nor is investigated. Irradiation of high- and low-spin ferric
azide complexes in an attempt to generate Fe(V)-nitride complexes has been
25
performed. Section 4.1 was completed with Claire Goodrich and [Fe(3,5-Me-
BAFP)(NH3)2] was crystallized by Ashley McQuarters. The starting five-coordinate
ferric azide complexes, [Fe(To-(OBn)2PP)(N3)] and [Fe(3,5-Me-BAFP)(N3)], in
Section 4.2.b were prepared by Cathy Mocny and Ashley McQuarters, respectively.
Dr. Saikat Roy (Matzger Laboratory) performed X-ray crystallography on [Fe(3,5-Me-
BAFP)(N3)].
Finally, activation of the primary mammalian nitric oxide (NO) sensor, soluble
guanylate cyclase (sGC), is discussed in Chapter 5. Through the strong
thermodynamic σ-trans effect of NO, binding of NO at the distal side of the ferrous
heme induces cleavage of the proximal Fe-NHis bond, activating the catalytic domain
of the enzyme.19-20
It has been proposed that nitroxyl (HNO) is also capable of
activating sGC, but the key question remains as to whether HNO can induce
cleavage of the Fe-NHis bond. Here, we report calculated binding constants for 1-
methylimidazole (MI) to [Fe(P)(X)] (P = porphine2-
) where X = NO, HNO, CO, and MI
to evaluate the trans interaction of these molecules, X, with the proximal imidazole
(histidine) in sGC. Additionally, calculated Fe-NMI bond lengths and key molecular
orbitals in [Fe(P)(MI)(X)] are analyzed. This work is reprinted with permission from
the Journal of Inorganic Biochemistry: Goodrich, L.E.; Lehnert, N. J. Inorg. Biochem.
2012, in press.
References 1. Moncada, S.; Palmer, R. M.; Higgs, E. A., Pharmacol. Rev. 1991, 43, 109-142.
2. Snyder, S. H., Science 1992, 257, 494-496.
3. Bredt, D. S.; Snyder, S. H., Annu. Rev. Biochem. 1994, 63, 175-195.

26
4. Ignarro, L., Nitric Oxide: Biology and Pathobiology. Academic Press: San Diego, 2000.
5. Culotta, E.; Koshland, D. E., Jr., Science 1992, 258, 1862-1865.
6. Furchgott, R. F., Angew. Chem. Int. Ed. 1999, 38, 1870-1880.
7. Ignarro, L., Angew. Chem. Int. Ed. 1999, 38, 1882-1892.
8. Murad, F., Angew. Chem. Int. Ed. 1999, 38, 1856-1868.
9. Stuehr, D. J., Annu. Rev. Pharmacol. Toxicol. 1997, 37, 339-359.
10. Fischmann, T. O.; Hruza, A.; Niu, X. D.; Fossetta, J. D.; Lunn, C. A.; Dolphin, E.; Prongay, A. J.; Reichert, P.; Lundell, D. J.; Narula, S. K.; Weber, P. C., Nat. Struct. Biol. 1999, 6, 233-242.
11. Li, H.; Poulos, T., J. Inorg. Biochem. 2005, 99, 293-305.
12. Rousseau, D. L.; Li, D.; Couture, M.; Yeh, S.-R., J. Inorg. Biochem. 2005, 99, 306-323.
13. Martin, N. I.; Woodward, J. J.; Winter, M. B.; Beeson, W. T.; Marletta, M. A., J. Am. Chem. Soc. 2007, 129, 12563-12570.
14. Stuehr, D. J.; Gross, S. S.; Sakuma, I.; Levi, R.; Nathan, C. F., J. Exp. Med. 1989, 169, 1011-1020.
15. MacMicking, J.; Xie, Q.-W.; Nathan, C., Annu. Rev. Immunol. 1997, 15, 323-350.
16. Terenzi, F.; Diaz-Guerra, J. M.; Casado, M.; Hortelano, S.; Leoni, S.; Boscá, L., J. Biol. Chem. 1995, 270, 6017-6021.
17. Montague, P. R.; Gancayco, C. D.; Winn, M. J.; Marchase, R. B.; Friedlander, M. J., Science 1994, 263, 973-977.
18. Ignarro, L. J., J. Biochem. Soc. Trans. 1992, 20, 465-469.
19. Traylor, T. G.; Sharma, V. S., Biochemistry 1992, 31, 2847-2849.
20. Zhao, Y.; Brandish, P. E.; Ballou, D. P.; Marletta, M. A., Proc. Natl. Acad. Sci. USA 1999, 96, 14753-14758.
21. Goodrich, L. E.; Paulat, F.; Praneeth, V. K. K.; Lehnert, N., Inorg. Chem. 2010, 49, 6293-6316.
22. Olson, J. S.; Foley, E. W.; Rogge, C.; Tsai, A.-L.; Doyle, M. P.; Lemon, D. D., Free Rad. Biol. Med. 2004, 36, 685-697.
23. Gardner, P. R.; Gardner, A. M.; Martin, L. A.; Salzman, A. L., Proc. Natl. Acad. Sci. USA 1998, 95, 10378-10383.
27
24. Eich, R. F.; Li, T.; Lemon, D. D.; Doherty, D. H.; Curry, S. R.; Aitken, J. F.; Mathews, A. J.; Johnson, K. A.; Smith, R. D.; Phillips, G. N., Jr.; Olson, J. S., Biochemistry 1996, 35, 6976-6983.
25. Zumft, W. G., J. Inorg. Biochem. 2005, 99, 194-215.
26. Wasser, I. M.; deVries, S.; Moënne-Loccoz, P.; Schröder, I.; Karlin, K. D., Chem. Rev. 2002, 102, 1201-1234.
27. Daiber, A.; Shoun, H.; Ullrich, V., J. Inorg. Biochem. 2005, 99, 185-193
28. Kizawa, H.; Tomura, D.; Oda, M.; Fukamizu, A.; Hoshino, T.; Gotoh, O.; Yasui, T.; Shoun, H., J. Biol. Chem. 1991, 266, 10632-10637.
29. Lehnert, N.; Berto, T. C.; Galinato, M. G. I.; Goodrich, L. E., The Role of Heme-Nitrosyls in the Biosynthesis, Transport, Sensing, and Detoxification of Nitric Oxide (NO) in Biological Systems: Enzymes and Model Complexes. In The Handbook of Porphyrin Science, Kadish, K.; Smith, K.; Guilard, R., Eds. World Scientific: 2011; Vol. 15, pp 1-247.
30. Zhang, L.; Kudo, T.; Takaya, N.; Shoun, H. In Distribution, structure and function of fungal nitric oxide reductase P450nor—recent advances, Int. Cong. Ser., Elsevier: 2002; pp 197-202.
31. Denisov, I. G.; Makris, T. M.; Sligar, S. G.; Schlichting, I., Chem. Rev. 2005, 105, 2253-77.
32. Peterson, J. A.; Graham, S. E., Structure 1998, 6, 1079-1085.
33. Park, S.-Y.; Shimizu, H.; Adachi, S.; Nagagawa, A.; Tanaka, I.; Nakahara, K.; Shoun, H.; Obayashi, E.; Nakamura, H.; Iizuka, T.; Shiro, Y., Nat. Struct. Biol. 1997, 4, 827-832.
34. Nakahara, K.; Tanimoto, T.; Hatano, K.; Usuda, K.; Shoun, H., J. Biol. Chem. 1993, 268, 8350-8355.
35. Shoun, H.; Tanimoto, T., J. Biol. Chem. 1991, 266, 11078-11082.
36. Takaya, N.; Shoun, H., Mol. Gen. Gent. 2000, 263, 342-348.
37. Zumft, W., Microbiol. Mol. Biol. Rev. 1997, 61, 533-616.
38. Takaya, N.; Kuwazaki, S.; Adachi, Y.; Suzuki, S.; Kikuchi, T.; Nakamura, H.; Shiro, Y.; Shoun, H., J. Biochem. 2003, 133, 461-465.
39. Zhou, Z.; Takaya, N.; Sakairi, M. A. C.; Shoun, H., Arch. Microbiol. 2001, 175, 19-25.
40. Kobayashi, M.; Matsuo, Y.; Takimoto, A.; Suzuki, S.; Maruo, F.; Shoun, H., J. Biol. Chem. 1996, 271, 16263-16267.

28
41. Tanimoto, T.; Nakahara, K.; Shoun, H., Biosci. Biotech. Biochem. 1992, 56, 2058-2059.
42. Heiss, B.; Frunzke, K.; Zumft, W. G., J. Bacteriol. 1989, 171, 3288-3297.
43. Shiro, Y.; Fujii, M.; Iizuka, T.; Adachi, S.; Tsukamoto, K.; Nakahara, K.; Shoun, H., J. Biol. Chem. 1995, 270, 1617-1623.
44. Shoun, H.; Suyama, W.; Yasui, T., FEBS Lett. 1989, 244, 11-14.
45. Usuda, K.; Toritsuka, N.; Matsuo, Y.; Kim, D. H.; Shoun, H., Appl. Environ. Microbiol. 1995, 61, 883-889.
46. Kudo, T.; Tomura, D.; Liu, D. L.; Dai, X. Q.; Shoun, H., Biochimie 1996, 78, 792-799.
47. Tsuruta, S.; Takaya, N.; Zhang, L.; Shoun, H.; Kimura, K.; Hamamoto, M.; Nakase, T., FEMS Microbiol. Lett. 1998, 168, 105-110.
48. Zhang, L.; Takaya, N.; Kitazume, T.; Kondo, T.; Shoun, H., Eur. J. Biochem. 2001, 268, 3198-3204.
49. Shoun, H.; Kano, M.; Baba, I.; Takaya, N.; Matsuo, M., J. Bacteriol. 1998, 180, 4413-4415.
50. Shoun, H.; Kim, D. H.; Uchiyama, H.; Sugiyama, J., FEMS Microbiol. Lett. 1992, 94, 277-282.
51. Tomura, D.; Obika, K.; Fukamizu, A.; Shoun, H., J. Biochem. 1994, 116, 88-94.
52. Takaya, N.; Suzuki, S.; Kuwazaki, S.; Shoun, H.; Maruo, F.; Yamaguchi, M.; Takeo, K., Arch. Biochem. Biophys. 1999, 372, 340-346.
53. Nakahara, K.; Shoun, H., J. Biochem. 1996, 120, 1082-1087.
54. Watsuji, T. O.; Takaya, N.; Nakamura, A.; Shoun, H., Biosci. Biotech. Biochem. 2003, 67, 1109-1114.
55. Shimizu, H.; Park, S. Y.; Lee, D. S.; Shoun, H.; Shiro, Y., J. Inorg. Biochem. 2000, 81, 191-205.
56. Shimizu, H.; Park, S.-Y.; Shiro, Y.; Adachi, S.-I., Acta Crystallogr. D 2002, 58, 81.
57. Oshima, R.; Fushinobu, S.; Su, F.; Zhang, L.; Takaya, N.; Shoun, H., J. Mol. Biol. 2004, 342, 207-217.
58. Shimizu, H.; Park, S.-Y.; Gomi, Y.; Arakawa, H.; Nakamura, H.; Adachi, S.-I.; Obayashi, E.; Iizuka, T.; Shoun, H.; Shiro, Y., J. Biol. Chem. 2000, 275, 4816-4826.
59. Obayashi, E.; Shimizu, H.; Park, S. Y.; Shoun, H.; Shiro, Y., J. Inorg. Biochem. 2000, 82, 103-111.
29
60. Lee, D. S.; Park, S. Y.; Yamane, K.; Obayashi, E.; Hori, H.; Shiro, Y., Biochemistry 2001, 40, 2669-2677.
61. Kudo, T.; Takaya, N.; Park, S. Y.; Shiro, Y.; Shoun, H., J. Biol. Chem. 2001, 276, 5020-5026.
62. Poulos, T. L.; Finzel, B. C.; Howard, A. J., Biochemistry 1986, 25, 5314-5322.
63. Gotoh, O., J. Biol. Chem. 1992, 267, 83-90.
64. Hasemann, C. A.; Ravichandran, K. G.; Peterson, J. A.; Deisenhofer, J., J. Mol. Biol. 1994, 236, 1169-1185.
65. Cupp-Vickery, J. R.; Poulos, T. L., Nat. Struct. Mol. Biol. 1995, 2, 144-153.
66. Zhang, L.; Kudo, T.; Takaya, N.; Shoun, H., J. Biol. Chem. 2002, 277, 33842-33847.
67. Okamoto, N.; Imai, Y.; Shoun, H.; Shiro, Y., Biochemistry 1998, 37, 8839-8847.
68. Okamoto, N.; Tsuruta, K.; Imai, Y.; Tomura, D.; Shoun, H., Arch. Biochem. Biophys. 1997, 337, 338-344.
69. Poulos, T. L.; Finzel, B. C.; Howard, A. J., J. Mol. Biol. 1987, 195, 687-700.
70. Ding, X. D.; Weichsel, A.; Andersen, J. F.; Shokhireva, T. K.; Balfour, C.; Pierik, A. J.; Averill, B. A.; Montfort, W. R.; Walker, F. A., J. Am. Chem. Soc. 1999, 121, 128-138.
71. Praneeth, V. K. K.; Paulat, F.; Berto, T. C.; DeBeer George, S.; Näther, C.; Sulok, C. D.; Lehnert, N., J. Am. Chem. Soc. 2008, 130, 15288-15303.
72. Cheng, L.; Richter-Addo, G. B., Binding and Activation of Nitric Oxide by Metalloporphyrins and Heme. In The Porphyrin Handbook, Kadish, K. M.; Smith, K. M.; Guilard, R., Eds. Academic Press: New York, 2000; Vol. 4, Chapter 33, pp 219-291.
73. Wyllie, G. R. A.; Scheidt, W. R., Chem. Rev. 2002, 102, 1067-1090.
74. Suzuki, N.; Higuchi, T.; Urano, Y.; Kikuchi, K.; Uchida, T.; Mukai, M.; Kitagawa, T.; Nagano, T., J. Am. Chem. Soc. 2000, 122, 12059-12060.
75. Xu, N.; Powell, D. R.; Cheng, L.; Richter-Addo, G. B., Chem. Commun. 2006, 2030-2032.
76. Goodrich, L. E.; Paulat, F.; Praneeth, V. K. K.; Lehnert, N., Inorg. Chem. 2010, 49, 6293-6316.
77. Obayashi, E.; Tsukamoto, K.; Adachi, S.; Takahashi, S.; Nomura, M.; Iizuka, T.; Shoun, H.; Shiro, Y., J. Am. Chem. Soc. 1997, 119, 7807-7816.
78. Hu, S.; Kincaid, J. R., J. Am. Chem. Soc. 1991, 113, 2843-2850.
30
79. Hu, S.; Kincaid, J. R., J. Am. Chem. Soc. 1991, 113, 9760-9766.
80. Paulat, F.; Lehnert, N., Inorg. Chem. 2007, 46, 1547-1549.
81. Obayashi, E.; Takahashi, S.; Shiro, Y., J. Am. Chem. Soc. 1998, 120, 12964-12965.
82. Scheidt, W. R.; Lee, Y. J.; Hatano, K., J. Am. Chem. Soc. 1984, 106, 3191-3198.
83. Ellison, M. K.; Scheidt, W. R., J. Am. Chem. Soc. 1999, 121, 5210-5219.
84. Ellison, M. K.; Schulz, C. E.; Scheidt, W. R., J. Am. Chem. Soc. 2002, 124, 13833-13841.
85. Yi, G.-B.; Chen, L.; Khan, M. A.; Richter-Addo, G. B., Inorg. Chem. 1997, 36, 3876-3885.
86. Shiro, Y.; Fujii, M.; Isogai, Y.; Adachi, S.; Iizuka, T.; Obayashi, E.; Makino, R.; Nakahara, K.; Shoun, H., Biochemistry 1995, 34, 9052-9058.
87. Park, S. Y.; Shimizu, H.; Adachi, S.; Shiro, Y.; Iizuka, T.; Nakagawa, A.; Tanaka, I.; Shoun, H.; Hori, H., FEBS Lett. 1997, 412, 346-350.
88. Shoun, H.; Sudo, Y.; Seto, Y.; Beppu, T., J. Biochem. 1983, 94, 1219-1229.
89. Lipscomb, J. D., Biochemistry 1980, 19, 3590-3599.
90. Singh, U. P.; Obayashi, E.; Takahashi, S.; Iizuka, T.; Shoun, H.; Shiro, Y., Biochim. Biophys. Acta 1998, 1384, 103-111.
91. Franke, A.; Stochel, G.; Jung, C.; Van Eldik, R., J. Am. Chem. Soc. 2004, 126, 4181-4191.
92. Franke, A.; Stochel, G.; Suzuki, N.; Higuchi, T.; Okuzono, K.; van Eldik, R., J. Am. Chem. Soc. 2005, 127, 5360-5375.
93. Franke, A.; Hessenauer-Ilicheva, N.; Meyer, D.; Stochel, G.; Woggon, W.-D.; van Eldik, R., J. Am. Chem. Soc. 2006, 128, 13611-13624.
94. Ivanovic-Burmazovic, I.; van Eldik, R., J. Chem. Soc. Dalton Trans. 2008, 5259-5275.
95. Makino, T.; Iizuka, T.; Sakaguchi, K.; Ishimura, Y., Oxygenase and Oxygen Metabolism. Academic Press: New York, 1982; p 466-477.
96. Gunsalus, I. C.; Meeks, J. R.; Lipscomb, J. D.; Debrunner, P.; Munck, E., Molecular mechanisms of oxygen activation. Academic Press: New York, 1974; p 599-613.
97. Daiber, A.; Nauser, T.; Takaya, N.; Kudo, T.; Weber, P.; Hultschig, C.; Shoun, H.; Ullrich, V., J. Inorg. Biochem. 2002, 88, 343-352.
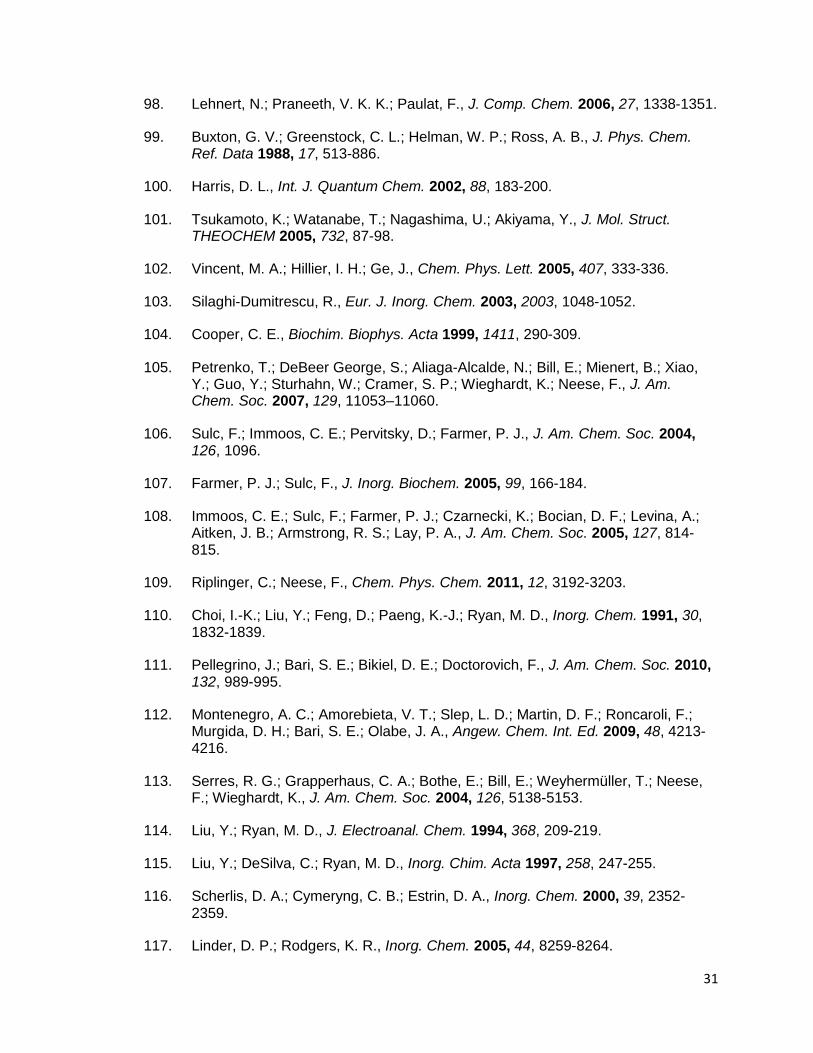
31
98. Lehnert, N.; Praneeth, V. K. K.; Paulat, F., J. Comp. Chem. 2006, 27, 1338-1351.
99. Buxton, G. V.; Greenstock, C. L.; Helman, W. P.; Ross, A. B., J. Phys. Chem. Ref. Data 1988, 17, 513-886.
100. Harris, D. L., Int. J. Quantum Chem. 2002, 88, 183-200.
101. Tsukamoto, K.; Watanabe, T.; Nagashima, U.; Akiyama, Y., J. Mol. Struct. THEOCHEM 2005, 732, 87-98.
102. Vincent, M. A.; Hillier, I. H.; Ge, J., Chem. Phys. Lett. 2005, 407, 333-336.
103. Silaghi-Dumitrescu, R., Eur. J. Inorg. Chem. 2003, 2003, 1048-1052.
104. Cooper, C. E., Biochim. Biophys. Acta 1999, 1411, 290-309.
105. Petrenko, T.; DeBeer George, S.; Aliaga-Alcalde, N.; Bill, E.; Mienert, B.; Xiao, Y.; Guo, Y.; Sturhahn, W.; Cramer, S. P.; Wieghardt, K.; Neese, F., J. Am. Chem. Soc. 2007, 129, 11053–11060.
106. Sulc, F.; Immoos, C. E.; Pervitsky, D.; Farmer, P. J., J. Am. Chem. Soc. 2004, 126, 1096.
107. Farmer, P. J.; Sulc, F., J. Inorg. Biochem. 2005, 99, 166-184.
108. Immoos, C. E.; Sulc, F.; Farmer, P. J.; Czarnecki, K.; Bocian, D. F.; Levina, A.; Aitken, J. B.; Armstrong, R. S.; Lay, P. A., J. Am. Chem. Soc. 2005, 127, 814-815.
109. Riplinger, C.; Neese, F., Chem. Phys. Chem. 2011, 12, 3192-3203.
110. Choi, I.-K.; Liu, Y.; Feng, D.; Paeng, K.-J.; Ryan, M. D., Inorg. Chem. 1991, 30, 1832-1839.
111. Pellegrino, J.; Bari, S. E.; Bikiel, D. E.; Doctorovich, F., J. Am. Chem. Soc. 2010, 132, 989-995.
112. Montenegro, A. C.; Amorebieta, V. T.; Slep, L. D.; Martin, D. F.; Roncaroli, F.; Murgida, D. H.; Bari, S. E.; Olabe, J. A., Angew. Chem. Int. Ed. 2009, 48, 4213-4216.
113. Serres, R. G.; Grapperhaus, C. A.; Bothe, E.; Bill, E.; Weyhermüller, T.; Neese, F.; Wieghardt, K., J. Am. Chem. Soc. 2004, 126, 5138-5153.
114. Liu, Y.; Ryan, M. D., J. Electroanal. Chem. 1994, 368, 209-219.
115. Liu, Y.; DeSilva, C.; Ryan, M. D., Inorg. Chim. Acta 1997, 258, 247-255.
116. Scherlis, D. A.; Cymeryng, C. B.; Estrin, D. A., Inorg. Chem. 2000, 39, 2352-2359.
117. Linder, D. P.; Rodgers, K. R., Inorg. Chem. 2005, 44, 8259-8264.

32
Chapter 2
Six-Coordinate Ferric Heme-Nitrosyl Complexes
The first step in reduction of nitric oxide (NO) to nitrous oxide (N2O) by
cytochrome P450 nitric oxide reductase (P450nor) is formation of a ferric heme-
nitrosyl intermediate with bound cysteinate, as discussed in detail in Chapter 1.
Therefore, in order to model the reaction cycle of P450nor, stable ferric heme-
nitrosyl complexes are necessary. However, synthesis of these model complexes is
not a trivial task as ferric heme-nitrosyls are intrinsically labile with respect to loss of
NO. This is in contrast to the very stable and generally unreactive ferrous heme-
nitrosyls. The binding constant for NO to ferrous heme complexes is in the range of
1011
– 1012
M-1
which equates to a free energy (ΔG) of NO binding of -15 to -16
kcal/mol,1-4
highly favorable with respect to association of NO. The binding constant
of NO to ferric heme-nitrosyls is significantly lower and generally ranges from 103 to
105 M
-1, translating to a ΔG of only -4 to -7 kcal/mol.
5-8 This difference in intrinsic
binding constants is nicely illustrated by water-soluble model complexes with
H2TPPS (TPPS2−
= tetra(4-sulfonatophenyl)porphyrin) investigated by Laverman et
al.:2 in the ferrous case, Keq equals 2.3 x 10
12 M
–1, which drops to 1.0 x 10
3 M
–1 in the
analogous ferric complex. Additionally, ferric heme-nitrosyl complexes are prone to a
process called “reductive nitrosylation.” Due to the Fe(II)–NO+ electronic structure of
these species, the coordinated NO is actually electrophilic, and reacts with various
bases including alcohols, water, amines, and thiols. This leads to the generation of
33
the corresponding ferrous heme-nitrosyl in the presence of excess NO.9-11
In terms
of model complex synthesis, the reactivity and instability of the coordinated NO in
ferric hemes constitutes a significant challenge for the preparation and
characterization of model compounds for structural and spectroscopic analysis.
The first crystal structure of a ferric heme-nitrosyl complex,
[Fe(TPP)(H2O)(NO)](ClO4), with bound water in axial position was not published until
1984 by Scheidt and co-workers.12
While this was a significant step towards
modeling ferric heme-nitrosyls in biological systems, ideal model complexes would
be six-coordinate with N- or S-donor ligands to accurately model enzyme active site
structure. It was not until 15 years later that the structures of a series of six-
coordinate octaethylporphyrin (OEP) complexes with axial N-donor coordination (1-
methylimidazole, pyrazole, indazole, pyrazine) were reported.13
Since that time,
significant spectroscopic characterization of ferric-nitrosyl complexes with neutral N-
donor ligands has been performed.13-17
Surprisingly, however, this is not the case for
ferric heme-nitrosyl model complexes with anionic S-donors, as is found in P450nor.
In this case, there is an added complication in the synthesis of these systems—the
axial thiolate ligand is susceptible to S-nitrosylation by NO, leading to decomposition
of the complex. This is unfortunate as the presence of the axial S-donor ligand is
predicted to be responsible for new, interesting ferric heme-nitrosyl properties. To
this end, Chapter 2 describes the preparation and characterization of six-coordinate
ferric heme-nitrosyl model complexes with thiolate (S-donor) coordination.
Additionally, due to the non-innocence of the Fe-S bond with respect to nitric oxide
(discussed below), the formation and properties of six-coordinate iron(III) porphyrin
nitrosyl complexes with anionic phenolate and acetate (O-donor) ligands are
reported.

34
2.1. Ferric Heme-Nitrosyls with Thiolate Coordination
The first indication that the presence of an axial (proximal) thiolate ligand
leads to new, interesting properties came from the crystal structure of ferric P450nor
with bound NO, shown in Figure 1.3.18
This structure exhibits a bent Fe-N-O unit with
an Fe-N-O angle of ~160o as described in Chapter 1. In contrast, ferric heme-
nitrosyls with axial coordination of neutral N-donor ligands show linear Fe-N-O units.
There are several possible explanations for this finding, including (a) a cryo-
reduction of the single crystal generating a mixture of ferrous and ferric heme-
nitrosyls, which would lead to a superposition of these structures with an
intermediate Fe-N-O angle, (b) a steric effect of the active site pocket of the protein
that would force the Fe-N-O unit to bend (as has been proposed for the Fe-C-O unit
in CO-bound ferrous globins), or (c) an electronic effect. However, the crystal
structure of P450nor(III)-NO is not indicative of strong steric interactions of protein
side chains with the bound NO in disagreement with (b).
To date, only one ferric heme-nitrosyl model complex with thiolate
coordination has been structurally characterized. This complex, [Fe(OEP)(SR-
H2)(NO)] (SR-H2¯ = S-2,6-(CF3CONH)2C6H3), shown in Figure 1.4, left, exhibits a
bent Fe-N-O unit with an Fe-N-O angle of 160o, very similar to the structure of
P450nor(III)-NO.19
This result provides direct evidence that this bending of the Fe-N-
O unit in ferric heme-nitrosyls with axial thiolate coordination is caused by an
electronic effect, which indicates that this is an intrinsic feature of this class of
complexes. The vibrational data collected in Table 1.2 highlight another
consequence of thiolate coordination to ferric heme-nitrosyls: in this case, N-O and
Fe-NO stretching frequencies are typically observed at about 1820 – 1850 and 510 –
35
530 cm-1
, respectively, in different proteins. These vibrational energies are
distinctively lower compared to the imidazole ligated proteins, where ν(N-O) and
ν(Fe-NO) are found at ~1900 and ~590 cm-1
, respectively.15
Although interesting structural and vibrational differences have been
highlighted between ferric heme-nitrosyls with N- versus S-donor ligands, only one
model complex has been successfully characterized in solution, [FeIII(SPorph)(NO)]
where SPorph is a porphyrin with a tethered thiolate ligand (Figure 1.4, right).20
This
system, however, fails to act as a model for P450nor reactivity. Upon addition of a
hydride source to [FeIII
(SPorph)(NO)], the resulting product quickly decomposes to
[FeII(SPorph)(NO)], rather than the desired two-electron reduced species
[FeII(SPorph)(NHO)].
20 This decomposition is hypothesized to be a result of
disproportionation of two intermediately formed Fe(II)-NHO complexes into two
Fe(II)-NO species and H2. As a result, model complexes are necessary that prevent
interaction of the formed ferrous-NHO species. To accomplish this task, we propose
the use of bis-picket fence porphyrins to create a sterically hindered binding pocket
for NO intermediates in the mechanistic cycle of P450nor. In this section, we screen
porphyrins (including bis-picket fence porphyrins) and axial thiolate ligands to
determine the key factors for the formation of stable ferric porphyrin nitrosyl
complexes with thiolate coordination. Such stable complexes are a necessity for
future reactivity studies.
Synthesis and Characterization of Ferric Porphyrin Thiolate Precursors
The synthesis of ferric heme-thiolate complexes has been published
previously;21-25
however, the methodology has proven difficult to apply across a
series of porphyrin and thiolate ligands. As a result, we have explored alternate
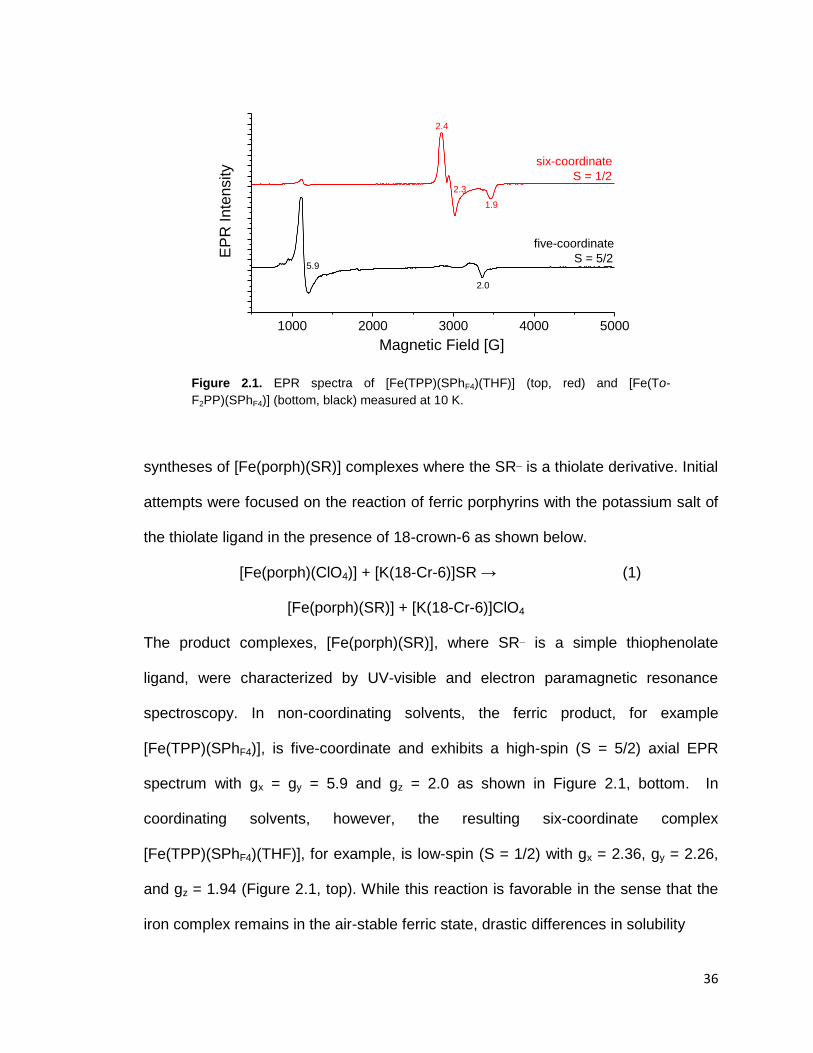
36
Figure 2.1. EPR spectra of [Fe(TPP)(SPhF4)(THF)] (top, red) and [Fe(To-
F2PP)(SPhF4)] (bottom, black) measured at 10 K.
syntheses of [Fe(porph)(SR)] complexes where the SR¯ is a thiolate derivative. Initial
attempts were focused on the reaction of ferric porphyrins with the potassium salt of
the thiolate ligand in the presence of 18-crown-6 as shown below.
[Fe(porph)(ClO4)] + [K(18-Cr-6)]SR → (1)
[Fe(porph)(SR)] + [K(18-Cr-6)]ClO4
The product complexes, [Fe(porph)(SR)], where SR¯ is a simple thiophenolate
ligand, were characterized by UV-visible and electron paramagnetic resonance
spectroscopy. In non-coordinating solvents, the ferric product, for example
[Fe(TPP)(SPhF4)], is five-coordinate and exhibits a high-spin (S = 5/2) axial EPR
spectrum with gx = gy = 5.9 and gz = 2.0 as shown in Figure 2.1, bottom. In
coordinating solvents, however, the resulting six-coordinate complex
[Fe(TPP)(SPhF4)(THF)], for example, is low-spin (S = 1/2) with gx = 2.36, gy = 2.26,
and gz = 1.94 (Figure 2.1, top). While this reaction is favorable in the sense that the
iron complex remains in the air-stable ferric state, drastic differences in solubility
1000 2000 3000 4000 5000
2.0
5.9
six-coordinate
S = 1/2
five-coordinate
S = 5/2
Magnetic Field [G]
EP
R Inte
nsity
2.4
2.3
1.9
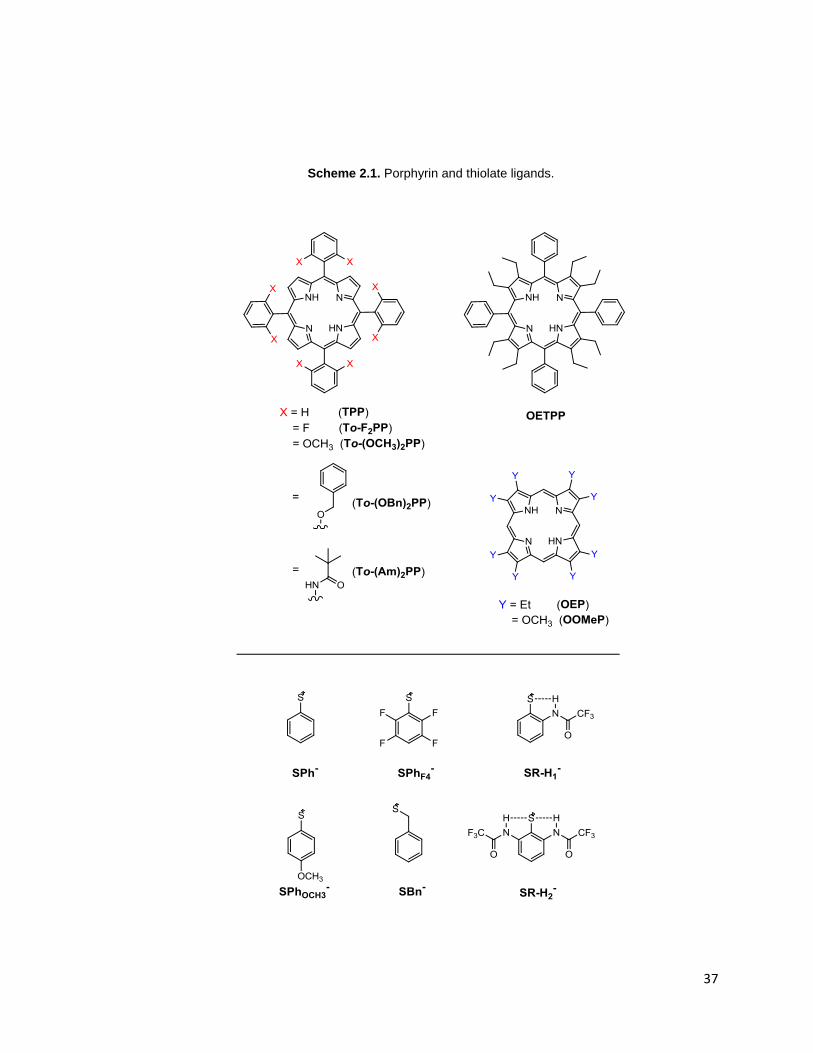
37
Scheme 2.1. Porphyrin and thiolate ligands.
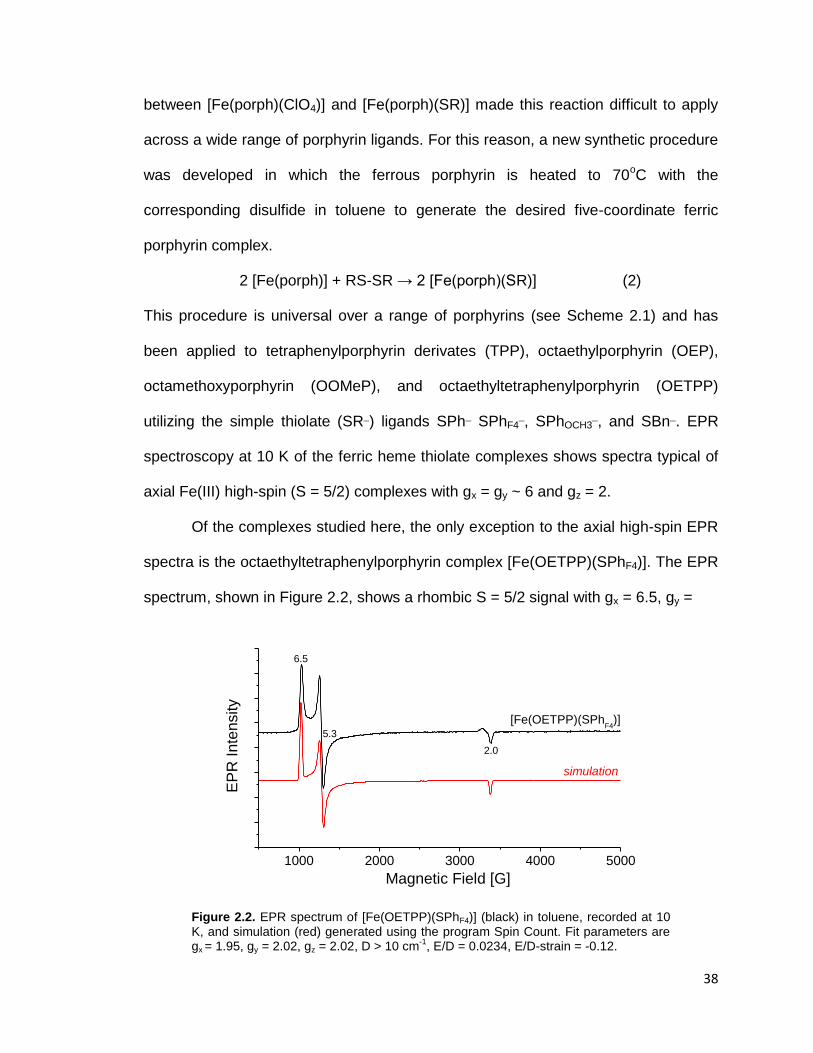
38
between [Fe(porph)(ClO4)] and [Fe(porph)(SR)] made this reaction difficult to apply
across a wide range of porphyrin ligands. For this reason, a new synthetic procedure
was developed in which the ferrous porphyrin is heated to 70oC with the
corresponding disulfide in toluene to generate the desired five-coordinate ferric
porphyrin complex.
2 [Fe(porph)] + RS-SR → 2 [Fe(porph)(SR)] (2)
This procedure is universal over a range of porphyrins (see Scheme 2.1) and has
been applied to tetraphenylporphyrin derivates (TPP), octaethylporphyrin (OEP),
octamethoxyporphyrin (OOMeP), and octaethyltetraphenylporphyrin (OETPP)
utilizing the simple thiolate (SR¯) ligands SPh¯ SPhF4¯, SPhOCH3¯, and SBn¯. EPR
spectroscopy at 10 K of the ferric heme thiolate complexes shows spectra typical of
axial Fe(III) high-spin (S = 5/2) complexes with gx = gy ~ 6 and gz = 2.
Of the complexes studied here, the only exception to the axial high-spin EPR
spectra is the octaethyltetraphenylporphyrin complex [Fe(OETPP)(SPhF4)]. The EPR
spectrum, shown in Figure 2.2, shows a rhombic S = 5/2 signal with gx = 6.5, gy =
Figure 2.2. EPR spectrum of [Fe(OETPP)(SPhF4)] (black) in toluene, recorded at 10 K, and simulation (red) generated using the program Spin Count. Fit parameters are gx = 1.95, gy = 2.02, gz = 2.02, D > 10 cm
-1, E/D = 0.0234, E/D-strain = -0.12.
1000 2000 3000 4000 5000
[Fe(OETPP)(SPhF4
)]
Magnetic Field [G]
EP
R Inte
nsity
simulation
6.5
5.3
2.0
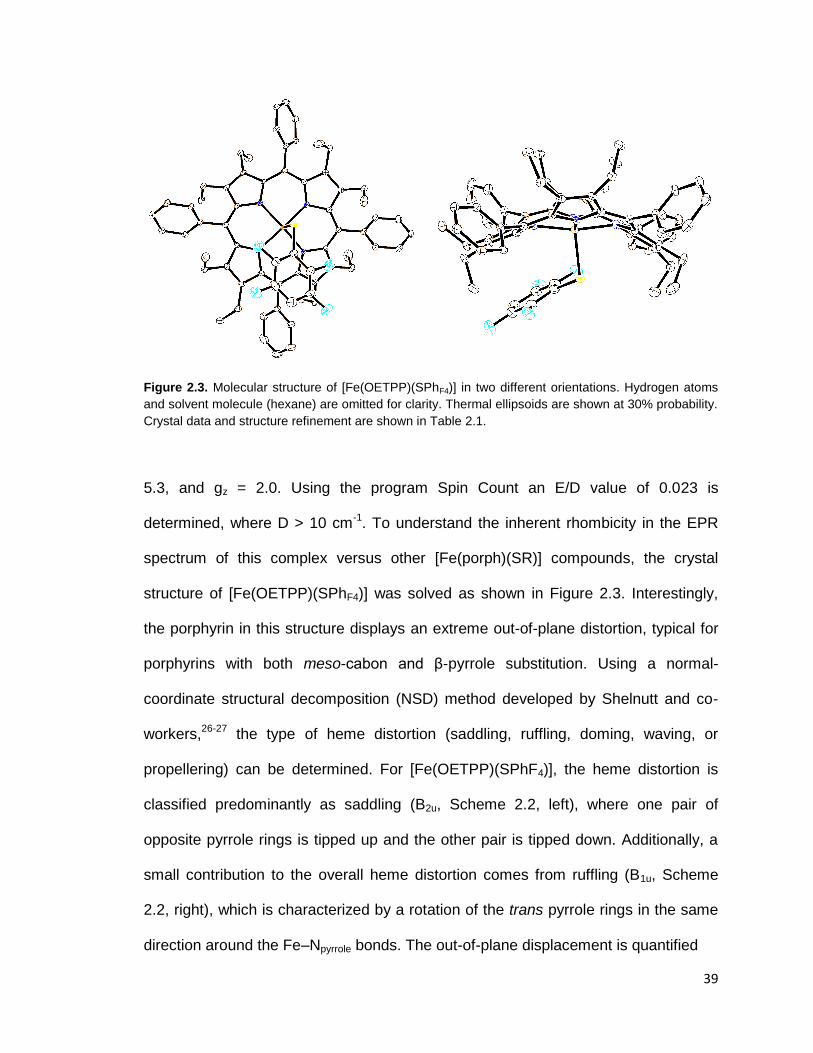
39
Figure 2.3. Molecular structure of [Fe(OETPP)(SPhF4)] in two different orientations. Hydrogen atoms
and solvent molecule (hexane) are omitted for clarity. Thermal ellipsoids are shown at 30% probability.
Crystal data and structure refinement are shown in Table 2.1.
5.3, and gz = 2.0. Using the program Spin Count an E/D value of 0.023 is
determined, where D > 10 cm-1
. To understand the inherent rhombicity in the EPR
spectrum of this complex versus other [Fe(porph)(SR)] compounds, the crystal
structure of [Fe(OETPP)(SPhF4)] was solved as shown in Figure 2.3. Interestingly,
the porphyrin in this structure displays an extreme out-of-plane distortion, typical for
porphyrins with both meso-cabon and β-pyrrole substitution. Using a normal-
coordinate structural decomposition (NSD) method developed by Shelnutt and co-
workers,26-27
the type of heme distortion (saddling, ruffling, doming, waving, or
propellering) can be determined. For [Fe(OETPP)(SPhF4)], the heme distortion is
classified predominantly as saddling (B2u, Scheme 2.2, left), where one pair of
opposite pyrrole rings is tipped up and the other pair is tipped down. Additionally, a
small contribution to the overall heme distortion comes from ruffling (B1u, Scheme
2.2, right), which is characterized by a rotation of the trans pyrrole rings in the same
direction around the Fe–Npyrrole bonds. The out-of-plane displacement is quantified
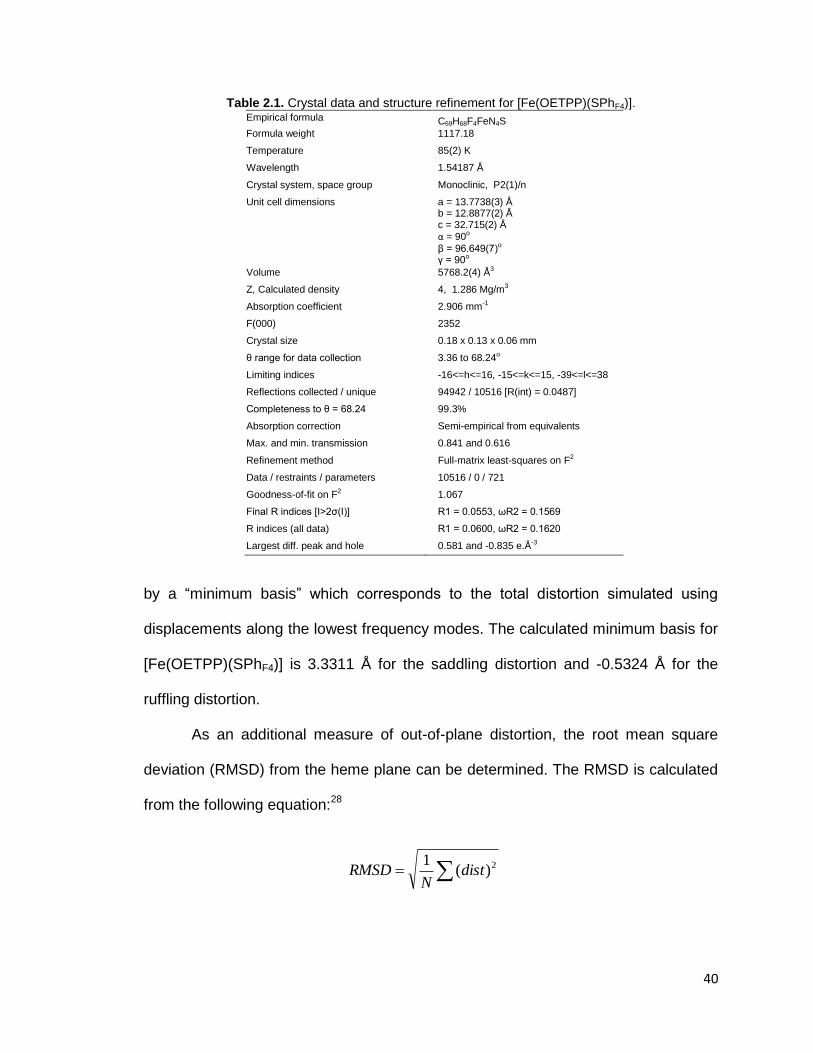
40
Table 2.1. Crystal data and structure refinement for [Fe(OETPP)(SPhF4)]. Empirical formula C69H68F4FeN4S
Formula weight 1117.18
Temperature 85(2) K
Wavelength 1.54187 Å
Crystal system, space group Monoclinic, P2(1)/n
Unit cell dimensions a = 13.7738(3) Å b = 12.8877(2) Å c = 32.715(2) Å
α = 90o
β = 96.649(7)o γ = 90o
Volume 5768.2(4) Å3
Z, Calculated density 4, 1.286 Mg/m3
Absorption coefficient 2.906 mm-1
F(000) 2352
Crystal size 0.18 x 0.13 x 0.06 mm
θ range for data collection 3.36 to 68.24o
Limiting indices -16<=h<=16, -15<=k<=15, -39<=l<=38
Reflections collected / unique 94942 / 10516 [R(int) = 0.0487]
Completeness to θ = 68.24 99.3%
Absorption correction Semi-empirical from equivalents
Max. and min. transmission 0.841 and 0.616
Refinement method Full-matrix least-squares on F2
Data / restraints / parameters 10516 / 0 / 721
Goodness-of-fit on F2 1.067
Final R indices [I>2σ(I)] R1 = 0.0553, ωR2 = 0.1569
R indices (all data) R1 = 0.0600, ωR2 = 0.1620
Largest diff. peak and hole 0.581 and -0.835 e.Å-3
by a “minimum basis” which corresponds to the total distortion simulated using
displacements along the lowest frequency modes. The calculated minimum basis for
[Fe(OETPP)(SPhF4)] is 3.3311 Å for the saddling distortion and -0.5324 Å for the
ruffling distortion.
As an additional measure of out-of-plane distortion, the root mean square
deviation (RMSD) from the heme plane can be determined. The RMSD is calculated
from the following equation:28
2)(1
distN
RMSD
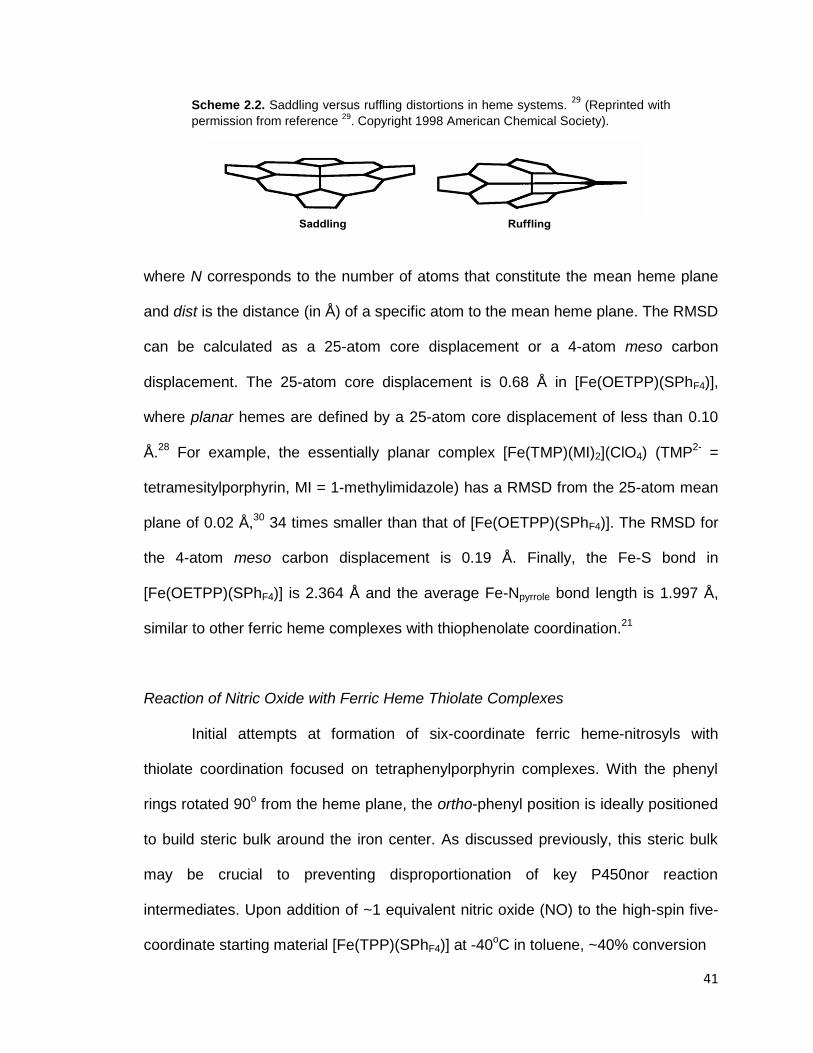
41
Scheme 2.2. Saddling versus ruffling distortions in heme systems. 29
(Reprinted with
permission from reference 29
. Copyright 1998 American Chemical Society).
where N corresponds to the number of atoms that constitute the mean heme plane
and dist is the distance (in Å) of a specific atom to the mean heme plane. The RMSD
can be calculated as a 25-atom core displacement or a 4-atom meso carbon
displacement. The 25-atom core displacement is 0.68 Å in [Fe(OETPP)(SPhF4)],
where planar hemes are defined by a 25-atom core displacement of less than 0.10
Å.28
For example, the essentially planar complex [Fe(TMP)(MI)2](ClO4) (TMP2-
=
tetramesitylporphyrin, MI = 1-methylimidazole) has a RMSD from the 25-atom mean
plane of 0.02 Å,30
34 times smaller than that of [Fe(OETPP)(SPhF4)]. The RMSD for
the 4-atom meso carbon displacement is 0.19 Å. Finally, the Fe-S bond in
[Fe(OETPP)(SPhF4)] is 2.364 Å and the average Fe-Npyrrole bond length is 1.997 Å,
similar to other ferric heme complexes with thiophenolate coordination.21
Reaction of Nitric Oxide with Ferric Heme Thiolate Complexes
Initial attempts at formation of six-coordinate ferric heme-nitrosyls with
thiolate coordination focused on tetraphenylporphyrin complexes. With the phenyl
rings rotated 90o from the heme plane, the ortho-phenyl position is ideally positioned
to build steric bulk around the iron center. As discussed previously, this steric bulk
may be crucial to preventing disproportionation of key P450nor reaction
intermediates. Upon addition of ~1 equivalent nitric oxide (NO) to the high-spin five-
coordinate starting material [Fe(TPP)(SPhF4)] at -40oC in toluene, ~40% conversion

42
Figure 2.4. UV-Vis spectral changes for the reaction of [Fe(TPP)(SPhF4)] with ~1 equivalent nitric
oxide at -40 °C in toluene. The desired six-coordinate ferric complex [Fe(TPP)(SPhF4)(NO)] is formed
intermediately (left) before decomposition to ferrous [Fe(TPP)(NO)] (right).
to the desired product [Fe(TPP)(SPhF4)(NO)] is observed by in situ UV-visible
spectroscopy, see Figure 2.4. The intermediately formed ferric nitrosyl
[Fe(TPP)(SPhF4)(NO)] is characterized by an absorbance maximum at 439 nm
(Soret band) and features in the Q-region at 554 and 596 nm. In situ IR
measurements show a band at 1840 cm-1
corresponding to the N-O stretch of
[Fe(TPP)(SPhF4)(NO)]. The ferric nitrosyl complex, however, is highly unstable and
quickly decomposes to the ferrous nitrosyl [Fe(TPP)(NO)], see Figure 2.4.
Importantly, if the reaction is not performed under extremely oxygen-free conditions
(O2 < 0.1 ppm) with highly purified NO the observed decomposition product is
[Fe(TPP)(NO2)(NO)]. This is due, in part, to the low porphyrin concentrations (1 μM)
necessary for UV-visible spectroscopy. We, and others, have shown this product to
be a result of trace impurities of O2 rather than a “legitimate” reaction product.20
300 400 500 600 700 800
0.0
0.1
0.2
0.3
0.4
0.5
0.6
0.7
7095
14
414
596554
439
Ab
s.
wavelength [nm]
Start: [Fe(TPP)(SPhF4
)]
End: [Fe(TPP)(SPhF4
)(NO)]
300 400 500 600 700 800
0.0
0.1
0.2
0.3
0.4
0.5
0.6
0.7408
Start: [Fe(TPP)(SPhF4
)(NO)]
End: [Fe(TPP)(NO)]
Ab
s.
wavelength [nm]
538
439
554
596
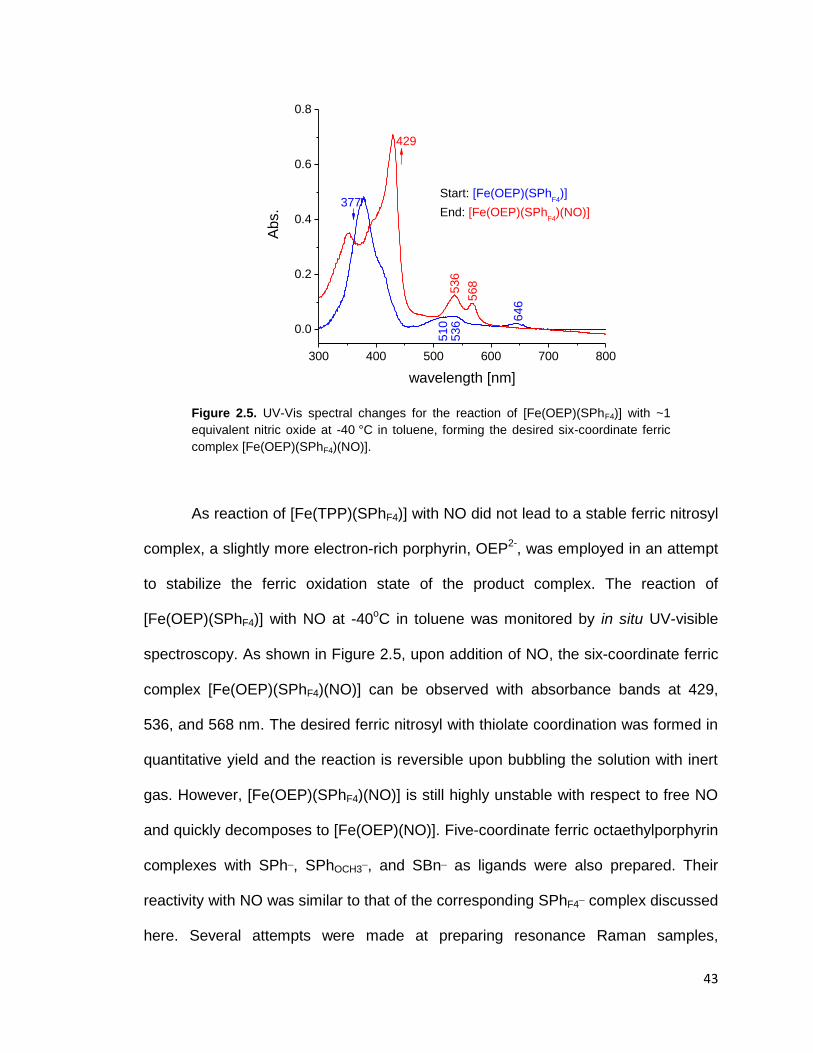
43
Figure 2.5. UV-Vis spectral changes for the reaction of [Fe(OEP)(SPhF4)] with ~1
equivalent nitric oxide at -40 °C in toluene, forming the desired six-coordinate ferric
complex [Fe(OEP)(SPhF4)(NO)].
As reaction of [Fe(TPP)(SPhF4)] with NO did not lead to a stable ferric nitrosyl
complex, a slightly more electron-rich porphyrin, OEP2-
, was employed in an attempt
to stabilize the ferric oxidation state of the product complex. The reaction of
[Fe(OEP)(SPhF4)] with NO at -40oC in toluene was monitored by in situ UV-visible
spectroscopy. As shown in Figure 2.5, upon addition of NO, the six-coordinate ferric
complex [Fe(OEP)(SPhF4)(NO)] can be observed with absorbance bands at 429,
536, and 568 nm. The desired ferric nitrosyl with thiolate coordination was formed in
quantitative yield and the reaction is reversible upon bubbling the solution with inert
gas. However, [Fe(OEP)(SPhF4)(NO)] is still highly unstable with respect to free NO
and quickly decomposes to [Fe(OEP)(NO)]. Five-coordinate ferric octaethylporphyrin
complexes with SPh¯, SPhOCH3¯, and SBn¯ as ligands were also prepared. Their
reactivity with NO was similar to that of the corresponding SPhF4¯ complex discussed
here. Several attempts were made at preparing resonance Raman samples,
300 400 500 600 700 800
0.0
0.2
0.4
0.6
0.8
646
510
377
568
429
536
536
Abs.
wavelength [nm]
Start: [Fe(OEP)(SPhF4
)]
End: [Fe(OEP)(SPhF4
)(NO)]
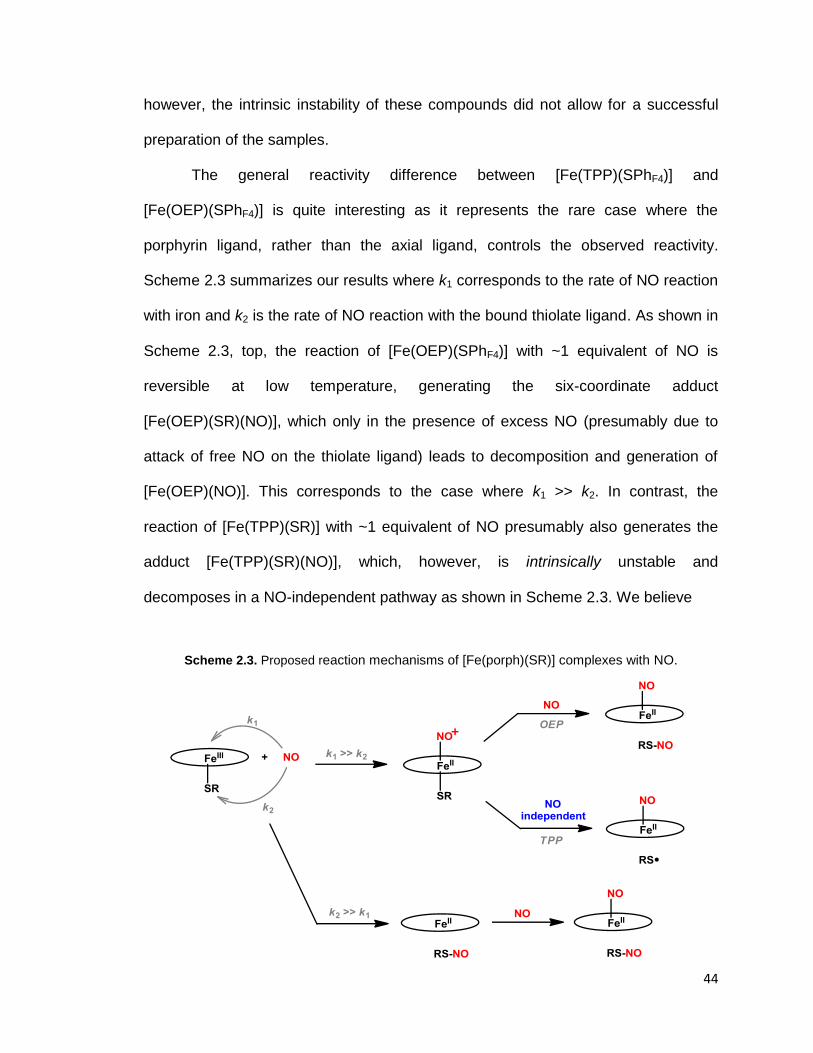
44
however, the intrinsic instability of these compounds did not allow for a successful
preparation of the samples.
The general reactivity difference between [Fe(TPP)(SPhF4)] and
[Fe(OEP)(SPhF4)] is quite interesting as it represents the rare case where the
porphyrin ligand, rather than the axial ligand, controls the observed reactivity.
Scheme 2.3 summarizes our results where k1 corresponds to the rate of NO reaction
with iron and k2 is the rate of NO reaction with the bound thiolate ligand. As shown in
Scheme 2.3, top, the reaction of [Fe(OEP)(SPhF4)] with ~1 equivalent of NO is
reversible at low temperature, generating the six-coordinate adduct
[Fe(OEP)(SR)(NO)], which only in the presence of excess NO (presumably due to
attack of free NO on the thiolate ligand) leads to decomposition and generation of
[Fe(OEP)(NO)]. This corresponds to the case where k1 >> k2. In contrast, the
reaction of [Fe(TPP)(SR)] with ~1 equivalent of NO presumably also generates the
adduct [Fe(TPP)(SR)(NO)], which, however, is intrinsically unstable and
decomposes in a NO-independent pathway as shown in Scheme 2.3. We believe
Scheme 2.3. Proposed reaction mechanisms of [Fe(porph)(SR)] complexes with NO.
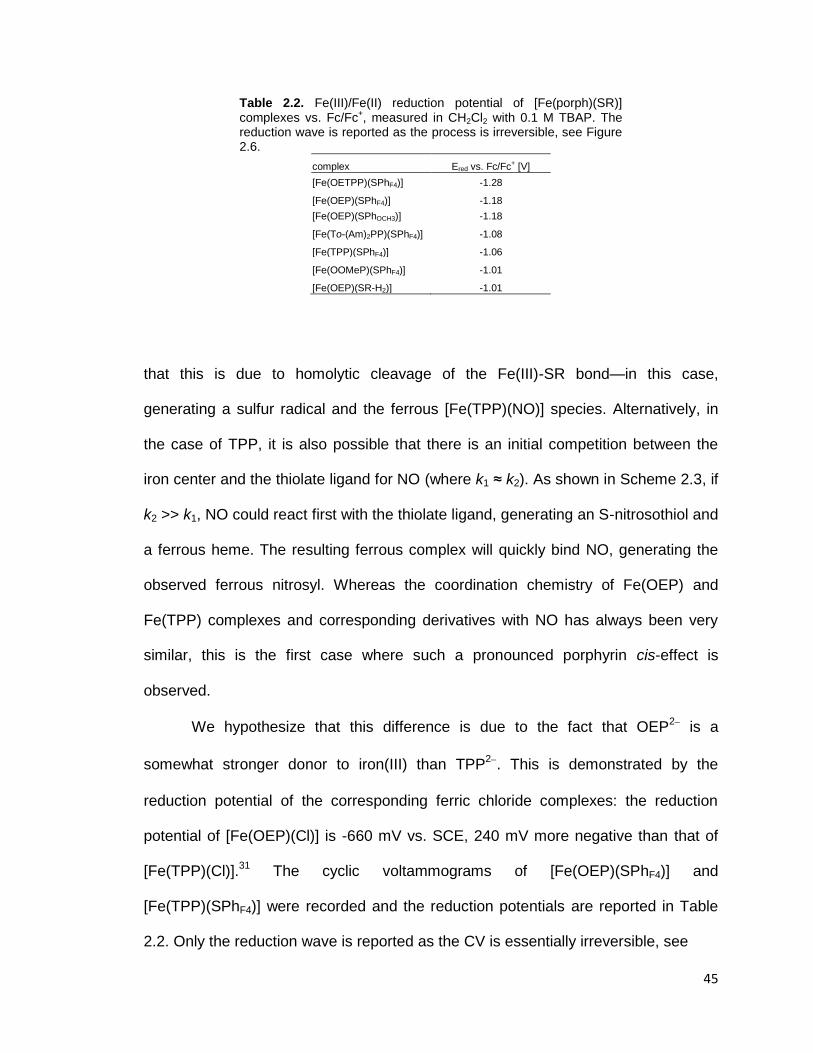
45
Table 2.2. Fe(III)/Fe(II) reduction potential of [Fe(porph)(SR)] complexes vs. Fc/Fc
+, measured in CH2Cl2 with 0.1 M TBAP. The
reduction wave is reported as the process is irreversible, see Figure 2.6.
complex Ered vs. Fc/Fc+ [V]
[Fe(OETPP)(SPhF4)] -1.28
[Fe(OEP)(SPhF4)] -1.18
[Fe(OEP)(SPhOCH3)] -1.18
[Fe(To-(Am)2PP)(SPhF4)] -1.08
[Fe(TPP)(SPhF4)] -1.06
[Fe(OOMeP)(SPhF4)] -1.01
[Fe(OEP)(SR-H2)] -1.01
that this is due to homolytic cleavage of the Fe(III)-SR bond—in this case,
generating a sulfur radical and the ferrous [Fe(TPP)(NO)] species. Alternatively, in
the case of TPP, it is also possible that there is an initial competition between the
iron center and the thiolate ligand for NO (where k1 ≈ k2). As shown in Scheme 2.3, if
k2 >> k1, NO could react first with the thiolate ligand, generating an S-nitrosothiol and
a ferrous heme. The resulting ferrous complex will quickly bind NO, generating the
observed ferrous nitrosyl. Whereas the coordination chemistry of Fe(OEP) and
Fe(TPP) complexes and corresponding derivatives with NO has always been very
similar, this is the first case where such a pronounced porphyrin cis-effect is
observed.
We hypothesize that this difference is due to the fact that OEP2 is a
somewhat stronger donor to iron(III) than TPP2. This is demonstrated by the
reduction potential of the corresponding ferric chloride complexes: the reduction
potential of [Fe(OEP)(Cl)] is -660 mV vs. SCE, 240 mV more negative than that of
[Fe(TPP)(Cl)].31
The cyclic voltammograms of [Fe(OEP)(SPhF4)] and
[Fe(TPP)(SPhF4)] were recorded and the reduction potentials are reported in Table
2.2. Only the reduction wave is reported as the CV is essentially irreversible, see
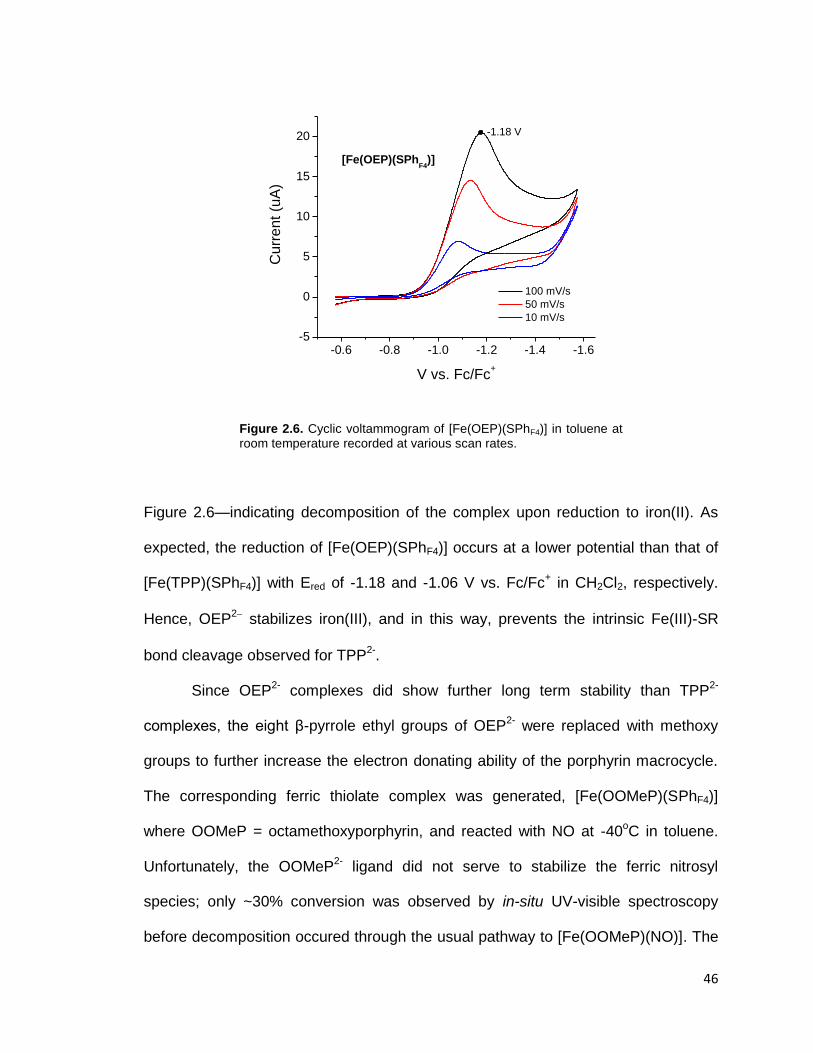
46
Figure 2.6. Cyclic voltammogram of [Fe(OEP)(SPhF4)] in toluene at room temperature recorded at various scan rates.
Figure 2.6—indicating decomposition of the complex upon reduction to iron(II). As
expected, the reduction of [Fe(OEP)(SPhF4)] occurs at a lower potential than that of
[Fe(TPP)(SPhF4)] with Ered of -1.18 and -1.06 V vs. Fc/Fc+ in CH2Cl2, respectively.
Hence, OEP2 stabilizes iron(III), and in this way, prevents the intrinsic Fe(III)-SR
bond cleavage observed for TPP2-
.
Since OEP2-
complexes did show further long term stability than TPP2-
complexes, the eight β-pyrrole ethyl groups of OEP2-
were replaced with methoxy
groups to further increase the electron donating ability of the porphyrin macrocycle.
The corresponding ferric thiolate complex was generated, [Fe(OOMeP)(SPhF4)]
where OOMeP = octamethoxyporphyrin, and reacted with NO at -40oC in toluene.
Unfortunately, the OOMeP2-
ligand did not serve to stabilize the ferric nitrosyl
species; only ~30% conversion was observed by in-situ UV-visible spectroscopy
before decomposition occured through the usual pathway to [Fe(OOMeP)(NO)]. The
-0.6 -0.8 -1.0 -1.2 -1.4 -1.6-5
0
5
10
15
20
[Fe(OEP)(SPhF4
)]
100 mV/s
50 mV/s
10 mV/s
Cu
rre
nt
(uA
)
V vs. Fc/Fc+
-1.18 V
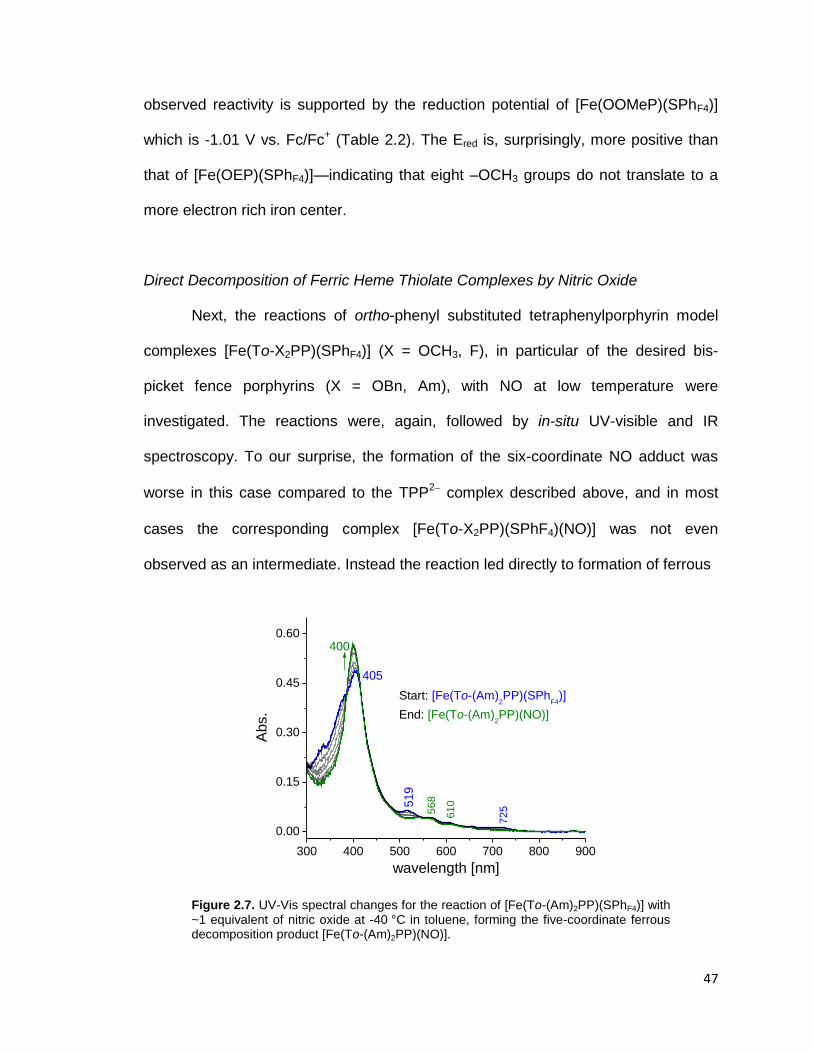
47
observed reactivity is supported by the reduction potential of [Fe(OOMeP)(SPhF4)]
which is -1.01 V vs. Fc/Fc+ (Table 2.2). The Ered is, surprisingly, more positive than
that of [Fe(OEP)(SPhF4)]—indicating that eight –OCH3 groups do not translate to a
more electron rich iron center.
Direct Decomposition of Ferric Heme Thiolate Complexes by Nitric Oxide
Next, the reactions of ortho-phenyl substituted tetraphenylporphyrin model
complexes [Fe(To-X2PP)(SPhF4)] (X = OCH3, F), in particular of the desired bis-
picket fence porphyrins (X = OBn, Am), with NO at low temperature were
investigated. The reactions were, again, followed by in-situ UV-visible and IR
spectroscopy. To our surprise, the formation of the six-coordinate NO adduct was
worse in this case compared to the TPP2 complex described above, and in most
cases the corresponding complex [Fe(To-X2PP)(SPhF4)(NO)] was not even
observed as an intermediate. Instead the reaction led directly to formation of ferrous
Figure 2.7. UV-Vis spectral changes for the reaction of [Fe(To-(Am)2PP)(SPhF4)] with ~1 equivalent of nitric oxide at -40 °C in toluene, forming the five-coordinate ferrous decomposition product [Fe(To-(Am)2PP)(NO)].
300 400 500 600 700 800 900
0.00
0.15
0.30
0.45
0.60
61
0
56
8
72
5
Ab
s.
wavelength [nm]
400
405
519
Start: [Fe(To-(Am)2PP)(SPh
F4)]
End: [Fe(To-(Am)2PP)(NO)]
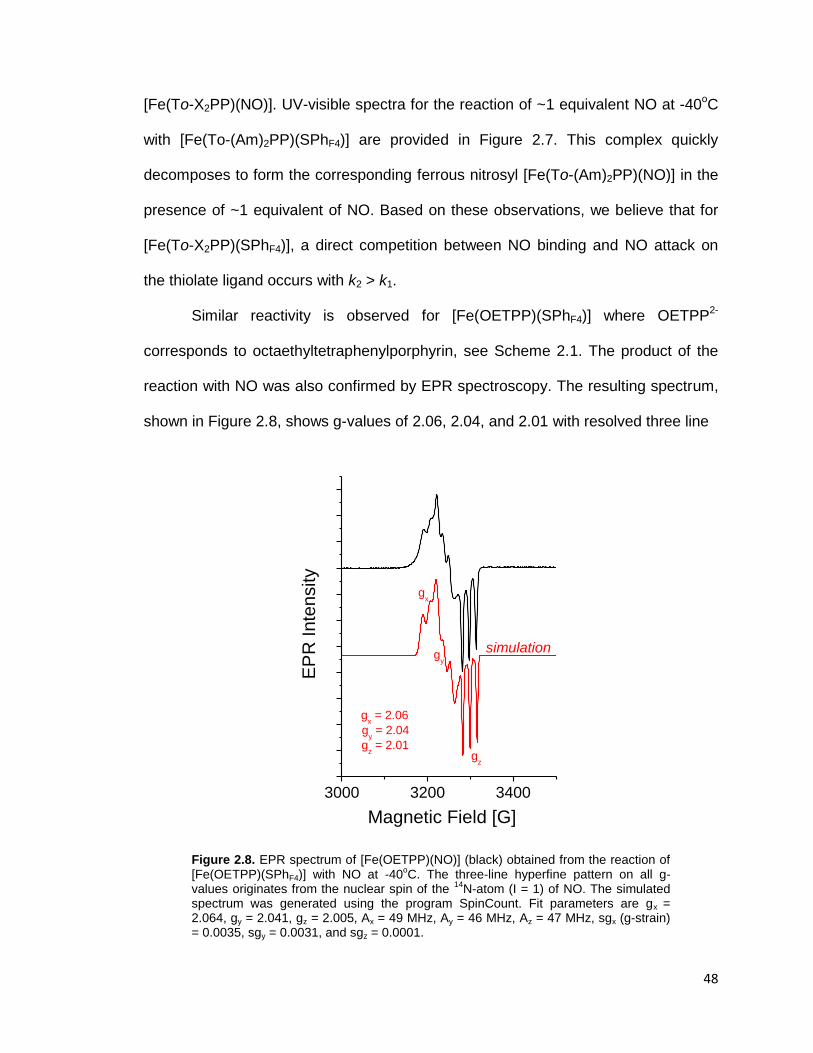
48
[Fe(To-X2PP)(NO)]. UV-visible spectra for the reaction of ~1 equivalent NO at -40oC
with [Fe(To-(Am)2PP)(SPhF4)] are provided in Figure 2.7. This complex quickly
decomposes to form the corresponding ferrous nitrosyl [Fe(To-(Am)2PP)(NO)] in the
presence of ~1 equivalent of NO. Based on these observations, we believe that for
[Fe(To-X2PP)(SPhF4)], a direct competition between NO binding and NO attack on
the thiolate ligand occurs with k2 > k1.
Similar reactivity is observed for [Fe(OETPP)(SPhF4)] where OETPP2-
corresponds to octaethyltetraphenylporphyrin, see Scheme 2.1. The product of the
reaction with NO was also confirmed by EPR spectroscopy. The resulting spectrum,
shown in Figure 2.8, shows g-values of 2.06, 2.04, and 2.01 with resolved three line
Figure 2.8. EPR spectrum of [Fe(OETPP)(NO)] (black) obtained from the reaction of [Fe(OETPP)(SPhF4)] with NO at -40
oC. The three-line hyperfine pattern on all g-
values originates from the nuclear spin of the 14
N-atom (I = 1) of NO. The simulated spectrum was generated using the program SpinCount. Fit parameters are gx = 2.064, gy = 2.041, gz = 2.005, Ax = 49 MHz, Ay = 46 MHz, Az = 47 MHz, sgx (g-strain) = 0.0035, sgy = 0.0031, and sgz = 0.0001.
3000 3200 3400
Magnetic Field [G]
EP
R I
nte
nsity
simulation
gz
gx = 2.06
gz = 2.01
gy = 2.04
gy
gx
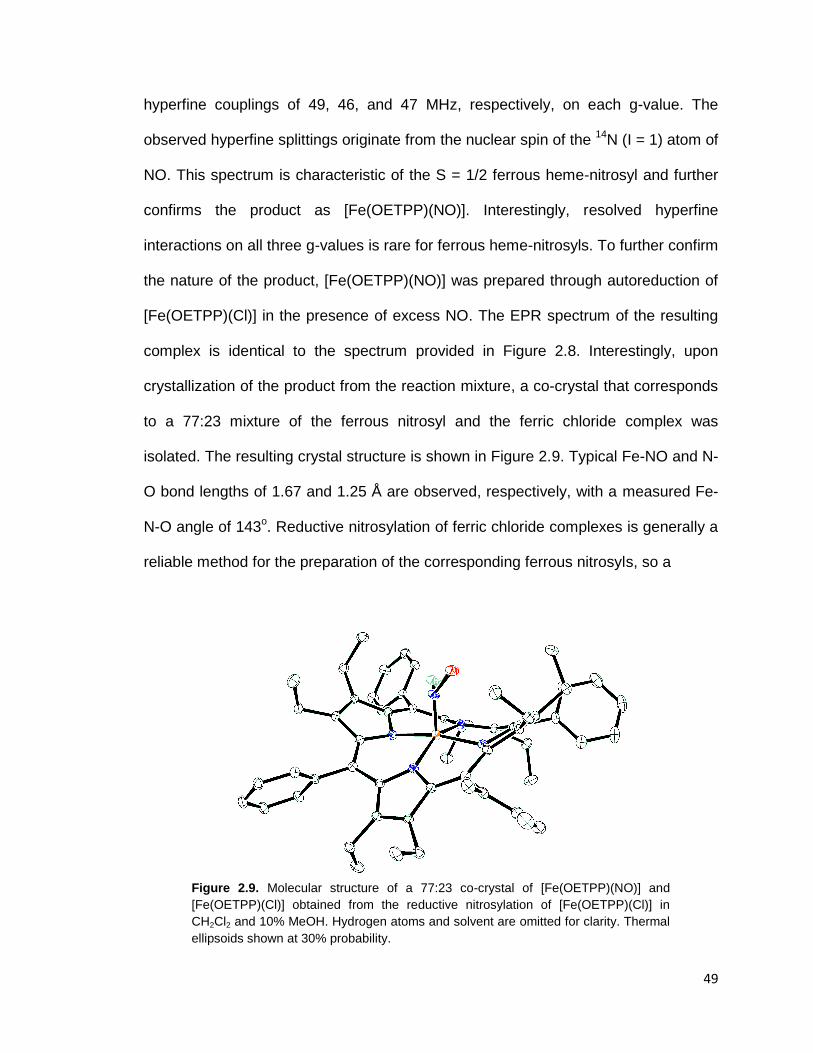
49
hyperfine couplings of 49, 46, and 47 MHz, respectively, on each g-value. The
observed hyperfine splittings originate from the nuclear spin of the 14
N (I = 1) atom of
NO. This spectrum is characteristic of the S = 1/2 ferrous heme-nitrosyl and further
confirms the product as [Fe(OETPP)(NO)]. Interestingly, resolved hyperfine
interactions on all three g-values is rare for ferrous heme-nitrosyls. To further confirm
the nature of the product, [Fe(OETPP)(NO)] was prepared through autoreduction of
[Fe(OETPP)(Cl)] in the presence of excess NO. The EPR spectrum of the resulting
complex is identical to the spectrum provided in Figure 2.8. Interestingly, upon
crystallization of the product from the reaction mixture, a co-crystal that corresponds
to a 77:23 mixture of the ferrous nitrosyl and the ferric chloride complex was
isolated. The resulting crystal structure is shown in Figure 2.9. Typical Fe-NO and N-
O bond lengths of 1.67 and 1.25 Å are observed, respectively, with a measured Fe-
N-O angle of 143o. Reductive nitrosylation of ferric chloride complexes is generally a
reliable method for the preparation of the corresponding ferrous nitrosyls, so a
Figure 2.9. Molecular structure of a 77:23 co-crystal of [Fe(OETPP)(NO)] and
[Fe(OETPP)(Cl)] obtained from the reductive nitrosylation of [Fe(OETPP)(Cl)] in
CH2Cl2 and 10% MeOH. Hydrogen atoms and solvent are omitted for clarity. Thermal
ellipsoids shown at 30% probability.

50
mixture of [Fe(OETPP)(Cl)] and [Fe(OETPP)(NO)] in this crystal is surprising.
However, it has been shown previously that distorted hemes stabilize the ferric
oxidation state.28
Here, the highly distorted porphyrin OETPP2-
could act to inhibit
reduction of the initial [Fe(OETPP)(NO)]+ complex. As a side note, preliminary
studies on [Fe(OETPP)(NO)] indicate that this complex is unusually unstable and
easily loses NO. This result is significant, as this indicates that the stability of ferrous
heme-nitrosyls in biological systems could be fine tuned by the conformation
(saddled, ruffled) of the heme. Normally, ferrous heme-nitrosyls are very stable and
unreactive, but it might be possible to overcome this limitation through the use of
distorted hemes. This point requires further study.
Decomposition of OETPP2-
and ortho-phenyl substituted TPP2-
ferric thiolate
complexes in the presence of NO is presumably occurring through NO independent
homolytic cleavage of the Fe-S bond as shown in Scheme 2.3. Alternatively, in the
presence of a second equivalent of NO, direct S-nitrosylation of the bound
thiophenolate ligand could occur followed by fast coordination of NO to the resulting
ferrous heme (Scheme 2.3, k2 >> k1). Interestingly, in contrast to TPP2-
where ~40%
formation of the desired ferric heme-nitrosyl with thiolate coordination is observed,
the complexes in this section undergo direct decomposition to the resulting ferrous
species. Interestingly, the reduction potential of [Fe(To-(Am)2PP)(SPhF4)] is -1.08 V
vs. Fc/Fc+, which is nearly identical to that of the corresponding TPP
2- complex, see
Table 2.2, while [Fe(OETPP)(SPhF4)] has a more negative reduction potential of -
1.28 V vs. Fc/Fc+. So based on reduction potential we would expect a similar
reactivity of NO with [Fe(TPP)(SPhF4)] and [Fe(To-(Am)2PP)(SPhF4)], and
significantly higher formation of the ferric nitrosyl complex with thiolate coordination
for the electron-rich OETPP2-
ligand. Thus, it is surprising that no formation of
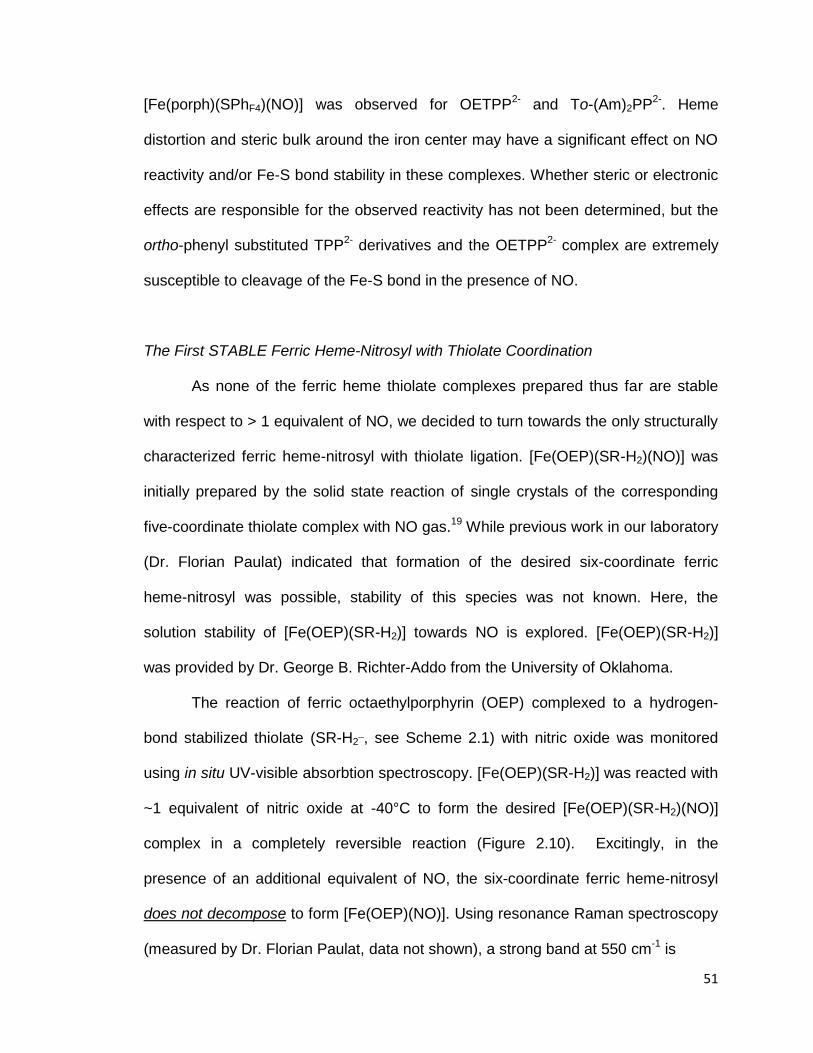
51
[Fe(porph)(SPhF4)(NO)] was observed for OETPP2-
and To-(Am)2PP2-
. Heme
distortion and steric bulk around the iron center may have a significant effect on NO
reactivity and/or Fe-S bond stability in these complexes. Whether steric or electronic
effects are responsible for the observed reactivity has not been determined, but the
ortho-phenyl substituted TPP2-
derivatives and the OETPP2-
complex are extremely
susceptible to cleavage of the Fe-S bond in the presence of NO.
The First STABLE Ferric Heme-Nitrosyl with Thiolate Coordination
As none of the ferric heme thiolate complexes prepared thus far are stable
with respect to > 1 equivalent of NO, we decided to turn towards the only structurally
characterized ferric heme-nitrosyl with thiolate ligation. [Fe(OEP)(SR-H2)(NO)] was
initially prepared by the solid state reaction of single crystals of the corresponding
five-coordinate thiolate complex with NO gas.19
While previous work in our laboratory
(Dr. Florian Paulat) indicated that formation of the desired six-coordinate ferric
heme-nitrosyl was possible, stability of this species was not known. Here, the
solution stability of [Fe(OEP)(SR-H2)] towards NO is explored. [Fe(OEP)(SR-H2)]
was provided by Dr. George B. Richter-Addo from the University of Oklahoma.
The reaction of ferric octaethylporphyrin (OEP) complexed to a hydrogen-
bond stabilized thiolate (SR-H2¯, see Scheme 2.1) with nitric oxide was monitored
using in situ UV-visible absorbtion spectroscopy. [Fe(OEP)(SR-H2)] was reacted with
~1 equivalent of nitric oxide at -40°C to form the desired [Fe(OEP)(SR-H2)(NO)]
complex in a completely reversible reaction (Figure 2.10). Excitingly, in the
presence of an additional equivalent of NO, the six-coordinate ferric heme-nitrosyl
does not decompose to form [Fe(OEP)(NO)]. Using resonance Raman spectroscopy
(measured by Dr. Florian Paulat, data not shown), a strong band at 550 cm-1
is
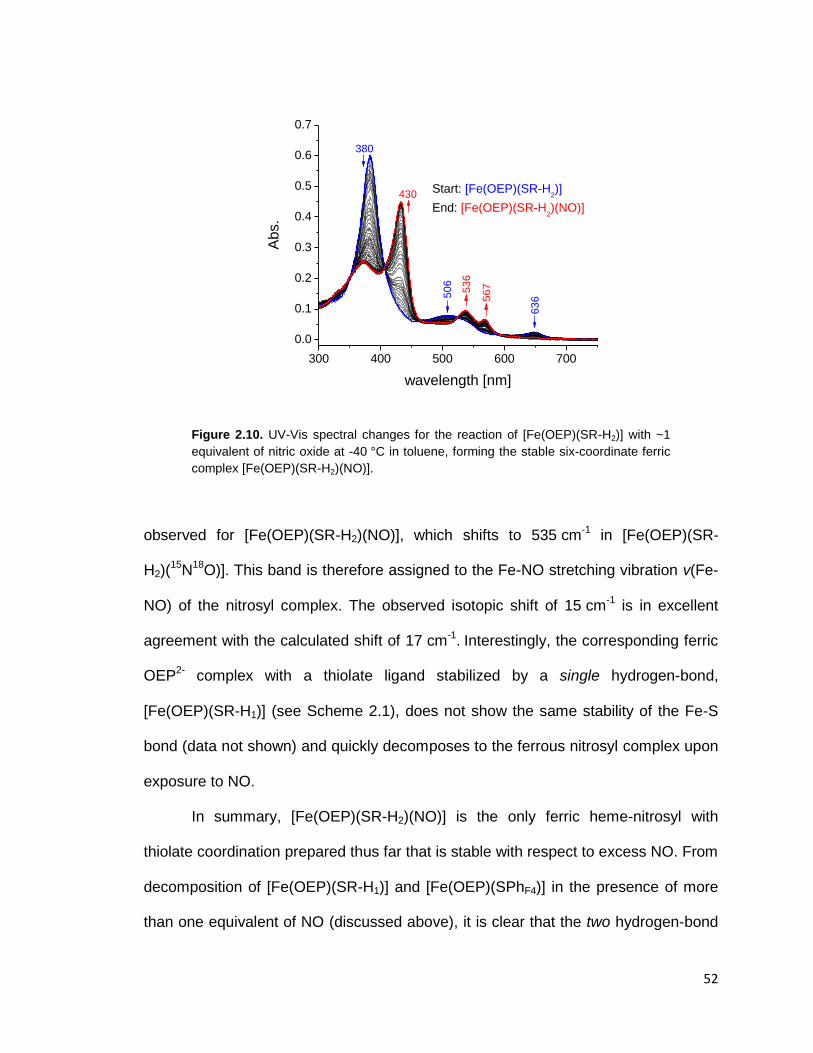
52
Figure 2.10. UV-Vis spectral changes for the reaction of [Fe(OEP)(SR-H2)] with ~1
equivalent of nitric oxide at -40 °C in toluene, forming the stable six-coordinate ferric
complex [Fe(OEP)(SR-H2)(NO)].
observed for [Fe(OEP)(SR-H2)(NO)], which shifts to 535 cm-1
in [Fe(OEP)(SR-
H2)(15
N18
O)]. This band is therefore assigned to the Fe-NO stretching vibration ν(Fe-
NO) of the nitrosyl complex. The observed isotopic shift of 15 cm-1
is in excellent
agreement with the calculated shift of 17 cm-1
. Interestingly, the corresponding ferric
OEP2-
complex with a thiolate ligand stabilized by a single hydrogen-bond,
[Fe(OEP)(SR-H1)] (see Scheme 2.1), does not show the same stability of the Fe-S
bond (data not shown) and quickly decomposes to the ferrous nitrosyl complex upon
exposure to NO.
In summary, [Fe(OEP)(SR-H2)(NO)] is the only ferric heme-nitrosyl with
thiolate coordination prepared thus far that is stable with respect to excess NO. From
decomposition of [Fe(OEP)(SR-H1)] and [Fe(OEP)(SPhF4)] in the presence of more
than one equivalent of NO (discussed above), it is clear that the two hydrogen-bond
300 400 500 600 700
0.0
0.1
0.2
0.3
0.4
0.5
0.6
0.7
50
6
Start: [Fe(OEP)(SR-H2)]
End: [Fe(OEP)(SR-H2)(NO)]
Abs.
wavelength [nm]
380
430
63
6
53
6
56
7

53
stabilized thiolate ligand is crucial to this observed stability of [Fe(OEP)(SR-H2)(NO)].
Thus, we hypothesize that SR-H2¯ is able to effectively stabilize the Fe(III)-SR¯ state
over an Fe(II)-SR(radical) configuration. This is critical as it is the sulfur radical that
promotes degradation of the desired ferric nitrosyl either through S-nitrosylation or
through homolytic cleavage of the Fe-S bond as illustrated in Scheme 2.3.
Interestingly, the reduction potential of [Fe(TPP)(SR-H2)] is 220 mV more positive
than that of [Fe(TPP)(SR-H1)].31
This indicates that the ligand SR-H2¯ donates less
electron density to the iron center than SR-H1¯ (and SPh¯ derivatives). As a result,
[Fe(OEP)(SR-H2)(NO)] is less likely to form the Fe(II)-SR(radical) state responsible
for homolytic cleavage of the Fe-S bond (Scheme 2.3, middle). This finding also
supports the hypothesis that OEP2-
ferric thiolate complexes, unlike the
corresponding TPP2-
derivatives, do not undergo homolytic Fe-S bond cleavage.
Importantly, due to the stabilization of the negative charge on the sulfur atom of SR-
H2¯ by the two hydrogen bonds, [Fe(OEP)(SR-H2)(NO)] resists S-nitrosylation in the
formed ferric nitrosyl complex (Scheme 2.3, top), in contrast to simple thiophenolate
ligands. In conclusion, the porphyrin ligand appears to contribute to fine tuning the
stability of ferric nitrosyls with thiolate coordination, but the key factor to successful
preparation of stable ferric heme-nitrosyls is the presence of SR-H2¯, a two
hydrogen-bond stabilized thiolate ligand.
Alternate Synthesis of the Hydrogen-Bond Stabilized Thiolate Ligand
From the reaction of a variety of ferric porphyrin thiolate complexes with NO
we have shown that the porphyrin ligand can be responsible for fine tuning the
stability of ferric nitrosyls with thiolate coordination, but the most dramatic effects
result from the nature of the thiolate ligand. All complexes synthesized thus far with
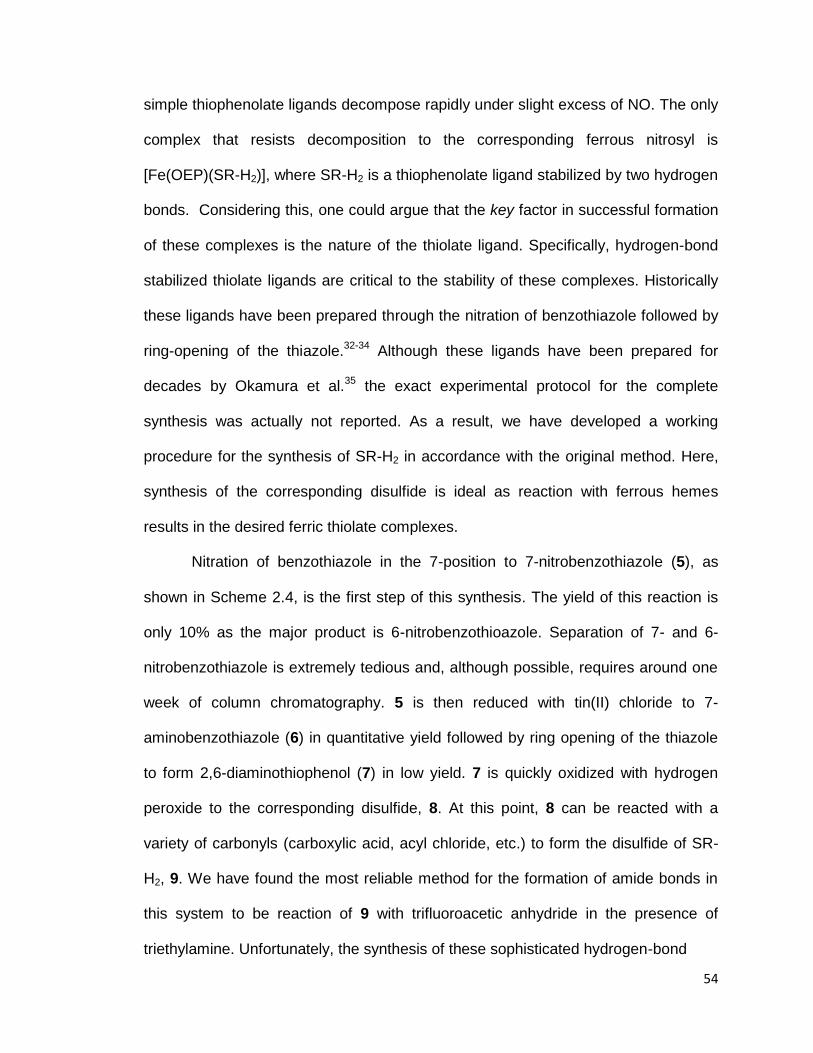
54
simple thiophenolate ligands decompose rapidly under slight excess of NO. The only
complex that resists decomposition to the corresponding ferrous nitrosyl is
[Fe(OEP)(SR-H2)], where SR-H2 is a thiophenolate ligand stabilized by two hydrogen
bonds. Considering this, one could argue that the key factor in successful formation
of these complexes is the nature of the thiolate ligand. Specifically, hydrogen-bond
stabilized thiolate ligands are critical to the stability of these complexes. Historically
these ligands have been prepared through the nitration of benzothiazole followed by
ring-opening of the thiazole.32-34
Although these ligands have been prepared for
decades by Okamura et al.35
the exact experimental protocol for the complete
synthesis was actually not reported. As a result, we have developed a working
procedure for the synthesis of SR-H2 in accordance with the original method. Here,
synthesis of the corresponding disulfide is ideal as reaction with ferrous hemes
results in the desired ferric thiolate complexes.
Nitration of benzothiazole in the 7-position to 7-nitrobenzothiazole (5), as
shown in Scheme 2.4, is the first step of this synthesis. The yield of this reaction is
only 10% as the major product is 6-nitrobenzothioazole. Separation of 7- and 6-
nitrobenzothiazole is extremely tedious and, although possible, requires around one
week of column chromatography. 5 is then reduced with tin(II) chloride to 7-
aminobenzothiazole (6) in quantitative yield followed by ring opening of the thiazole
to form 2,6-diaminothiophenol (7) in low yield. 7 is quickly oxidized with hydrogen
peroxide to the corresponding disulfide, 8. At this point, 8 can be reacted with a
variety of carbonyls (carboxylic acid, acyl chloride, etc.) to form the disulfide of SR-
H2, 9. We have found the most reliable method for the formation of amide bonds in
this system to be reaction of 9 with trifluoroacetic anhydride in the presence of
triethylamine. Unfortunately, the synthesis of these sophisticated hydrogen-bond
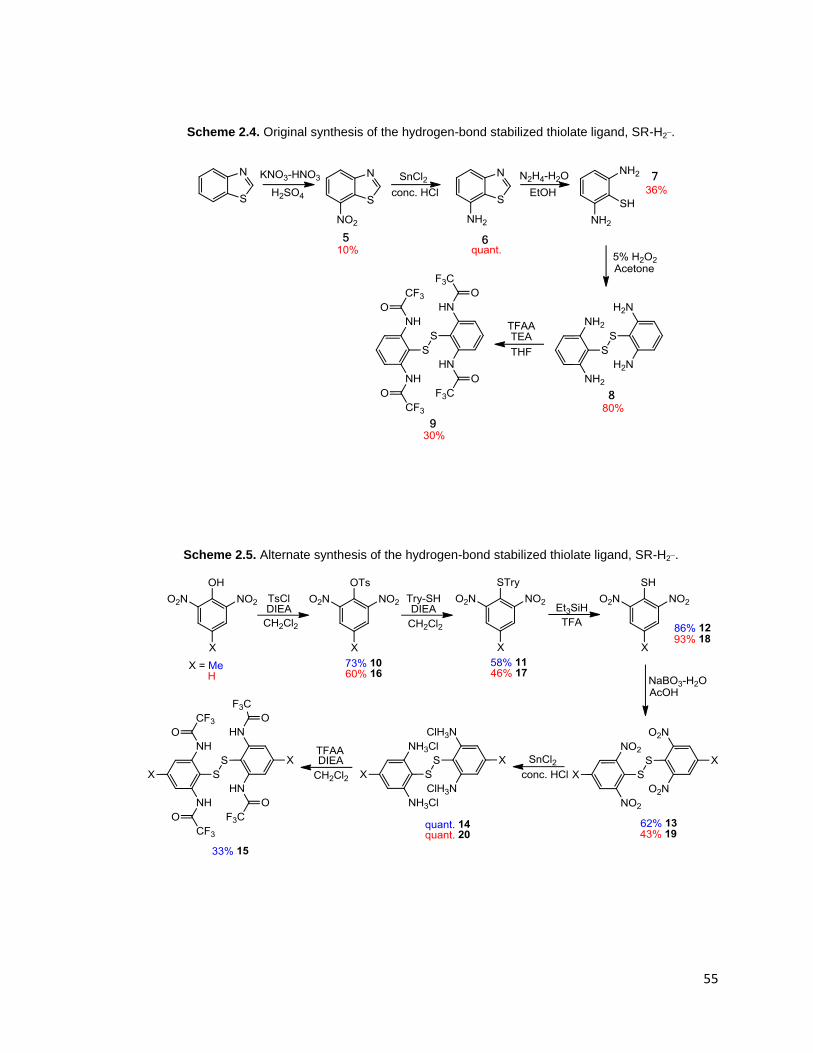
55
Scheme 2.4. Original synthesis of the hydrogen-bond stabilized thiolate ligand, SR-H2¯.
Scheme 2.5. Alternate synthesis of the hydrogen-bond stabilized thiolate ligand, SR-H2¯.
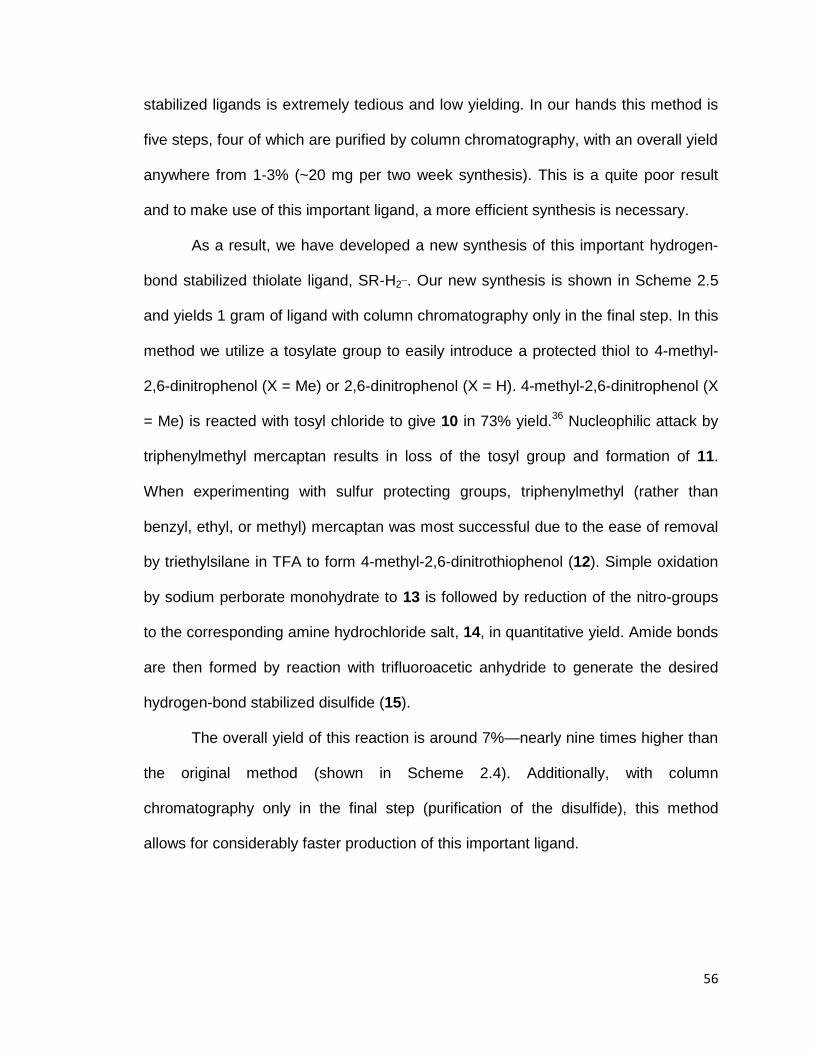
56
stabilized ligands is extremely tedious and low yielding. In our hands this method is
five steps, four of which are purified by column chromatography, with an overall yield
anywhere from 1-3% (~20 mg per two week synthesis). This is a quite poor result
and to make use of this important ligand, a more efficient synthesis is necessary.
As a result, we have developed a new synthesis of this important hydrogen-
bond stabilized thiolate ligand, SR-H2¯. Our new synthesis is shown in Scheme 2.5
and yields 1 gram of ligand with column chromatography only in the final step. In this
method we utilize a tosylate group to easily introduce a protected thiol to 4-methyl-
2,6-dinitrophenol (X = Me) or 2,6-dinitrophenol (X = H). 4-methyl-2,6-dinitrophenol (X
= Me) is reacted with tosyl chloride to give 10 in 73% yield.36
Nucleophilic attack by
triphenylmethyl mercaptan results in loss of the tosyl group and formation of 11.
When experimenting with sulfur protecting groups, triphenylmethyl (rather than
benzyl, ethyl, or methyl) mercaptan was most successful due to the ease of removal
by triethylsilane in TFA to form 4-methyl-2,6-dinitrothiophenol (12). Simple oxidation
by sodium perborate monohydrate to 13 is followed by reduction of the nitro-groups
to the corresponding amine hydrochloride salt, 14, in quantitative yield. Amide bonds
are then formed by reaction with trifluoroacetic anhydride to generate the desired
hydrogen-bond stabilized disulfide (15).
The overall yield of this reaction is around 7%—nearly nine times higher than
the original method (shown in Scheme 2.4). Additionally, with column
chromatography only in the final step (purification of the disulfide), this method
allows for considerably faster production of this important ligand.
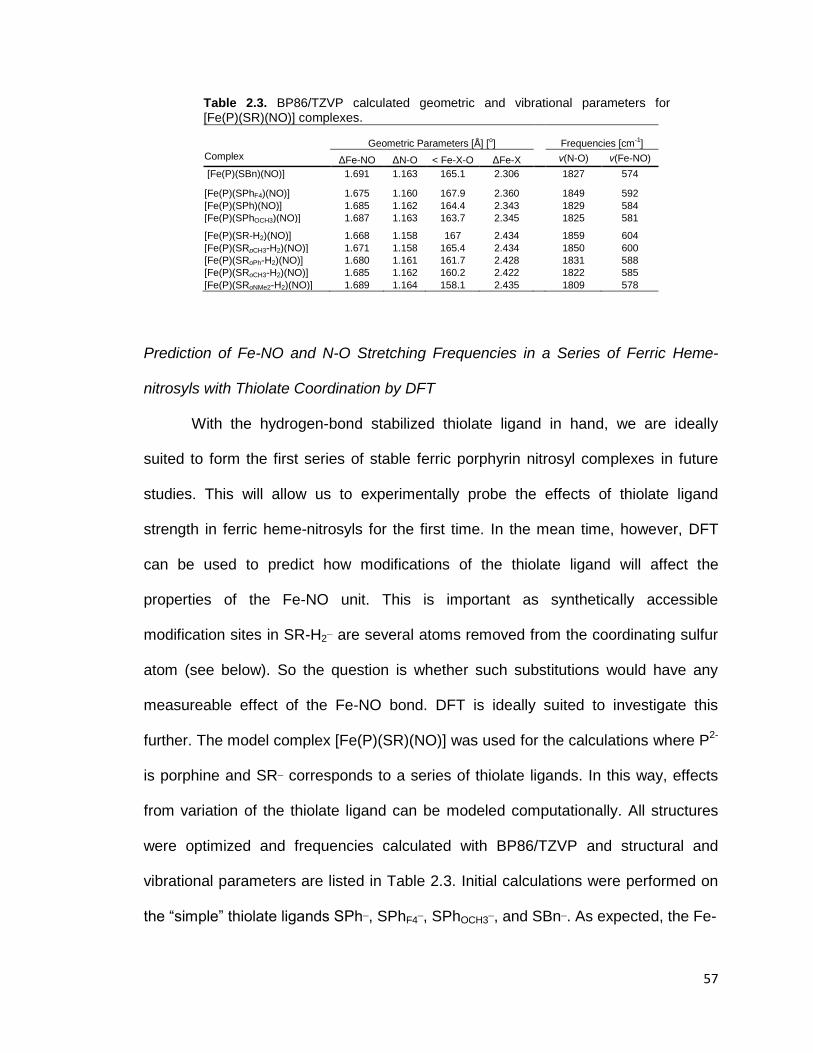
57
Table 2.3. BP86/TZVP calculated geometric and vibrational parameters for [Fe(P)(SR)(NO)] complexes.
Geometric Parameters [Å] [o]
Frequencies [cm-1]
Complex ΔFe-NO ΔN-O < Fe-X-O ΔFe-X ν(N-O) ν(Fe-NO)
[Fe(P)(SBn)(NO)] 1.691 1.163 165.1 2.306 1827 574
[Fe(P)(SPhF4)(NO)] 1.675 1.160 167.9 2.360 1849 592
[Fe(P)(SPh)(NO)] 1.685 1.162 164.4 2.343 1829 584
[Fe(P)(SPhOCH3)(NO)] 1.687 1.163 163.7 2.345 1825 581
[Fe(P)(SR-H2)(NO)] 1.668 1.158 167 2.434 1859 604
[Fe(P)(SRpCH3-H2)(NO)] 1.671 1.158 165.4 2.434 1850 600
[Fe(P)(SRoPh-H2)(NO)] 1.680 1.161 161.7 2.428 1831 588
[Fe(P)(SRoCH3-H2)(NO)] 1.685 1.162 160.2 2.422 1822 585
[Fe(P)(SRoNMe2-H2)(NO)] 1.689 1.164 158.1 2.435
1809 578
Prediction of Fe-NO and N-O Stretching Frequencies in a Series of Ferric Heme-
nitrosyls with Thiolate Coordination by DFT
With the hydrogen-bond stabilized thiolate ligand in hand, we are ideally
suited to form the first series of stable ferric porphyrin nitrosyl complexes in future
studies. This will allow us to experimentally probe the effects of thiolate ligand
strength in ferric heme-nitrosyls for the first time. In the mean time, however, DFT
can be used to predict how modifications of the thiolate ligand will affect the
properties of the Fe-NO unit. This is important as synthetically accessible
modification sites in SR-H2¯ are several atoms removed from the coordinating sulfur
atom (see below). So the question is whether such substitutions would have any
measureable effect of the Fe-NO bond. DFT is ideally suited to investigate this
further. The model complex [Fe(P)(SR)(NO)] was used for the calculations where P2-
is porphine and SR¯ corresponds to a series of thiolate ligands. In this way, effects
from variation of the thiolate ligand can be modeled computationally. All structures
were optimized and frequencies calculated with BP86/TZVP and structural and
vibrational parameters are listed in Table 2.3. Initial calculations were performed on
the “simple” thiolate ligands SPh¯, SPhF4¯, SPhOCH3¯, and SBn¯. As expected, the Fe-
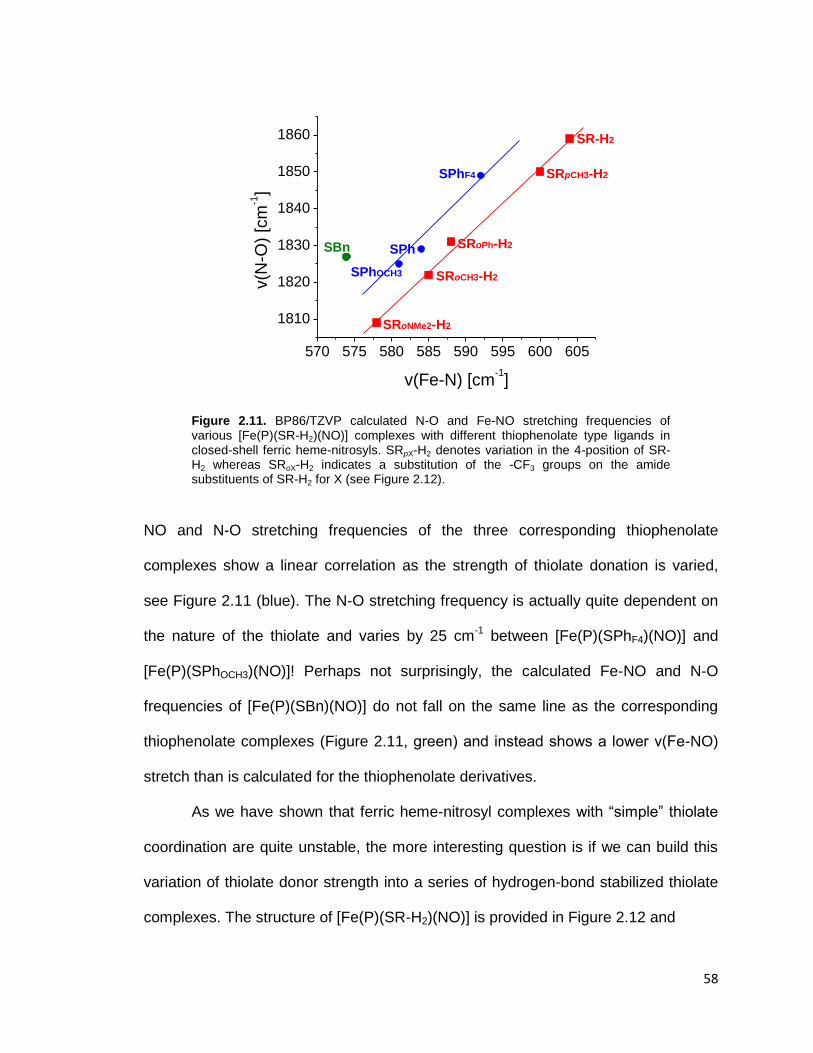
58
Figure 2.11. BP86/TZVP calculated N-O and Fe-NO stretching frequencies of various [Fe(P)(SR-H2)(NO)] complexes with different thiophenolate type ligands in closed-shell ferric heme-nitrosyls. SRpX-H2 denotes variation in the 4-position of SR-H2 whereas SRoX-H2 indicates a substitution of the -CF3 groups on the amide substituents of SR-H2 for X (see Figure 2.12).
NO and N-O stretching frequencies of the three corresponding thiophenolate
complexes show a linear correlation as the strength of thiolate donation is varied,
see Figure 2.11 (blue). The N-O stretching frequency is actually quite dependent on
the nature of the thiolate and varies by 25 cm-1
between [Fe(P)(SPhF4)(NO)] and
[Fe(P)(SPhOCH3)(NO)]! Perhaps not surprisingly, the calculated Fe-NO and N-O
frequencies of [Fe(P)(SBn)(NO)] do not fall on the same line as the corresponding
thiophenolate complexes (Figure 2.11, green) and instead shows a lower ν(Fe-NO)
stretch than is calculated for the thiophenolate derivatives.
As we have shown that ferric heme-nitrosyl complexes with “simple” thiolate
coordination are quite unstable, the more interesting question is if we can build this
variation of thiolate donor strength into a series of hydrogen-bond stabilized thiolate
complexes. The structure of [Fe(P)(SR-H2)(NO)] is provided in Figure 2.12 and
570 575 580 585 590 595 600 605
1810
1820
1830
1840
1850
1860
SRoNMe2-H2
SRoPh-H2
SRoCH3-H2
SRpCH3-H2
SR-H2
SBn
SPhOCH3
SPhF4
v(N
-O)
[cm
-1]
v(Fe-N) [cm-1]
SPh
59
Figure 2.12. BP86/TZVP optimized structure of [Fe(P)(SR-H2)(NO)]. Here, p
and o denote a systematic variation of the 4-position and the -CF3 groups in
SR-H2, respectively.
illustrates where synthetic modifications to the hydrogen-bond stabilized thiolate
ligand are possible. Substitutions can be made at either the para position of the
thiophenolate ring (denoted as SRpX-H2) or at the R-group of the amide bond
(denoted as SRoX-H2). Only ligands that are synthetically accessible are calculated
here. Excitingly, these results indicate that through the addition of electron-donating
groups to the amide bonds, the N-O and Fe-NO stretching frequencies can be
dramatically decreased by over 50 and 25 cm-1
, respectively, compared to SR-H2¯.
Here, the simple substitution of the amide bond is enough to cause drastic changes
in the strength of the Fe-NO and N-O bonds. This result indicates that we can, in
theory, successfully modulate the properties of the Fe-NO unit in our model
complexes through thiolate donor strength, which may be crucial in generating key
P450nor intermediates in our model systems.
o
p

60
2.2. The Phenolate Ligand: A More Stable Alternative to Thiolate Ligation in
Ferric Heme-Nitrosyls?
Through the work discussed in Section 2.1, we propose that ferric heme
thiolate complexes in the presence of nitric oxide degrade through attack of NO on
the thiolate ligand to form S-nitrosothiols (SNOs) or via homolytic cleavage of the Fe-
S bond. Therefore, to form stable ferric heme-nitrosyl model complexes with axial,
anionic ligands to study intermediates in the catalytic cycle P450nor, it is necessary
to find a way to prevent degradation or replace the anionic sulfur ligand with a more
stable alternative. While we have shown that the hydrogen-bond stabilized thiolate
ligand can be used successfully to prevent S-nitrosylation, the synthesis of these
compounds is tedious. As such, an attractive substitute for the thiolate ligand (SR¯)
used in our model complexes is the phenolate (OPh¯) ligand. Ferric heme phenolate
complexes provide the anionic axial ligand found in P450nor and should, in theory,
be resistant to attack of NO on the axial ligand. In addition, these complexes are
easy to prepare. It is therefore surprising that the synthesis and characterization of
ferric heme-nitrosyl model complexes with axial phenolate coordination has not been
reported.
Additionally, ferric heme-nitrosyl complexes with axial phenolate ligation
serve as model complexes for heme proteins with a proximally bound tyrosinate
such as catalase.37
Catalase is found in nearly all plants and animals and many
bacteria.38
Of crucial importance to aerobically respiring organisms, catalase
performs the vital degradation of the toxic reactive oxygen species (ROS) hydrogen
peroxide through the following equation:39
2 H2O2 → 2 H2O + O2 (3)
Catalase is also responsible for ethanol oxidation to acetaldehyde in the liver.
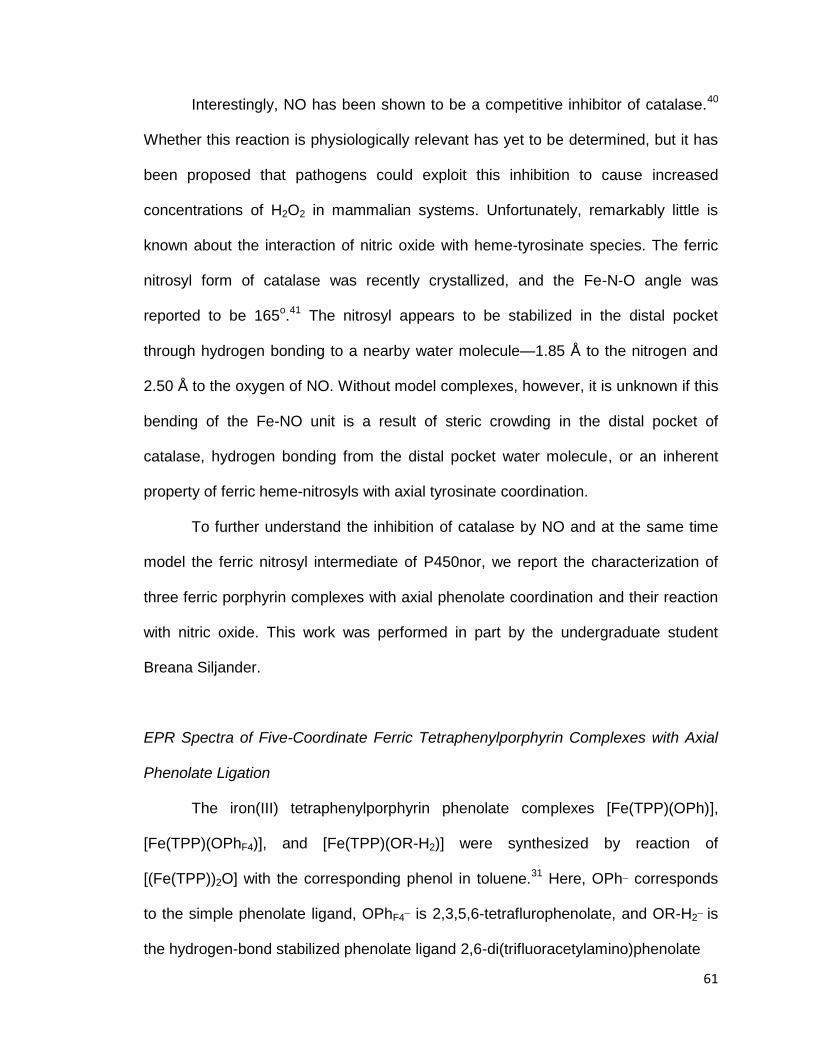
61
Interestingly, NO has been shown to be a competitive inhibitor of catalase.40
Whether this reaction is physiologically relevant has yet to be determined, but it has
been proposed that pathogens could exploit this inhibition to cause increased
concentrations of H2O2 in mammalian systems. Unfortunately, remarkably little is
known about the interaction of nitric oxide with heme-tyrosinate species. The ferric
nitrosyl form of catalase was recently crystallized, and the Fe-N-O angle was
reported to be 165o.41
The nitrosyl appears to be stabilized in the distal pocket
through hydrogen bonding to a nearby water molecule—1.85 Å to the nitrogen and
2.50 Å to the oxygen of NO. Without model complexes, however, it is unknown if this
bending of the Fe-NO unit is a result of steric crowding in the distal pocket of
catalase, hydrogen bonding from the distal pocket water molecule, or an inherent
property of ferric heme-nitrosyls with axial tyrosinate coordination.
To further understand the inhibition of catalase by NO and at the same time
model the ferric nitrosyl intermediate of P450nor, we report the characterization of
three ferric porphyrin complexes with axial phenolate coordination and their reaction
with nitric oxide. This work was performed in part by the undergraduate student
Breana Siljander.
EPR Spectra of Five-Coordinate Ferric Tetraphenylporphyrin Complexes with Axial
Phenolate Ligation
The iron(III) tetraphenylporphyrin phenolate complexes [Fe(TPP)(OPh)],
[Fe(TPP)(OPhF4)], and [Fe(TPP)(OR-H2)] were synthesized by reaction of
[(Fe(TPP))2O] with the corresponding phenol in toluene.31
Here, OPh¯ corresponds
to the simple phenolate ligand, OPhF4¯ is 2,3,5,6-tetraflurophenolate, and OR-H2¯ is
the hydrogen-bond stabilized phenolate ligand 2,6-di(trifluoracetylamino)phenolate
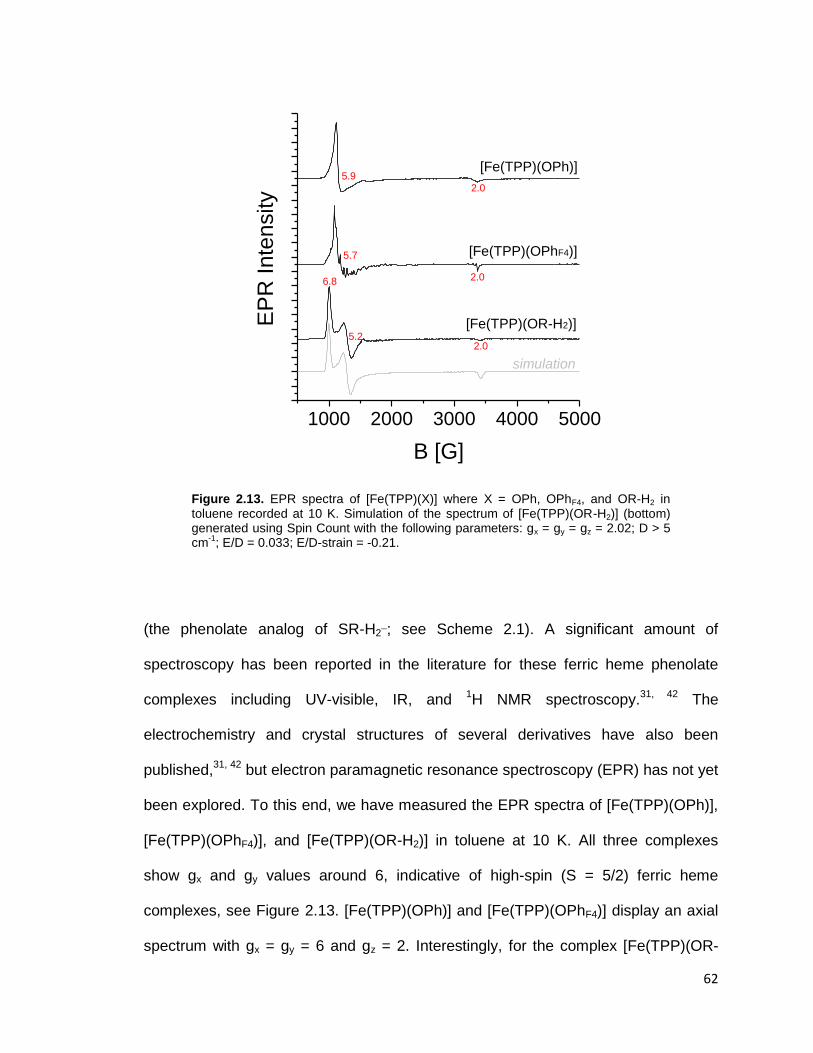
62
Figure 2.13. EPR spectra of [Fe(TPP)(X)] where X = OPh, OPhF4, and OR-H2 in toluene recorded at 10 K. Simulation of the spectrum of [Fe(TPP)(OR-H2)] (bottom) generated using Spin Count with the following parameters: gx = gy = gz = 2.02; D > 5 cm
-1; E/D = 0.033; E/D-strain = -0.21.
(the phenolate analog of SR-H2¯; see Scheme 2.1). A significant amount of
spectroscopy has been reported in the literature for these ferric heme phenolate
complexes including UV-visible, IR, and 1H NMR spectroscopy.
31, 42 The
electrochemistry and crystal structures of several derivatives have also been
published,31, 42
but electron paramagnetic resonance spectroscopy (EPR) has not yet
been explored. To this end, we have measured the EPR spectra of [Fe(TPP)(OPh)],
[Fe(TPP)(OPhF4)], and [Fe(TPP)(OR-H2)] in toluene at 10 K. All three complexes
show gx and gy values around 6, indicative of high-spin (S = 5/2) ferric heme
complexes, see Figure 2.13. [Fe(TPP)(OPh)] and [Fe(TPP)(OPhF4)] display an axial
spectrum with gx = gy = 6 and gz = 2. Interestingly, for the complex [Fe(TPP)(OR-
1000 2000 3000 4000 5000
6.8
5.2
5.9
2.0
2.0
[Fe(TPP)(OR-H2)]
[Fe(TPP)(OPhF4)]
EP
R Inte
nsity
B [G]
[Fe(TPP)(OPh)]
simulation
5.7
2.0
63
H2)], gx and gy undergo rhombic splitting. The E/D value for the spectrum is 0.033
where D > 5 cm-1
, obtained from simulation of the experimental EPR spectrum using
the program Spin Count. This indicates a loss of symmetry in the case of
[Fe(TPP)(OR-H2)] compared to [Fe(TPP)(OPh)] and [Fe(TPP)(OPhF4)]. Likely, the
free rotation of the phenolate ligand is highly hindered in the case of the bulky OR-
H2¯ ligand.
Reaction of Five-Coordinate Ferric Porphyrin Phenolate Complexes with NO
The reaction of the five-coordinate precursors [Fe(TPP)(OPh)],
[Fe(TPP)(OPhF4)], and [Fe(TPP)(OR-H2)] with NO (g) has been studied at -40oC in
toluene. The reactions were performed under inert atmosphere and monitored by in
situ UV-visible spectroscopy. As shown in Figure 2.14, left, reaction of
[Fe(TPP)(OPh)] with NO (g) results in a loss of the Soret band at 414 nm and the Q
band at 494 nm. A new Soret band appears at 433 nm, while a prominent new band
in the Q-region occurs at 544 nm. Interestingly, this new species with a Soret band
Figure 2.14. UV-visible spectra for the reaction of [Fe(TPP)(OPh)] (left) and [Fe(TPP)(OPhF4)] (right) with NO at -40
oC in toluene. The resulting UV-visible spectra (blue) correspond to the formation of
[Fe(TPP)(NO2)(NO)].
400 500 600 700
0.0
0.4
0.8
1.2
400 500 600 700
0.0
0.2
0.4
0.6
0.8
1.0
Start: [Fe(TPP)(OPh)
End: [Fe(TPP)(NO2)(NO)]
wavelength [nm]
Ab
s.
Ab
s.
wavelength [nm]
Start: [Fe(TPP)(OPhF4
)
End: [Fe(TPP)(NO2)(NO)]
417
433
544502
414
433
544494
64
at 433 nm corresponds to the complex [Fe(TPP)(NO2)(NO)] as opposed to the
desired product [Fe(TPP)(OPh)(NO)]. This was confirmed by separate synthesis of
[Fe(TPP)(NO2)(NO)].15
Additionally, the N-O stretching frequency of the isolated
reaction product (in a KBr pellet) is 1875 cm-1
—identical to the ν(N-O) band of
[Fe(TPP)(NO2)(NO)] prepared separately. Interestingly, reaction of [Fe(TPP)(OPhF4)]
with NO gave a similar result as shown in Figure 2.14, right. Decrease of starting
material bands at 417 and 502 nm gave rise to absorption bands at 433 and 544 nm
upon addition of NO—indicating, again, formation of [Fe(TPP)(NO2)(NO)].
There are two feasible explanations for the formation of [Fe(TPP)(NO2)(NO)]
from the reaction of NO with [Fe(TPP)(OPh)] and [Fe(TPP)(OPhF4)]. First, we have
shown previously that trace amounts of O2 in the system or impure NO (g) can both
lead to formation of ferric porphyrin nitro-nitrosyl complexes. Here, however, this is
highly unlikely as great care was taken to keep the reaction systems free of O2 and
freshly purified NO was used for each reaction. Additionally, each reaction was
repeated three times. The second possibility is that NO is able to react with the
bound phenolate ligand in the same way that S-nitrosothiol formation occurs from a
bound thiolate and NO, as outlined below.
[Fe(TPP)(OPh)] + NO → [Fe(TPP)] + ONOPh (4)
[Fe(TPP)] + NO → [Fe(TPP)(NO)] (5)
2 ONOPh → 2 NO2· + Ph-Ph (6)
[Fe(TPP)(NO)] + NO2· → [Fe(TPP)(NO2)(NO)] (7)
In this scenario, NO attacks the five-coordinate ferric heme precursor with phenolate
coordination resulting in a ferrous tetraphenylporphyrin complex and O-nitrobenzene
(ONOPh). The formed ferrous complex then quickly binds free NO, and the unusual
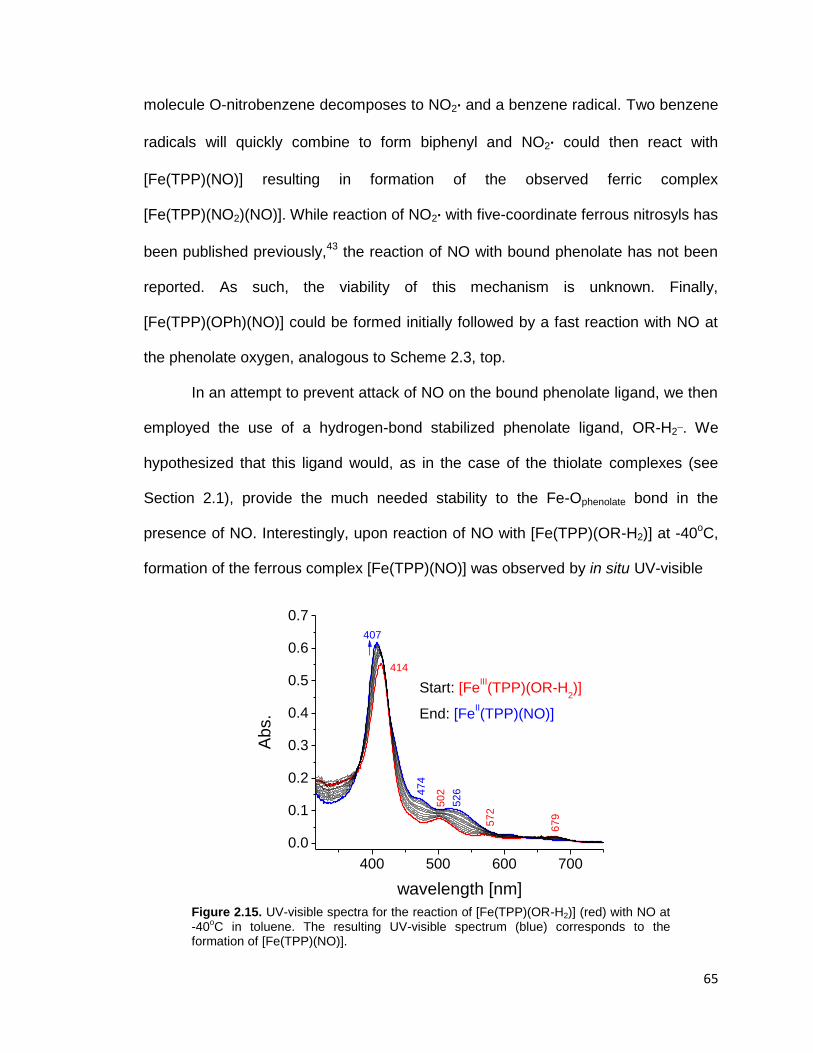
65
molecule O-nitrobenzene decomposes to NO2· and a benzene radical. Two benzene
radicals will quickly combine to form biphenyl and NO2· could then react with
[Fe(TPP)(NO)] resulting in formation of the observed ferric complex
[Fe(TPP)(NO2)(NO)]. While reaction of NO2· with five-coordinate ferrous nitrosyls has
been published previously,43
the reaction of NO with bound phenolate has not been
reported. As such, the viability of this mechanism is unknown. Finally,
[Fe(TPP)(OPh)(NO)] could be formed initially followed by a fast reaction with NO at
the phenolate oxygen, analogous to Scheme 2.3, top.
In an attempt to prevent attack of NO on the bound phenolate ligand, we then
employed the use of a hydrogen-bond stabilized phenolate ligand, OR-H2¯. We
hypothesized that this ligand would, as in the case of the thiolate complexes (see
Section 2.1), provide the much needed stability to the Fe-Ophenolate bond in the
presence of NO. Interestingly, upon reaction of NO with [Fe(TPP)(OR-H2)] at -40oC,
formation of the ferrous complex [Fe(TPP)(NO)] was observed by in situ UV-visible
Figure 2.15. UV-visible spectra for the reaction of [Fe(TPP)(OR-H2)] (red) with NO at -40
oC in toluene. The resulting UV-visible spectrum (blue) corresponds to the
formation of [Fe(TPP)(NO)].
400 500 600 700
0.0
0.1
0.2
0.3
0.4
0.5
0.6
0.7
67
9
57
2
50
2
52
647
4
Ab
s.
wavelength [nm]
414
407
Start: [FeIII(TPP)(OR-H
2)]
End: [FeII(TPP)(NO)]
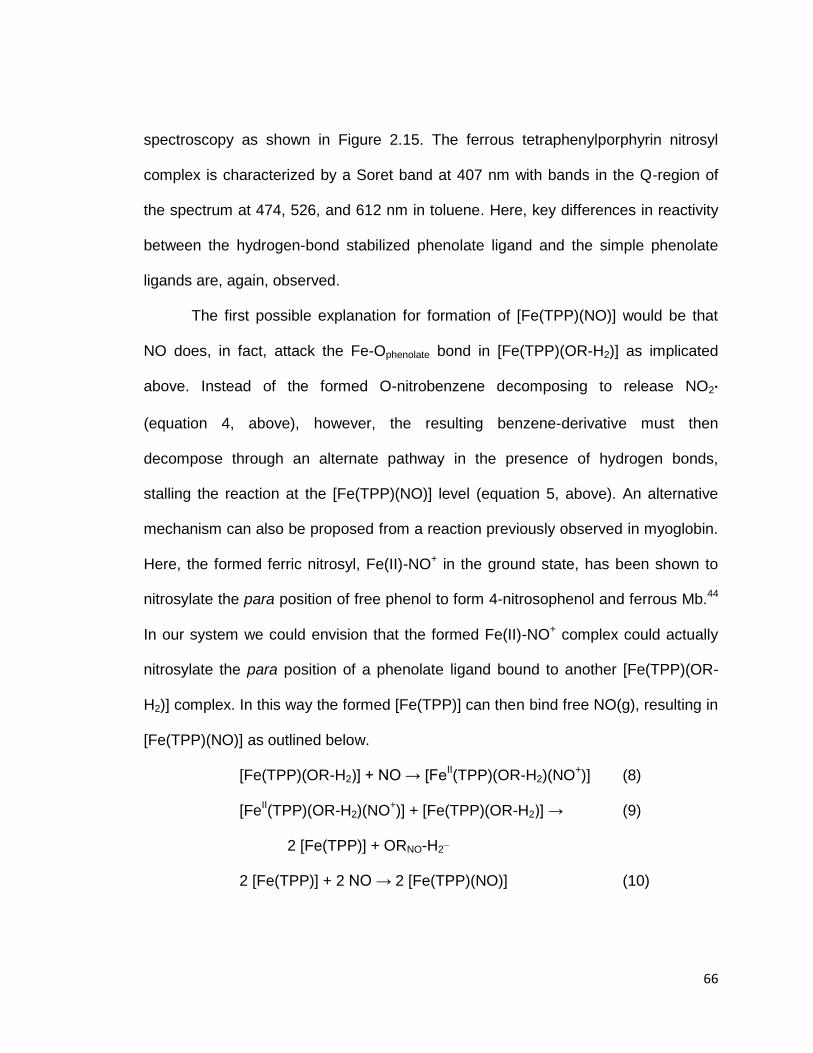
66
spectroscopy as shown in Figure 2.15. The ferrous tetraphenylporphyrin nitrosyl
complex is characterized by a Soret band at 407 nm with bands in the Q-region of
the spectrum at 474, 526, and 612 nm in toluene. Here, key differences in reactivity
between the hydrogen-bond stabilized phenolate ligand and the simple phenolate
ligands are, again, observed.
The first possible explanation for formation of [Fe(TPP)(NO)] would be that
NO does, in fact, attack the Fe-Ophenolate bond in [Fe(TPP)(OR-H2)] as implicated
above. Instead of the formed O-nitrobenzene decomposing to release NO2·
(equation 4, above), however, the resulting benzene-derivative must then
decompose through an alternate pathway in the presence of hydrogen bonds,
stalling the reaction at the [Fe(TPP)(NO)] level (equation 5, above). An alternative
mechanism can also be proposed from a reaction previously observed in myoglobin.
Here, the formed ferric nitrosyl, Fe(II)-NO+ in the ground state, has been shown to
nitrosylate the para position of free phenol to form 4-nitrosophenol and ferrous Mb.44
In our system we could envision that the formed Fe(II)-NO+ complex could actually
nitrosylate the para position of a phenolate ligand bound to another [Fe(TPP)(OR-
H2)] complex. In this way the formed [Fe(TPP)] can then bind free NO(g), resulting in
[Fe(TPP)(NO)] as outlined below.
[Fe(TPP)(OR-H2)] + NO → [FeII(TPP)(OR-H2)(NO
+)] (8)
[FeII(TPP)(OR-H2)(NO
+)] + [Fe(TPP)(OR-H2)] → (9)
2 [Fe(TPP)] + ORNO-H2¯
2 [Fe(TPP)] + 2 NO → 2 [Fe(TPP)(NO)] (10)

67
Finally, ferric heme-nitrosyls undergo autoreduction to ferrous heme-nitrosyls in the
presence of base. Here, excess phenol ligand from formation of the ferric precursor
could act as the required base to perform this reduction. This is highly unlikely,
however, as 1H NMR of the starting complex [Fe(TPP)(OR-H2)] does not show any
free phenol.
While further studies are necessary to determine the reactivity of five-
coordinate ferric heme phenolate complexes with NO, the difference in reactivity
between simple phenolate ligands (OPh¯, OPHF4¯) and their hydrogen-bond
stabilized counterpart (OR-H2¯) is interesting. This finding demonstrates the
effectiveness of proximal pocket hydrogen bonds in tuning the properties and
reactivites of heme active sites in proteins.
DFT Analysis of Ferric Porphyrin Nitrosyl Complexes with Axial Phenolate Ligation
Although we have been unsuccessful in isolating ferric heme-nitrosyl
complexes with axial phenolate coordination, we are able to probe their properties
and the effect of the hydrogen-bond stabilized phenolate ligand using DFT
calculations. To this end, we have performed geometry optimizations and vibrational
analysis of three [Fe(P)(X)(NO)] complexes where X is OPh¯, OR-H1¯, and OR-H2¯.
Figure 2.16. DFT optimized structures of (a) [Fe(P)(OPh)(NO)], (b) [Fe(P)(OR-H1)(NO)], and (c)
[Fe(P)(OR-H2)(NO)] calclulated with BP86/TZVP. Bond lengths and angles are provided in Table 2.4.
(a) (b) (c)
68
Table 2.4. BP86/TZVP calculated geometric and vibrational parameters of selected ferric heme-nitrosyl complexes with axial phenolate coordination. Geometric Parameters [Å] [o]
ν(N-O)
Complex ΔFe-NO ΔN-O < Fe-X-O ΔFe-X ΔFe-Np [cm-1]
[Fe(P)(OPh)(NO)] 1.668 1.163 164.2 1.901 2.030 1838
[Fe(P)(OR-H1)(NO)] 1.662 1.161 164.9 1.942 2.026 1848
[Fe(P)(OR-H2)(NO)] 1.655 1.159 165.8 2.019 2.019
1858
In this way, we can systematically assess the effect of hydrogen bonds to the
phenolate ligand in ferric heme-nitrosyl complexes, and compare the results to the
analogous thiolate complexes (where X is SPh¯, SR-H1¯, and SR-H2¯) which was
published previously.45
The BP86/TZVP optimized structures of [Fe(P)(OPh)(NO)], [Fe(P)(OR-
H1)(NO)], and [Fe(P)(OR-H2)(NO)] are shown in Figure 2.16 with geometric
parameters listed in Table 2.4. As hydrogen bonds are successively added, the Fe-
Ophenolate bond becomes longer in accordance with a decrease in the phenolate donor
strength. In [Fe(P)(OPh)(NO)], the Fe-Ophenolate bond is 1.90 Å, whereas it is 2.02 Å in
[Fe(P)(OR-H2)(NO)]. The donor strength of the phenolate also trends well with the
calculated Fe-NO and N-O bond lengths. As the donor strength of the phenolate is
reduced through the addition of hydrogen bonds, the Fe-NO and N-O bonds become
shorter and the Fe-N-O angle becomes more linear (listed in Table 2.4). Additionally,
the N-O stretching frequencies follow this trend: for X = OPh¯, the calculated N-O
stretching frequency is 1938 cm-1
which increases systematically to 1948 and 1958
cm-1
for X = OR-H1¯ and OR-H2¯, respectively. Unfortunately, the Fe-NO stretching
frequencies in these complexes are spread over several vibrational bands and as a
result are difficult to assign from the BP68/TZVP frequency calculations. In
summary, the stronger the donation of the axial phenolate ligand in ferric heme-
nitrosyl complexes, the weaker the Fe-NO and N-O bonds become and the more the
69
Fe-N-O angle bends. This trend is observed for both S-45
and O-donor anionic axial
ligands.
Interestingly, the effect of added hydrogen bonds is slightly more dramatic in
the case of thiolate coordination to ferric heme-nitrosyls. In the case of thiolate
ligation, addition of two hydrogen bonds straightens the Fe-N-O unit by 3o whereas
in the corresponding phenolate complex, addition of two hydrogen bonds straightens
the Fe-N-O unit by 1.6o. Additionally, the calculated N-O stretching frequency
increases by 30 cm-1
with the addition of hydrogen bonds: ν(N-O) is 1829 and 1859
cm-1
for [Fe(P)(SPh)(NO)] and [Fe(P)(SR-H2)(NO)], respectively. For the
corresponding phenolate complexes, the increase in ν(N-O) is only 20 cm-1
. In
conclusion, the strength of the Fe-NO and N-O bonds and the geometry of the Fe-
NO unit are directly related to the strength of the axial anionic donor in ferric heme-
nitrosyls. This emphasizes that the bending of the Fe-NO unit in ferric catalase and
P450nor is due to an electronic effect of the proximal tyrosinate/cysteinate ligand
rather than steric crowding in the distal pockets of these enzymes.
2.3. The Effect of Axial Ligand Strength in Ferric Heme-Nitrosyls
While synthesis of ferric heme-nitrosyls with axial phenolate ligation has been
surprisingly difficult, recently our collaborator Dr. George B. Richter-Addo from the
University of Oklahoma has successfully synthesized an analogous ferric heme-
nitrosyl with acetate ligation. The complex, [Fe(TPP)(AcF3)(NO)] where AcF3¯ =
trifluroracetate, was synthesized by solid state reaction of NO (g) with the five-
coordinate precursor, [Fe(TPP)(AcF3)]. The resulting complex was characterized by
X-ray crystallography as shown in Figure 2.17. This complex is a model for the
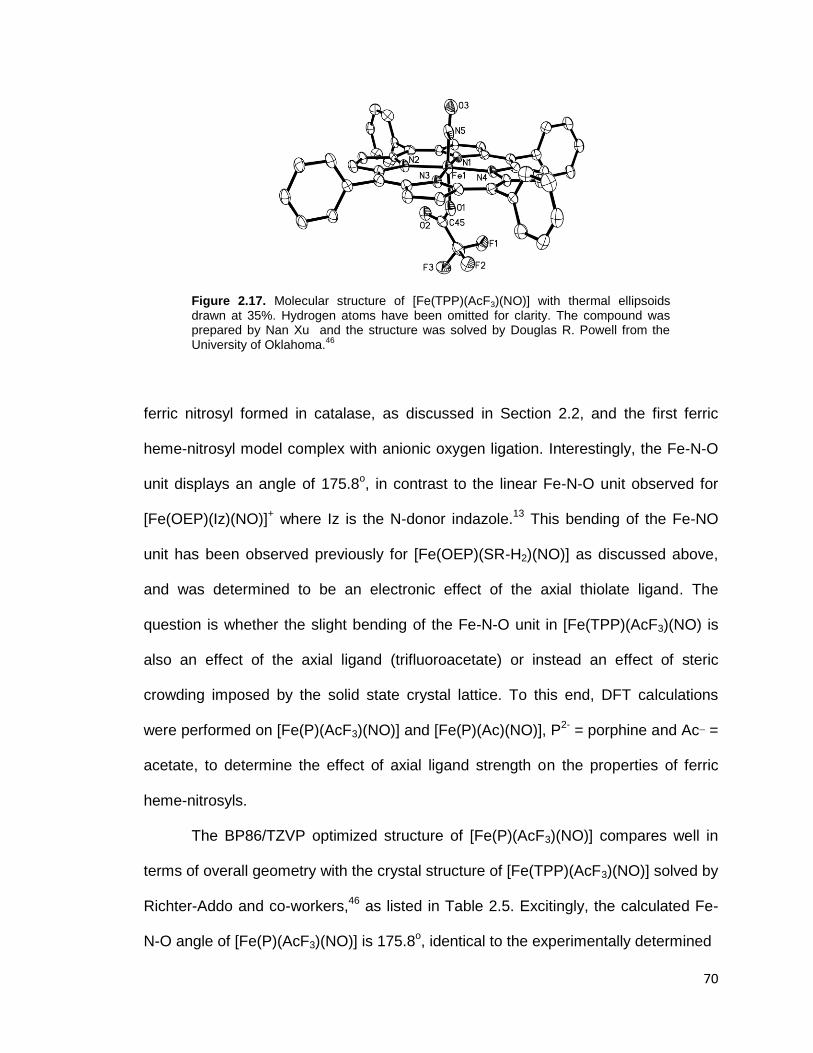
70
Figure 2.17. Molecular structure of [Fe(TPP)(AcF3)(NO)] with thermal ellipsoids drawn at 35%. Hydrogen atoms have been omitted for clarity. The compound was prepared by Nan Xu and the structure was solved by Douglas R. Powell from the University of Oklahoma.
46
ferric nitrosyl formed in catalase, as discussed in Section 2.2, and the first ferric
heme-nitrosyl model complex with anionic oxygen ligation. Interestingly, the Fe-N-O
unit displays an angle of 175.8o, in contrast to the linear Fe-N-O unit observed for
[Fe(OEP)(Iz)(NO)]+ where Iz is the N-donor indazole.
13 This bending of the Fe-NO
unit has been observed previously for [Fe(OEP)(SR-H2)(NO)] as discussed above,
and was determined to be an electronic effect of the axial thiolate ligand. The
question is whether the slight bending of the Fe-N-O unit in [Fe(TPP)(AcF3)(NO) is
also an effect of the axial ligand (trifluoroacetate) or instead an effect of steric
crowding imposed by the solid state crystal lattice. To this end, DFT calculations
were performed on [Fe(P)(AcF3)(NO)] and [Fe(P)(Ac)(NO)], P2-
= porphine and Ac¯ =
acetate, to determine the effect of axial ligand strength on the properties of ferric
heme-nitrosyls.
The BP86/TZVP optimized structure of [Fe(P)(AcF3)(NO)] compares well in
terms of overall geometry with the crystal structure of [Fe(TPP)(AcF3)(NO)] solved by
Richter-Addo and co-workers,46
as listed in Table 2.5. Excitingly, the calculated Fe-
N-O angle of [Fe(P)(AcF3)(NO)] is 175.8o, identical to the experimentally determined
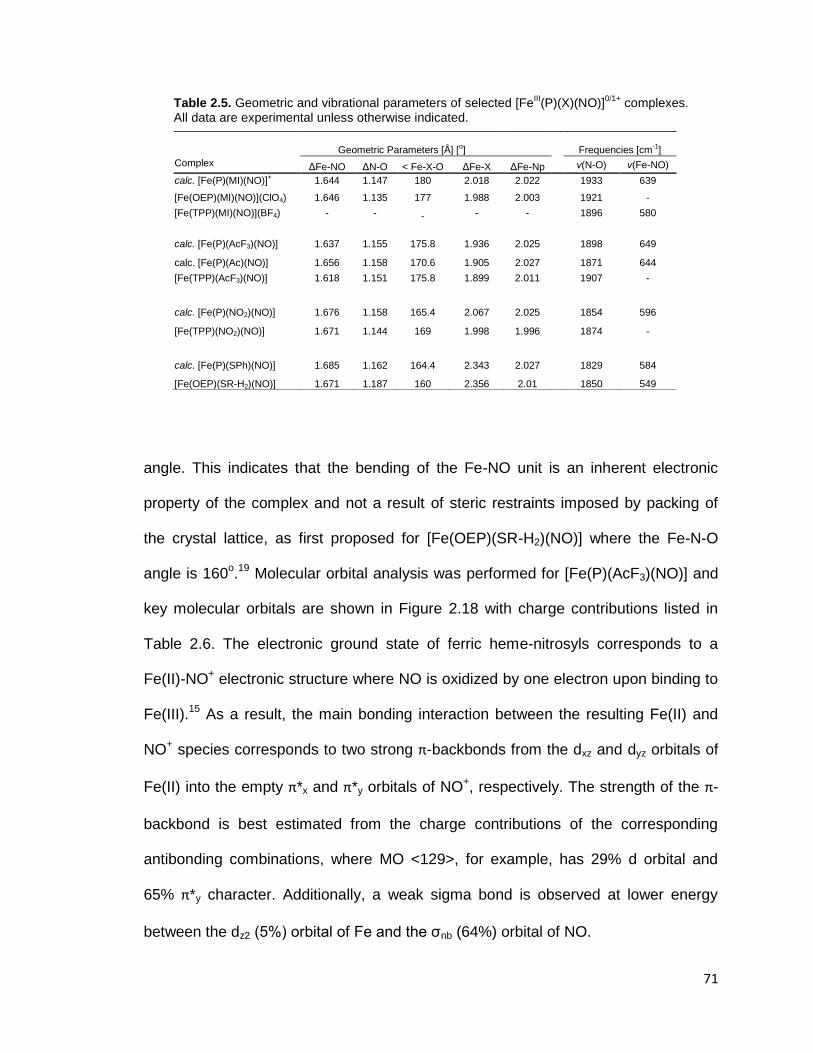
71
Table 2.5. Geometric and vibrational parameters of selected [FeIII(P)(X)(NO)]
0/1+ complexes.
All data are experimental unless otherwise indicated.
angle. This indicates that the bending of the Fe-NO unit is an inherent electronic
property of the complex and not a result of steric restraints imposed by packing of
the crystal lattice, as first proposed for [Fe(OEP)(SR-H2)(NO)] where the Fe-N-O
angle is 160o.19
Molecular orbital analysis was performed for [Fe(P)(AcF3)(NO)] and
key molecular orbitals are shown in Figure 2.18 with charge contributions listed in
Table 2.6. The electronic ground state of ferric heme-nitrosyls corresponds to a
Fe(II)-NO+ electronic structure where NO is oxidized by one electron upon binding to
Fe(III).15
As a result, the main bonding interaction between the resulting Fe(II) and
NO+ species corresponds to two strong π-backbonds from the dxz and dyz orbitals of
Fe(II) into the empty π*x and π*y orbitals of NO+, respectively. The strength of the π-
backbond is best estimated from the charge contributions of the corresponding
antibonding combinations, where MO <129>, for example, has 29% d orbital and
65% π*y character. Additionally, a weak sigma bond is observed at lower energy
between the dz2 (5%) orbital of Fe and the σnb (64%) orbital of NO.
Geometric Parameters [Å] [o]
Frequencies [cm-1]
Complex ΔFe-NO ΔN-O < Fe-X-O ΔFe-X ΔFe-Np ν(N-O) ν(Fe-NO)
calc. [Fe(P)(MI)(NO)]+ 1.644 1.147 180 2.018 2.022 1933 639
[Fe(OEP)(MI)(NO)](ClO4) 1.646 1.135 177 1.988 2.003 1921 -
[Fe(TPP)(MI)(NO)](BF4) - - - - - 1896 580
calc. [Fe(P)(AcF3)(NO)] 1.637 1.155 175.8 1.936 2.025 1898 649
calc. [Fe(P)(Ac)(NO)] 1.656 1.158 170.6 1.905 2.027 1871 644
[Fe(TPP)(AcF3)(NO)] 1.618 1.151 175.8 1.899 2.011 1907 -
calc. [Fe(P)(NO2)(NO)] 1.676 1.158 165.4 2.067 2.025 1854 596
[Fe(TPP)(NO2)(NO)] 1.671 1.144 169 1.998 1.996 1874 -
calc. [Fe(P)(SPh)(NO)] 1.685 1.162 164.4 2.343 2.027 1829 584
[Fe(OEP)(SR-H2)(NO)] 1.671 1.187 160 2.356 2.01
1850 549
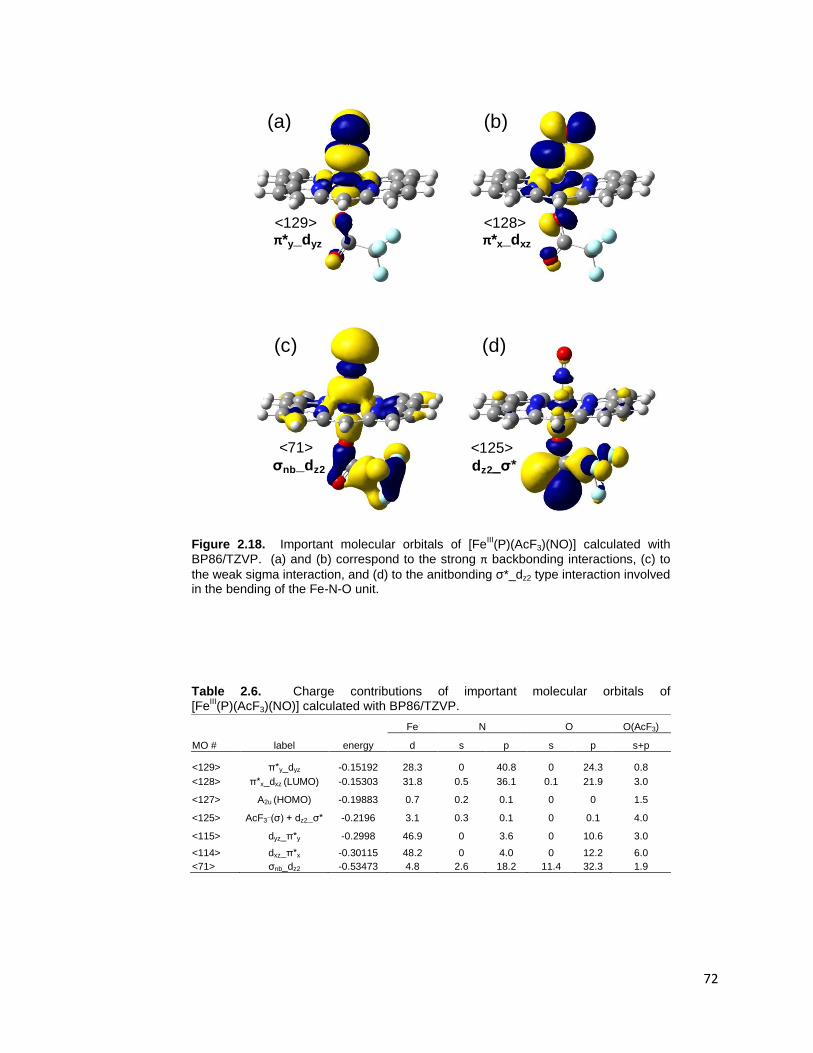
72
Figure 2.18. Important molecular orbitals of [FeIII(P)(AcF3)(NO)] calculated with
BP86/TZVP. (a) and (b) correspond to the strong π backbonding interactions, (c) to
the weak sigma interaction, and (d) to the anitbonding σ*_dz2 type interaction involved in the bending of the Fe-N-O unit.
Table 2.6. Charge contributions of important molecular orbitals of [Fe
III(P)(AcF3)(NO)] calculated with BP86/TZVP.
(a) (b)
<129> π*y_dyz
<128> π*x_dxz
(c) (d)
<71>
σnb_dz2
<125>
dz2_σ*
Fe N O O(AcF3)
MO # label energy d s p s p s+p
<129> π*y_dyz -0.15192 28.3 0 40.8 0 24.3 0.8
<128> π*x_dxz (LUMO) -0.15303 31.8 0.5 36.1 0.1 21.9 3.0
<127> A2u (HOMO) -0.19883 0.7 0.2 0.1 0 0 1.5
<125> AcF3¯(σ) + dz2_σ* -0.2196 3.1 0.3 0.1 0 0.1 4.0
<115> dyz_π*y -0.2998 46.9 0 3.6 0 10.6 3.0
<114> dxz_π*x -0.30115 48.2 0 4.0 0 12.2 6.0
<71> σnb_dz2 -0.53473 4.8 2.6 18.2 11.4 32.3 1.9
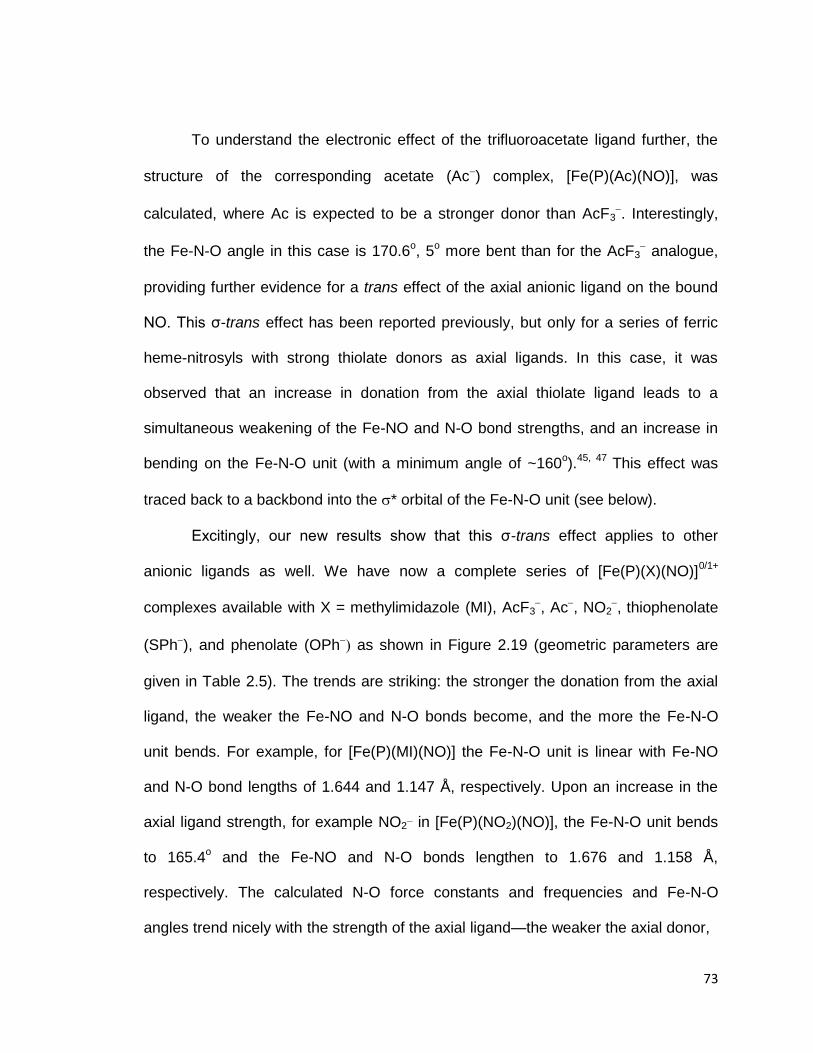
73
To understand the electronic effect of the trifluoroacetate ligand further, the
structure of the corresponding acetate (Ac) complex, [Fe(P)(Ac)(NO)], was
calculated, where Ac is expected to be a stronger donor than AcF3. Interestingly,
the Fe-N-O angle in this case is 170.6o, 5
o more bent than for the AcF3
analogue,
providing further evidence for a trans effect of the axial anionic ligand on the bound
NO. This σ-trans effect has been reported previously, but only for a series of ferric
heme-nitrosyls with strong thiolate donors as axial ligands. In this case, it was
observed that an increase in donation from the axial thiolate ligand leads to a
simultaneous weakening of the Fe-NO and N-O bond strengths, and an increase in
bending on the Fe-N-O unit (with a minimum angle of ~160o).
45, 47 This effect was
traced back to a backbond into the * orbital of the Fe-N-O unit (see below).
Excitingly, our new results show that this σ-trans effect applies to other
anionic ligands as well. We have now a complete series of [Fe(P)(X)(NO)]0/1+
complexes available with X = methylimidazole (MI), AcF3, Ac, NO2
, thiophenolate
(SPh), and phenolate (OPh as shown in Figure 2.19 (geometric parameters are
given in Table 2.5). The trends are striking: the stronger the donation from the axial
ligand, the weaker the Fe-NO and N-O bonds become, and the more the Fe-N-O
unit bends. For example, for [Fe(P)(MI)(NO)] the Fe-N-O unit is linear with Fe-NO
and N-O bond lengths of 1.644 and 1.147 Å, respectively. Upon an increase in the
axial ligand strength, for example NO2¯ in [Fe(P)(NO2)(NO)], the Fe-N-O unit bends
to 165.4o and the Fe-NO and N-O bonds lengthen to 1.676 and 1.158 Å,
respectively. The calculated N-O force constants and frequencies and Fe-N-O
angles trend nicely with the strength of the axial ligand—the weaker the axial donor,

74
Figure 2.19. Optimized geometric parameters of [Fe(P)(X)(NO)]0/1+
calculated with BP86/TZVP.
Table 2.7. BP86/TZVP calculated force constants and stretching frequencies of [Fe
III(P)(X)(NO)]
0/1+ complexes.
Calculated Force Constants (mdyn/Å)
Calculated Frequencies [cm-1]
Complex N-O Fe-NO Fe-Xa ν(N-O) ν(Fe-NO)
[Fe(P)(MI)(NO)]+ 15.62 4.82 1.48 1933 639
[Fe(P)(AcF3)(NO)] 14.87 5.14 1.62 1898 649
[Fe(P)(Ac)(NO)] 14.54 4.67 1.90 1871 644
[Fe(P)(NO2)(NO)] 14.43 4.24 1.29 1854 596
[Fe(P)(SPh)(NO)] 14.03 3.99 1.16 1829 584
aaxial ligand trans to NO
1.147Å
1.644Å
2.018Å
179.9°
[Fe(P)(Ac)(NO)]
1.158Å
1.656Å
1.905Å
170.6°
[Fe(P)(SPh)(NO)]
1.162Å
1.685Å
2.343Å
164.4°
[Fe(P)(NO2)(NO)]
1.158Å
1.676Å
2.067Å
165.4°
[Fe(P)(AcF3)(NO)]
1.155Å
1.637Å
1.936Å
175.8°
[Fe(P)(MI)(NO)]
[Fe(P)(OPh)(NO)]
1.163Å
1.668Å
1.901Å
164.2°
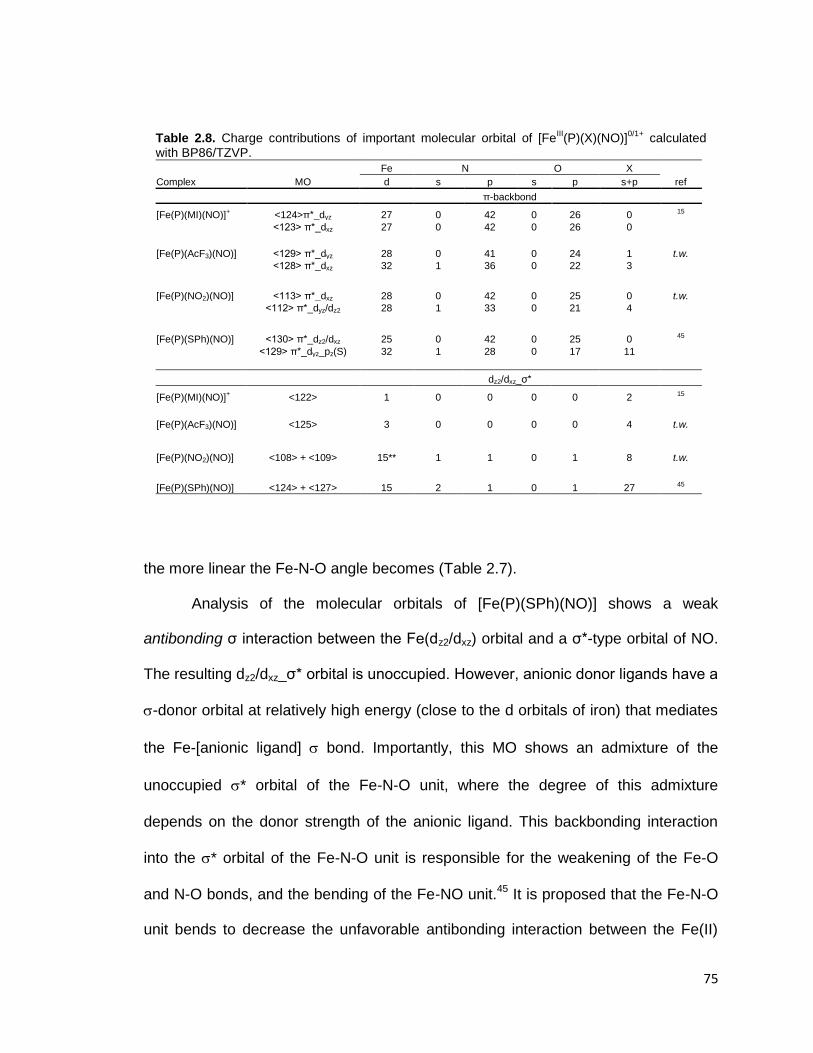
75
Table 2.8. Charge contributions of important molecular orbital of [FeIII(P)(X)(NO)]
0/1+ calculated
with BP86/TZVP.
Fe N O X
Complex MO d s p s p s+p ref
π-backbond
[Fe(P)(MI)(NO)]+ <124>π*_dyz 27 0 42 0 26 0 15
<123> π*_dxz 27 0 42 0 26 0
[Fe(P)(AcF3)(NO)] <129> π*_dyz 28 0 41 0 24 1 t.w.
<128> π*_dxz 32 1 36 0 22 3
[Fe(P)(NO2)(NO)] <113> π*_dxz 28 0 42 0 25 0 t.w.
<112> π*_dyz/dz2 28 1 33 0 21 4
[Fe(P)(SPh)(NO)] <130> π*_dz2/dxz 25 0 42 0 25 0 45
<129> π*_dyz_pz(S) 32 1 28 0 17 11
dz2/dxz_σ*
[Fe(P)(MI)(NO)]+ <122> 1 0 0 0 0 2 15
[Fe(P)(AcF3)(NO)] <125> 3 0 0 0 0 4 t.w.
[Fe(P)(NO2)(NO)] <108> + <109> 15** 1 1 0 1 8 t.w.
[Fe(P)(SPh)(NO)] <124> + <127> 15 2 1 0 1 27 45
the more linear the Fe-N-O angle becomes (Table 2.7).
Analysis of the molecular orbitals of [Fe(P)(SPh)(NO)] shows a weak
antibonding σ interaction between the Fe(dz2/dxz) orbital and a σ*-type orbital of NO.
The resulting dz2/dxz_σ* orbital is unoccupied. However, anionic donor ligands have a
-donor orbital at relatively high energy (close to the d orbitals of iron) that mediates
the Fe-[anionic ligand] bond. Importantly, this MO shows an admixture of the
unoccupied * orbital of the Fe-N-O unit, where the degree of this admixture
depends on the donor strength of the anionic ligand. This backbonding interaction
into the * orbital of the Fe-N-O unit is responsible for the weakening of the Fe-O
and N-O bonds, and the bending of the Fe-NO unit.45
It is proposed that the Fe-N-O
unit bends to decrease the unfavorable antibonding interaction between the Fe(II)
76
and NO+ orbitals. The charge contributions for this dz2/dxz_σ* orbital for X = MI,
AcF3, NO2
, and SPh are listed in Table 2.8. As expected, for the strong donor X =
SPh where the Fe-N-O bond is highly bent and the lowest N-O stretching frequency
is predicted, the largest admixture of the dz2/dxz_σ* orbital is observed: 15% Fe(d)
character and 4% NO(σ*) character as previously reported.45
As the Fe-N-O unit
straightens and the N-O stretching frequency increases, the charge contribution of
this key orbital decreases accordingly. When X corresponds to the weak donor AcF3
the orbital contains only 3% Fe(d) character and less than 1% NO(σ*) character. For
the completely linear complex [Fe(P)(MI)(NO)] with a neutral N-donor ligand this
backbond into dz2/dxz_σ* disappears.
In summary, the nature of the axial ligand in six-coordinate ferric heme-
nitrosyls controls the properties of the Fe-NO unit. Here we provide the first series of
compounds to illustrate this point. The stronger the donation of the axial ligand, the
weaker the Fe-NO and N-O bonds become. A weakening of the Fe-NO and N-O
bonds is accompanied by a distinct bending of the Fe-N-O unit. In addition, the
calculated force constants and Fe-NO and N-O stretching frequencies decrease
accordingly. In this way, proteins can utilize the nature of the axial ligand in ferric
heme-nitrosyls to fine tune the properties and reactivity of these species in biological
systems.
Experimental
The following porphyrin ligands were synthesized as previously reported:
tetraphenylporphyrin (H2[TPP]),48
tetrakis-5,10,15,20-(o-difluorophenyl)porphyrin
(H2[To-F2PP]),49
tetrakis-5,10,15,20-(o-dimethoxyphenyl)porphyrin (H2[To-
77
(OCH3)2PP]),50
tetrakis-5,10,15,20-(o-dihydroxyphenyl)porphyrin (H2[To-(OH)2PP]),50
and octaethyltetraphenylporphyrin (H2[OETPP]).51
Tetrakis-5,10,15,20-(2,6-dinitro-4-
tert-butylphenyl)porphyrin, H2[To-(NO2)2-p-tBuPP], was prepared by BF3-OEt
catalyzed condensation of 2,6-dinitro-4-tert-butylbenzaldehyde52
and pyrrole in
CH2Cl2 as reported previously.53
Octaethylporphyrin (H2[OEP]) was purchased from
Frontier Scientific. [Fe(OEP)(SR-H2)] and [Fe(OEP)(SR-H1)] were provided by Dr.
George B. Richter-Addo at the University of Oklahoma. The ferric phenolate
complexes [Fe(TPP)(OPh)], [Fe(TPP)(OPhF4)], and [Fe(TPP)(OR-H2)] were prepared
through the synthesis developed by Ueyama and co-workers.54 Diphenyl disulfide
derivatives were prepared as previously reported.55
Porphyrin Synthesis
3,4-dihydroxy-2,5-dimethoxytetrahydrofuran (1).56
Under inert atmosphere, 12.2 g
KMnO4 (77 mmol) in 450 mL water was added dropwise to a stirring solution of 10 g
2,5-dihyrdo-2,5-dimethoxyfuran (77 mmol) in 100 mL THF at -10oC. The KMnO4
solution was added slowly enough that the temperature did not rise above 5oC. After
addition, the reaction was allowed to stir at room temperature for 12 hours. After 12
hours, the reaction mixture is filtered and the filtrate evaporated to an oil. The
resulting oil is dissolved in ethyl acetate, dried with magnesium sulfate, rotovaped to
a yellow oil, and used without further purification. Yield: 5.53 g (44%). 1H NMR
(CDCl3): 4.92 (s, 2H); 4.16 (s, 2H); 3.41 (s, 6H).
2,3,4,5-tetramethoxytetrahydrofuran (2).57
A stirring mixture of 2.6 g 3,4-dihydroxy-
2,5-dimethoxytetrahydrofuran (1, 15.8 mmol), 5.7 g KOH, and 32 mL THF were
heated at reflux for 1 hour. Then, over a 3 hour period, 4.6 mL dimethylsulfate (48
78
mmol) in 19 mL THF was added via disposable needle. The solution was refluxed for
16 hours. Next, 100 mL of water was added and solution was stirred for and
additional hour. Water (600 mL) was added to the reaction mixture and the resulting
solution was extracted with an equal portion of ether. The aqueous layer was then
washed with CH2Cl2 four times. The organic layers were combined and evaporated
to yellow oil. Yield: 2.8 g (92%). 1H NMR (CDCl3): 4.97 (s, 2H); 3.81 (s, 2H); 3.44 (s,
6H); 3.41 (s, 6H). LCT-MS: m/z 192.1
1-benzyl-3,4-dimethoxypyrrole (3). 2.8 g 2,3,4,5-tetramethoxytetrahydrofuran (2, 15
mmol) was added to 2.0 M HCl (2.5 mL, 5 mmol) and heated to 70C for 30 minutes.
Once the solution cooled to room temperature, a solution of 8 mL benzylamine (73
mmol) and 14.1 g sodium acetate trihydrate (104 mmol) in 220 mL CHCl3 was added
to the reaction mixture and stirred for 24 hours. After 24 hours, the reaction mixture
was washed with saturated sodium bicarbonate, dried with magnesium sulfate, and
solvent removed via reduced pressure. The resulting residue was purified via silica
column with 100% CH2Cl2. The second fraction (emits a light green fluorescence)
was collected. Yield: 1.58 g (50%). 1H NMR (CDCl3): 7.28 (m, 3H); 7.07 (d, 2H); 6.09
(s, 2H); 4.82 (s, 2H); 3.69 (s, 6H). LCT-MS: m/z 218.1 (M+1).
3,4-dimethoxypyrrole (4). While stirring, ~73 mL NH3 was condensed into 336 mg
Na(s) (14.6 mmol) in a dry ice-acetone bath. Then, 1.58 g 1-benzyl-3,4-
dimethoxypyrrole (3, 7.3 mmol) in 7.15 mL dry THF was added dropwise to the
Na(s)/NH3 solution. As the reaction progressed, the solution turned from navy blue
to orange. After stirring for 20 minutes, the reaction was warmed to room
79
temperature and 0.78 g ammonium chloride in 44mL H2O was added to quench
excess Na (s). The NH3 was allowed to evaporate and the solution was extracted
with CH2Cl2. The organic layer was evaporated to dryness and the yellow-brown oil
was purified via column chromatography on silica with 100% CH2Cl2. The product,
3,4-dimethoxypyrrole, was in the 2nd
band. Yield: 0.26 g (27%). 1H NMR (CDCl3):
6.93 (s, 1H); 6.20 (d, 2H); 3.74 (s, 6H).
2,3,7,8,12,13,17,18-octamethoxyporphyrin (H2[OOMeP]). Synthesized through the
condensation of 3,4-dimethoxylpyrrole (4) and formaldehyde as reported by Merz et
al.58
1H NMR (CDCl3): 10.04 (s, 4H); 4.77 (s, 24H). UV-vis (CH2Cl2): 373, 477, 535,
597 nm. LCT-MS: m/z 551 (M + 1).
Tetrakis-5,10,15,20-(2,6-di-O-benzylphenyl)porphyrin (H2[To-(OBn)2PP],6). Under
inert atmosphere, 100 mg H2[To-(OH)2PP] (0.13 mmol), 0.67 g potassium carbonate
(4.8 mmol), and 0.28 g 18-crown-6 (1 mmol) were brought to reflux in 8 mL dry DMF.
Once at reflux, 0.25 mL benzyl bromide (2 mmol) was added and the reaction
refluxed for 5 days. The DMF was removed via Schlenk line and the crude product
column chromatographed on silica with 2:1 CH2Cl2:acetone. The red product band
was recrystallized at -30oC by dissolving in a minimum amount of CH2Cl2 and
layering with hexanes. Yield: 111 mg (56%). 1H NMR (CDCl3): 8.86 (s, 8H); 7.66 (t,
4H); 6.98 (d, 8H); 6.65 (m, 40H); 4.89 (s, 16H); -2.21 (s, 2H). UV-vis (CH2Cl2): 421,
514, 548, 589, 646 nm. LCT-MS: m/z 1464.8.
Tetrakis-5,10,15,20-(2,6-diamino-4-tert-butylphenyl)porphyrin (H2[To-(NH2)2-p-
tBuPP]). Under inert atmosphere, 25 mg H2[To-(NO2)2-p-tBuPP] (0.025 mmol), 25

80
mg 10% palladium on carbon, and 3 mL absolute ethanol were brought to reflux.
Then, 0.22 mL hydrazine hydrate in 0.75 mL absolute ethanol was added dropwise
to the refluxing solution. The mixture was refluxed overnight before being poured
through a pad of Celite. The Celite was rinsed with boiling ethanol and CH2Cl2. The
filtrate was collected and rotovaped to dryness. Yield: 19 mg (77%). 1H NMR
(CDCl3): 8.93 (s, 8H); 6.75 (s, 8H); 3.75 (s, 16 H); 1.62 (s, 36H); -2.85 (s, 2H). UV-vis
(CH2Cl2): 424, 521, 559, 595, 656 nm. LCT-MS: m/z 959.5.
H2[To-(Am)2-p-tBuPP]. 100 mg H2[To-(NH2)2-p-tBuPP] (0.1 mmol), 0.8 mL pyridine
(0.8 mmol), and 0.8 mL pivolyl chloride (0.8 mmol) were stirred in 10 mL CH2Cl2
under inert atmosphere for 12 hours. After 12 hours, the reaction mixture was
washed with ammonium hydroxide, twice with water, and then evaporated to
dryness. The resulting purple residue was column chromatgraphed on silica with 1:1
hexanes:CH2Cl2. The red product band was recrystallized at -30oC by dissolving in a
minimum amount of CH2Cl2 and layering with hexanes. Yield: 119 mg (73%). 1H
NMR (acetone-d6): 9.21 (s, 8H); 8.68 (s, 8H); 7.92 (s, 8H); 1.34 (s, 72H); 0.14 (s,
36H); -2.85 (s, 2H). UV-vis (CH2Cl2): 423, 518, 554, 596, 654 nm. LCT-MS: m/z
1632.6.
Iron Insertion and Ligand Exchange
General procedures for iron insertion and formation of the corresponding five-
coordinate ferric porphyrin complexes with thiolate coordination follow:
[Fe(P)(Cl)].49
Under inert atmosphere, porphyrin (0.1 mmol) is brought to reflux in 20
mL DMF. Once at reflux, anhydrous iron(II) chloride (1 mmol) is added and the
81
reaction refluxed for 3 hours. The reaction is cooled to room temperature and the
DMF partioned between ethyl acetate and water. The organic layer is evaporated to
dryness and chromatographed on a silica column eluted with (1) 100% CH2Cl2 to
remove free-base porphyrin and (2) 97:3 CH2Cl2:methanol to removed desired
product. The product band is evaporated to dryness, redissolved in CH2Cl2 and
washed twice with 1 M HCl. The organic layer is dried with sodium sulfate and
evaporated to dryness to yield a dark purple solid.
[Fe(P)(OH)] or [(Fe(P))2O]. [Fe(P)(Cl)] (0.1 mmol) was dissolved in 25 mL CH2Cl2
and stirred with 4 M NaOH (aq). Reaction progress was monitored by UV-visible
spectroscopy. Once full conversion to the product is observed (~1 hour), the organic
layer is washed three times with H2O, dried with sodium sulfate, and evaporated to
dryness to yield a brown solid.
[Fe(P)]. Ethanethiol (40 mmol) and [Fe(P)(OH)] or [(Fe(P))2O] (0.1 mmol) were
dissolved in 10 mL toluene under inert atmosphere. The reaction is heated to 70oC
for 4 hours at which point the solvent and excess ethanethiol are removed via
reduced pressure. The residue is redissolved in a minimum volume of toluene and
layered with hexanes for recrystallization at -30oC overnight. The resulting solid is
filtered under inert atmosphere yielding bright purple solid.
[Fe(P)(SR)]. Under inert atmosphere, [Fe(P)] (0.1 mmol) and diphenyl disulfide (0.2
mmol) were heated to 70oC in 12 mL toluene. Reaction progress was monitored by
UV-visible spectroscopy. Typical reaction time at 70oC is 4 hours. Alternatively, the
reaction can be stirred at room temperature overnight with 10 equivalents diphenyl
82
disulfide. Once full formation of the ferric porphyrin thiolate complex is observed, the
reaction mixture is cooled to room temperature, layered with hexanes, and stored at
-30oC overnight to crystallize.
[Fe(TPP)(Cl)]. UV-vis (CH2Cl2): 379, 416, 509, 588, 659, 692 nm.
[(Fe(TPP))2O]. UV-vis (CH2Cl2): 407, 569, 613 nm.
[Fe(TPP)]. UV-vis (toluene): 418, 442, 542 nm.
[Fe(TPP)(SPhF4)]. UV-vis (toluene): 417, 512, 577, 671, 715 nm.
[Fe(TPP)(NO)]. UV-vis (toluene): 408, 475, 538, 613 nm.
[Fe(OEP)(Cl)]. UV-vis (CH2Cl2): 379, 507, 537, 636 nm.
[(Fe(OEP))2O]. UV-vis (CH2Cl2): 385, 558, 595 nm.
[Fe(OEP)]: UV-vis (toluene): 386, 411, 528, 562 nm.
[Fe(OEP)(SPhF4)]. UV-vis (toluene): 376, 513, 537, 645 nm.
[Fe(OEP)(SPhOMe)]. UV-vis (toluene):383, 521, 638 nm.
[Fe(OEP)(SBn)]. UV-vis (toluene):388, 541, 558, 637 nm.
[Fe(OEP)(NO)]. UV-vis (toluene): 392, 480, 534, 559 nm.
[Fe(OOMeP)(Cl)]. UV-vis (CH2Cl2): 318, 370, 467, 651 nm.
[Fe(OOMeP)(OH)]. UV-vis (CH2Cl2): 370, 455, 562, 590 nm.
[Fe(OOMeP)]. UV-vis (toluene): 384, 527, 564 nm.
[Fe(OOMeP)(SPhF4)]. UV-vis (toluene): 381, 513, 653 nm.
[Fe(OOMeP)(NO)]. UV-vis (toluene): 385, 484, 528, 561 nm.
[Fe(OETPP)(Cl)]. UV-vis (CH2Cl2): 399, 445, 540, 580, 694 nm.
83
[Fe(OETPP)(OH)]. UV-vis (CH2Cl2): 436, 492, 697 nm.
[Fe(OETPP)]. UV-vis (toluene): 436, 467, 574 nm.
[Fe(OETPP)(SPhF4)]. UV-vis (toluene): 415, 577 nm.
[Fe(OETPP)(NO)]. UV-vis (toluene): 431, 577 nm.
[Fe(To-(OBn)2PP)(Cl)]. UV-vis (CH2Cl2): 376, 423, 511, 586, 655, 690 nm.
[Fe(To-(OBn)2PP)(OH)]. UV-vis (toluene): 420, 500 (broad), 581, 631 nm.
[Fe(To-(OBn)2PP)]. UV-vis (toluene): 420, 444, 541 nm.
[Fe(To-(OBn)2PP)(SPhF4)]. UV-vis (toluene): 424, 509, 583, 654, 687 nm.
[Fe(To-(OBn)2PP)(NO)]. UV-vis (toluene): 409, 476, 545 nm.
[Fe(To-(Am)2-p-tBuPP)(Cl)]. UV-vis (CH2Cl2): 381, 422, 515, 595, 654, 692 nm.
[Fe(To-(Am)2-p-tBuPP)(OH)]. UV-vis (toluene): 413, 573, 612 nm.
[Fe(To-(Am)2-p-tBuPP)]. UV-vis (toluene): 409, 551 nm.
[Fe(To-(Am)2-p-tBuPP)(SPhF4)]. UV-vis (toluene): 406, 523, 569, 612, 723 nm.
[Fe(To-(Am)2-p-tBuPP)(NO)]. UV-vis (toluene): 399, 486, 547, 619 nm.
[Fe(To-F2PP)(Cl)]. UV-vis (CH2Cl2): 368, 412, 506, 580, 640 nm.
[Fe(To-F2PP)(OH)]. UV-vis (CH2Cl2): 410, 569 nm.
[Fe(To-F2PP)]. UV-vis (THF): 422, 542 nm.
[Fe(To-F2PP)(SPhF4)]. UV-vis (toluene): 411, 510, 573 nm.
[Fe(To-F2PP)(NO)]. UV-vis (THF): 410, 472, 548 nm.
[Fe(To-(OCH3)2PP)(Cl)]. UV-vis (CH2Cl2): 380, 416, 508, 591, 656, 689 nm.
[Fe(To-(OCH3)2PP)(OH)]. UV-vis (CH2Cl2): 416, 506, 584, 642 nm.
84
[Fe(To-(OCH3)2PP)]. UV-vis (toluene): 418, 437, 537 nm.
[Fe(To-(OCH3)2PP)(SPhF4)]. UV-vis (CH2Cl2): 417, 508, 583 nm.
Crystallization of [Fe(OETPP)(SPhF4)]. 25 mg [Fe(OETPP)] and 283 mg bis(2,4,5,6-
tetrafluorophenyl) disulfide were stirred at room temperature in 2 mL toluene for 16
hours. The flask was layered with 4mL hexane and allowed to stand for 3 days. After
3 days, crystals suitable for X-ray analysis were obtained.
Thiolate Ligand, SR-H2¯, Synthesis
7-Nitrobenzothiazole (5). 200 mL conc. H2SO4 was cooled to 10oC in a 500 mL RBF.
16 mL benzothiazole was added dropwise to the H2SO4 via addition funnel. The
solution became a cloudy light brown. In a separate flask, 1.55 g KNO3 ws added to
100 mL HNO3 and stirred until all KNO3 was dissolved. The KNO3-HNO3 solution
was then added dropwise via addition funnel to the benzothiazole-H2SO4 mixture.
The reaction was allowed to stir at 10oC for 1.5 hours and then at room temperature
overnight. After stirring overnight, the reaction mixture was poured over ice and a
yellow precipitate formed. The yellow precipitate was filtered and dissolved in ethyl
acetate. The organic layer was washed with NaCl (aq) and dried with Na2SO4. The
organic layer was rotovaped to dryness and recrystallized with ethanol (heat on a stir
plate until all solid dissolved, let cool overnight). Brown crystals of 6-
nitrobenzothiazole were filtered and recrystallized in ethanol a second time. The
orange filtrate from both recrystallizations was retained and rotovaped to dryness.
The resulting solid was purified on neutral alumina with 1:2 CH2Cl2:hexane. Product
was dry loaded on an alumina column in silica (residue dissolved in acetone/silica
slurry and carefully rotovaped to a dry powder). The product, 7-nitrobenzothiazole,
85
elutes in the first band and 6-nitrobenzothiazole elutes in the second. The yield of
this reaction is very low as the major product of this reaction is 6-nitrobenzothiazole
rather than the desired 7-nitrobenzothiazole. Yield: 2.624 g (10%). 1H-NMR (CDCl3):
9.20 (s, 1H); 8.50-8.48 (dd, 2H); 7.73 (t, 1H).
6-nitrobenzothiazole: 1H-NMR (CDCl3): 9.27 (s, 1H); 8.93 (s, 1H); 8.41 (d,
1H); 8.26 (d, 1H)
7-Aminobenzothiazole (6). 5.65 g SnCl2 and 20 mL conc. HCl were placed in a 50
mL RBF and heated to 40oC while stirring. The solution was heated to 55
oC and
0.91 g of 7-nitrobenzothiazole (5) was added slowly. Once all 7-nitrobezothiazole
was added, the reaction was heated to 65oC for 1 hour and then put on ice and left
overnight to stir. Reaction progress was monitored by mini-extraction with
water/CHCl3 and then TLC on silica in 100% CHCl3. After stirring overnight, 50 mL
DI H2O was added and the pH adjusted to 12 with ~4 M NaOH. The product was
extracted from the aqueous layer with 100 mL ether and 2 x 100 mL CHCl3. The
organic layer was rotovaped to dryness. A yellow oil resulted that dried over time to
a light yellow solid. Yield: quantitative (100%). 1H-NMR (CDCl3): 8.95 (s, 1H); 7.63
(d, 1H); 7.36 (t, 1H); 6.76 (d, 1H); 3.95 (br s, 2H). LCT MS (E+): m/z 151.1 (M+1)
2,6-Diaminobenzenethiol (7). 0.76 g 7-aminobenzothiazole (6) was dissolved in 43
mL of ethanol was placed in a 250 mL Schlenk flask fitted with condenser. The
system was flushed with Ar(g) and 22 mL hydrazine hydrate was added via syringe.
The reaction was brought to reflux under Ar(g) and refluxed overnight. After
refluxing overnight, solvent was pulled off via Schlenk line. Care was taken not to
raise temperature over 40oC. The brown crude material was column
86
chromatographed on silica with 80:2:1 CHCl3:MeOH:NH4OH. The product band was
identified by MS and solvent evaporated via Schlenk line. The obtained thiol was
oxidized immediately to the disulfide. Yield: 0.26 g (36%). LCT MS (E+): m/z 139.1
Bis(2,6-diaminophenyl) Disulfide (8). Under an Ar(g) atmosphere, 100 mg 2,6-
diaminobenzenethiol (7) and 2 mL acetone was cooled to 0oC. Then 3 mL of 5%
H2O2 in acetone was added dropwise to the cooled solution. The reaction was
allowed to stir for 3.5 hours. Solvent was evaporated to dryness. Purification was
performed on silica with 1:2 acetone:hexane. Product was stored under inert
atmosphere. Yield: 80%. 1H NMR (CDCl3): 6.88 (t, 1H); 6.04 (d, 2H); 4.30 (br s, 4H).
LCT MS(E+): m/z 279.1 (M+1)
Bis(2,6-di(trifluoracetylamino)phenyl) Disulfide (9).35
LCT MS(E+): m/z 685.0
(M+Na+).
1H NMR (CDCl3): 8.56 (s, 2H); 8.12(d, 2H); 7.56 (t, 1H).
19F NMR (CDCl3): -
75.66 (s). 13
C NMR (CDCl3): 154.69; 138.68; 134.66; 118.86; 116.90; 112.12
4-Methyl-2,6-dinitrotosylbenzene (10).36
2,6-dinitro-p-cresol (4.0 g, 18.2 mmol) and
p-toluenesulfonyl chloride (3.8 g, 20 mmol) were dissolved in 15 mL dry CH2Cl2.
While stirring, diisopropylethylamine 6.3 mL, 36.4 mmol) was added dropwise over
the course of 10 minutes. Upon addition of diisopropylethyamine (DIEA), the solution
became warm and turned from orange to red. The reaction mixture was allowed to
stir at room temperature for 18 hours. After 18 hours, the solution was filtered and
the precipitate was washed with cold CH2Cl2. The light orange solid was redissolved
in ethyl acetate and washed with 10% citric acid, saturated NaHCO3(aq), and brine.
The organic layer was dried with sodium sulfate and evaporated to dryness. The
87
solid can be further purified by recrystallization from a small amount of ethyl acetate
to yield 3.0 g (47%) of light yellow crystals. An additional 1.7 g of product can be
obtained by evaporating all CH2Cl2 from the original reaction mixture filtrate under
reduced pressure and redissolving in ethyl acetate. After work-up and
recrystallization (as described above), the resulting overall yield is 4.7 g (73%). 1H
NMR (DMSO-d6, 400 MHz): 8.27 (s, 2H), 7.65 (d, 2H), 7.50 (d, 2H), 2.48 (s, 3H),
2.45 (s, 3H). 1H NMR (CDCl3, 400 MHz): 7.93 (s, 2H), 7.76 (d, 2H), 7.37 (d, 2H),
2.53 (s, 3H), 2.49 (s, 3H). 13
C NMR (DMSO-d6, 100 MHz): 147.44, 143.67, 140.43,
130.66, 130.52, 130.44, 129.01, 128.32, 21.14, 20.00. IR (KBr): 1548 (NO2), 1344
cm-1
(NO2).
4-Methyl-2,6-dinitro-1-S-trityl-benzene (11). 4-methyl-2,6-dinitro-p-tosylbenzene (10,
4.0 g, 11 mmol) and triphenylmethanethiol (4.7 g, 17 mmol) were dissolved in 30 mL
dry CH2Cl2 under N2 (g). Diisopropylethylamine (4 mL, 23 mmol) was added via
syringe to the stirring solution and the reaction allowed to stir under inert atmosphere
for 18 hours. After 18 hours, a yellow precipitate formed. The reaction mixture was
filtered and the solid redissoved in CH2Cl2. The CH2Cl2 solution was washed with 5%
NaOH (aq.), 10% citric acid, saturated NaHCO3 (aq.), and brine. The organic layer
was dried with sodium sulfate and evaporated to a tan solid. Yield: 2.9 g (58%). 1H
NMR (DMSO-d6, 400 MHz): 7.80 (s, 2H), 7.24 (m, 9H), 7.04 (d, 6H), 2.38 (s, 3H);
see Figure 2.20. 13
C NMR (DMSO-d6, 100 MHz): 156.45, 142.99, 142.67, 130.00,
127.43, 127.22, 126.10, 118.16, 75.87, 20.83. IR (KBr): 1538 (NO2), 1350 cm-1
(NO2).

88
Figure 2.20. 1H NMR spectrum of 4-methyl-2,6-dinitro-1-S-trityl-benzene (11) in DMSO-d6.
Figure 2.21. 1H NMR spectrum of 4-methyl-2,6-dinitro-thiophenol (12) in CDCl3.
8.5 8.0 7.5 7.0 6.5 4.0 3.5 3.0 2.5 2.0
ppm
DM
SO
-d6
H2O
2H
a
a
b
b
c
c
d
d
9H 6H 3H
8.5 8.0 7.5 7.0 6.5 6.0 5.5 3.0 2.5 2.0
ppm
CD
Cl 3
2H
a
a
b
b
c
c
1H 3H
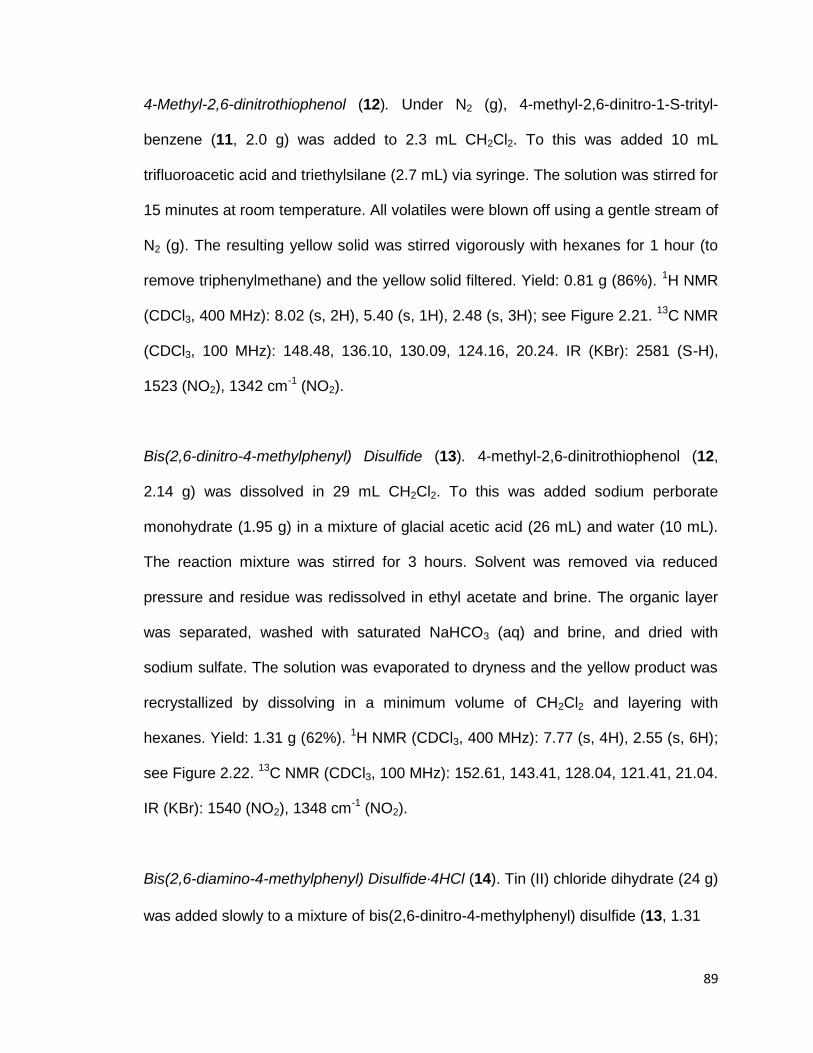
89
4-Methyl-2,6-dinitrothiophenol (12). Under N2 (g), 4-methyl-2,6-dinitro-1-S-trityl-
benzene (11, 2.0 g) was added to 2.3 mL CH2Cl2. To this was added 10 mL
trifluoroacetic acid and triethylsilane (2.7 mL) via syringe. The solution was stirred for
15 minutes at room temperature. All volatiles were blown off using a gentle stream of
N2 (g). The resulting yellow solid was stirred vigorously with hexanes for 1 hour (to
remove triphenylmethane) and the yellow solid filtered. Yield: 0.81 g (86%). 1H NMR
(CDCl3, 400 MHz): 8.02 (s, 2H), 5.40 (s, 1H), 2.48 (s, 3H); see Figure 2.21. 13
C NMR
(CDCl3, 100 MHz): 148.48, 136.10, 130.09, 124.16, 20.24. IR (KBr): 2581 (S-H),
1523 (NO2), 1342 cm-1
(NO2).
Bis(2,6-dinitro-4-methylphenyl) Disulfide (13). 4-methyl-2,6-dinitrothiophenol (12,
2.14 g) was dissolved in 29 mL CH2Cl2. To this was added sodium perborate
monohydrate (1.95 g) in a mixture of glacial acetic acid (26 mL) and water (10 mL).
The reaction mixture was stirred for 3 hours. Solvent was removed via reduced
pressure and residue was redissolved in ethyl acetate and brine. The organic layer
was separated, washed with saturated NaHCO3 (aq) and brine, and dried with
sodium sulfate. The solution was evaporated to dryness and the yellow product was
recrystallized by dissolving in a minimum volume of CH2Cl2 and layering with
hexanes. Yield: 1.31 g (62%). 1H NMR (CDCl3, 400 MHz): 7.77 (s, 4H), 2.55 (s, 6H);
see Figure 2.22. 13
C NMR (CDCl3, 100 MHz): 152.61, 143.41, 128.04, 121.41, 21.04.
IR (KBr): 1540 (NO2), 1348 cm-1
(NO2).
Bis(2,6-diamino-4-methylphenyl) Disulfide·4HCl (14). Tin (II) chloride dihydrate (24 g)
was added slowly to a mixture of bis(2,6-dinitro-4-methylphenyl) disulfide (13, 1.31
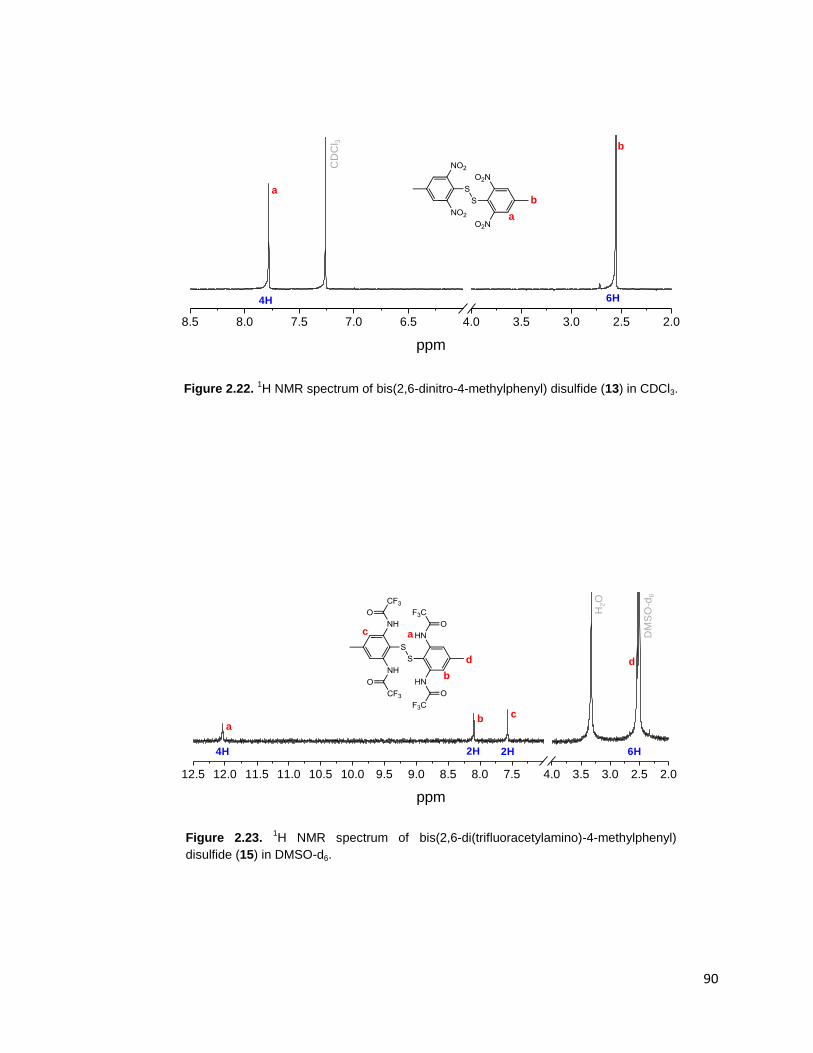
90
Figure 2.22. 1H NMR spectrum of bis(2,6-dinitro-4-methylphenyl) disulfide (13) in CDCl3.
Figure 2.23. 1H NMR spectrum of bis(2,6-di(trifluoracetylamino)-4-methylphenyl)
disulfide (15) in DMSO-d6.
8.5 8.0 7.5 7.0 6.5 4.0 3.5 3.0 2.5 2.0
ppmC
DC
l 3
4H
a
ab
b
6H
12.5 12.0 11.5 11.0 10.5 10.0 9.5 9.0 8.5 8.0 7.5 4.0 3.5 3.0 2.5 2.0
ppm
DM
SO
-d6
4H
a
a
b
b c
c
2H 6H2H
H2O
d d

91
g) in 40 mL concentrated hydrochloric acid. The reaction was allowed to stir 12
hours at which point and additional 5 g of tin(II) chloride dihydrate was added and
the reaction stirred and additional 12 hours. The white solid was filtered and dried
under reduced pressure for 12 hours, resulting in a quantitative yield. 1H NMR
(DMSO-d6, 400 MHz): 6.73 (s, 4H), 4.03 (br s, 12H), 2.16 (s, 6H). IR (KBr): 2914 cm-
1 (N-H).
Bis(2,6-di(trifluoracetylamino)-4-methylphenyl) Disulfide (15). Under inert
atmosphere, bis(2,6-diamino-4-methylphenyl) disulfide·4HCl (14, 1.45 g) was
dissolved in 50 mL dry CH2Cl2. Diisoprophylethylamine was added via syrine and the
reaction cooled to 0oC. Trifluoroacteic anhydride was added dropwise and the
reaction stirred at 0oC for 1 hour at which point the ice bath was removed and the
reaction stirred an additional 12 hours. After 12 hours, 50 mL H2O was added to
quench the reaction, CH2Cl2 removed via evaporation under reduced pressure, and
the residue was redissolved in ethyl acetate. The ethyl acetate was washed twice
with H2O, dried with sodium sulfate, and evaporated to dryness. Crude product was
chromatographed on silica with 100% ethyl acetate resulting in 0.68 g (33%) of white
solid. 1H NMR (DMSO-d6, 400 MHz): 12.02 (s, 4H), 8.08 (s, 2H), 7.55 (s, 2H), 2.49
(s, 6H); see Figure 2.23. 1H NMR (CDCl3, 400 MHz): 8.02 (s, 4H), 7.97 (s, 2H), 7.55
(s, 2H), 2.67 (s, 6H). 19
F NMR (CDCl3, 400MHz): -61.86 (s, 6H), -75.27 (s, 6H). IR
(KBr): 3261 (N-H), 1710 cm-1
(C=O).
The alternate hydrogen-bonded thiolate ligand where X = H was prepared using the
same synthetic procedure as X = CH3. Characterization of compounds 16-19 follows:
92
2,6-dinitrotosylbenzene (16). 1H NMR (CDCl3, 400 MHz): 8.16 (d, 2H), 7.77 (d, 2H),
7.61 (t, 1H), 7.40 (d, 2H), 2.50 (s, 3H).
2,6-dinitro-S-tritylbenzene (17). 1H NMR (DMSO-d6, 400 MHz): 7.92 (d, 2H), 7.80 (t,
1H), 7.24 (m, 9H), 7.07 (d, 6H).
2,6-dinitrothiophenol (18). 1H NMR (CDCl3, 400 MHz): 8.22 (d, 2H), 7.43 (t, 1H),
5.57 (s, 1H).
Bis(2,6-dinitrophenyl) Disulfide (19). 1H NMR (CDCl3, 400 MHz): 7.98 (d, 4H), 7.69
(t, 2H).
Physical Methods
FTIR spectra were obtained from KBr pellets on a Perkin-Elmer BX
spectrometer at room temperature. Resolution was set to 2 cm-1
. In situ IR
measurement were recorded using a Mettler Toledo ReactIR ic10. Proton magnetic
resonance spectra were recorded on a Varian Innova 400 MHz instrument.
Electronic absorbance spectra were measured using an Analytical Jena Specord
600 instrument at room temperature. In situ UV-visible measurements were taken
with a Hellma all-quartz immersion probe with 10 mm pathlength. Electron
paramagnetic resonance (EPR) spectra were recorded on a Bruker X-band EMX
spectrometer equipped with an Oxford Instruments liquid helium cryostat. EPR
spectra were typically obtained on frozen solutions using 20 mW microwave power
and 100 kHz field modulation with the amplitude set to 1 G. Sample concentrations
employed were ~2 mM. Cyclic voltammograms were recorded with a CH instruments
CHI660C electrochemical workstation using a three component system consisting of
a platinum working electrode, a platinum auxiliary electrode, and an Ag wire pseudo-
93
reference electrode. CVs were measured in 0.1 M tetrabutylammonium perchlorate
(TBAP) solutions in CH2Cl2. Potentials are reported against the measured Fc/Fc+
couple.
Crystal structure determination was carried out using a Bruker SMART APEX
CCD-based X-ray diffractometer equipped with a low temperature device and a fine
focus Mo-target X-ray tube (wavelength ) 0.71073 Å) operated at 1500 W power (50
kV, 30 mA). Measurements were taken at 85 K and the detector was placed 5.055
cm from the crystal. See Table 2.1 for crystallographic data and measurement
parameters. The data were processed with SADABS and corrected for absorption.59
The structure was solved and refined with the Bruker SHELXTL (vs. 2008/3)
software package.60-61
DFT Calculations
All geometry optimizations and frequency calculations were performed with
the program package Gaussian 0362
using the BP6863-64
functional and TZVP65-66
basis set. Molecular orbitals were obtained from BP86/TZVP single point
calculations using ORCA.67
In Gaussian calculations, convergence was reached
when the relative change in the density matrix between subsequent iterations was
less that 1 x 10⁻⁸
. Molecular orbitals were plotted with the program orca_plot included
in the ORCA package and visualized using GaussView. Force constants in internal
coordinates were extracted from the Gaussian output using a modified version of the
program Redong (QCPE 628).68-69
94
References
1. Moore, E. G.; Gibson, Q. H., J. Biol. Chem. 1976, 251, 2788-2794.
2. Laverman, L. E.; Ford, P. C., J. Am. Chem. Soc. 2001, 123, 11614-11622.
3. Scheele, J. S.; Bruner, E.; Kharitonov, V. G.; Martasek, P.; Roman, L. J.; Masters, B. S. S.; Sharma, V. S.; Magde, D., J. Biol. Chem. 1999, 274, 13105-13110.
4. Rose, E. J.; Hoffman, B. M., J. Am. Chem. Soc. 1983, 105, 2866-2873.
5. Abu-Soud, H. M.; Gachhui, R.; Raushel, F. M.; Stuehr, D. J., J. Biol. Chem. 1997, 272, 17349-17353.
6. Sharma, V. S.; Traylor, T. G.; Gardiner, R.; Mizukami, H., Biochemistry 1987, 26, 3837-3843.
7. Franke, A.; Stochel, G.; Jung, C.; Van Eldik, R., J. Am. Chem. Soc. 2004, 126, 4181-4191.
8. Hoshino, M.; Ozawa, K.; Seki, H.; Ford, P. C., J. Am. Chem. Soc. 1993, 115, 9568-9575.
9. Addison, A. W.; Stephanos, J. J., Biochemistry 1986, 25, 4104-4113.
10. Roncaroli, F.; Videla, M.; Slep, L. D.; Olabe, J. A., Coord. Chem. Rev. 2007, 251, 1903-1930.
11. Hoshino, M.; Maeda, M.; Konishi, R.; Seki, H.; Ford, P. C., J. Am. Chem. Soc. 1996, 118, 5702-5707.
12. Scheidt, W. R.; Lee, Y. J.; Hatano, K., J. Am. Chem. Soc. 1984, 106, 3191-3198.
13. Ellison, M. K.; Scheidt, W. R., J. Am. Chem. Soc. 1999, 121, 5210-5219.
14. Ellison, M. K.; Schulz, C. E.; Scheidt, W. R., J. Am. Chem. Soc. 2002, 124, 13833-13841.
15. Praneeth, V. K. K.; Paulat, F.; Berto, T. C.; DeBeer George, S.; Näther, C.; Sulok, C. D.; Lehnert, N., J. Am. Chem. Soc. 2008, 130, 15288-15303.
16. Yi, G.-B.; Chen, L.; Khan, M. A.; Richter-Addo, G. B., Inorg. Chem. 1997, 36, 3876-3885.
17. Lipscomb, L. A.; Lee, B.-S.; Yu, N.-T., Inorg. Chem. 1993, 32, 281-286.
18. Shimizu, H.; Park, S.-Y.; Gomi, Y.; Arakawa, H.; Nakamura, H.; Adachi, S.-I.; Obayashi, E.; Iizuka, T.; Shoun, H.; Shiro, Y., J. Biol. Chem. 2000, 275, 4816-4826.
95
19. Xu, N.; Powell, D. R.; Cheng, L.; Richter-Addo, G. B., Chem. Commun. 2006, 2030-2032.
20. Suzuki, N.; Higuchi, T.; Urano, Y.; Kikuchi, K.; Uchida, T.; Mukai, M.; Kitagawa, T.; Nagano, T., J. Am. Chem. Soc. 2000, 122, 12059-12060.
21. Koch, S.; Tang, S. C.; Holm, R. H.; Frankel, R. B.; Ibers, J. A., J. Am. Chem. Soc. 1975, 97, 916-918.
22. Schappacher, M.; Ricard, L.; Fischer, J.; Weiss, R.; Bill, E.; Montiel-Montoya, R.; Winkler, H.; Trautwein, A. X., Eur. J. Biochem. 1987, 168, 419-429.
23. Tang, S. C.; Koch, S.; Papaefthymiou, G. C.; Foner, S.; Frankel, R. B.; Ibers, J. A.; Holm, R. H., J. Am. Chem. Soc. 1976, 98, 2414-2434.
24. Bryn, M. P.; Strouse, C. E., J. Am. Chem. Soc. 1991, 113, 2501-2508.
25. Ueyama, N.; Nishikawa, N.; Yamada, Y.; Okamura, T.; Oka, S.; Sakurai, H.; Nakamura, A., Inorg. Chem. 1998, 37, 2415-2421.
26. Jentzen, W.; Ma, J.-G.; Shelnutt, J. A., Biophysical Journal 1998, 74, 753-763.
27. Jentzen, W.; Song, X.-Z.; Shelnutt, J. A., J. Phys. Chem. B 1997, 101, 1684-1699.
28. Walker, F. A., J. Inorg. Biochem. 2005, 99, 216-236.
29. Song, X. Z.; Jentzen, W.; Jaquinod, L.; Khoury, R. G.; Medforth, C. J.; Jia, S. L.; Ma, J. G.; Smith, K. M.; Shelnutt, J. A., Inorg. Chem. 1998, 37, 2117-2128.
30. Safo, M. K.; Walker, F. A.; Raitsimring, A. M.; Walters, W. P.; Dolata, D. P.; Debrunner, P. G.; Scheidt, W. R., J. Am. Chem. Soc. 1994, 116, 7760-7770.
31. Ueyama, N.; Nishikawa, N.; Yamada, Y.; Okamura, T.; Nakamura, A., Inorg. Chim. Acta 1998, 283, 91-97.
32. Ward, E. R.; Poesche, W. H.; Higgins, D.; Heard, D. D., J. Chem. Soc. 1962, 2374-2379.
33. Ward, E. R.; Heard, D. D., J. Chem. Soc. 1963, 1963, 4794-4803.
34. Ward, E. R.; Heard, D. D., J. Chem. Soc. 1965, 1023-1028.
35. Okamura, T.; Takamizawa, S.; Ueyama, N.; Nakamura, A., Inorg. Chem. 1998, 37, 18-28.
36. Chio, S.; Clements, D. J.; Pophristic, V.; Ivanov, I.; Vemparala, S.; Bennett, J. S.; Klein, M. L.; Winkler, J. D.; DeGrado, W. F., Angew. Chem. Int. Ed. 2005, 44, 6685-6689.
37. Reid, T. J.; Murthy, M. R. N.; Sicignano, A.; Tanaka, N.; Musick, W. D. L.; Rossmann, M. G., Proc. Natl. Acad. Sci. USA 1981, 78.
96
38. Murthy, M. R. N.; Reid, T. J.; Sicignano, A.; Tanaka, N.; Rossmann, M. G., J. Mol. Biol. 1981, 152, 465-499.
39. Holm, R. H.; Kennepohl, P.; Solomon, E. I., Chem. Rev. 1996, 96, 2239-2314.
40. Brown, G. C., Eur. J. Biochem. 1995, 232, 188-191.
41. Purwar, N.; McGarry, J. M.; Kostera, J.; Pacheco, A. A.; Schmidt, M., Biochemistry 2011, 50, 4491-4503.
42. Kanamori, D.; Yamada, Y.; Onoda, A.; Okamura, T.; Adachi, S.; Yamamoto, H.; Ueyama, N., Inorg. Chim. Acta 2005, 358, 331-338.
43. Lim, M. D.; Lorkovic, I. M.; Wedeking, K.; Zanella, A. W.; Works, C. F.; Massick, S. M.; Ford, P. C., J. Am. Chem. Soc. 2002, 124, 9737-9743.
44. Wade, R. S.; Castro, C. E., Chem. Res. Toxicol. 1990, 3, 289-291.
45. Paulat, F.; Lehnert, N., Inorg. Chem. 2007, 46, 1547-1549.
46. Xu, N.; Goodrich, L. E.; Lehnert, N.; Powell, D. R.; Richter-Addo, G. B., 2012, submitted for publication.
47. Goodrich, L. E.; Paulat, F.; Praneeth, V. K. K.; Lehnert, N., Inorg. Chem. 2010, 49, 6293-6316.
48. Adler, A. D.; Longo, F. R.; Finarelli, J. D.; Goldmacher, J.; Assour, J.; Korsakoff, L., J. Org. Chem. 1967, 32, 476.
49. Ghiladi, R. A.; Kretzer, R. M.; Guzei, I.; Rheingold, A. L.; Neuhold, Y.-M.; Hatwell, K. R.; Zuberbuhler, A. D.; Karlin, K. D., Inorg. Chem 2001, 40, 5754-5767.
50. Huang, L.; Chen, Y.; Gao, G.-Y.; Zhang, X. P., J. Org. Chem. 2003, 68, 8179-8184.
51. Barkigia, K. M.; Berber, M. D.; Fajer, J.; Medforth, C. J.; Renner, M. W.; Smith, K. M., J. Am. Chem. Soc. 1990, 112, 8851-8857.
52. Peters, M. V.; Stoll, R. S.; Goddard, R.; Buth, G.; Hecht, S., J. Org. Chem. 2006, 71, 7840-7845.
53. Rose, E.; Kossanyi, A.; Quelquejeu, M.; Soleilhavoup, M.; Duwavran, F.; Bernard, N.; Lecas, A., J. Am. Chem. Soc. 1996, 118, 1567-1568.
54. Kanamori, D.; Yamada, Y.; Onoda, A.; Okamura, T.; Adachi, S.; Yamamoto, H.; Ueyama, N., Inorganica Chimica Acta 2005, 358, 331-338.
55. Nambu, H.; Hata, K.; Matsugi, M.; Kita, Y., Chem. Eur. J. 2005, 11, 719-727.
56. Honel, M.; Mosher, H. S., J. Org. Chem. 1985, 50, 4386-4388.
57. Merz, A.; Meyer, T., Synthesis 1999, 94-99.
97
58. Merz, A.; Schropp, R.; Lex, J., Angew. Chem. Int. Ed. 1993, 32, 291-293.
59. Sheldrick, G. M. Program for Empirical Absorption Correction of Area Detector Data, v. 2008/1; University of Gottingen: Gottingen, Germany, 2008.
60. Sheldrick, G. M. v. 2008/3; Bruker Analytical X-ray: Madison, WI, 2008.
61. Saint Plus, v. 7.53a; Bruker Analytical X-Ray: Madison, WI, 2008.
62. Frisch, M. J.; Trucks, G. W.; Schlegel, H. B.; Scuseria, G. E.; Robb, M. A.; Cheeseman, J. R.; Montgomery, J., J. A.; Vreven, T.; Kudin, K. N.; Burant, J. C.; Millam, J. M.; Iyengar, S. S.; Tomasi, J.; Barone, V.; Mennucci, B.; Cossi, M.; Scalmani, G.; Rega, N.; Petersson, G. A.; Nakatsuji, H.; Hada, M.; Ehara, M.; Toyota, K.; Fukuda, R.; Hasegawa, J.; Ishida, M.; Nakajima, T.; Honda, Y.; Kitao, O.; Nakai, H.; Klene, M.; Li, X.; Knox, J. E.; Hratchian, H. P.; Cross, J. B.; Bakken, V.; Adamo, C.; Jaramillo, J.; Gomperts, R.; Stratmann, R. E.; Yazyev, O.; Ausin, A. J.; Cammi, R.; Pomelli, C.; Octerski, J. W.; Ayala, P. Y.; Morokuma, K.; Voth, G. A.; Salvador, P.; Dannenberg, J. J.; Zakrzewski, V. G.; Dapprich, S.; Daniels, A. D.; Strain, M. C.; Farkas, O.; Makick, D. K.; Rabuck, A. D.; Raghavachair, K.; Foresman, J. B.; Ortiz, J. V.; Cui, Q.; Baboul, A. G.; Clifford, S.; Cioslowski, J.; Stefanov, B. B.; Lui, G.; Laishenko, A.; Piskorz, R.; Komaromi, I.; Martin, R. L.; Fox, D. J.; Keith, T.; Al-Laham, M. A.; Peng, C. Y.; Nanayakkara, A.; Challacombe, M.; Gill, P. M. W.; Johnson, B.; Chen, W.; Wong, M. W.; Gonzalez, C.; Pople, J. A. Gaussin 03, Gaussian, Inc.: Pittsburgh, PA, 2003.
63. Perdew, J. P., Phys. Rev. B 1986, 33, 8822-8824.
64. Becke, A. D., Phys. Rev. A 1988, 38, 3098-3100.
65. Schaefer, A.; Horn, H.; Ahlrichs, R., J. Chem. Phys. 1992, 97, 2571-2577.
66. Schaefer, A.; Huber, C.; Ahlrichs, R., J. Chem. Phys. 1994, 100, 5829-5835.
67. Neese, F. ORCA, 2.2; Max-Planck Institut feur Bioanorganische Chemie: Meulheim/Ruhr, Germany, 2004.
68. Allouche, A.; Pourcin, J., Spectrochim. Acta 1993, 49, 571.
69. Praneeth, V. K. K.; Näther, C.; Peters, G.; Lehnert, N., Inorg. Chem. 2006, 45, 2795-2811.
98
Chapter 3
One-Electron Reduction of Five- and Six-Coordinate {FeNO}7 Porphyrin
Complexes: Exploring the Reactivity of Low-Spin {FeNO}8 Complexes and the
trans Effect of NO¯
Nitric oxide (NO) is toxic to cells at relatively low (μM) concentrations,1 and it
was therefore surprising when it was discovered in the 1980s that this diatomic is
actually a signaling molecule in mammals at nM concentrations. In addition,
macrophages produce NO at higher (local) concentration for the purpose of immune
defense.2-5
Due to its toxicity, both the biosynthesis of this molecule and its
degradation are tightly regulated in mammalian organisms to prevent cellular
damage. In denitrifying fungi that reduce nitrate to nitrous oxide (N2O) for anaerobic
respiration, the toxic metabolite NO is removed from the cell by the heme enzyme
Cytochrome P450 nitric oxide reductase (P450nor) which catalyzes the following
reaction:6-7
2 NO + NAD(P)H + 2 H+ → N2O + H2O. Unlike most Cyt. P450s which
perform oxidation chemistry, P450nor is one of the few enzymes in this class that
reduces its substrate. P450nor, a heme enzyme with a proximal cysteinate ligand,
reduces two equivalents of NO to N2O through an initially formed ferric nitrosyl
intermediate.8-9
In a two-electron process, the ferric nitrosyl is reduced by NAD(P)H
to form a ferrous nitroxyl (NO¯ or HNO in aqueous environments) intermediate,10
an
{FeNO}8 or {FeNHO}
8 complex in the Enemark-Feltham notation.
11 From stopped
flow measurements on P450nor, a corresponding intermediate is observed upon
99
reaction of the initial Fe(III)-NO adduct with NAD(P)H. This “Intermediate I” was
characterized by a Soret band absorbtion at 444 nm10
and Fe-NO stretching
frequency at 543 cm-1
.12
Reaction with a second equivalent of NO then produces
N2O and closes the catalytic cycle.
DFT and QM/MM calculations13-14
indicate that following a direct hydride
transfer from NAD(P)H to the ferric nitrosyl complex, an Fe(II)-HNO complex is
generated that could either react directly with NO, or that could undergo protonation
to a formally Fe(IV)-NHOH/Fe(III)-NHOH(radical) structure prior to reaction with the
second equivalent of NO—ultimately releasing N2O and H2O. Calculations predict
that the Fe(II)-HNO species is basic due to the presence of the axial cysteinate
ligand and, thus, will be easily protonated.13-14
However, whether this step is
mechanistically significant is not known. So despite all of these studies, the key
question remains whether the nitroxyl intermediate of P450nor (Intermediate I) is
singly or doubly protonated and what the significance of the protonation state is for
the reactivity of this species with NO. In addition, little is known about the
fundamental properties and reactivites of Fe(II)-nitroxyl complexes in general,
making it difficult to evaluate the proposed mechanism based on the chemical
properties of these species. Without ferrous heme-nitroxyl model complexes in hand,
this is difficult to ascertain for the protein due to our inability to precisely control
protons, and proton dependent reactions, in protein (aqueous) environments.
Ferrous nitroxyl intermediates have also been proposed in the catalytic cycle
of bacterial nitric oxide reductases (NorBC). NorBC, like P450nor, reduces 2
equivalents of NO to N2O, but instead of a single heme active site as found in
P450nor, NorBC contains a bi-metallic heme/non-heme active site.15
While the exact
mechanism of NO reduction by NorBC is not known, one proposal (the “cis-heme b3”
100
mechanism) suggests that all of the NO chemistry happens exclusively at the heme
b3 site.16
The cis-heme b3 mechanism proposes that NO first binds the heme b3 to
form a ferrous heme-nitrosyl. A recent DFT paper indicates that reduction of this
species to generate an {FeNO}8 complex is crucial for the following reaction with NO
to form the N-N bond and create a hyponitrite-level intermediate.17
As there is
currently no experimental evidence to support the key N-N bond forming step of this
hypothesis, elucidation of the reaction of free NO with Fe(II)-NO¯ complexes is of key
importance to further validate the chemical basis for this mechanism.
Two main approaches have been employed in the literature to generate
ferrous heme-nitroxyl model complexes. First, free HNO can be reacted directly with
a ferrous heme through the use of HNO donors such as Piloty’s acid or
methylsulfonylhydroxylamic acid.18
This method has, to our knowledge, only been
employed successfully in globin proteins by Farmer and co-workers.19-20
These
researchers first reported a long-lived six-coordinate ferrous Mb(II)-HNO complex
with proximal histidine ligation, which has been characterized by resonance Raman,
X-ray absorption,21
and 1H NMR spectroscopy.
22 An alternative route to generate
Fe(II)-nitroxyl complexes is to start from a stable ferrous heme-nitrosyl adduct
{FeNO}7. The {FeNO}
7 species can then be reduced by one-electron to a {FeNO}
8
species or ferrous nitroxyl complex, which can subsequently be protonated. Initial
studies by Kadish and co-workers demonstrated reversible one-electron reduction of
five-coordinate ferrous heme-nitrosyls, utilizing TPP2-
and OEP2-
ligands, to generate
Fe(II)-NO¯ species as shown by UV-visible spectroelectrochemistry.23-24
Ryan and
co-workers provided further vibrational characterization of both [Fe(TPP)(NO)]¯ and
[Fe(OEP)(NO)]¯.25-26
Finally, using an extremely electron withdrawing porphyrin,
H2TFPPBr8, Doctorovich and co-workers have isolated and characterized the
101
corresponding five-coordinate Fe(II)-NO¯ complex, obtained by reduction of the
Fe(II)-NO starting material by cobaltocene.27
Unfortunately, all attempts at
protonation of the formed Fe(II)-NO¯ species to form a Fe(II)-HNO complex have
resulted in generation of the corresponding Fe(II)-NO complex, presumably via
disproportionation of an intermediately formed HNO adduct.25, 27
Ryan and co-
workers also reported H2 generation during this process.25
No other details about the
reactivity of these species are known. Additionally, all {FeNO}8 model complexes
reported thus far are five-coordinate and hence, not ideal models for the coordination
environment found in proteins. As such, the effect of a sixth ligand like histidine or
cysteine on the properties of ferrous heme-nitroxyl complexes has yet to be explored
experimentally.
In this study, we report the vibrational and electronic structural properties of
four new {FeNO}8 porphyrin complexes prepared through the one-electron reduction
of the corresponding {FeNO}7 precursors. The formed {FeNO}
8 species have been
investigated for (1) reactivity towards weak acids and NO, and (2) the effect of an
axially coordinated N-donor ligand. To prevent disproportionation of the putative
HNO adduct and model the steric protection of a protein environment, we have
employed the sterically encumbered bis-picket fence porphyrin 5,10,15,20-
tetrakis(2,6-bis(2-methoxyphenoxy)phenyl)porphyrin, H2[3,5-Me-BAFP]. Here, the
large phenoxy pickets provide a binding pocket for NO¯/HNO. In particular, we are
exploring for the first time the reaction of {FeNO}8 species with NO, and the effects of
axial N-donor ligands on ferrous heme-nitroxyl complexes.
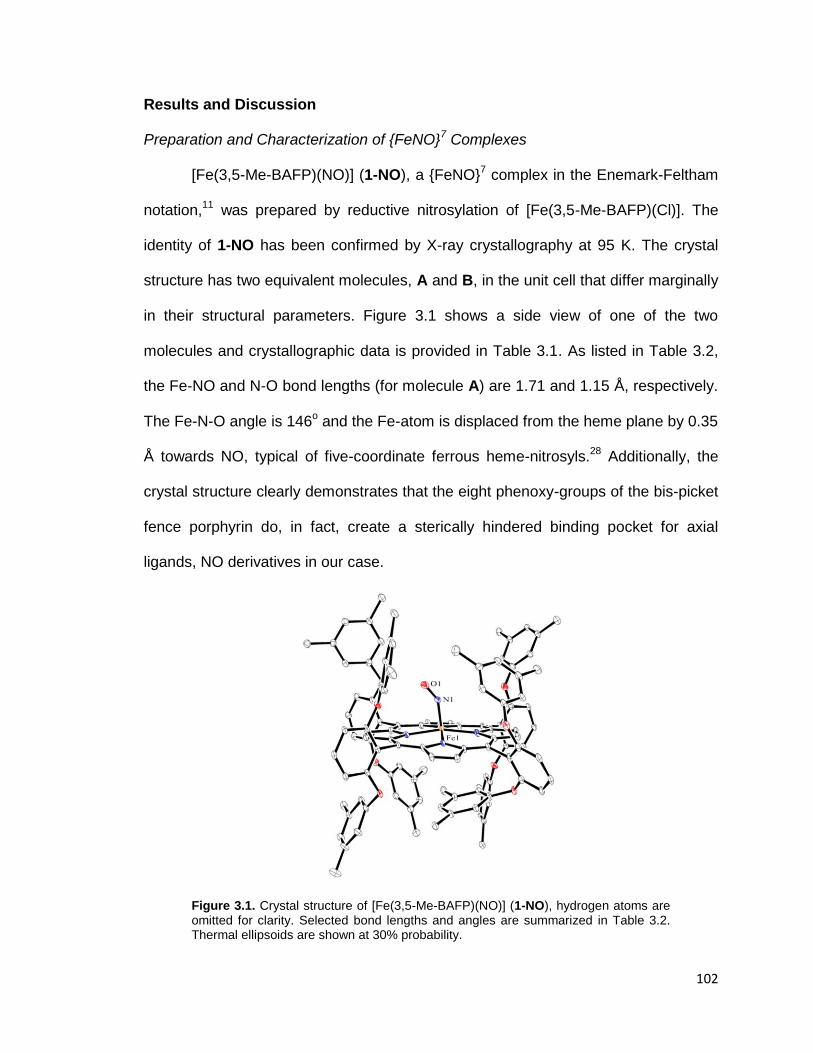
102
Results and Discussion
Preparation and Characterization of {FeNO}7 Complexes
[Fe(3,5-Me-BAFP)(NO)] (1-NO), a {FeNO}7 complex in the Enemark-Feltham
notation,11
was prepared by reductive nitrosylation of [Fe(3,5-Me-BAFP)(Cl)]. The
identity of 1-NO has been confirmed by X-ray crystallography at 95 K. The crystal
structure has two equivalent molecules, A and B, in the unit cell that differ marginally
in their structural parameters. Figure 3.1 shows a side view of one of the two
molecules and crystallographic data is provided in Table 3.1. As listed in Table 3.2,
the Fe-NO and N-O bond lengths (for molecule A) are 1.71 and 1.15 Å, respectively.
The Fe-N-O angle is 146o and the Fe-atom is displaced from the heme plane by 0.35
Å towards NO, typical of five-coordinate ferrous heme-nitrosyls.28
Additionally, the
crystal structure clearly demonstrates that the eight phenoxy-groups of the bis-picket
fence porphyrin do, in fact, create a sterically hindered binding pocket for axial
ligands, NO derivatives in our case.
Figure 3.1. Crystal structure of [Fe(3,5-Me-BAFP)(NO)] (1-NO), hydrogen atoms are omitted for clarity. Selected bond lengths and angles are summarized in Table 3.2. Thermal ellipsoids are shown at 30% probability.
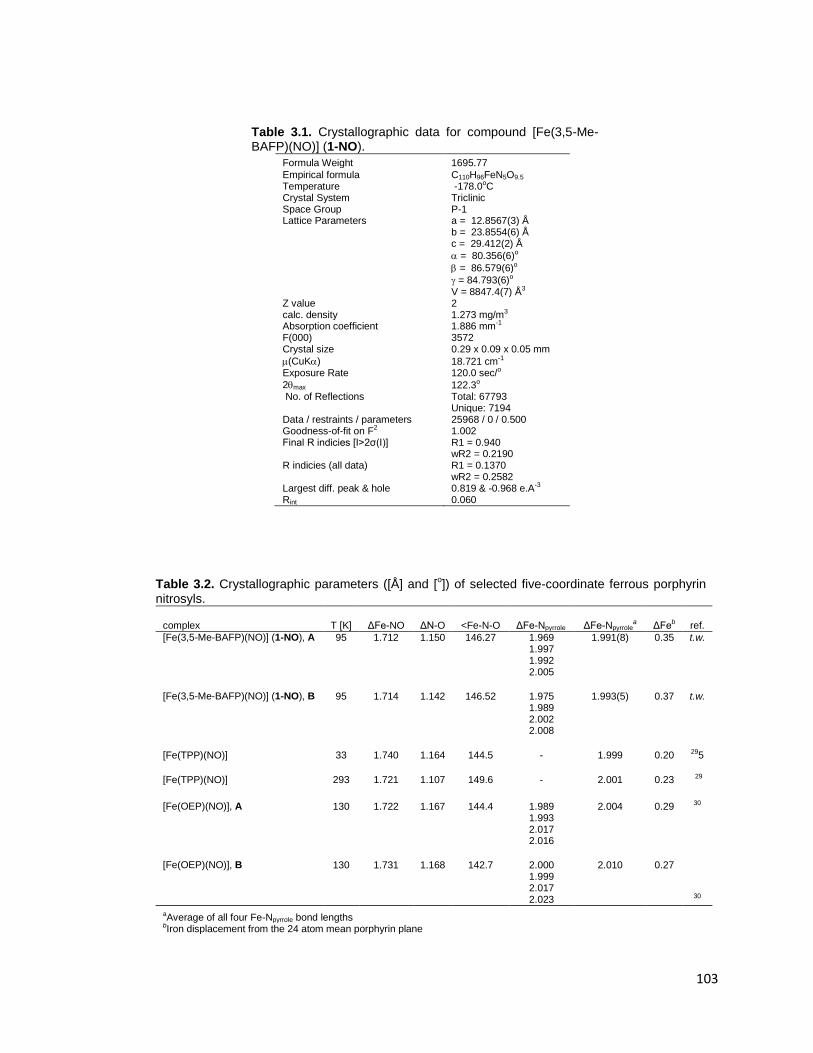
103
Table 3.1. Crystallographic data for compound [Fe(3,5-Me-BAFP)(NO)] (1-NO).
Formula Weight 1695.77
Empirical formula C110H96FeN5O9.5 Temperature -178.0oC Crystal System Triclinic Space Group P-1 Lattice Parameters a = 12.8567(3) Å
b = 23.8554(6) Å
c = 29.412(2) Å
= 80.356(6)o
= 86.579(6)o
= 84.793(6)o
V = 8847.4(7) Å3
Z value 2 calc. density 1.273 mg/m3 Absorption coefficient 1.886 mm-1 F(000) 3572 Crystal size 0.29 x 0.09 x 0.05 mm
(CuK) 18.721 cm-1 Exposure Rate 120.0 sec/o
2max 122.3o No. of Reflections Total: 67793
Unique: 7194
Data / restraints / parameters 25968 / 0 / 0.500 Goodness-of-fit on F2 1.002 Final R indicies [I>2σ(I)]
R1 = 0.940 wR2 = 0.2190
R indicies (all data)
R1 = 0.1370 wR2 = 0.2582
Largest diff. peak & hole 0.819 & -0.968 e.A-3 Rint 0.060
Table 3.2. Crystallographic parameters ([Å] and [o]) of selected five-coordinate ferrous porphyrin
nitrosyls.
complex T [K] ΔFe-NO ΔN-O <Fe-N-O ΔFe-Npyrrole ΔFe-Npyrrolea ΔFeb ref.
[Fe(3,5-Me-BAFP)(NO)] (1-NO), A
95
1.712
1.150
146.27
1.969 1.997 1.992 2.005
1.991(8)
0.35
t.w.
[Fe(3,5-Me-BAFP)(NO)] (1-NO), B
95
1.714
1.142
146.52
1.975 1.989 2.002 2.008
1.993(5)
0.37
t.w.
[Fe(TPP)(NO)] 33 1.740 1.164 144.5 - 1.999 0.20 295
[Fe(TPP)(NO)] 293 1.721 1.107 149.6 - 2.001 0.23 29
[Fe(OEP)(NO)], A
130
1.722
1.167
144.4
1.989 1.993 2.017 2.016
2.004
0.29
30
[Fe(OEP)(NO)], B
130
1.731
1.168
142.7
2.000 1.999 2.017 2.023
2.010
0.27 30
aAverage of all four Fe-Npyrrole bond lengths
bIron displacement from the 24 atom mean porphyrin plane
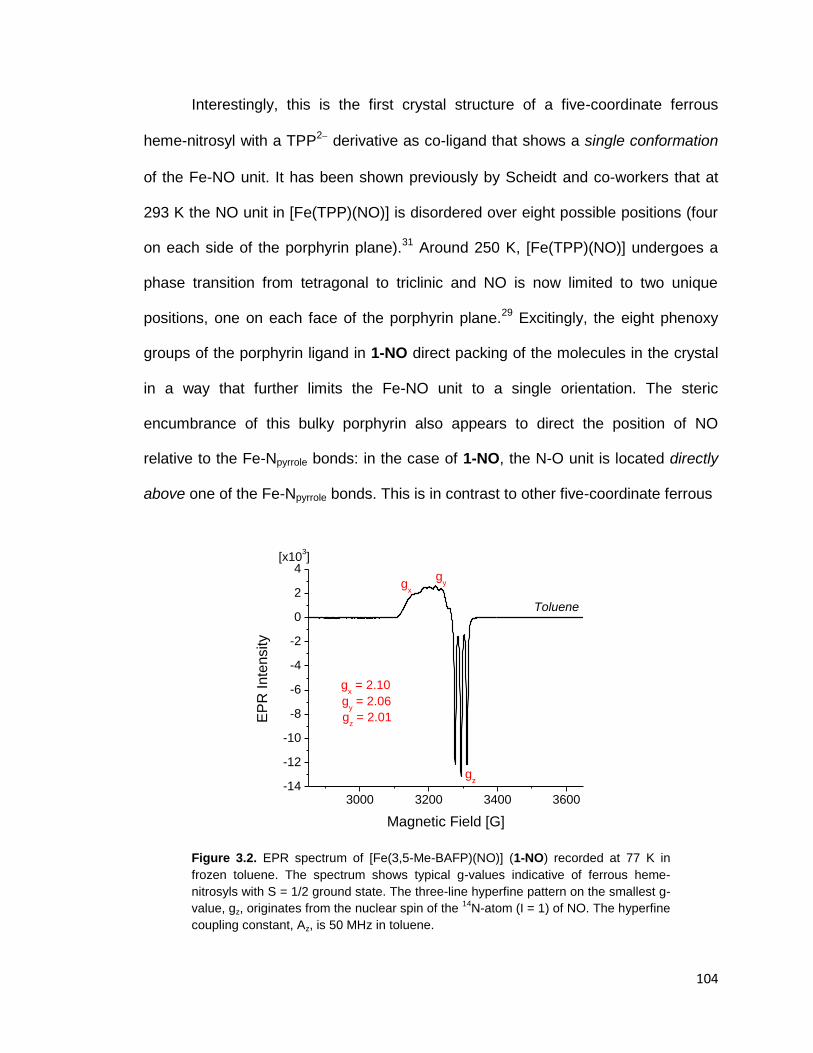
104
Interestingly, this is the first crystal structure of a five-coordinate ferrous
heme-nitrosyl with a TPP2 derivative as co-ligand that shows a single conformation
of the Fe-NO unit. It has been shown previously by Scheidt and co-workers that at
293 K the NO unit in [Fe(TPP)(NO)] is disordered over eight possible positions (four
on each side of the porphyrin plane).31
Around 250 K, [Fe(TPP)(NO)] undergoes a
phase transition from tetragonal to triclinic and NO is now limited to two unique
positions, one on each face of the porphyrin plane.29
Excitingly, the eight phenoxy
groups of the porphyrin ligand in 1-NO direct packing of the molecules in the crystal
in a way that further limits the Fe-NO unit to a single orientation. The steric
encumbrance of this bulky porphyrin also appears to direct the position of NO
relative to the Fe-Npyrrole bonds: in the case of 1-NO, the N-O unit is located directly
above one of the Fe-Npyrrole bonds. This is in contrast to other five-coordinate ferrous
Figure 3.2. EPR spectrum of [Fe(3,5-Me-BAFP)(NO)] (1-NO) recorded at 77 K in
frozen toluene. The spectrum shows typical g-values indicative of ferrous heme-
nitrosyls with S = 1/2 ground state. The three-line hyperfine pattern on the smallest g-
value, gz, originates from the nuclear spin of the 14
N-atom (I = 1) of NO. The hyperfine
coupling constant, Az, is 50 MHz in toluene.
3000 3200 3400 3600-14
-12
-10
-8
-6
-4
-2
0
2
4g
y
gz
gx = 2.10
gz = 2.01
gy = 2.06
EP
R I
nte
nsity
Magnetic Field [G]
[x103]
gx
Toluene

105
heme-nitrosyls where the O-atom is positioned towards a meso-carbon; for example,
in [Fe(TPP)(NO)] the N-O unit is rotated 44o from the closest Fe-Npyrrole bond.
29 This
difference results in a unique core asymmetry in 1-NO. In this complex, the Fe-Npyrrole
bond which is aligned with the N-O unit (1.969 Å) is significantly shorter than the
remaining three bonds (1.997, 1.992, and 2.005 Å). Typically, when the N-O unit
points toward a meso-carbon of the porphyrin ligand two Fe-Npyrrole bonds are shorter
(in the direction of NO) than the remaining two bonds.32
In the case of
[Fe(OEP)(NO)], the short Fe-Npyrrole bond lengths are 1.989 and 1.993 Å and the
long bonds are 2.017 and 2.016 Å.30
The {FeNO}7 complex 1-NO shows an EPR spectrum typical of a S = 1/2 five-
coordinate ferrous heme-nitrosyl with g-values of 2.10, 2.06, and 2.01 in toluene
(see Figure 3.2). A well defined 3-line hyperfine pattern is observed on the smallest
g-value, gz from the 14
N nuclear spin (I = 1) of bound NO. In THF, however, the
Figure 3.3. Vibrational density of states (VDOS) for [57
Fe(3,5-Me-BAFP)(NO)] (1-NO, red) and [
57Fe(3,5-Me-BAFP)(
15N
18O)] (1-
15N
18O, black) calculated from raw nuclear
resonance vibrational spectroscopy (NRVS) data.
100 200 300 400 500 600 700
0
50
100
150
200
250
VD
OS
energy [cm-1]
[Fe(3,5-Me-BAFP)(NO)] (1-NO)
[Fe(3,5-Me-BAFP)(15
N18
O)] (1-15
N18
O)
502
518
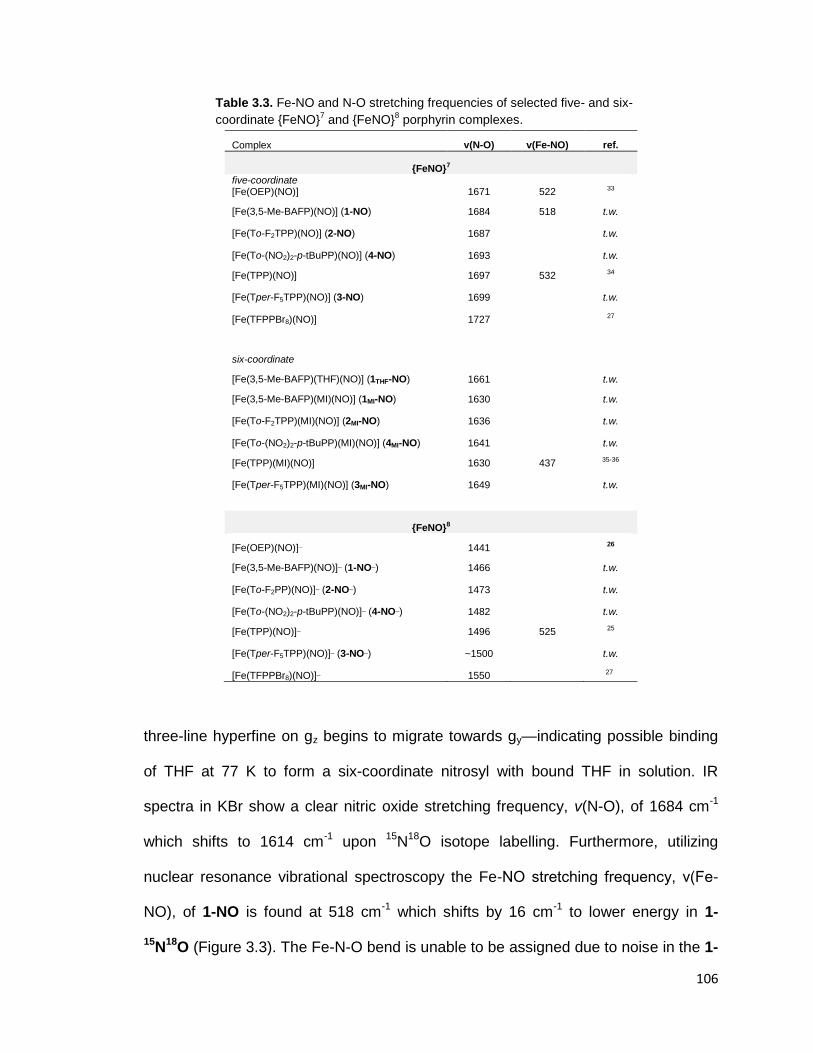
106
Table 3.3. Fe-NO and N-O stretching frequencies of selected five- and six-
coordinate {FeNO}7 and {FeNO}
8 porphyrin complexes.
three-line hyperfine on gz begins to migrate towards gy—indicating possible binding
of THF at 77 K to form a six-coordinate nitrosyl with bound THF in solution. IR
spectra in KBr show a clear nitric oxide stretching frequency, v(N-O), of 1684 cm-1
which shifts to 1614 cm-1
upon 15
N18
O isotope labelling. Furthermore, utilizing
nuclear resonance vibrational spectroscopy the Fe-NO stretching frequency, ν(Fe-
NO), of 1-NO is found at 518 cm-1
which shifts by 16 cm-1
to lower energy in 1-
15N
18O (Figure 3.3). The Fe-N-O bend is unable to be assigned due to noise in the 1-
Complex v(N-O) v(Fe-NO) ref.
{FeNO}7 five-coordinate
[Fe(OEP)(NO)] 1671 522 33
[Fe(3,5-Me-BAFP)(NO)] (1-NO) 1684 518 t.w.
[Fe(To-F2TPP)(NO)] (2-NO) 1687
t.w.
[Fe(To-(NO2)2-p-tBuPP)(NO)] (4-NO) 1693
t.w.
[Fe(TPP)(NO)] 1697 532 34
[Fe(Tper-F5TPP)(NO)] (3-NO) 1699
t.w.
[Fe(TFPPBr8)(NO)] 1727
27
six-coordinate
[Fe(3,5-Me-BAFP)(THF)(NO)] (1THF-NO) 1661
t.w.
[Fe(3,5-Me-BAFP)(MI)(NO)] (1MI-NO) 1630
t.w.
[Fe(To-F2TPP)(MI)(NO)] (2MI-NO) 1636
t.w.
[Fe(To-(NO2)2-p-tBuPP)(MI)(NO)] (4MI-NO) 1641
t.w.
[Fe(TPP)(MI)(NO)] 1630 437 35-36
[Fe(Tper-F5TPP)(MI)(NO)] (3MI-NO) 1649
t.w.
{FeNO}8
[Fe(OEP)(NO)]¯ 1441
26
[Fe(3,5-Me-BAFP)(NO)]¯ (1-NO¯) 1466
t.w.
[Fe(To-F2PP)(NO)]¯ (2-NO¯) 1473
t.w.
[Fe(To-(NO2)2-p-tBuPP)(NO)]¯ (4-NO¯) 1482
t.w.
[Fe(TPP)(NO)]¯ 1496 525 25
[Fe(Tper-F5TPP)(NO)]¯ (3-NO¯) ~1500
t.w.
[Fe(TFPPBr8)(NO)]¯ 1550 27
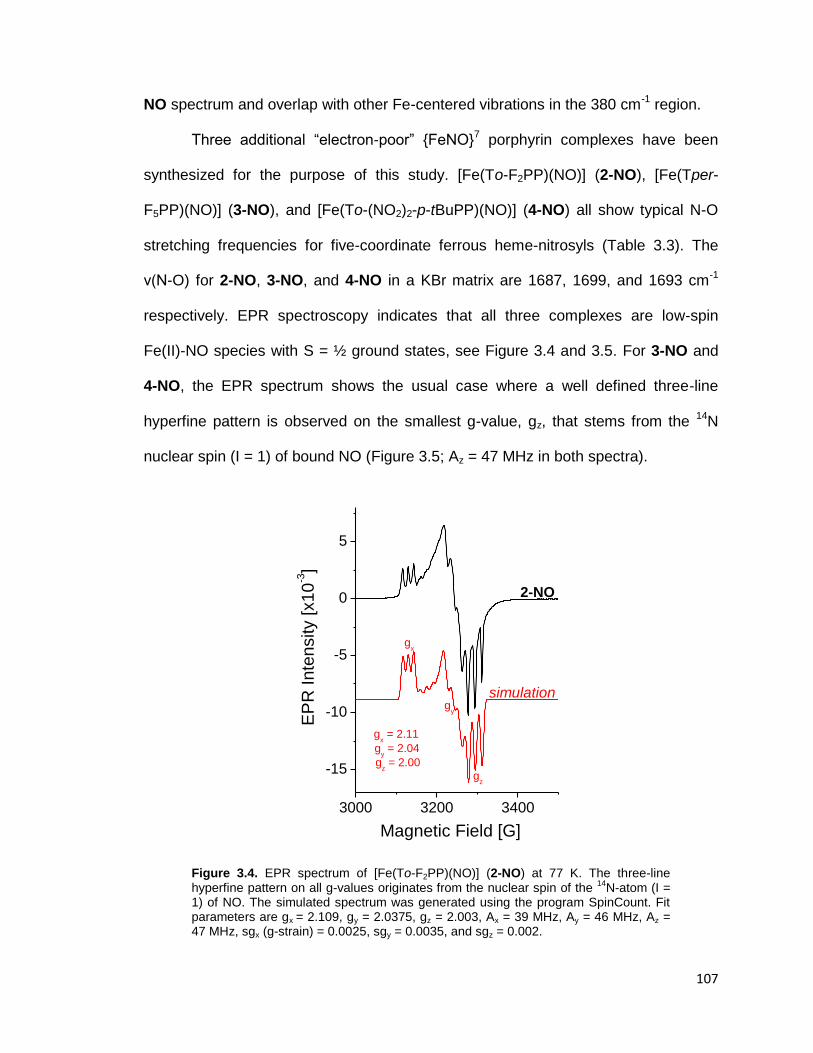
107
NO spectrum and overlap with other Fe-centered vibrations in the 380 cm-1
region.
Three additional “electron-poor” {FeNO}7 porphyrin complexes have been
synthesized for the purpose of this study. [Fe(To-F2PP)(NO)] (2-NO), [Fe(Tper-
F5PP)(NO)] (3-NO), and [Fe(To-(NO2)2-p-tBuPP)(NO)] (4-NO) all show typical N-O
stretching frequencies for five-coordinate ferrous heme-nitrosyls (Table 3.3). The
ν(N-O) for 2-NO, 3-NO, and 4-NO in a KBr matrix are 1687, 1699, and 1693 cm-1
respectively. EPR spectroscopy indicates that all three complexes are low-spin
Fe(II)-NO species with S = ½ ground states, see Figure 3.4 and 3.5. For 3-NO and
4-NO, the EPR spectrum shows the usual case where a well defined three-line
hyperfine pattern is observed on the smallest g-value, gz, that stems from the 14
N
nuclear spin (I = 1) of bound NO (Figure 3.5; Az = 47 MHz in both spectra).
Figure 3.4. EPR spectrum of [Fe(To-F2PP)(NO)] (2-NO) at 77 K. The three-line hyperfine pattern on all g-values originates from the nuclear spin of the
14N-atom (I =
1) of NO. The simulated spectrum was generated using the program SpinCount. Fit parameters are gx = 2.109, gy = 2.0375, gz = 2.003, Ax = 39 MHz, Ay = 46 MHz, Az = 47 MHz, sgx (g-strain) = 0.0025, sgy = 0.0035, and sgz = 0.002.
3000 3200 3400
-15
-10
-5
0
5
Magnetic Field [G]
EP
R I
nte
nsity [
x1
0-3]
simulation
2-NO
gz
gx = 2.11
gz = 2.00
gy = 2.04
gy
gx
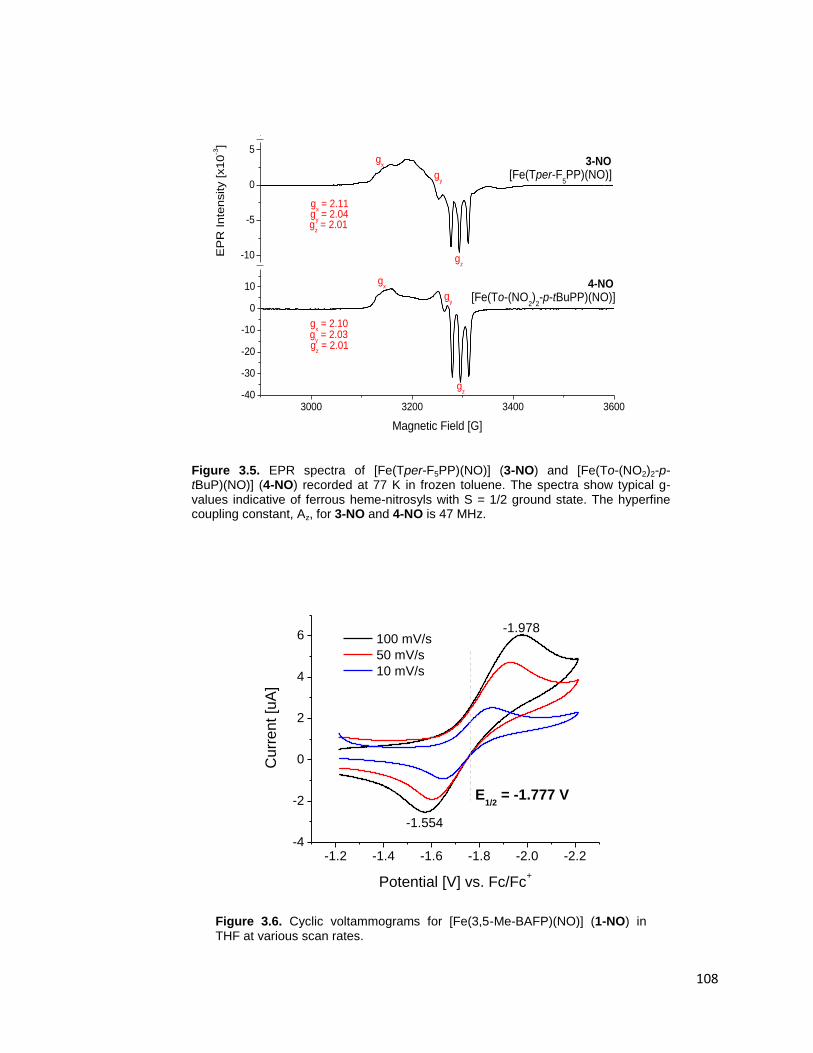
108
Figure 3.5. EPR spectra of [Fe(Tper-F5PP)(NO)] (3-NO) and [Fe(To-(NO2)2-p-tBuP)(NO)] (4-NO) recorded at 77 K in frozen toluene. The spectra show typical g-values indicative of ferrous heme-nitrosyls with S = 1/2 ground state. The hyperfine coupling constant, Az, for 3-NO and 4-NO is 47 MHz.
Figure 3.6. Cyclic voltammograms for [Fe(3,5-Me-BAFP)(NO)] (1-NO) in THF at various scan rates.
-1.2 -1.4 -1.6 -1.8 -2.0 -2.2-4
-2
0
2
4
6
-1.554
E1/2
= -1.777 V
100 mV/s
50 mV/s
10 mV/s
Curr
ent [u
A]
Potential [V] vs. Fc/Fc+
-1.978
3000 3200 3400 3600-40
-30
-20
-10
0
10
-10
-5
0
5
-10
-5
0
5
Magnetic Field [G]
[Fe(To-(NO2)
2-p-tBuPP)(NO)]
gx = 2.10
gz = 2.01
gy = 2.03
gy
gx 4-NO
gz
EP
R Inte
nsity [x10
-3]
gz
[Fe(Tper-F5PP)(NO)]
gx = 2.11
gz = 2.01
gy = 2.04
gy
gx 3-NO
gz
[Fe(To-F2PP)(NO)]
gx = 2.11
gz = 2.00
gy = 2.04
gy
gx 2-NO
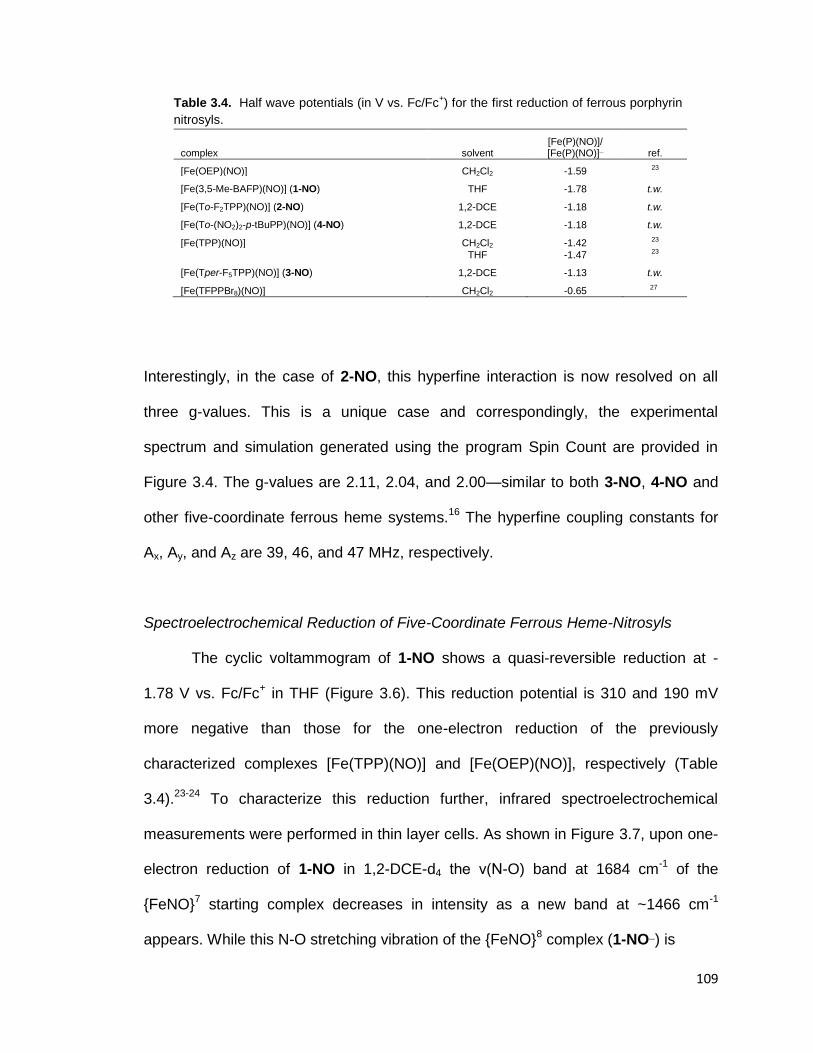
109
Table 3.4. Half wave potentials (in V vs. Fc/Fc+) for the first reduction of ferrous porphyrin
nitrosyls.
complex solvent [Fe(P)(NO)]/ [Fe(P)(NO)]¯ ref.
[Fe(OEP)(NO)] CH2Cl2 -1.59 23
[Fe(3,5-Me-BAFP)(NO)] (1-NO) THF -1.78 t.w.
[Fe(To-F2TPP)(NO)] (2-NO) 1,2-DCE -1.18 t.w.
[Fe(To-(NO2)2-p-tBuPP)(NO)] (4-NO) 1,2-DCE -1.18 t.w.
[Fe(TPP)(NO)] CH2Cl2 -1.42 23
THF -1.47 23
[Fe(Tper-F5TPP)(NO)] (3-NO) 1,2-DCE -1.13 t.w.
[Fe(TFPPBr8)(NO)] CH2Cl2 -0.65 27
Interestingly, in the case of 2-NO, this hyperfine interaction is now resolved on all
three g-values. This is a unique case and correspondingly, the experimental
spectrum and simulation generated using the program Spin Count are provided in
Figure 3.4. The g-values are 2.11, 2.04, and 2.00—similar to both 3-NO, 4-NO and
other five-coordinate ferrous heme systems.16
The hyperfine coupling constants for
Ax, Ay, and Az are 39, 46, and 47 MHz, respectively.
Spectroelectrochemical Reduction of Five-Coordinate Ferrous Heme-Nitrosyls
The cyclic voltammogram of 1-NO shows a quasi-reversible reduction at -
1.78 V vs. Fc/Fc+ in THF (Figure 3.6). This reduction potential is 310 and 190 mV
more negative than those for the one-electron reduction of the previously
characterized complexes [Fe(TPP)(NO)] and [Fe(OEP)(NO)], respectively (Table
3.4).23-24
To characterize this reduction further, infrared spectroelectrochemical
measurements were performed in thin layer cells. As shown in Figure 3.7, upon one-
electron reduction of 1-NO in 1,2-DCE-d4 the ν(N-O) band at 1684 cm-1
of the
{FeNO}7 starting complex decreases in intensity as a new band at ~1466 cm
-1
appears. While this N-O stretching vibration of the {FeNO}8 complex (1-NO¯) is

110
Figure 3.7. Infrared spectra from the spectroelectrochemical reduction of [Fe(3,5-Me-BAFP)(NO)] (top, 1-NO) and [Fe(3,5-Me-BAFP)(
15N
18O)] (middle, 1-
15N
18O) in 1,2-
DCE-d4. The asterisk (*) indicates poor subtraction of a porphyrin band at 1450 cm-1
. The estimated isotope shift (by DFT) of the N-O stretch in the NO¯ complex is 61 cm
-
1, indicating that the 1450 cm
-1 feature in the reduced compound is too high in energy
to be the v(15
N-18
O) stretch.
partially masked by a porphyrin ligand band, 15
N18
O labelling shifts this band into an
open window of the IR spectrum at ~1400 cm-1
. Importantly, this reduction is
completely reversible: upon re-oxidation, complex 1-NO is regenerated. Natural
abundance NO and 15
N18
O difference spectra for 1-NO¯ is provided in Figure 3.7, to
further confirm the assignment of the N-O stretching frequency of 1-NO¯.
As listed in Table 3.3, the ν(N-O) frequency of 1-NO¯ is consistent with
previously reported values for five-coordinate {FeNO}8 porphyrin systems, where
ν(N-O) is observed between 1440 – 1550 cm-1
. In contrast, low-spin non-heme iron
0.0
0.2
0.0
0.2
1800 1700 1600 1500 1400 1300 1200
-0.03
0.00
0.03 {FeNO}8
14
66
1466
1684
1-15
N18
O
1-NO
NO - 15
N18
O
A
bs.
1400
wavenumber [cm-1]
Abs.
14
00
1614
*
111
nitrosyls typically show significantly lower N-O stretching frequencies (~1300 cm-1
).
This suggests a strongly NO ligand-centered reduction for the low-spin non-heme
NO adducts and a more metal based reduction for the heme systems. Previous DFT
calculations from our group have shown that for the heme complexes this
corresponds to an electronic structure that is intermediate between low-spin Fe(II)-
NO¯ ↔ Fe(I)NO·.13
UV-visible spectroelectrochemical measurements in an OTTLE cell were
used to further characterize the one electron reduced complex 1-NO¯ as shown in
Figure 3.8. As the potential is swept reductively from -0.4 V to -1.8 V vs. Ag wire at
10 mV/sec, there is essentially no change in the Soret band at 413 nm when 1,2-
DCE is used as solvent, but dramatic changes are observed in the Q-band region
(see Figure 3.8, top). The band at 478 nm decreases in intensity while a new band
appears at 523 nm upon reduction. The clean isosbestic point at 504 nm is indicative
of a clean conversion from 1-NO to 1-NO¯ without further intermediates. The spectral
changes observed for the reduction of 1-NO are in agreement with the reduction of
[Fe(TPP)(NO)] reported previously.25
Importantly, this does not correspond to a
reduction of the porphyrin ligand, as this is accompanied by a dramatic loss of
intensity of the Soret band not observed here. As an illustration of a porphyrin-
centered reduction the spectroelectrochemical reduction of [Fe(3,5-Me-BAFP)] in
THF is provided in Figure 3.9. For 1-NO, this porphyrin reduction (corresponding to a
two-electron reduction) is not accessible in 1,2-DCE.
Upon dissolving 1-NO in THF, the Soret band shifts by 9 nm from 413 to 422
nm—indicating coordination of THF to the iron center in this system. Solution IR
spectra support formation of [Fe(3,5-Me-BAFP)(NO)(THF)] with a new ν(N-O) band
at 1661 cm-1
. Additionally, the EPR spectrum of 1-NO in THF indicates weak binding
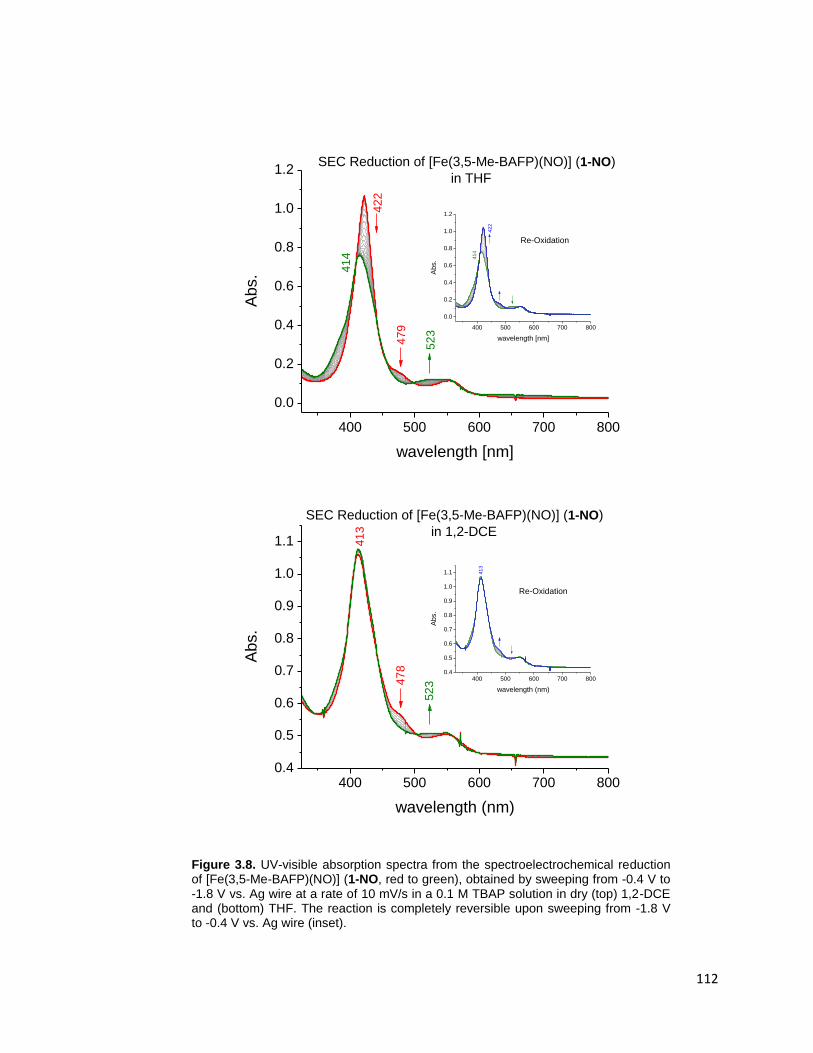
112
Figure 3.8. UV-visible absorption spectra from the spectroelectrochemical reduction of [Fe(3,5-Me-BAFP)(NO)] (1-NO, red to green), obtained by sweeping from -0.4 V to -1.8 V vs. Ag wire at a rate of 10 mV/s in a 0.1 M TBAP solution in dry (top) 1,2-DCE and (bottom) THF. The reaction is completely reversible upon sweeping from -1.8 V to -0.4 V vs. Ag wire (inset).
400 500 600 700 800
0.0
0.2
0.4
0.6
0.8
1.0
1.2
52
3
42
2
400 500 600 700 800
0.0
0.2
0.4
0.6
0.8
1.0
1.2
Abs.
wavelength [nm]
42
2
41
4
Re-Oxidation
Abs.
wavelength [nm]
47
9
41
4
SEC Reduction of [Fe(3,5-Me-BAFP)(NO)] (1-NO)
in THF
400 500 600 700 8000.4
0.5
0.6
0.7
0.8
0.9
1.0
1.1
52
347
8
400 500 600 700 8000.4
0.5
0.6
0.7
0.8
0.9
1.0
1.1
Abs.
wavelength (nm)
Re-Oxidation
41
3
SEC Reduction of [Fe(3,5-Me-BAFP)(NO)] (1-NO)
in 1,2-DCE
Ab
s.
wavelength (nm)
41
3
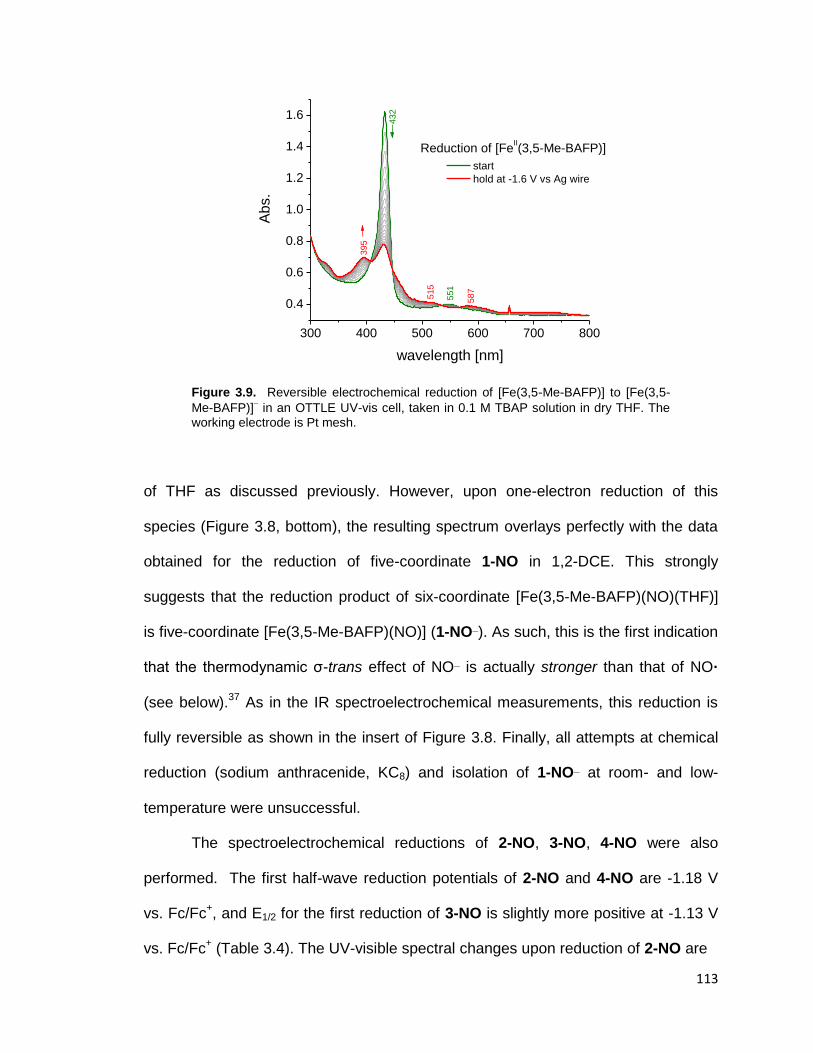
113
Figure 3.9. Reversible electrochemical reduction of [Fe(3,5-Me-BAFP)] to [Fe(3,5-
Me-BAFP)] in an OTTLE UV-vis cell, taken in 0.1 M TBAP solution in dry THF. The
working electrode is Pt mesh.
of THF as discussed previously. However, upon one-electron reduction of this
species (Figure 3.8, bottom), the resulting spectrum overlays perfectly with the data
obtained for the reduction of five-coordinate 1-NO in 1,2-DCE. This strongly
suggests that the reduction product of six-coordinate [Fe(3,5-Me-BAFP)(NO)(THF)]
is five-coordinate [Fe(3,5-Me-BAFP)(NO)] (1-NO¯). As such, this is the first indication
that the thermodynamic σ-trans effect of NO¯ is actually stronger than that of NO·
(see below).37
As in the IR spectroelectrochemical measurements, this reduction is
fully reversible as shown in the insert of Figure 3.8. Finally, all attempts at chemical
reduction (sodium anthracenide, KC8) and isolation of 1-NO¯ at room- and low-
temperature were unsuccessful.
The spectroelectrochemical reductions of 2-NO, 3-NO, 4-NO were also
performed. The first half-wave reduction potentials of 2-NO and 4-NO are -1.18 V
vs. Fc/Fc+, and E1/2 for the first reduction of 3-NO is slightly more positive at -1.13 V
vs. Fc/Fc+ (Table 3.4). The UV-visible spectral changes upon reduction of 2-NO are
300 400 500 600 700 800
0.4
0.6
0.8
1.0
1.2
1.4
1.6
start
hold at -1.6 V vs Ag wire
Reduction of [FeII(3,5-Me-BAFP)]
551
587
395
Ab
s.
wavelength [nm]
515
432
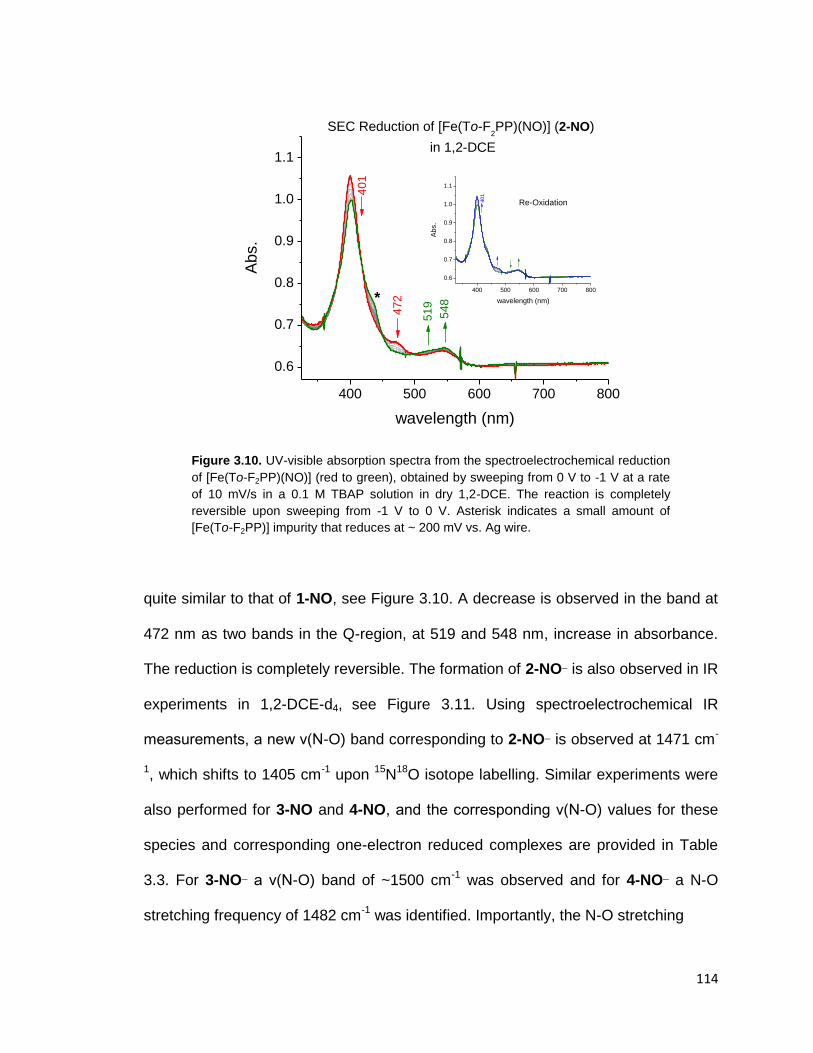
114
Figure 3.10. UV-visible absorption spectra from the spectroelectrochemical reduction
of [Fe(To-F2PP)(NO)] (red to green), obtained by sweeping from 0 V to -1 V at a rate
of 10 mV/s in a 0.1 M TBAP solution in dry 1,2-DCE. The reaction is completely
reversible upon sweeping from -1 V to 0 V. Asterisk indicates a small amount of
[Fe(To-F2PP)] impurity that reduces at ~ 200 mV vs. Ag wire.
quite similar to that of 1-NO, see Figure 3.10. A decrease is observed in the band at
472 nm as two bands in the Q-region, at 519 and 548 nm, increase in absorbance.
The reduction is completely reversible. The formation of 2-NO¯ is also observed in IR
experiments in 1,2-DCE-d4, see Figure 3.11. Using spectroelectrochemical IR
measurements, a new ν(N-O) band corresponding to 2-NO¯ is observed at 1471 cm-
1, which shifts to 1405 cm
-1 upon
15N
18O isotope labelling. Similar experiments were
also performed for 3-NO and 4-NO, and the corresponding ν(N-O) values for these
species and corresponding one-electron reduced complexes are provided in Table
3.3. For 3-NO¯ a ν(N-O) band of ~1500 cm-1
was observed and for 4-NO¯ a N-O
stretching frequency of 1482 cm-1
was identified. Importantly, the N-O stretching
400 500 600 700 800
0.6
0.7
0.8
0.9
1.0
1.1
400 500 600 700 800
0.6
0.7
0.8
0.9
1.0
1.1
Abs.
wavelength (nm)
Re-Oxidation40
1
51
9
47
2
SEC Reduction of [Fe(To-F2PP)(NO)] (2-NO)
in 1,2-DCE
Ab
s.
wavelength (nm)
40
1
54
8*
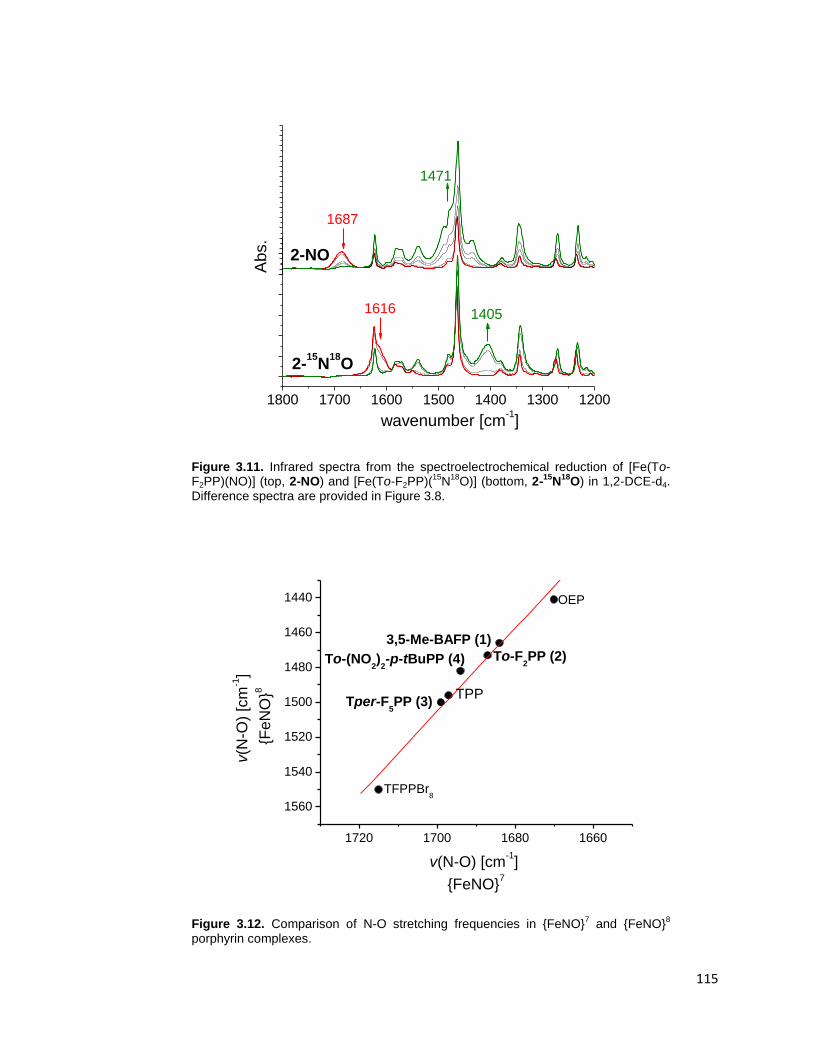
115
Figure 3.11. Infrared spectra from the spectroelectrochemical reduction of [Fe(To-F2PP)(NO)] (top, 2-NO) and [Fe(To-F2PP)(
15N
18O)] (bottom, 2-
15N
18O) in 1,2-DCE-d4.
Difference spectra are provided in Figure 3.8.
Figure 3.12. Comparison of N-O stretching frequencies in {FeNO}7 and {FeNO}
8
porphyrin complexes.
1800 1700 1600 1500 1400 1300 1200
1471
1687
2-15
N18
O
2-NO
wavenumber [cm-1]
Ab
s.
14051616
1720 1700 1680 1660
1560
1540
1520
1500
1480
1460
1440
3,5-Me-BAFP (1)
Tper-F5PP (3)
To-(NO2)
2-p-tBuPP (4)
v(N
-O)
[cm
-1]
{FeN
O}8
v(N-O) [cm-1]
{FeNO}7
OEP
TPP
TFPPBr8
To-F2PP (2)
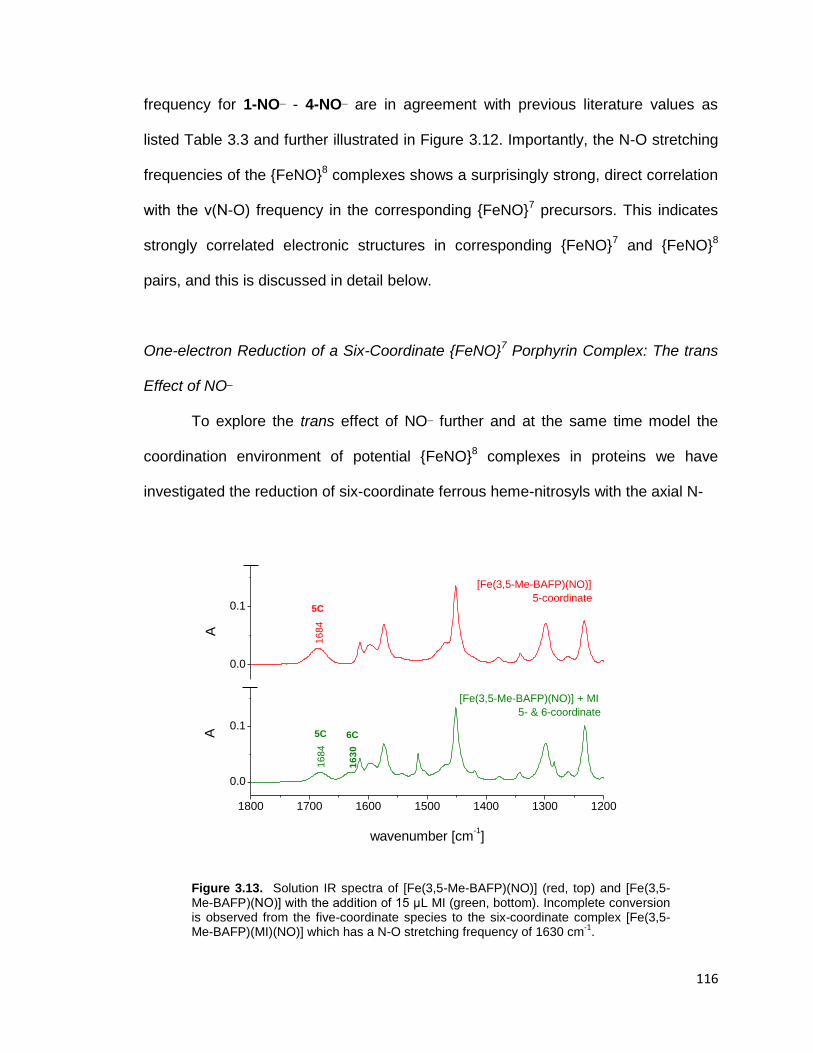
116
frequency for 1-NO¯ - 4-NO¯ are in agreement with previous literature values as
listed Table 3.3 and further illustrated in Figure 3.12. Importantly, the N-O stretching
frequencies of the {FeNO}8 complexes shows a surprisingly strong, direct correlation
with the ν(N-O) frequency in the corresponding {FeNO}7 precursors. This indicates
strongly correlated electronic structures in corresponding {FeNO}7 and {FeNO}
8
pairs, and this is discussed in detail below.
One-electron Reduction of a Six-Coordinate {FeNO}7 Porphyrin Complex: The trans
Effect of NO¯
To explore the trans effect of NO¯ further and at the same time model the
coordination environment of potential {FeNO}8 complexes in proteins we have
investigated the reduction of six-coordinate ferrous heme-nitrosyls with the axial N-
Figure 3.13. Solution IR spectra of [Fe(3,5-Me-BAFP)(NO)] (red, top) and [Fe(3,5-Me-BAFP)(NO)] with the addition of 15 μL MI (green, bottom). Incomplete conversion is observed from the five-coordinate species to the six-coordinate complex [Fe(3,5-Me-BAFP)(MI)(NO)] which has a N-O stretching frequency of 1630 cm
-1.
1800 1700 1600 1500 1400 1300 1200
0.0
0.1
[Fe(3,5-Me-BAFP)(NO)] + MI
5- & 6-coordinate
[Fe(3,5-Me-BAFP)(NO)]
5-coordinate
1684
1684
16
30
A
wavenumber [cm-1]
0.0
0.1
5C 6C
A
5C

117
donor ligand 1-methylimidazole (MI) as a model for histidine in globins. We
investigated the use of our ferrous picket fence porphyrin nitrosyl complex (1-NO)
first. After addition of 50 eq. of MI to 1-NO in a thin layer IR spectroelectrochemical
cell, only ~40% of 1-NO was converted to [Fe(3,5-MeBAFP)(MI)(NO)] (see Figure
3.13). As such, we needed to move to a system with a higher affinity for MI.
Therefore, various porphyrins were screened as formation of six-coordinate ferrous
nitrosyl complexes in solution requires excess N-donor as the σ-trans effect of NO is
strong.34, 38
Importantly, it has been shown previously that the use of electron
withdrawing derivatives of TPP increases MI affinity for the ferrous nitrosyl form.34
To quantify MI binding to five-coordinate ferrous heme-nitrosyls, the binding
constant can be calculated for the reaction below:
[Fe(TPP*)(NO)] + MI ⇄ [Fe(TPP*)(MI)(NO)] (1)
where TPP*2-
is a tetraphenylporphyrin derivative. The titration of MI against the five-
coordinate complex 1-NO was followed by UV-visible spectroscopy and Keq can then
be calculated from the equation:
[MI] = cTΔε [MI] - Keq (2) ΔE
which was originally developed by Drago and co-workers.
39-41 Here, cT corresponds
to the total concentration of porphyrin complexes, cT = c(6C) + c(5C), and Δε is the
difference in extinction coefficients, Δε = ε(6C) – ε(5C). UV-vis absorption
measurements are performed at different concentrations of MI ([MI]) and the change
in absorbance (ΔE) is measured. A plot of [MI] versus [MI]/ΔE then gives Keq-1
.
Calculation of the binding constant of MI to 1-NO supports the low conversion to the
six-coordinate species under IR conditions as Keq is only 76 M-1
, see Table 3.5. This
is essentially equal to Keq of MI binding to [Fe(TPP)(NO)], 26 M-1
, and significantly
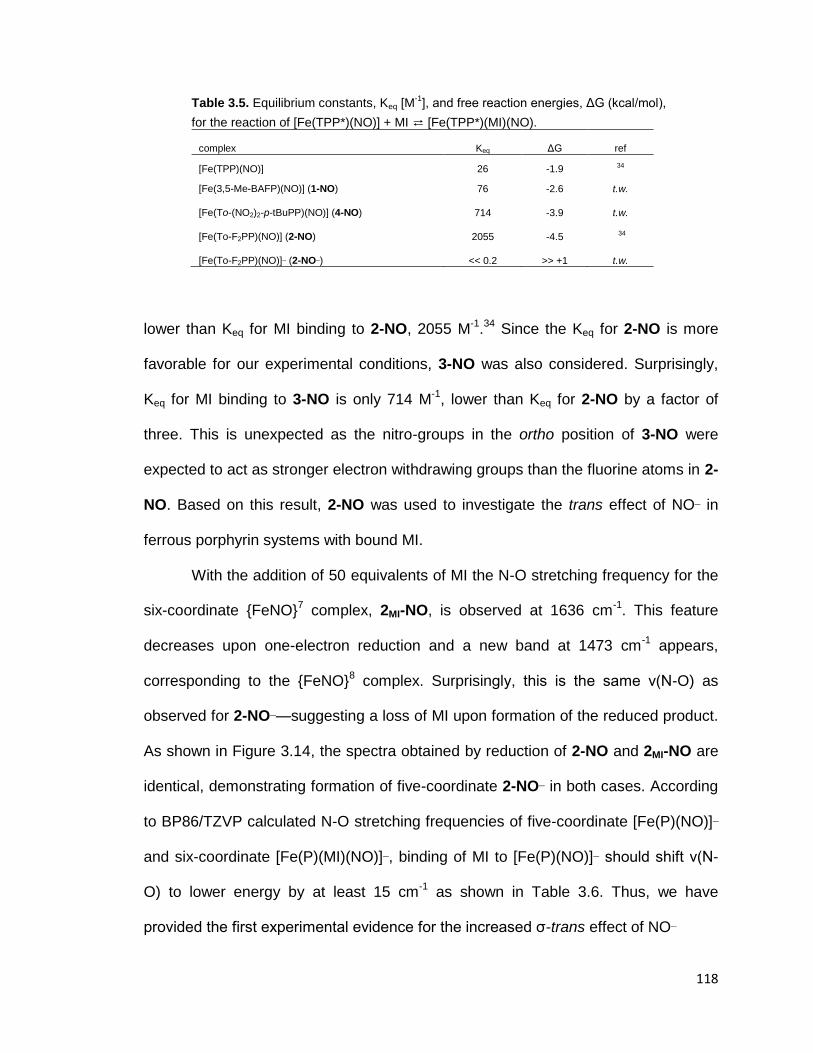
118
Table 3.5. Equilibrium constants, Keq [M-1
], and free reaction energies, ΔG (kcal/mol),
for the reaction of [Fe(TPP*)(NO)] + MI ⇄ [Fe(TPP*)(MI)(NO).
complex Keq ΔG ref
[Fe(TPP)(NO)] 26 -1.9 34
[Fe(3,5-Me-BAFP)(NO)] (1-NO) 76 -2.6 t.w.
[Fe(To-(NO2)2-p-tBuPP)(NO)] (4-NO) 714 -3.9 t.w.
[Fe(To-F2PP)(NO)] (2-NO) 2055 -4.5 34
[Fe(To-F2PP)(NO)]¯ (2-NO¯) << 0.2 >> +1 t.w.
lower than Keq for MI binding to 2-NO, 2055 M-1
.34
Since the Keq for 2-NO is more
favorable for our experimental conditions, 3-NO was also considered. Surprisingly,
Keq for MI binding to 3-NO is only 714 M-1
, lower than Keq for 2-NO by a factor of
three. This is unexpected as the nitro-groups in the ortho position of 3-NO were
expected to act as stronger electron withdrawing groups than the fluorine atoms in 2-
NO. Based on this result, 2-NO was used to investigate the trans effect of NO¯ in
ferrous porphyrin systems with bound MI.
With the addition of 50 equivalents of MI the N-O stretching frequency for the
six-coordinate {FeNO}7 complex, 2MI-NO, is observed at 1636 cm
-1. This feature
decreases upon one-electron reduction and a new band at 1473 cm-1
appears,
corresponding to the {FeNO}8 complex. Surprisingly, this is the same ν(N-O) as
observed for 2-NO¯—suggesting a loss of MI upon formation of the reduced product.
As shown in Figure 3.14, the spectra obtained by reduction of 2-NO and 2MI-NO are
identical, demonstrating formation of five-coordinate 2-NO¯ in both cases. According
to BP86/TZVP calculated N-O stretching frequencies of five-coordinate [Fe(P)(NO)]¯
and six-coordinate [Fe(P)(MI)(NO)]¯, binding of MI to [Fe(P)(NO)]¯ should shift ν(N-
O) to lower energy by at least 15 cm-1
as shown in Table 3.6. Thus, we have
provided the first experimental evidence for the increased σ-trans effect of NO¯
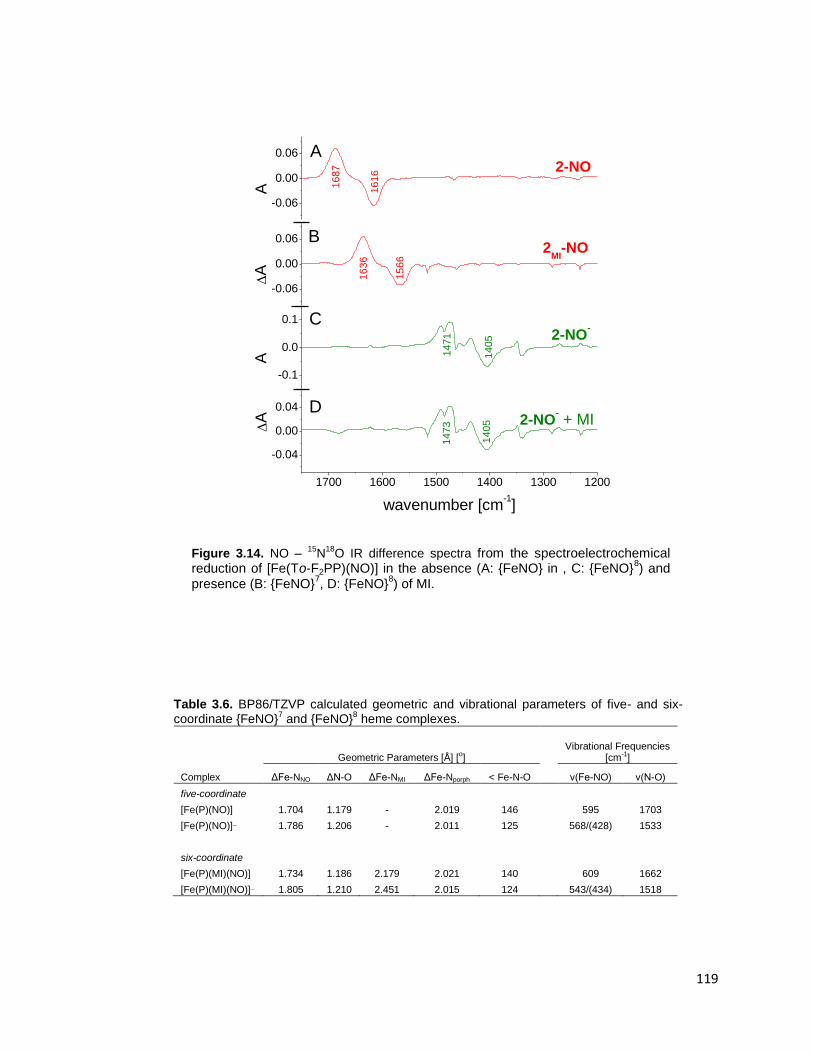
119
Figure 3.14. NO – 15
N18
O IR difference spectra from the spectroelectrochemical reduction of [Fe(To-F2PP)(NO)] in the absence (A: {FeNO} in , C: {FeNO}
8) and
presence (B: {FeNO}7, D: {FeNO}
8) of MI.
Table 3.6. BP86/TZVP calculated geometric and vibrational parameters of five- and six-coordinate {FeNO}
7 and {FeNO}
8 heme complexes.
Geometric Parameters [Å] [o]
Vibrational Frequencies [cm-1]
Complex ΔFe-NNO ΔN-O ΔFe-NMI ΔFe-Nporph < Fe-N-O
ν(Fe-NO) ν(N-O)
five-coordinate
[Fe(P)(NO)] 1.704 1.179 - 2.019 146
595 1703
[Fe(P)(NO)]¯ 1.786 1.206 - 2.011 125
568/(428) 1533
six-coordinate
[Fe(P)(MI)(NO)] 1.734 1.186 2.179 2.021 140
609 1662
[Fe(P)(MI)(NO)]¯ 1.805 1.210 2.451 2.015 124
543/(434) 1518
1700 1600 1500 1400 1300 1200
-0.04
0.00
0.04
2-NO-
2MI
-NO
2-NO
2-NO- + MI
1471
1473
1405
1405
A
wavenumber [cm-1]
-0.1
0.0
0.1
A
-0.06
0.00
0.06
1616
1687
1566
A 1636
-0.06
0.00
0.06
D
C
B
A
A

120
relative to NO·. 15N
18O isotope labelling further confirms this idea: the observed
stretching frequency upon reduction of [Fe(To-F2PP)(MI)(15
N18
O)] at 1405 cm-1
is
exactly identical to 2-15
N18
O¯, see Figure 3.14. The reduction is completely reversible
and after re-oxidation the starting six-coordinate complexes, 2MI-NO and 2MI-15
N18
O
are regenerated.
Increasing the amount of MI to 170 eq. still shows formation of N-O stretching
frequencies at 1473 and 1405 cm-1
for the natural abundance isotopes and 15
N18
O
complexes, respectively. Using this, we can estimate the upper limit of the MI
binding constant to 2-NO¯ to be 0.2 M-1
. Using the Van’t Hoff equation at 298.15 K
this corresponds to an unfavourable Gibbs free energy, ΔG, of +1 kcal/mol for MI
binding as listed in Table 3.5. This Keq is calculated assuming 10% conversion to 2MI-
NO¯ at 170 equivalent of MI—which spectroscopically we do not observe. As a
result, the actual Keq for MI binding to 2-NO is, in reality, significantly lower than 0.2
M-1
. DFT geometry optimizations and calculated N-O stretching frequencies of
[Fe(P)(MI)(NO)] and [Fe(P)(MI)(NO)]¯ support the strengthened thermodynamic
Figure 3.15. The model system [Fe(P)(MI)(NO)]¯, where P = porphine
2- and MI = 1=methylimidazole, and applied coordinate
system. The structure shown is calculated using BP86/TZVP.
2.45 Å
z
yx
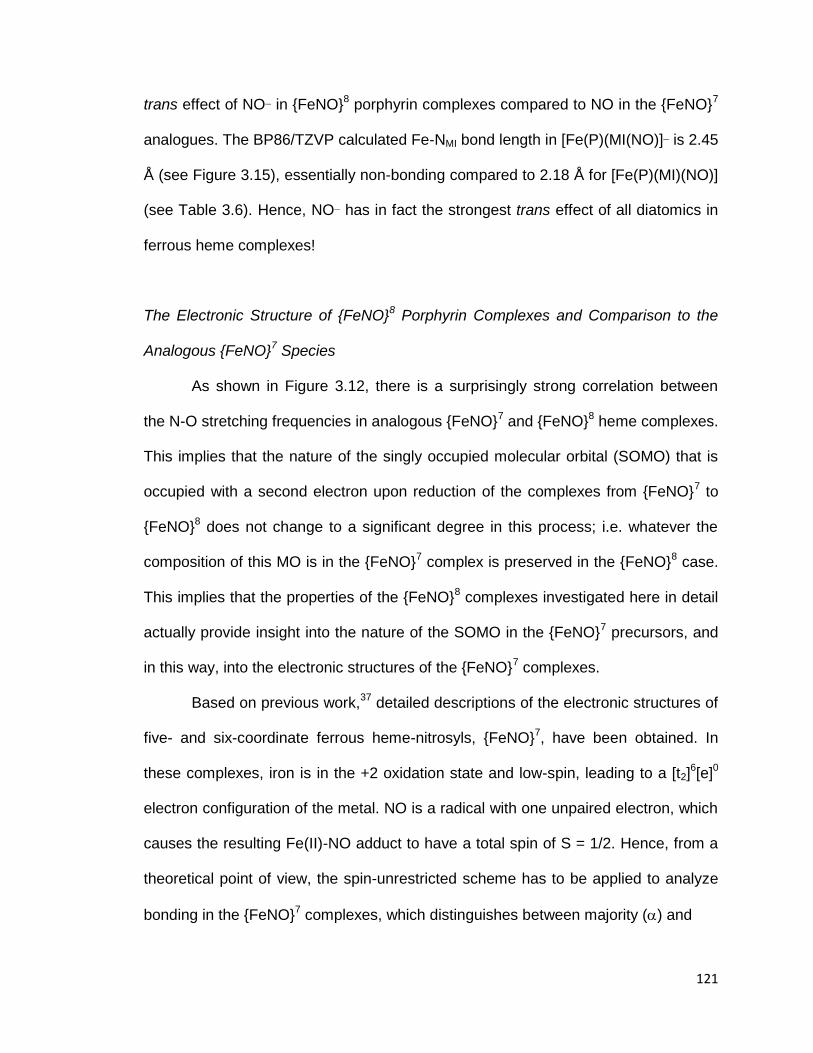
121
trans effect of NO¯ in {FeNO}8 porphyrin complexes compared to NO in the {FeNO}
7
analogues. The BP86/TZVP calculated Fe-NMI bond length in [Fe(P)(MI(NO)]¯ is 2.45
Å (see Figure 3.15), essentially non-bonding compared to 2.18 Å for [Fe(P)(MI)(NO)]
(see Table 3.6). Hence, NO¯ has in fact the strongest trans effect of all diatomics in
ferrous heme complexes!
The Electronic Structure of {FeNO}8 Porphyrin Complexes and Comparison to the
Analogous {FeNO}7 Species
As shown in Figure 3.12, there is a surprisingly strong correlation between
the N-O stretching frequencies in analogous {FeNO}7 and {FeNO}
8 heme complexes.
This implies that the nature of the singly occupied molecular orbital (SOMO) that is
occupied with a second electron upon reduction of the complexes from {FeNO}7 to
{FeNO}8 does not change to a significant degree in this process; i.e. whatever the
composition of this MO is in the {FeNO}7 complex is preserved in the {FeNO}
8 case.
This implies that the properties of the {FeNO}8 complexes investigated here in detail
actually provide insight into the nature of the SOMO in the {FeNO}7 precursors, and
in this way, into the electronic structures of the {FeNO}7 complexes.
Based on previous work,37
detailed descriptions of the electronic structures of
five- and six-coordinate ferrous heme-nitrosyls, {FeNO}7, have been obtained. In
these complexes, iron is in the +2 oxidation state and low-spin, leading to a [t2]6[e]
0
electron configuration of the metal. NO is a radical with one unpaired electron, which
causes the resulting Fe(II)-NO adduct to have a total spin of S = 1/2. Hence, from a
theoretical point of view, the spin-unrestricted scheme has to be applied to analyze
bonding in the {FeNO}7 complexes, which distinguishes between majority () and
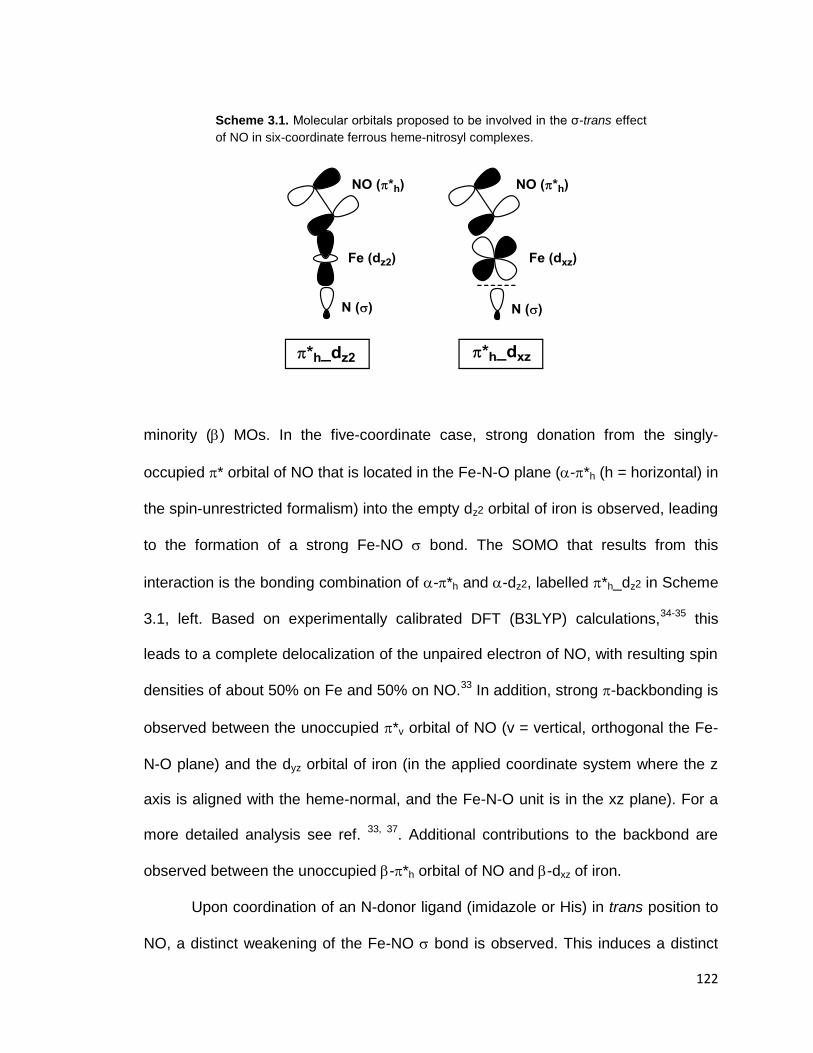
122
Scheme 3.1. Molecular orbitals proposed to be involved in the σ-trans effect
of NO in six-coordinate ferrous heme-nitrosyl complexes.
minority () MOs. In the five-coordinate case, strong donation from the singly-
occupied * orbital of NO that is located in the Fe-N-O plane (-*h (h = horizontal) in
the spin-unrestricted formalism) into the empty dz2 orbital of iron is observed, leading
to the formation of a strong Fe-NO bond. The SOMO that results from this
interaction is the bonding combination of -*h and -dz2, labelled *h_dz2 in Scheme
3.1, left. Based on experimentally calibrated DFT (B3LYP) calculations,34-35
this
leads to a complete delocalization of the unpaired electron of NO, with resulting spin
densities of about 50% on Fe and 50% on NO.33
In addition, strong -backbonding is
observed between the unoccupied *v orbital of NO (v = vertical, orthogonal the Fe-
N-O plane) and the dyz orbital of iron (in the applied coordinate system where the z
axis is aligned with the heme-normal, and the Fe-N-O unit is in the xz plane). For a
more detailed analysis see ref. 33, 37
. Additional contributions to the backbond are
observed between the unoccupied -*h orbital of NO and -dxz of iron.
Upon coordination of an N-donor ligand (imidazole or His) in trans position to
NO, a distinct weakening of the Fe-NO bond is observed. This induces a distinct
123
drop in the Fe-NO force constant and corresponding Fe-NO stretching frequency in
the six-coordinate case as observed experimentally.34, 42
In addition, the underlying
-trans interaction between NO and imidazole leads to weak binding of imidazole in
trans position to NO (Keq is usually < 50 M-1
).37
The presence of the axial imidazole
ligand further induces a redistribution of the unpaired electron density of NO, which
is mostly located on the NO ligand in the six-coordinate case. Based on B3LYP
calculations,34-35
the spin density distribution is estimated to be 80% on NO and 20%
on Fe. This mechanism, the strong (thermodynamic) -trans effect of NO in low-spin
{FeNO}7 complexes, is responsible for the activation of the NO sensor soluble
guanylate cyclase.43-44
Although basic agreement has been achieved in the literature on the overall
electronic structure description of ferrous heme-nitrosyls as described above, the
specific details are still highly controversial. The reason for this is that DFT methods
are generally not very accurate in describing the properties of the Fe-N-O unit in
these complexes.37, 43, 45
In particular, the spin density distribution, i.e. the distribution
of the unpaired electron of NO over the Fe-NO unit, and the shape of the SOMO are
strongly affected by the chosen DFT method, as documented nicely by Pierloot and
co-workers.46-47
Where gradient-corrected functionals generally lead to metal-based
spin (> 60% spin density on iron), hybrid functionals give a more unified distribution
of the spin density over the whole Fe-N-O unit as described above.37, 47
It has been
recently suggested the metal-based spin description is more accurate due to high
agreement of gradient-corrected functionals (for example, BP86, OLYP, PBE) with
CASSCF/CASPT2 results.47-48
However, CASSCF/CASPT2 calculations themselves
can give highly varied spin density distributions based on the active space used in

124
these calculations and, as a result, may not provide the most accurate comparison.45
It is therefore most important to compare calculated properties to experiment
to better assess the quality of the calculated results, in particular spectroscopic
properties are a good way to gauge the quality of quantum-chemical calculations. In
principal, EPR g values and hyperfine coupling constants (especially those of the
coordinated 14
N atom of NO) should be a good experimental probe for the spin
density distribution in ferrous heme-nitrosyls. In this case, it has been shown that
gradient-corrected functionals35, 49-50
perform slightly better than hybrid functionals35
for the calculation of g tensors and hyperfine coupling constants. These types of
calculations, however, generally show quite large deviations from experiment and
are also strongly dependent on the geometry and the applied basis set.51
Thus, it is
difficult to judge the quality of the overall description solely based on comparisons of
EPR parameters. On the other hand, calculated Fe-NO vibrational frequencies and
force constants, which directly reflect the strength of the Fe-NO bond, show very
clear trends when comparing the results from calculations using gradient-corrected
and hybrid functional. Here, gradient-corrected functionals tend to overemphasize
electron delocalization and, as demonstrated now for many cases,37
lead to an
overestimation of metal-ligand covalencies, and hence, bond strengths. In five- and
six-coordinate ferrous heme-nitrosyls, the experimental Fe-NO stretching vibrations
are located at 515 – 530 and ~440 cm-1
, respectively (see Table 3.3). Gradient-
corrected functionals strongly overestimate the Fe-NO bond strength, predicting the
Fe-NO stretching mode to occur at about 600 cm-1
in both the five- and six-
coordinate complexes. In contrast, B3LYP predicts the Fe-NO stretch at 540 – 580
and ~420 cm-1
for the five- and six-coordinate {FeNO}7 complexes, respectively,
which is in much better agreement with experiment (see also ref. 37
). The
125
overestimation of the covalency of the Fe-NO bond with the gradient-corrected
functionals goes along with a significant quenching of the spin density on the NO
ligand. Because of this, the spin density distributions calculated with hybrid
functionals (see above) can overall be expected to be more reliable, and hence,
these should be in closer agreement with the electronic structures of the real
complexes. Calculated Fe-NO binding energies further support these conclusions.
Recently it has been shown that the inclusion of van der Waals interactions is of key
importance to calculate accurate metal-ligand binding energies.43, 52
When these
contributions are included, hybrid functionals are able to predict quite accurate Fe-
NO binding energies. In contrast, gradient-corrected functionals greatly overestimate
NO binding energies52
in agreement with overestimation of the Fe-NO bond strength.
Importantly, the experimental properties of the analogous {FeNO}8 comlexes
investigated here provide further key insight into the properties of the SOMO in
{FeNO}7 systems. Whereas previous DFT results characterize the SOMO of ferrous
heme-nitrosyls as the bonding combination of -*h and -dz2, *h_dz2, as described
above (see Scheme 3.1, left),34, 53
it was recently proposed based on calculations
performed with gradient-corrected functionals that for the corresponding six-
coordinate complexes, this orbital should be considered the antibonding combination
between -*h and -dxz, resulting in a SOMO that is strongly π-antibonding in nature
as illustrated in Scheme 3.1, right.48
This would de facto eliminate the Fe-NO bond
in six-coordinate {FeNO}7 complexes. However, there are several experimental
observations that argue against this notion. First, the strong thermodynamic trans
effect of NO requires the presence of a distinct bond; in comparison, the strongly
backbonding ligand CO does not mediate much of a trans effect.43, 54
Second, the
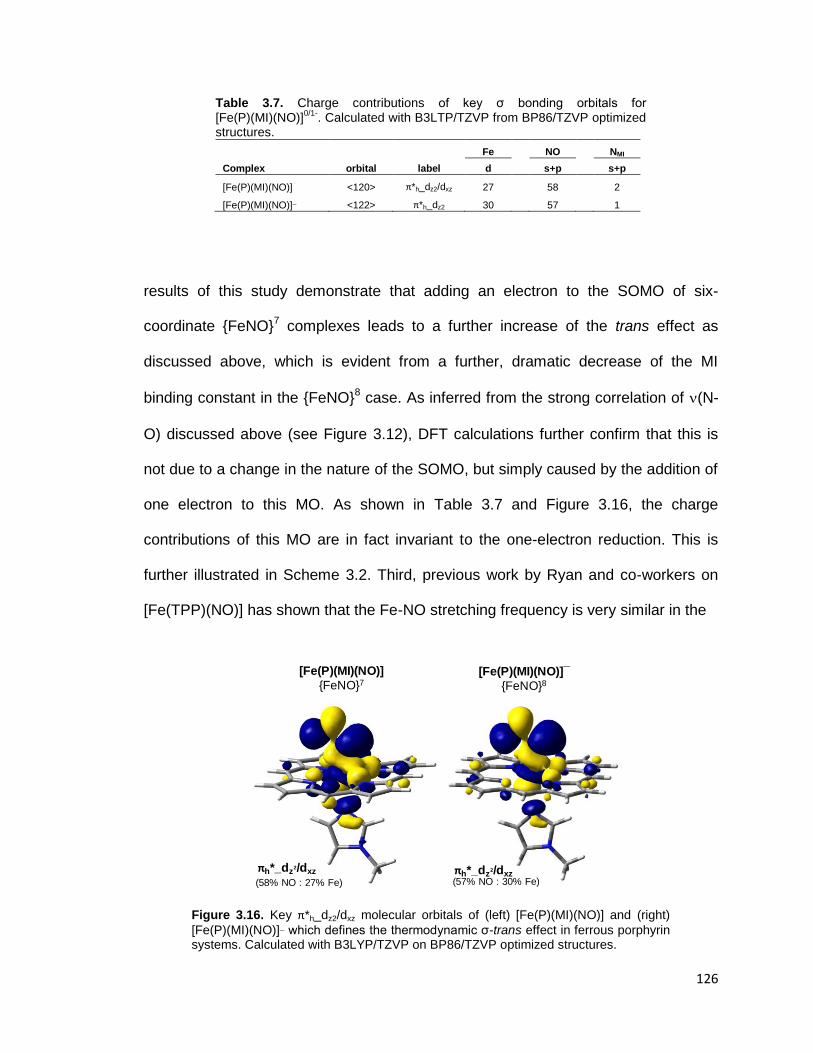
126
Table 3.7. Charge contributions of key σ bonding orbitals for [Fe(P)(MI)(NO)]
0/1-. Calculated with B3LTP/TZVP from BP86/TZVP optimized
structures.
Fe NO NMI
Complex orbital label d s+p s+p
[Fe(P)(MI)(NO)] <120> π*h_dz2/dxz 27
58
2
[Fe(P)(MI)(NO)]¯ <122> π*h_dz2 30 57 1
results of this study demonstrate that adding an electron to the SOMO of six-
coordinate {FeNO}7 complexes leads to a further increase of the trans effect as
discussed above, which is evident from a further, dramatic decrease of the MI
binding constant in the {FeNO}8 case. As inferred from the strong correlation of (N-
O) discussed above (see Figure 3.12), DFT calculations further confirm that this is
not due to a change in the nature of the SOMO, but simply caused by the addition of
one electron to this MO. As shown in Table 3.7 and Figure 3.16, the charge
contributions of this MO are in fact invariant to the one-electron reduction. This is
further illustrated in Scheme 3.2. Third, previous work by Ryan and co-workers on
[Fe(TPP)(NO)] has shown that the Fe-NO stretching frequency is very similar in the
Figure 3.16. Key π*h_dz2/dxz molecular orbitals of (left) [Fe(P)(MI)(NO)] and (right)
[Fe(P)(MI)(NO)]¯ which defines the thermodynamic σ-trans effect in ferrous porphyrin systems. Calculated with B3LYP/TZVP on BP86/TZVP optimized structures.
πh*_dz2/dxz
(57% NO : 30% Fe)
[Fe(P)(MI)(NO)]
{FeNO}7
πh*_dz2/dxz
(58% NO : 27% Fe)
[Fe(P)(MI)(NO)]¯
{FeNO}8
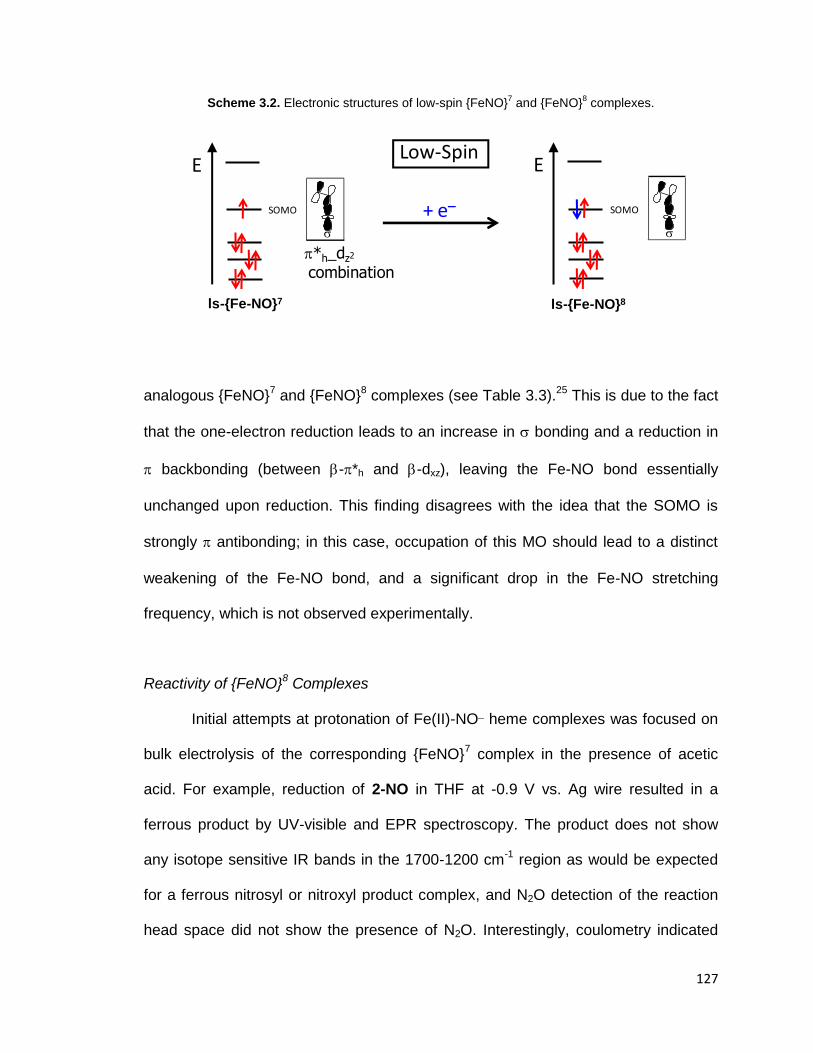
127
Scheme 3.2. Electronic structures of low-spin {FeNO}7 and {FeNO}
8 complexes.
analogous {FeNO}7 and {FeNO}
8 complexes (see Table 3.3).
25 This is due to the fact
that the one-electron reduction leads to an increase in bonding and a reduction in
backbonding (between -*h and -dxz), leaving the Fe-NO bond essentially
unchanged upon reduction. This finding disagrees with the idea that the SOMO is
strongly antibonding; in this case, occupation of this MO should lead to a distinct
weakening of the Fe-NO bond, and a significant drop in the Fe-NO stretching
frequency, which is not observed experimentally.
Reactivity of {FeNO}8 Complexes
Initial attempts at protonation of Fe(II)-NO¯ heme complexes was focused on
bulk electrolysis of the corresponding {FeNO}7 complex in the presence of acetic
acid. For example, reduction of 2-NO in THF at -0.9 V vs. Ag wire resulted in a
ferrous product by UV-visible and EPR spectroscopy. The product does not show
any isotope sensitive IR bands in the 1700-1200 cm-1
region as would be expected
for a ferrous nitrosyl or nitroxyl product complex, and N2O detection of the reaction
head space did not show the presence of N2O. Interestingly, coulometry indicated
E
SOMO
+ e
E
SOMO
Low-Spin
*h_dz2combination
ls-{Fe-NO}7 ls-{Fe-NO}8
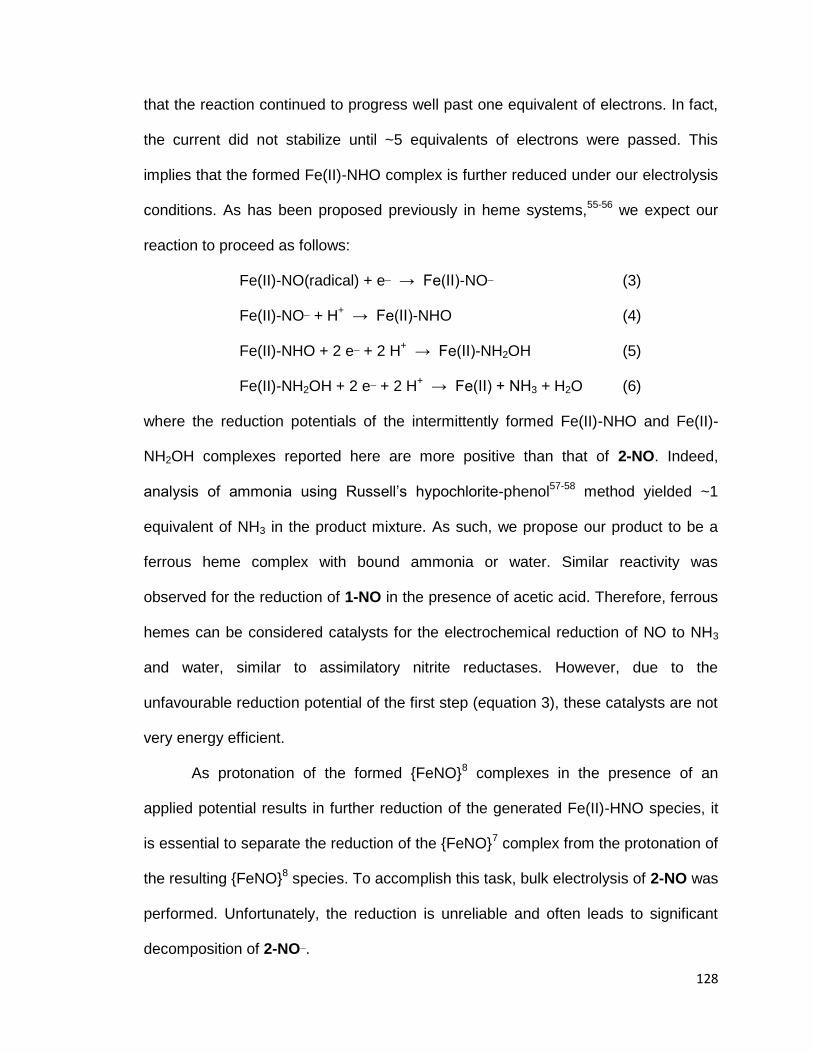
128
that the reaction continued to progress well past one equivalent of electrons. In fact,
the current did not stabilize until ~5 equivalents of electrons were passed. This
implies that the formed Fe(II)-NHO complex is further reduced under our electrolysis
conditions. As has been proposed previously in heme systems,55-56
we expect our
reaction to proceed as follows:
Fe(II)-NO(radical) + e¯ → Fe(II)-NO¯ (3)
Fe(II)-NO¯ + H+ → Fe(II)-NHO (4)
Fe(II)-NHO + 2 e¯ + 2 H+ → Fe(II)-NH2OH (5)
Fe(II)-NH2OH + 2 e¯ + 2 H+ → Fe(II) + NH3 + H2O (6)
where the reduction potentials of the intermittently formed Fe(II)-NHO and Fe(II)-
NH2OH complexes reported here are more positive than that of 2-NO. Indeed,
analysis of ammonia using Russell’s hypochlorite-phenol57-58
method yielded ~1
equivalent of NH3 in the product mixture. As such, we propose our product to be a
ferrous heme complex with bound ammonia or water. Similar reactivity was
observed for the reduction of 1-NO in the presence of acetic acid. Therefore, ferrous
hemes can be considered catalysts for the electrochemical reduction of NO to NH3
and water, similar to assimilatory nitrite reductases. However, due to the
unfavourable reduction potential of the first step (equation 3), these catalysts are not
very energy efficient.
As protonation of the formed {FeNO}8 complexes in the presence of an
applied potential results in further reduction of the generated Fe(II)-HNO species, it
is essential to separate the reduction of the {FeNO}7 complex from the protonation of
the resulting {FeNO}8 species. To accomplish this task, bulk electrolysis of 2-NO was
performed. Unfortunately, the reduction is unreliable and often leads to significant
decomposition of 2-NO¯.
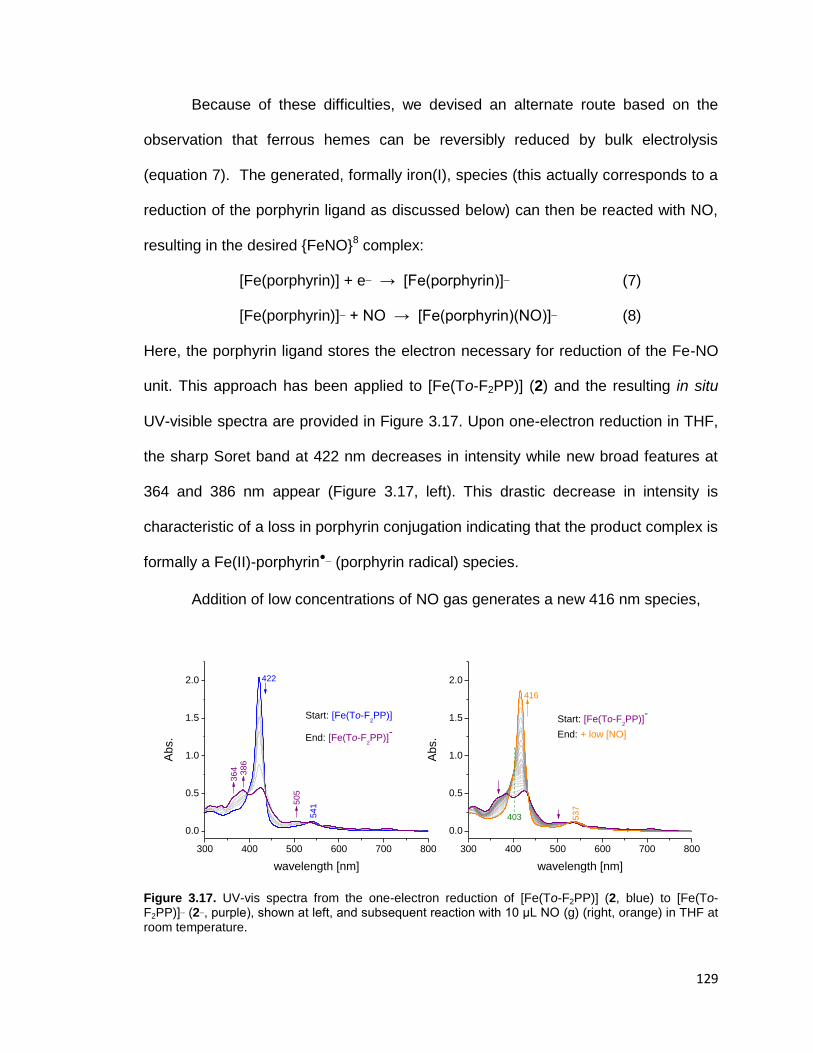
129
Because of these difficulties, we devised an alternate route based on the
observation that ferrous hemes can be reversibly reduced by bulk electrolysis
(equation 7). The generated, formally iron(I), species (this actually corresponds to a
reduction of the porphyrin ligand as discussed below) can then be reacted with NO,
resulting in the desired {FeNO}8 complex:
[Fe(porphyrin)] + e¯ → [Fe(porphyrin)]¯ (7)
[Fe(porphyrin)]¯ + NO → [Fe(porphyrin)(NO)]¯ (8)
Here, the porphyrin ligand stores the electron necessary for reduction of the Fe-NO
unit. This approach has been applied to [Fe(To-F2PP)] (2) and the resulting in situ
UV-visible spectra are provided in Figure 3.17. Upon one-electron reduction in THF,
the sharp Soret band at 422 nm decreases in intensity while new broad features at
364 and 386 nm appear (Figure 3.17, left). This drastic decrease in intensity is
characteristic of a loss in porphyrin conjugation indicating that the product complex is
formally a Fe(II)-porphyrin●
¯ (porphyrin radical) species.
Addition of low concentrations of NO gas generates a new 416 nm species,
Figure 3.17. UV-vis spectra from the one-electron reduction of [Fe(To-F2PP)] (2, blue) to [Fe(To-F2PP)]¯ (2¯, purple), shown at left, and subsequent reaction with 10 μL NO (g) (right, orange) in THF at room temperature.
300 400 500 600 700 800
0.0
0.5
1.0
1.5
2.0
Abs.
wavelength [nm]
54
150
5
38
6
Start: [Fe(To-F2PP)]
End: [Fe(To-F2PP)]
-
422
36
4
300 400 500 600 700 800
0.0
0.5
1.0
1.5
2.0
53
7
Abs.
wavelength [nm]
Start: [Fe(To-F2PP)]
-
End: + low [NO]
416
403
130
as shown in Figure 3.17 (right), of unknown nature. In contrast to this, if a high
concentration of NO is added to 2¯, see Figure 3.18, the desired 2-NO¯ is generated
without formation of the 416 nm complex. Our hypothesis is that the new 416 nm
complex is a hyponitrite complex, or decomposition thereof. If correct, the formation
of the 416 nm band would be dependent on the presence of 2-NO¯, 2¯ and free NO,
as shown below:
2¯ + NO + 2-NO¯ → 2 + 2-N2O22¯ (9)
In order to test this we added NO gas to the pre-generated 2-NO¯, resulting in
formation of 2-NO (the {FeNO}7 complex) with a Soret band at 408 nm instead of
416 nm (discussed below). This implies that only a mixture of 2¯, NO, and 2-NO¯ can
generate this species, observed at 416 nm. Further work is needed to determine the
exact identity of the 416 nm species.
Interestingly, 2-NO¯ reacts with free NO in solution as mentioned above to
form 2-NO, as evident from UV-visible spectroscopy. This suggests that 2-NO¯
Figure 3.18. UV-visible spectra for the reaction of [Fe(To-F2PP)]¯ (2¯, purple) with NO to generate [Fe(To-F2PP)(NO)]¯ (2-NO¯, green) in THF at room temperature.
300 400 500 600 700 800
0.0
0.2
0.4
0.6
0.8
1.0
1.2
Start: [Fe(To-F2PP)]
-
End: [Fe(To-F2PP)(NO)]
-
50
5
Abs.
wavelength [nm]
403
54
8
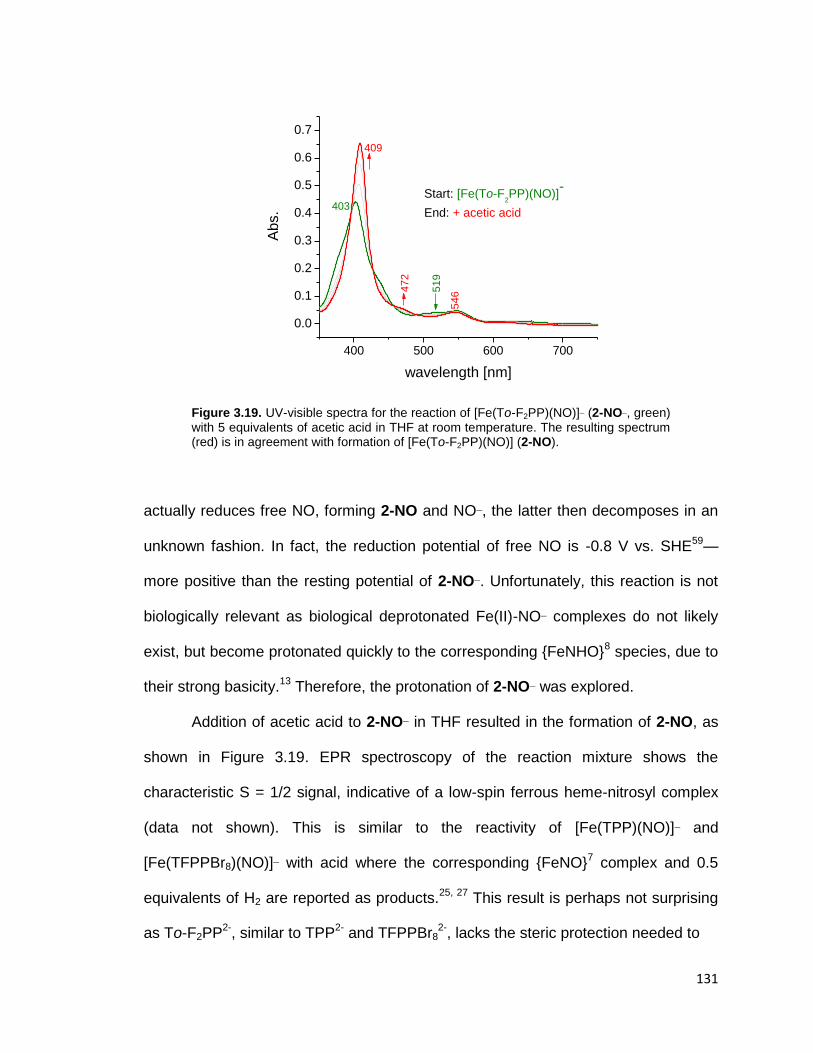
131
Figure 3.19. UV-visible spectra for the reaction of [Fe(To-F2PP)(NO)]¯ (2-NO¯, green) with 5 equivalents of acetic acid in THF at room temperature. The resulting spectrum (red) is in agreement with formation of [Fe(To-F2PP)(NO)] (2-NO).
actually reduces free NO, forming 2-NO and NO¯, the latter then decomposes in an
unknown fashion. In fact, the reduction potential of free NO is -0.8 V vs. SHE59
—
more positive than the resting potential of 2-NO¯. Unfortunately, this reaction is not
biologically relevant as biological deprotonated Fe(II)-NO¯ complexes do not likely
exist, but become protonated quickly to the corresponding {FeNHO}8 species, due to
their strong basicity.13
Therefore, the protonation of 2-NO¯ was explored.
Addition of acetic acid to 2-NO¯ in THF resulted in the formation of 2-NO, as
shown in Figure 3.19. EPR spectroscopy of the reaction mixture shows the
characteristic S = 1/2 signal, indicative of a low-spin ferrous heme-nitrosyl complex
(data not shown). This is similar to the reactivity of [Fe(TPP)(NO)]¯ and
[Fe(TFPPBr8)(NO)]¯ with acid where the corresponding {FeNO}7 complex and 0.5
equivalents of H2 are reported as products.25, 27
This result is perhaps not surprising
as To-F2PP2-
, similar to TPP2-
and TFPPBr82-
, lacks the steric protection needed to
400 500 600 700
0.0
0.1
0.2
0.3
0.4
0.5
0.6
0.7
51
9
54
6
Abs.
wavelength [nm]
409
403
47
2
Start: [Fe(To-F2PP)(NO)]
-
End: + acetic acid

132
Figure 3.20. UV-vis spectra from the one-electron reduction of [Fe(3,5-Me-BAFP)] (1, blue) to [Fe(3,5-Me-BAFP)]¯ (2¯, red), shown at left, and subsequent reaction with 100 μL NO (g) in THF at room
temperature resulting in formation of [Fe(3,5-Me-BAFP)(NO)]¯ (right, green).
prevent this disproportionation of the Fe-NHO unit. In this sense, the reaction of the
bis-picket fence porphyrin complex [Fe(3,5-Me-BAFP)(NO)]¯ (1-NO¯) with acid is of
extreme interest.
To this end, bulk electrolysis of [Fe(3,5-Me-BAFP)] (1) in THF was performed
at room temperature. The in situ UV-visible spectra for the one-electron reduction to
1¯ are reported in Figure 3.20 (left). Addition of 100 μL of NO to 1¯ at room
temperature results in formation of 1-NO¯ with a Soret band at 415 nm (consistent
with spectroelectrochemical measurements), as shown in Figure 3.20 (right).
Subsequent reaction of 1-NO¯ with ~ 5 equivalents of acetic acid indicates formation
of a new complex with a Soret band at 426 nm, see Figure 3.21. Excitingly, this does
not correspond to 1-NO, which instead shows a Soret band of 422 nm in THF. This
indicates that, through the use of a bis-picket fence porphyrin, we are able to block
the disproportionation of bound HNO through the introduction of steric bulk around
the HNO-adduct! Whether the generated species, observed at 426 nm, is the
300 400 500 600 700 800
0.0
0.2
0.4
0.6
0.8
1.0
1.2
Ab
s.
wavelength [nm]
Start: [Fe(3,5-Me-BAFP)]
End: [Fe(3,5-Me-BAFP)]-
432
37
0
39
5
51
0
54
9
300 400 500 600 700 800
0.0
0.2
0.4
0.6
51
0
Abs.
wavelength [nm]
Start: [Fe(3,5-Me-BAFP)]-
End: [Fe(3,5-Me-BAFP)(NO)]-
415
54
4
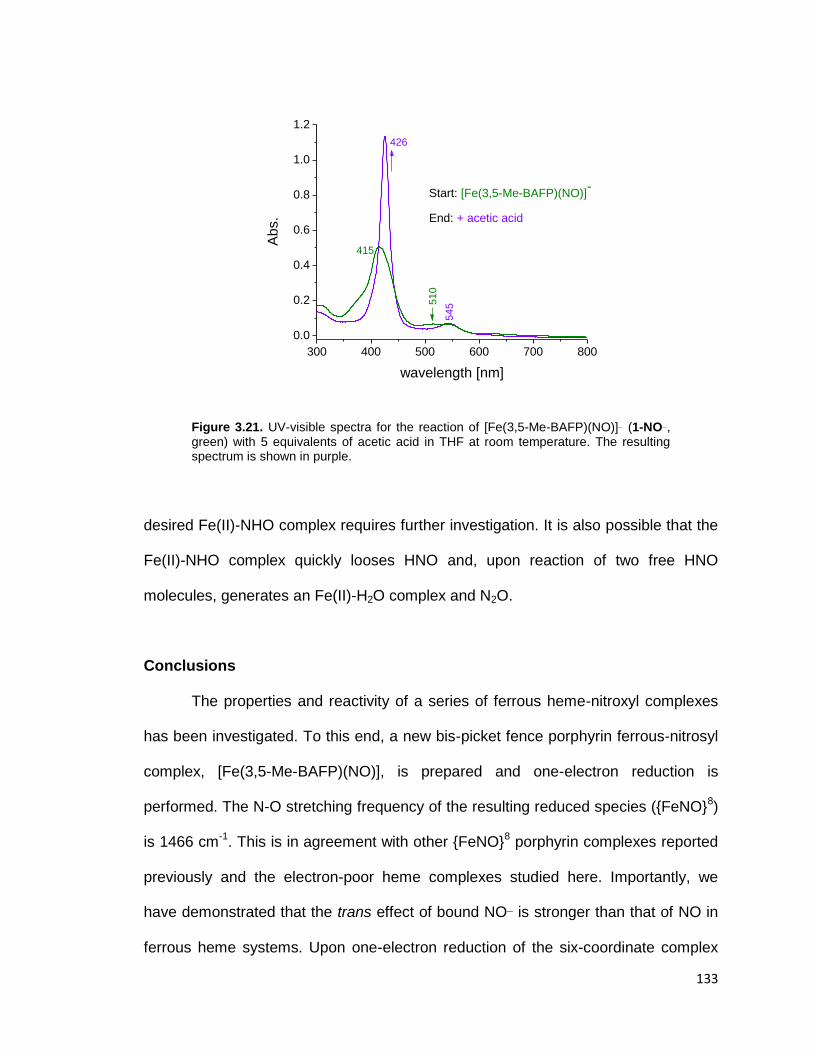
133
Figure 3.21. UV-visible spectra for the reaction of [Fe(3,5-Me-BAFP)(NO)]¯ (1-NO¯, green) with 5 equivalents of acetic acid in THF at room temperature. The resulting spectrum is shown in purple.
desired Fe(II)-NHO complex requires further investigation. It is also possible that the
Fe(II)-NHO complex quickly looses HNO and, upon reaction of two free HNO
molecules, generates an Fe(II)-H2O complex and N2O.
Conclusions
The properties and reactivity of a series of ferrous heme-nitroxyl complexes
has been investigated. To this end, a new bis-picket fence porphyrin ferrous-nitrosyl
complex, [Fe(3,5-Me-BAFP)(NO)], is prepared and one-electron reduction is
performed. The N-O stretching frequency of the resulting reduced species ({FeNO}8)
is 1466 cm-1
. This is in agreement with other {FeNO}8 porphyrin complexes reported
previously and the electron-poor heme complexes studied here. Importantly, we
have demonstrated that the trans effect of bound NO¯ is stronger than that of NO in
ferrous heme systems. Upon one-electron reduction of the six-coordinate complex
300 400 500 600 700 800
0.0
0.2
0.4
0.6
0.8
1.0
1.2
51
0
Ab
s.
wavelength [nm]
Start: [Fe(3,5-Me-BAFP)(NO)]-
End: + acetic acid
415
426
54
5
134
[Fe(To-F2PP)(MI)(NO)], the resulting complex, [Fe(To-F2PP)(NO)]¯, is five-
coordinate. This indicates loss of MI upon reduction to the {FeNO}8 complex, and an
increased trans effect of NO¯ relative to NO. We estimate the binding constant, Keq,
of MI binding to [Fe(To-F2PP)(NO)] to be << 0.2 M-1
, at least four orders of
magnitude smaller than that of MI binding to [Fe(To-F2PP)(NO)]. DFT results support
this finding and indicate that the key molecular orbital, π*h_dz2, responsible for the σ-
trans effect in {FeNO}7 systems does not change upon one-electron reduction.
Additionally, the reactivity of {FeNO}8 complexes with acid and free NO were
explored. [Fe(To-F2PP)(NO)]¯ reacts with acetic acid to generate the corresponding
{FeNO}7 complex and 0.5 equivalents H2, whereas the corresponding sterically
hindered 3,5-Me-BAFP2-
complex shows unique reactivity—effectively blocking the
disproportionation of bound HNO. Finally, reaction of [Fe(To-F2PP)(NO)]¯ with NO
results in reduction of free NO to NO¯ and oxidation of the ferrous nitroxyl complex to
[Fe(To-F2PP)(NO)].
Experimental
All reactions were performed under an inert gas atmosphere using dried and
distilled solvents. Handling of air-sensitive samples was carried out under an N2
atmosphere in an MBraun glovebox equipped with a circulating purifier (O2, H2O <
0.1 ppm). Nitric oxide gas (Cryogenic Gases Inc., 99.5%) was passed through
ascarite and then through a cold trap at –80°C prior to usage to remove higher
nitrogen oxide impurities. Nitric oxide-15
N18
O (Aldrich, 98% 15
N, 95% 18
O) was used
without further purification. 1-methylimidazole (MI) was distilled and degassed prior
to use. Ammonia analysis was carried out using the phenolate assay originally
135
developed by J. A. Russel.57-58
Tetrakis-5,10,15,20-(per-pentafluorophenyl)porphyrin, H2[Tper-F5PP], and
tetrakis-5,10,15,20-(o-difluorophenyl)porphyrin, H2[To-F2PP], were synthesized and
purified as previously reported.60-61
Tetrakis-5,10,15,20-(2,6-dinitro-4-tert-
butylphenyl)porphyrin, H2[To-(NO2)2-p-tBuPP], was prepared by BF3-OEt catalyzed
condensation of 2,6-dinitro-4-tert-butylbenzaldehyde62
and pyrrole in CH2Cl2 as
reported previously.63
The porphyrin ligand H2[3,5-Me-BAFP] was prepared
according to modified literature procedures as described below.64-65
Iron(III) chloride
porphyrin complexes were prepared from the porphyrin ligand and excess FeCl2 in
refluxing DMF.66
Five-coordinate ferrous porphyrin nitrosyls were prepared by
reductive nitrosylation of the corresponding iron(III) chloride complexes.31
A
representative procedure for iron insertion and reductive nitrosylation is provided
below. [57
Fe(3,5-Me-BAFP)(NO)] and [57
Fe(3,5-Me-BAFP)(15
N18
O)] for nuclear
resonance vibrational spectroscopy (NRVS) measurements were prepared in the
same manner as the n.a.i. complexes using 57
FeCl2 for the initial metallation.67
2,6-bis(3’,5’-dimethylphenoxy)benzaldehyde. 3.4 g potassium methoxide, 12.5 mL
dry benzene, and 6.1 g 3,5-dimethylphenol (50mmol) were added to a 100 mL
Schlenk flask. The mixture was allowed to stir under Ar(g) for 1 hour. After 1 hour,
benzene and methanol were removed via a Schlenk line. 12.5 mL dry pyridine was
added and the mixture was brought to a reflux. Then, 3.2 g 2,6-
dibromobenzaldehyde64
and 0.19 g copper(I) chloride were added quickly to the
mixture. The reaction was kept at reflux under Ar(g) for 17 hours. After 17 hrs, the
mixture was added to 37 mL of ice water, and conc. hydrochloric acid was added
until the solution became acidic. The reaction mixture was extracted with 20 mL
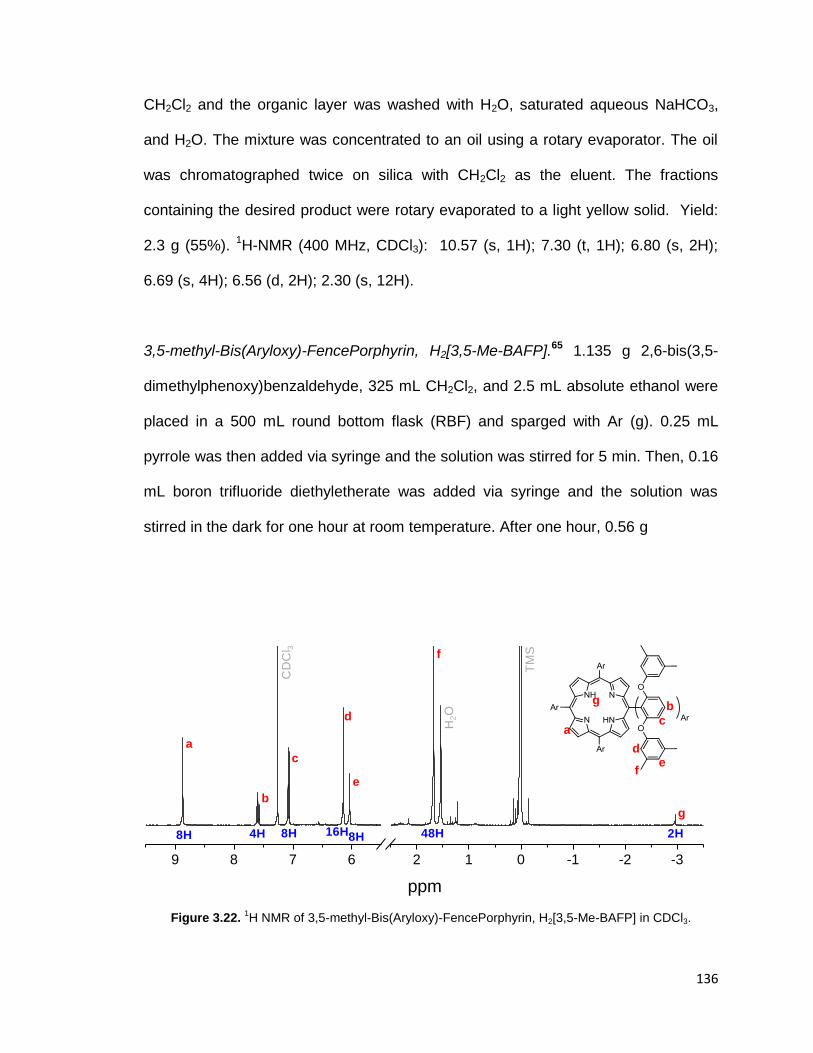
136
CH2Cl2 and the organic layer was washed with H2O, saturated aqueous NaHCO3,
and H2O. The mixture was concentrated to an oil using a rotary evaporator. The oil
was chromatographed twice on silica with CH2Cl2 as the eluent. The fractions
containing the desired product were rotary evaporated to a light yellow solid. Yield:
2.3 g (55%). 1H-NMR (400 MHz, CDCl3): 10.57 (s, 1H); 7.30 (t, 1H); 6.80 (s, 2H);
6.69 (s, 4H); 6.56 (d, 2H); 2.30 (s, 12H).
3,5-methyl-Bis(Aryloxy)-FencePorphyrin, H2[3,5-Me-BAFP].65
1.135 g 2,6-bis(3,5-
dimethylphenoxy)benzaldehyde, 325 mL CH2Cl2, and 2.5 mL absolute ethanol were
placed in a 500 mL round bottom flask (RBF) and sparged with Ar (g). 0.25 mL
pyrrole was then added via syringe and the solution was stirred for 5 min. Then, 0.16
mL boron trifluoride diethyletherate was added via syringe and the solution was
stirred in the dark for one hour at room temperature. After one hour, 0.56 g
Figure 3.22. 1H NMR of 3,5-methyl-Bis(Aryloxy)-FencePorphyrin, H2[3,5-Me-BAFP] in CDCl3.
9 8 7 6 2 1 0 -1 -2 -3
ppm
CD
Cl 3
8H
aa
b
b
c
c
4H 2H8H 8H16H 48H
d
e
f
g
TM
S
H2O
de
f
g
137
dichlorodicyano-benzoquinone and 0.16 mL triethylamine were added, and the
reaction was stirred for an additional hour. The reaction mixture was then
evaporated to dryness, chromoatographed on silica with 100% CH2Cl2, and the
obtained solid was recrystallized from CH2Cl2/MeOH. Yield: 349 mg (27%). 1H-NMR
(400MHz, CDCl3): 8.86 (s, 8H); 7.59 (t, 4H); 7.06 (d, 8H); 6.13 (s, 16H); 6.02 (s, 8H);
1.66 (s, 48H); -2.98 (s, 2H); see Figure 3.22. LCT MS: m/z 1576.1 (M+1). UV-vis
(CH2Cl2): 424, 517, 554, 593 nm.
[Fe(3,5-Me-BAFP)(Cl)]. 270 mg H2[3,5-Me-BAFP] in 60 mL dry THF was brought to
a reflux. Once refluxing, 0.22 g FeCl2 was quickly added and the reaction was
allowed to reflux for 3 hours. The solution was evaporated to dryness and the crude
material chromatographed on silica with 100% CH2Cl2 (to remove free base
porphyrin) and 98:2 CH2Cl2:MeOH to elute the ferric porphyrin. The product band
was evaporated, the resulting solid was redissolved in CH2Cl2 and washed with ~1 M
HCl. The organic layer was first dried with Na2SO4, and the solvent was then
removed under reduced pressure to yield a dark purple powder. Yield: 186 mg
(66%). LCT MS: m/z 1629.8 (M-Cl). UV-vis (CH2Cl2): 374, 424, 510, 584, 667 nm.
[Fe(3,5-Me-BAFP)(NO)] (1-NO). 325 mg of [Fe(3,5-Me-BAFP)(Cl)] was dissolved in
9 mL CH2Cl2 and 0.9 mL MeOH. The solution was exposed to excess NO (g) and
stirred at room temperature for 30 min. The resulting nitrosyl complex was
precipitated with the addition of 24 mL MeOH and stored at -30oC overnight. The
resulting solid was filtered under inert atmosphere and dried for 2 min under reduced
pressure. Yield: 253 mg (78%). FT-IR: v(N-O) 1686 cm-1
. [Fe(3,5-Me-BAFP)(15
N18
O)]
138
was prepared with 15
N18
O using the same procedure. FT-IR: v(15
N-18
O) 1614 cm-1
.
UV-vis (THF): 412, 483, 554 nm. UV-vis (1,2-DCE): 421, 480, 555 nm.
Crystallization of [Fe(3,5-Me-BAFP)(NO)]. In the glovebox, ~2 mg [Fe(3,5-Me-
BAFP)(NO)] was dissolved in 1 mL THF and placed in a 7 mm glass tube. 5 mL
MeOH was carefully layered on the THF solution and the setup was left under an
inert atmosphere to crystallize. After 8 days, crystals suitable for X-ray analysis were
collected.
Physical Measurements
Infrared spectra were obtained from KBr disks on a Perkin-Elmer BX
spectrometer at room temperature. Resolution was set to 2 cm-1
. Proton magnetic
resonance spectra were recorded on a Varian Inova 400 MHz instrument. Electronic
absorption spectra were measured using an Analytical Jena Specord 600 instrument
at room temperature. Electron paramagnetic resonance spectra were recorded on a
Bruker X-band EMX spectrometer equipped with an Oxford Instruments liquid
nitrogen cryostat. EPR spectra were typically obtained on frozen solutions using 20
mW microwave power and 100 kHz field modulation with the amplitude set to 1 G.
Sample concentrations employed were ~1 mM. Nuclear resonance vibrational
spectroscopy (NRVS) data were obtained as described previously36
at beam line 3-
ID-XOR of the Advanced Photon Source (APS) at Argonne National Laboratory. This
beamline provides about 2.5 x 10⁹ photons/sec in ~1 meV bandwidth (= 8 cm
-1) at
14.4125 keV in a 0.5 mm (vertical) x 0.5 mm (horizontal) spot. Samples were loaded
into 4 x 7 x 1 mm copper NRVS cells. The final spectra represent averages of 6
139
scans. The program Phoenix was used to convert the NRVS raw data to the
Vibrational Density of States (VDOS).68-69
Cyclic voltammograms (CVs) were recorded with a CH instruments CHI660C
electrochemical workstation using a three component system consisting of a
platinum or glassy carbon working electrode, a platinum auxiliary electrode, and an
Ag wire pseudo-reference electrode. CVs were measured in 0.1 M tetrabutyl-
ammonium perchlorate (TBAP) solutions in THF or 1,2-dichloroethane (1,2-DCE).
Potentials are reported against the measured Fc/Fc+ couple. IR
spectroelectrochemistry was performed using a solution IR cell with CaF2 windows
as previously described.26
Electrodes consist of an 8 x 10 mm Pt mesh (100 mesh,
99.9%, Aldrich) for the working, 3 x 10 mm Pt mesh for the counter, and Ag wire (0.1
mm diameter, 99.9%, Aldrich) as a pseudo-reference electrode. UV-vis
spectroelectrochemistry was performed in a OTTLE cell.70
Electrodes consist of an
8 x 10 mm Pt mesh (100 mesh, 99.9%, Aldrich) for the working, 3 x 20 mm Pt mesh
for the counter, and Ag wire (1 mm diameter, 99.9%, Aldrich) as a pseudo-reference
electrode. Bulk electrolysis was performed in a two compartment set-up where the
carbon felt working electrode and Ag wire reference electrode are separated from
the carbon felt counter electrode by a fine frit. The counter electrode compartment
contains solvent in electrolyte. Electrolyte (TBAP of TBAPF6) was 0.1 M. All bulk
electrolysis experiments were performed in the glovebox (O2 < 0.1 ppm).
X-ray crystallography measurements were performed on a Rigaku R-AXIS
RAPID imaging plate diffractometer using graphite monochromated Cu-Kα radiation.
A red prism crystal of C108H92O9N5Fe having approximate dimensions of 0.20 x
0.20 x 0.20 mm was mounted on a glass fiber. See Table 3.1 for crystallographic
140
data and measurement parameters. The crystal-to-detector distance was 127.40
mm. Readout was performed in the 0.100 mm pixel mode. The data were processed
with SADABS and corrected for absorption. The structure was solved and refined
with the Bruker SHELXTL (vs. 2008/3) software package.
DFT Calculations
All geometry optimizations and frequency calculations were performed with
the program package Gaussian 0371
using the BP8672-73
functional and TZVP74-75
basis set. Molecular orbitals were obtained from B3LYP73, 76-77
/TZVP single point
calculations on the BP86/TZVP optimized structures using ORCA.78
In all Gaussian
calculations, convergence was reached when the relative change in the density
matrix between subsequent iterations was less that 1 x 10⁻⁸
. Molecular orbitals were
plotted with the program orca_plot included in the ORCA package and visualized
using GaussView.
References
1. Burney, S.; Tamir, S.; Gal, A.; Tannenbaum, S. R., Nitric Oxide 1997, 1, 130-144.
2. Moncada, S.; Palmer, R. M.; Higgs, E. A., Pharmacol. Rev. 1991, 43, 109-142.
3. Snyder, S. H., Science 1992, 257, 494-496.
4. Bredt, D. S.; Snyder, S. H., Annu. Rev. Biochem. 1994, 63, 175-195.
5. Ignarro, L., Nitric Oxide: Biology and Pathobiology. Academic Press: San Diego, 2000.
6. Nakahara, K.; Tanimoto, T.; Hatano, K.; Usuda, K.; Shoun, H., J. Biol. Chem. 1993, 268, 8350-8355.
7. Dabier, A.; Shoun, H.; Ullrich, V., J. Inorg. Biochem. 2005, 99, 185-193.
141
8. Park, S.-Y.; Shimizu, H.; Adachi, S.; Nagagawa, A.; Tanaka, I.; Nakahara, K.; Shoun, H.; Obayashi, E.; Nakamura, H.; Iizuka, T.; Shiro, Y., Nat. Struct. Biol. 1997, 4, 827-832.
9. Shimizu, H.; Park, S.-Y.; Lee, D. S.; Shoun, H.; Shiro, Y., J. Inorg. Biochem. 2000, 81, 191-205.
10. Shiro, Y.; Fujii, M.; Iisuka, T.; Adachi, S.; Tsukamoto, K.; Nakahara, K.; Shoun, H., J. Biol. Chem. 1995, 270, 1617-1623.
11. Enemark, J. H.; Feltham, R. D., Coord. Chem. Rev. 1974, 13, 339-406.
12. Obayashi, E.; Takahashi, S.; Shiro, Y., J. Am. Chem. Soc. 1998, 120, 12964-12965.
13. Lehnert, N.; Praneeth, V. K. K.; Paulat, F., J. Comp. Chem. 2006, 27, 1338-1351.
14. Riplinger, C.; Neese, F., Chem. Phys. Chem. 2011, 12, 3192-3203.
15. Hino, T.; Matsumoto, Y.; Nagano, S.; Sugimoto, Y.; Fukumori, Y.; Murata, T.; Iwata, S.; Shiro, Y., Science 2010, 330, 1666-1670.
16. Lehnert, N.; Berto, T. C.; Galinato, M. G. I.; Goodrich, L. E., The Role of Heme-Nitrosyls in the Biosynthesis, Transport, Sensing, and Detoxification of Nitric Oxide (NO) in Biological Systems: Enzymes and Model Complexes. In Handbook of Porphyrin Science, Kadish, K. M.; Smith, K.; Guilard, R., Eds. World Scientific: 2012; Vol. 15, pp 1-247.
17. Yi, J.; Morrow, B. H.; Campbell, A. L. O. C.; Shen, J. K.; Richter-Addo, G. B., Chem. Comm. 2012, 48, 9041-9043.
18. King, S. B.; Nagasawa, H. T., Methods Enzymol. 1998, 301, 211-221.
19. Sulc, F.; Immoos, C. E.; Pervitsky, D.; Farmer, P. J., J. Am. Chem. Soc. 2004, 126, 1096-1101.
20. Kumar, M. R.; Pervitsky, D.; Chen, L.; Poulos, T.; Kundu, S.; Hargrove, M. S.; Rivera, E. J.; Diaz, A.; Colon, J. L.; Farmer, P. J., Biochemistry 2009, 48, 5018-5025.
21. Immoos, C. E.; Sulc, F.; Farmer, P. J.; Czarnecki, K.; Bocian, D. F.; Levina, A.; Aitken, J. B.; Armstrong, R. S.; Lay, P., J. Am. Chem. Soc. 2005, 127, 814-815.
22. Lin, R.; Farmer, P. J., J. Am. Chem. Soc. 2000, 122, 2393-2394.
23. Lancon, D.; Kadish, K. M., J. Am. Chem. Soc. 1983, 105, 5610-5617.
24. Olson, L. W.; Schaeper, D.; Lancon, D.; Kadish, K. M., J. Am. Chem. Soc. 1982, 104, 2042-2044.
25. Choi, I. K.; Liu, Y.; Feng, D. W.; Paeng, K. J.; Ryan, M. D., Inorg. Chem. 1991, 30, 1832-1839.
142
26. Wei, Z.; Ryan, M. D., Inorg. Chem. 2010, 49, 6948-6954.
27. Pellegrino, J.; Bari, S. E.; Bikiel, D. E.; Doctorovich, F., J. Am. Chem. Soc. 2010, 132, 989-995.
28. Wyllie, G. R. A.; Scheidt, W. R., Chem. Rev. 2002, 102, 1067-1090.
29. Silvernail, N. J.; Olmstead, M. M.; Noll, B. C.; Scheidt, W. R., Inorg. Chem. 2009, 48, 971-977.
30. Scheidt, W. R.; Duval, H. F.; Neal, T. J.; Ellison, M. K., J. Am. Chem. Soc. 2000, 122.
31. Scheidt, W. R.; Frisse, M. E., J. Am. Chem. Soc. 1975, 97, 17-21.
32. Scheidt, W. R.; Barabanschikov, A.; Pavlik, J. W.; Silvernail, N. J.; Sage, J. T., Inorg. Chem. 2010, 49, 6240-6252.
33. Lehnert, N.; Galinato, M. G. I.; Paulat, F.; Richter-Addo, G. B.; Sturhahn, W.; Xu, N.; Zhao, J., Inorg. Chem. 2010, 49, 4133-4148.
34. Praneeth, V. K. K.; Nather, C.; Peters, G.; Lehnert, N., Inorg. Chem. 2006, 45, 2795-2811.
35. Praneeth, V. K. K.; Neese, F.; Lehnert, N., Inorg. Chem. 2005, 44, 2570-2572.
36. Paulat, F.; Berto, T. C.; DeBeer George, S.; Goodrich, L.; Praneeth, V. K. K.; Sulok, C. D.; Lehnert, N., Inorg. Chem. 2008, 47, 11449-11451.
37. Goodrich, L. E.; Paulat, F.; Praneeth, V. K. K.; Lehnert, N., Inorg. Chem. 2010, 49, 6293-6316.
38. Berto, T. C.; Praneeth, V. K. K.; Goodrich, L. E.; Lehnert, N., J. Am. Chem. Soc. 2009, 47, 17116-17126.
39. Rose, N. J.; Drago, R. S., J. Am. Chem. Soc. 1959, 81, 6138-6141.
40. Beugelskijk, T. J.; Drago, R. S., J. Am. Chem. Soc. 1975, 97, 6466-6472.
41. Collman, J. P.; Brauman, J. I.; Doxsee, K. M.; Halbert, T. R.; Hayes, S. E.; Suslick, K. S., J. Am. Chem. Soc. 1978, 100, 2761-2766.
42. Lehnert, N.; Sage, J. T.; Silvernail, N. J.; Scheidt, W. R.; Alp, E. E.; Sturhahn, W.; Zhao, J., Inorg. Chem. 2010, 49, 7197-7215.
43. Goodrich, L. E.; Lehnert, N., J. Inorg. Biochem. 2012, in press.
44. Traylor, T. G.; Sharma, V. S., Biochemistry 1992, 31, 2847-2849.
45. Boguslawski, K.; Jacob, C. R.; Reiher, M., J. Chem. Theory Comput. 2011, 2011, 2740-2752.
143
46. Radon, M.; Broclawik, E.; Pierloot, K., J. Phys. Chem. B 2010, 114, 1518-1528.
47. Radon, M.; Pierloot, K., J. Phys. Chem. A 2008, 112, 11824-11832.
48. Radoul, M.; Bykov, D.; Rinaldo, S.; Cutruzzola, F.; Neese, F.; Goldfarb, D., J. Am. Chem. Soc. 2011, 133, 3043-3055.
49. Radoul, M.; Sundararajan, M.; Potapov, A.; Riplinger, C.; Neese, F.; Goldfarb, D., Phys. Chem. Chem. Phys. 2010, 12, 7276-7289.
50. Zhang, Y.; Gossman, W.; Oldfield, E., J. Am. Chem. Soc. 2003, 125, 16387-16396.
51. Neese, F., J. Chem. Phys. 2001, 115, 11080-11096.
52. Siegbahn, P. E. M.; Bolmberg, M. R. A.; Chen, S. L., J. Chem. Theory Comput. 2010, 6, 2040-2044.
53. Patchkovskii, S.; Ziegler, T., Inorg. Chem. 2000, 39, 5354-5364.
54. Leu, B. M.; Silvernail, N. J.; Zgierski, M. Z.; Wyllie, G. R. A.; Ellison, M. K.; Scheidt, W. R.; Zhao, J.; Sturhahn, W.; Alp, E. E.; Sage, J. T., Biophys. J. 2007, 92, 3764-3783.
55. Barley, M. H.; Takeuchi, K. J.; Meyer, T. J., J. Am. Chem. Soc. 1986, 108, 5876-5885.
56. Barley, M. H.; Rhodes, M. R.; Meyer, T. J., Inorg. Chem. 1987, 26, 1746-1750.
57. Russell, J. A., J. Biol. Chem. 1944, 156, 457-462.
58. Choi, I. K.; Wei, Z.; Ryan, M. D., Inorg. Chem. 1997, 36, 3113-3118.
59. Bartberger, M. D.; Liu, W.; Ford, E.; Miranda, K. M.; Switzer, C.; Fukuto, J. M.; Farmer, P. J.; Wink, D. A.; Houk, K. N., Proc. Nat. Acad. Sci. USA 2002, 99, 10958-10963.
60. Quast, H.; Dietz, T.; Witzel, A., Liebigs. Ann. 1995, 1495-1501.
61. Ghiladi, R. A.; Kretzer, R. M.; Guzei, I.; Rheingold, A. L.; Neuhold, Y.-M.; Hatwell, K. R.; Zuberbuhler, A. D.; Karlin, K. D., Inorg. Chem. 2001, 40, 5754-5767.
62. Peters, M. V.; Stoll, R. S.; Goddard, R.; Buth, G.; Hecht, S., J. Org. Chem. 2006, 71, 7840-7845.
63. Rose, E.; Kossanyi, A.; Quelquejeu, M.; Soleilhavoup, M.; Duwavran, F.; Bernard, N.; Lecas, A., J. Am. Chem. Soc. 1996, 118, 1567-1568.
64. Lulinski, S.; Servatowski, J., J. Org. Chem. 2003, 68, 5384-5387.
65. Tohara, A.; Sugawara, Y.; Sato, M., J. Porphyrins Phthalocyanines 2006, 10, 104-116.

144
66. Adler, A. D.; Longo, F. R.; Kampas, F.; Kim, J., J. Inorg. Nucl. Chem. 1970, 32, 2443-2445.
67. Berto, T. C.; Hoffman, M. B.; Murata, Y.; Landenberger, K. B.; Alp, E. E.; Zhao, J.; Lehnert, N., J. Am. Chem. Soc. 2011, 133, 16714-16717.
68. Sage, J. T.; Paxson, C.; Wyllie, G. R. A.; Sturhahn, W.; Durbin, S. M.; Champion, P. M.; Alp, E. E.; Scheidt, W. R., J. Phys. Condens. Matter 2001, 13, 7707-7722.
69. Sturhahn, W., Hyperfine Interact. 2000, 125, 149-172.
70. Lin, X. Q.; Kadish, K. M., Anal. Chem. 1985, 57, 1498-1501.
71. Frisch, M. J.; Trucks, G. W.; Schlegel, H. B.; Scuseria, G. E.; Robb, M. A.; Cheeseman, J. R.; Montgomery, J., J. A.; Vreven, T.; Kudin, K. N.; Burant, J. C.; Millam, J. M.; Iyengar, S. S.; Tomasi, J.; Barone, V.; Mennucci, B.; Cossi, M.; Scalmani, G.; Rega, N.; Petersson, G. A.; Nakatsuji, H.; Hada, M.; Ehara, M.; Toyota, K.; Fukuda, R.; Hasegawa, J.; Ishida, M.; Nakajima, T.; Honda, Y.; Kitao, O.; Nakai, H.; Klene, M.; Li, X.; Knox, J. E.; Hratchian, H. P.; Cross, J. B.; Bakken, V.; Adamo, C.; Jaramillo, J.; Gomperts, R.; Stratmann, R. E.; Yazyev, O.; Ausin, A. J.; Cammi, R.; Pomelli, C.; Octerski, J. W.; Ayala, P. Y.; Morokuma, K.; Voth, G. A.; Salvador, P.; Dannenberg, J. J.; Zakrzewski, V. G.; Dapprich, S.; Daniels, A. D.; Strain, M. C.; Farkas, O.; Makick, D. K.; Rabuck, A. D.; Raghavachair, K.; Foresman, J. B.; Ortiz, J. V.; Cui, Q.; Baboul, A. G.; Clifford, S.; Cioslowski, J.; Stefanov, B. B.; Lui, G.; Laishenko, A.; Piskorz, R.; Komaromi, I.; Martin, R. L.; Fox, D. J.; Keith, T.; Al-Laham, M. A.; Peng, C. Y.; Nanayakkara, A.; Challacombe, M.; Gill, P. M. W.; Johnson, B.; Chen, W.; Wong, M. W.; Gonzalez, C.; Pople, J. A. Gaussin 03, Gaussian, Inc.: Pittsburgh, PA, 2003.
72. Perdew, J. P., Phys. Rev. B 1986, 33, 8822-8824.
73. Becke, A. D., Phys. Rev. A 1988, 38, 3098-3100.
74. Schaefer, A.; Horn, H.; Ahlrichs, R., J. Chem. Phys. 1992, 97, 2571-2577.
75. Schaefer, A.; Huber, C.; Ahlrichs, R., J. Chem. Phys. 1994, 100, 5829-5835.
76. Becke, A. D., J. Chem. Phys. 1993, 98, 1372-1377.
77. Becke, A. D., J. Chem. Phys. 1993, 98, 5648-5652.
78. Neese, F. ORCA, 2.2; Max-Planck Institut feur Bioanorganische Chemie: Meulheim/Ruhr, Germany, 2004.

145
Chapter 4
Investigations into the Active Species of P450nor:
Towards High-Valent Iron Porphyrin Complexes with N-Based Ligands
From enzyme studies on P450nor, it is known that NO reacts with the ferric
state of the enzyme to form a ferric heme-nitrosyl. This species is reduced by NADH
in the next step, resulting in a ferrous heme-nitroxyl (HNO) intermediate.1-2
DFT
predicts that this species (basic due to the presence of the cysteinate ligand) will be
easily protonated to form a formally Fe(IV)-NHOH complex.3 At this point, two
mechanistic pathways exist as illustrated in Scheme 4.1, either the ferryl species
reacts with a second equivalent of NO or this complex loses H2O to form a (formally)
Fe(VI)-nitride complex which in turn reacts with NO. The latter species is the
nitrogen analog of the highly oxidizing Fe(IV)=O complexes found in
monooxygenase cytochrome P450s. This leads to an important mechanistic
question: which complex is the actual catalyst—is it the Fe(IV)-NHOH or Fe(VI)-
Scheme 4.1. Two possible mechanistic pathways for N2O production by P450nor.
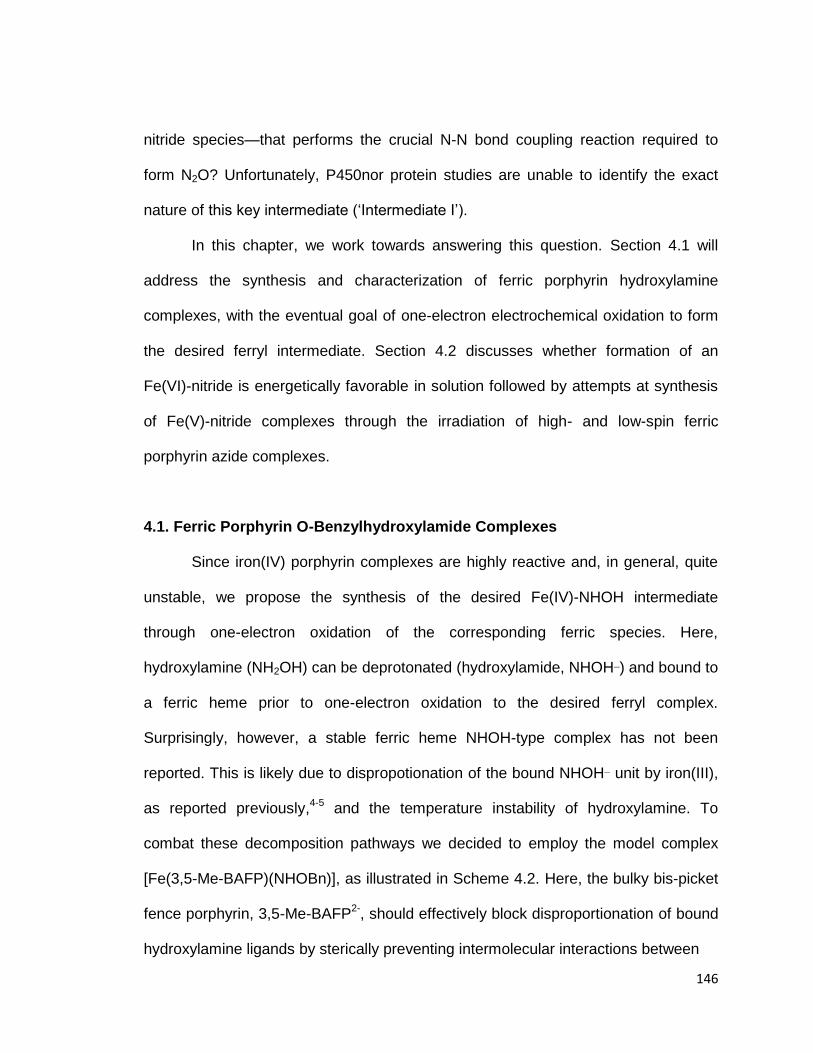
146
nitride species—that performs the crucial N-N bond coupling reaction required to
form N2O? Unfortunately, P450nor protein studies are unable to identify the exact
nature of this key intermediate (‘Intermediate I’).
In this chapter, we work towards answering this question. Section 4.1 will
address the synthesis and characterization of ferric porphyrin hydroxylamine
complexes, with the eventual goal of one-electron electrochemical oxidation to form
the desired ferryl intermediate. Section 4.2 discusses whether formation of an
Fe(VI)-nitride is energetically favorable in solution followed by attempts at synthesis
of Fe(V)-nitride complexes through the irradiation of high- and low-spin ferric
porphyrin azide complexes.
4.1. Ferric Porphyrin O-Benzylhydroxylamide Complexes
Since iron(IV) porphyrin complexes are highly reactive and, in general, quite
unstable, we propose the synthesis of the desired Fe(IV)-NHOH intermediate
through one-electron oxidation of the corresponding ferric species. Here,
hydroxylamine (NH2OH) can be deprotonated (hydroxylamide, NHOH¯) and bound to
a ferric heme prior to one-electron oxidation to the desired ferryl complex.
Surprisingly, however, a stable ferric heme NHOH-type complex has not been
reported. This is likely due to dispropotionation of the bound NHOH¯ unit by iron(III),
as reported previously,4-5
and the temperature instability of hydroxylamine. To
combat these decomposition pathways we decided to employ the model complex
[Fe(3,5-Me-BAFP)(NHOBn)], as illustrated in Scheme 4.2. Here, the bulky bis-picket
fence porphyrin, 3,5-Me-BAFP2-
, should effectively block disproportionation of bound
hydroxylamine ligands by sterically preventing intermolecular interactions between
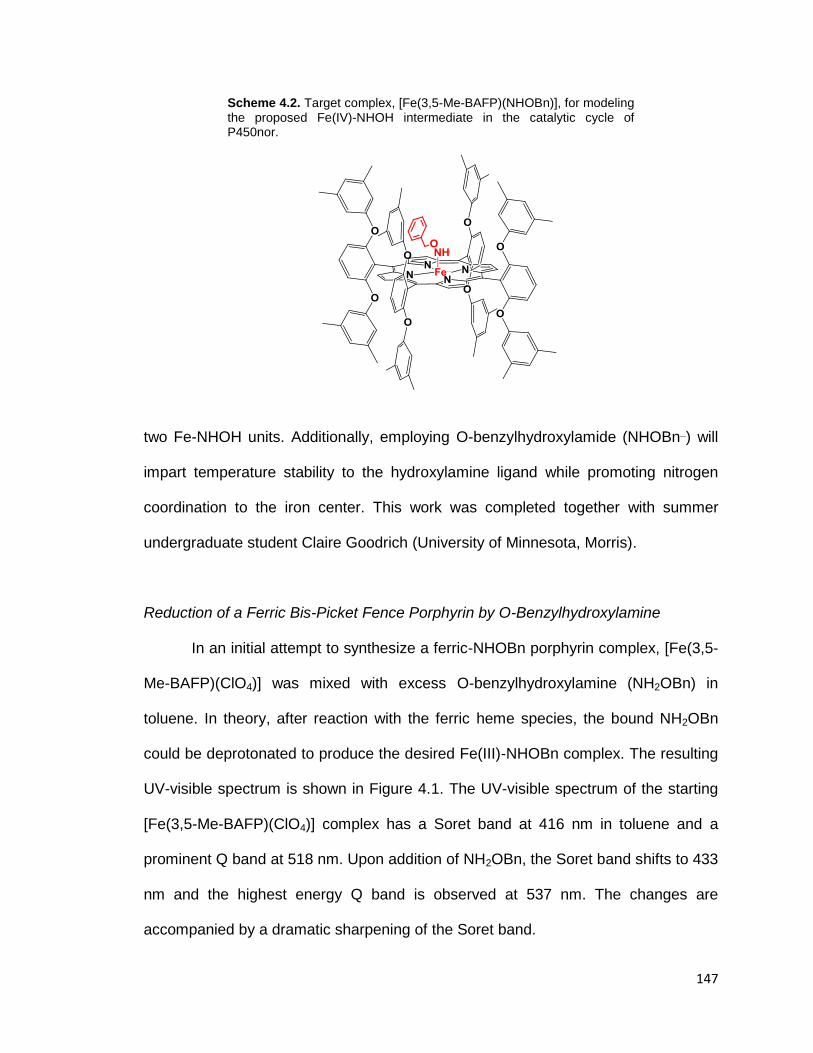
147
Scheme 4.2. Target complex, [Fe(3,5-Me-BAFP)(NHOBn)], for modeling the proposed Fe(IV)-NHOH intermediate in the catalytic cycle of P450nor.
two Fe-NHOH units. Additionally, employing O-benzylhydroxylamide (NHOBn¯) will
impart temperature stability to the hydroxylamine ligand while promoting nitrogen
coordination to the iron center. This work was completed together with summer
undergraduate student Claire Goodrich (University of Minnesota, Morris).
Reduction of a Ferric Bis-Picket Fence Porphyrin by O-Benzylhydroxylamine
In an initial attempt to synthesize a ferric-NHOBn porphyrin complex, [Fe(3,5-
Me-BAFP)(ClO4)] was mixed with excess O-benzylhydroxylamine (NH2OBn) in
toluene. In theory, after reaction with the ferric heme species, the bound NH2OBn
could be deprotonated to produce the desired Fe(III)-NHOBn complex. The resulting
UV-visible spectrum is shown in Figure 4.1. The UV-visible spectrum of the starting
[Fe(3,5-Me-BAFP)(ClO4)] complex has a Soret band at 416 nm in toluene and a
prominent Q band at 518 nm. Upon addition of NH2OBn, the Soret band shifts to 433
nm and the highest energy Q band is observed at 537 nm. The changes are
accompanied by a dramatic sharpening of the Soret band.
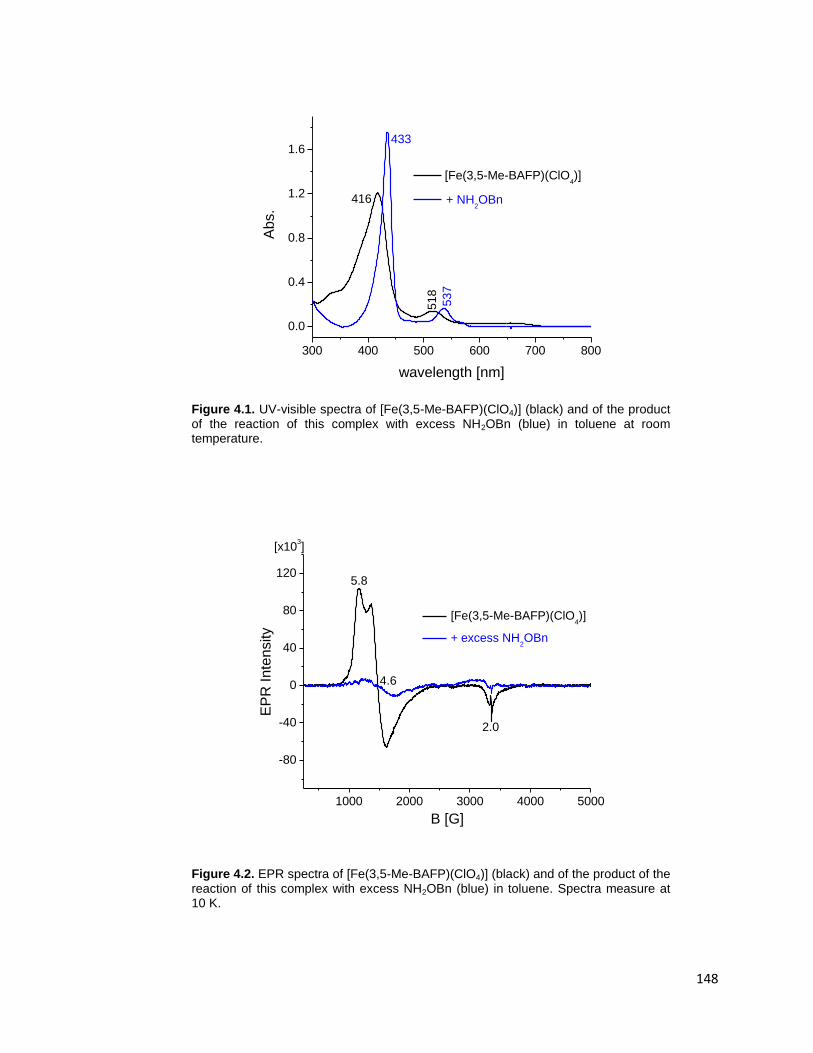
148
Figure 4.1. UV-visible spectra of [Fe(3,5-Me-BAFP)(ClO4)] (black) and of the product of the reaction of this complex with excess NH2OBn (blue) in toluene at room temperature.
Figure 4.2. EPR spectra of [Fe(3,5-Me-BAFP)(ClO4)] (black) and of the product of the reaction of this complex with excess NH2OBn (blue) in toluene. Spectra measure at 10 K.
300 400 500 600 700 800
0.0
0.4
0.8
1.2
1.6
416
53
7
Ab
s.
wavelength [nm]
[Fe(3,5-Me-BAFP)(ClO4)]
+ NH2OBn
433
51
8
1000 2000 3000 4000 5000
-80
-40
0
40
80
120
EP
R I
nte
nsity
B [G]
[Fe(3,5-Me-BAFP)(ClO4)]
+ excess NH2OBn
[x103]
5.8
4.6
2.0
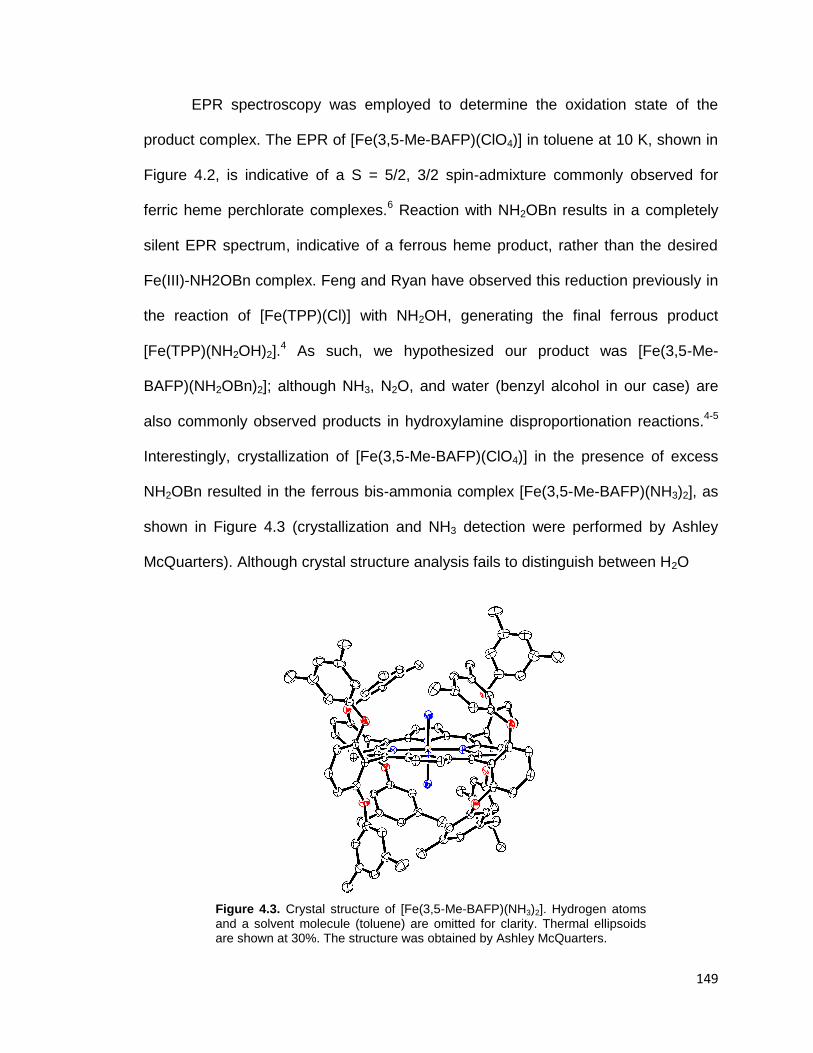
149
EPR spectroscopy was employed to determine the oxidation state of the
product complex. The EPR of [Fe(3,5-Me-BAFP)(ClO4)] in toluene at 10 K, shown in
Figure 4.2, is indicative of a S = 5/2, 3/2 spin-admixture commonly observed for
ferric heme perchlorate complexes.6 Reaction with NH2OBn results in a completely
silent EPR spectrum, indicative of a ferrous heme product, rather than the desired
Fe(III)-NH2OBn complex. Feng and Ryan have observed this reduction previously in
the reaction of [Fe(TPP)(Cl)] with NH2OH, generating the final ferrous product
[Fe(TPP)(NH2OH)2].4 As such, we hypothesized our product was [Fe(3,5-Me-
BAFP)(NH2OBn)2]; although NH3, N2O, and water (benzyl alcohol in our case) are
also commonly observed products in hydroxylamine disproportionation reactions.4-5
Interestingly, crystallization of [Fe(3,5-Me-BAFP)(ClO4)] in the presence of excess
NH2OBn resulted in the ferrous bis-ammonia complex [Fe(3,5-Me-BAFP)(NH3)2], as
shown in Figure 4.3 (crystallization and NH3 detection were performed by Ashley
McQuarters). Although crystal structure analysis fails to distinguish between H2O
Figure 4.3. Crystal structure of [Fe(3,5-Me-BAFP)(NH3)2]. Hydrogen atoms and a solvent molecule (toluene) are omitted for clarity. Thermal ellipsoids are shown at 30%. The structure was obtained by Ashley McQuarters.
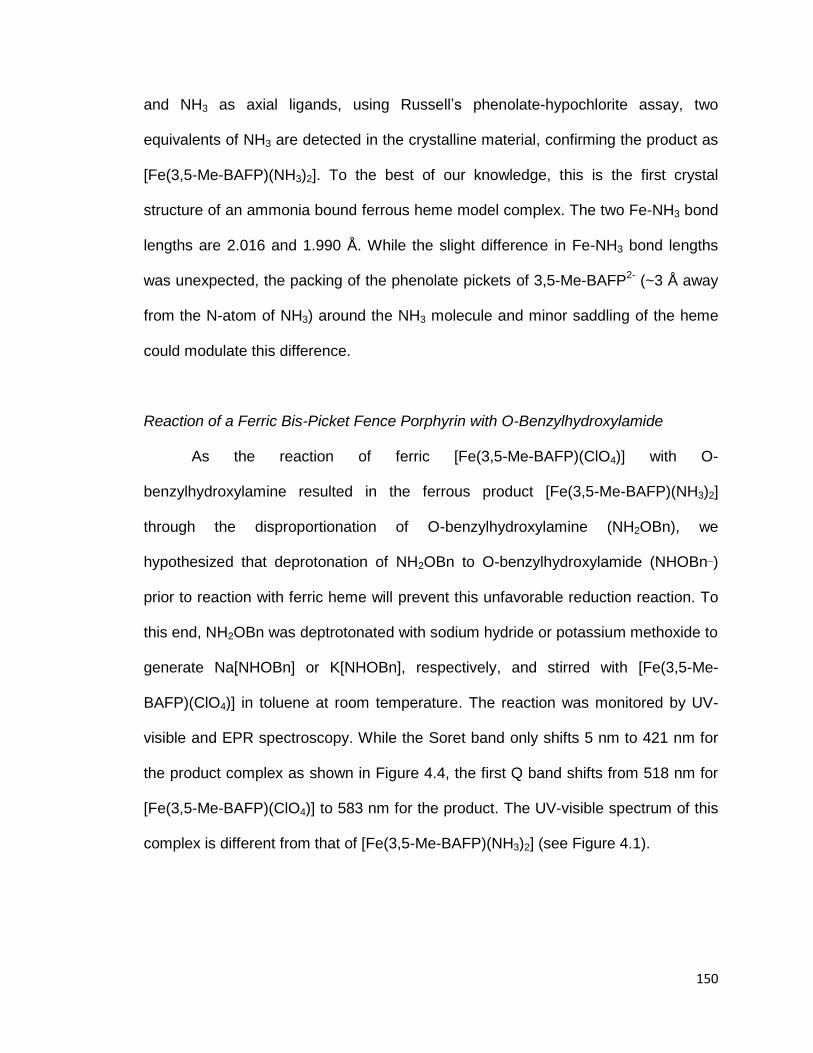
150
and NH3 as axial ligands, using Russell’s phenolate-hypochlorite assay, two
equivalents of NH3 are detected in the crystalline material, confirming the product as
[Fe(3,5-Me-BAFP)(NH3)2]. To the best of our knowledge, this is the first crystal
structure of an ammonia bound ferrous heme model complex. The two Fe-NH3 bond
lengths are 2.016 and 1.990 Å. While the slight difference in Fe-NH3 bond lengths
was unexpected, the packing of the phenolate pickets of 3,5-Me-BAFP2-
(~3 Å away
from the N-atom of NH3) around the NH3 molecule and minor saddling of the heme
could modulate this difference.
Reaction of a Ferric Bis-Picket Fence Porphyrin with O-Benzylhydroxylamide
As the reaction of ferric [Fe(3,5-Me-BAFP)(ClO4)] with O-
benzylhydroxylamine resulted in the ferrous product [Fe(3,5-Me-BAFP)(NH3)2]
through the disproportionation of O-benzylhydroxylamine (NH2OBn), we
hypothesized that deprotonation of NH2OBn to O-benzylhydroxylamide (NHOBn¯)
prior to reaction with ferric heme will prevent this unfavorable reduction reaction. To
this end, NH2OBn was deptrotonated with sodium hydride or potassium methoxide to
generate Na[NHOBn] or K[NHOBn], respectively, and stirred with [Fe(3,5-Me-
BAFP)(ClO4)] in toluene at room temperature. The reaction was monitored by UV-
visible and EPR spectroscopy. While the Soret band only shifts 5 nm to 421 nm for
the product complex as shown in Figure 4.4, the first Q band shifts from 518 nm for
[Fe(3,5-Me-BAFP)(ClO4)] to 583 nm for the product. The UV-visible spectrum of this
complex is different from that of [Fe(3,5-Me-BAFP)(NH3)2] (see Figure 4.1).
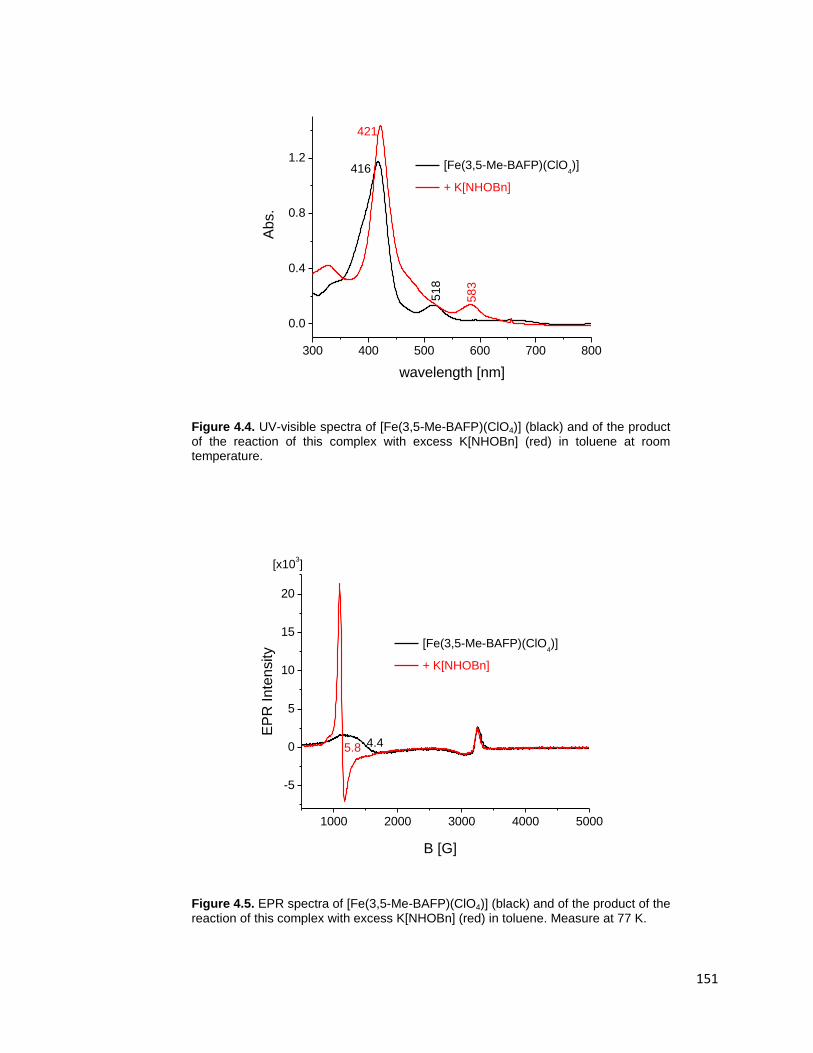
151
Figure 4.4. UV-visible spectra of [Fe(3,5-Me-BAFP)(ClO4)] (black) and of the product of the reaction of this complex with excess K[NHOBn] (red) in toluene at room temperature.
Figure 4.5. EPR spectra of [Fe(3,5-Me-BAFP)(ClO4)] (black) and of the product of the reaction of this complex with excess K[NHOBn] (red) in toluene. Measure at 77 K.
300 400 500 600 700 800
0.0
0.4
0.8
1.2
51
8
58
3
416 [Fe(3,5-Me-BAFP)(ClO4)]
+ K[NHOBn]
Ab
s.
wavelength [nm]
421
1000 2000 3000 4000 5000
-5
0
5
10
15
20
B [G]
[Fe(3,5-Me-BAFP)(ClO4)]
+ K[NHOBn]
EP
R I
nte
nsity
[x103]
5.8 4.4
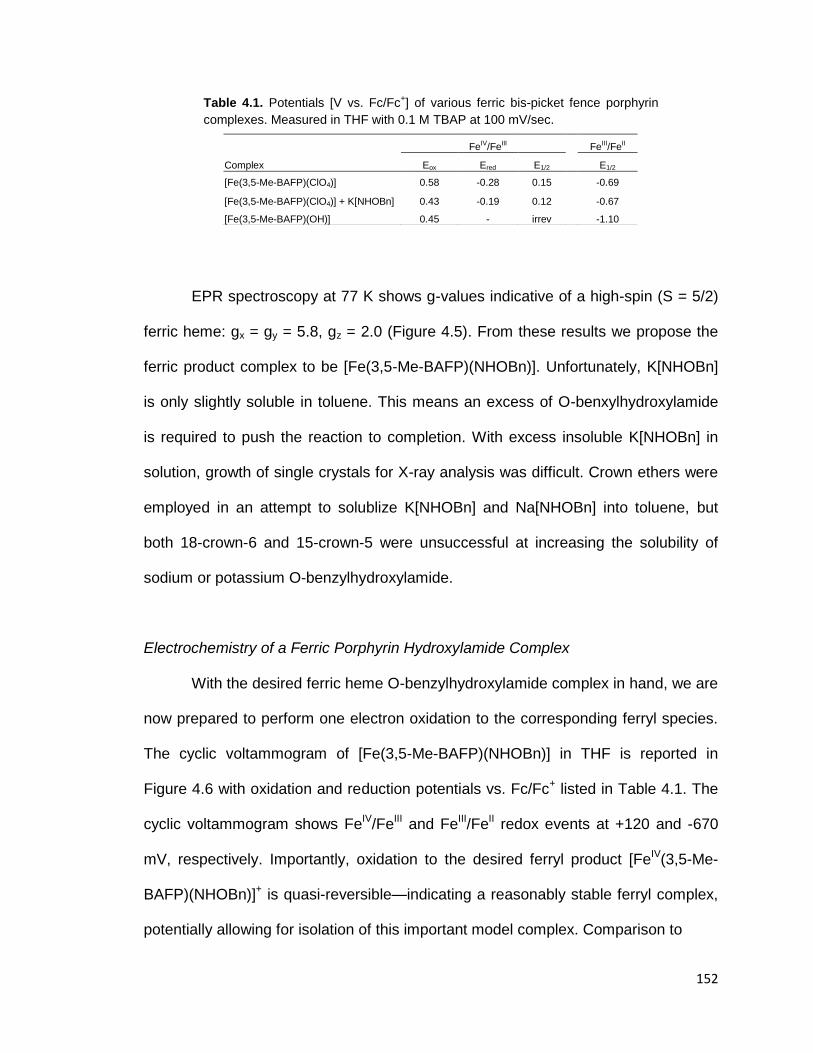
152
Table 4.1. Potentials [V vs. Fc/Fc+] of various ferric bis-picket fence porphyrin
complexes. Measured in THF with 0.1 M TBAP at 100 mV/sec.
EPR spectroscopy at 77 K shows g-values indicative of a high-spin (S = 5/2)
ferric heme: gx = gy = 5.8, gz = 2.0 (Figure 4.5). From these results we propose the
ferric product complex to be [Fe(3,5-Me-BAFP)(NHOBn)]. Unfortunately, K[NHOBn]
is only slightly soluble in toluene. This means an excess of O-benxylhydroxylamide
is required to push the reaction to completion. With excess insoluble K[NHOBn] in
solution, growth of single crystals for X-ray analysis was difficult. Crown ethers were
employed in an attempt to solublize K[NHOBn] and Na[NHOBn] into toluene, but
both 18-crown-6 and 15-crown-5 were unsuccessful at increasing the solubility of
sodium or potassium O-benzylhydroxylamide.
Electrochemistry of a Ferric Porphyrin Hydroxylamide Complex
With the desired ferric heme O-benzylhydroxylamide complex in hand, we are
now prepared to perform one electron oxidation to the corresponding ferryl species.
The cyclic voltammogram of [Fe(3,5-Me-BAFP)(NHOBn)] in THF is reported in
Figure 4.6 with oxidation and reduction potentials vs. Fc/Fc+ listed in Table 4.1. The
cyclic voltammogram shows FeIV
/FeIII and Fe
III/Fe
II redox events at +120 and -670
mV, respectively. Importantly, oxidation to the desired ferryl product [FeIV
(3,5-Me-
BAFP)(NHOBn)]+ is quasi-reversible—indicating a reasonably stable ferryl complex,
potentially allowing for isolation of this important model complex. Comparison to
FeIV/FeIII
FeIII/FeII
Complex Eox Ered E1/2
E1/2
[Fe(3,5-Me-BAFP)(ClO4)] 0.58 -0.28 0.15
-0.69
[Fe(3,5-Me-BAFP)(ClO4)] + K[NHOBn] 0.43 -0.19 0.12
-0.67
[Fe(3,5-Me-BAFP)(OH)] 0.45 - irrev
-1.10
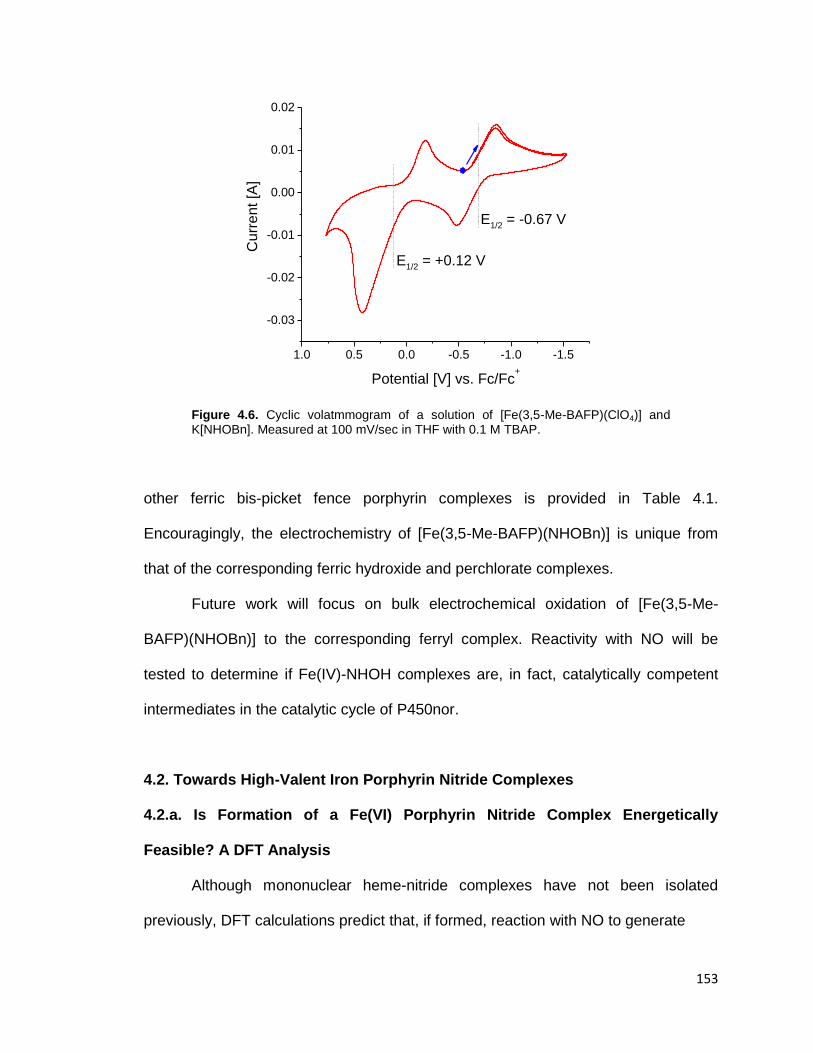
153
Figure 4.6. Cyclic volatmmogram of a solution of [Fe(3,5-Me-BAFP)(ClO4)] and K[NHOBn]. Measured at 100 mV/sec in THF with 0.1 M TBAP.
other ferric bis-picket fence porphyrin complexes is provided in Table 4.1.
Encouragingly, the electrochemistry of [Fe(3,5-Me-BAFP)(NHOBn)] is unique from
that of the corresponding ferric hydroxide and perchlorate complexes.
Future work will focus on bulk electrochemical oxidation of [Fe(3,5-Me-
BAFP)(NHOBn)] to the corresponding ferryl complex. Reactivity with NO will be
tested to determine if Fe(IV)-NHOH complexes are, in fact, catalytically competent
intermediates in the catalytic cycle of P450nor.
4.2. Towards High-Valent Iron Porphyrin Nitride Complexes
4.2.a. Is Formation of a Fe(VI) Porphyrin Nitride Complex Energetically
Feasible? A DFT Analysis
Although mononuclear heme-nitride complexes have not been isolated
previously, DFT calculations predict that, if formed, reaction with NO to generate
1.0 0.5 0.0 -0.5 -1.0 -1.5
-0.03
-0.02
-0.01
0.00
0.01
0.02
Cu
rre
nt
[A]
Potential [V] vs. Fc/Fc+
E1/2
= -0.67 V
E1/2
= +0.12 V
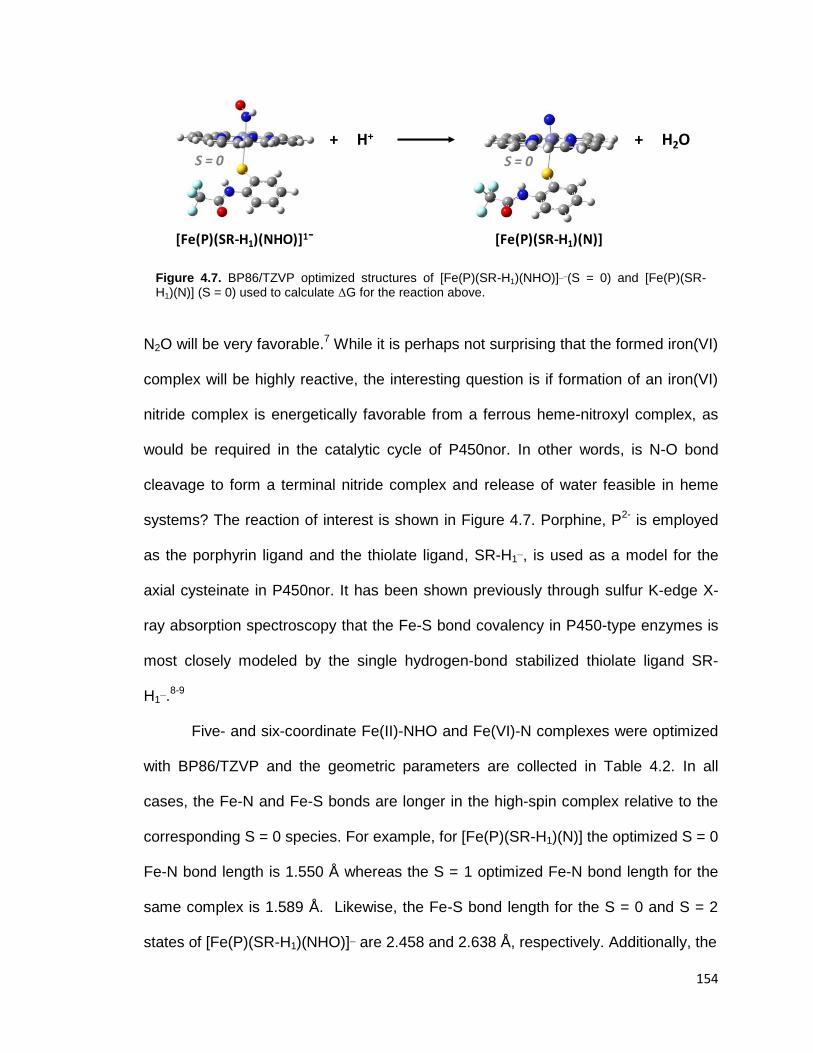
154
Figure 4.7. BP86/TZVP optimized structures of [Fe(P)(SR-H1)(NHO)]¯(S = 0) and [Fe(P)(SR-H1)(N)] (S = 0) used to calculate ΔG for the reaction above.
N2O will be very favorable.7 While it is perhaps not surprising that the formed iron(VI)
complex will be highly reactive, the interesting question is if formation of an iron(VI)
nitride complex is energetically favorable from a ferrous heme-nitroxyl complex, as
would be required in the catalytic cycle of P450nor. In other words, is N-O bond
cleavage to form a terminal nitride complex and release of water feasible in heme
systems? The reaction of interest is shown in Figure 4.7. Porphine, P2-
is employed
as the porphyrin ligand and the thiolate ligand, SR-H1¯, is used as a model for the
axial cysteinate in P450nor. It has been shown previously through sulfur K-edge X-
ray absorption spectroscopy that the Fe-S bond covalency in P450-type enzymes is
most closely modeled by the single hydrogen-bond stabilized thiolate ligand SR-
H1¯.8-9
Five- and six-coordinate Fe(II)-NHO and Fe(VI)-N complexes were optimized
with BP86/TZVP and the geometric parameters are collected in Table 4.2. In all
cases, the Fe-N and Fe-S bonds are longer in the high-spin complex relative to the
corresponding S = 0 species. For example, for [Fe(P)(SR-H1)(N)] the optimized S = 0
Fe-N bond length is 1.550 Å whereas the S = 1 optimized Fe-N bond length for the
same complex is 1.589 Å. Likewise, the Fe-S bond length for the S = 0 and S = 2
states of [Fe(P)(SR-H1)(NHO)]¯ are 2.458 and 2.638 Å, respectively. Additionally, the
+ H+ + H2OS = 0 S = 0
[Fe(P)(SR-H1)(NHO)]1¯ [Fe(P)(SR-H1)(N)]
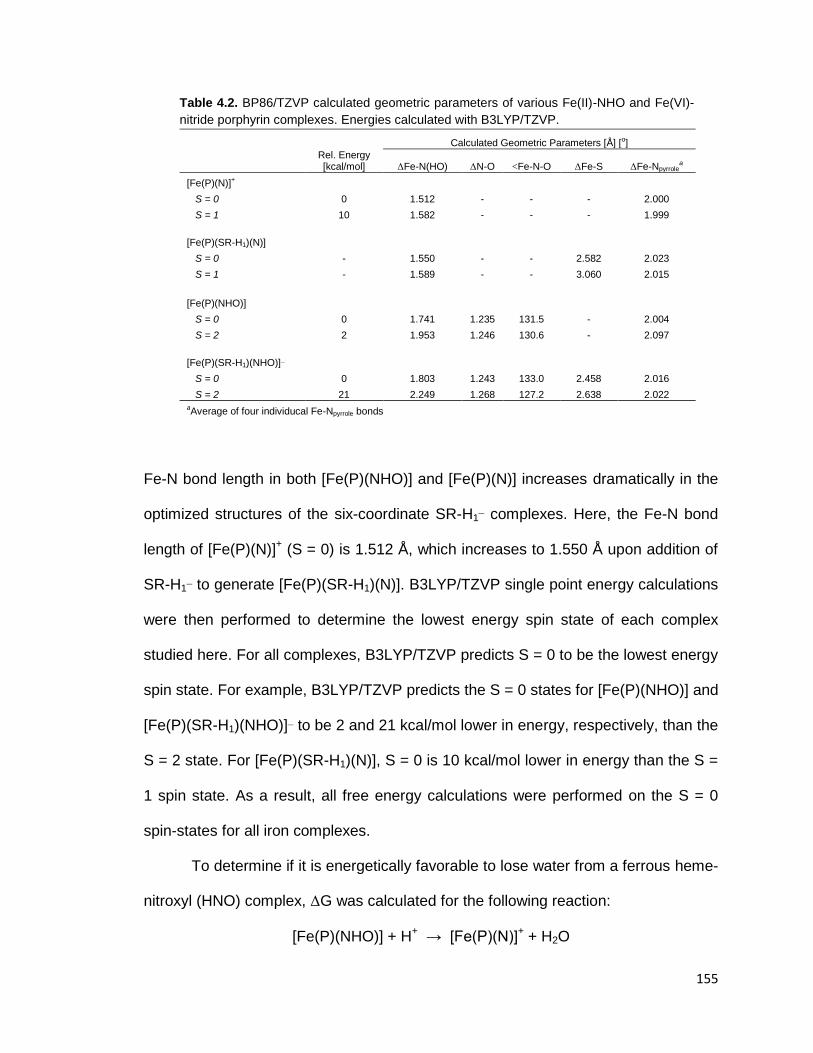
155
Table 4.2. BP86/TZVP calculated geometric parameters of various Fe(II)-NHO and Fe(VI)-
nitride porphyrin complexes. Energies calculated with B3LYP/TZVP.
Calculated Geometric Parameters [Å] [o]
Rel. Energy [kcal/mol] ΔFe-N(HO) ΔN-O <Fe-N-O ΔFe-S ΔFe-Npyrrole
a
[Fe(P)(N)]+ S = 0 0 1.512 - - - 2.000
S = 1 10 1.582 - - - 1.999
[Fe(P)(SR-H1)(N)] S = 0 - 1.550 - - 2.582 2.023
S = 1 - 1.589 - - 3.060 2.015
[Fe(P)(NHO)] S = 0 0 1.741 1.235 131.5 - 2.004
S = 2 2 1.953 1.246 130.6 - 2.097
[Fe(P)(SR-H1)(NHO)]¯ S = 0 0 1.803 1.243 133.0 2.458 2.016
S = 2 21 2.249 1.268 127.2 2.638 2.022
aAverage of four individucal Fe-Npyrrole bonds
Fe-N bond length in both [Fe(P)(NHO)] and [Fe(P)(N)] increases dramatically in the
optimized structures of the six-coordinate SR-H1¯ complexes. Here, the Fe-N bond
length of [Fe(P)(N)]+ (S = 0) is 1.512 Å, which increases to 1.550 Å upon addition of
SR-H1¯ to generate [Fe(P)(SR-H1)(N)]. B3LYP/TZVP single point energy calculations
were then performed to determine the lowest energy spin state of each complex
studied here. For all complexes, B3LYP/TZVP predicts S = 0 to be the lowest energy
spin state. For example, B3LYP/TZVP predicts the S = 0 states for [Fe(P)(NHO)] and
[Fe(P)(SR-H1)(NHO)]¯ to be 2 and 21 kcal/mol lower in energy, respectively, than the
S = 2 state. For [Fe(P)(SR-H1)(N)], S = 0 is 10 kcal/mol lower in energy than the S =
1 spin state. As a result, all free energy calculations were performed on the S = 0
spin-states for all iron complexes.
To determine if it is energetically favorable to lose water from a ferrous heme-
nitroxyl (HNO) complex, ΔG was calculated for the following reaction:
[Fe(P)(NHO)] + H+ → [Fe(P)(N)]
+ + H2O

156
Table 4.3. B3LYP/TZVP calculated free energies (ΔG) for reaction of
five- (without SR-H1¯) and six-coordinate [Fe(P)(SR-H1)(NHO)]¯ + H+ →
[Fe(P)(SR-H1)(N)] + H2O at 298.15 K in toluene.
However, calculation of the energy of a free proton, H+, is problematic. For this
reason, the weak acids phenol and 2,6-lutitidium were used in these DFT
calculations. Then, to balance the equation, phenolate or 2,6-lutidine is also included
as a product. The free energy was calculated in toluene using a polarizable
continuum model (PCM) available in Gaussian 03. ΔG for this reaction was also
calculated for the corresponding six-coordinate thiolate complexes, [Fe(P)(SR-
H1)(NHO)]¯ and [Fe(P)(SR-H1)(N)], as illustrated in Figure 4.7. Calculated free
energies are reported in Table 4.3. Interestingly, if phenol is used as the proton
source, ΔG for the reaction of the five-coordinate (without SR-H1¯) and six-coordinate
(with SR-H1¯) complexes is highly unfavorable at 79.7 and 49.8 kcal/mol,
respectively. Interestingly, addition of the thiolate ligand SR-H1¯ decreases ΔG for
the reaction by 30 kcal/mol. As this reaction should be driven by acid strength, ΔG
was recalculated using the moderately stronger acid 2,6-lutidinium. In this case, ΔG
for the reaction of [Fe(P)(NHO)] with 2,6-lutidinium to form [Fe(P)(N)]+ and water is
24.4 kcal/mol—still highly unfavorable, but 25 kcal/mol less endothermic than with
phenol. When 2,6-lutidium is used as a the proton source and the thiolate ligand SR-
H1¯ is applied, the calculated ΔG is now -5.6 kcal/mol as listed in Table 4.3. This
indicates that with thiolate coordination, as is present in P450nor, it could be
energetically feasible to generate a iron(VI) porphyrin nitride complex via release of
H+ Source (pKa) coordination
number ΔG
[kcal/mol]
Phenol (10) 5 79.7
6 49.8
2,6-lutidinium (5) 5 24.4
6 -5.6
157
water. Additionally, in the presence of an even stronger acid, this reaction may be
favorable for both five- or six-coordinate ferrous nitroxyl (HNO) complexes. It is
important to note, however, that there is no experimental evidence to support the
formation of an Fe(VI)-nitride complex in the catalytic cycle of cytochrome P450nor.
In particular, the Fe-N stretching frequency of intermediate I has been observed at
596 cm-1
, which is incompatible with an Fe(VI)-nitride intermediate.10
4.2.b. Photochemistry of Ferric Bis-Picket Fence Porphyrin Azide Complexes
High-valent non-heme iron nitride complexes are commonly prepared through
one of two methods (1) N-atom transfer from an organic donor11-12
or (2) through
photolysis of azide (N3) complexes.13-15
In the latter method, irradiation of azide
causes cleavage of a N-N bond, driving off N2 yielding a terminal nitride at the iron
center. Mononuclear heme-nitride complexes, however, have not been reported in
the literature. The main reason is that they dimerize upon formation. For example,
upon irradiation (or thermal decomposition) of [Fe(TPP)(N3)], the resulting product is
a Fe(III)-Fe(IV) μ-nitride complex, [(Fe(TPP))2N].16
We propose synthesis of an iron(V) porphyrin nitride species through
irradiation of the high-spin ferric bis-picket fence porphyrin azide complex, [Fe(3,5-
Me-BAFP)(N3)], as illustrated in Scheme 4.3 (left). The steric bulk provided by 3,5-
Me-BAFP2-
should prevent formation of a bridging nitride complex. Additionally,
Neese and co-workers have proposed that formation of iron nitride complexes is
possible only in corresponding low-spin iron complexes.17
To this end, the porphyrin
Im-BAFP2-
ligand and the corresponding low-spin ferric azide complex, [Fe(Im-
BAFP)(N3)] (Scheme 4.3, right) have been prepared.

158
Scheme 4.3. [Fe(3,5-Me-BAFP)(N3)] (left) and [Fe(Im-BAFP)(N3)] (right).
Characterization of Five- and Six-Coordinate Ferric Heme Azide Complexes
The five-coordinate ferric heme azide complex, [Fe(3,5-Me-BAFP)(N3)] is
prepared by stirring [Fe(3,5-Me-BAFP)(Cl)] in toluene with aqueous sodium azide.
Interestingly, the UV-visible spectrum of [Fe(3,5-Me-BAFP)(N3)] is similar to that of
[Fe(3,5-Me-BAFP)(Cl)] in CH2Cl2 (Figure 4.8) with the exception of the highest
energy feature at ~370 nm. In [Fe(3,5-Me-BAFP)(Cl)], the highest energy absorption
Figure 4.8. UV-visible spectra of [Fe(3,5-Me-BAFP)(Cl)] and [Fe(3,5-Me-BAFP)(N3)] in CH2Cl2.
400 500 600 700 800
0.0
0.2
0.4
0.6
0.8
1.0
Ab
s.
wavelength [nm]
[Fe(3,5-Me-BAFP)(Cl)]
[Fe(3,5-Me-BAFP)(N3)]
424
37
53
58
51
2
65
7
58
9
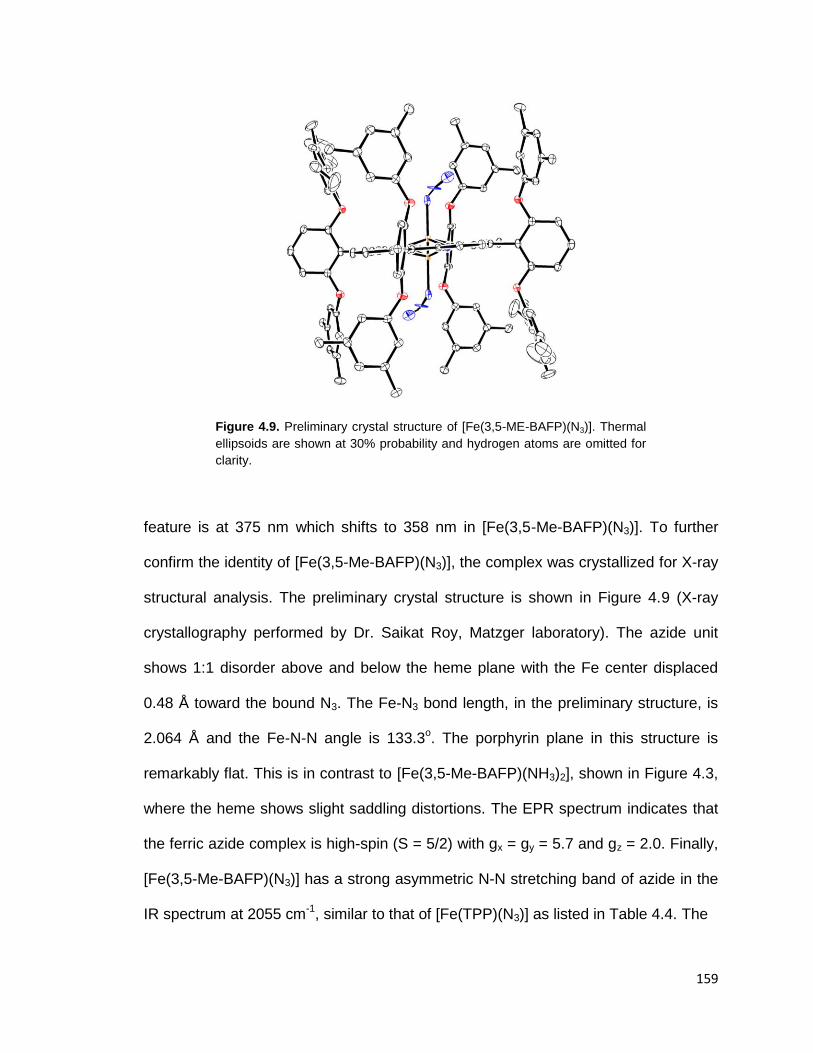
159
Figure 4.9. Preliminary crystal structure of [Fe(3,5-ME-BAFP)(N3)]. Thermal
ellipsoids are shown at 30% probability and hydrogen atoms are omitted for
clarity.
feature is at 375 nm which shifts to 358 nm in [Fe(3,5-Me-BAFP)(N3)]. To further
confirm the identity of [Fe(3,5-Me-BAFP)(N3)], the complex was crystallized for X-ray
structural analysis. The preliminary crystal structure is shown in Figure 4.9 (X-ray
crystallography performed by Dr. Saikat Roy, Matzger laboratory). The azide unit
shows 1:1 disorder above and below the heme plane with the Fe center displaced
0.48 Å toward the bound N3. The Fe-N3 bond length, in the preliminary structure, is
2.064 Å and the Fe-N-N angle is 133.3o. The porphyrin plane in this structure is
remarkably flat. This is in contrast to [Fe(3,5-Me-BAFP)(NH3)2], shown in Figure 4.3,
where the heme shows slight saddling distortions. The EPR spectrum indicates that
the ferric azide complex is high-spin (S = 5/2) with gx = gy = 5.7 and gz = 2.0. Finally,
[Fe(3,5-Me-BAFP)(N3)] has a strong asymmetric N-N stretching band of azide in the
IR spectrum at 2055 cm-1
, similar to that of [Fe(TPP)(N3)] as listed in Table 4.4. The
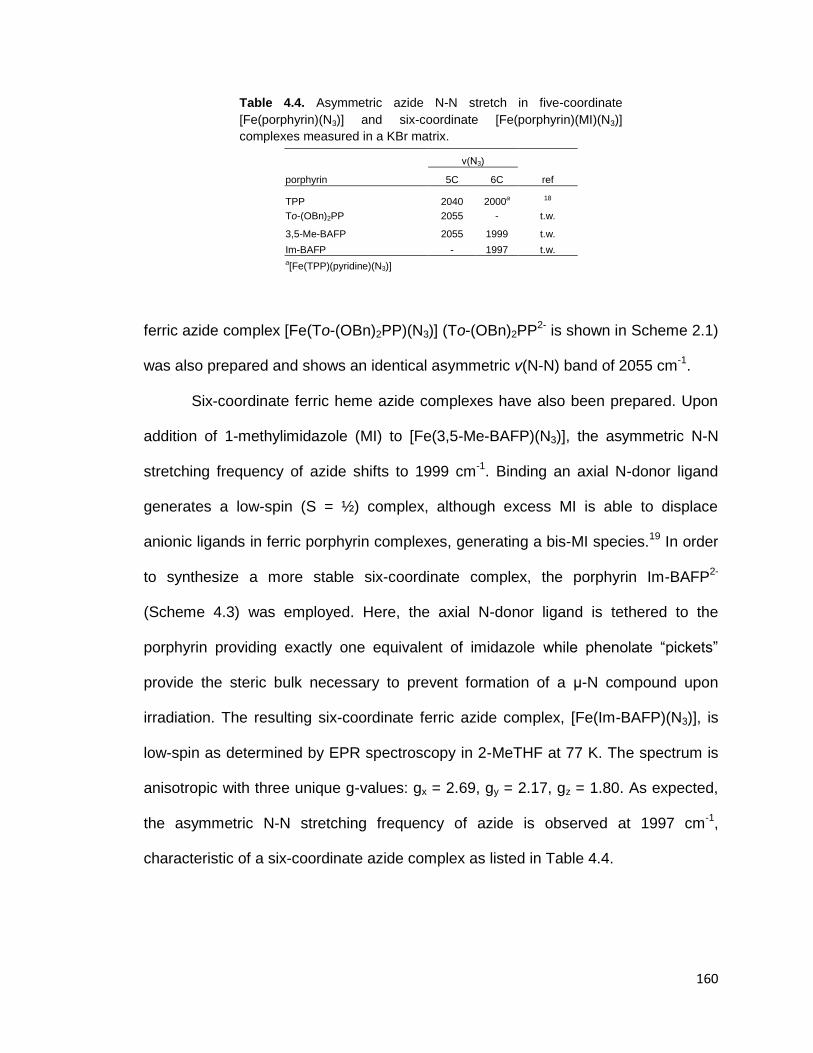
160
Table 4.4. Asymmetric azide N-N stretch in five-coordinate
[Fe(porphyrin)(N3)] and six-coordinate [Fe(porphyrin)(MI)(N3)]
complexes measured in a KBr matrix.
ferric azide complex [Fe(To-(OBn)2PP)(N3)] (To-(OBn)2PP2-
is shown in Scheme 2.1)
was also prepared and shows an identical asymmetric v(N-N) band of 2055 cm-1
.
Six-coordinate ferric heme azide complexes have also been prepared. Upon
addition of 1-methylimidazole (MI) to [Fe(3,5-Me-BAFP)(N3)], the asymmetric N-N
stretching frequency of azide shifts to 1999 cm-1
. Binding an axial N-donor ligand
generates a low-spin (S = ½) complex, although excess MI is able to displace
anionic ligands in ferric porphyrin complexes, generating a bis-MI species.19
In order
to synthesize a more stable six-coordinate complex, the porphyrin Im-BAFP2-
(Scheme 4.3) was employed. Here, the axial N-donor ligand is tethered to the
porphyrin providing exactly one equivalent of imidazole while phenolate “pickets”
provide the steric bulk necessary to prevent formation of a μ-N compound upon
irradiation. The resulting six-coordinate ferric azide complex, [Fe(Im-BAFP)(N3)], is
low-spin as determined by EPR spectroscopy in 2-MeTHF at 77 K. The spectrum is
anisotropic with three unique g-values: gx = 2.69, gy = 2.17, gz = 1.80. As expected,
the asymmetric N-N stretching frequency of azide is observed at 1997 cm-1
,
characteristic of a six-coordinate azide complex as listed in Table 4.4.
ν(N3)
porphyrin 5C 6C ref
TPP 2040 2000a 18
To-(OBn)2PP 2055 - t.w.
3,5-Me-BAFP 2055 1999 t.w.
Im-BAFP - 1997 t.w. a[Fe(TPP)(pyridine)(N3)]
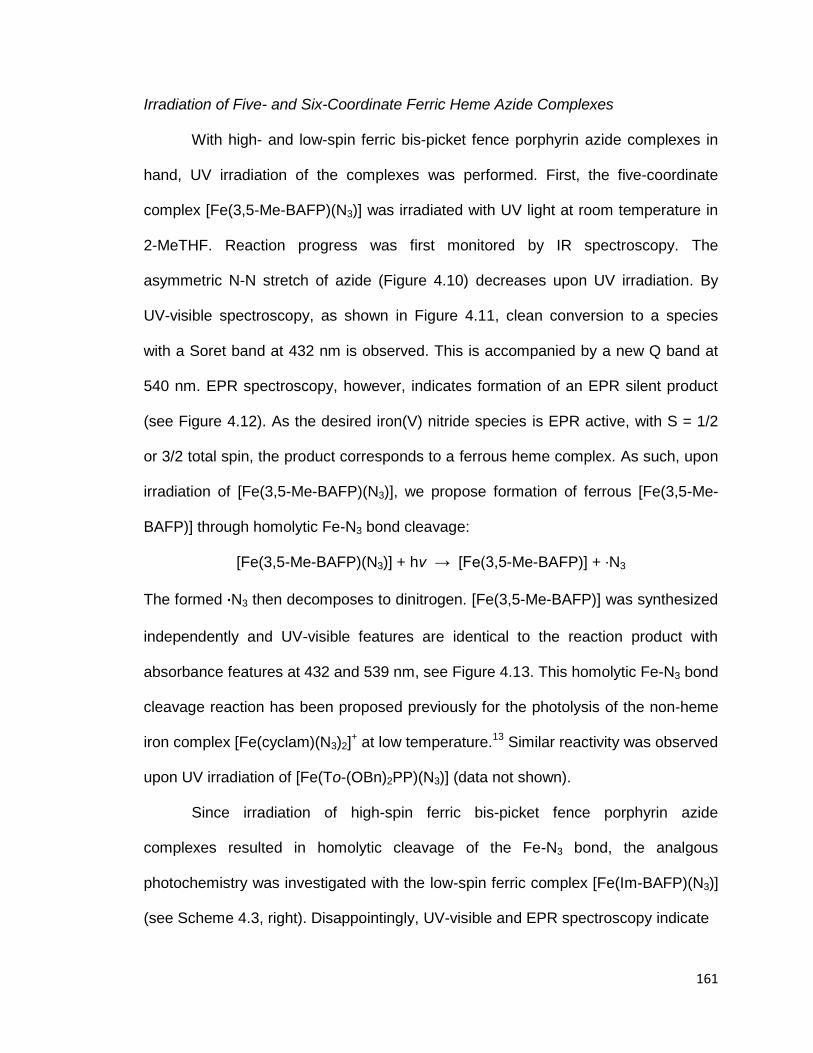
161
Irradiation of Five- and Six-Coordinate Ferric Heme Azide Complexes
With high- and low-spin ferric bis-picket fence porphyrin azide complexes in
hand, UV irradiation of the complexes was performed. First, the five-coordinate
complex [Fe(3,5-Me-BAFP)(N3)] was irradiated with UV light at room temperature in
2-MeTHF. Reaction progress was first monitored by IR spectroscopy. The
asymmetric N-N stretch of azide (Figure 4.10) decreases upon UV irradiation. By
UV-visible spectroscopy, as shown in Figure 4.11, clean conversion to a species
with a Soret band at 432 nm is observed. This is accompanied by a new Q band at
540 nm. EPR spectroscopy, however, indicates formation of an EPR silent product
(see Figure 4.12). As the desired iron(V) nitride species is EPR active, with S = 1/2
or 3/2 total spin, the product corresponds to a ferrous heme complex. As such, upon
irradiation of [Fe(3,5-Me-BAFP)(N3)], we propose formation of ferrous [Fe(3,5-Me-
BAFP)] through homolytic Fe-N3 bond cleavage:
[Fe(3,5-Me-BAFP)(N3)] + hν → [Fe(3,5-Me-BAFP)] + ·N3
The formed ·N3 then decomposes to dinitrogen. [Fe(3,5-Me-BAFP)] was synthesized
independently and UV-visible features are identical to the reaction product with
absorbance features at 432 and 539 nm, see Figure 4.13. This homolytic Fe-N3 bond
cleavage reaction has been proposed previously for the photolysis of the non-heme
iron complex [Fe(cyclam)(N3)2]+ at low temperature.
13 Similar reactivity was observed
upon UV irradiation of [Fe(To-(OBn)2PP)(N3)] (data not shown).
Since irradiation of high-spin ferric bis-picket fence porphyrin azide
complexes resulted in homolytic cleavage of the Fe-N3 bond, the analgous
photochemistry was investigated with the low-spin ferric complex [Fe(Im-BAFP)(N3)]
(see Scheme 4.3, right). Disappointingly, UV-visible and EPR spectroscopy indicate
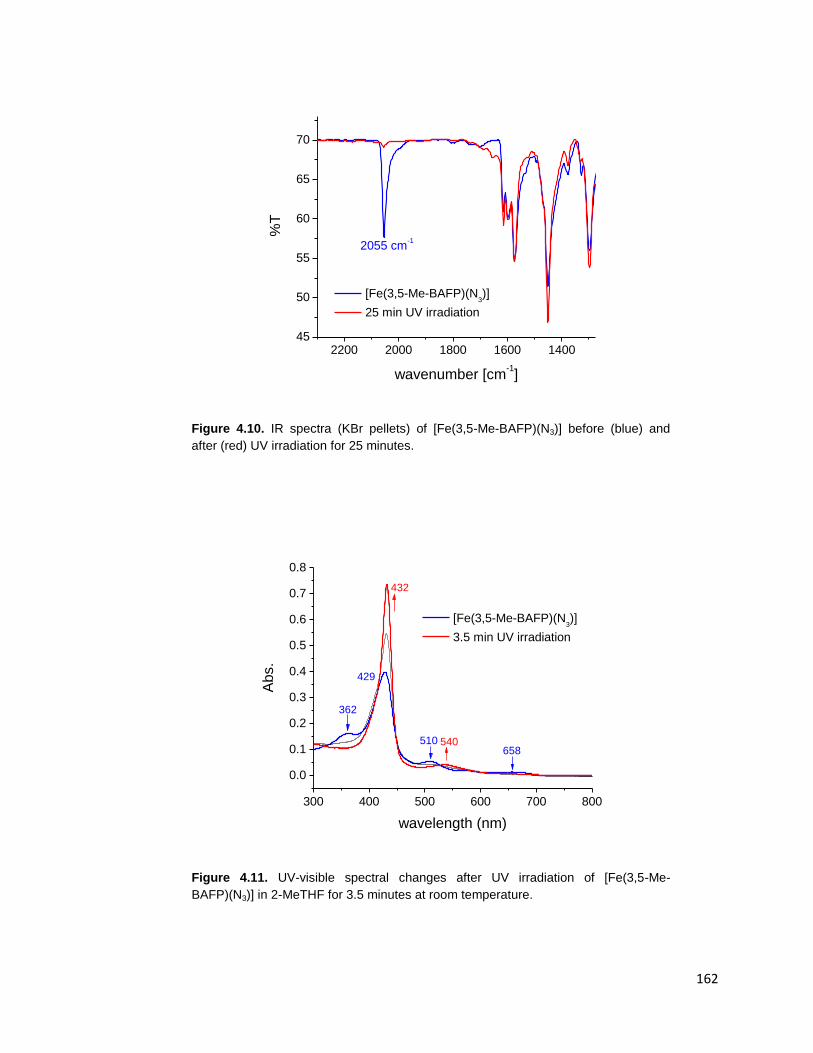
162
Figure 4.10. IR spectra (KBr pellets) of [Fe(3,5-Me-BAFP)(N3)] before (blue) and
after (red) UV irradiation for 25 minutes.
Figure 4.11. UV-visible spectral changes after UV irradiation of [Fe(3,5-Me-
BAFP)(N3)] in 2-MeTHF for 3.5 minutes at room temperature.
2200 2000 1800 1600 140045
50
55
60
65
70
2055 cm-1
%T
wavenumber [cm-1]
[Fe(3,5-Me-BAFP)(N3)]
25 min UV irradiation
300 400 500 600 700 800
0.0
0.1
0.2
0.3
0.4
0.5
0.6
0.7
0.8
540658
510
362
Abs.
wavelength (nm)
[Fe(3,5-Me-BAFP)(N3)]
3.5 min UV irradiation
429
432
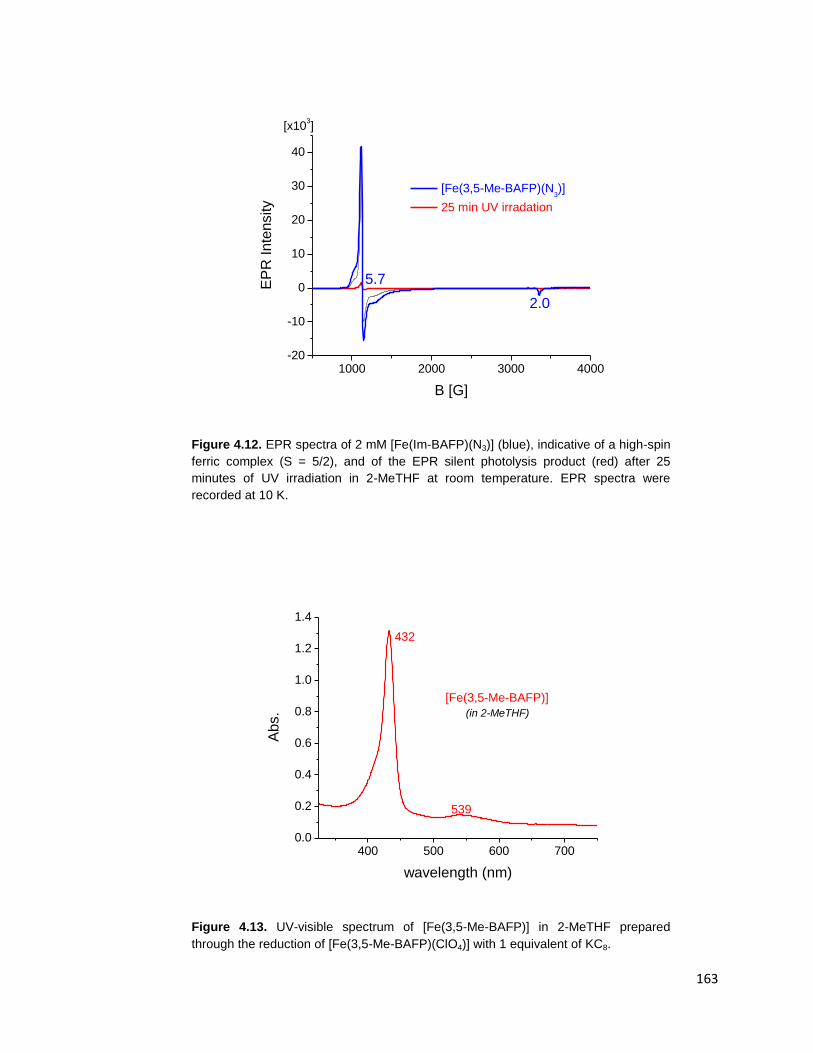
163
Figure 4.12. EPR spectra of 2 mM [Fe(Im-BAFP)(N3)] (blue), indicative of a high-spin
ferric complex (S = 5/2), and of the EPR silent photolysis product (red) after 25
minutes of UV irradiation in 2-MeTHF at room temperature. EPR spectra were
recorded at 10 K.
Figure 4.13. UV-visible spectrum of [Fe(3,5-Me-BAFP)] in 2-MeTHF prepared
through the reduction of [Fe(3,5-Me-BAFP)(ClO4)] with 1 equivalent of KC8.
1000 2000 3000 4000-20
-10
0
10
20
30
40
2.0
EP
R Inte
nsity
B [G]
[Fe(3,5-Me-BAFP)(N3)]
25 min UV irradation
5.7
[x103]
400 500 600 7000.0
0.2
0.4
0.6
0.8
1.0
1.2
1.4
432
Abs.
wavelength (nm)
[Fe(3,5-Me-BAFP)]
539
(in 2-MeTHF)
164
formation of a ferrous product rather than the desired iron(V) complex. UV-visible
spectra of [Fe(Im-BAFP)(N3)] and of the irradiation product are provided in Figure
4.14. The Q band at 535 nm is characteristic of the ferrous complex [Fe(Im-BAFP)].
Finally, as shown in Figure 4.15, the EPR spectrum of the irradiation product is EPR
silent. These spectra are all consistent with a ferrous product and, thus, photo-
induced homolytic Fe-N3 bond cleavage.
In our hands, UV irradiation of high- and low-spin ferric heme azide
complexes at room temperature induces homolytic Fe-N3 bond cleavage resulting in
formation of the corresponding ferrous porphyrin complexes. Although our bis-picket
fence porphyrin complexes show a unique reactivity compared to TPP2-
, this result is
dissatisfactory in that we do not generate the desired high-valent heme-nitride
species. Future work will focus on generation of iron(V) bis-picket fence porphyrin
nitride complexes through the use of N-atom transfer agents.20-21
Experimental
All reactions were performed under inert conditions with dried and freeze pump
thawed solvents unless stated otherwise. O-benxylhydroxylamine (NH2OBn)22
and α-
imidazolyl-m-toluic acid hydrochloride23
were prepared as reported previously. 1-
methylimidazole (MI) was distilled prior to use. H2[3,5-Me-BAFP] and H2[To-(O-
Bn)2PP] and their ferric chloride analogues were synthesized according to
procedures reported in Chapter 3. 2,6-bis(3’,5’-dimethylphenoxy)benzaldehyde was
also prepared as described in Chapter 3. Ammonia analysis was carried out using
the phenolate assay originally developed by J. A. Russel.24-25

165
Figure 4.14. UV-visible spectra of [Fe(Im-BAFP)(N3)] (blue) and of the photolysis product (red) after 1.5 minutes of UV irradiation in 2-MeTHF at room temperature.
Figure 4.15. EPR spectra of 2 mM [Fe(Im-BAFP)(N3)] (blue), indicative of a low-spin ferric complex (S = 1/2), and of the EPR silent photolysis product (red) after 25 minutes of UV irradiation in 2-MeTHF at room temperature. EPR spectra were recorded at 77 K.
300 400 500 600 700 8000.0
0.1
0.2
0.3
0.4
0.5
0.6
0.7
0.8
428
Abs.
wavelength [nm]
[Fe(Im-BAFP)(N3)]
1.5 min UV-vis
irradation428
535
550
1500 2000 2500 3000 3500 4000 4500 5000-40
-20
0
20
40
60
EP
R I
nte
nsity
B [G]
[Fe(Im-BAFP)(N3)]
25 min UV irradiation
2.69
2.17
1.80
[x103]
166
Synthetic Procedures
Na[NHOBn]. 100 mg O-benzylhydroxylamine (0.81 mmol) and 19 mg sodium
hydroxide (0.81 mmol) were stirred for 1 hour in 1.5 mL methanol. Then, the solvent
was removed via a Schlenk line to yield a white solid. The product was used without
further purification. Yield: quantative.
K[NHOBn]. 226 mg O-benzylhydroxylamine (1.84 mmol) and 129 mg potassium
methoxide (1.84 mmol) were stirred for 1 hour in 3.3 mL methanol. Then, the solvent
was removed via a Schlenk line to yield a white solid. The product was used without
further purification. Yield: quantative.
[Fe(3,5-Me-BAFP)(ClO4)]. 286 mg [Fe(3,5-Me-BAFP)(Cl)] (0.172 mmol) and 36 mg
silver perchlorate (0.172 mmol) were dissolved in 17 mL 2-methyltetrahydrofuran.
The reaction mixture was refluxed for 1 hour and filtered hot through a fine frit. The
filtrate was layered with 30 mL hexanes and allowed to precipitate at -30oC. After 20
hours, the resulting purple crystalline material was filtered and vacuum dried for 4
hours. Yield: 185 mg (62%). UV-vis (CH2Cl2): 405, 524, 593, 623 nm. UV-vis
(toluene): 416, 515, 597, 661 nm.
Reaction of [Fe(3,5-Me-BAFP)(ClO4)] with NH2OBn. In 5 mL of toluene, 18 mg of
[Fe(3,5-Me-BAFP)(ClO4)] (0.01 mmol) and 10 equivalents O-benzylhydroxylamine
(12.5 mg, 0.1 mmol) were stirred for 20 min. The resulting solution is EPR silent. UV-
vis (toluene): 435, 537, 569 nm.
167
Crystallization of [Fe(3,5-Me-BAFP)(NH3)2]. In a 5 mm diameter glass tube, 5 mg of
[Fe(3,5-Me-BAFP)(ClO4)] and ~5 equivalents O-benzylhydroxylamine were dissolved
in 0.2 mL toluene. The mixture was layered carefully with 1.5 mL hexanes and
closed with a rubber septum. After 5 days, crystals suitable for X-ray analysis were
harvested.
Reaction of [Fe(3,5-Me-BAFP)(ClO4)] with K[NHOBn]. Under inert atomosphere, 100
mg [Fe(3,5-Me-BAFP)(ClO4)] (0.058 mmol) and 47 mg K[NHOBn] (0.29 mmol) were
stirred in 3 mL toluene 12 hours. The product was precipitated with 9 mL hexanes.
The brown solid was filtered via fine frit. Yield: 75 mg (74%). UV-vis (toluene): 423,
583, 631 nm.
[Fe(To-(OBn)2PP)(N3)]. 170 mg [Fe(To-(O-Bn)2PP)(Cl)] (0.11 mmol) was dissolved in
10 mL CH2Cl2 from the solvent system and stirred with 3.25 g sodium azide in 10 mL
water (5 M) overnight. The organic layer was then separated, dried with sodium
sulfate, and rotovaped to dryness. Yield: quantative. UV-vis (CH2Cl2): 376, 422, 511,
584, 650, 688 nm. IR (KBr,): 2054 cm-1
(ν(N3)).
[Fe(3,5-Me-BAFP)(N3)]. 232 mg [Fe(3,5-Me-BAFP)(Cl)] (0.14 mmol) was dissolved
in 25 mL toluene and stirred with 4.04 g sodium azide in 13 mL water (5 M)
overnight. The organic layer was then separated, dried with sodium sulfate, and
rotovaped to dryness. Yield: quantative. UV-vis (2-MeTHF): 361, 428, 507, 579, 650,
676 nm. IR (KBr): 2055 cm-1
(ν(N3)).
168
Cyrstallization of [Fe(3,5-Me-BAFP)(N3)]. ~2 mg of [Fe(3,5-Me-BAFP)(N3)] was
dissolved in 0.1 mL toluene in a 5 mm diameter tube. The mixture was layered with 2
mL hexanes and closed with a rubber septum. X-ray quality crystals were observed
after 8 days.
NO2-BAFP. Under inert atmosphere, 2.0 g 2,6-bis(3’,5’-
dimethylphenoxy)benzaldehyde (5.8 mmol), 290 mg 2-nitrobenzaldehyde (1.9
mmol), and 0.53 mL freshly distilled pyrrole (7.7 mmol) were dissolved in a mixture
of 690 mL CH2Cl2 and 5.3 mL absolute ethanol. The mixture was allowed to stir for
20 minutes before addition of 0.34 mL boron trifluoride diethyletherate via syringe.
The reaction stirred at room temperature for 1.5 hours. After 1.5 hours, 1.2 g 2,3-
dichloro-5,6-dicyano-1,4-benzoquinone was added and the reaction stirred at room
temperature for 12 hours. The reaction mixture was rotovaped to dryness and
purified through a series of silica columns: (1) 100% CH2Cl2, (2) 1:1 hexanes:CH2Cl2,
and (3) 100% CH2Cl2. Yield: 202 mg (11%). 1H-NMR (CDCl3): 8.95 (s, 4H); 8.87 (d,
2H); 8.48 (d, 2H); 8.39 (dd, 1H); 8.16 (dd, 1H); 7.86 (m, 2H); 7.62 (m, 3H); 7.09 (m
4H); 7.02 (dd, 2H); 6.25 (s, 2H); 6.22 (s, 4H); 6.20 (s, 2H); 6.16 (s, 1H); 6.14 (s, 4H);
6.08 (s, 4H); 5.98 (s, 1H); 1.80 (s, 12H); 1.78 (s, 6H); 1.67 (s, 12H); 1.62 (s, 6H); -
2.86 (s, 2H); see Figure 4.16. UV-vis (CH2Cl2): 423, 518, 551, 594, 649 nm. LCT-
MS: m/z 1380.8.
NH2-BAFP. 140 mg NO2-BAFP and 260 mg tin(II) chloride were dissolved in a
mixture of 3.5 mL concentrated HCl and 2 mL CH2Cl2. The reaction mixture was
stirred overnight at room temperature. An additional 300 mg tin(II) chloride was
added and the reaction stirred for another 3 hours. The mixture was neutralized with

169
Figure 4.16. 1H NMR spectrum of NO2-BAFP in CDCl3. Top portion of spectrum is intensified x 3.
a
b
fc
e
d
d
9.0 8.5 8.0 7.5 7.0 6.0
2.0 -2.0 -2.5 -3.0
ppm
H2O
2H
e
a
b
c
f
d
18H6H
CD
Cl 3
36H
9H4H
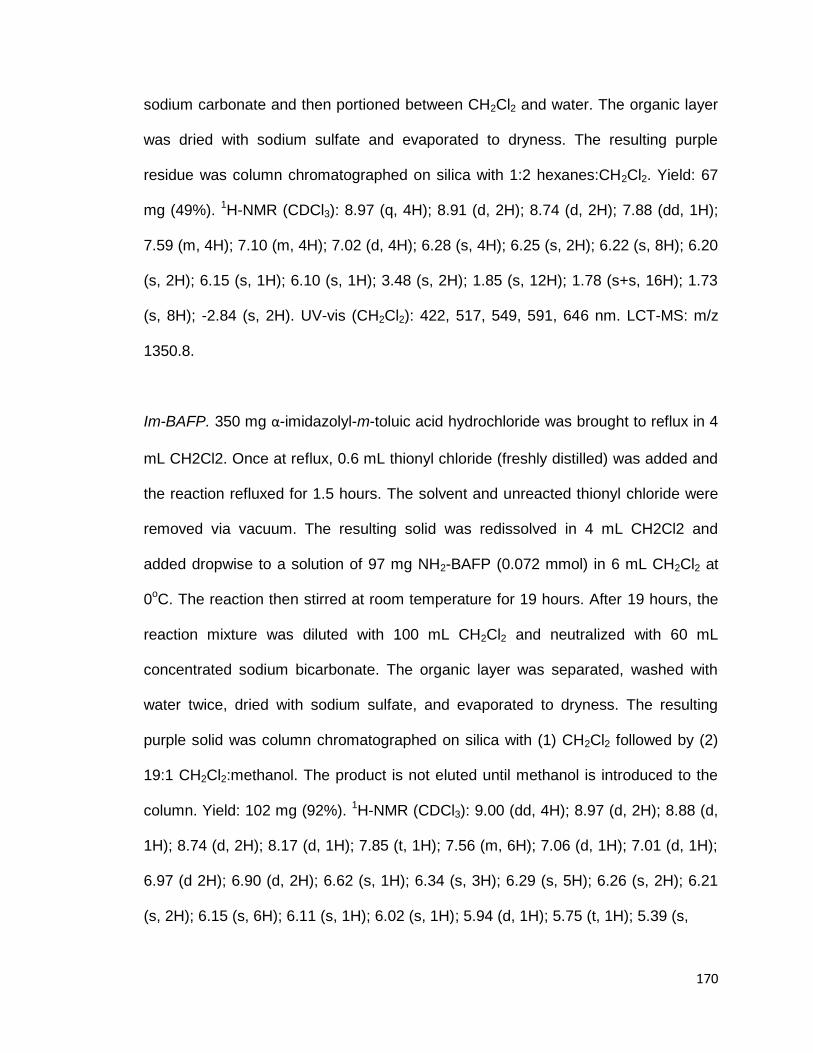
170
sodium carbonate and then portioned between CH2Cl2 and water. The organic layer
was dried with sodium sulfate and evaporated to dryness. The resulting purple
residue was column chromatographed on silica with 1:2 hexanes:CH2Cl2. Yield: 67
mg (49%). 1H-NMR (CDCl3): 8.97 (q, 4H); 8.91 (d, 2H); 8.74 (d, 2H); 7.88 (dd, 1H);
7.59 (m, 4H); 7.10 (m, 4H); 7.02 (d, 4H); 6.28 (s, 4H); 6.25 (s, 2H); 6.22 (s, 8H); 6.20
(s, 2H); 6.15 (s, 1H); 6.10 (s, 1H); 3.48 (s, 2H); 1.85 (s, 12H); 1.78 (s+s, 16H); 1.73
(s, 8H); -2.84 (s, 2H). UV-vis (CH2Cl2): 422, 517, 549, 591, 646 nm. LCT-MS: m/z
1350.8.
Im-BAFP. 350 mg α-imidazolyl-m-toluic acid hydrochloride was brought to reflux in 4
mL CH2Cl2. Once at reflux, 0.6 mL thionyl chloride (freshly distilled) was added and
the reaction refluxed for 1.5 hours. The solvent and unreacted thionyl chloride were
removed via vacuum. The resulting solid was redissolved in 4 mL CH2Cl2 and
added dropwise to a solution of 97 mg NH2-BAFP (0.072 mmol) in 6 mL CH2Cl2 at
0oC. The reaction then stirred at room temperature for 19 hours. After 19 hours, the
reaction mixture was diluted with 100 mL CH2Cl2 and neutralized with 60 mL
concentrated sodium bicarbonate. The organic layer was separated, washed with
water twice, dried with sodium sulfate, and evaporated to dryness. The resulting
purple solid was column chromatographed on silica with (1) CH2Cl2 followed by (2)
19:1 CH2Cl2:methanol. The product is not eluted until methanol is introduced to the
column. Yield: 102 mg (92%). 1H-NMR (CDCl3): 9.00 (dd, 4H); 8.97 (d, 2H); 8.88 (d,
1H); 8.74 (d, 2H); 8.17 (d, 1H); 7.85 (t, 1H); 7.56 (m, 6H); 7.06 (d, 1H); 7.01 (d, 1H);
6.97 (d 2H); 6.90 (d, 2H); 6.62 (s, 1H); 6.34 (s, 3H); 6.29 (s, 5H); 6.26 (s, 2H); 6.21
(s, 2H); 6.15 (s, 6H); 6.11 (s, 1H); 6.02 (s, 1H); 5.94 (d, 1H); 5.75 (t, 1H); 5.39 (s,
171
Figure 4.17. 1H NMR spectrum of Im-BAFP in CDCl3. Top portion of spectrum is intensified x 3.
a
g
e
b
c
d
f
cfg
h
i
j
9.0 8.5 8.0 7.5 7.0 6.5 6.0 5.5
3.5 3.0 2.5 2.0 -2.0 -2.5 -3.0
ppm
CD
Cl 3
2H
e
a
bb
b,c,d
ad
c
6H 1H
36H 2H
2H 6H
f
g
6H 1H 18H 1H3H
c c
1H
h
i
j
172
1H); 3.48 (s, 1H); 1.88 (s, 6H); 1.84 (s, 12H); 1.76 (s, 12H); 1.74 (s, 6H); -2.72 (s,
2H); see Figure 4.17. UV-vis (CH2Cl2): 424, 518, 553, 590, 645 nm. LCT-MS: m/z
1535.3.
[Fe(Im-BAFP)(Cl)]. 102 mg Im-BAFP (0.07 mmol) was brought to reflux in 8 mL dry,
degassed THF. Then 42 mg anhydrous iron(II) chloride (0.33 mmol) was added and
the reaction refluxed for 4 hours. The solvent was removed via evaporation and the
resulting brown solid was column chromatographed on silica with 97:3
CH2Cl2:methanol. Yield: 97 mg (91%). UV-vis (CH2Cl2): 421, 514, 546, 653 nm. LCT-
MS: m/z 1588.3 (M – Cl).
[Fe(Im-BAFP)(N3)]. 20 mg [Fe(3,5-Me-BAFP)(Cl)] (0.012 mmol) was dissolved in 20
mL CH2Cl2 and stirred with 200 mg sodium azide in 40 mL for 5 hours. The organic
layer was then separated, dried with sodium sulfate, and rotovaped to dryness.
Yield: quantative. UV-vis (CH2Cl2): 425, 550 nm. UV-vis (2-MeTHF): 429, 550 nm. IR
(KBr): 1998 cm-1
(ν(N3)).
Physical Methods
Infrared spectra were obtained from KBr disks on a Perkin-Elmer BX
spectrometer at room temperature. Resolution was set to 2 cm-1
. Proton magnetic
resonance spectra were recorded on a Varian Inova 400 MHz instrument. Electronic
absorption spectra were measured using an Analytical Jena Specord 600 instrument
at room temperature. In situ UV-visible measurements were taken with a Hellma
quartz immersion probe with 10 mm pathlength. Electron paramagnetic resonance
173
spectra were recorded on a Bruker X-band EMX spectrometer equipped with an
Oxford Instruments liquid nitrogen or helium cryostat. EPR spectra were typically
obtained on frozen solutions using 20 mW microwave power and 100 kHz field
modulation with the amplitude set to 1 G. Sample concentrations employed were ~2
mM.
DFT Calculations
All geometry optimizations and frequency calculations were performed with
the program package Gaussian 0326
using the BP6827-28
functional and TZVP29-30
basis set. Single point energy calculations were performed using B3LYP28, 31-32
/TZVP
with toluene as the solvent using the polarizable continuum model (PCM). Free
energies, ΔG, were calculated by applying BP86/TZVP thermal corrections to
B3LYP/TZVP calculated energies. In all calculations, convergence was reached
when the relative change in the density matrix between subsequent iterations was
less that 1 x 10⁻⁸
.
References
1. Nakahara, K.; Tanimoto, T.; Hatano, K.; Usuda, K.; Shoun, H., J. Biol. Chem. 1993, 268, 8350-8355.
2. Shiro, Y.; Fujii, M.; Iizuka, T.; Adachi, S.; Tsukamoto, K.; Nakahara, K.; Shoun, H., J. Biol. Chem. 1995, 270, 1617-1623.
3. Lehnert, N.; Praneeth, V. K. K.; Paulat, F., J. Comp. Chem. 2006, 27, 1338-1351.
4. Feng, D.; Ryan, M. D., Inorg. Chem. 1987, 26, 2480-2483.
5. Bari, S. E.; Amorebieta, V. T.; Gutierrez, M. M.; Olabe, J. A.; Doctorovich, F., J. Inorg. Biochem. 2010, 104, 30-36.
6. Kintner, E. T.; Dawson, J. H., Inorg. Chem. 1991, 30, 4892-4897.
174
7. Harris, D. L., Int. J. Quantum Chem. 2002, 88, 183-200.
8. Dey, A.; Okamura, T.; Ueyama, N.; Hedman, B.; Hodgson, K. O.; Solomon, E. I., J. Am. Chem. Soc. 2005, 127, 12046-12053.
9. Dey, A.; Jiang, Y.; Ortiz de Montellano, P. R.; Hodgson, K. O.; Hedman, B.; Solomon, E. I., J. Am. Chem. Soc. 2009, 131, 7869-7878.
10. Petrenko, T.; DeBeer George, S.; Aliaga-Alcalde, N.; Bill, E.; Mienert, B.; Xiao, Y.; Guo, Y.; Sturhahn, W.; Cramer, S. P.; Wieghardt, K.; Neese, F., J. Am. Chem. Soc. 2007, 129, 11053–11060.
11. Smith, J. M.; Subedi, D., Dalton Trans. 2012, 41, 1423-1429.
12. Betley, T. A.; Peters, J. C., J. Am. Chem. Soc. 2004, 126, 6252-6254.
13. Meyer, K.; Bill, E.; Mienert, B.; Weyhermuller, T.; Wieghardt, K., J. Am. Chem. Soc. 1999, 121, 4859-4876.
14. Scepaniak, J. J.; Young, J. A.; Bontchev, R. P.; Smith, J. M., Angew. Chem. Int. Ed. 2009, 48, 3158-3160.
15. Scepaniak, J. J.; Vogel, C. S.; Khusniyarov, M. M.; Heinemann, F. W.; Meyer, K.; Smith, J. M., Science 2011, 331, 1049-1052.
16. Summerville, D. A.; Cohen, I. A., J. Am. Chem. Soc. 1976, 98, 1747-1752.
17. Aliaga-Alcalde, N.; DeBeer George, S.; Mienert, B.; Bill, E.; Wieghardt, K.; Neese, F., Angew. Chem. Int. Ed. 2005, 44, 2908-2912.
18. Adams, K. M.; Rasmussen, P. G.; Scheidt, W. R.; Hatano, K., Inorg. Chem. 1979, 18, 1892-1899.
19. Byers, W.; Cossham, J. A.; Edwards, J. O.; Gordon, A. T.; Jones, J. G.; Kenny, E. T. P.; Mahmood, A.; McKnight, J.; Sweigart, D. A.; Tondreau, G. A.; Wright, T., Inorg. Chem. 1986, 25, 4767-4774.
20. Carpino, L. A.; Padykula, R. E.; Barr, D. E.; Hall, F. H.; Krause, J. G.; Dufresne, R. F.; Thoman, C. J., J. Org. Chem. 1988, 53, 2565-2572.
21. Mindiola, D. J.; Cummins, C. C., Angew. Chem. Int. Ed. 1998, 37, 945-947.
22. Falborg, L.; Jorgensen, K. A., J. Chem. Soc. Perkin Trans. 1 1996, 2823-2826.
23. Berto, T. C.; Praneeth, V. K. K.; Goodrich, L. E.; Lehnert, N., J. Am. Chem. Soc. 2009, 131, 17116-17126.
24. Choi, I.-K.; Liu, Y.; Wei, Z.; Ryan, M. D., Inorg. Chem. 1997, 36, 3113-3118.
25. Russell, J. A., J. Biol. Chem. 1944, 156, 457-462.
175
26. Frisch, M. J.; Trucks, G. W.; Schlegel, H. B.; Scuseria, G. E.; Robb, M. A.; Cheeseman, J. R.; Montgomery, J., J. A.; Vreven, T.; Kudin, K. N.; Burant, J. C.; Millam, J. M.; Iyengar, S. S.; Tomasi, J.; Barone, V.; Mennucci, B.; Cossi, M.; Scalmani, G.; Rega, N.; Petersson, G. A.; Nakatsuji, H.; Hada, M.; Ehara, M.; Toyota, K.; Fukuda, R.; Hasegawa, J.; Ishida, M.; Nakajima, T.; Honda, Y.; Kitao, O.; Nakai, H.; Klene, M.; Li, X.; Knox, J. E.; Hratchian, H. P.; Cross, J. B.; Bakken, V.; Adamo, C.; Jaramillo, J.; Gomperts, R.; Stratmann, R. E.; Yazyev, O.; Ausin, A. J.; Cammi, R.; Pomelli, C.; Octerski, J. W.; Ayala, P. Y.; Morokuma, K.; Voth, G. A.; Salvador, P.; Dannenberg, J. J.; Zakrzewski, V. G.; Dapprich, S.; Daniels, A. D.; Strain, M. C.; Farkas, O.; Makick, D. K.; Rabuck, A. D.; Raghavachair, K.; Foresman, J. B.; Ortiz, J. V.; Cui, Q.; Baboul, A. G.; Clifford, S.; Cioslowski, J.; Stefanov, B. B.; Lui, G.; Laishenko, A.; Piskorz, R.; Komaromi, I.; Martin, R. L.; Fox, D. J.; Keith, T.; Al-Laham, M. A.; Peng, C. Y.; Nanayakkara, A.; Challacombe, M.; Gill, P. M. W.; Johnson, B.; Chen, W.; Wong, M. W.; Gonzalez, C.; Pople, J. A. Gaussin 03, Gaussian, Inc.: Pittsburgh, PA, 2003.
27. Perdew, J. P., Phys. Rev. B 1986, 33, 8822-8824.
28. Becke, A. D., Phys. Rev. A 1988, 38, 3098-3100.
29. Schaefer, A.; Horn, H.; Ahlrichs, R., J. Chem. Phys. 1992, 97, 2571-2577.
30. Schaefer, A.; Huber, C.; Ahlrichs, R., J. Chem. Phys. 1994, 100, 5829-5835.
31. Becke, A. D., J. Chem. Phys. 1993, 98, 1372-1377.
32. Becke, A. D., J. Chem. Phys. 1993, 98, 5648-5652.
176
Chapter 5
The trans Effect of Nitroxyl (HNO) in Ferrous Heme Systems: Implications for
Soluble Guanylate Cyclase Activation by HNO
Nitroxyl, HNO, is the protonated and one electron reduced form of the
signaling diatomic molecule nitric oxide, NO. While the physiological role of NO is
well established,1-5
the role of HNO in biological systems is very controversial. HNO
has been proposed to be an intermediate in the catalytic cycle of assimilatory nitrite
reductase6-7
and P450 nitric oxide reductase,8-9
to be an irreversible inhibitor of
mitochondrial aldehyde dehydrogenase10
and glyceraldehyde-3-phosphate
dehydrogenase11
through cysteine modification, and to be an oxidant of thiols to the
corresponding disulfides with formation of hydroxylamine.12
Interestingly, it is still
unknown whether HNO is produced in vivo. Proposals for endogenous HNO
generation include reduction of NO by cyctochrome c oxidase and hemoglobin,12
reaction of S-nitrosothiols with excess thiol,13
or perhaps most prominently through
nitric oxide synthase mediated oxidation of L-arginine in the absence of
tetrahydrobiopterin.14
Although HNO has chemical properties, and thus physiological effects,
distinct from that of NO,15-16
both nitrogen oxides have been reported to activate
soluble guanylate cyclase (sGC), a ferrous heme enzyme primarily responsible for
vasodilation in mammalian organisms.17
sGC is a ~150 kDa heterodimer consisting
of three domains: a N-terminal sensing domain that contains a ferrous heme, the

177
dimerization domain, and a C-terminal catalytic domain. In the presence of NO, a
conformational change takes place in the heme domain of sGC, activating the
catalytic domain of the enzyme that mediates the conversion of GTP to the
biochemical messenger cyclic guanosine monophosphate, cGMP.18
It has been
proposed that two distinct binding sites exist for NO in the sensing domain of sGC.
The primary, high-affinity site consists of a ferrous heme b ligated by a proximal
histidine ligand, His105 in human and bovine sGC.19
Upon binding of NO, an
intermediate six-coordinate complex is formed before the strong thermodynamic σ-
trans effect (also called trans “interaction”) of NO induces cleavage of the Fe-NHis105
bond to form the activated five-coordinate heme-nitrosyl complex.20-23
This
movement of His105 induces a conformational change in the sensing domain which
activates the catalytic domain of the enzyme. The second, low affinity binding site is
proposed to be the thiol of a cysteine residue.24-25
While NO has been established as the endogenous activator of sGC,26
several reports have shown increased sGC dependent vasodilation in the presence
of HNO donors.27-30
In the presence of SOD, HNO is readily oxidized to NO which
can then activate sGC through the previously discussed pathway.31-32
Hence, one
important question is whether HNO could directly activate sGC. In an initial report,
Dierks and Burstyn determined that HNO is unable to activate sGC.33
However, the
possibility remains that HNO was scavenged by the 10 mM DTT in the buffer prior to
reaction with sGC in these experiments. In a second study, Mayer and co-workers
confirmed that HNO does not activate sGC in the absence of SOD.34
However, Miller
et al. demonstrated sGC activity in thiol and O2-free buffer in the presence of the
HNO donors 1-nitrosocyclohexyl trifluoroacetate and Angeli’s salt.17
The activity was
1.9 and 3.4 fold lower than NO induced activity at 10 μM, respectively, but
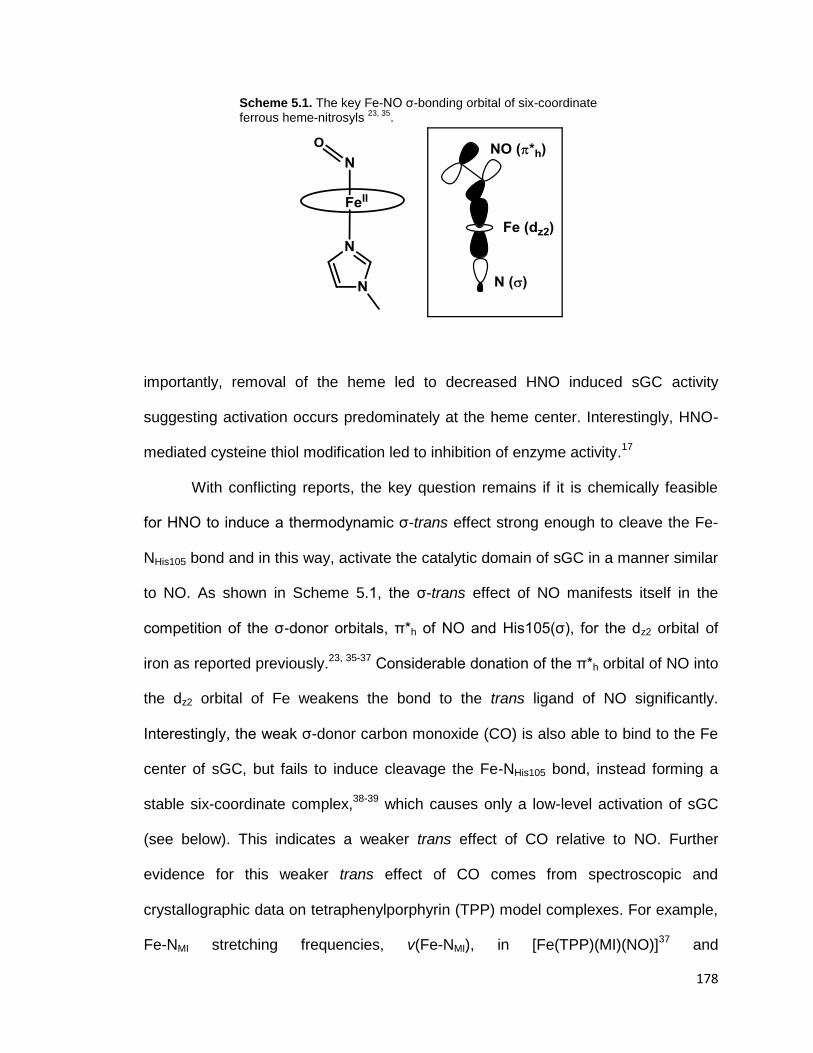
178
Scheme 5.1. The key Fe-NO σ-bonding orbital of six-coordinate ferrous heme-nitrosyls
23, 35.
importantly, removal of the heme led to decreased HNO induced sGC activity
suggesting activation occurs predominately at the heme center. Interestingly, HNO-
mediated cysteine thiol modification led to inhibition of enzyme activity.17
With conflicting reports, the key question remains if it is chemically feasible
for HNO to induce a thermodynamic σ-trans effect strong enough to cleave the Fe-
NHis105 bond and in this way, activate the catalytic domain of sGC in a manner similar
to NO. As shown in Scheme 5.1, the σ-trans effect of NO manifests itself in the
competition of the σ-donor orbitals, π*h of NO and His105(σ), for the dz2 orbital of
iron as reported previously.23, 35-37
Considerable donation of the π*h orbital of NO into
the dz2 orbital of Fe weakens the bond to the trans ligand of NO significantly.
Interestingly, the weak σ-donor carbon monoxide (CO) is also able to bind to the Fe
center of sGC, but fails to induce cleavage the Fe-NHis105 bond, instead forming a
stable six-coordinate complex,38-39
which causes only a low-level activation of sGC
(see below). This indicates a weaker trans effect of CO relative to NO. Further
evidence for this weaker trans effect of CO comes from spectroscopic and
crystallographic data on tetraphenylporphyrin (TPP) model complexes. For example,
Fe-NMI stretching frequencies, v(Fe-NMI), in [Fe(TPP)(MI)(NO)]37
and
179
[Fe(TPP)(CO)(MI)]40
complexes (MI = 1-methylimidazole) directly reflect this
difference between CO and NO. In the six-coordinate NO complex, v(Fe-NMI) is
observed at 149 cm-1
whereas this mode is found at 172/225 cm-1
for the analogous
CO complex and at 210-220 cm-1
in deoxy-Mb. Additionally, crystal structures of
[Fe(TPP)(MI)(NO)]41
and [Fe(TPP)(MI)(CO)]42
show Fe-NMI bond lengths of 2.173 Å
and 2.071 Å, respectively. By comparison, the Fe-NMI bond length of
[Fe(TPP)(MI)2],43
where no trans interaction exists, is 1.997 Å. These observations
can be explained by the fact that CO binds to ferrous heme systems predominantly
via strong π-backbonds, which do not give rise to a large thermodynamic trans
effect. It should be noted, though, that CO is able to activate sGC, although the
effect is quite weak relative to NO—100% CO and 0.5% NO atmosphere result in
4.4- and 128-fold activation, respectively.38
It has been suggested that this low-level
activation by CO may be due to changes in heme conformation.44-46
Thus, it seems that a moderate lengthening of the Fe-NHis105 bond, as in the
case of CO coordination, does not induce the conformational change necessary for
high (as in the case of NO) catalytic production of cGMP and instead a stronger
trans effect, as in the case of NO, is required. To understand this effect better, we
have employed DFT calculations to investigate the thermodynamic trans effect
(referred to as the trans effect in this paper) induced by NO, HNO, and CO on 1-
methylimidazole (MI) in ferrous heme model complexes. Here we use DFT total
energy calculations to evaluate the binding of MI to five-coordinate ferrous
porphyrins in trans position to NO, HNO, CO, and MI as a way to (a) systematically
assess the relative strength of the trans effect induced by each of these small
molecules and (b) to calibrate DFT methods for the accurate calculation of weak
binding constants in ferrous heme complexes.

180
Results and Discussion
Geometric Parameters and Spin States of Model Complexes
In order to determine the extent to which HNO is able to induce a σ-trans
effect in sGC, density functional theory calculations were performed on the five- and
six-coordinate model systems [Fe(P)(X)] and [Fe(P)(MI)(X)] (P2-
= porphine ligand),
where X = NO, HNO, CO, and MI, as shown for X = HNO in Figure 5.1. To decrease
computational cost, the porphine approximation was applied and MI was used as a
model for histidine ligation to the ferrous heme center. To determine which DFT
method predicts the most accurate optimized structures in our system, [Fe(P)(MI)(X)]
where X = NO and MI were optimized using a variety of functional/basis set
combinations, listed in Table 5.1. Calculated structures with BP86/TZVP,
B3LYP/LanL2DZ*, and B3LYP/6-31G* reproduce experimental bond lengths and
angles with reasonable accuracy, as shown in Table 5.1. Interestingly, BP86/TZVP
Figure 5.1. The model system [Fe(P)(MI)(X)], where P = porphine2-, MI = 1=methylimidazole, and X = NHO, and applied coordinate system. The structure shown is calculated with BP86/TZVP.
z
yx
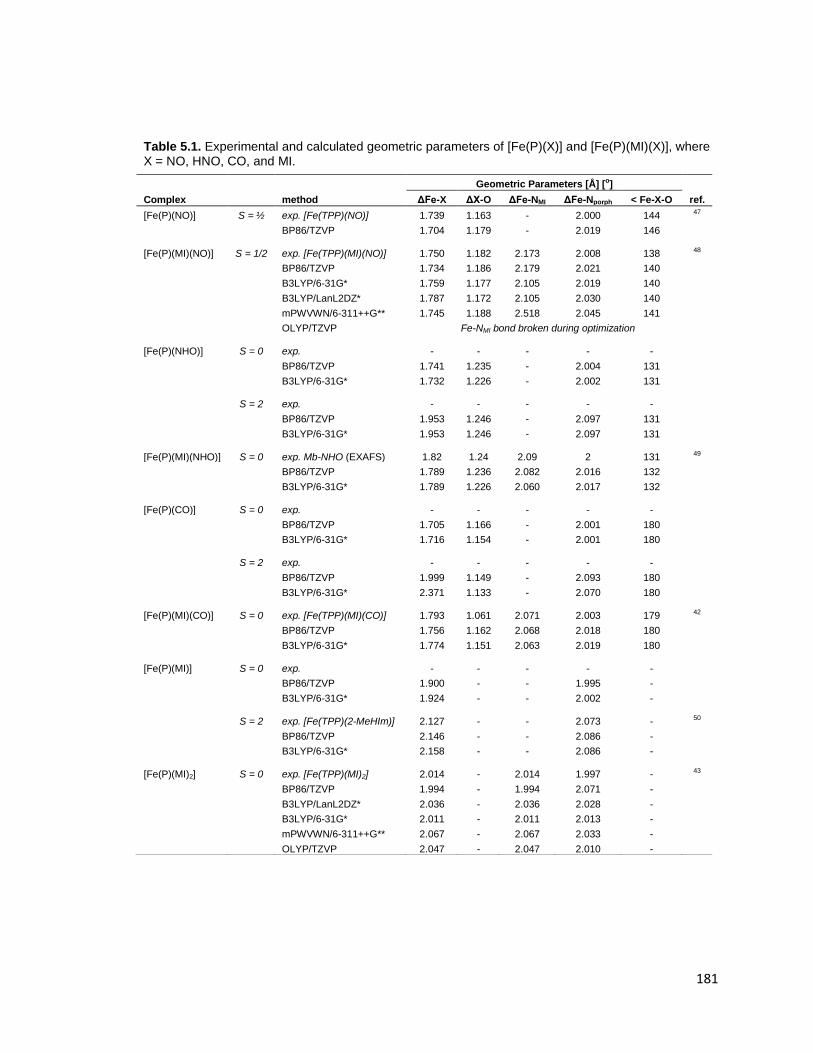
181
Table 5.1. Experimental and calculated geometric parameters of [Fe(P)(X)] and [Fe(P)(MI)(X)], where X = NO, HNO, CO, and MI.
Geometric Parameters [Å] [o]
Complex method ΔFe-X ΔX-O ΔFe-NMI ΔFe-Nporph < Fe-X-O ref.
[Fe(P)(NO)] S = ½ exp. [Fe(TPP)(NO)] 1.739 1.163 - 2.000 144 47
BP86/TZVP 1.704 1.179 - 2.019 146
[Fe(P)(MI)(NO)] S = 1/2 exp. [Fe(TPP)(MI)(NO)] 1.750 1.182 2.173 2.008 138 48
BP86/TZVP 1.734 1.186 2.179 2.021 140
B3LYP/6-31G* 1.759 1.177 2.105 2.019 140
B3LYP/LanL2DZ* 1.787 1.172 2.105 2.030 140
mPWVWN/6-311++G** 1.745 1.188 2.518 2.045 141
OLYP/TZVP Fe-NMI bond broken during optimization
[Fe(P)(NHO)] S = 0 exp. - - - - -
BP86/TZVP 1.741 1.235 - 2.004 131
B3LYP/6-31G* 1.732 1.226 - 2.002 131
S = 2 exp. - - - - -
BP86/TZVP 1.953 1.246 - 2.097 131
B3LYP/6-31G* 1.953 1.246 - 2.097 131
[Fe(P)(MI)(NHO)] S = 0 exp. Mb-NHO (EXAFS) 1.82 1.24 2.09 2 131 49
BP86/TZVP 1.789 1.236 2.082 2.016 132
B3LYP/6-31G* 1.789 1.226 2.060 2.017 132
[Fe(P)(CO)] S = 0 exp. - - - - -
BP86/TZVP 1.705 1.166 - 2.001 180
B3LYP/6-31G* 1.716 1.154 - 2.001 180
S = 2 exp. - - - - -
BP86/TZVP 1.999 1.149 - 2.093 180
B3LYP/6-31G* 2.371 1.133 - 2.070 180
[Fe(P)(MI)(CO)] S = 0 exp. [Fe(TPP)(MI)(CO)] 1.793 1.061 2.071 2.003 179 42
BP86/TZVP 1.756 1.162 2.068 2.018 180
B3LYP/6-31G* 1.774 1.151 2.063 2.019 180
[Fe(P)(MI)] S = 0 exp. - - - - -
BP86/TZVP 1.900 - - 1.995 -
B3LYP/6-31G* 1.924 - - 2.002 -
S = 2 exp. [Fe(TPP)(2-MeHIm)] 2.127 - - 2.073 - 50
BP86/TZVP 2.146 - - 2.086 -
B3LYP/6-31G* 2.158 - - 2.086 -
[Fe(P)(MI)2] S = 0 exp. [Fe(TPP)(MI)2] 2.014 - 2.014 1.997 - 43
BP86/TZVP 1.994 - 1.994 2.071 -
B3LYP/LanL2DZ* 2.036 - 2.036 2.028 -
B3LYP/6-31G* 2.011 - 2.011 2.013 -
mPWVWN/6-311++G** 2.067 - 2.067 2.033 -
OLYP/TZVP 2.047 - 2.047 2.010 -
182
predicts slightly shorter Fe-X bond lengths in both [Fe(P)(MI)(NO)] and [Fe(P)(MI)2]
than B3LYP/6-31G* and B3LYP/LanL2DZ*. This is not surprising as pure density
functionals generally overestimate metal-ligand covalencies. We also tested the
functional OLYP, which has been recently suggested to work well for ferrous heme
systems.51
However, OLYP/TZVP geometry optimizations let to the breaking of the
Fe-NMI bond in [Fe(P)(MI)(NO)], preventing formation of the six-coordinate complex
in this case. Zhang and co-workers further recommended using the mPWVWN/“6-
311++G**” method for calculating HNO and NO adducts of heme complexes.52
In
this method the 6-311++G** basis set is applied to the first coordination sphere
elements of Fe, LanL2DZ to Fe, and 6-31G* to all other atoms. The choice of the
inferior basis set LanL2DZ for iron is surprising as it generates a poorly balanced
description of the system, which reduces the quality of this approach. Interestingly,
when we instead use mPWVWN/6-311++G**, where 6-311++G** is now applied to
all atoms, the Fe-NMI bond lengths in [Fe(P)(MI)(X)], where X = NO and MI, are
dramatically elongated relative to experimental values (see Table 5.1), showing that
this method is not useful for the investigation of the heme complexes considered
here.
Based on these findings, initial geometry optimizations of all five- and six-
coordinate complexes were performed with BP86/TZVP. This basis set and
functional combination, in general, provides reliable geometries and, as expected,
the obtained structures for all model systems compare well to experimental
parameters (see Table 5.1). Prior to calculation of binding energies, the ground
states of all reactants were determined for each functional/basis set combination
utilized here. The five- and six-coordinate ferrous heme-nitrosyl complexes were
computed as S = 1/2, in accordance with experimental data.53
For X = HNO, CO,
183
and MI the ferrous six-coordinate complexes were computed as low-spin (S = 0), but
for the corresponding five-coordinate complexes both the S = 0 and 2 spin states
were included to determine the lowest energy spin state in each case. Whereas DFT
predicts quite clearly that [Fe(P)(X)] with X = CO, HNO to be low-spin
(experimentally not known), the spin state of [Fe(P)(MI)] is very ambiguous.54
Experimentally, the latter complex is high-spin.
Method Calibration: Calculation of Binding Constants for 1-Methylimidazole Ligation
to [Fe(P)(NO)] and [Fe(P)(MI)]
As a measure of the σ-trans interaction exerted by each of the four small
molecules HNO, CO, NO, and MI in ferrous heme complexes, we have evaluated
the binding constants (Keq) of MI to the five-coordinate species [Fe(P)(X)], which are
obtained from the calculated ΔG values at 298.15 K for the reaction:
[Fe(P)(X)] + MI ⇄ [Fe(P)(MI)(X)]
Due the lack of experimental binding constants for both X = HNO and CO, the
NO and MI complexes were utilized to assess the accuracy of DFT to calculate
these binding energies (Table 5.2) and Keq values (Table 5.3). Since gradient-
corrected functionals generally overestimate metal-ligand covalencies, and also
show strong preference for low-spin states, accurate metal-ligand binding energies
are often times only available from hybrid functionals.23
Given that BP86/TZVP
generates good structures at low computational cost, we used these structures and
then calculated binding energies, ΔE, with a large number of methods as listed in
Table 5.2. Calculated basis set superposition errors (BSSE), usually around 2
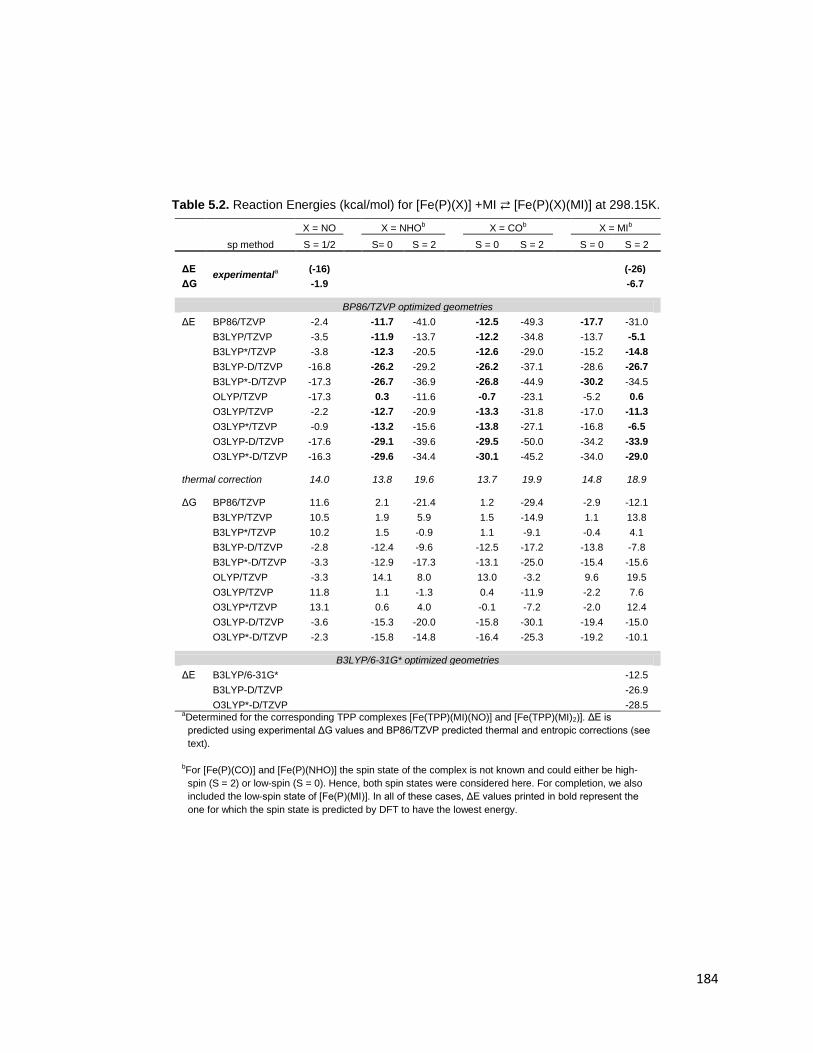
184
Table 5.2. Reaction Energies (kcal/mol) for [Fe(P)(X)] +MI ⇄ [Fe(P)(X)(MI)] at 298.15K.
X = NO X = NHOb X = COb X = MIb
sp method S = 1/2 S= 0 S = 2 S = 0 S = 2 S = 0 S = 2
ΔE experimentala
(-16)
(-26)
ΔG -1.9
-6.7
BP86/TZVP optimized geometries
ΔE BP86/TZVP -2.4
-11.7 -41.0
-12.5 -49.3
-17.7 -31.0
B3LYP/TZVP -3.5
-11.9 -13.7
-12.2 -34.8
-13.7 -5.1
B3LYP*/TZVP -3.8
-12.3 -20.5
-12.6 -29.0
-15.2 -14.8
B3LYP-D/TZVP -16.8
-26.2 -29.2
-26.2 -37.1
-28.6 -26.7
B3LYP*-D/TZVP -17.3
-26.7 -36.9
-26.8 -44.9
-30.2 -34.5
OLYP/TZVP -17.3
0.3 -11.6
-0.7 -23.1
-5.2 0.6
O3LYP/TZVP -2.2
-12.7 -20.9
-13.3 -31.8
-17.0 -11.3
O3LYP*/TZVP -0.9
-13.2 -15.6
-13.8 -27.1
-16.8 -6.5
O3LYP-D/TZVP -17.6
-29.1 -39.6
-29.5 -50.0
-34.2 -33.9
O3LYP*-D/TZVP -16.3
-29.6 -34.4
-30.1 -45.2
-34.0 -29.0
thermal correction 14.0
13.8 19.6
13.7 19.9
14.8 18.9
ΔG BP86/TZVP 11.6
2.1 -21.4
1.2 -29.4
-2.9 -12.1
B3LYP/TZVP 10.5
1.9 5.9
1.5 -14.9
1.1 13.8
B3LYP*/TZVP 10.2
1.5 -0.9
1.1 -9.1
-0.4 4.1
B3LYP-D/TZVP -2.8
-12.4 -9.6
-12.5 -17.2
-13.8 -7.8
B3LYP*-D/TZVP -3.3
-12.9 -17.3
-13.1 -25.0
-15.4 -15.6
OLYP/TZVP -3.3
14.1 8.0
13.0 -3.2
9.6 19.5
O3LYP/TZVP 11.8
1.1 -1.3
0.4 -11.9
-2.2 7.6
O3LYP*/TZVP 13.1
0.6 4.0
-0.1 -7.2
-2.0 12.4
O3LYP-D/TZVP -3.6
-15.3 -20.0
-15.8 -30.1
-19.4 -15.0
O3LYP*-D/TZVP -2.3
-15.8 -14.8
-16.4 -25.3
-19.2 -10.1
B3LYP/6-31G* optimized geometries
ΔE B3LYP/6-31G*
-12.5
B3LYP-D/TZVP
-26.9
O3LYP*-D/TZVP -28.5
aDetermined for the corresponding TPP complexes [Fe(TPP)(MI)(NO)] and [Fe(TPP)(MI)2)]. ΔE is
predicted using experimental ΔG values and BP86/TZVP predicted thermal and entropic corrections (see
text).
bFor [Fe(P)(CO)] and [Fe(P)(NHO)] the spin state of the complex is not known and could either be high-
spin (S = 2) or low-spin (S = 0). Hence, both spin states were considered here. For completion, we also
included the low-spin state of [Fe(P)(MI)]. In all of these cases, ΔE values printed in bold represent the
one for which the spin state is predicted by DFT to have the lowest energy.
185
kcal/mol, are corrected for in the reported binding energies. Finally, a thermal and
entropic correction (taken from BP86/TZVP calculations) is applied to the calculated
ΔE values, resulting in the free energies, ΔG at 298.15 K, listed in Table 5.2.
Importantly, this thermal correction is essentially method independent (with typical
errors of less than 5%) and, as a result, we can apply a BP86/TZVP thermal
correction to energies calculated with an alternate method. For example, calculated
thermal corrections for the reaction: [Fe(P)(MI)] (S = 2) + MI ⇄ [Fe(P)(MI)2], are 18.9
and 19.7 kcal/mol when applying BP86/TZVP and B3LYP/6-31G* respectively. If X =
NO, thermal corrections for BP86/TZVP and B3LYP/LanL2DZ* are 14.0 and 13.4
kcal/mol, again, a deviation of less than 5%.
The experimental ΔG values for binding MI to [Fe(TPP)(NO)]35
is -1.9
kcal/mol and, using a calculated thermal correction of about 14.0 kcal/mol, the
binding energy can be estimated around -16 kcal/mol. The B3LYP/TZVP calculated
binding energy for MI ligation to [Fe(P)(NO)] (Table 5.2) is, however, only -3.5
kcal/mol; underestimated by >10 kcal/mol. Similarly, ΔG for binding MI to
[Fe(TPP)(MI)] is -6.7 kcal/mol experimentally. After applying a 18.9 kcal/mol thermal
correction, ΔE can be predicted around -26 kcal/mol. B3LYP/TZVP significantly
underestimates this value by >20 kcal/mol, calculating a ΔE value of -5.1 kcal/mol.
Accordingly, the B3LYP/TZVP Keq values (calculated from ΔG) for MI ligation to
[Fe(P)(NO)] and [Fe(P)(MI)] show significant errors compared to reported
experimental values. For [Fe(TPP)(NO)] and [Fe(TPP)(MI)],55
MI binding constants
of 26 and 7.8 x 10⁴ M
-1 are reported, whereas the calculations yield 1.1 x 10
-6 and
4.2 x 10⁻⁹
M-1
, respectively (Table 5.3).

186
Table 5.3. Binding constants (M
-1) for [Fe(P)(X)] + MI ⇄ [Fe(P)(X)(MI)] at 298.15 K. Keq is calculated
using the listed method on BP86/TZVP geometries.
Since the calculated binding constants are seven (or more) orders of
magnitude underestimated using B3LYP/TZVP, ΔE was recalculated for X = NO and
MI using a modified B3LYP functional where HF exact exchange is reduced to 15%
(B3LYP*), in combination with the TZVP basis set. It has been noted previously by
Hess and co-workers that decreasing the 20% HF exact exchange in the original
B3LYP functional to 15% greatly improves computational results for transition metal
complexes without compromising the quality of the hybrid functional.56
While using
the B3LYP* functional favorably increased the binding energy of MI to [Fe(P)(MI)] to
-14.8 kcal/mol, ΔE for [Fe(P)(NO)] is essentially unaffected at -3.8 kcal/mol. This
translates to a free energy for MI binding to [Fe(P)(MI)] of 4.1 kcal/mol, 10 kcal/mol
higher than the experimental ΔG of -6.7 kcal/mol for [Fe(TPP)(MI)]. Correspondingly,
the predicted Keq value for [Fe(P)(MI)] of 9.2 x 10⁻⁴
M-1
is eight orders of magnitude
too low. The calculated free energy, ΔG, for MI binding to [Fe(P)(NO)] is still
predicted ~10 kcal/mol too high compared to the experimental value of -1.9 kcal/mol
for [Fe(TPP)(NO)]; translating to a calculated Keq value of 3.2 x 10⁻⁸
M-1
(nine orders
of magnitude too low, see Table 5.3).
X = NO X = NHO X = CO X = MI
sp method S = 1/2 S= 0 S = 2 S = 0 S = 2 S = 0 S = 2
experimental 26
7.8 x 10⁴
BP86 3.1 x 10⁻⁹
2.9 x 10⁻² 5.0 x 10¹⁵
1.3 x 10⁻¹ 3.5 x 10²¹
1.4 x 10² 7.2 x 10⁸
B3LYP 1.9 x 10⁻⁸
4.0 x 10⁻² 5.0 x 10⁻⁵
7.6 x 10⁻² 7.9 x 10¹⁰
1.7 x 10⁻¹ 7.4 x 10⁻¹¹
B3LYP* 3.2 x 10-8
7.8 x 10⁻² 4.2
1.7 x 10⁻¹ 4.5 x 10⁶
1.8 9.2 x 10⁻⁴
B3LYP-D 1.1 x 10²
1.1 x 10⁹ 1.2 x 10⁷
1.5 x 10⁹ 4.1 x 10¹²
1.3 x 10¹⁰ 5.6 x 10⁵
B3LYP*-D 2.7 x 10²
2.7 x 10⁹ 4.5 x 10¹²
4.3 x 10⁹ 2.0 x 10¹⁸
1.9 x 10¹¹ 2.7 x 10¹¹
OLYP 2.7 x 10²
4.7 x 10⁻¹¹ 1.3 x 10⁻⁶
2.9 x 10⁻¹⁰ 2.1 x 10²
8.5 x 10⁻⁸ 5.2 x 10⁻¹⁵
O3LYP 2.2 x 10⁻⁹
1.5 x 10⁻¹ 8.7
5.2 x 10⁻¹ 5.3 x 10⁸
39 2.7 x 10⁻⁶
O3LYP* 2.4 x 10-10
3.7 x 10⁻¹ 1.2 x 10⁻³
1.2 1.9 x 10⁸
30 7.5 x 10⁻¹⁰
O3LYP-D 4.7 x 10²
1.7 x 10¹¹ 4.9 x 10¹⁴
4.1 x 10¹¹ 1.1 x 10²²
1.5 x 10¹⁴ 9.4 x 10¹⁰
O3LYP*-D 53 4.1 x 10¹¹ 6.9 x 10¹⁰ 9.7 x 10¹¹ 3.5 x 10¹⁸ 1.2 x 10¹⁴ 2.6 x 10⁷
187
Finally, recent computational work by Siegbahn and co-workers has shown
that inclusion of van der Waals interactions is important for the accurate
determination of metal-ligand binding constants.57
If van der Waals interactions are
included in the B3LYP functional (B3LYP-D/TZVP), ΔE is now predicted for
[Fe(P)(NO)] to be -16.8 kcal/mol, only 0.8 kcal/mol from the “experimental” MI
binding energy of -16 kcal/mol as shown in Table 5.2. Keq of the NO complex
increases to 1.1 x 10² M
-1, now only overestimating MI affinity for [Fe(P)(NO)] by one
order of magnitude, or 0.9 kcal/mol in terms of ΔG. Additionally, with B3LYP-D we
predict ΔE of -26.7 kcal/mol for [Fe(P)(MI)] which is also within 1 kcal/mol of the
experimental value for the tetraphenylporphyrin complex. The B3LYP-D/TZVP
calculated MI binding constant for [Fe(P)(MI)] is 5.6 x 10⁵ M
-1, again only one order
of magnitude from the experimental value of 7.8 x 10⁴ M
-1 (1.1 kcal/mol in terms of
ΔG). Excitingly, the ΔG values obtained with B3LYP-D/TZVP, and hence, binding
constants are well within the error of DFT (~2 kcal/mol). Finally, we explored whether
a combination of the two previously introduced corrections, i.e. both van der Waals
interactions and a 15% HF exact exchange (B3LYP*-D), would further improve the
computational results. With B3LYP*-D, the MI binding constant for X = NO remains
essentially unchanged, but the MI binding affinity for X = MI is now overestimated by
seven orders of magnitude (2.7 x 10¹¹
M-1
) compared to the experimental Keq value.
Therefore, inclusion of van der Waals interactions (with the original 20% HF exact
exchange present in B3LYP) in the calculation of Keq values (B3LYP-D) affords the
most accurate MI binding constants for [Fe(P)(NO)] and [Fe(P)(MI)]; see Figure 5.2.
Interestingly, the success of the B3LYP-D functional lies largely in the fact
that the van der Waals interactions essentially compensate for the thermal and
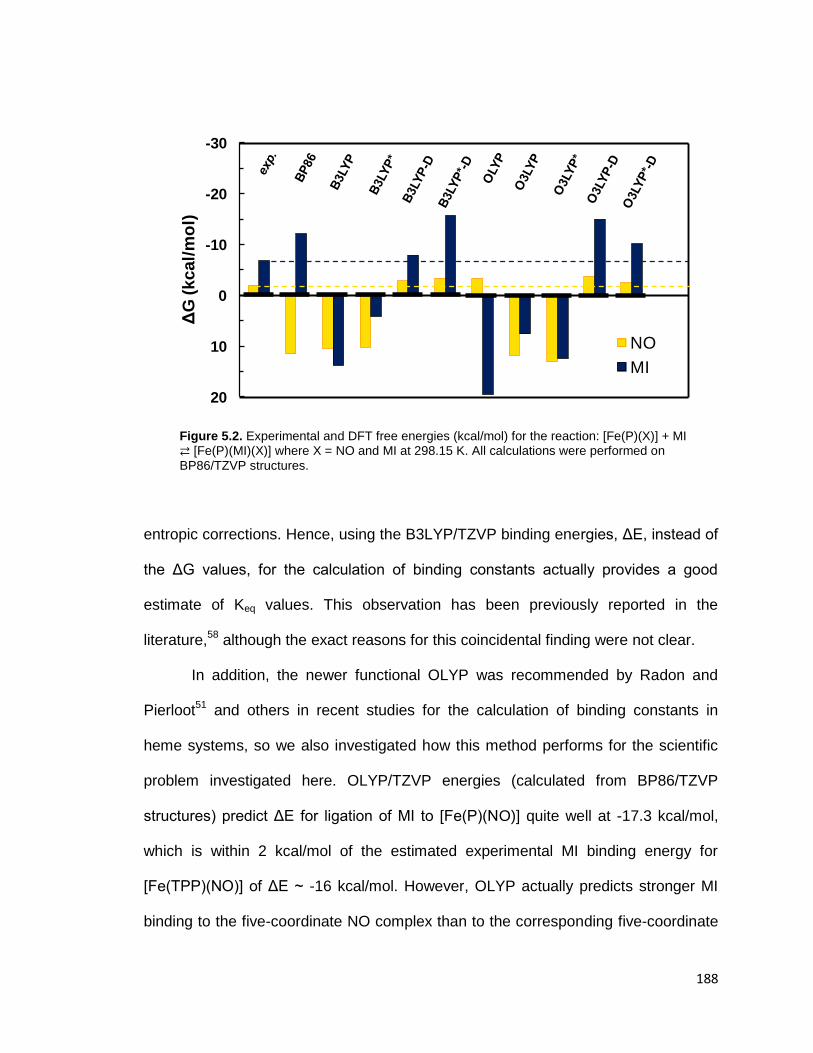
188
Figure 5.2. Experimental and DFT free energies (kcal/mol) for the reaction: [Fe(P)(X)] + MI ⇄ [Fe(P)(MI)(X)] where X = NO and MI at 298.15 K. All calculations were performed on
BP86/TZVP structures.
entropic corrections. Hence, using the B3LYP/TZVP binding energies, ΔE, instead of
the ΔG values, for the calculation of binding constants actually provides a good
estimate of Keq values. This observation has been previously reported in the
literature,58
although the exact reasons for this coincidental finding were not clear.
In addition, the newer functional OLYP was recommended by Radon and
Pierloot51
and others in recent studies for the calculation of binding constants in
heme systems, so we also investigated how this method performs for the scientific
problem investigated here. OLYP/TZVP energies (calculated from BP86/TZVP
structures) predict ΔE for ligation of MI to [Fe(P)(NO)] quite well at -17.3 kcal/mol,
which is within 2 kcal/mol of the estimated experimental MI binding energy for
[Fe(TPP)(NO)] of ΔE ~ -16 kcal/mol. However, OLYP actually predicts stronger MI
binding to the five-coordinate NO complex than to the corresponding five-coordinate
-30
-20
-10
0
10
20
NO
MI
ΔG
(kcal/
mo
l)

189
MI complex, as shown in Table 5.3, with a predicted binding energy of only 0.6
kcal/mol for [Fe(P)(MI)]. This is in stark contrast to experimental findings. Combined
with the problems of OLYP/TZVP to determine an accurate structure for
[Fe(P)(MI)(NO)] (see above), this clearly renders this method unusable for the
system under study here. If instead the corresponding hybrid functional O3LYP is
employed, the absolute ΔE values for X = NO and MI, -2.2 and -11.3 kcal/mol, are
still significantly in error but the trend is now correctly described. After applying the
thermal and entropic correction, though, ΔG is found to be incorrectly predicted to be
positive with this method, 11.8 and 7.6 kcal/mol for the NO and MI complexes,
respectively. These values are highly inconsistent with the experimental free
energies of -1.9 (NO) and -6.7 (MI) kcal/mol, and hence, this result is still highly
unsatisfactory. In the end, Keq values predicted by O3LYP are nearly 10 orders of
magnitude underestimated (Table 5.3).
Applying van der Waals interactions (O3LYP-D) and setting the HF exact
exchange to 15% (O3LYP*) again improves the quality of the overall predictions as
shown in Table 5.3. In contrast to B3LYP, the O3LYP functional with both
modifications included (O3LYP*-D) actually predicts the best binding energies, ΔE,
for X = NO and MI, -16.3 and -29.0 kcal/mol, respectively. As a result, the calculated
ΔG value for X = NO is -2.3 kcal/mol with O3LYP*-D, only overestimating the
experimental value by 0.4 kcal/mol. The free energy for X = MI is -10.1 kcal/mol,
overestimated compared to experiment by 3.4 kcal/mol. Therefore, the O3LYP*-D
binding constants are the most accurate for any modified O3LYP functional
investigated here (see Figure 5.2) with Keq values for MI binding of 53 and 2.6 x 10⁷
M-1
for X = NO and MI, respectively. This now provides an accurate prediction of MI
190
binding constants to ferrous heme-nitrosyl systems, although binding of MI to
[Fe(P)(MI)] is overestimated by 3 orders of magnitude.
In comparison to experimental values for the corresponding ferrous
tetraphenylporphyrin complexes, B3LYP-D/TZVP predicts the most accurate MI
binding constants to [Fe(P)(X)] (where X = NO and MI) of all the methods tested
here. Excitingly, the Keq values predicted by this method are well within the error of
density functional theory calculations. B3LYP-D/TZVP is followed closely in accuracy
by binding constants for O3LYP*-D/TZVP as shown in Tables 5.2 and 5.3.
To examine the effect of alternate geometries on the predicted ΔE values,
B3LYP-D/TZVP and O3LYP*-D/TZVP energies (most accurate for the BP86/TZVP
structures) were recalculated using B3LYP/6-31G* fully optimized structures.
B3LYP/6-31G* was determined to predict the most accurate Fe-NMI bond lengths for
[Fe(P)(MI)2] in comparison to experimental data for [Fe(TPP)(MI)2] (see above).
Importantly, calculated binding energies (ΔE) vary by less than 0.5 kcal/mol when
using the BP86/TZVP and B3LYP/6-31G* structures, see Table 5.3. This is found for
both the B3LYP-D and the O3LYP*-D functional used in combination with the TZVP
basis set. While this may be expected as geometries are, in general, relatively
similar between the BP86/TZVP and B3LYP/6-31G* optimizations, it does indicate
that the most important parameter in determining accurate absolute binding energies
and Keq values is the method by which the single-point energies are calculated, as
long as the structures are reasonable. In addition, as mentioned above, the thermal
and entropy corrections to obtain ΔG from ΔE values are essentially constant,
emphasizing that the accurate calculation of ΔE values on good geometries is key to
success in Keq calculations.
191
In summary, prediction of accurate MI binding constants, Keq, in ferrous heme
systems poses a serious challenge due to the fact that computational errors in ligand
binding energies are of the same magnitude as the actual binding energies that we
are trying to calculate. Several previous computational studies51, 57
have discussed
the difficulties in obtaining accurate binding energies for heme systems and our work
suggests similar conclusions. Therefore, it is crucial that all theoretical binding
constants are reported using experimental values as a calibration for method
accuracy.
Examination of the Thermodynamic σ-trans Effect of HNO in sGC Model Systems:
Calculation of Binding Constants for 1-Methylimidazole Ligation to Five-Coordinate
Heme Complexes
Based on our method calibration, inclusion of van der Waals interactions is
crucial to calculation of MI binding constants to [Fe(P)(X)] where X = NO and MI,
vide supra. Specifically the B3LYP-D and O3LYP*-D functionals gave particularly
accurate Keq values (Table 5.3) for our system. Upon applying the B3LYP-D
functional with the TZVP basis set we are able to calculate free energies, ΔG, for MI
binding to both [Fe(P)(NO)] and [Fe(P)(MI)] that are within ~1 kcal/mol of
experimental values—well within the error of DFT. Due to the exponential
relationship between ΔG and Keq, this translates to Keq values predicted within one
order of magnitude of experimental values for [Fe(TPP)(NO)] and [Fe(TPP)(MI)].
While the absolute values of the calculated binding constants for many of the
tested methods (Table 5.3) are significantly in error compared to experimental data,
the binding constants of MI to [Fe(P)(NHO)] and [Fe(P)(CO)] are generally predicted
to be within the same order of magnitude, indicating that HNO and CO exhibit a

192
Table 5.4. Relative binding constants (M-1
) for [Fe(P)(X)] + MI ⇄ [Fe(P)(X)(MI)] at 298.15 K. Keq
values are taken from Table 5.3.
comparable trans effect. This does not appear to depend much on the applied
computational method. In addition, the best method from our method calibration
study, B3LYP-D/TZVP, predicts relative MI binding constants of 1.0 x 10⁷ and 1.4 x
107 M
-1 for HNO (five-coordinate, S = 0) and CO (five-coordinate, S = 0) complexes,
respectively, as shown in Table 5.4. Keq values for the five-coordinate HNO and CO
complexes are approximately seven orders of magnitude larger than that of the
corresponding NO complex. Oddly, however, B3LYP-D/TZVP predicts the relative
binding constant of MI to [Fe(P)(MI)] (S = 2) to be only 5.0 x 10³ M
-1—three orders of
magnitude lower than for the CO complex (Table 5.4). While CO should have a
relatively small trans effect, it is still thought to have a larger trans effect than MI,
based on crystallographic Fe-NMI bond lengths and Fe-NMI stretching frequencies,
see above. A similar situation is observed for O3LYP*-D/TZVP binding constants
where X = HNO and CO are predicted to have larger binding constants than X = MI.
Conversely, as shown in Table 5.4, utilization of B3LYP*-D/TZVP, where the HF
exact exchange is lowered to 15%, yields relative MI binding constants of 1.0 x 10⁷
and 1.6 x 10⁷ M
-1 for the five-coordinate HNO and CO complexes (S = 0), and 1.0 x
109 M
-1 for X = MI (S = 2); i.e. B3LYP*-D predicts that both CO and HNO exert a
stronger trans interaction in ferrous heme systems than MI (see Table 5.4). In
accordance with the strong σ-trans effect of NO, the binding constant of MI to
X = NO X = NHO X = CO X = MI
sp method S = 1/2 S= 0 S = 2 S = 0 S = 2 S = 2
experimental 1
3.0 x 10³
B3LYP-D 1
1.0 x 10⁷ 1.0 x 10⁵
1.4 x 10⁷ 3.6 x 10¹⁰
5.0 x 10³
B3LYP*-D 1
1.0 x 10⁷ 1.7 x 10¹⁰
1.6 x 10⁷ 7.2 x 10¹⁵
1.0 x 10⁹
O3LYP*-D 1 7.8 x 10⁹ 1.3 x 10⁹ 1.8 x 10¹⁰ 6.7 x 10¹⁶ 4.9 x 10⁵

193
[Fe(P)(NO)] obtained with B3LYP*-D/TZVP is much lower than that for X = CO,
HNO, and MI and is predicted to be 2.7 x 10² M
-1 (see Table 5.3). Therefore,
although the absolute MI binding constant to [Fe(P)(MI)] is significantly in error with
B3LYP*-D, lowering the HF exact exchange in B3LYP to 15% appears to aid in the
prediction of good relative binding constants for all complexes considered here.
While DFT’s ability to accurately predict binding constants is in question (vide supra),
it appears to consistently predict similar binding constants for both HNO and CO
which are at least 6 orders of magnitude larger than that of NO. This indicates that
the thermodynamic trans effect of NO is much stronger than that of CO and HNO,
suggesting that HNO cannot directly activate sGC through cleavage of the Fe-NHis105
bond, as observed for CO.
Examination of the Thermodynamic σ-trans Effect of HNO in sGC Model Systems:
Fe-NMI Bond Lengths and Orbital Analysis
Further support for the weakened trans effect of HNO relative to NO is
obtained by the BP86/TZVP optimized Fe-NMI bond lengths for the six-coordinate
structures with X = HNO or NO, where values of 2.082 Å and 2.179 Å are obtained,
respectively. These values are in fact in very good agreement with the experimental
data (Table 5.1). This comparison indicates that HNO does not induce a trans effect
of the same magnitude as NO. HNO does, however, induce slightly longer Fe-NMI
bond lengths than both CO, 2.068 Å, and MI, 1.994 Å in the BP86/TZVP
optimizations.
The difference in trans interaction is further illustrated by the B3LYP/TZVP
calculated molecular orbitals for the six-coordinate complexes, as shown in the
contour plots in Figure 5.3. Here, the competition of the π*h orbital of HNO and the

194
Figure 5.3. Relevant molecular orbitals of (a) [FeII(P)(NO)(MI)], (b) [Fe
II(P)(NHO)(MI)], and (c)
[FeII(P)(CO)(MI)] which define the thermodynamic σ-trans effect in these ferrous porphyrin
systems. Calculated with B3LYP/TZVP on the BP86/TZVP optimized structures.
σ(N) orbital of MI for the dz2 orbital of Fe defines the σ-trans interaction induced by
HNO.23
For [Fe(P)(MI)(NO)], the important Fe-NO σ bonding orbital shows 57% π*h
and 27% Fe dz2/dxz contributions, corresponding to a strong σ-bond, inducing a large
trans interaction. Here, the weakening of the Fe-NMI bond is due to the antibonding
Fe-NMI interaction in this molecular orbital (cf. Scheme 5.1). In contrast, in the HNO
bound model system, the important Fe-NO σ bonding orbital shows 69% π*h
character and only 4% Fe dz2 contribution, see Table 5.5. The decrease in the Fe dz2
percentage in the orbital of the HNO complex relative to the corresponding orbital of
the NO complex indicates a much smaller σ-trans effect for HNO, i.e. a weaker Fe-
NMI antibonding interaction, thus making it unlikely that this molecule could induce
the cleavage of the Fe-histidine bond in sGC in agreement with the calculated
binding constants discussed above. This also indicates that HNO is mostly a π-
backbonding ligand (with the main π-backbonding (occupied) MO containing 48% dyz
and 15% π*v character), similar to CO.
[Fe(P)(NO)(MI)]
πh*_dz2/dxz
(57% NO : 27% Fe)
[Fe(P)(NHO)(MI)]
πh*_dz2
(69% NHO : 4% Fe)
[Fe(P)(CO)(MI)]
a1g(P)_ dz2
(9% CO : 13% Fe)
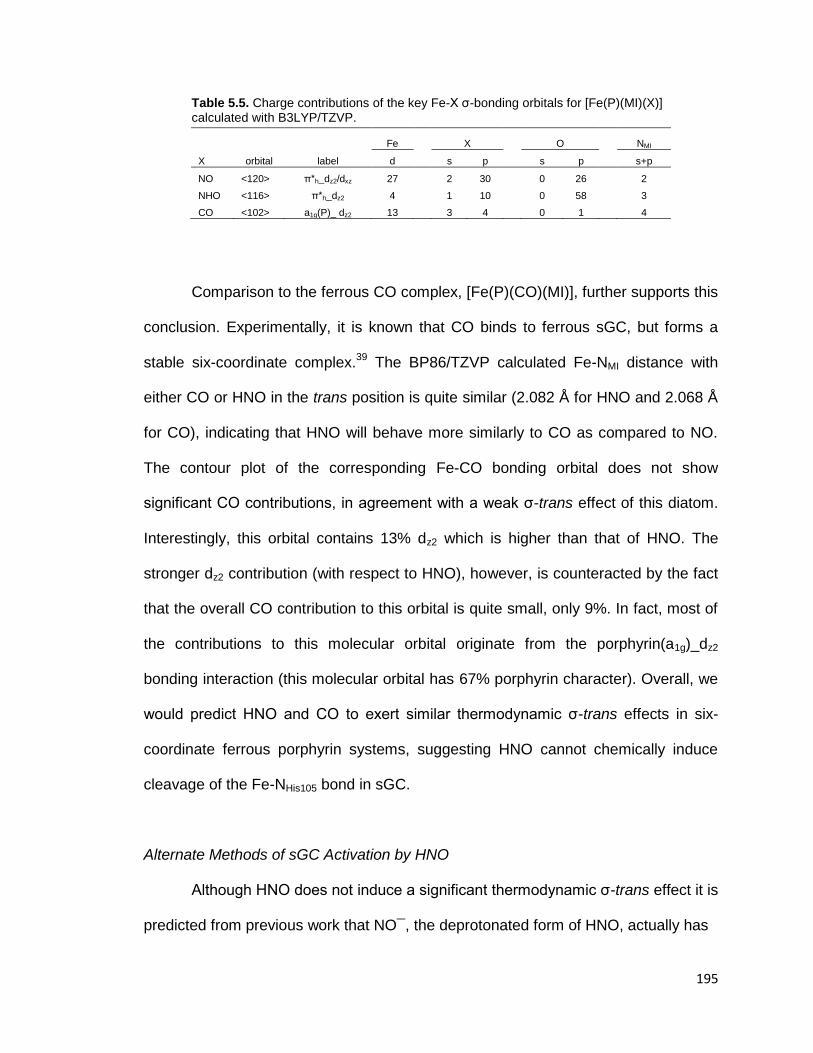
195
Table 5.5. Charge contributions of the key Fe-X σ-bonding orbitals for [Fe(P)(MI)(X)] calculated with B3LYP/TZVP.
Comparison to the ferrous CO complex, [Fe(P)(CO)(MI)], further supports this
conclusion. Experimentally, it is known that CO binds to ferrous sGC, but forms a
stable six-coordinate complex.39
The BP86/TZVP calculated Fe-NMI distance with
either CO or HNO in the trans position is quite similar (2.082 Å for HNO and 2.068 Å
for CO), indicating that HNO will behave more similarly to CO as compared to NO.
The contour plot of the corresponding Fe-CO bonding orbital does not show
significant CO contributions, in agreement with a weak σ-trans effect of this diatom.
Interestingly, this orbital contains 13% dz2 which is higher than that of HNO. The
stronger dz2 contribution (with respect to HNO), however, is counteracted by the fact
that the overall CO contribution to this orbital is quite small, only 9%. In fact, most of
the contributions to this molecular orbital originate from the porphyrin(a1g)_dz2
bonding interaction (this molecular orbital has 67% porphyrin character). Overall, we
would predict HNO and CO to exert similar thermodynamic σ-trans effects in six-
coordinate ferrous porphyrin systems, suggesting HNO cannot chemically induce
cleavage of the Fe-NHis105 bond in sGC.
Alternate Methods of sGC Activation by HNO
Although HNO does not induce a significant thermodynamic σ-trans effect it is
predicted from previous work that NO¯, the deprotonated form of HNO, actually has
Fe X O NMI
X orbital label d s p s p s+p
NO <120> π*h_dz2/dxz 27
2 30
0 26
2
NHO <116> π*h_dz2 4
1 10
0 58
3
CO <102> a1g(P)_ dz2 13
3 4
0 1
4
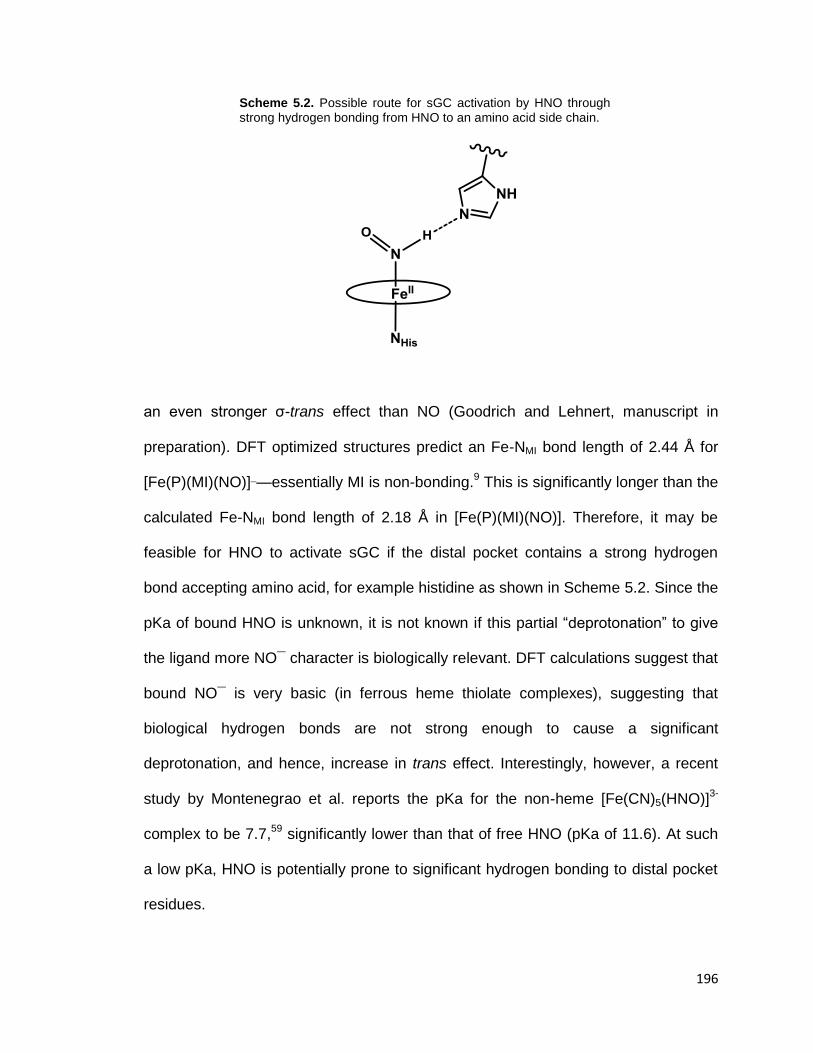
196
Scheme 5.2. Possible route for sGC activation by HNO through strong hydrogen bonding from HNO to an amino acid side chain.
an even stronger σ-trans effect than NO (Goodrich and Lehnert, manuscript in
preparation). DFT optimized structures predict an Fe-NMI bond length of 2.44 Å for
[Fe(P)(MI)(NO)]¯—essentially MI is non-bonding.9 This is significantly longer than the
calculated Fe-NMI bond length of 2.18 Å in [Fe(P)(MI)(NO)]. Therefore, it may be
feasible for HNO to activate sGC if the distal pocket contains a strong hydrogen
bond accepting amino acid, for example histidine as shown in Scheme 5.2. Since the
pKa of bound HNO is unknown, it is not known if this partial “deprotonation” to give
the ligand more NO¯ character is biologically relevant. DFT calculations suggest that
bound NO¯ is very basic (in ferrous heme thiolate complexes), suggesting that
biological hydrogen bonds are not strong enough to cause a significant
deprotonation, and hence, increase in trans effect. Interestingly, however, a recent
study by Montenegrao et al. reports the pKa for the non-heme [Fe(CN)5(HNO)]3-
complex to be 7.7,59
significantly lower than that of free HNO (pKa of 11.6). At such
a low pKa, HNO is potentially prone to significant hydrogen bonding to distal pocket
residues.
197
Conclusions
In summary, weak metal-ligand binding constants are inherently difficult to
calculate by DFT methods. The prediction of accurate MI binding constants to
[Fe(P)(X)] for X = NO and MI is dependent on the inclusion of van der Waals
interactions. In this study, the best Keq values were obtained with B3LYP-D/TZVP
energies on BP86/TZVP geometries. The calculated MI binding constants for X = NO
and MI are 110 and 5.6 x 10⁵ M
-1, predicted only one order of magnitude higher than
experimentally determined values of 26 and 7.8 x 10⁴ M
-1 for ferrous
tetraphenylporphyrin complexes. Interestingly, the addition of van der Waals
interactions in the calculation of binding energies, ΔE, essentially compensates for
the thermal and entropic corrections to ΔG. As a result, calculated ΔE values from
simple B3LYP/TZVP calculations are actually good estimates for corresponding ΔG
values and can be used to roughly estimate Keq values in a fast and straightforward
way. Although calculated Keq values are prone to errors, calculated MI binding
constants indicate that the thermodynamic σ-trans effect exerted by HNO and CO in
these six-coordinate heme complexes is essentially equal, independent of the
computational method employed. Additionally, the binding constants for MI to
[Fe(P)(NHO)] are consistently predicted six orders of magnitude higher than those
for MI ligation to [Fe(P)(NO)]. This indicates that the thermodynamic σ-trans effect
induced by HNO is significantly weaker than that induced by NO, and is instead
comparable to that of CO. This conclusion is supported by (a) Fe-NMI bond lengths in
both model complexes and DFT-calculated geometries and (b) molecular orbital
analysis of the key σ-bonding orbitals in these complexes, as described in this
paper. The optimized Fe-NMI bond length of [Fe(P)(MI)(NHO)] is ~0.1 Å shorter than
that in [Fe(P)(MI)(NO)], essentially equal to [Fe(P)(MI)(CO)], and ~0.09 Å longer
198
than that in [Fe(P)(MI)2]. Molecular orbital analysis indicates 23% less Fe-dz2
character in the relevant π*h_dz2 orbital of HNO relative to that of the strong σ-trans
ligand NO. Hence, HNO is predominantly a π-backbonding ligand, similar to CO. As
such, we predict that HNO cannot directly activate sGC through binding to the heme
and cleavage of the Fe-NHis105 bond.
Experimental
To determine the accuracy of density functional theory (DFT) methods for the
prediction of structures and binding constants in ferrous heme complexes, an
investigation into various computational methods was performed. Functionals utilized
include BP86,60-61
B3LYP,61-63
O3LYP,64-65
OLYP,66-67
and mPWVWN68-69
in
combination with the basis sets TZVP,70-71
LanL2DZ*,72-73
6-31G*,74
and 6-
311++G**.75
Modified versions of the hybrid functionals were also utilized. This
includes addition of van der Waals interactions (for example, B3LYP-D) or decrease
of the HF exact exchange contribution to 15% (for example, B3LYP*).56-57
The most
accurate computational results were obtained using the BP86 functional and TZVP
basis set for geometry optimizations and the B3LYP-D functional and TZVP basis
set for total energy calculations (unless stated otherwise). The calculated lowest
energy spin state was utilized for all five-coordinate complexes unless the spin state
is known experimentally. Counterpoise calculations to estimate the basis set
superposition error (BSSE) are also included in all calculated ΔE values. Frequency
calculations were performed using the same basis set/functional combination as the
optimizations to determine the thermal and entropic corrections to ΔE to obtain the
Gibbs free energies, ΔG, for all reactions.
199
All geometry optimizations and single point energy calculations were
performed with the program package Gaussian 03.76
Molecular orbitals were
obtained from single point calculations using ORCA.77
In all calculations,
convergence was reached when the relative change in the density matrix between
subsequent iterations was less that 1 x 10⁻⁸
. Molecular orbitals were plotted with the
program orca_plot included in the ORCA package and visualized using GaussView.
References
1. Culottta, E.; Koshland, D. E., Jr., Science 1992, 258, 1862-1865.
2. Bredt, D. S.; Snyder, S. H., Annu. Rev. Biochem. 1994, 63, 175-195.
3. Moncada, S.; Palmer, R. M.; Higgs, E. A., Pharmacol. Rev. 1991, 43, 109-142.
4. Butler, A. R.; Williams, D. L. H., Chem. Soc. Rev. 1993, 223-241.
5. Ignarro, L., Nitric Oxide: Biology and Pathobiology. Academic Press: San Diego, 2000.
6. Lui, S. M.; Soriano, A.; Cowan, J. A., J. Am. Chem. Soc. 1993, 115, 10483-10486.
7. Crane, B. R.; Seigel, L. M.; Getzoff, E. D., Biochemistry 1997, 36, 12120-12137.
8. Shiro, Y.; Fujii, M.; Iisuka, T.; Adachi, S.; Tsukamoto, K.; Nakahara, K.; Shoun, H., J. Biol. Chem. 1995, 270, 1617-1623.
9. Lehnert, N.; Praneeth, V. K. K.; Paulat, F., J. Comput. Chem. 2006, 27, 1338-1351.
10. Nagasawa, H. T.; DeMaster, E. G.; Redfern, B.; Shirota, F. N.; Goon, D. J. W., J. Med. Chem. 1990, 33, 3120-3122.
11. Lopez, B. E.; Wink, D. A.; Fukuto, J. M., Arch. Biochem. Biophys. 2007, 465, 430-436.
12. Paolocci, N.; Jackson, M. I.; Lopez, B. E.; Miranda, K.; Tocchetti, C. G.; Wink, D. A.; Hobbs, A. J.; Fukuto, J. M., Pharmacol. Ther. 2007, 113, 442-458.
13. Arnelle, D. R.; Stamler, J. S., Arch. Biochem. Biophys. 1995, 318, 279-285.
14. Schmidt, H. H. H. W.; Hofmann, H.; Schindler, U.; Shutenko, Z. S.; Cunningham, D. D.; Feelish, M., Proc. Natl. Acad. Sci. USA 1996, 93, 14492-14497.
200
15. Miranda, K. M., Coord. Chem. Rev. 2005, 249, 433-455.
16. Doctorovich, F.; Bikiel, D.; Pellegrino, J.; Suarez, S. A.; Larsen, A.; Marti, M. A., Coord. Chem. Rev. 2011, 255, 2764-2784.
17. Miller, T. W.; Cherney, M. M.; Lee, A. J.; Francoleon, N. E.; Farmer, P. J.; King, S. B.; Hobbs, A. J.; Miranda, K. M.; Burstyn, J. N.; Fukuto, J. M., J. Biol. Chem. 2009, 284, 21788-21796.
18. Ignarro, L. J., J. Biochem. Soc. Trans. 1992, 20, 465-469.
19. Zhao, Y.; Marletta, M. A., Biochemistry 1997, 36, 15959-15964.
20. Traylor, T. G.; Sharma, V. S., Biochemistry 1992, 31, 2847-2849.
21. Yu, A. E.; Hu, S. S. T. G.; Burstyn, J. N., J. Am. Chem. Soc. 1994, 116, 4117-4118.
22. Zhao, Y.; Brandish, P. E.; Ballou, D. P.; Marletta, M. A., Proc. Natl. Acad. Sci. USA 1999, 96, 14753-14758.
23. Goodrich, L. E.; Paulat, F.; Praneeth, V. K. K.; Lehnert, N., Inorg. Chem. 2010, 49, 6293-6316.
24. Cary, S. P.; Winger, J. A.; Marletta, M. A., Proc. Natl. Acad. Sci. USA 2005, 102, 13064-13069.
25. Fernoff, N. B.; Derbyshire, E. R.; Marletta, M. A., Proc. Natl. Acad. Sci. USA 2009, 106, 21602-21607.
26. Kimura, H.; Mittal, C. K.; Murad, F., J. Biol. Chem. 1975, 250, 8016-8022.
27. Paolocci, N.; Saavedra, W. F.; Miranda, K. M.; Martignani, C.; Isoda, T.; Hare, J. M.; Espey, M. G.; Fukuto, J. M.; Feelisch, M.; Wink, D. A.; Kass, D. A., Proc. Natl. Acad. Sci. USA 2001, 98, 10463-10468.
28. Ellis, A.; Li, C. G.; Rand, M. J., Br. J. Pharmacol. 2000, 129, 315-322.
29. Favaloro, J. L.; Kemp-Harper, B. K., Cardiovas. Res. 2007, 73, 587-596.
30. Fukuto, J. M.; Chiang, K.; Hszieh, R.; Wong, P.; Chaudhuri, G., J. Pharmacol. Exp. Ther. 1992, 263, 546-551.
31. Fukuto, J. M.; Hobbs, A. J.; Ignarro, L. J., Biochem. Biophys. Res. Commun. 1993, 196, 707-713.
32. Murphy, M. E.; Sies, H., Proc. Natl. Acad. Sci. USA 1991, 88, 10860-10864.
33. Dierks, E. A.; Burstyn, J. N., Biochem. Pharmacol. 1996, 51, 1593-1600.
34. Zeller, A.; Wenzl, M. V.; Beretta, M.; Stessel, H.; Russwurm, M.; Koesling, D.; Schmidt, K.; Mayer, B., Mol. Pharmacol. 2009, 76, 1115-1122.
201
35. Praneeth, V. K. K.; Näther, C.; Peters, G.; Lehnert, N., Inorg. Chem. 2006, 45, 2795-2811.
36. Berto, T. C.; Praneeth, V. K. K.; Goodrich, L. E.; Lehnert, N., J. Am. Chem. Soc. 2009, 131, 17116-17126.
37. Lehnert, N.; Sage, J. T.; Silvernail, N.; Scheidt, W. R.; Alp, E. E.; Sturhahn, W.; Zhao, J., Inorg. Chem. 2010, 49, 7197-7215.
38. Stone, J. R.; Marletta, M. A., Biochemistry 1994, 33, 5636-5640.
39. Burstyn, J. N.; Yu, A. E.; Dierks, E. A.; Hawkins, B. K.; Dawson, J. H., Biochemistry 1995, 34, 5896-5903.
40. Leu, B. M.; Silvernail, N. J.; Zgierski, M. Z.; Wyllie, G. R. A.; Ellison, M. K.; Scheidt, W. R.; Zhao, J.; Sturhahn, W.; Alp, E. E.; Sage, J. T., Biophys. J. 2007, 92, 3764-3783.
41. Wyllie, G. R. A.; Schulz, C. E.; Scheidt, W. R., Inorg. Chem. 2003, 42, 5722-5734.
42. Salzmann, R.; Ziegler, C. J.; Godbout, N.; McMahon, M. T.; Suslick, K. S.; Oldfield, E., J. Am. Chem. Soc. 1998, 120, 11323-11334.
43. Li, J.; Nair, S. M.; Noll, B. C.; Schulz, C. E.; Scheidt, W. R., Inorg. Chem. 2008, 47, 3841-3850.
44. Erbil, W. K.; Price, M. S.; Wemmer, D. E.; Marletta, M. A., Proc. Natl. Acad. Sci. USA 2009, 106, 19753-19760.
45. Ma, X.; Sayed, N.; Bbeuve, A.; van den Akker, F., EMBO J. 2007, 26, 578-588.
46. Muralidharan, S.; Boon, E. M., J. Am. Chem. Soc. 2012, 134, 2044-2046.
47. Silvernail, N. J.; Olmstead, M. M.; Noll, B. C.; Scheidt, W. R., Inorg. Chem. 2009, 48, 971-977.
48. Graeme, R. A.; Schulz, C. E.; Scheidt, W. R., Inorg. Chem. 2003, 42, 5722-5734.
49. Immoos, C. E.; Sulc, F.; Farmer, P. J.; Czarnecki, K.; Bocian, D. F.; Levina, A.; Aitken, J. B.; Armstrong, R. S.; Lay, P. A., J. Am. Chem. Soc. 2005, 127, 814-815.
50. Ellison, M. K.; Schulz, C. E.; Scheidt, W. R., Inorg. Chem. 2002, 41, 2173-2181.
51. Radon, M.; Pierloot, K., J. Phys. Chem. A 2008, 112, 11824-11832.
52. Ling, Y.; Mills, C.; Weber, R.; Yang, L.; Zhang, Y., J. Am. Chem. Soc. 2010, 132, 1583-1591.
53. Lehnert, N.; Berto, T. C.; Galinato, M. G. I.; Goodrich, L. E., The Role of Heme-Nitrosyls in the Biosynthesis, Transport, Sensing, and Detoxification of Nitric
202
Oxide (NO) in Biological Systems: Enzymes and Model Complexes. In The Handbook of Porphyrin Science, Kadish, K.; Smith, K.; Guilard, R., Eds. World Scientific: 2011; Vol. 15, pp 1-247.
54. Jensen, K. P.; Ryde, U., Mol. Phys. 2003, 101, 2003-2018.
55. Portela, C. F.; Magde, D.; Traylor, T. G., Inorg. Chem. 1993, 32, 1313-1320.
56. Reiher, M.; Salomon, O.; Hess, B. A., Theor. Chem. Acc. 2001, 107, 48-55.
57. Siegbahn, P. E. M.; Blomberg, M. R. A.; Chen, S.-L., J. Chem. Theory Comput. 2010, 6, 2040-2044.
58. Praneeth, V. K. K.; Paulat, F.; Berto, T. C.; DeBeer George, S.; Näther, C.; Sulok, C. D.; Lehnert, N., J. Am. Chem. Soc. 2008, 130, 15288-15303.
59. Montenegro, A. C.; Amorebieta, V. T.; Slep, L. D.; Martin, D. F.; Roncaroli, F.; Murgida, D. H.; Bari, S. E.; Olabe, J. A., Angew. Chem. Int. Ed. 2009, 48, 4213-4216.
60. Perdew, J. P., Phys. Rev. B 1986, 33, 8822-8824.
61. Becke, A. D., Phys. Rev. A 1988, 38, 3098-3100.
62. Becke, A. D., J. Chem. Phys. 1993, 98, 1372-1377.
63. Becke, A. D., J. Chem. Phys. 1993, 98, 5648-5652.
64. Handy, N. C.; Cohen, A. J., Mol. Phys. 2001, 99, 403-412.
65. Hoe, W.-M.; Cohen, A.; Handy, N. C., Chem. Phys. Lett. 2001, 341, 319-328.
66. Lee, C.; Yang, W.; Parr, R. G., Phys. Rev. B. 1988, 37, 785-789.
67. Miehlich, B.; Savin, A.; Stoll, H.; Preuss, H., Chem. Phys. Lett. 1989, 157, 200-206.
68. Adamo, C.; Barone, V., J. Chem. Phys. 1998, 108, 664-675.
69. Vosko, S. H.; Wilk, L.; Nusair, M., Can. J. Phys. 1980, 58, 1200-1211.
70. Schaefer, A.; Horn, H.; Ahlrichs, R., J. Chem. Phys. 1992, 97, 2571-2577.
71. Schaefer, A.; Huber, C.; Ahlrichs, R., J. Chem. Phys. 1994, 100, 5829-5835.
72. Praneeth, V. K. K.; Neese, F.; Lehnert, N., Inorg. Chem. 2005, 44, 2570-2572.
73. Lehnert, N.; Galinato, M. G. I.; Paulat, F.; Richter-Addo, G. B.; Sturhahn, W.; Zhao, J., Inorg. Chem. 2010, 49, 4133-4148.
74. Rassolov, V.; Pople, J. A.; Ratner, M.; Redfern, P. C.; Curtiss, L. A., J. Comp. Chem. 2001, 22, 976-984.
203
75. Raghavachari, K.; Binkley, J. S.; Seeger, R.; Pople, J. A., J. Chem. Phys. 1980, 72, 650-654.
76. Frisch, M. J.; Trucks, G. W.; Schlegel, H. B.; Scuseria, G. E.; Robb, M. A.; Cheeseman, J. R.; Montgomery, J., J. A.; Vreven, T.; Kudin, K. N.; Burant, J. C.; Millam, J. M.; Iyengar, S. S.; Tomasi, J.; Barone, V.; Mennucci, B.; Cossi, M.; Scalmani, G.; Rega, N.; Petersson, G. A.; Nakatsuji, H.; Hada, M.; Ehara, M.; Toyota, K.; Fukuda, R.; Hasegawa, J.; Ishida, M.; Nakajima, T.; Honda, Y.; Kitao, O.; Nakai, H.; Klene, M.; Li, X.; Knox, J. E.; Hratchian, H. P.; Cross, J. B.; Bakken, V.; Adamo, C.; Jaramillo, J.; Gomperts, R.; Stratmann, R. E.; Yazyev, O.; Ausin, A. J.; Cammi, R.; Pomelli, C.; Octerski, J. W.; Ayala, P. Y.; Morokuma, K.; Voth, G. A.; Salvador, P.; Dannenberg, J. J.; Zakrzewski, V. G.; Dapprich, S.; Daniels, A. D.; Strain, M. C.; Farkas, O.; Makick, D. K.; Rabuck, A. D.; Raghavachair, K.; Foresman, J. B.; Ortiz, J. V.; Cui, Q.; Baboul, A. G.; Clifford, S.; Cioslowski, J.; Stefanov, B. B.; Lui, G.; Laishenko, A.; Piskorz, R.; Komaromi, I.; Martin, R. L.; Fox, D. J.; Keith, T.; Al-Laham, M. A.; Peng, C. Y.; Nanayakkara, A.; Challacombe, M.; Gill, P. M. W.; Johnson, B.; Chen, W.; Wong, M. W.; Gonzalez, C.; Pople, J. A. Gaussin 03, Gaussian, Inc.: Pittsburgh, PA, 2003.
77. Neese, F. ORCA, 2.2; Max-Planck Institut feur Bioanorganische Chemie: Meulheim/Ruhr, Germany, 2004.
204
Chapter 6
Conclusions
The critical degradation of toxic nitric oxide (NO) in biological systems is
performed either through the oxidation of NO to nitrate by globins1 or through
reduction to nitrous oxide (N2O) by a class of enzymes called nitric oxide reductases
(NORs). Bacterial and fungal NORs reduce NO to N2O as a part of the denitrification
process where nitrate is reduced in a step-wise fashion to N2 (bacteria) or N2O
(fungi).2 The fungal NOR, cytochrome P450 nitric oxide reductase (P450nor), is a
ferric heme thiolate enzyme.3-4
This dissertation is focused on the generation of
small molecule models of intermediates in the catalytic cycle of P450nor.
The first step in reduction of NO to N2O by P450nor is coordination of NO to
the active site ferric heme to generate a ferric heme-nitrosyl complex with cysteinate
ligation.5 Chapter 2 is focused on synthesis of model complexes of this important
intermediate. In the first section, we screen both porphyrin and thiolate ligands in an
attempt to prepare stable ferric heme-nitrosyl complexes with thiolate ligation. While
the porphyrin ligand appears to contribute to fine tuning the stability of ferric nitrosyls
with thiolate coordination, the key factor to successful preparation of ferric heme-
nitrosyls is the presence of SR-H2¯, a two hydrogen-bond stabilized thiolate ligand.6
Unfortunately, the synthesis of SR-H2¯ is time consuming and results in low yields.
For this reason, we have developed a new synthetic procedure for large scale
preparation of this important ligand. In the second section, the reactivity of NO with
205
ferric heme phenolate complexes was tested. Surprisingly, upon addition of NO,
decomposition of the complex was observed rather than formation of the desired six-
coordinate ferric nitrosyl. Finally, the effect of axial ligand donor strength on ferric
heme-nitrosyls was explored. DFT calculations predict that as electron donation from
the axial ligand increases, the Fe-NO and N-O bonds become weaker. This is
accompanied by a distinct bending of the Fe-N-O unit.7 Excitingly, this trend is also
observed experimentally.
Chapter 3 is focused on modeling the second intermediate in the catalytic
cycle of P450nor, a ferrous heme-nitroxyl complex.8 Here, a new bis-picket fence
porphyrin ferrous nitrosyl complex is prepared and one-electron reduction is
performed. The N-O stretching frequency of the resulting reduced species ({FeNO}8)
is 1466 cm-1
. This is in agreement with other {FeNO}8 porphyrin complexes reported
previously. Importantly, we have demonstrated that the trans effect of bound NO¯ is
stronger than that of NO in ferrous heme systems. Upon one-electron reduction of
the six-coordinate complex [Fe(To-F2PP)(MI)(NO)], the resulting complex, [Fe(To-
F2PP)(NO)]¯, is five-coordinate. This indicates loss of MI upon reduction to the
{FeNO}8 complex, and an increased trans effect of NO¯ relative to NO. DFT results
support this finding and indicate that the key molecular orbital, π*h_dz2, responsible
for the σ-trans effect in {FeNO}7 systems does not change upon one-electron
reduction. Additionally, the reactivity of {FeNO}8 complexes with acid and free NO
was explored. [Fe(To-F2PP)(NO)]¯ reacts with acetic acid to generate the
corresponding {FeNO}7 complex and 0.5 equivalents H2. Finally, reaction of [Fe(To-
F2PP)(NO)]¯ with NO results in reduction of free NO to NO¯ and oxidation of the
ferrous nitroxyl complex to [Fe(To-F2PP)(NO)].
206
Chapter 4 addresses the key intermediate in the catalytic cycle of P450nor
responsible for the crucial N-N bond formation. This intermediate is proposed to be a
Fe(IV)-NHOH complex9 or, upon loss of water, a Fe(VI)-N heme complex. In the first
part of Chapter 4, we prepare a bis-picket fence porphyrin ferric O-
benzylhydroxylamide complex, [Fe(3,5-Me-BAFP)(NHOBn)]. This complex is now
ready for one-electron oxidation to the corresponding Fe(IV) complex and reaction
with NO. In the second half of Chapter 4, we work towards preparing high-valent
heme-nitride complexes. DFT calculations suggest that in the presence of an axial
thiolate ligand, as is found in P450nor, loss of water from a doubly protonated
ferrous nitroxyl complex is energetically feasible. Additionally, irradiation of heme
azide complexes was tested in an attempt to generate a Fe(V)-nitride complex
through release of N2. Unfortunately, irradiation of both five- and six-coordinate ferric
bis-picket fence porphyrin azide complexes resulted in photoinduced cleavage of the
Fe-N3 bond, generating the corresponding ferrous complexes rather than the desired
Fe(V)-N complex.
Finally, in Chapter 5, activation of the primary mammalian nitric oxide (NO)
sensor, soluble guanylate cyclase (sGC), is discussed. Through the strong
thermodynamic σ-trans effect of NO, binding of NO at the distal side of the ferrous
heme induces cleavage of the proximal Fe-NHis bond, activating the catalytic domain
of the enzyme.10
It has been proposed that nitroxyl (HNO) is also capable of
activating sGC, but the key question remains as to whether HNO can induce
cleavage of the Fe-NHis bond. Here, we report calculated binding constants for 1-
methylimidazole (MI) to [Fe(P)(X)] (P = porphine2-
) where X = NO, HNO, CO, and MI
to evaluate the trans interaction of these molecules, X, with the proximal imidazole
(histidine) in sGC. A systematic assessment of DFT methods suggests that the
207
prediction of accurate MI binding constants is critically dependent on the inclusion of
van der Waals interactions (-D functionals). Calculated (B3LYP-D/TZVP) MI binding
constants for X = NO and MI are 110 and 5.6 x 10⁵ M
-1, respectively, predicted only
one order of magnitude higher than the corresponding experimentally determined
values. MI binding constants where X = HNO and CO are consistently predicted to
be essentially equal and around six orders of magnitude larger than those of NO,
indicating that CO and HNO mediate a weak thermodynamic trans effect in this
system. Orbital analysis of the key σ-bonding orbital, π*h_dz2, and comparison of Fe-
NMI bond lengths support this prediction. This suggests that HNO does not induce a
σ-trans effect strong enough to promote cleavage of the Fe-NHis bond—a key step in
activation of sGC.11
References
1. Gardner, P. R.; Gardner, A. M.; Martin, L. A.; Salzman, A. L., Proc. Natl. Acad. Sci. USA 1998, 95, 10378-10383.
2. Zumft, W. G., J. Inorg. Biochem. 2005, 99, 194-215.
3. Nakahara, K.; Tanimoto, T.; Hatano, K.; Usuda, K.; Shoun, H., J. Biol. Chem. 1993, 268, 8350-8355.
4. Lehnert, N.; Berto, T. C.; Galinato, M. G. I.; Goodrich, L. E., The Role of Heme-Nitrosyls in the Biosynthesis, Transport, Sensing, and Detoxification of Nitric Oxide (NO) in Biological Systems. In Handbook of Porphyrin Science, Kadish, K.; Smith, K.; Guilard, R., Eds. World Scientific: 2011; Vol. 15, pp 1-247.
5. Shiro, Y.; Fujii, M.; Iizuka, T.; Adachi, S.; Tsukamoto, K.; Nakahara, K.; Shoun, H., J. Biol. Chem. 1995, 270, 1617-1623.
6. Goodrich, L. E.; Paulat, F.; Praneeth, V. K. K.; Lehnert, N., Inorg. Chem. 2010, 49, 6293-6316.
7. Xu, N.; Goodrich, L. E.; Lehnert, N.; Powell, D. R.; Richter-Addo, G. B., 2012, submitted for publication.
8. Goodrich, L. E.; Roy, S.; Matzger, A. J.; Lehnert, N., 2012, manuscript in preparation.
208
9. Lehnert, N.; Praneeth, V. K. K.; Paulat, F., J. Comp. Chem. 2006, 27, 1338-1351.
10. Traylor, T. G.; Sharma, V. S., Biochemistry 1992, 31, 2847-2849.
11. Goodrich, L. E.; Lehnert, N., J. Inorg. Biochem. 2012, accepted.
Related Documents