JOURNAL OF GEOPHYSICAL RESEARCH, VOL. 99, NO. A7, PAGES 13,489-13,498, JULY 1, 1994 Model calculation of energetic neutral atoms precipitation at low altitudes S. Orsini, xI. A. Dglis, 2 M. Cndidi, x K. C. Hsieh, s'4 S. Livi,2andB. Wilken 2 Abstract. It has become apparent during recent years that giobal magnetospheric imaging through the detection of energetic neutral atoms (ENA) will be a crucial tool for the advancement of magnetospheric reseaxch via remote sensing technique. This report presents model calculations of ENA precipitationas detectable from a satellite orbiting at low •ltitudes (<1500 kin). The ENA generation via charge exchange betwden energetic ionsand geocorona] neutrals is simulated in the inner magnetosphere, between 1.5R• and 10R•, where both neutral densities and ion fluxes are significantly high. AMPTE/CCE energetic ion measurements and the geocoronal neutral H altitude profile are used to simulate the chaxge exchange process leadingto ENA production. We discuss the relative contribution of ring currentand radiationbelts, as well as the relative contribution of H+ and 0 + to the ENA generation. 1. Introduction In the past decade someaspects of energetic neutral atoms (ENA) generation and detection in the Earth's magnetosphere havebeen discussed [e.g.,Roelof et al., 1985;Roelof, 1987]. Nevertheless, we reviewthe ENA generation process and detection techniques in order to introduce the reader to the new approach we propose in the following sections. 1.1. ENA Generation Energetic neutral atoms (ENA) areatoms with ener- giesin the range ~ 1 keV to ~ i MeV. They are pro- ducedwhen energeticions undergoa chargeexchange interaction with relatively cold(~ 1000 ø K) ambient neutral backgroundatoms. This cloud of cold neutral atomsresonantly scatters solar Lyman alpha radiation, producing a faint glowaroundthe Earth called the "geo- corona". The only neutral species present in signifi- cant numbers in the Earth's magnetosphere is hydrogen. The hydrogen geocorona has beenimaged from the DE I spacecraft, and the approximate radial dependence of the geocoronal H atom density was determined by Rair- denet al. [1986] on the basis of the Chamberlain model [Chamberlain, 1963]. At lowaltitudes (< 2000 km) the relative importanceof neutral atmospheric densities of 11stitutodi Fisica dello Spazio Interplanetario, Frascati, Italy. 2Max-Planck-Institutfiir Aeronomie, Katlenburg-Lindau, Germany. 3National Space Program Office, Hsinchu, Taiwan. 4 On leavefrom Department of Physics, Universityof Arizona, Tucson. Copyright 1994 by the American Geophysical Union. Paper number 93JA03270. 0148-0227/94/93JA-03270505.00 H and O is a strongfunction of solar activity, with the O density risingdramatically duringhigh solaractivity [McEntire andMitchell, 1989]. The main charge exchange processes involvingener- geticionsand coldneutrals are the following: H+ + H --• H + H + (1) O + + H -• O + H + (2) H+ + O -• H + O + .(3) O + + O-• O + O + (4) The most important processes are the first two, cor- responding to H+ and O + interacting with neutral ex- ospheric hydrogen. The result of a charge exchange collision is that the energetic ion is neutralized by the electron of the cold atom. After the interaction the produced ENA, with essentiallythe sourceion's initial energy, travels in a ballistic trajectory, since it is no more affected by magneticor electricfields. Charge ex- change collisions are rare, but around the Earth such a mechanism is active over a wide range of altitudes, so that the resulting ENA fluxes become significantly high, especially during active times. 1.2. ENA Detection The straight-line paths of ENA from the point of charge exchange permit the imaging of the ENA emit- ting regionsof the magnetosphere in a manner anal- ogousto the imaging of the aurora by the detection of photons emitted from the upper atmosphere. The detection of ENA coming from different regionsof the magnetosphere will enable us to monitor the global magnetospheric dynamicsand the spatial and tempo- ral evolution of the hot plasma components. Global observations will make a major advance in the study of 13,489

Welcome message from author
This document is posted to help you gain knowledge. Please leave a comment to let me know what you think about it! Share it to your friends and learn new things together.
Transcript
JOURNAL OF GEOPHYSICAL RESEARCH, VOL. 99, NO. A7, PAGES 13,489-13,498, JULY 1, 1994
Model calculation of energetic neutral atoms precipitation at low altitudes
S. Orsini, x I. A. Dglis, 2 M. Cndidi, x K. C. Hsieh, s'4 S. Livi, 2 and B. Wilken 2
Abstract. It has become apparent during recent years that giobal magnetospheric imaging through the detection of energetic neutral atoms (ENA) will be a crucial tool for the advancement of magnetospheric reseaxch via remote sensing technique. This report presents model calculations of ENA precipitation as detectable from a satellite orbiting at low •ltitudes (<1500 kin). The ENA generation via charge exchange betwden energetic ions and geocorona] neutrals is simulated in the inner magnetosphere, between 1.5R• and 10R•, where both neutral densities and ion fluxes are significantly high. AMPTE/CCE energetic ion measurements and the geocoronal neutral H altitude profile are used to simulate the chaxge exchange process leading to ENA production. We discuss the relative contribution of ring current and radiation belts, as well as the relative contribution of H + and 0 + to the ENA generation.
1. Introduction
In the past decade some aspects of energetic neutral atoms (ENA) generation and detection in the Earth's magnetosphere have been discussed [e.g., Roelof et al., 1985; Roelof, 1987]. Nevertheless, we review the ENA generation process and detection techniques in order to introduce the reader to the new approach we propose in the following sections.
1.1. ENA Generation
Energetic neutral atoms (ENA) are atoms with ener- gies in the range ~ 1 keV to ~ i MeV. They are pro- duced when energetic ions undergo a charge exchange interaction with relatively cold (~ 1000 ø K) ambient neutral background atoms. This cloud of cold neutral atoms resonantly scatters solar Lyman alpha radiation, producing a faint glow around the Earth called the "geo- corona". The only neutral species present in signifi- cant numbers in the Earth's magnetosphere is hydrogen. The hydrogen geocorona has been imaged from the DE I spacecraft, and the approximate radial dependence of the geocoronal H atom density was determined by Rair- den et al. [1986] on the basis of the Chamberlain model [Chamberlain, 1963]. At low altitudes (< 2000 km) the relative importance of neutral atmospheric densities of
11stituto di Fisica dello Spazio Interplanetario, Frascati, Italy. 2Max-Planck-Institut fiir Aeronomie, Katlenburg-Lindau,
Germany. 3National Space Program Office, Hsinchu, Taiwan. 4 On leave from Department of Physics, University of Arizona,
Tucson.
Copyright 1994 by the American Geophysical Union.
Paper number 93JA03270. 0148-0227/94/93JA-03270505.00
H and O is a strong function of solar activity, with the O density rising dramatically during high solar activity [McEntire and Mitchell, 1989].
The main charge exchange processes involving ener- getic ions and cold neutrals are the following:
H+ + H --• H + H + (1)
O + + H -• O + H + (2)
H + + O -• H + O + .(3)
O + + O-• O + O + (4)
The most important processes are the first two, cor- responding to H + and O + interacting with neutral ex- ospheric hydrogen. The result of a charge exchange collision is that the energetic ion is neutralized by the electron of the cold atom. After the interaction the
produced ENA, with essentially the source ion's initial energy, travels in a ballistic trajectory, since it is no more affected by magnetic or electric fields. Charge ex- change collisions are rare, but around the Earth such a mechanism is active over a wide range of altitudes, so that the resulting ENA fluxes become significantly high, especially during active times.
1.2. ENA Detection
The straight-line paths of ENA from the point of charge exchange permit the imaging of the ENA emit- ting regions of the magnetosphere in a manner anal- ogous to the imaging of the aurora by the detection of photons emitted from the upper atmosphere. The detection of ENA coming from different regions of the magnetosphere will enable us to monitor the global magnetospheric dynamics and the spatial and tempo- ral evolution of the hot plasma components. Global observations will make a major advance in the study of
13,489
13,490 ORSINI ET AL.: ENERGETIC NEUTRAL ATOMS MODEL CALCULATION
magnetospheric processes. In particular, imaging of the entire magnetosphere in ENA fluxes will be a very use- ful tool for the understanding of the substorm processes [e.g., Rodof et al., 1985; Rodof, 1987].
The first indication of the presence of hydrogen ENA at auroral altitudes was reported by Meinel [1951] when he detected a blue-shifted hydrogen H line correspond- ing to 76 keV H in the magnetic zenith during an au- rora. Fan [1958] calculated the proton flux necessary for the observed Ha intensity to be ~10 a (cm -2 s-l), thus providing the first estimate of precipitating proton flux during an aurora breakup. This high proton flux during an aurora breakup was observed a decade later by the direct measurement of precipitated 1-20 keV pro- tons and electrons at 250 km altitude [Bernstein et al., 1•].
At 800 km altitude, high fluxes of keV neutral hy- drogen atoms were detected by the neutral hydrogen energy spectrometer aboard a Javelin sounding rocket launched from Wallops Island, Virginia, on March 7, 1970 [Wax et al., 1970]. The authors tried to identify ENA as of either solar or interstellar origin and received little attention from the community. Although the au- thors were fully aware of the significance of charge ex- change at altitudes < 450 kin, they ignored the role of the extended exosphere that overlaps with the radiation belt.
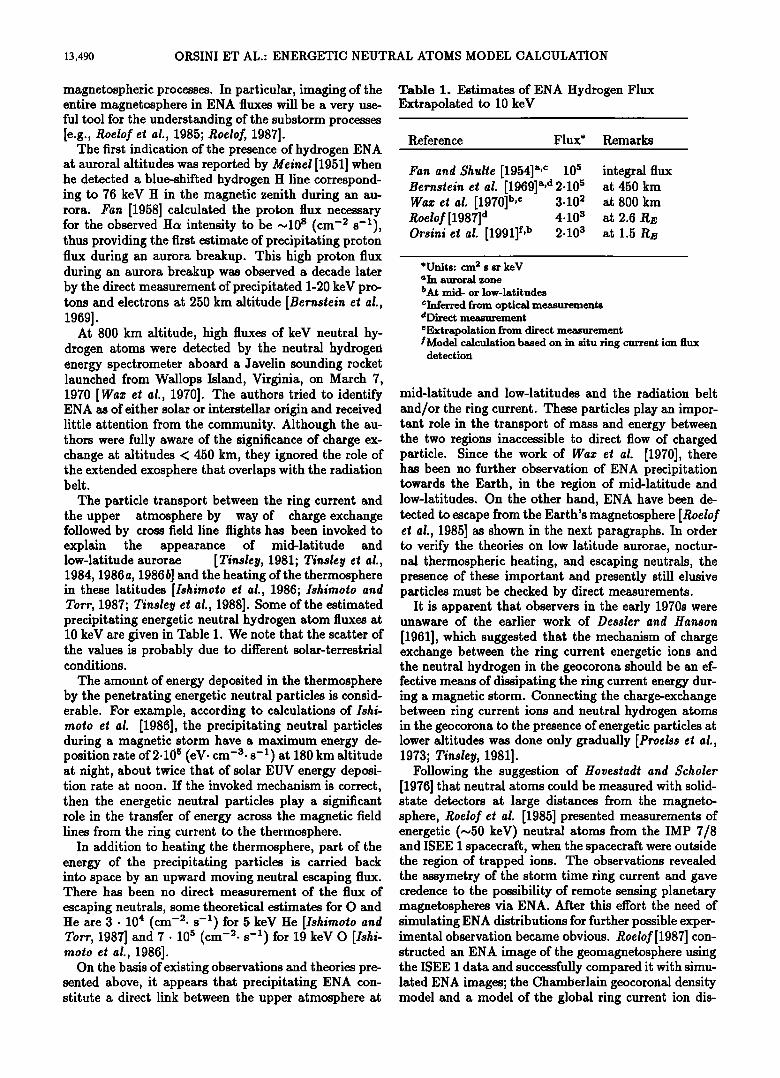
The particle transport between the ring current and the upper atmosphere by way of charge exchange followed by cross field line flights has been invoked to explain the appearance of mid-latitude and low-latitude aurorae [Tinsley, 1981; Tinsley et al., 1984, 1986a, 1986b] and the heating of the thermosphere in these latitudes [Ishimoto et al., 1986; Ishimoto and Tort, 1987; Tinsky et al., 1988]. Some of the estimated precipitating energetic neutral hydrogen atom fluxes at 10 keV are given in Table 1. We note that the scatter of the values is probably due to different solar-terrestrial conditions.
The amount of energy deposited in the thermosphere by the penetrating energetic neutral particles is consid- erable. For example, according to calculations of Ishi- moro et al. [1986], the precipitating neutral particles during a magnetic storm have a maximum energy de- position rate of2.105 (eV. cm -3. s -1) at 180 km altitude at night, about twice that of solar EUV energy deposi- tion rate at noon. If the invoked mechanism is correct, then the energetic neutral particles play a significant role in the transfer of energy across the magnetic field lines from the ring current to the thermosphere.
In addition to heating the thermosphere, part of the energy of the precipitating particles is carried back into space by an upward moving neutral escaping flux. There has been no direct measurement of the flux of
escaping neutrals, some theoretical estimates for O and 4 2 1
He are3. 10 (cm- .s- )for5keVHe [Ishimotoand Tort, 1987] and 7.105 (cm -2. s -1) for 19 keV O [ishi- moro et al., 1986].
On the basis of existing observations and theories pre- sented above, it appears that precipitating ENA con- stitute a direct link between the upper atmosphere at
Table 1. Estimates of ENA Hydrogen Flux Extrapolated to 10 keV
Reference Flux* Remarks
Fan and Shulte [1954] a,c 10 5 Bernstein et al. [1969]a'd2.105 Waz et al. [1970] b,e 3.102 Roelof [1987] d 4.10 a Orsini et al. [1991] f,b 2.10 a
integral flux at 450 km
at 800 km
at2.6 Rz at 1.5 Rz
*Units: cm 2 s sr keV aIn auroral zone
bat mid- or low-latitudes CInferred from optical measurements aDirect measurement eExtrapolation from direct measurement ! Model calculation based on in situ ring current ion flux
detection
mid-latitude and low-latitudes and the radiation belt
and/or the ring current. These particles play an impor- tant role in the transport of mass and energy between the two regions inaccessible to direct flow of charged particle. Since the work of Waz et al. [1970], there has been no further observation of ENA precipitation towards the Earth, in the region of mid-latitude and low-latitudes. On the other hand, ENA have been de- tected to escape from the Earth's magnetosphere [Roelof et al., 1985] as shown in the next paragraphs. in order to verify the theories on low latitude aurorae, noctur- nal thermospheric heating, and escaping neutrals, the presence of these important and presently still elusive particles must be checked by direct measurements.
It is apparent that observers in the early 1970s were unaware of the earlier work of Dessler and Hanson
[1961], which suggested that the mechanism of charge exchange between the ring current energetic ions and the neutral hydrogen in the geocorona should be an ef- fective means of dissipating the ring current energy dur- ing a magnetic storm. Connecting the charge-exchange between ring current ions and neutral hydrogen atoms in the geocorona to the presence of energetic particles at lower altitudes was done only gradually [Proelss et al., 1973; Tinsley, 1981].
Following the suggestion of Hovestadt and Scholer [1976] that neutral atoms could be measured with solid- state detectors at large distances from the magneto- sphere, Rodof et al. [1985] presented measurements of energetic (~50 keV) neutral atoms from the IMP 7/8 and ISEE I spacecraft, when the spacecraft were outside the region of trapped ions. The observations revealed the assymetry of the storm time ring current and gave credence to the possibility of remote sensing planetary magnetospheres via ENA. After this effort the need of simulating ENA distributions for further possible exper- imental observation became obvious. Roelof[1987] con- structed an ENA image of the geomagnetosphere using the ISEE I data and successfully compared it with simu- lated ENA images; the Chamberlain geocoronal density model and a model of the global ring current ion dis-
ORSINI ET AL.: ENERGETIC NEUTRAL ATOMS MODEL CALCULATION 13,491
tribution were used for the ENA simulation. This was
the first (and up to now the only) image of the Earth's magnetospheric plasma distributions through ENA de- tection.
We attempt to simulate the ENA distributions which should be detected by a low-altitude equatorial orbit- ing satellite, when its field of view points toward the Earth's magnetotail, around midnight local time. As shown in the next sections, we simulate the ENA distri- bution by using real energetic ion distribution data, as recently accumulated by the CHEM spectrometer on- board AMPTE/CCE in the equatorial magnetosphere between ~ 1.5RE and 9RE. Furthermore, we attempt to discriminate the contribution to ENA production by the ring current and the radiation belt ions respectively and compare our result with previous in situ observa- 27 tions.
2. Energetic Neutral Atoms Modeling
The energy spectra of energetic H and O neutral atoms at an altitude of 1400 km have been computed. The modeling technique assumes that these ENA are generated via charge exchange between the energetic ions of the plasma in the ring current and in the ra- diation belts (trapped there by the terrestrial magnetic field) and the neutral H gas of the geocorona. Once gen- erated, ENA do not feel the magnetic field, and travel freely, maintaining both the velocity direction and the energy of the incident ion.
The differential flux of H ENA of energy E originatin•g from • and arriving at a certain observation point R0 along the direction • can be derived using the following most general formula:
dj •t ( l•o , • , E)
= [jp(l•, E)•ps(E)ns(l•) - js(l•, •, E)DH(•, E)]ds (5)
where
E)
flux of H arriving at R0 along • with energy E, (cm 2 s sr keV)-•; flux of H arriving at R along • with en- ergy E, (cm 2 s sr keV)-•; flux of protons at R and of energy E, (cm2 s sr keV)- •; charge exchange cross section for pro- tons of energy E in target gas H; number density of neutral gas H, cm-S; destruction of energetic H or the por- tion of H generated at R but not arriv- ing at R0 as H;
equal to f de. np(l•, e) . • •ilt(e) + œo
. dl œ œ• YO (cm • s sr keY)- •; relative energy of projectile to energetic H as target (protons);
relative energy of projectile to energetic H as target (electrons); number density of protons of relative
is the relative velocity of proton of rele- tive energy e (assuming isotropic flux relative to H); ionization cross section of H bombarded
by projectile i of relative energy e; same as np(R, e), but for electrons (note e' is very different from e); electron impact ionization cross section; photoionization cross section as a func- tion of y; differential photon intensity at R.
The approach for other ENA species (like 0 or He) is similar. We will show in the following sections that, with the assumptions used in our study, the terms re- garding ENA destruction are negligible.
3. The Source Ion Distributions for
Modeling ENA Production
The ring current/radiation belts source-distribution for our ENA production modeling has been derived from the energetic ion measurements made by the charge- energy-mass (CHEM) spectrometer on board the Charge Composition Explorer (CCE), one of the three Active Magnetospheric Particle Tracers (AMPTE) spacecraft. The CCE spacecraft [Dassoulas et al., 1985] was fully operational from August 1984 to the end of 1988. It had an elliptic orbit with apogee at ~ 8.SRB, perigee at ~ 1.2R•, and an orbital inclination of ~ 4.8 ø. The or- bital period was ,,, 16 hours, the spacecraft was spin sta- bilized with the spin axis roughly along the Earth-Sun line and it had a spin period of ,,, 6 s. The orbit apogee moved through all local times within ,,, 12 months. It is obvious that the orbital configuration permitted an extensive monitoring of the near-Earth magnetosphere.
The CHEM spectrometer was able to determine the energy (r), mass per charge (M/Q) ratio, mass (M), and pitch angle (a) of all major magnetospheric ions in the range of ~ I to 300 keV/e, using a combina- tion of electrostatic deflection, post acceleration of up to 30 kV (which made the detection of low-energy heavy ions more efficient), and time-of-ffight and energy mea- surements [GIoeckler el al., 1985]. The energy range of ,,, I to 300 keV/e was sampled in 32 logarithmic steps with a 18.9 % spacing.
In order to obtain a source population data set for the ENA production simulation, we created a data set covering the whole range of distances (1.25 ( L (9.5) and magnetic local times (0000 to 2400 MLT) avail- able from the CCE orbit throughout the time period January 1985 to June 1987. We used average values of the 1-min auroral electrojet AE index to obtain the geomagnetic activity level for each L-MLT sample of CttEM data. The data were binned in 0.25R• intervals
13,492 ORSINI ET AL.' ENERGETIC NEUTRAL ATOMS MODEL CALCULATION
based on the values of L, in 20-min intervals based on the value of MLT and in three different geomagnetic activity levels defined as low (AE < 500 nT), medium (500 nT < AE < 1000 nT) and high (AE > 1000 nT). In the present study only data in the MLT region between 2300 and 0100 hours have been considered.
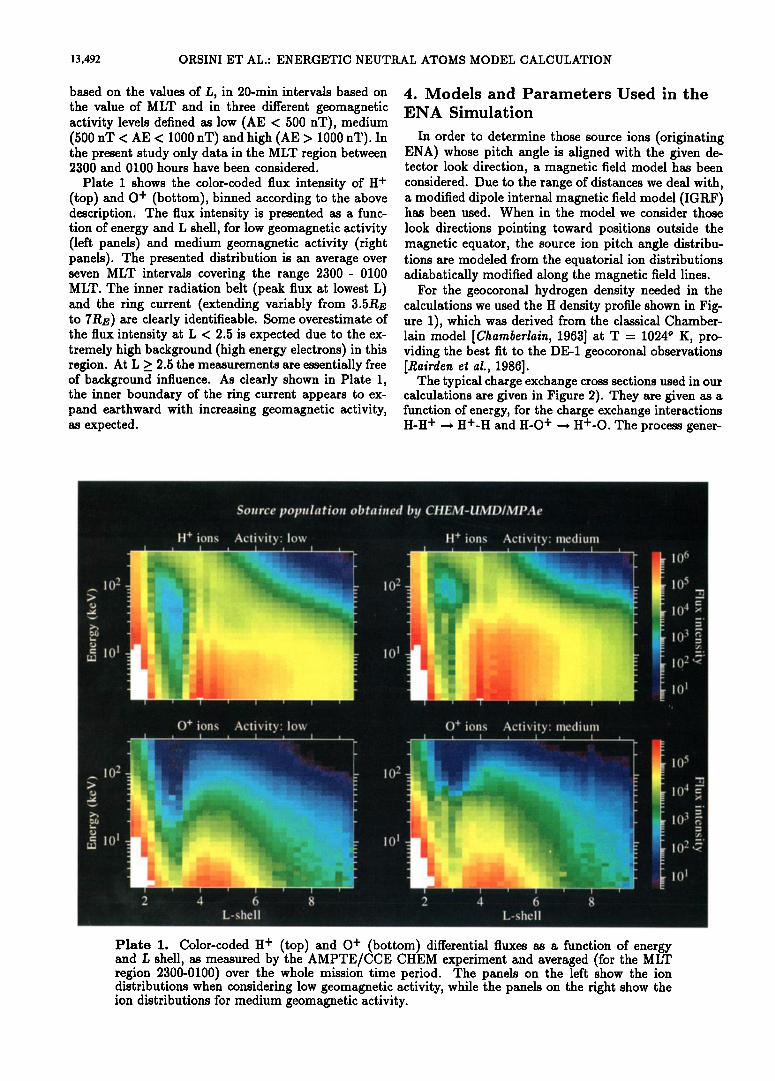
Plate I shows the color-coded flux intensity of H + (top) and O + (bottom), binned according to the above description. The flux intensity is presented as a func- tion of energy and L shell, for low geomagnetic activity (left panels) and medium geomagnetic activity (right panels). The presented distribution is an average over seven MLT intervals covering the range 2300- 0100 MLT. The inner radiation belt (peak flux at lowest L) and the ring current (extending variably from 3.5RE to 7Rr) are clearly identifieable. Some overestimate of the flux intensity at L < 2.5 is expected due to the ex- tremely high background (high energy electrons) in this region. At L _> 2.5 the measurements are essentially free of background influence. As clearly shown in Plate 1, the inner boundary of the ring current appears to ex- pand earthward with increasing geomagnetic activity, as expected.
4. Models and Parameters Used in the
ENA Simulation
In order to determine those source ions (originating ENA) whose pitch angle is aligned with the given de- tector look direction, a magnetic field model has been considered. Due to the range of distances we deal with, a modified dipole internal magnetic field model (IGRF) has been used. When in the model we consider those
look directions pointing toward positions outside the magnetic equator, the source ion pitch angle distribu- tions are modeled from the equatorial ion distributions adiabatically modified along the magnetic field lines.
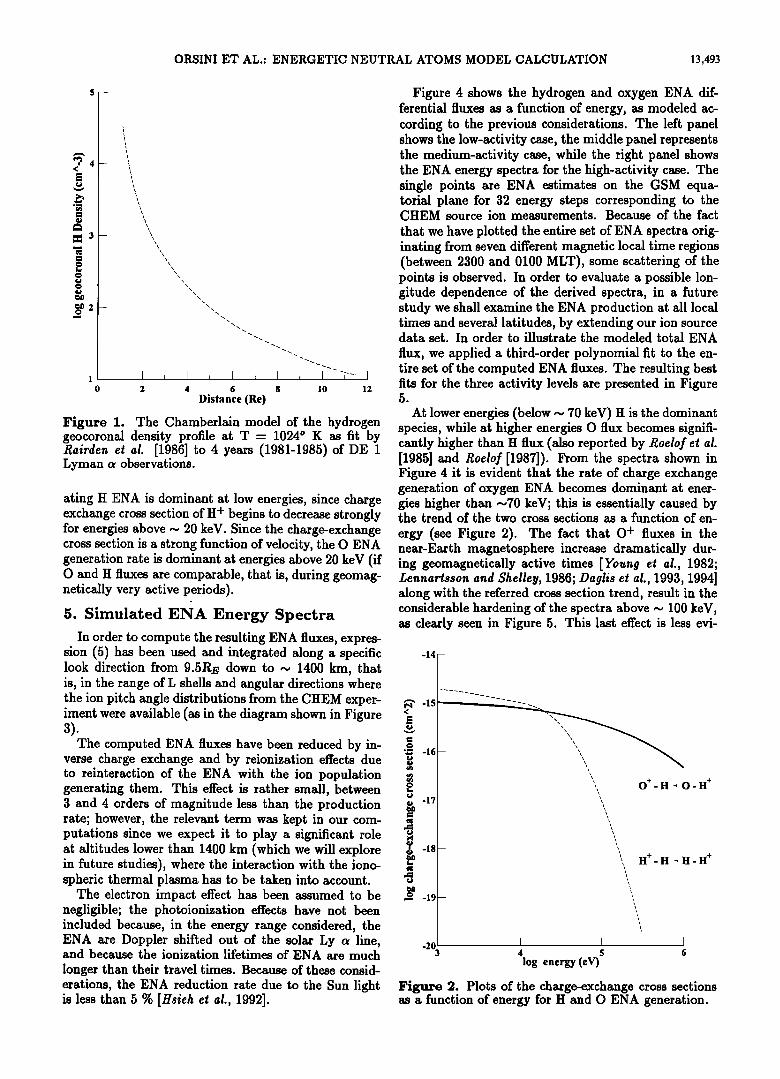
For the geocoronal hydrogen density needed in the calculations we used the H density profile shown in Fig- ure 1), which was derived from the classical Chamber- lain model [Chamberlain, 1963] at T = 1024 ø K, pro- viding the best fit to the DE-1 geocoronal observations [Rairden et al., 1986].
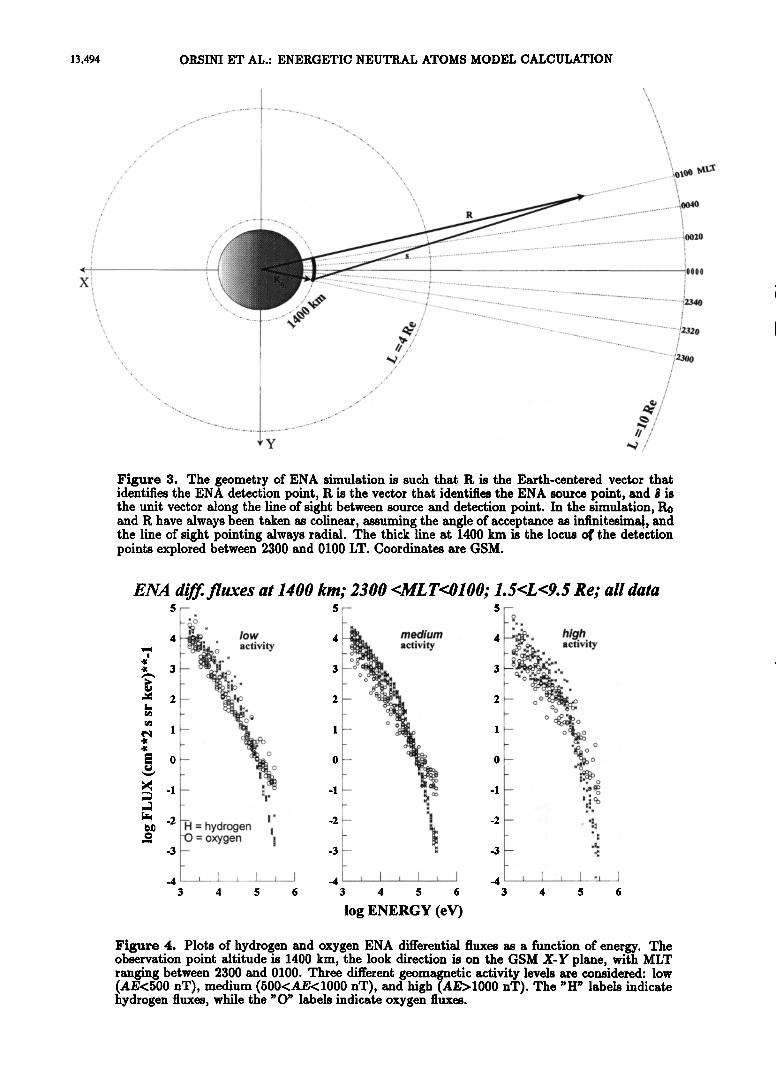
The typical charge exchange cross sections used in our calculations are given in Figure 2). They are given as a function of energy, for the charge exchange interactions H-H + • H+-H and H-O + • H+-O. The process gener-
Source population obtained by CHEM-UMDIMPAe
H + ions Activity: low H + ions Activity: medium
,., 10 2
= 10 !
10 2
101
O + ions Activity: low O + ions Activity: medium
,., 10 2
= 10 !
10 2
101
2 4 6 8 2 4 6 8 L-shell L-shell
Plate 1. Color-coded H + (top) and O + (bottom) differential fluxes as a function of energy and L shell, as measured by the AMPTE/CCE CHEM experiment and averaged (for the MLT region 2300-0100) over the whole mission time period. The panels on the left show the ion distributions when considering low geomagnetic activity, while the panels on the right show the ion distributions for medium geomagnetic activity.
10 6
10 5
10 4 =
10 3 •
10 2 •' .
10 5
10 4 •' ...,o
1o 3 •
'
101
ORSINI ET AL.: ENERGETIC NEUTRAL ATOMS MODEL CALCULATION 13,493
Figure 1.
\x \\
\\ \\
\\ \\
2 4 6 8 10 12
Distance •e)
The Chamberlain model of the hydrogen geocoronal density profile at T- 1024 ø K as fit by Rairden et al. [1986] to 4 years (1981-1985) of DE 1 Lyman c• observations.
ating H ENA is dominant at low energies, since charge exchange cross section of H + begins to decrease strongly for energies above ~ 20 keV. Since the charge-exchange cross section is a strong function of velocity, the O ENA generation rate is dominant at energies above 20 keV (if O and H fluxes are comparable, that is, during geomag- netically very active periods).
5. Simulated ENA Energy Spectra In order to compute the resulting ENA fluxes, expres-
sion (5) has been used and integrated along a specific look direction from 9.5RE down to ~ 1400 km, that is, in the range of L shells and angular directions where the ion pitch angle distributions from the CHEM exper- iment were available (as in the diagram shown in Figure a).
The computed ENA fluxes have been reduced by in- verse charge exchange and by reionization effects due to reinteraction of the ENA with the ion population generating them. This effect is rather small, between 3 and 4 orders of magnitude less than the production rate; however, the relevant term was kept in our com- putations since we expect it to play a significant role at altitudes lower than 1400 km (which we will explore in future studies), where the interaction with the iono- spheric thermal plasma has to be taken into account.
The electron impact effect has been assumed to be negligible; the photoionization effects have not been included because, in the energy range considered, the ENA are Doppler shifted out of the solar Ly a line, and because the ionization lifetimes of ENA are much longer than their travel times. Because of these consid- erations, the ENA reduction rate due to the Sun light is less than 5 % [Hsieh et al., 1992].
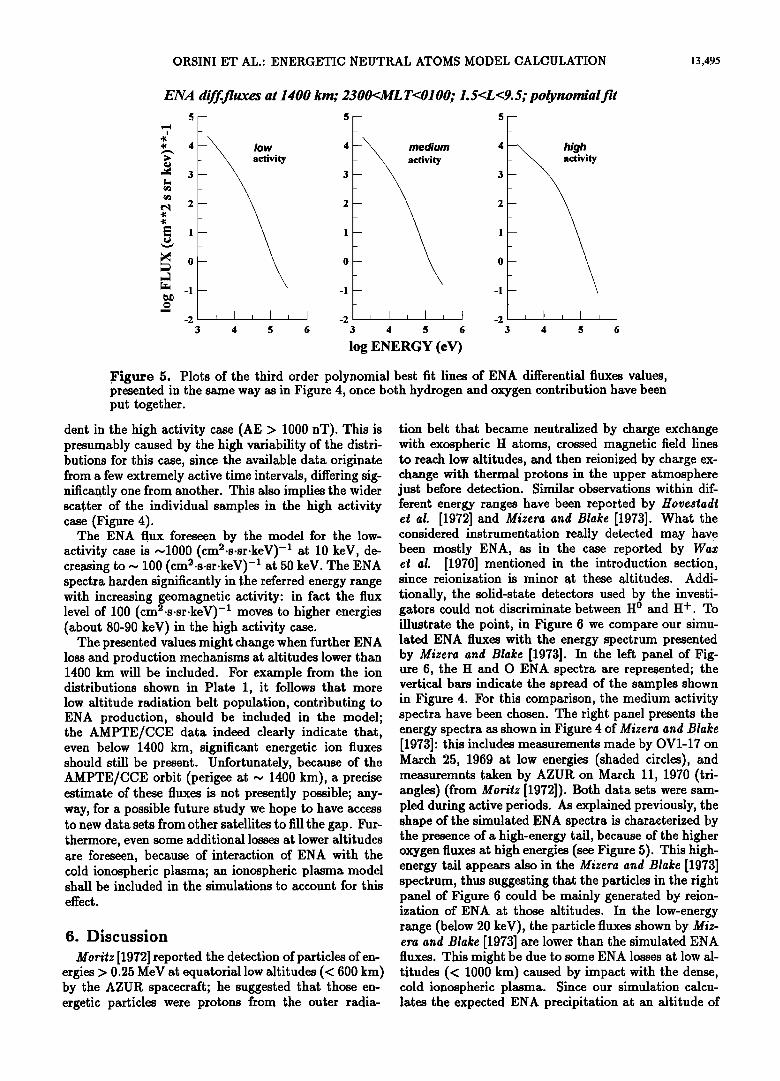
Figure 4 shows the hydrogen and oxygen ENA dif- ferential fluxes as a function of energy, as modeled ac- cording to the previous considerations. The left panel shows the low-activity case, the middle panel represents the medium-activity case, while the right panel shows the ENA energy spectra for the high-activity case. The single points are ENA estimates on the GSM equa- torial plane for 32 energy steps corresponding to the CHEM source ion measurements. Because of the fact
that we have plotted the entire set of ENA spectra orig- inating from seven different magnetic local time regions (between 2300 and 0100 MLT), some scattering of the points is observed. In order to evaluate a possible lon- gitude dependence of the derived spectra, in a future study we shall examine the ENA production at all local times and several latitudes, by extending our ion source data set. In order to illustrate the modeled total ENA
flux, we applied a third-order polynomial fit to the en- tire set of the computed ENA fluxes. The resulting best fits for the three activity levels are presented in Figure 5.
At lower energies (below ~ 70 keV) H is the dominant species, while at higher energies O flux becomes signifi- cantly higher than H flux (also reported by Roelof et al. [1985] and Roelof [1987]). From the spectra shown in Figure 4 it is evident that the rate of charge exchange generation of oxygen ENA becomes dominant at ener- gies higher than ~70 keV; this is essentially caused by the trend of the two cross sections as a function of en-
ergy (see Figure 2). The fact that O + fluxes in the near-Earth magnetosphere increase dramatically dur- ing geomagnetically active times [Young et al., 1982; Lennartsson and Shelley, 1986; Daglis et al., 1993, 1994] along with the referred cross section trend, result in the considerable hardening of the spectra above ~ 100 keV, as clearly seen in Figure 5. This last effect is less evi-
-14 --
<
ø- -16 --
• ' O + H'O H + • -17 --
$ -18 -- • • H + - H • H- H +
-20 I • ] 4 5 6
log energy (e•
Figure 2. Plots of the chargeexchange cross sections • a function of energy for H and O ENA generation.
13,494 ORSINI ET AL- ENERGETIC NEUTRAL ATOMS MODEL CALCULATION
.-- .,,•• '- ' . .................... .," :....-..- •____::________• -,.., ............................. . .................................................. ?o20 /' .......................... ........... ß ........... i ............................................................................................ ! ...... •:i:i, ii.-!:'.• '" • iiOO0 0 ............... •.• --------.---===-••-•:••••••:_• .. ..... . .......... . .................... .,
.......... • ............................. 2340 ..................... ;,,,• / .... /
Figure 3. The geometry of ENA simulation is such that tt is the Earth-centered vector that identifies the ENA detection point, tt is the vector that identifies the ENA source point, and • is the unit vector along the line of sight between source and detection point. In the simulation, R0 and tt have always been taken as colinear, assuming the angle of acceptance as infinitesimal, and the line of sight pointing always radial. The thick line at 1400 km is the locus of the detection points explored between 2300 and 0100 LT. Coordinates are GSM.
ENA cliff. fluxes at 1400 kin; 2300 <MœT<0100; 1.$<œ<9.$ Re; all data
sj--. s F " low " medium 4 4
• ••.• activity activity H HH H
• -2 H ' -2 -
• = hydrogen I _ • • = oxygen • -3 -3 -- •
_
3 4 5 6 3 4 5
5
?: high ,. activity
' ..:o o
- o
- • o
O-- '•o - "7o
_• - .•
_• - . "•: -
-3 -- .: _
-4 , I , I "• I 3 4 5 6
log ENERGY (eV)
Figure 4. Plots of hydrogen and oxygen ENA differential fluxes as a function of energy. The observation point altitude is 1400 km, the look direction is on the GSM X-Y plane, with MLT ranging between 2300 and 0100. Three different geomagnetic activity levels are considered: low (AE<500 nT), medium (500<AE<1000 nT), and high (AE>1000 nT). The "H" labels indicate hydrogen fluxes, while the "O" labels indicate oxygen fluxes.
ORSINI ET AL' ENERGETIC NEUTRAL ATOMS MODEL CALCULATION 13,495
ENA diff. fiuxes at 1400 km; 2300<MLT<0100; 1.5<L<9.5; polynomial fit 5-- 5• 5
--• Io . .w . 4 3
2
1
o
-• me.d. ium
-2 , I , I , I -2 I -2 I 3 4 5 6 3 4 5 6 6
log ENERGY (eV)
_
Figure 5. Plots of the third order polynomial best fit lines of ENA differential fluxes values, presented in the same way as in Figure 4, once both hydrogen and oxygen contribution have been put together.
dent in the high activity case (AE > 1000 nT). This is presumably caused by the high variability of the distri- butions for this case, since the available data originate from a few extremely active time intervals, differing sig- nificantly one from another. This also implies the wider scatter of the individual samples in the high activity case (Figure 4).
The ENA flux foreseen by the model for the low- activity case is ~1000 (cm2.s.sr.keV) -• at 10 keV, de- creasing to ~ 100 (cm2.s.sr.keV) -• at 50 keV. The ENA spectra harden significantly in the referred energy range with increasing geomagnetic activity: in fact the flux level of 100 (cm•.s.sr.keV) -• moves to higher energies (about 80-90 keV) in the high activity case.
The presented values might change when further ENA loss and production mechanisms at altitudes lower than 1400 km will be included. For example from the ion distributions shown in Plate 1, it follows that more low altitude radiation belt population, contributing to ENA production, should be included in the model; the AMPTE/CCE data indeed clearly indicate that, even below 1400 km, significant energetic ion fluxes should still be present. Unfortunately, because of the AMPTE/CCE orbit (perigee at ~ 1400 km), a precise estimate of these fluxes is not presently possible; any- way, for a possible future study we hope to have access to new data sets from other satellites to fill the gap. Fur- thermore, even some additional losses at lower altitudes are foreseen, because of interaction of ENA with the cold ionospheric plasma; an ionospheric plasma model shall be included in the simulations to account for this effect.
6. Discussion
Moritz [1972] reported the detection of p•rticles of en- ergies • 0.25 MeV a• equatorial low •l•itudes (• 600 km) by the AZUR spacecraft; he suggested that those en- ergetic p•rtic!es were protons from the outer r•di•-
tion belt that became neutralized by charge exchange with exospheric H atoms, crossed magnetic field lines to reach low altitudes, and then reionized by charge ex- change with thermal protons in the upper atmosphere just before detection. Similar observations within dif- ferent energy ranges have been reported by Hovestadt et al. [1972] and Mizera and Blake [1973]. What the considered instrumentation really detected may have been mostly ENA, as in the case reported by Waz et al. [1970] mentioned in the introduction section, since reionization is minor at these altitudes. Addi-
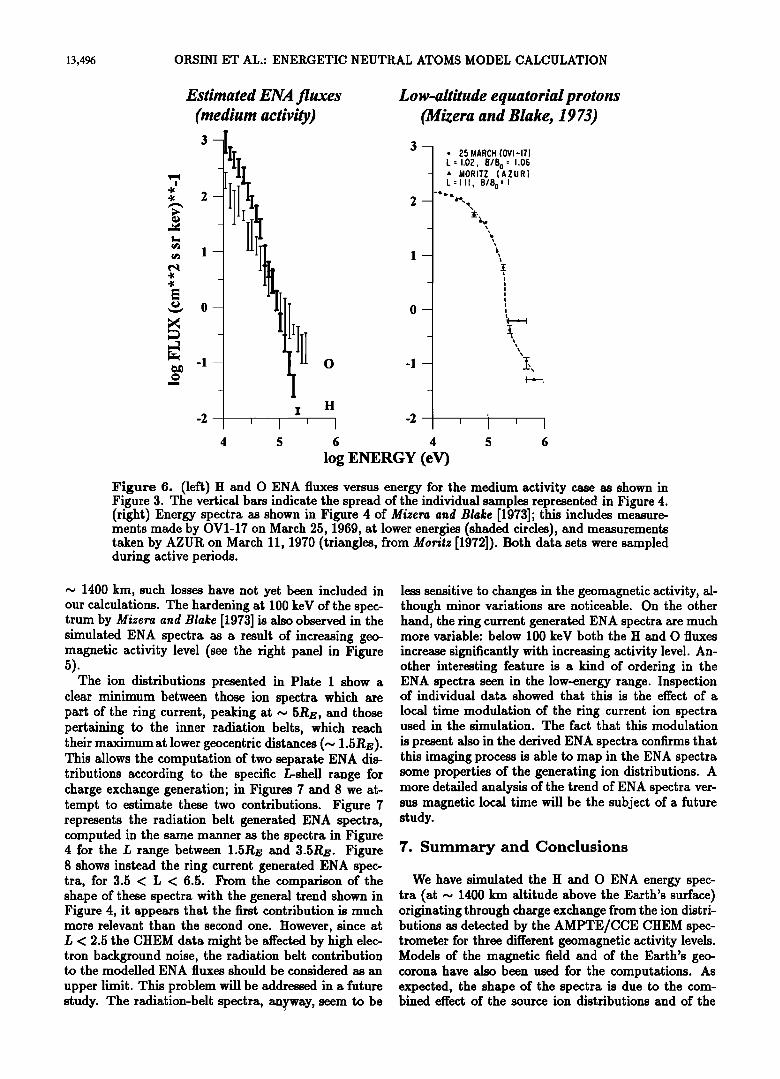
tionally, the solid-state detectors used by the investi- gators could not discriminate between H ø and H +. To illustrate the point, in Figure 6 we compare our simu- lated ENA fluxes with the energy spectrum presented by Mizera and Blake [1973]. In the left panel of Fig- ure 6, the H and O ENA spectra are represented; the vertical bars indicate the spread of the samples shown in Figure 4. For this comparison, the medium activity spectra have been chosen. The right panel presents the energy spectra as shown in Figure 4 of Mizera and Blake [1973]' this includes measurements made by OV1-17 on March 25, 1969 at low energies (shaded circles), and measuremnts taken by AZUR on March 11, 1970 (tri- angles) (from Moritz [1972]). Both data sets were sam- pled during active periods. As explained previously, the shape of the simulated ENA spectra is characterized by the presence of a high-energy tail, because of the higher oxygen fluxes at high energies (see Figure 5). This high- energy tail appears also in the Mizera and Blake [1973] spectrum, thus suggesting that the particles in the right panel of Figure 6 could be mainly generated by reion- ization of ENA at those altitudes. In the low-energy range (below 20 keV), the particle fluxes shown by Miz- era and Blake [1973] are lower than the simulated ENA fluxes. This might be due to some ENA losses at low al- titudes (< 1000 km) caused by impact with the dense, cold ionospheric plasma. Since our simulation calcu- lates the expected ENA precipitation at an altitude of
13,496 ORSINI ET AL' ENERGETIC NEUTRAL ATOMS MODEL CALCULATION
Estimated ENA fluxes (medium activity)
Low-altitude equatorial protons (Mizera and Blake, 19 73)
-2
w
I
i
0 -1 i
ß 25 MARCH {OVI-17} L=I.O?, 8/8 o= 1.06 ß MORITZ (AZUR} L=I.II, B/8o= I
•:,,
t
i i i
,• _- ,,
I,,
H
i I ' I -2 4 5 6 4 5 6
log ENERGY (eV)
Figure 6. (left) H and O ENA fluxes versus energy for the medium activity case as shown in Figure 3. The vertical bars indicate the spread of the individual samples represented in Figure 4. (right) Energy spectra as shown in Figure 4 of Mizera and Blake [1973]; this includes measure- ments made by OVl-17 on March 25, 1969, at lower energies (shaded circles), and measurements taken by AZUR on March 11, 1970 (triangles, from Moritz [1972]). Both data sets were sampled during active periods.
~ 1400 km, such losses have not yet been included in our calculations. The hardening at 100 keV of the spec- trum by Mizera and Blake [1973] is also observed in the simulated ENA spectra as a result of increasing geo- magnetic activity level (see the right panel in Figure 5).
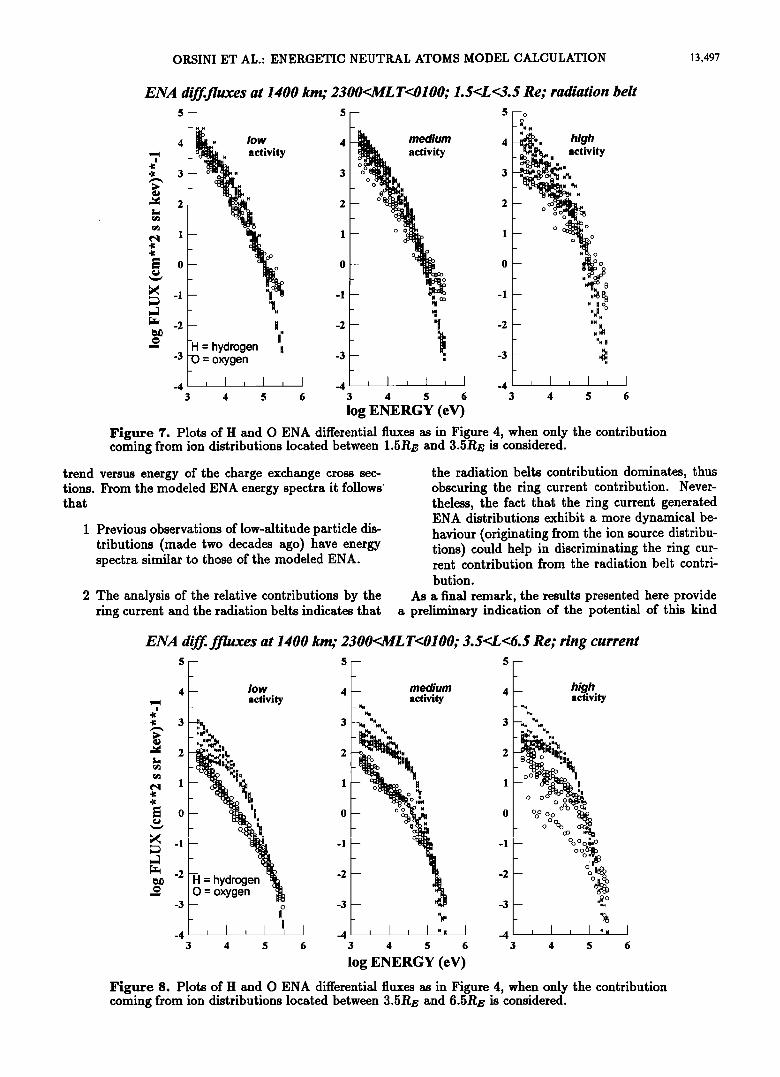
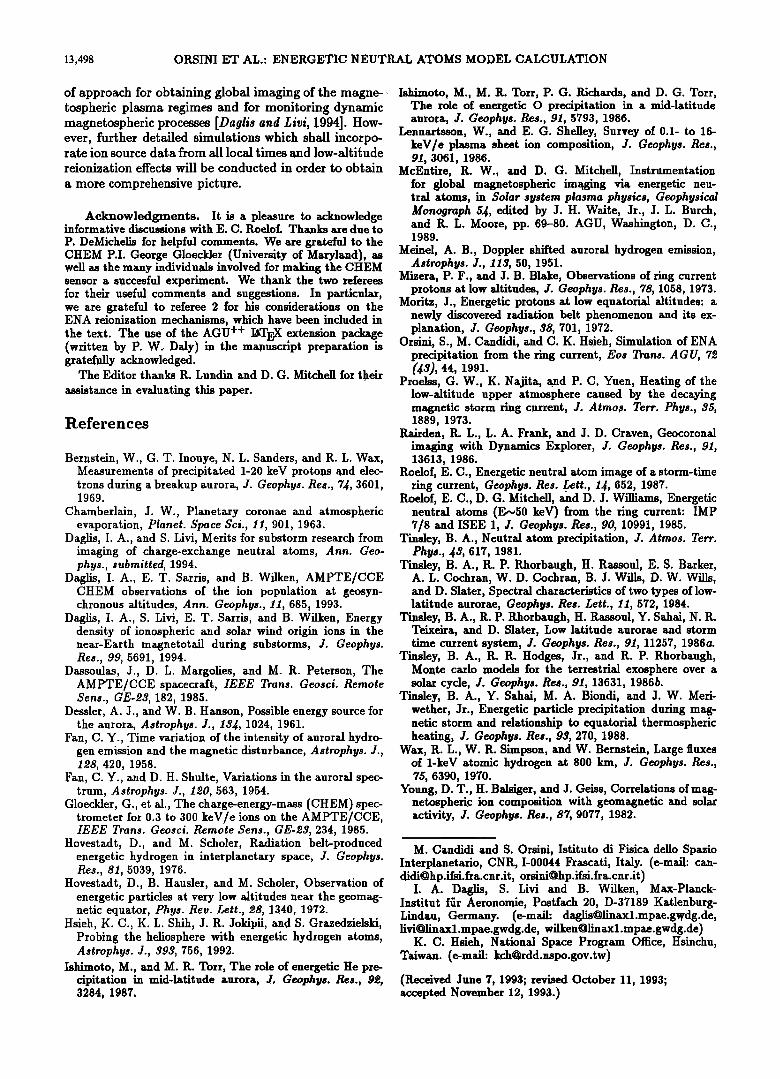
The ion distributions presented in Plate 1 show a clear minimum between those ion spectra which are part of the ring current, peaking at ~ 5R•, and those pertaining to the inner radiation belts, which reach their maximum at lower geocentric distances (~ 1.SR•). This allows the computation of two separate ENA dis- tributions according to the specific L-shell range for charge exchange generation; in Figures 7 and 8 we at- tempt to estimate these two contributions. Figure 7 represents the radiation belt generated ENA spectra, computed in the same manner as the spectra in Figure 4 for the L range between 1.SRE and 3.5R•. Figure 8 shows instead the ring current generated ENA spec- tra, for 3.5 < L < 6.5. From the comparison of the shape of these spectra with the general trend shown in Figure 4, it appears that the first contribution is much more relevant than the second one. However, since at L < 2.5 the CHEM data might be affected by high elec- tron background noise, the radiation belt contribution to the modelled ENA fluxes should be considered as an
upper limit. This problem will be addressed in a future study. The radiation-belt spectra, anyway, seem to be
less sensitive to changes in the geomagnetic activity, al- though minor variations are noticeable. On the other hand, the ring current generated ENA spectra are much more variable: below 100 keV both the H and O fluxes
increase significantly with increasing activity level. An- other interesting feature is a kind of ordering in the ENA spectra seen in the low-energy range. Inspection of individual data showed that this is the effect of a
local time modulation of the ring current ion spectra used in the simulation. The fact that this modulation
is present also in the derived ENA spectra confirms that this imaging process is able to map in the ENA spectra some properties of the generating ion distributions. A more detailed analysis of the trend of ENA spectra ver- sus magnetic local time will be the subject of a future study.
7. Summary and Conclusions
We have simulated the H and O ENA energy spec- tra (at ~ 1400 km altitude above the Earth's surface) originating through charge exchange from the ion distri- butions as detected by the AMPTE/CCE CHEM spec- trometer for three different geomagnetic activity levels. Models of the magnetic field and of the Earth's geo- corona have also been used for the computations. As expected, the shape of the spectra is due to the com- bined effect of the source ion distributions and of the
ORSINI ET AL.' ENERGETIC NEUTRAL ATOMS MODEL CALCULATION 13,497
ENA diff. fluxes at 1400 km; 2300<MLT<0100; 1.5<L<3.5 Re; radiation belt
5 5 low 4 medium 4
activity activity 3 3
o
-2--
-H: hydrogen -3 0 = oxygen
_
3 4 5 6 6 3 4 5 6
log ENERGY (eV)
. h/g• .. activity
H•."
_ o o;• o o
-- o o
",%
-- -- H H •
- H
_
3 4 5
Figure 7. Plots of H and O ENA differential fluxes as in Figure 4, when only the contribution coming from ion distributions located between 1.5Rr and 3.5RE is considered.
trend versus energy of the charge exchange cross sec- tions. From the modeled ENA energy spectra it follows that
i Previous observations of low-altitude particle dis- tributions (made two decades ago) have energy spectra similar to those of the modeled ENA.
2 The analysis of the relative contributions by the ring current and the radiation belts indicates that
the radiation belts contribution dominates, thus obscuring the ring current contribution. Never- theless, the fact that the ring current generated ENA distributions exhibit a more dynamical be- haviour (originating from the ion source distribu- tions) could help in discriminating the ring cur- rent contribution from the radiation belt contri- bution.
As a final remark, the results presented here provide a preliminary indication of the potential of this kind
ENA diff. ffiuxes at 1400 kin,' 2300<MLT<0100; 3.5<L<6.5 Re; ring current 5 5 5
low 4 medium activity activity
3 H HHI44 - "# L tll• #H.
-- • 0
• -1 --
= hydro9 -2 _ o•9e• • -3 o
-4 • I • I • I -4 • I • I • • I -4 3 4 5 6 3 4 5 6
log ENERGY (eV)
4 4
-1
-2
I high . activity
o • oo _ o• •
_
-
3 4
Figure 8. Plots of H and O ENA differential fluxes as in Figure 4, when only the contribution coming from ion distributions located between 3.5RE and 6.5RE is considered.
13,498 ORSINI ET AL.: ENERGETIC NEUTRAL ATOMS MODEL CALCULATION
of approach for obtaining global imaging of the magne-, tospheric plasma regimes and for monitoring dynamic magnetospheric processes [Daglis and œivi, 1994]. How- ever, further detailed simulations which shall incorpo- rate ion source data from all local times and low-altitude reionization effects will be conducted in order to obtain
a more comprehensive picture.
Acknowledgments. It is a pleasure to acknowledge informative discussions with E. C. Roelof. Thanks are due to
P. DeMichelis for helpful comments. We are grateful to the CHEM P.I. George Gioeckler (University of Maryland), as well as the many individuals involved for making the CHEM sensor a succesful experiment. We thank the two referees for their useful comments and suggestions. In particular, we are grateful to referee 2 for his considerations on the ENA reionization mechanisms, which have been included in the text' The use of the AGu ++ I•TEX extension package (written by P. W. Daly) in the manuscript preparation is gratefully acknowledged.
The Editor thanks R. Lundin and D. G. Mitchell for their assistance in evaluating this paper.
References
Bernstein, W., G. T. Inouye, N. L. Sanders, and R. L. Wax, Measurements of precipitated 1-20 keV protons and elec- trons during a breakup aurora, J. Geoph•ls. Res., 74, 3601, 1969.
Chamberlain, J. W., Planetary coronae and atmospheric evaporation, Planet. Space Sci., 11, 901, 1963.
Daglis, I. A., and S. Livi, Merits for substorm research from imaging of charge-exchange neutral atoms, Ann. Geo- phys., submitted, 1994.
Daglis, I. A., E. T. Sarris, and B. Wilken, AMPTE/CCE CHEM observations of the ion population at geosyn- chronous altitudes, Ann. Geoph!Is., 11, 6852 1993.
Daglis, I. A., S. Livi, E. T. Sarris, and B. Wilken, Energy density of ionospheric and solar wind origin ions in the near-Earth magnetotail during substorms, J. Geoph•Is. Res., 99, 5691, 1994.
D•ssoulas, J., D. L. Margolies, and M. R. Peterson, The AMPTE/CCE spacecraft, IEEE Trans. Geosci. Remote Sens., GE-œ3, 182, 1985.
Dessler, A. J., and W. B. Hanson, Possible energy source for the aurora, Astroph•ls. J., 134, 1024, 1961.
Fan, C. Y., Time variation of the intensity of auroral hydro- gen emission and the magnetic disturbance, Astrophys. J., 1œ8, 420, 1958.
Fan, C. Y., and D. H. Shulte, Variations in the auroral spec- trum, Astroph•ls. J., 1œ0, 563, 1954.
Gloeckler, G., et al., The charge-energy-mass (CHEM) spec- trometer for 0.3 to 300 keV/e ions on the AMPTE/CCE, IEEE Trans. Geosci. Remote Sens., GE-œ$, 234, 1985.
Hovestadt, D., and M. Scholer, Radiation belt-produced energetic hydrogen in interplanetary space, J. Geoph•ls. Res., 81, 5039, 1976.
Hovestadt, D., B. Hausler, and M. Scholer, Observation of energetic particles at very low altitudes near the geomag- netic equator, Phys. Rev. œett., œ8, 1340, 1972.
Hsieh, K. C., K. L. Shih, J. R. Jokipii, and S. Grazedzielski, Probing the hellosphere with energetic hydrogen atoms, Astroph•ls. J., 393, 756, 1992.
Ishimoto, M., and M. R. Tort, The role of energetic He pre- cipitation in mid-latitude aurora, J, Geophys. Res., 9œ, 3284, 1987.
Ishimoto, M., M. R. Tort, P. G. Richards, and D. G. Tort, The role of energetic O precipitation in a mid-latitude aurora, J. Geophys. Res., 91, 5793, 1986.
Lennartsson, W., and E.G. Shelley, Survey of 0.1- to 16- keV/e plasma sheet ion composition, J. Geophys. Res., 91, 3061, 1986.
McEntire, R. W., and D. G. Mitchell, Instrumentation for global magnetospheric imaging via energetic neu- tral atoms, in Solar system plasma physics, Geophysical Monograph 5J, edited by J. H. Waite, Jr., J. L. Burch, and R. L. Moore, pp. 69-80. AGU, Washington, D.C., 1989.
Meinel, A. B., Doppler shifted auroral hydrogen emission, Astrophys. J., 113, 50, 1951.
Mizera, P. F., and J, B. Blake, Observations of ring current protons at low altitudes, J. Geophys. Res., 78, 1058, 1973.
Moritz, J., Energetic protons at low equatorial altitudes: a newly discovered radiation belt phenomenon and its ex- p!anation, J. Geophys., 38, 701, 1972.
Orsini, S., M. Candidi, and C. K. Hsieh, Simulation of ENA precipitation from the ring current, Eos Trans. A GU, 7œ (•$), 44, 1991.
Proelss, G. W., K. N ajita, and P. C. Yuen, Heating of the low-altitude upper atmosphere caused by the decaying magnetic storm ring current, J. Armor. Terr. Phys., $5, 1889, 1973.
l•.a•xden, R. L., L. A. Frank, and J. D. Craven, Geocoronal imaging with Dynamics Explorer, J. Geophys. Res., 91, 13613, 1986.
Roe]of, E. C., Energetic neutral atom image of a storm-time ring current, Geophys. Res. œett., 1•, 652, 1987.
Roelof, E. C., D. G. Mitchell, and D. J. Willia•ns, Energetic neutral atoms (E~50 keV) from the ring current: IMP 7/8 and ISEE 1, J. Geophys. Res., 90, 10991, 1985.
Tinsley, B. A., Neutral atom precipitation, J. Atmos. Terr. Phys., •$, 617, 1981.
Tinsley, B. A., R. P. Rhorbaugh, H. Rassoul, E. S. Barker, A. L. Cochran, W. D. Cochran, B. J. Wills, D. W. Wills, and D. Slater, Spectral characteristics of two types of low- latitude aurorae, Geophys. Res. Lett., 11, 572, 1984.
Tinsley, B. A., R. P. Rhorbaugh, H. Rassoul, Y. Sahai, N. R. Teixeira, and D. Slater, Low latitude aurorae and storm time current system, J. Geophys. Res., 91, 11257, 1986a.
Tinsley, B. A., R. R. Hodges, Jr., and R. P. Rhorbaugh, Monte carlo models for the terrestrial exosphere over a solar cycle, J. Geophys. Res., 91, 13631, 1986b.
Tinsley, B. A., Y. Sahai, M. A. Biondi, and J. W. Meri- wether, Jr., Energetic particle precipitation during mag- netic storm and relationship to equatorial thermospheric heating, J. Geophys. Res., 93, 270, 1988.
Wax, R. L., W. R. Simpson, and W. Bernstein, Large fluxes of 1-keV atomic hydrogen at 800 kin, J. Geophys. Res., 75, 6390, 1970.
Young, D. T., H. Balsiger, and J. Geiss, Correlations of mag- netospheric ion composition with geomagnetic and solar activity, J. Geophys. Res., 87, 9077, 1982.
M. Candidi and S. Orsini, Istituto di Fisica dello Spazio Interplanetario, CNR, 1-00044 Frascati, Italy. (e-mail: can- didi•hp.ifsi.fra.cnr.it, orsini•hp.ifsi.fra.cnr.it)
I. A. Daglis, S. Livi and B. Waken, Max-Planck- Institut fiir Aeronomie, Postfach 20, D-37189 Katlenburg- Lindau, Germ.any. (e-mail: daglis•linaxl.mpae.gwdg.de, livi•linaxl.mpae.gwdg.de, wilken•linaxl.mpae.gwdg.de)
K. C. Hsieh, National Space Program Office, Hsinchu, Taiwan. (e-mail: kch•rdd.nspo.gov.tw)
(Received June 7, 1993; revised October 11, 1993; accepted November 12, 1993.)
Related Documents