Kidney International, Vol. 65 (2004), pp. 1499–1510 Model-based study of the effects of the hemodialysis technique on the compensatory response to hypovolemia SILVIO CAVALCANTI,ANDREA CIANDRINI,STEFANO SEVERI,F ABIO BADIALI,STEFANO BINI, ANDREA GATTIANI,LEONARDO CAGNOLI, and ANTONIO SANTORO Bioengineering Laboratory-DEIS, University of Bologna, Bologna, Italy; Division of Nephrology and Dialysis, Infermi Hospital, Rimini, Italy; and Malpighi Division of Nephrology and Dialysis, Policlinico S. Orsola-Malpighi, Bologna, Italy Model-based study of the effects of the hemodialysis technique on the compensatory response to hypovolemia. Background. Hemodialysis technique (dialysate composi- tion, filter, convection/diffusion ratio, etc.) can have an impact on the patient’s tendency to acute hypotension. We have ex- amined the hypothesis that the dialysis technique affects the hypotension risk by altering the cardiovascular compensatory response to hemodialysis-induced hypovolemia. Methods. Twelve hypotension-prone subjects were studied during six sessions of conventional bicarbonate dialysis (BD) and six sessions of acetate-free biofiltration (AFB). Blood vol- ume (BV) control system was used in AFB to provide a BV change equivalent to the BV change observed in BD. The ef- ficacy of reflex compensatory mechanisms was assessed by a model-based computer analysis of the BD and AFB sessions. Results. BD sessions were complicated by hypotension more frequently than the AFB ones (34/66 BD vs. 18/66 AFB). Hy- potension arose about 60 minutes earlier in BD (123 ± 41 min- utes in BD vs. 183 ± 25 minutes in AFB, P < 0.01), and after a smaller BV reduction (hypotension BV 7.9% ± 2.0% in BD vs. 10.9% ± 2.6% in AFB, P < 0.05). Model-based computer anal- ysis of the sessions without hypotension revealed differences in peripheral resistance adaptation (9% ± 9% BD vs. 19% ± 7% AFB, P < 0.05) as well as in the stroke volume reduction (19% ± 8% BD vs. 10% ± 8% AFB, P < 0.001). Model anal- ysis of sessions with hypotension indicated that compensatory mechanisms were almost inoperative in BD, whereas a residual capacity to control peripheral resistance and cardiac contractil- ity was present in AFB. Model simulations demonstrated that hypotension occurred later in AFB since the residual compen- satory capacity in AFB was able to sustain the arterial pressure for larger BV reductions (8.3% BD vs. 11.2% AFB). Conclusion. The increased risk of acute hypotension in BD compared to AFB is caused by a therapy-induced inhibition of reflex compensatory response to hypovolemia. Key words: hypotension, bicarbonate dialysis, buffer-free dialysate, ni- tric oxide. Received for publication August 15, 2003 and in revised form October 25, 2003 Accepted for publication November 19, 2003 C 2004 by the International Society of Nephrology Acute hypotension is a common intratreatment com- plication of chronic renal replacement therapies by hemodialysis, with an incidence still reported to be around the 20% to 30% of treatments [1, 2]. Apart from patient discomfort, acute hypotension also leads to a less effective treatment, especially in terms of body water re- moval. Sessions complicated by hypotension often end without achieving the correct dry body weight. In the long run, repetitive hypotensive episodes yield a chronic hydroelectrolytic derangement that promotes cardiovas- cular side-effects, leading the patient to have chronically unstable behavior. Patient susceptibility to intradialytic hypotension ex- hibits large intrasubject variability and several factors have been ascribed to the pathogenesis of this compli- cation. In subjects prone to acute hypotension, the first determinant of the hypotensive event is the hemodialysis- induced intravascular hypovolemia due to plasma-water ultrafiltration [2–4]. To prevent excessive hypovolemic stress, the online monitoring of circulatory blood volume reduction is rapidly gaining acceptance in clinical practice [5–7]. Actually, arterial pressure response is not simply determined by the blood volume changes since it closely depends on the short-term reflex capability to compen- sate for hypovolemia [8]. Indeed, significant differences between patients prone to hypotension can be noted also when the blood volume reduction is similar. Also, isov- olemic hemodialysis can result in hypotension [9]. Additional therapy-related factors may potentially determine the patient’s susceptibility to hemodialysis. Among these factors, the composition and quality of dialysate, filter membrane biocompatibility, and the con- vection/diffusion rate seem to influence the patient’s ten- dency to acute hypotension. As a pertinent example, the replacement of most of the acetate with bicarbonate in standard hemodialysis has resulted in a decrease in intra- dialytic hypotensive episodes [10–12]. The role of acetate has been attributed to an acetate-induced impairment of cardiovascular reactivity. In fact, acetate dialysis stimu- lates nitric oxide synthesis [13] and endogenous nitric 1499

Welcome message from author
This document is posted to help you gain knowledge. Please leave a comment to let me know what you think about it! Share it to your friends and learn new things together.
Transcript
Kidney International, Vol. 65 (2004), pp. 1499–1510
Model-based study of the effects of the hemodialysis technique
on the compensatory response to hypovolemia
SILVIO CAVALCANTI, ANDREA CIANDRINI, STEFANO SEVERI, FABIO BADIALI, STEFANO BINI,
ANDREA GATTIANI, LEONARDO CAGNOLI, and ANTONIO SANTORO
Bioengineering Laboratory-DEIS, University of Bologna, Bologna, Italy; Division of Nephrology and Dialysis, Infermi Hospital,Rimini, Italy; and Malpighi Division of Nephrology and Dialysis, Policlinico S. Orsola-Malpighi, Bologna, Italy
Model-based study of the effects of the hemodialysis techniqueon the compensatory response to hypovolemia.
Background. Hemodialysis technique (dialysate composi-tion, filter, convection/diffusion ratio, etc.) can have an impacton the patient’s tendency to acute hypotension. We have ex-amined the hypothesis that the dialysis technique affects thehypotension risk by altering the cardiovascular compensatoryresponse to hemodialysis-induced hypovolemia.
Methods. Twelve hypotension-prone subjects were studiedduring six sessions of conventional bicarbonate dialysis (BD)and six sessions of acetate-free biofiltration (AFB). Blood vol-ume (BV) control system was used in AFB to provide a BVchange equivalent to the BV change observed in BD. The ef-ficacy of reflex compensatory mechanisms was assessed by amodel-based computer analysis of the BD and AFB sessions.
Results. BD sessions were complicated by hypotension morefrequently than the AFB ones (34/66 BD vs. 18/66 AFB). Hy-potension arose about 60 minutes earlier in BD (123 ± 41 min-utes in BD vs. 183 ± 25 minutes in AFB, P < 0.01), and after asmaller BV reduction (hypotension BV 7.9% ± 2.0% in BD vs.10.9% ± 2.6% in AFB, P < 0.05). Model-based computer anal-ysis of the sessions without hypotension revealed differencesin peripheral resistance adaptation (9% ± 9% BD vs. 19% ±
7% AFB, P < 0.05) as well as in the stroke volume reduction(19% ± 8% BD vs. 10% ± 8% AFB, P < 0.001). Model anal-ysis of sessions with hypotension indicated that compensatorymechanisms were almost inoperative in BD, whereas a residualcapacity to control peripheral resistance and cardiac contractil-ity was present in AFB. Model simulations demonstrated thathypotension occurred later in AFB since the residual compen-satory capacity in AFB was able to sustain the arterial pressurefor larger BV reductions (8.3% BD vs. 11.2% AFB).
Conclusion. The increased risk of acute hypotension in BDcompared to AFB is caused by a therapy-induced inhibition ofreflex compensatory response to hypovolemia.
Key words: hypotension, bicarbonate dialysis, buffer-free dialysate, ni-tric oxide.
Received for publication August 15, 2003and in revised form October 25, 2003Accepted for publication November 19, 2003
C© 2004 by the International Society of Nephrology
Acute hypotension is a common intratreatment com-plication of chronic renal replacement therapies byhemodialysis, with an incidence still reported to bearound the 20% to 30% of treatments [1, 2]. Apart frompatient discomfort, acute hypotension also leads to a lesseffective treatment, especially in terms of body water re-moval. Sessions complicated by hypotension often endwithout achieving the correct dry body weight. In thelong run, repetitive hypotensive episodes yield a chronichydroelectrolytic derangement that promotes cardiovas-cular side-effects, leading the patient to have chronicallyunstable behavior.
Patient susceptibility to intradialytic hypotension ex-hibits large intrasubject variability and several factorshave been ascribed to the pathogenesis of this compli-cation. In subjects prone to acute hypotension, the firstdeterminant of the hypotensive event is the hemodialysis-induced intravascular hypovolemia due to plasma-waterultrafiltration [2–4]. To prevent excessive hypovolemicstress, the online monitoring of circulatory blood volumereduction is rapidly gaining acceptance in clinical practice[5–7]. Actually, arterial pressure response is not simplydetermined by the blood volume changes since it closelydepends on the short-term reflex capability to compen-sate for hypovolemia [8]. Indeed, significant differencesbetween patients prone to hypotension can be noted alsowhen the blood volume reduction is similar. Also, isov-olemic hemodialysis can result in hypotension [9].
Additional therapy-related factors may potentiallydetermine the patient’s susceptibility to hemodialysis.Among these factors, the composition and quality ofdialysate, filter membrane biocompatibility, and the con-vection/diffusion rate seem to influence the patient’s ten-dency to acute hypotension. As a pertinent example, thereplacement of most of the acetate with bicarbonate instandard hemodialysis has resulted in a decrease in intra-dialytic hypotensive episodes [10–12]. The role of acetatehas been attributed to an acetate-induced impairment ofcardiovascular reactivity. In fact, acetate dialysis stimu-lates nitric oxide synthesis [13] and endogenous nitric
1499
1500 Cavalcanti et al: Dialysate composition and acute hypotension
oxide overload has a significant neuromodulator activity[14], with the net apparent effect of vagal activation andsympathetic inhibition [15]. Autonomic compensatory re-sponse plays a pivotal role in maintaining stable arterialpressure during hemodialysis. Thus, the patient’s capac-ity to compensate for hypovolemia could be worsenedby exposure to acetate as well as to other therapy-dependent stimuli because of the inhibition of the short-term autonomic-mediated reflex mechanisms controllingcardiovascular functions.
In line with this hypothesis, the present study in-vestigated the cardiovascular compensatory responseto hypovolemia, in a population of 12 end-stage renaldisease (ESRD) hypotension-prone patients, during awidespread conventional therapy [bicarbonate dialysis(BD)]. In order to show that the dialysis technique di-rectly impacts on the risk of hypotension, the same pa-tients were also studied during an alternative technique[acetate-free biofiltration (AFB)], which has resulted ina better hemodynamic outcome [16]. A blood volumecontrol system [17] was used in AFB to have blood vol-ume changes similar to those observed in BD treatment.The effectiveness of the compensatory response to hy-povolemia was then studied by means of model-basedcomputer simulations of BD and AFB treatments.
METHODS
Subjects
Twelve patients with ESRD in renal replacement ther-apy with three times a week 4-hour maintenance double-needle hemodialysis at the dialysis center of the InfermiHospital (Rimini, Italy) were enrolled (N = 12, fourmales and eight females; age 73.8 ± 8 years old, range55 to 84 years; and weight 66 ± 11 kg, range 52.5 to87.5 kg). All the participants provided informed consentfor participation in this study.
Etiologies of the renal failure in the participants werenephrosclerosis (6), chronic glomerulonephritis (3), poly-cystic kidney disease (2), and diabetic nephropathy (1).No severe abnormalities were found upon physical ex-amination. None of the patients had been treated withvasoactive substances, had experienced an acute myocar-dial infarction or chronic cardiac rhythm abnormalitiesnor had they been treated for heart failure. All the pa-tients had a good vascular access (blood flow rate greaterthan 250 mL/min), an equilibrated Kt/V of at least 1.13,and residual diuresis lower than 400 mL/day.
All patients were classified as hypotension-prone basedon recent incidence of hemodialysis-induced hypotension(at least two of their most recent 12 treatments com-plicated by acute hypotension). Intradialytic hypoten-sion was defined as one of the following three situations:(1) systolic blood pressure ≤90 mm Hg, accompaniedby symptoms and therapeutic maneuvers (saline or hy-
pernatric infusions, plasma expander, Trendelenburg orother maneuvers, reduction in blood flow, stop of ultra-filtration); (2) systolic blood pressure reduction ≥25 mmHg compared to the predialysis value, in the presenceof symptoms and therapeutic maneuvers; or (3) systolicblood pressure ≤90 mm Hg, accompanied by a reductionof at least 20 mm Hg from the predialysis value. Incidenceof hypotension was 2/12 in two subjects, 3/12 in one, 4/12in two, 6/12 in two, 8/12 in two, 9/12 in one, and 10/12 intwo.
Experimental design and run-in
After a run-in period, all the patients underwent a4-week study period. The study was developed accordingto a prospective, crossover, parallel group design, withtwo sequences. Six patients were treated first with BD(2 weeks) and then by AFB (2 weeks) and six patientswere treated first with AFB (2 weeks) and then by BD(2 weeks). One patient in the AFB-BD sequencedropped out because of a persistent intratreatment atrialfibrillation.
Each patient underwent an observational run-in periodon conventional bicarbonate dialysis (see BD treatment,below) lasting 2 weeks. The run-in period was aimed atcorrecting and optimizing the prescription of postdialysisdry body weight and establishing the blood volume re-duction to be set in the blood volume control system inthe AFB treatment.
Postdialysis body weight was determined on the basisof both the traditional clinical parameters (skin and sub-cutaneous hydration state, jugular vein, predialysis andintradialytic blood pressure behavior, postdialysis stand-ing blood pressure, and intratreatment symptoms, such asmuscular cramps) as well as the radiologic signs relatedto the hydration status (cardiothoracic index, myocardialdiameters, pulmonary blood flow distribution, and vascu-lar pedicle aspect).
After having established the optimal dry body weightit was verified that postdialysis inferior vena cava diame-ter (VCD) determined by echography and corrected forbody surface area was in the range of 10 to 14, whichindicated an adequate cardiac filling pressure.
The weight loss normalized blood volume reduction(BV/WL) to be prescribed in the AFB treatment wasestablished as the average of the spontaneous blood vol-ume reductions at the end of the run-in sessions withouthypotension, normalized with respect to the patient end-treatment weight loss.
BD treatment
The BD treatment was a conventional bicarbonatedialysis session [polysulphone (PS) membranes of 1.7 m2
PS-low flux] (Fresenius MC AG, Bad Homburg,Germany). Dialysate flow rate was 500 mL/min and bath
Cavalcanti et al: Dialysate composition and acute hypotension 1501
temperature was constant at 36.5◦C. Both the ultrafiltra-tion rate and dialysate conductivity were kept constantduring the treatment. The duration of dialysis was be-tween 210 and 270 minutes. The composition of dialysatewas sodium 140 mEql/L, potassium 2.5 mEq/L, bicarbon-ate 34 mEql/L, acetate 3.0 mEq/L, chloride 109 mEq/L,calcium 3.0 mEq/L, magnesium 1.0 mEq/L, and glucose1.0 g/L. The percentage reduction of blood volume (%R-BV) was measured continuously during the entire treat-ment (HemoscanTM; Gambro-Dasco S.p.A., Medolla,Italy).
AFB treatment
The AFB treatment was acetate-free biofiltration withcontrolled blood volume. It consisted of a hemodiafil-tration technique (polyacrylonitrile membrane AN69)(Hospal S.p.A, Bologna, Italy) in which the dialysateis buffer-free and acid-base correction is obtained bypostfilter infusion of a 145 mEq/L sodium bicarbon-ate fluid [18]. The composition of dialysate was sodium139 mEql/L, potassium 3.0 mEq/L, chloride 147.5 mEq/L,calcium 4.0 mEq/L, magnesium 1.0 mEq/L, and glucose1.0 g/L. In order to deliver a blood volume reduction dur-ing the AFB treatment equivalent to the BD treatment ablood volume control system (HemocontrolTM) (HospalS.p.A.) was employed. This automatic system continu-ously controls the blood volume profile during the ses-sion to obtain a goal blood volume reduction at the endof the treatment that is the prescribed BV/WL ratio. Thisis achieved by moment-to-moment adjustment of ultra-filtration rate and dialysate conductivity by a feedbackcontrol system using the deviation of measured %R-BVfrom the prescribed blood volume profile as input sig-nal [17]. Other factors such as treatment time, blood anddialysate flow rates, and dialysate temperature were keptwith the same as for the BD treatment.
Measurements and data collection
During each session (66 BD + 66 AFB), the %R-BVsignal was acquired with a frequency of one sample perminute.
Systolic and diastolic arterial blood pressures weremeasured every 15 minutes by an automatic oscillomet-ric sphygmomanometer (BP100) (Gambro AB, Lund,Sweden). The occurrence of typical low blood pressuresymptoms (muscular cramps, headache, dizziness, vom-iting, nausea, and sweating) and the times of any acutehypotension episodes were also recorded.
Since the model-based computer analysis was limitedto the midweek dialyses only (two BD and two AFBfor each patient), a 12-lead ECG Holter (H-12 Holter)(Mortara Instrument, Inc., Milwaukee, WI, USA) wasrecorded during these sessions and an array containingthe beat-to-beat heart rate was extracted from the R-R
time series. %R-BV and heart rate time series, before be-ing analyzed by the model, were low pass filtered with adigital Butterworth filter to remove the high-frequencyvariability.
Plasma Na+, K+, Ca2+, HCO3− concentrations, and pH
were also measured before and after the midweek treat-ments (BG Electrolytes) (Instrumentation Laboratory,Milan, Italy).
Qualitative description of the computer model
Cardiovascular response to hemodialysis-induced hy-povolemia was simulated using the mathematical modelpresented in previous works [8, 19] to which a few ad-justments were made to analyze data from the presentstudy. An accurate description of the mathematicalmodel, including equations and parameter assignment,can be found on the Internet Web site www-bio.deis.
unibo.it/DialSim.html. Here, only the main adjustmentsand the relevant improvements are outlined.
The model of the circulatory system was in accor-dance with the hydraulic equivalent already shown in [8].Briefly, it includes (1) the systemic circulation comprisedof three compartments in series (arterial, microcircula-tory and venous); and (2) the cardiac pump representedby a single compartment (right atrium) and by the Star-ling law, linking the right atrium pressure to the strokeindex.
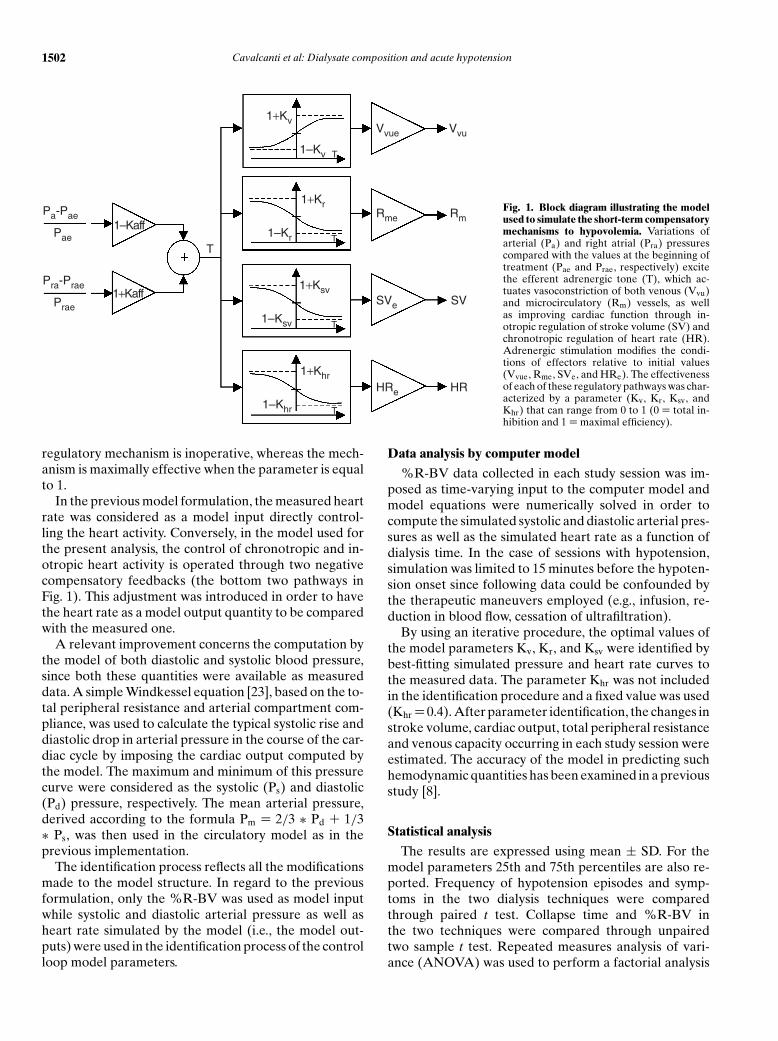
The model of the short-term reflex compensation to hy-povolemia was rearranged according to the block schemeshown in Figure 1. As in the previous formulation of themodel, two distinct afferent pathways were considered:one for the arterial [20] and the other for the cardiopul-monary [21] sides. The model parameter, Kaff, allows theassignment of a different relative weight to the two path-ways. Previous model-based analyses [8, 19] showed thatin hypotension-prone patients Kaff typically ranges from−0.1 to −0.5, indicating that the afferent pathways areweighted toward the arterial side. Kaff was arbitrarily setto −0.3 for the analysis of data of present study’s data.
Afferent pathways determine the efferent autonomictone, in which accordance with current physiologicknowledge [22], drives the compensatory response to hy-povolemia by way of four distinct mechanisms (see Fig. 1):(1) the decrease in venous capacity that causes an en-hancement in the venous return; (2) the increase in totalperipheral resistance that allows for the rise of arterialpressure in proximal arteries; (3) the increase in car-diac contractility; and (4) the increase in heart rate tooptimize the cardiac output. Four distinct gains expressthe efficiency of the short-term reflex compensatory re-sponse: Kv for venous capacity, Kr for total peripheralresistance, Ksv for stroke volume, and Khr for heart rate.Each of these parameters may range between 0 and 1.When the parameter is equal to 0, the corresponding
1502 Cavalcanti et al: Dialysate composition and acute hypotension
Pa-Pae
Pae
Pra-Prae
Prae
1–Kaff
1+Kaff
T
1+KvVvue
Rme
SVe
HRe HR
SV
Rm
Vvu
1–Kv T
1+Kr
1–Kr T
1+Ksv
1–Ksv T
1+Khr
1–Khr T
Fig. 1. Block diagram illustrating the modelused to simulate the short-term compensatorymechanisms to hypovolemia. Variations ofarterial (Pa) and right atrial (Pra) pressurescompared with the values at the beginning oftreatment (Pae and Prae, respectively) excitethe efferent adrenergic tone (T), which ac-tuates vasoconstriction of both venous (Vvu)and microcirculatory (Rm) vessels, as wellas improving cardiac function through in-otropic regulation of stroke volume (SV) andchronotropic regulation of heart rate (HR).Adrenergic stimulation modifies the condi-tions of effectors relative to initial values(Vvue, Rme, SVe, and HRe). The effectivenessof each of these regulatory pathways was char-acterized by a parameter (Kv, Kr, Ksv, andKhr) that can range from 0 to 1 (0 = total in-hibition and 1 = maximal efficiency).
regulatory mechanism is inoperative, whereas the mech-anism is maximally effective when the parameter is equalto 1.
In the previous model formulation, the measured heartrate was considered as a model input directly control-ling the heart activity. Conversely, in the model used forthe present analysis, the control of chronotropic and in-otropic heart activity is operated through two negativecompensatory feedbacks (the bottom two pathways inFig. 1). This adjustment was introduced in order to havethe heart rate as a model output quantity to be comparedwith the measured one.
A relevant improvement concerns the computation bythe model of both diastolic and systolic blood pressure,since both these quantities were available as measureddata. A simple Windkessel equation [23], based on the to-tal peripheral resistance and arterial compartment com-pliance, was used to calculate the typical systolic rise anddiastolic drop in arterial pressure in the course of the car-diac cycle by imposing the cardiac output computed bythe model. The maximum and minimum of this pressurecurve were considered as the systolic (Ps) and diastolic(Pd) pressure, respectively. The mean arterial pressure,derived according to the formula Pm = 2/3 ∗ Pd + 1/3∗ Ps, was then used in the circulatory model as in theprevious implementation.
The identification process reflects all the modificationsmade to the model structure. In regard to the previousformulation, only the %R-BV was used as model inputwhile systolic and diastolic arterial pressure as well asheart rate simulated by the model (i.e., the model out-puts) were used in the identification process of the controlloop model parameters.
Data analysis by computer model
%R-BV data collected in each study session was im-posed as time-varying input to the computer model andmodel equations were numerically solved in order tocompute the simulated systolic and diastolic arterial pres-sures as well as the simulated heart rate as a function ofdialysis time. In the case of sessions with hypotension,simulation was limited to 15 minutes before the hypoten-sion onset since following data could be confounded bythe therapeutic maneuvers employed (e.g., infusion, re-duction in blood flow, cessation of ultrafiltration).
By using an iterative procedure, the optimal values ofthe model parameters Kv, Kr, and Ksv were identified bybest-fitting simulated pressure and heart rate curves tothe measured data. The parameter Khr was not includedin the identification procedure and a fixed value was used(Khr = 0.4). After parameter identification, the changes instroke volume, cardiac output, total peripheral resistanceand venous capacity occurring in each study session wereestimated. The accuracy of the model in predicting suchhemodynamic quantities has been examined in a previousstudy [8].
Statistical analysis
The results are expressed using mean ± SD. For themodel parameters 25th and 75th percentiles are also re-ported. Frequency of hypotension episodes and symp-toms in the two dialysis techniques were comparedthrough paired t test. Collapse time and %R-BV inthe two techniques were compared through unpairedtwo sample t test. Repeated measures analysis of vari-ance (ANOVA) was used to perform a factorial analysis
Cavalcanti et al: Dialysate composition and acute hypotension 1503
0
10
20
30
40
50
60
70
80
90
100
Pe
rce
nta
ge
, %
Hypotension Symptom
P < 0.05
P < 0.05
P < 0.01
P < 0.05
AFBBD
A
0
2
4
6
8
10
12
14
16
18
20
Blo
od
vo
lum
e r
ed
uctio
n, %
Collapse %R-BV Collapse time0
30
60
90
120
150
180
210
240
Tre
atm
en
t time
, min
ute
s
B
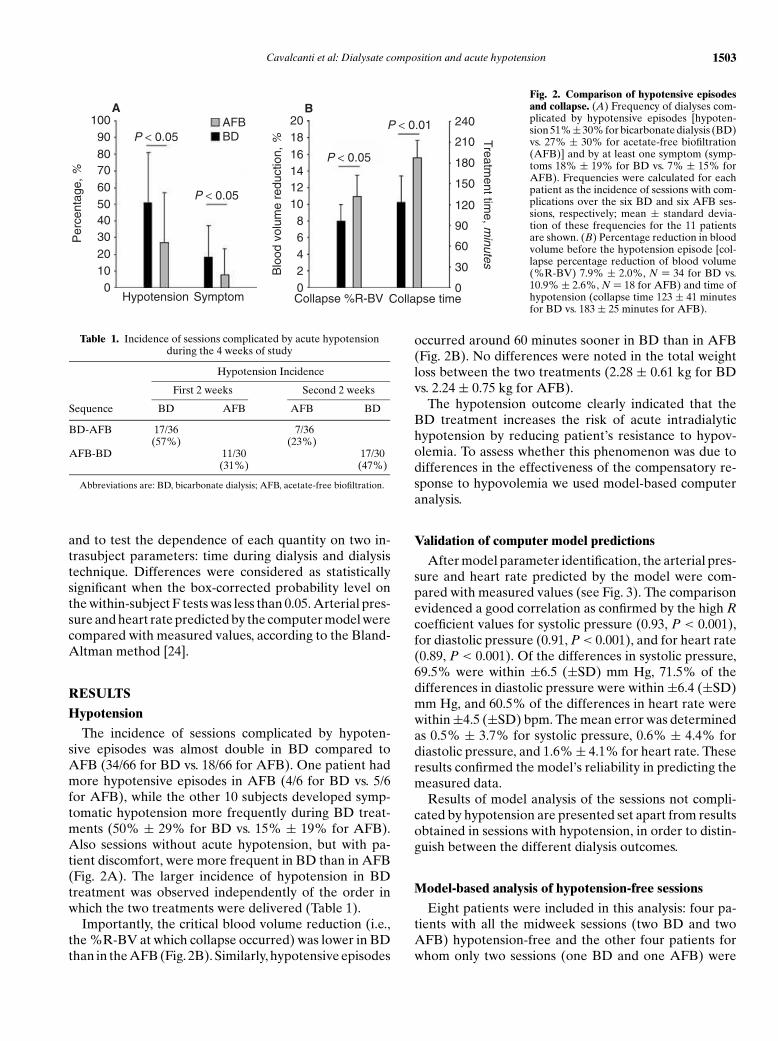
Fig. 2. Comparison of hypotensive episodesand collapse. (A) Frequency of dialyses com-plicated by hypotensive episodes [hypoten-sion 51%±30% for bicarbonate dialysis (BD)vs. 27% ± 30% for acetate-free biofiltration(AFB)] and by at least one symptom (symp-toms 18% ± 19% for BD vs. 7% ± 15% forAFB). Frequencies were calculated for eachpatient as the incidence of sessions with com-plications over the six BD and six AFB ses-sions, respectively; mean ± standard devia-tion of these frequencies for the 11 patientsare shown. (B) Percentage reduction in bloodvolume before the hypotension episode [col-lapse percentage reduction of blood volume(%R-BV) 7.9% ± 2.0%, N = 34 for BD vs.10.9% ± 2.6%, N = 18 for AFB) and time ofhypotension (collapse time 123 ± 41 minutesfor BD vs. 183 ± 25 minutes for AFB).
Table 1. Incidence of sessions complicated by acute hypotensionduring the 4 weeks of study
Hypotension Incidence
First 2 weeks Second 2 weeks
Sequence BD AFB AFB BD
BD-AFB 17/36 7/36(57%) (23%)
AFB-BD 11/30 17/30(31%) (47%)
Abbreviations are: BD, bicarbonate dialysis; AFB, acetate-free biofiltration.
and to test the dependence of each quantity on two in-trasubject parameters: time during dialysis and dialysistechnique. Differences were considered as statisticallysignificant when the box-corrected probability level onthe within-subject F tests was less than 0.05. Arterial pres-sure and heart rate predicted by the computer model werecompared with measured values, according to the Bland-Altman method [24].
RESULTS
Hypotension
The incidence of sessions complicated by hypoten-sive episodes was almost double in BD compared toAFB (34/66 for BD vs. 18/66 for AFB). One patient hadmore hypotensive episodes in AFB (4/6 for BD vs. 5/6for AFB), while the other 10 subjects developed symp-tomatic hypotension more frequently during BD treat-ments (50% ± 29% for BD vs. 15% ± 19% for AFB).Also sessions without acute hypotension, but with pa-tient discomfort, were more frequent in BD than in AFB(Fig. 2A). The larger incidence of hypotension in BDtreatment was observed independently of the order inwhich the two treatments were delivered (Table 1).
Importantly, the critical blood volume reduction (i.e.,the %R-BV at which collapse occurred) was lower in BDthan in the AFB (Fig. 2B). Similarly, hypotensive episodes
occurred around 60 minutes sooner in BD than in AFB(Fig. 2B). No differences were noted in the total weightloss between the two treatments (2.28 ± 0.61 kg for BDvs. 2.24 ± 0.75 kg for AFB).
The hypotension outcome clearly indicated that theBD treatment increases the risk of acute intradialytichypotension by reducing patient’s resistance to hypov-olemia. To assess whether this phenomenon was due todifferences in the effectiveness of the compensatory re-sponse to hypovolemia we used model-based computeranalysis.
Validation of computer model predictions
After model parameter identification, the arterial pres-sure and heart rate predicted by the model were com-pared with measured values (see Fig. 3). The comparisonevidenced a good correlation as confirmed by the high R
coefficient values for systolic pressure (0.93, P < 0.001),for diastolic pressure (0.91, P < 0.001), and for heart rate(0.89, P < 0.001). Of the differences in systolic pressure,69.5% were within ±6.5 (±SD) mm Hg, 71.5% of thedifferences in diastolic pressure were within ±6.4 (±SD)mm Hg, and 60.5% of the differences in heart rate werewithin ±4.5 (±SD) bpm. The mean error was determinedas 0.5% ± 3.7% for systolic pressure, 0.6% ± 4.4% fordiastolic pressure, and 1.6% ± 4.1% for heart rate. Theseresults confirmed the model’s reliability in predicting themeasured data.
Results of model analysis of the sessions not compli-cated by hypotension are presented set apart from resultsobtained in sessions with hypotension, in order to distin-guish between the different dialysis outcomes.
Model-based analysis of hypotension-free sessions
Eight patients were included in this analysis: four pa-tients with all the midweek sessions (two BD and twoAFB) hypotension-free and the other four patients forwhom only two sessions (one BD and one AFB) were
1504 Cavalcanti et al: Dialysate composition and acute hypotension
20
10
0
10
20
He
art
ra
te d
iffe
ren
ce, b
pm
50 60 70 80 90 100 110
Measured heart rate, bpm
m+2SD
m
m−2SD
A
40
20
0
20
40
40
20
0
20
40
50 60 70 80 90 100
Measured diastolic pressure, mm Hg
m+2SD
mm−2SD
C
Systo
lic p
ressu
re
diffe
ren
ce, m
m H
g
80 90 100 110 120 130 140 150 160 170
Measured systolic pressure, mm Hg
m+2SD
mm−2SD
B
Dia
sto
lic p
ressure
diffe
rence, m
m H
g
Fig. 3. Bland-Altman scatter plot of differences between simulatedand measured heart rate (A), systolic pressure (B), and diastolic pres-sure (C) for bicarbonate dialysis (BD) (�) and acetate-free biofiltration(AFB) (+). Mean values ± standard deviations of the differences were:0.01 ± 4.59 bpm for heart rate, 0.74 ± 6.46 mm Hg for systolic pressure,and −0.05 ± 6.38 mm Hg for diastolic pressure.
hypotension-free. The remaining three patients were notincluded since both the midweek BD sessions were com-plicated by hypotension. Notably, these three patientsshowed the highest hypotension frequency (5/6 in BDtreatment). Altogether, 12 BD and 12 AFB hypotension-free sessions were considered.
According to the experimental design, the use of theblood volume control system allowed the AFB treat-ments to be delivered with blood volume reductions sim-ilar to those observed in BD (Fig. 4). The electrolyteplasma concentrations and pH also exhibited similarchanges (Table 2).
Systolic and diastolic pressures tend to remain sta-ble throughout both treatments. A slightly lower systolicpressure in the BD was observed (Table 3). Conversely,a notable difference was evident in the heart rate, which
14
12
10
0
2
4
6
8
Blo
od
vo
lum
e r
ed
uctio
n, %
0 30 60 90 120 150 180 210
Treatment time, minutes
Fig. 4. Percentage reduction in blood volume in 12 bicarbonate dial-ysis (BD) (�) and in 12 acetate-free biofiltration (AFB) (�) sessionswithout hypotension. No significant difference was found between thetwo treatments (see Table 3).
Table 2. Electrolytes concentrations and pH in sessions withouthypotension [12 bicarbonate dialysis (BD) vs. 12 acetate-free
biofiltration (AFB)]
Sample TimeANOVA
Chemical Treatment Pre Post Treatment
Na+ mEq/L BD 139.2 ± 1.9 138.7 ± 1.5 NSAFB 138.8 ± 1.5 138.9 ± 2.1
Ca++ mEq/L BD 1.08 ± 0.14 1.13 ± 0.14 NSAFB 1.13 ± 0.09 1.18 ± 0.18
K+ mEq/L BD 5.11 ± 0.53 3.94 ± 0.28 NSAFB 5.09 ± 0.39 3.86 ± 0.31
HCO3− mEq/L BD 23.13 ± 2.03 27.74 ± 2.55 NS
AFB 23.56 ± 1.71 27.75 ± 2.31pH BD 7.36 ± 0.03 7.46 ± 0.04 NS
AFB 7.37 ± 0.02 7.45 ± 0.03
Abbreviations are: ANOVA, analysis of variance; Pre, values measuredbefore haemodialysis; Post, values measured at the end of the hemodialysis; NS,not significant.
rises significantly in BD, whereas it remains stable in theAFB treatment (Table 3).
Analysis of model parameters in the hypotension-freesessions (Table 4) revealed that cardiovascular reactiv-ity was worse in the BD treatments than in the AFBtreatments. In fact, all the parameters were on averagelower in the BD therapy than in AFB. The difference wasespecially significant in the parameter Kr related to thecontrol of microvascular resistance and in the parameterKsv expressing the efficacy of inotropic control of cardiaccontractility.
Differences in the effectiveness of compensation to hy-povolemia were also evident: the increase in total periph-eral resistance in AFB was twice that exhibited in BD;whereas, the decrease in stroke volume was twice greaterin BD compared to AFB (Table 5).

Cavalcanti et al: Dialysate composition and acute hypotension 1505
Table 3. Pressure, heart rate, and blood volume in sessions without hypotension [12 bicarbonate dialysis (BD) vs. 12 acetate-free biofiltration(AFB)]
Treatment time minutes ANOVA
0 90 180 Time Treatment
Systolic pressure mm Hg BD 122.4 ± 14.1 114.5 ± 16.4 114.8 ± 18.4 NS P < 0.01AFB 120.1 ± 12.4 123.4 ± 17.8 122.6 ± 12.1
Diastolic pressure mm Hg BD 72.1 ± 10.1 68.7 ± 10.5 69.7 ± 11.9 NS NSAFB 66.4 ± 5.9 71.7 ± 8.9 72.9 ± 11.4
Heart rate bpm BD 69.7 ± 9.73 78.7 ± 9.7 83.3 ± 9.5 P < 0.05 P < 0.01AFB 71.5 ± 9.8 71.8 ± 12.3 75.2 ± 11.1
Blood volume reduction % BD – 6.84 ± 1.71 8.95 ± 2.41 P < 0.01 NSAFB – 7.41 ± 2.12 8.81 ± 3.05
ANOVA is analysis of variance and NS is not significant.
Table 4. Model parameter identification in sessions withouthypotension
BD (N = 12) AFB (N = 12) t test
Kv mean ± SD 0.35 ± 0.25 0.60 ± 0.23 NS(25% to 75%) (0.10–0.41) (0.30–0.91)Kr mean ± SD 0.24 ± 0.24 0.90 ± 0.15 P < 0.001(25% to 75%) (0.10–0.42) (0.70–0.94)Ksv mean ± SD 0.21 ± 0.3 0.73 ± 0.4 P < 0.01(25% to 75%) (0.10–0.4) (0.30–0.92)
Abbreviations are: BD, bicarbonate dialysis; AFB, acetate-free biofiltration;Kv, efficiency of venous capacity regulation (maximum efficiency Kv = 1); Kr,efficiency of peripheral resistance regulation (maximum efficiency Kr = 1); Ksv,efficiency of stroke volume regulation (maximum efficiency Ksv = 1); NS, notsignificant.
Table 5. Percent changes of cardiac output (CO), total peripheralresistance (TPR), stroke volume (SV), and venous capacity (VC) in
sessions without hypotension
BD (N = 12) AFB (N = 12) t test
�CO % −2.1 ± 6.3 −3.1 ± 5.1 NS�SV % −19.1 ± 8.2 −10.7 ± 7.8 P < 0.01�TPR % 9.1 ± 9.4 18.9 ± 6.6 P < 0.05�VC % −14.7 ± 5.5 −14.8 ± 4.5 NS
Abbreviations are: BD, bicarbonate dialysis; AFB, acetate-free biofiltration;�CO, percent changes in cardiac output; �TPR, percent changes in totalperipheral resistance; �SV, percent changes in stroke volume; �VC, percentchanges in venous capacity; NS, not significant.
The mean values of the Kv, Kr, and Ksv parameterswere considered to be representative of the compen-satory response exhibited in the BD and AFB treat-ments without hypotension. Using these two sets of meanparameters (see Table 4) and the blood volume curvesshown in Figure 4 as model input, virtual BD and AFBtreatments were simulated. The systolic and diastolic ar-terial pressures as well as the heart rate of the virtualtreatments were then compared with the correspondingexperimental data (see Fig. 5) to demonstrate that thetwo sets of parameters characterize the mean response inBD and AFB during hypotension-free sessions.
A comparison between the cardiovascular responsespredicted by the model for the virtual BD and AFB ses-sions is shown in Figure 6. Cardiac output as well as ve-
nous pressure appear to follow the same trend in bothtreatments. On the other hand, treatment differences areclearly evident for peripheral resistance and stroke vol-ume. The latter fell markedly in the BD treatment (−23%at 180 minutes), whereas the reduction was moderate inthe AFB treatment (−10% at 180 minutes).
Model-based analysis of sessions with hypotension
Seven patients were included in the analysis of sessionswith hypotension: four patients with only one BD and oneAFB sessions complicated by hypotension and three pa-tients experiencing hypotension in both the midweek BDsessions. For this second group of patients, one had boththe AFB sessions complicated by hypotension, whereasthe other two patients had only one midweek AFB ses-sion with hypotension. For these two patients, just one ofthe two BD sessions was considered, in order to main-tain a balanced data set. Thus, eight BD and eight AFBsessions with hypotension were considered.
In both BD and AFB treatments, the parameter Kv
was close to zero (Table 6), suggesting that the adapta-tion of venous capacity to hypovolemia was ineffectivein the sessions with hypotension. Both Kr and Ksv wereclose to zero in the BD treatments, whereas these param-eters were significantly higher in the AFB treatments (seeTable 6).
To compare the pressure response to hypovolemia intwo treatments, the mean values of the BD and AFB pa-rameters (Table 6) were used to simulate BD and AFBdialyses with a linearly decreasing blood volume thatresulted in a 15% reduction in the blood volume after4 hours. The results of these simulations are shown inFigure 7, where the systolic pressure is plotted as a func-tion of the blood volume reduction. In BD, the completelack of effectiveness in compensation (Kv = 0.02, Kr =
0.05, Ksv = 0.05) causes the systolic pressure to fall swiftlyin response to hypovolemia. Under this condition, the hy-potension threshold is reached at a blood volume reduc-tion of about 8%. Notably, this value closely matches thecritical blood volume observed in the BD sessions with
1506 Cavalcanti et al: Dialysate composition and acute hypotension
50
70
90
110
130
150
Pre
ssu
re, m
m H
g
0 30 60 90 120
150
180
210
Treatment time, minutes
A
50
60
70
80
90
100
He
art
ra
te, b
pm
0 30 60 90 120
150
180
210
Treatment time, minutes
50
60
70
80
90
100
He
art
ra
te, b
pm
0 30 60 90 120
150
180
210
Treatment time, minutes
50
70
90
110
130
150
Pre
ssu
re, m
m H
g
0 30 60 90 120
150
180
210
Treatment time, minutes
B
Fig. 5. Comparison of simulated and mea-sured arterial pressure and heart rate (mean± SD) in bicarbonate dialysis (BD) (A) andacetate-free biofiltration (AFB) (B) sessionswithout hypotension. Model simulated pres-sure and heart rate (continuous lines) used thepercentage reduction of blood volume (%R-BV) curves shown in Fig. 4. as input. Forthe simulation, the mean values of parame-ters identified in the hypotension-free sessions(see Table 4) were assigned (BD Kv = 0.35,Kr = 0.24, and Ksv = 0.21; AFB Kv = 0.60,Kr = 0.90, Ksv = 0.73).
0
5
10
15
20
25
∆T
PR
, %
0 30 60 90 120
150
180
210
Treatment time, minutes
A
AFB
BD
–25
–20
–15
–10
–5
0
∆C
O, %
0 30 60 90 120
150
180
210
Treatment time, minutes
B
AFB
BD
–25
–20
–15
–10
–5
0
∆S
V, %
0 30 60 90 120
150
180
210
Treatment time, minutes
D
AFB
BD
–25
–20
–15
–10
–5
0
∆P
v, %
0 30 60 90 120
150
180
210
Treatment time, minutes
C
AFB
BD
Fig. 6. Percentage changes in total periph-eral resistance (TPR) (A), cardiac output(CO) (B), venous pressure (Pv) (C), andstroke volume (SV) (D) simulated by themodel during bicarbonate dialysis (BD) andacetate-free biofiltration (AFB) without hy-potension. The percentage reduction of bloodvolume (%R-BV) curves used as model in-puts are shown in Fig. 4. Parameters are thosereported in Fig. 5. Peripheral resistance andstroke volume exhibited notable differences.
hypotension (see Fig. 7). In the case of AFB treatment,the residual control of vascular resistance and heart con-tractility (Kv = 0.01, Kr = 0.49, Ksv = 0.50) maintainsa sustained pressure up to a 5% blood volume reduc-tion. Beyond this value, pressure falls and the hypoten-sive threshold is crossed at a blood volume reduction ofabout 12%. This value also closely agrees with the criticalblood volume threshold observed in AFB with hypoten-sion (see Fig. 7). Hypotension occurs about 60 minutes
earlier in BD than AFB (see Fig. 7) that is comparable tothe timing of hypotension observed in the experimentalresults.
DISCUSSION
In this study we have examined the impact of thetechnique used to deliver hemodialysis treatment on thecardiovascular system, focusing on the risk of hypoten-sion in hypotension-prone patients. For this purpose,

Cavalcanti et al: Dialysate composition and acute hypotension 1507
Table 6. Model parameter identification in sessions with hypotension
BD (N = 8) AFB (N = 8) t test
Kv mean ± SD 0.02 ± 0.07 0.01 ± 0.03 NS(25% to 75%) (0.00–0.07) (0.00–0.05)Kr mean ± SD 0.05 ± 0.09 0.49 ± 0.16 P < 0.01(25% to 75%) (0.00–0.07) (0.39–0.52)Ksv mean ± SD 0.05 ± 0.09 0.50 ± 0.27 P < 0.01(25% to 75%) (0.00–0.05) (0.44–0.53)
Abbreviations are: BD, bicarbonate dialysis; AFB, acetate-free biofiltration;Kv, efficiency in the venous capacity regulation (maximum efficiency Kv = 1);Kr, efficiency in the peripheral resistance regulation (maximum efficiency Kr =
1); Ksv, efficiency in stroke volume regulation (maximum efficiency Ksv = 1); NS,not significant.
0 30 60 90 120 150 180 210 240
Treatment time, minutes
AFB
BD
14 1612100 2 4 6 8
Blood volume reduction, %
40
20
0
20
Systo
lic p
ressure
, %
Collapse
threshold
Fig. 7. Percentage change of systolic pressure simulated by the modelduring a treatment that produces a percentage blood volume reductionof 15% after 4 hours. The parameter values used for the simulations arethe mean values identified in hypotensive sessions [bicarbonate dialysis(BD) Kv = 0.02, Kr = 0.05, Ksv = 0.05; acetate-free biofiltration (AFB)Kv = 0.01, Kr = 0.49, Ksv = 0.50]. The critical percentage reduction ofblood volume (%R-BV) for the occurrence of hypotensive episodes inBD and AFB treatments are also shown (mean ± SD).
the hemodynamic response to conventional dialysis us-ing a predominantly bicarbonate-based buffer with asmall amount of acetate (BD), the worldwide dominanthemodialysis modality, was compared with the hemody-namic response to AFB, a technique that uses a buffer-free dialysate with continuous post-filter infusion of asterile bicarbonate solution [25]. BD was proposed toimprove the hemodynamic stability compared with ac-etate dialysis [11, 26, 27]. However, this benefit has notalways been confirmed [28, 29] and the improvement ofdialysis morbidity with BD remains controversial. AFBhas been proposed as an alternative to acetate or bicar-bonate hemodialysis that gives better cardiovascular sta-bility [30, 31]. In a crossover study Zucchelli, Santoro,and Spongano [16], showed that the percentage of ses-sions with symptomatic side-effects was lower in AFBthan in BD and that hypotensive events decreased sig-nificantly. Hypotension incidence as well as symptomatic
side-effects observed in the present study (see Fig. 2) at-tested to such differences. With respect to previous stud-ies, we assured each patient had a similar blood volumereduction and dry body weight in both treatments. Thus,we can exclude that different hypotensive risk associatedwith BD and AFB was due to a different therapy-inducedhypovolemia or body weight loss.
A novel result was that the critical blood volumethreshold (i.e., the relative blood volume reduction atwhich acute hypotension occurred) was significantlylower in BD than in AFB (7.9% ± 2.0% BD vs. 10.9% ±
2.6% AFB). As a direct consequence, hypotensive eventsalso occurred earlier in BD, thus demonstrating a differ-ent cardiovascular tolerance to blood volume withdrawalbetween BD and AFB.
Differences between the two treatments were also ev-ident when only the sessions uncomplicated by hypoten-sion were considered. In hypotension-free BD sessions,systolic pressure was lower at the end of treatment com-pared to AFB sessions whereas heart rate was higher(see Table 3). To our knowledge, previous comparisons ofhemodynamic response between different dialysis tech-niques did not distinguish between sessions with andwithout hypotension. Acute hypotension is associatedwith large reactive hemodynamic changes. Therefore, weconsidered it appropriate to study the actual impact oftherapy on the cardiovascular system in hypotension-free sessions where confounding reactive factors didnot influence the hemodynamics. Since treatment dif-ferences were evident also in hypotension-free sessions,we advanced the hypothesis that BD systematically re-duces the cardiovascular compensatory responsivenessto hemodialysis-induced hypovolemia.
To explore this hypothesis we utilized a model-basedcomputer analysis successfully used in the past to studythe role of compensatory mechanisms on the pressureresponse to hypovolemia [8]. The model-based approachconstituted a quantitative framework useful for giving acoherent explanation of the experimental observations.A significant model improvement was the computation ofboth systolic and diastolic arterial pressure. Apart fromthe advantage of having twice the number of points avail-able for the identification procedure, the tuning of modelparameters improved since systolic and diastolic pressurereflect different information. Systolic pressure dependsmore on cardiac output which is determined by myocar-dial contractility and heart frequency, whereas diastolicpressure is mainly influenced by the total peripheral resis-tance which depends on the smooth muscle tone of smallarteries and arterioles.
In the present investigation, model analysis was crucialin providing an explanation of the different heart rate re-sponse observed in BD compared with AFB (Table 3).The presence of a small amount of acetate in the BDdialysate may be significant. Vincent et al [32] observed
1508 Cavalcanti et al: Dialysate composition and acute hypotension
a myocardial depression induced by acetate buffer witha significant increase in the heart rate. However, a directtachycardic effect of acetate upon the sinus node can beexcluded since a decrease in the heart rate generally fol-lows acetate administration in animals [33].
To test the hypothesis that the different heart rate re-sponse reflected the difference in arterial pressure onlyand was not due to a direct effect of the therapies uponthe sinus node, we assigned a fixed value to the modelparameter Khr. The good agreement between the heartrate simulated by model and measured heart rate (seeFig. 5) validated this assumption. Under this condition,model-based analysis revealed the important findingsthat peripheral resistance constriction as well as cardiacinotropism were blunted in hypotension-free BD ses-sions. As a direct consequence, in the BD treatment,chronotropic activation raised the heart rate in orderto maintain adequate cardiac output in the presence ofblunted inotropic control. In AFB, on the other hand, va-somotor and cardiac contractility compensation was ableto sustain pressure without activating the baroreflex in-crease in heart rate. Therefore, the increased heart rateduring BD may be ascribed to a positive compensationfor a therapy-induced depression in the contractile forceof vascular smooth muscle and cardiac fibers.
Model-based analysis also revealed the ineffectivenessof venous compensation in dialysis sessions complicatedby hypotension (Kv close to 0 in both BD and AFBtechniques). On the contrary, in the hypotension-freesessions the venous capacity control was adequate inassuring hypovolemia compensation (Kv = 0.35 ± 0.25in BD and Kv = 0.60 ± 0.23 in AFB). The pivotal role ofvenous capacity in the genesis of hypotension was con-firmed by the inverse relationship between the Kv val-ues and the tendency to intradialytic hypotension: thethree patients with the highest frequency of hypotension(78% of BD treatments) had Kv = 0, whereas the threepatients with the lowest incidence of hypotension (lessthan 30% of BD treatments) had the highest Kv values(Kv > 0.4).
An equivalent discriminating role was not evident withregard to peripheral resistance. In fact, in the sessionscomplicated by hypotension the compensation of periph-eral resistance and stroke volume was again operative inAFB, whereas it was ineffective in BD (see Table 6). Theunique difference ascribable to peripheral resistance wasthe time of acute hypotension (see Fig. 7), which wasabout 60 minutes earlier in BD than in AFB. Previousinvestigations [34, 35] pointed out the inability to distin-guish patients with a stable or unstable pressure responseto dialysis on the basis of peripheral vascular resistancealone. According to our observations, the effectivenessof venous capacity adaptation may be the crucial elementfor cardiovascular stability during hemodialysis-inducedhypovolemia.
Evidence of venous pooling or impaired venous tonein hemodialysis-induced hypotension in the presence ofblood volume reduction has already been reported [8, 36].Dialysis patients with diastolic dysfunction due to highsensitivity to cardiac filling pressure particularly sufferfrom impaired venous capacity control [37]. Venous toneaffects cardiac filling during blood volume withdrawal.The more venous capacity is reduced, the less venous re-turn is assured to the right heart and thus indirectly thecardiac output drops. Furthermore, effective regulationof arterial vascular resistance coupled with inadequatecontrol of venous capacitance may trigger a dangerouspositive feedback. Blood volume withdrawal induces anuncompensated lowering of venous pressure with a con-sequent reduction in cardiac output responsible for adecrease in arterial pressure that stimulates peripheralvasoconstriction, which by closing the unstable loopcauses a further decrease in venous pressure. This behav-ior was evident in the simulation of AFB with hypoten-sion, where in the initial phase of hypovolemia, thanksto the increase in arterial peripheral vascular resistance,a paradoxic increase in the arterial pressure was evident(see Fig. 7). However, in the second phase, the bloodpressure dropped sharply even if the control of periph-eral resistance was operative because of the absence ofvenous capacity compensation.
Notably, the present study has demonstrated a therapy-induced deficiency in vessel and cardiac contractility inBD treatment. Since a primary autonomic dysfunctioncan be excluded, the reduced cardiovascular responsive-ness in the BD treatment can be associated to an apparentinhibition of a- and b-adrenergic stimulation. However,the heart rate increase in BD is indicative of adequate car-diac sympathetic tone. Therefore, the blunted contractionof vascular smooth muscle and cardiac fibers during BDcould reflect the inhibition of intracellular effectors forthe action of adrenergic receptor stimulation.
One possible explanation for the reduced responsive-ness to adrenergic stimulus could be an enhanced pro-duction of endogenous nitric oxide in BD compared toAFB, since nitric oxide overload inhibits the contractileresponses to adrenergic stimulation by limiting the trans-membrane calcium L-type current [38]. The hypothesisthat an enhanced production of nitric oxide causes theinhibition of sympathetic activity in patients with acutehypotensive episodes has already been advanced [39].Beasley and Brenner [40] investigated the role of ni-tric oxide in hemodialysis hypotension and proposed thehypothesis that hypotension is mediated by inflamma-tory cytokine-induced NO production in vascular smoothmuscle cells. Acetate-containing dialysate [41] or filtermembrane [42, 43] is likely to stimulate the productionof the cytokine activators of nitric oxide synthesis. AFBhas been shown to cause less monocyte activation andcytokine release than BD [44]. Moreover, in vitro studies

Cavalcanti et al: Dialysate composition and acute hypotension 1509
on the effects of dialysate solutions with and without ac-etate on the nitric oxide synthase (NOS) activity foundthat acetate-containing dialysate up-regulated nitric ox-ide production in endothelial cells [13, 45]. Emergingevidence indicates that the responsiveness of the en-dothelium to hemodialysis therapy may play a key rolein hemodynamic instability due to endothelium-derivednitric oxide and endothelin [46]. Hence, the hypothesiscould be advanced that BD treatment causes a deficientcardiovascular responsiveness in hypotension-prone pa-tients because of an enhanced stimulation of nitric oxideproduction in vascular smooth muscle and cardiac fibers.
An alternative or complementary plausible cause forthe enhanced adrenergic responsiveness in AFB couldbe associated with the post-filter infusion of bicarbon-ate buffer and with the significant convective mass trans-fer that results. Purely convective transport across thedialysis membrane has long been known to promote bet-ter cardiovascular stability [47]. Moreover, in AFB thesubject receives direct infusion of bicarbonate solutionthat is at room temperature. Infusion of cold fluid couldhave an impact on the cardiac and vascular reactivitycomparable to cooled conventional dialysate, which hasgenerally been associated with increased cardiovascularstability [48]. Thus, the disparity in the cardiovascular re-activity between conventional BD and AFB could be alsoascribed to differing thermal balance and/or differing va-soactive middle molecule removal because of the differ-ent levels of convection present in the two therapies.
CONCLUSION
In the hypotension-prone patient, conventional BD in-creases the risk of hypotension compared to AFB sinceit worsens the patient’s responsiveness to hypovolemia.Model-based computer analysis has revealed a therapy-specific worsening of cardiovascular compensatory re-sponse to adrenergic stimulation during BD treatment.
ACKNOWLEDGMENTS
We are grateful to Mortara Europe S.p.A. for providing the H-12Holter recorder and the H-Scribe software used in this study. Theauthors wish to thank Dr. L.J. Garred for his critical reading of themanuscript.
Reprint requests to Professor Silvio Cavalcanti, DEIS, Viale Risorgi-mento, 2 I-40136, Bologna, Italy.E-mail: [email protected]
REFERENCES
1. OROFINO L, MARCEN R, QUEREDA C, et al: Epidemiology of symp-tomatic hypotension in hemodialysis: Is cool dialysate beneficial forall patients? Am J Nephrol 10:177–180, 1990
2. DAUGIRDAS JT: Dialysis hypotension: A hemodynamic analysis.Kidney Int 39:233–246, 1991
3. ZUCCHELLI P, SANTORO A: Dialysis-induced hypotension: A freshlook at pathophysiology. Blood Purif 11:85–98, 1993
4. KITAMURA M, SAITO A: Dialysis hypotension: a review of recentstudies of causative factors. Nephrology 6:109–112, 2001
5. BOGAARD HJ, DE VRIES JP, DE VRIES PM: Assessment of refilland hypovolaemia by continuous surveillance of blood volume andextracellular fluid volume. Nephrol Dial Transplant 9:1283–1287,1994
6. STEUER RR, LEYPOLDT JK, CHEUNG AK, et al: Hematocrit as anindicator of blood volume and a predictor of intradialytic morbidevents. ASAIO J 40:M691–M696, 1994
7. SANTORO A: On-line monitoring. Nephrol Dial Transplant 10:615–618, 1995
8. CAVALCANTI S, CAVANI S, SANTORO A: Role of short-term regulatorymechanisms on pressure response to hemodialysis-induced hypov-olemia. Kidney Int 61:228–238, 2002
9. WEHLE B, ASABA H, CASTENFORS J, et al: Hemodynamic changesduring sequential ultrafiltration and dialysis. Kidney Int 15:411–418,1979
10. MION CM, HEGSTROM RM, BOEN ST, et al: Substitution of sodiumacetate for sodium bicarbonate in the bath fluid for hemodialysis.Trans Am Soc Artif Intern Organs 10:110–115, 1964
11. GRAEFE U, MILUTINOVICH J, FOLLETTE WC, et al: Less dialysis-induced morbidity and vascular instability with bicarbonate indialysate. Ann Intern Med 88:332–336, 1978
12. HERRERO JA, TROBO JI, TORRENTE J, et al: Hemodialysis with acetate,DL-lactate and bicarbonate: a hemodynamic and gasometric study.Kidney Int 46:1167–1177, 1994
13. NORIS M, TODESCHINI M, CASIRAGHI F, et al: Effect of acetate, bicar-bonate dialysis, and acetate-free biofiltration on nitric oxide syn-thesis: Implications for dialysis hypotension. Am J Kidney Dis 32:115–124, 1998
14. BALLIGAND JL, KELLY RA, MARSDEN PA, et al: Control of cardiacmuscle cell function by an endogenous nitric oxide signaling system.Proc Natl Acad Sci USA 90:347–351, 1993
15. CHOWDHARY S, TOWNEND JN: Role of nitric oxide in the regulationof cardiovascular autonomic control. Clin Sci (Lond) 97:5–17, 1999
16. ZUCCHELLI P, SANTORO A, SPONGANO M: Acetate-free biofiltration:Acidosis correction and cardiovascular stability. Contrib Nephrol108:105–113, 1994
17. SANTORO A, MANCINI E, PAOLINI F, et al: Blood volume regulationduring hemodialysis. Am J Kidney Dis 32:739–748, 1998
18. SANTORO A, FERRARI G, SPONGANO M, et al: Acetate-free biofil-tration: A viable alternative to bicarbonate dialysis. Artif Organs13:476–479, 1989
19. CAVALCANTI S, DI MARCO Y: Numerical simulation of the hemody-namic response to hemodialysis-induced hypovolemia. Artif Organs23:1063–1073, 1999
20. MANCIA G, MAN AL: Arterial baroreflexes in humans, chap. 20, inHandbook of Physiology (vol 3), edited by Shepherd JT, AbboundFM, Geiger SR, Bethesda, MD, American Physiology Society, 1983,pp 755–793
21. MARK AL, MANCIA G: Cardiopulmonary baroreflexes in humans,chap. 21, in Handbook of Physiology (vol 3), edited by ShepherdJT, Abbound FM, Geiger SR, Bethesda, MD, American PhysiologySociety, 1983, pp 795–813
22. SAGAWA K: Baroreflex control of systemic arterial pressure and vas-cular bed, chap. 2, in Handbook of Physiology (vol 3), edited byShepherd JT, Abbound FM, Geiger SR, Bethesda, MD, AmericanPhysiology Society, 1983, pp 453–496
23. MILNOR WR: Hemodynamics, Baltimore, Williams & Wilkins, 198924. BLAND JM, ALTMAN DG: Statistical methods for assessing agree-
ment between two methods of clinical measurement. Lancet 1:307–310, 1986
25. ZUCCHELLI P, SANTORO A, FERRARI G, et al: Acetate-free biofiltra-tion: hemodiafiltration with base-free dialysate. Blood Purif 8:14–22, 1990
26. NOVELLO A, KELSCH RC, EASTERLING RE: Acetate intolerance dur-ing hemodialysis. Clin Nephrol 5:29–32, 1976
27. PAGEL MD, AHMAD S, VIZZO JE, et al: Acetate and bicarbonate fluc-tuations and acetate intolerance during dialysis. Kidney Int 21:513–518, 1982
28. MANSELL MA, MORGAN SH, MOORE R, et al: Cardiovascular andacid-base effects of acetate and bicarbonate haemodialysis. NephrolDial Transplant 1:229–232, 1987
1510 Cavalcanti et al: Dialysate composition and acute hypotension
29. OTTE KE, LILLEVAN ST, RASMUSSES AG, et al: Acetate or bicarbon-ate for hemodialysis: A randomised, double-blind controlled trial.Nephrol Dial Transplant 5:931–936, 1990
30. ALBERTAZZI A, PALMIERI PF, MASTRANGELO E: Efficacy and toler-ance of acetate free biofiltration: A central Italian multicenter trial.Kidney Int 43 (Suppl 41):S188–S194, 1993
31. MOVILLI E, CAMERINI C, ZEIN H, et al: A prospective com-parison of bicarbonate dialysis, hemodiafiltration, and acetate-free biofiltration in the elderly. Am J Kidney Dis 27:541–547,1996
32. VINCENT JL, VANHERWEGHEM JL, DEGAUTE JP, et al: Acetate-inducedmyocardial depression during hemodialysis for acute renal failure.Kidney Int 22:653–657, 1982
33. KIRKENDOL RL, PEARSON JE, BOWER JD, et al: Myocardial de-pressant effects of sodium acetate. Cardiovasc Res 12:127–136,1978
34. MAEDA K, FUJITA Y, SHINZATO T, et al: Mechanism of dialysis-induced hypotension. ASAIO Trans 35:245–247, 1989
35. NAKAMURA Y, IKEDA T, TAKATA S, et al: The role of peripheral capac-itance and resistance vessels in hypotension following hemodialysis.Am Heart J 121:1170–1177, 1991
36. LEUNISSEN KM, KOOMAN JP, VAN DER SANDE FM, et al: Hypotensionand ultrafiltration physiology in dialysis. Blood Purif 18:251–254,2000
37. RITZ E, RAMBAUSEK M, MALL G, et al: Cardiac changes inuraemia and their possible relationship to cardiovascular insta-bility on dialysis. Nephrol Dial Transplant 5 (Suppl 1):93–97,1990
38. BALLIGAND JL: Regulation of cardiac beta-adrenergic response bynitric oxide. Cardiovasc Res 43:607–620, 1999
39. NISHIMURA M, TAKAHASHI H, MARUYAMA K, et al: Enhanced pro-duction of nitric oxide may be involved in acute hypotension duringmaintenance hemodialysis. Am J Kidney Dis 31:809–817, 1998
40. BEASLEY D, BRENNER BM: Role of nitric oxide in hemodialysis hy-potension. Kidney Int 42 (Suppl 38):S96–S100, 1992
41. BINGEL M, LONNEMANN G, KOCH KM, et al: Enhancement of in-vitrohuman interleukin-1 production by sodium acetate. Lancet 1:14–16,1987
42. CHENOWETH DE, CHEUNG AK, HENDERSON LW: Anaphylatoxinformation during hemodialysis: effects of different dialyzer mem-branes. Kidney Int 24:764–769, 1983
43. SCHINDLER R, LONNEMANN G, SHALDON S, et al: Transcription, notsynthesis, of interleukin-1 and tumor necrosis factor by complement.Kidney Int 37:85–93, 1990
44. TODESCHINI M, MACCONI D, FERNANDEZ NG, et al: Effect of acetate-free biofiltration and bicarbonate hemodialysis on neutrophil acti-vation. Am J Kidney Dis 40:783–793, 2002
45. AMORE A, CIRINA P, MITOLA S, et al: Acetate intolerance is mediatedby enhanced synthesis of nitric oxide by endothelial cells. J Am SocNephrol 8:1431–1436, 1997
46. RAJ DS, VINCENT B, SIMPSON K, et al: Hemodynamic changes dur-ing hemodialysis: Role of nitric oxide and endothelin. Kidney Int61:697–704, 2002
47. SANTORO A, MANCINI E, ZUCCHELLI P: The impact of haemofiltrationon the systemic cardiovascular response. Nephrol Dial Transplant15 (Suppl 2):49–54, 2000
48. MAGGIORE Q, PIZZARELLI F, SANTORO A, et al: The effects of controlof thermal balance on vascular stability in hemodialysis patients:Results of the European randomized clinical trial. Am J Kidney Dis40:280–290, 2002
Related Documents


