CENTER FOR HEALTH ECONOMICS AND POLICY STUDIES (CHEPS) UNIVERSITAS INDONESIA 2017 MODEL BASED ECONOMIC EVALUATION Cost utility analysis (CUA) of Peritoneal Dialysis versus Hemodialysis in End Stage Renal Disease (ESRD) patients

Welcome message from author
This document is posted to help you gain knowledge. Please leave a comment to let me know what you think about it! Share it to your friends and learn new things together.
Transcript

CENTER FOR HEALTH ECONOMICS AND POLICY
STUDIES (CHEPS)
UNIVERSITAS INDONESIA
2017
MODEL BASED
ECONOMIC EVALUATIONCost utility analysis (CUA) of Peritoneal
Dialysis versus Hemodialysis in End Stage
Renal Disease (ESRD) patients

Outline
Model based economic evaluation: basic concepts
Conceptual model development
Methodology
Result of Cost utility analysis, Incremental cost
effectiveness ratio (ICER)
Probabilistic sensitivity analysis CE Plane, CEAC
Discussion and Conclusion

Model based economic
evaluationEconomic evaluation has been defined as ‘‘the
comparative analysis of alternative courses of action interms of both their costs and their consequences’’
A cost-utility analysis a type of cost-effectiveanalysis that compares different procedures andoutcomes relative to a person's quality of life.
Decision analytical modeling compares the expectedcosts and consequences of decision options bysynthesising information from multiple sources andapplying mathematical techniques, usually withcomputer software.

“Essentially, all models are wrong, but
some are useful (George Box, British
Statistician)”
“A good decision is a logical decision – one
based on uncertainties, values, and
preferences of a decision‐maker.” (Ronald
Howard)

Conceptual model
Decision
problem :
CAPD vs HD
Markov Model
ICER
Sensitivity
Analysis and
Scenarios
Costs (IDR)
Transition probability
QALYs Utility Literature review
Epidemiological data
Discount rate

Model structure
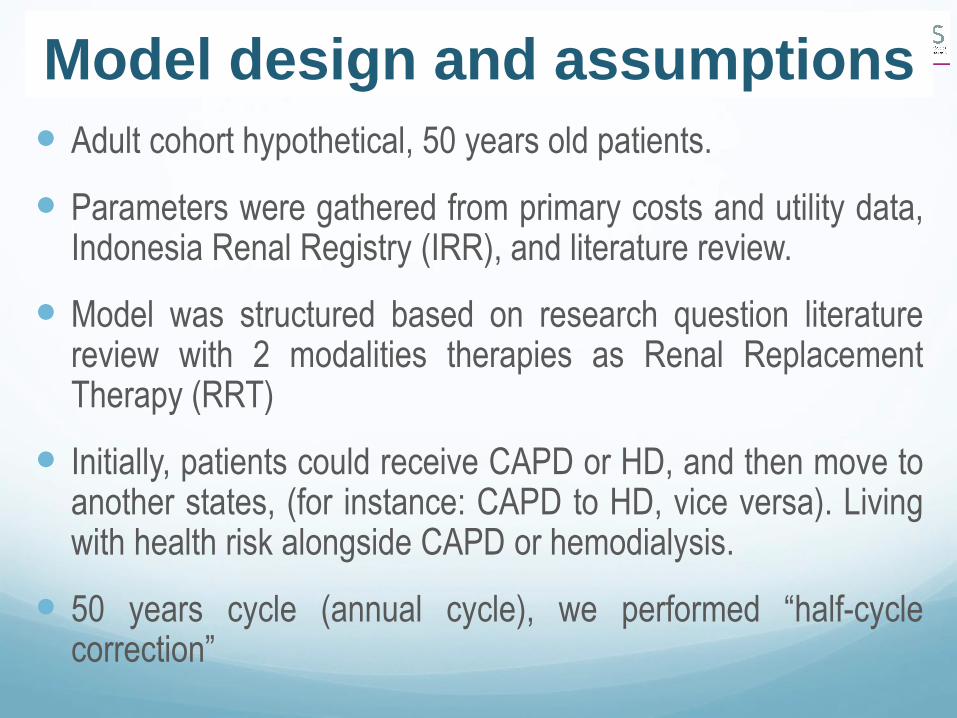
Model design and assumptions
Adult cohort hypothetical, 50 years old patients.
Parameters were gathered from primary costs and utility data,Indonesia Renal Registry (IRR), and literature review.
Model was structured based on research question literaturereview with 2 modalities therapies as Renal ReplacementTherapy (RRT)
Initially, patients could receive CAPD or HD, and then move toanother states, (for instance: CAPD to HD, vice versa). Livingwith health risk alongside CAPD or hemodialysis.
50 years cycle (annual cycle), we performed “half-cyclecorrection”

Model design and assumptions
Transplant has very low probability due to the donor
transplant availability, suitability, data limitation and not as
first therapy for ESRD patients. This model excluded
transplant. The analysis focuses on Dialysis modalities.
Cost Utility Analysis (Adaptation from CEA), we estimated
ICER (Cost/Quality Adjusted Life Years) as final outcome
of this study
Probabilistic sensitivity analysis was applied.
Established several scenarios, deterministically.

Survival Data
-ln(1-tp(t))/interval
Exponential moving average
1-s(u)

ParametersParameter Nilai 95% CI Distribusi Referensi
Transition probabilities HDtoPD 0,111 -0,3-0,25 Beta Korevaar et al.,2003
PD to HD 0,198 0,11-0,28 Beta Jaar et al.,2009
Direct medical cost
CostDMHD 102.929.481 97.277.162-108.581.800 Gamma CHEPS CostDMPD 121.788.452 110.872.425-
132.704.478
Gamma CHEPS
CosComHD 23.252.295 8.890.352- 37.614.238 Gamma HTA Indonesia CostComPD 8.207.800 1.200.408-15.215.192 Gamma HTA Indonesia
Direct non medical cost
CostDnMHD 8.917.656 7.322.763- 10.512.550 Gamma CHEPS
CostDnMPD 4.506.421 1.932.270- 7.080.572 Gamma CHEPS
Indirect cost
CostIDHD 9.291.866 7.182.895-11.400.838 Gamma CHEPS CostIDPD 6.157.997 3.582.264-8.733.731 Gamma CHEPS
Utility
UHD 0,65 0,60-0,71 Beta CHEPS
UPD 0,81 0,73-0,88 Beta CHEPS
Discounting
Dcost 3% WHO Doutcome 3% WHO

Results
CAPD HD Incremental ICER
Cost 857,778,507 865,331,716 (7,553,209) (48,850,332)
QALY 3.66 3.51 0.15

Probabilistic Sensitivity
Analysis (CE plane)
-100000000.00
-80000000.00
-60000000.00
-40000000.00
-20000000.00
0.00
20000000.00
40000000.00
60000000.00
80000000.00
-0.40 -0.35 -0.30 -0.25 -0.20 -0.15 -0.10 -0.05 0.00 0.05 0.10 0.15 0.20 0.25 0.30 0.35 0.40 0.45 0.50 0.55
Inc QALY
Inc c
osts

Cost Effectiveness Acceptability Curve
0%
10%
20%
30%
40%
50%
60%
70%
80%
90%
100%
CEACThreshold (Rupiah)
Pro
ba
bili
ty to
be
co
st e
ffe
ctive

ScenarioParameters Total Costs
(IDR) QALY ICER
Scenario 1 839,788,559
3.56
(158,799,793)
Failure probability (actual)
Transition probability HD to PD (-5%) Utility PD (-5%)
Direct medical costs PD (-5%)
Cost of complication PD (+10%)
Scenario 2
841,467,003
3.46
(235,418,020)
Failure probability (actual) Transition probability HD to PD (-10%)
Utility PD (-10%)
Direct medical costs PD (-5%)
Cost of complication PD (+15%) Scenario 3
Probabilitas failure (EMA) 1,853,640,411 8.49 (145,726,883)
Transition probability HD to PD (-15%)
Utility PD (-5%)
Direct medical costs PD (-5%)
Cost of complication PD (+15%)

Model limitations Utilization of CAPD probability of switching between
modalities
Cost of complications should be improved, sample
limitation at primary data as well.
Limitation of survival data. Data only in patient who
received HD similar life years gained expert
consultation
Utility values EQ5D-3L, collected as cross
sectional requires more representative data
Playing with scenario considerable parameters

Conclusions Average direct medical costs CAPD is higher compared
to HD
CAPD potentially cost-effective compared to HD
Switching modalities and epidemiological data are
required
Future research needed: budget impact analysis, more
‘local parameters’ for mathematical modeling, sub
group analysis,

THANK YOU
Pusat Kajian Ekonomi Kebijakan dan Kesehatan (PKEKK) FKM UI
Gedung G Lantai 3 Ruang 311, FKM UI- Depok
Email : [email protected]
www.cheps.or.id
021 7875576
Related Documents