General rights Copyright and moral rights for the publications made accessible in the public portal are retained by the authors and/or other copyright owners and it is a condition of accessing publications that users recognise and abide by the legal requirements associated with these rights. • Users may download and print one copy of any publication from the public portal for the purpose of private study or research. • You may not further distribute the material or use it for any profit-making activity or commercial gain • You may freely distribute the URL identifying the publication in the public portal If you believe that this document breaches copyright please contact us providing details, and we will remove access to the work immediately and investigate your claim. Downloaded from orbit.dtu.dk on: May 07, 2018 Model-based analysis of photoinitiated coating degradation under artificial exposure conditions Kiil, Søren Published in: Journal of Coatings Technology and Research Link to article, DOI: 10.1007/s11998-011-9383-5 Publication date: 2012 Document Version Publisher's PDF, also known as Version of record Link back to DTU Orbit Citation (APA): Kiil, S. (2012). Model-based analysis of photoinitiated coating degradation under artificial exposure conditions. Journal of Coatings Technology and Research, 9(4), 375-398. DOI: 10.1007/s11998-011-9383-5

Welcome message from author
This document is posted to help you gain knowledge. Please leave a comment to let me know what you think about it! Share it to your friends and learn new things together.
Transcript

General rights Copyright and moral rights for the publications made accessible in the public portal are retained by the authors and/or other copyright owners and it is a condition of accessing publications that users recognise and abide by the legal requirements associated with these rights.
• Users may download and print one copy of any publication from the public portal for the purpose of private study or research. • You may not further distribute the material or use it for any profit-making activity or commercial gain • You may freely distribute the URL identifying the publication in the public portal
If you believe that this document breaches copyright please contact us providing details, and we will remove access to the work immediately and investigate your claim.
Downloaded from orbit.dtu.dk on: May 07, 2018
Model-based analysis of photoinitiated coating degradation under artificial exposureconditions
Kiil, Søren
Published in:Journal of Coatings Technology and Research
Link to article, DOI:10.1007/s11998-011-9383-5
Publication date:2012
Document VersionPublisher's PDF, also known as Version of record
Link back to DTU Orbit
Citation (APA):Kiil, S. (2012). Model-based analysis of photoinitiated coating degradation under artificial exposure conditions.Journal of Coatings Technology and Research, 9(4), 375-398. DOI: 10.1007/s11998-011-9383-5

Model-based analysis of photoinitiated coating degradationunder artificial exposure conditions
Søren Kiil
� The Author(s) 2011. This article is published with open access at Springerlink.com
Abstract Coating degradation mechanisms of ther-moset coatings exposed to ultraviolet radiation andhumidity at constant temperature are investigated. Theessential processes, photoinitiated oxidation reactions,intrafilm oxygen permeability, water absorption anddiffusion, reduction of crosslink density, and develop-ment of a thin surface oxidation zone are quantifiedand a mathematical model for degrading coatingsdeveloped. Front-tracking techniques are used todetermine the rate of movement of the oxidation andablation fronts, the positions of which define theextension of the surface oxidation zone. Three previ-ous and independent experimental investigations withtwo-component, densely crosslinked, epoxy–aminemodel coatings were selected for verification of themathematical model. Simulations can match andexplain transient mass loss and coating thicknessreduction data and are in agreement with infraredmeasurements of carbonyl groups formed in thesurface zone. The thickness of the stable surfaceoxidation zone, which is established after an initialablation lag time, is estimated by the model to 0.5–2 lm in good agreement with previous measurements.Simulated concentration profiles of active groups,oxygen, and radicals in the stable surface oxidationzone are presented and analyzed. The mathematicalmodel can be used for obtaining a quantitative insightinto the degradation of thermoset coatings and haspotential, after further development, to completecommercial coatings and dynamic exposure conditions,to become a supplementing tool for predictingin-service coating behavior based on accelerated lab-oratory measurements.
Keywords Exterior durability, Materials,Weathering stress, Chain scission, Accelerated testing,Network degradation
List of symbols
Variables
A Coating area exposed to ultraviolet
radiation, m2
Ci Concentration of component i, mol/m3
coating
CCCO Initial concentration of ‘‘bridges’’ (CC) in
network structure, mol/m3 coating
CCHOHO Initial concentration of CHOH groups in
network structure, mol/m3 coating
CCH2NO Initial concentration of CH2N groups in
network structure, mol/m3 coating
CPhO Initial concentration of phenoxy groups in
network structure, mol/m3 coating
Di Intrafilm diffusion coefficient of
component i (water or oxygen), m2/s
Do Preexponential factor for diffusion
coefficient, m2/s
E Activation energy (reaction or diffusion),
J/mol
El Radiation intensity at position l in coating,
W/m2
Eo Radiation intensity at the coating surface,
W/m2
Eo,S Radiation intensity at the coating surface
in region of spectral sensitivity, W/m2
fi Functionality of reactant i
h Planck’s constant or percentage of water in
coating sample at equilibrium, J s
i Component i
S. Kiil (&)Department of Chemical and Biochemical Engineering,Technical University of Denmark, Building 229, 2800Kongens Lyngby, Denmarke-mail: [email protected]
J. Coat. Technol. Res., 9 (4) 375–398, 2012
DOI 10.1007/s11998-011-9383-5
375

ki Rate constant of reaction i, (m2/W)½ s�1,
(m3/mol s) or (m3/mol)5 s
l Position in coating, m
lA Position of moving ablation front, m
lo Initial coating thickness, m
lox Position of moving oxidation front, m
Dm Mass loss from coating, kg
mo Initial mass of coating, kg
MW,i Molar mass of component i, kg/mol
n Number of repeating units in epoxy
backbone
Piair Partial pressure of component i in air, Pa
r Stoichiometric ratio between epoxy and
amine (active hydrogen) functional groups
(�rj,i) Rate of reaction j with respect to
component i, mol/(m3 solid coating s)
R Universal gas constant, J/(mol K)
RÆ Radical
ROOÆ Radical
RH Relative humidity in UV-chamber
RHO Relative humidity in room where coatings
were stored prior to exposure
Seq Equilibrium solubility of oxygen in
coating, mol/(m3 coating Pa)
t Time, s
T Air temperature, K
Tg Glass transition temperature of coating, K
To Reference temperature, K
v Frequency of light, Hz
veo Initial crosslink density, mol/m3 coating
V Local volume of coating (= Vo(1 � e)), m3
Vo Local volume of coating at zero porosity,
m3
XCL Conversion of epoxy chains in the epoxy–
amine network (defined by equation 19)
XCL,max Value of XCL at the moving ablation front
yi Dimensionless concentration of
component i (= Ci/CiO)
Greek letters
aPh Molar absorptivity of phenoxy group, m2/mol
e Porosity
qF Film (coating) density, kg/m3
/ Quantum yield of binder (ratio of number of
bonds broken per photon absorbed)
Subscripts
CC ‘‘Bridge’’ in epoxy structure (see Fig. 1)
E Epoxy resin
i Component i
PA Polyamine crosslinker
W Water
O Initial value
Superscripto Reference value in sensitivity analysis
Introduction
Exterior coatings exposed to solar ultraviolet (UV)radiation, heat, moisture, and other environmentalstresses degrade through a number of processescollectively referred to as weathering.1 For modernhigh-performance coatings, weathering is usually aslow process often taking 5 years or longer before acritical performance property can be said to havefailed.2 In the case of an automotive clear coating, thelifetime expectancy is typically 10 years, whereas for atopcoat of an industrial anticorrosive coating system,the specified service lifetime can be more than20 years.3 Coating failure can be aesthetic (e.g., glossloss or discoloration) or protective (e.g., thicknessreduction or loss of mechanical properties). Due tonew products being continuously developed by thecoatings industry, there is a great need for acceleratedweathering tests as evidenced by the abundant litera-ture available on the topic (overviews are provided,e.g., in the recent books by Schulz1 and Wypych4).Accelerated testing can be done in laboratory exposureequipment, using high radiation intensity and/or hightemperature and relative humidity, or outdoor inclimatically stable regions, such as the very sunnyreference climates in Miami, Florida, where the rela-tive humidity is high, and Phoenix, Arizona, where theair is very dry.1 However, it is essential that theexposure strategies developed allow valid extrapola-tions to in-service exposure conditions.1,5,6 Efforts inthis direction have been ongoing for at least 100 years7
with the first UV-chamber being introduced by Atlas in1918.8 To analyze and improve the correlationsbetween laboratory and field data and increase theunderstanding of coating behavior during acceleratedexposure conditions it is of relevance to quantify theunderlying physical and chemical mechanisms anddevelop overall modeling tools.9–11 Mathematicalmodels can also help to map the coupling of individualrate phenomena.
Quantification of rate phenomena andmathematical model
In this work a mathematical model which quantifiesdegradation of simple thermoset model coatingsexposed to UV radiation and humidity, at room toslightly elevated temperatures, is developed. To capture
J. Coat. Technol. Res., 9 (4) 375–398, 2012
376

numerically the very thin surface oxidation zone thatdevelops upon exposure, front-tracking strategies areused to calculate the rate of movement of the oxidationand ablation fronts, the positions of which define thewidth of the oxidation zone. Simulations with themodel for epoxy–amine coatings are compared withthree experimental data series obtained by Nguyenet al.,12 Rezig et al.,13 and Guillot et al.14 (the latterwith data also available in Monney et al.15), whichinclude transient mass loss and thickness reductiondata as well as infrared measurements of carbonylgroups in the oxidation zone. These experimental data,supplemented by other investigations, allow a thor-ough verification of the model and many of theunderlying assumptions (a similar approach was usedto model simultaneous solvent evaporation and chem-ical curing in thermoset coatings16). The significance ofvarious degradation phenomena are subsequentlyanalyzed using the model. It should be mentioned thatthe model is relevant for industrial protective coatingsand therefore does not include a direct description ofhow the gloss develops, but rather focuses on predictionof mass loss and ablation rates (thickness reduction).
Previous mathematical modelsof coating degradation
When working with exterior durability of coatings, anessential activity is to develop mathematical models ofthe coating behavior, which can be verified or ‘‘cali-brated’’ using data obtained in accelerated laboratoryexperiments and then subsequently use these modelsfor making extrapolations to in-service conditions. Thisis a difficult task, but essential for both end-usecustomers and the coatings industry. There are severalearlier attempts to model degradation of coatingsexposed to weathering. The mathematical models canbe based on either a stochastic (statistical) approach,so-called reliability theory, leading to cumulative dam-age models, or quantitative mechanistic models, basedon knowledge of the underlying degradation mecha-nisms.10,17 Another distinction can be made betweenthe various predictions that the models undertake orthe definition of service life used. For exterior housepaints or automobile coatings, gloss loss is often of greatimportance, whereas for industrial protective coatings,loss of mechanical properties (expressed, e.g., by massloss or thickness reduction), are typically of moreconcern. In the coatings field, the models based onreliability theory appear to start with the work ofMartin,18 who developed a stochastic model for degra-dation of poly(methyl methacrylate) films. Martin’smodel uses a Poisson distribution for computing theprobability of chain scissions as a function of temper-ature and radiation intensity and another probabilityfactor estimates if a performance parameter will begreater than a minimum specified value after a givennumber of chain scissions. Service life is defined as the
time after which an unacceptable portion of a nominalpopulation of films have failed. The model wasvalidated against 25 data sets. Later stochastic modelsare described in, e.g., Martin.7,19 Calibration of themodels, to estimate dosage and damage functions,require extensive laboratory exposure data sets wherethe three main weathering factors—temperature, rela-tive humidity, and spectral UV radiation—are varied inboth space and time.7 A demonstration of an impressivedevice that can undertake such an experimental exer-cise in a fast and controlled manner, an integratingsphere-based UV exposure chamber, was reported bythe National Institute of Standards and Technology,NIST.8 Subsequent to calibration, the cumulative dam-age models are used to predict the performance of thecoatings during natural exposure (the general method-ology is provided in detail in Martin et al.20 and twospecific examples, on selected coatings, are available inGuseva et al.21 and Dickens22). Hinderliter and Croll23
have used a statistical Monte Carlo approach tosimulate coating degradation, in their work defined assurface erosion. Using repeated calculations of randomevents taking place at the coating surface, a correlationcan be established between coating degradation (e.g.,gloss loss) and any number of input variables (e.g.,pigment volume concentration). This method haspotential for improving the understanding of how glossloss develops.
The mechanistic models are based on mathematicaldescriptions of the physical and chemical phenomenataking place in coatings during exposure. Any level ofcomplexity can, in principle, be obtained, but if themodel contains too many unknown parameters it is notpractical to use. On the contrary, if the physics andchemistry are too simple, the predictive value will notbe high. The mechanistic models also require calibra-tion to estimate model parameters, but as a startingpoint, the data required will be less than that for thestochastic models, though the more data available thebetter. Mechanistic models can be used to suggestimprovements in accelerated test procedures by iden-tifying the key events in coating degradation9 andevaluating accelerated coating exposure scenarios.However, not many mechanistic models are available.Bauer17 appears to have initiated a quantitativeformalism, using in his work so-called ‘‘time-to-failuremodels’’ which should be based on fundamental studiesof the chemistry and physics of failure. Distributionfunctions are recommended to describe the statisticalvariation of the key material and exposure parameters.In Bauer’s work, the approach suggested is illustratedon two different hypothetical mechanisms, but nottried out and validated on a practical coating case.Wood and Robien24 have set up a model of weath-ering-induced mass and gloss loss in thermoplasticcoatings simulating the constant mass loss period as afunction of pigment volume concentration. The degra-dation chemistry employed is not discussed andappears to be indirectly considered through one ormore calibration parameters. Wood and Robien find
J. Coat. Technol. Res., 9 (4) 375–398, 2012
377

that the constant mass loss rate predicted is 3–4 timeshigher than the measured value and offer a number ofexplanations for this observation. Apart from thesestudies, no other mechanistic models have been identified.
Summarizing the above analysis of previous inves-tigations, the following conclusions are reached: foroptimization of a given coating, the present statisticalmodels based on reliability theory, though requiringmany systematic laboratory experiments, seem to bethe most direct way to proceed. In terms of under-standing and analysis, mechanisms of photoinitiatedcoating degradation have not been quantified to anextent that allows a detailed analysis of acceleratedexposure protocols and data. Very few models havebeen developed and several important rate phenomenaare not included in the existing models. In addition,validation of the existing models against a sufficientlylarge set of experimental data is lacking.
Outline of relevant epoxy–amine degradationmechanism
Most of the earlier degradation studies have focusedon acrylic-melamine coatings for automobiles. Morerecent studies have used epoxy–amine networks withor without pigments as reference systems because oftheir abundant use as protective coatings, insulators inelectronics, and as structural composites often exposedto direct sunlight. Though a focus on other systems hasbeen encouraged,25 epoxy–amine systems are presently
the most relevant systems to use for validation ofquantitative models because of the large amount ofdata available in the literature for those systems. InFig. 1 the structures of the epoxy binder and epoxy–amine network, relevant for this work, are shown.
Mechanism of photoinitiated oxidativedegradation of epoxy–amine networks
Photooxidation of epoxy networks, whether cross-linked with amine or other curing agents, is compli-cated. Monney et al.26 have trapped and measuredvolatile photoproducts and the degradation pathwaysare many, each one consisting of many elementarysteps. In terms of a mathematical model, this calls for asimplified closed-loop mechanism as demonstrated byColin et al.27 for a thermal oxidation problem. Such areduction is necessary to avoid a prohibitive complex-ity of the overall mathematical model and can bejustified if all relevant experimental observations canbe described by the model. Based on the detailedstudies of Bellenger, Verdu, and co-workers,28–33 thefollowing reduced mechanism can be proposed
E� CC�!hv2R� ð1Þ
R� þO2 ! ROO� ð2Þ
CH2Nþ CHOH þ 2ROO� þO2 ! CONðamideÞþ COðcarbonylÞ þH2OðlÞ þ 2ROOH ð3Þ
Photoinitiating sites ("bridge" or CC)
Diglycidyl ether bisphenol A epoxy
Epoxy-amine curing
Photooxidation
Absorption site (phenoxy)
H2
R1 +
+R1
R1
H2
H2
R2
R2R1
H2
R2
R2
NC
C
O
C
CH
OH
O
O
Amide
H2O 2ROOH
Carbonyl
2, hν
HC
CH
OH
OH
C
C
N
H2R2 R1
H2
H2
R2
R2
NC CH
CH
OH
OH
CCH2 R2CH
OH
CHC
R1
H2R2HN C
OH
CHNH2
HN
CH2 R2CH
O
O
H H2 H2 H2 HCH3
CH CH2
CH3
CH2
CH3CH3
C C
O
O O O O
O
C C
n
C C
OH
+ +
Fig. 1: Schematic illustration of epoxy structure (top) and curing (middle) and photooxidation (bottom), respectively, of anepoxy–amine network. R1 and R2 symbolize the remaining part of the polyamine crosslinker and epoxy binder molecule,respectively. n is the number of repeating units in the epoxy backbone. A three-dimensional network is formed upon fullcuring. The CH-sites (CHOH and CH2N) vulnerable to hydrogen abstraction during ultraviolet radiation exposure areindicated with arrows in the structure (middle)
J. Coat. Technol. Res., 9 (4) 375–398, 2012
378

R� þR� ! E� CC ð4Þ
ROOH�!hvvolatile end products ð5Þ
where E–CC is short for the ‘‘bridge’’ in the epoxybackbone and CH2N and CHOH are the groups in thenetwork vulnerable to hydrogen abstraction (seeFig. 1). Reactions (2), (3), and (5) are consideredirreversible. Reactions (1), (2), and (4) are elementary,while reactions (3) and (5) are overall reactions.Reactions (3) and (4) are termination reactions. Thisreduced chemical mechanism includes the mainreactions responsible for the degradation of thebinder matrix without considering the manyintermediate species and volatile end productsinvolved. The initiation reaction (1) is assumed tosimply break the ‘‘bridge’’ between the aromaticgroups in the epoxy backbone (see Fig. 1). Wypich4
and others have suggested that particular chain scissionreaction, but also the possibility of formation of a CH3
radical (also at the ‘‘bridge’’ molecular position), whichdoes not lead to any chain scission. Furthermore,Ollier-Dureult and Bosse34 suggest that the C–Obonding in the phenoxy structure in the epoxy canbreak and lead to chain scission, but these two lastreactions are not included at this stage because thefractional split between the three pathways is notknown. Reaction (2) is always part of a photooxidationmechanism.35 Reaction (3) is essential to includebecause amide and carbonyl groups are known to beformed as oxidation products in more or less equalamounts.28 Reaction (4) can, in principle, lead to otherend products than reforming of the original epoxystructure. Since no such products have been observed28
and because there has not been any detection ofdegradation in the bulk oxygen-free part of the denselycrosslinked coatings considered here,15 the radicals areassumed to simply recombine to the original bonding.Reaction (5) is shown in the mechanism, but notincluded in the model because the exact volatile endproducts formed are not known. So in the model,ROOH is accumulated and the concentration ofROOH simply represents volatile species that may beformed (e.g., ketones, alcohols, phenols, and methane).Branching of the free-radical mechanism by radicalsformed as intermediate products in reaction (5) isneglected (no radical feedback) because there are nocatalytic metal species in the coatings considered1
(except perhaps for a later special case with nano-pigments). It is assumed that there is no oxygenconsumption in reaction (5). Another reaction that isoften included in the chain reaction scheme is thetermination reaction
ROO� þROO� ! ROOR þO2 ð6Þ
However, there are no reports of peroxide endproducts being formed for epoxy–amine networks andsimulations of this work, including the reaction (taking
it as being elementary), revealed that a very large andunrealistic rate constant was required before thereaction had any influence on the simulation results.Therefore, it was omitted in the model.
Chemical kinetics
The chemical kinetics of reaction (1) is given by
ð�r1;CCÞ ¼ k1E1=2r CCC ð7Þ
where
Er ¼ /El ð8Þ
/ is the quantum yield of the epoxy resin and El and Er
are the radiation intensity of the transmitted light atposition l and the radiation intensity at position l thatcan be used for reaction (1), respectively. The radiationintensity dependency of the rate was proposed byChristensen et al.36 The remaining kinetic expressionsare assumed to be given by
ð�r2;O2Þ ¼ k2½R��½O2� ð9Þ
ð�r3;CHOHÞ ¼ k3 CH2N½ �2 CHOH½ � O2½ � ROO�½ �2 ð10Þ
ð�r4;CCÞ ¼ k4½R��2 ð11Þ
The CH2N concentration dependency of the rate ofreaction (3) was suggested by Bellenger et al.30
Mechanisms of coating degradation
The process that takes place when a densely cross-linked epoxy–amine coating is exposed to constant UVradiation and humidity at a fixed temperature in anaccelerated exposure device is schematically shown inFig. 2. From the very beginning of an exposure test,photoinitiated chain scission reactions take place,which slowly degrade the top layer of the bindermatrix. Simultaneously, if the coating, prior to expo-sure, has been stored at another value of relativehumidity than that in the exposure chamber, moistureis absorbed (or desorbed depending on the relativehumidity in the chamber) and starts to penetrate thecoating. At the surface, an oxidation front begins tomove into the coating. The rate of movement of thisfront is dependent on the rates of chemical oxidations,the solubility of oxygen in the coating, and the rate ofdiffusion of oxygen into the coating. When a criticalfraction of the original network chains has been brokenat the coating surface, the ablative front (i.e., thecoating surface) starts to move and the coatingthickness is reduced. After some time, the rate ofmovement of the oxidation and ablative fronts can
J. Coat. Technol. Res., 9 (4) 375–398, 2012
379

become equal and a stable oxidation zone thickness isestablished. This stable surface zone has been observedin practice for highly crosslinked coatings15 and esti-mated by various analytical methods to be less thanand close to 2 lm, the actual width probably beingsomewhat dependent on the exposure conditionsapplied.37,38 In the inner, much wider and oxygen-freezone, no degradation takes place despite the fact thatradiation penetrates. When radicals are formed in thiszone, they rapidly recombine and no damage occurs. Inthe stable oxidation zone, concentration gradients areestablished, the original matrix structure is partly lost,and oxidation products are present. As evidenced by
Nguyen et al.,12 about 80% of the original benzenerings in the epoxy structure can disappear from theouter part of the oxidation zone and the presence ofcarbonyl and amide groups increase rapidly. Weightloss has been observed to start before the ablationfront begins to move and the oxidation zone musttherefore be expected to be somewhat porous, at leastin the outer part.
Mathematical modeling
A transient 1-D model capable of describing degrada-tion of densely crosslinked coating exposed to UVradiation and humidity at slightly elevated tempera-tures is described here. The degradation process isschematically shown in Fig. 2. The model takes intoaccount photoinitiated chain reactions, intrafilm oxy-gen permeability, water absorption and diffusion,reduction of crosslink density, and development of a
thin oxidation zone. The overall purpose of the modelis to provide a tool that can estimate the mass loss andmatrix ablation of a coating, as well as oxygen and solidphase concentration profiles in the oxidation zone at allvalues of time. The stable oxidation zone thicknessobtained is a function of the various processes takingplace and as such is treated as an output provided bythe model. The following ‘‘active’’ groups are consid-ered in the cured network (see Fig. 1): CH groups nextto secondary hydroxyl (CHOH), phenoxy groups (Ph),‘‘bridges’’ between benzene rings in the epoxy struc-ture (CC), and CH groups next to tertiary aminegroups in the crosslinker structure (CH2N). Productgroups formed are carbonyl, amide, and hydroperox-ide. Water vapor and oxygen, which may absorb ordissolve in the coating, are also considered. Theassumptions underlying the model development are:
• Exposure conditions are limited to constant airtemperature, relative humidity, and UV radiationintensity. There is no visible or infrared radiation.Acid precipitation, air pollutants, aggressive dustand aerosols, and biological attacks are neglected.
• A clearcoat (completely cured and densely cross-linked network based on stoichiometric amounts ofreactant functional groups) of epoxy binder andamine crosslinker is considered. There are no UVabsorbers, antioxidants, or additives present in thehomogeneous coating. Pigments are considered inspecial cases only.
• Chemical degradation is represented by reactions(1)–(5).
Ablation front lA
UV radiation
O2
Air,
l Thickness of
waterVolatile products
Oxidation front, lox
Oxidation zone oxidation zone
Inactive zone
Substrate
Fig. 2: Schematic illustration (cross section view) of epoxy–amine coating during exposure to ultraviolet (UV) radiation andhumidity. On the surface of the coating, a thin oxidation zone is formed, where the degradation takes place. Figure is not toscale; in reality the oxidation zone is much thinner than the initial coating thickness
J. Coat. Technol. Res., 9 (4) 375–398, 2012
380
• Oxidation and chain scission take place in theoxidation zone only. The rest of the coating isinactive, except for water diffusion and absorption.
• The initial coating surface is flat, nonporous, andwithout defects.
• The coating is isothermal and the temperature ofthe coating is equal to that of the chamber airtemperature at all times.
• Diffusivities in the coating of all active groups areassumed to be negligible, except for ROOH, whichis assumed to be rapidly degraded to volatile andfast diffusing end products.
• The only photosensitive group in the network isphenoxy (also called phenyl ether) and it onlyabsorbs in the interval 300–330 nm, or, moreprecisely, slightly above 300 nm.4,28,30–33 As degra-dation proceeds, carbonyl groups are formed andphenoxy groups disappear. The UV molar absorp-tivities of these two groups are assumed to be thesame (equal to that of carbonyl) and the concen-tration of the photosensitive group and the absorp-tion capacity of the coating do not vary over time.Photoinitiating species can also be impurities oroxidation products initially present in the epoxyresin,1 but that will be neglected in this analysis.
• Moisture in the coating can influence the diffusionrate of oxygen in the oxidation zone via a loweringof the coating glass transition temperature andpotential swelling of the network.
• The amount of water absorption in the coating isindependent of coating degradation.
• Reflection of UV radiation at the coating-substrateinterface is neglected.
• Moisture (water) does not react with the curednetwork structure.
• No thermal degradation takes place at the temper-atures considered (maximum of 50�C).
• Radiation intensity received by the coating surfacecorresponds to that of the lamps in the UV-chamber (angle of exposure is zero degrees anddistance between lamps and coatings small enoughnot to influence the radiation intensity).
• Internal stress in the coating is considered indirectlyonly via the values used for the adjustable modelparameters.
• Potential skeleton breaking reactions, due to inter-nal stress, as described by Bellenger and Verdu,29
are neglected.
• An average and thereby constant diffusion coeffi-cient, independent of coating degradation andposition, is used for liquid water. For oxygen, anaverage and constant diffusion coefficient in theoxidation zone is used, but the value of this
parameter is dependent on coating degradationand relative humidity and must therefore be treatedas an adjustable parameter of the model.
• There is no external mass transport resistance foroxygen (i.e., the intrafilm mass transport resistanceis much larger than the external resistance).
• Potential formation of peracids is neglected.
• All CC and CH groups vulnerable to hydrogenabstraction react independently of one another.
• Relaxation (physical degradation) of the polymernetwork is neglected.
• The network formed upon curing is ideal with noloops or intramolecular bonds.39
• The ablation front starts to move when the localdegree of conversion of elastically effective net-work chains (crosslink density) has reached acritical value, termed XCL,max. The surface isremoved by the loss of volatile photoproducts.
The validity of the above assumptions, and someadditional ones to be made during the model develop-ment below, is addressed after model validation hastaken place. The mathematical model can now bedeveloped by considering a so-called control volume inthe coating as the basis.
Moving ablation front
The surface of the coating starts to move when theconversion of crosslinks, XCL, reaches a specifiedconversion, XCL,max. From then on the surface conver-sion is equal to XCL,max, and the rate of movement ofthe ablative front can be described by40
dlA
dt¼� @XCL
@t
� �l¼lAj
@XCL
@l
� �l¼lAj
� �t
ð12Þ
The initial condition is given by
lAðt ¼ 0Þ ¼ 0 ð13Þ
Moving oxidation front
The oxidation zone is placed between the movingsurface of the coating (ablative front) and the movingoxidation front. The rate of movement of the oxidationfront, at a given value of time, can be found implicitlyfrom a condition of zero oxygen flux at the oxidationfront
@CO2ðl; tÞ@l
l¼loxj ¼ 0 ð14Þ
J. Coat. Technol. Res., 9 (4) 375–398, 2012
381

with the initial condition given by
loxðt ¼ 0Þ ¼ 0 ð15Þ
This front-tracking approach insures that the widthof the oxidation zone remains dynamic and a functionof the processes taking place in the zone. An increasein oxygen availability will widen the zone and fasteroxidation reactions will narrow it.
Transmission of UV light
Absorption and transmission of UV light is describedby the Beer–Lambert law
ElðlÞ ¼ Eo10 �aPhCPhOlð Þ ð16Þ
where CPhO is the initial concentration of phenoxygroups in the network and aPh is the molar absorptivityof phenoxy groups.
Balance for crosslink density and CC groups
The concentration of elastically effective networkchains, which is approximately equivalent to theconcentration of CC groups in the epoxy backbonewhen n > 1 (there will be one CC group in each chainwhen n = 0), is given by
@CCC
@t
� �
l
¼ �ð�r1;CCÞ þ ð�r4;CCÞ ð17Þ
with initial condition
CCCðl; t ¼ 0Þ ¼ CCCO ð18Þ
As will be shown later on, the initial crosslinkdensity and CC concentration (CCCO) are calculatedbased on the common definition of crosslink density.
Local conversion of crosslinks
The local conversion of crosslinks in the oxidation zoneis given by
XCLðl; tÞ ¼ 1� CCC
CCCOð19Þ
with initial condition
XCLðl; t ¼ 0Þ ¼ 0 ð20Þ
It is assumed that up to a value of conversion ofXCL,max, no intact CC groups are lost with the volatilesformed and there is no effect of porosity on CCC.
The concentration profiles of the species present inthe leached layer, needed in the solution of the above
equations, can be determined by the mass balancespresented below.
Mass balance for nonvolatile compounds
A differential mass balance for immobilized compo-nent i (active groups except CC) in the coating gives
@Ci
@t
� �
l
¼ �X
j
ð�rj;iÞþCi
V
� �@V
@t
� �
l
¼ �X
j
ð�rj;iÞ�Ci
1� e
� �@e@t
� �
l
ð21Þ
with initial condition
Ciðl; t ¼ 0Þ ¼ CiO ð22Þ
where t (s) is time, Ci (mol/m3 coating) is concentrationof active group i, e is porosity, and (�rj,i) (mol i/m3
solid coating s), which is positive for reactants andnegative for products, is the rate of reaction j withrespect to component i. This equation takes intoaccount chemical reactions (first term on the righthand side) and development of porosity in the coating(second term on the right hand side), which continu-ously decreases the concentration of the active groupsin the coating.
Porosity in the oxidation zone
The porosity of the coating at a given position in theoxidation zone is assumed to be a power law functionof the fraction of crosslinks that have been broken byreaction (1)
eðl; tÞ ¼ 1� CCCðl; tÞCCCO
� �a
ð23Þ
There is no scientific basis for this functional rela-tionship other than it meets the requirements of aporosity of zero when no crosslinks have been brokenand a porosity of unity when all crosslinks are broken.The exponent a must be estimated from experiments.Upon differentiation the temporal derivative is obtained:
@e@t
� �
l
¼ a 1� CCCðl; tÞCCCO
� �a�1
� 1
CCCO
@CCC
@t
� �
l
� �
ð24Þ
Mass balance for oxygen
The concentration of oxygen in the solid coating in theoxidation zone is given by a differential mass balance
J. Coat. Technol. Res., 9 (4) 375–398, 2012
382

@CO2
@t¼ @
@lDO2
@CO2
@l
� �� ð�r2;O2
Þ þ ð�r3;O2Þ
�
� CO2
1� e
� �@e@t
� �
l
ð25Þ
with initial condition
CO2ðl; t ¼ 0Þ ¼ 0 ð26Þ
The boundary condition at the moving oxidationfront is given by
CO2ðlox; tÞ ¼ 0 ð27Þ
and at the ablation front by
CO2ðlA; tÞ ¼ SeqPair
O2ð28Þ
where Seq is the solubility of oxygen in the coating.
Mass balance for liquid water
Diffusion of liquid water, CW(l,t), in the coating isgiven by a differential mass balance
@CW
@t¼ @
@lDW
@CW
@l
� �þ ð�r3;WÞ ð29Þ
with an initial condition
CWðl; t ¼ 0Þ ¼ CWOðRHOÞ ð30Þ
One boundary condition is given from no substratepenetration of water
@CW
@ll¼loj ¼ 0 ð31Þ
and the other from an equilibrium condition
CWðl ¼ lA; tÞ ¼ hðRHÞ ð32Þ
where h(RH) is the equilibrium water absorption inthe coating at a given value of relative humidity, RH.
Coating weight loss
The relative weight loss of the coating, which initiallycan be positive, is given by
Dm
mo¼MW;waterA
mo
Zlo
lA
Cwdl � lAAqF
mo�AqF
mo
Zlox
lA
edl
þAMw;O2
mo
Zlox
lA
Ccarbonyldl ð33Þ
The first term on the right takes into account weightgain from water absorption, the second ablation, andthe third term includes weight loss in the oxidationzone (formation of porosity due to coating degrada-tion). Oxygen fixation to the network chains, corre-sponding to reaction (3), is included in the fourth term(simulations revealed that this term can in fact beneglected). The oxygen consumption in reaction (2) isreleased again as ROOH in reaction (3) and istherefore not included.
Heat balance
The coating can be assumed to be isothermal at alltimes (for an evaluation of this point see Levenspiel41),but the coating temperature can differ from thesurrounding air temperature. The coating temperaturethat is obtained at given conditions can be calculatedfrom an energy balance taking into account heatconvection, radiation, and substrate conduction.42
However, in a UV-chamber, which is relevant for thiswork, there will be little difference between the air andcoating temperatures. Croll et al.43 have measured thedifference to 3�C for a clearcoat exposed in a UVchamber maintained at 58�C air temperature. Due tothe fact that the heat balance requires the estimation ofparameters specific to each UV testing chamber, whichare typically not available,42 coating and air tempera-ture will be assumed equal.
Crosslink density
The initial crosslink density of the cured network canbe calculated from the method of Hill39 assuming anideal network. All epoxy resin molecules (with func-tionality of 2) then form elastically effective networkchains and if a fPA—functional amine (with 2ÆfPA activehydrogens) is used, then 1 mol 2ÆfPA—functional aminehydrogens react with fPA mol difunctional epoxygroups and the initial crosslink density is given by
voe ¼
fPAqF
Mw;PA þ fPAMw;Eð34Þ
Initial concentrations of active groups
The initial active group concentrations can be calcu-lated from the initial crosslink density. Each chain inthe network contains two CH2N groups (one in eachend) so that
CCH2NO ¼ 2voe ð35Þ
For each network chain, there are (2 + n) hydroxylgroups, where n is the number of repeating units in abisphenol A based epoxy resin
J. Coat. Technol. Res., 9 (4) 375–398, 2012
383

CCHOHO ¼ voeð2þ nÞ ð36Þ
Here, it is assumed that the hydroxyl group in theepoxy backbone can also abstract hydrogen. n isusually close to zero (0.01–0.1) so the assumption isnot important. Furthermore,
CCCO ¼ voeð1þ nÞ ð37Þ
and
CPhO ¼ voeð2nþ 2Þ ð38Þ
Glass transition temperature
During UV radiation exposure, the network is brokendown (crosslink density decreases) and it is expectedthat the glass transition temperature in the oxidationzone of the coating decreases. Croll et al.43 have shownthat the glass transition temperature of an entirecoating can be reduced after UV exposure. However,it is not possible to quantify this parameter due to lackof relevant data for densely crosslinked epoxy–aminesystems exposed at constant UV radiation conditions.As will be shown later, constant average diffusioncoefficients will be used for water and oxygen and therefinement is not needed at the present stage.
Numerical solution procedure
The model is rendered dimensionless by introductionof dimensionless variables and solved by the method oforthogonal collocation. At all times, oxygen is onlypresent in the very thin surface oxidation layer with azone thickness of 0.5–2 lm (see later) compared with atotal initial coating thickness of 50–200 lm. This leadsto a very steep oxygen concentration gradient and themodel cannot be solved by any conventional globaldiscretization procedure without numerical problems.Consequently, the two zones of the coating areimmobilized by introduction of suitable coordinatetransformations.40 Using this approach, 6 and 3 interiordiscretization points in the oxidation and inactivezones, respectively, were needed to obtain conver-gence of the transient mass loss and thickness reduc-tion simulations. Using parts of the numericaltechnique described in Ramachandran and Dudukovic44
and additional equation rearrangements, it waspossible to derive an explicit equation for the rate ofmovement of the oxidation front as a function of theoxygen gradient in the oxidation zone and the rate ofmovement of the ablation front. To initiate calcula-tions, a very low initial value of the position of theoxidation front lox has to be assigned in the followingwindow of convergence: 10�5 < lox/lo < 5 9 10�4. Inaddition, initial concentration profiles for oxygen and
water in the oxidation zone must be assumed. Somesensitivity of the weight loss towards the initialconcentration profile of oxygen used was found, butthe stable dimensionless profile of oxygen was almostinsensitive to the values provided so this stable profile,once obtained, could be used to initiate calculations inall cases. The pseudo-steady-state assumption (see e.g.,Levenspiel41) was used on the radical concentrations toobtain robust simulations.
Estimation of model parameters
The model requires a number of physical and chemicalconstants as inputs. These were estimated from variousliterature sources and are listed in Table 1. In the‘‘Sensitivity analysis’’ section, the required precision ofrelevant parameters is evaluated. The values obtainedwere from similar, but not identical and nonexposedepoxy–amine networks. With aging time, the epoxy–amine network is broken down by chain scissions andoxidation products are formed. This may obviouslylead to changes in the parameter values in theoxidation zone, but such an added complexity ispresently avoided due to lack of data.
The relationship between relative humidity (RH) ofthe air and equilibrium water content in an epoxy–amine network can be calculated from45
h ¼ hmk�f �RH
1� f �RHð Þ 1þ ðk� 1Þ�f �RH½ � ð39Þ
where h (g water/100 g dry sample) is the percentage ofwater content in the specimen. In the equation,hm = 0.57, k = 6.5, and f = 0.76. According toMaggana and Pissis, h can be assumed independentof temperature and the correlation can also be used for
Table 1: Physical and chemical parameter valuesneeded for the mathematical model
Parameter Parameter values
Dwater46,47 2.1 9 10�12 m2/s (50�C)a
qF 1170 kg/m3
Spectral sensitivity 300–330 nmaPh (310 nm) 1 m2/molE1–E4 27 kJ/molCWO (75% RH) 1.19 9 10�2 g water/(g dry coating)
= 774 mol water/(m3 dry coating)/ 10�4
Seq27 1.6 9 10�4 mol/(m3 coating Pa)a
k2 15 L/mol s (25�C)k3 >1 (m3/mol)5 s (25�C)Poxygen
air 21278 Pa (21 vol.% in air)
If no temperature is indicated, the parameter is assumedtemperature-independenta Standard deviation not available
J. Coat. Technol. Res., 9 (4) 375–398, 2012
384

immersion of the coating system in water (heavyrainfall) corresponding to 100% relative humidity.The diffusion coefficient of water in an epoxy/amineclearcoat can be calculated from an Arrheniusexpression:
Dwater ¼ Do;water exp �Ewater
RT
� �ð40Þ
with an approximate activation energy of 45 kJ/mol46
and a preexponential factor of 3.86 9 10�5 m2/s. Thevalue obtained for the diffusion coefficient is in goodagreement with the value for an epoxy–anhydridesystem (clearcoat), which is 3.67 9 10�13 m2/s at 25�Cand 75% relative humidity.47 The molar absorptivity ofphenoxy groups was assumed to be equal to that ofcarbonyl groups at 310 nm and taken from Schulz.1 Aquantum yield value for the epoxy resin was estimatedfrom Bellenger and Verdu.29,31,32 Quantum yield canbe a function of moisture content, coating thickness,and many other parameters,19,48 but that complexity isnot included in the model.
A typical network density was taken from Monneyet al.15 and the spectral sensitivity from Wypych.4 Anorder of magnitude value for the rate constant k2 wasfound in Bateman49 who estimated k2 to 3–50L/(mol s) at 25�C for two different polymers (ethyllinoleate and digernyl). It seems reasonable to assume,at least as a first approximation, that the rate ofoxidation of radicals could be similar in differentsystems and the value provided in Table 1 is used. Allamine groups that react are assumed to form amides inreaction (3) and therefore k3 should just be above acritical value (provided in Table 1).
Rate constants at a given temperature can becalculated from the following equation based onArrhenius expressions
lnkiðTÞkiðToÞ
� �¼ Ei
R
1
To� 1
T
� �ð41Þ
For later comparison, oxygen diffusion (20–120�C),in an aromatic amine crosslinked epoxy network belowTg, is given by27
Doxygen ¼ Do;oxygen exp �Eoxygen
RT
� �ð42Þ
where the preexponential factor is 2.1 9 10�10 m2/sand the activation energy is 18 kJ/mol. The solubilityof oxygen in the same epoxy–amine system, Seq, can beassumed independent of temperature (20–120�C) andis assumed to be independent of relative humidity. It isgenerally found that for light gases, such as oxygen, thediffusivity varies a great deal more from polymer topolymer than solubility. Activation energies of allchemical reactions are assumed to be the same andequal to some intermediate value of the numbers
suggested by Bellinger et al.30 Activation energies arealso discussed in Bauer.50 Estimation of the remainingmodel parameters (k1, k4, XCL,max, and Doxygen) isdiscussed in the ‘‘Results and discussion’’ section.
Results and discussion
To verify the coating degradation model, three inde-pendent experimental series of data with epoxy–aminecoatings were used. Many exposure and formulationvariables are required for model input and these arenot always explicitly stated in the experimental reports.In general, it has been particularly difficult to establishthe radiation intensity (in W/m2) of the lamps appliedin the accelerated weathering devices, the distancebetween lamps and coating samples in the chambers(UV radiation intensity decreases rapidly with dis-tance), and the fractional effect delivered in the regionof spectral sensitivity of epoxy–amine systems. Thisdoes not prevent simulations because the uncertainty(including that of the quantum yield) is simply lumpedinto the values used for k1 (see equation 7). However,it means that the values reported for k1 do notrepresent numbers for the true rate constant and assuch, for purposes other than the present model,should be used with caution.
Model verification using the dataof Nguyen et al.12 (clearcoat)
The first set of data was recently reported by Nguyenet al.12 who used the SPHERE equipment at NIST forexperimentation, which provides very controlled expo-sure conditions. This appears to be the only data setavailable in the literature that includes both the rate ofmass loss and end product formation (carbonyl). Inaddition, the required test parameters, air chambertemperature, relative humidity, total UV radiationintensity, initial weight of coating sample, bindermolecular weights and functionalities, and coatingsurface area exposed, are provided. The initial dryfilm thickness, for a given coating, can be calculatedfrom the following equation (assuming a nonporouscoating)
lo ¼mo
AqF
ð43Þ
Based on the spectral output from the SPHERE,provided in Chin et al.,51 it is estimated that in theinterval of spectral sensitivity of epoxies, 300–330 nm4,about 30 W/m2 falls on the coatings exposed. In Fig. 3a comparison of simulations and experimental data areshown for a clearcoat. A reasonable good agreementcan be seen for the rate of mass loss. The modelparameters k1, k4, XCL,max, Doxygen, and a wereadjusted (values provided in the figure caption) to
J. Coat. Technol. Res., 9 (4) 375–398, 2012
385

match the data points. All other parameters wereestimated independently. In the first few days, due towater absorption, the mass of the coating increases.The oxidation zone becomes somewhat porous when itdegrades and therefore mass loss also starts from thevery beginning, but for some days the water absorptionis larger than the material loss. After about 6 days, thecrosslink density at the surface has decreased, corre-sponding to a conversion value of XCL,max, and thecoating surface (ablation front) now starts to move,rapidly leading to a larger, but constant, rate of massloss, dominated by the rate of ablation. From this pointand onwards, the rate of mass loss will no longerchange. In the experimental data in Fig. 3, after mostof the water absorption has taken place, there is asudden decrease in the mass of the coating, muchlarger than the model suggests, followed by a more orless constant weight for some days. The experimentaldata are based on five replicates12 so the effect shouldbe significant and cannot be attributed to, e.g., arandom loss of a ‘‘large’’ material piece from theoxidation zone. It has not been possible to find aphysical explanation for this observation and for someunknown reason, it is not present in the other two datasets of Nguyen et al. (to be discussed later). Analternative explanation could be an instrumental oroperator error in the measurements, but this has notbeen confirmed.
In the top part of Fig. 3, the decrease in the surfaceconcentration of epoxy ‘‘bridges’’ and the increase inthe surface concentration of carbonyl end product areshown. Note that here simulations and experimentaldata can only be compared qualitatively because theexperimental data are presented as a relative change inFTIR intensity (reflection mode) in the top surfacelayer (down to a depth of somewhere between 0.5 and2 lm,12 the depth of penetration being frequencydependent52). However, it can be seen that thesimulated time it takes for the end product concentra-tion to reach a stable value is in very good agreementwith the experimental data (error bars are not shown,but the experimental uncertainty is quite small20).Nguyen et al. have also measured the transientdecrease in the relative change of FTIR intensity ofbenzene rings, which form part of the epoxy backbonestructure. Assuming a linear relationship betweenFTIR signal and concentration, the benzene concen-tration in the top layer decreases by a factor of five inthe first about 10 days12 (not shown here). Thisobservation cannot be compared directly to simula-tions, but as shown in Fig. 3, the dimensionless surfaceconcentration of epoxy ‘‘bridges’’ (yCC) decreases by40% in the first 10 days. The relationship between thedimensionless concentration of elastically effectivenetwork chains (yCC) and the loss of benzene rings isunknown, but it seems possible that a 40% decrease inthe crosslink density at the surface can lead to areduction of 80% in the benzene concentration in thesurface layer. For soft epoxy systems, Mailhot et al.53
have found an almost complete loss of aromatic
character in the surface layer. In Fig. 4 simulations ofthe transient developments in the oxidation zonethickness and position of the oxidation and ablationfronts, still at the conditions of Fig. 3, are shown. Thegap between the positions of the two fronts corre-sponds to the oxidation zone thickness. It can be seenthat after about 10 days of exposure, a stable thicknessof approximately 1.95 lm is predicted by the model.This is in very good agreement with measurementsdone by Monney et al.15,26,37,38 using several independentanalytical techniques on densely crosslinked epoxy–amine coatings exposed to UV radiation. Monney
0 10 20 30
Time (days)40 50
1 35
Simulation of ycc
SimulationExperimental data
Simulation of ycarbonylExperimental data(carbonyl in surface layer)
30
25
20
15
10
5
0
0.8
0.6
0.4
0.2
0
0
–0.8
–1.6M
ass
loss
(%
)S
urfa
ce v
alue
of y
cc o
r y c
arbo
nyl
Rel
ativ
e ch
ange
in F
TIR
inte
nsity
–2.4
–3.2
Fig. 3: Comparison of model simulations (lines) withexperimental mass loss data (symbols) for a pigment-freeepoxy–amine coating. Error bars are also shown on bottomplot. The experimental data were taken from Nguyen et al.12
Conditions are: T = 50�C, RH = 75%, RHO = 45%, Eo = 480W/m2 (295–400 nm), Eo,S = 30 W/m2, r = 1, lo = 147 lm(mo = 106.78 mg), n = 0.1, Mw,E = 378 g/mol, fE = 2, Mw,PA =486 g/mol, fPA = 3 (equivalent to six active hydrogens),mo = 106.78 mg, A = 6.25 3 1024 m2, ve
o = 2167 mol/m3,CCCO = 2383 mol/m3, CCHOHO = CCH2NO = 4333 mol/m3, andCPhO = 4767 mol/m3. Adjustable parameters at 50�C are:XCL,max = 0.4, k1 = 0.012 (m2/W)½ s21, k4 = 0.3 (m3/mol s),Doxygen = 0.49 3 10213 m2/s, and a = 0.6. The remainingparameters are provided in Table 1
J. Coat. Technol. Res., 9 (4) 375–398, 2012
386

et al., for the conditions selected, found that thethickness should be close to and less than about 2 lm.Floyd25 suggests, based on conference discussions, thatthe thickness may be down to about 1 lm. It can alsobe seen in Fig. 4 that there is a lag time (about 6 days)before the ablation front begins to move. The reasonfor this is that a certain amount of the network (epoxychains) must be broken before the surface is suffi-ciently degraded to initiate movement. A similarbehavior, for other binder types and under verydifferent exposure conditions, has been observed forunderwater degradation of self-polishing antifoulingcoatings.54 As will be shown later, the ablation lag timeof Figs. 3 and 4 has also been found in practice. Therate of movement of the oxidation front is dramaticallyincreased when the ablation front begins to move. Thereason for this is that the diffusion length of oxygen is
kept constant and low, when the stable oxidation zonethickness is established.
Evaluation of adjustable parameters used
The values of the adjustable parameters used in thesimulations of Figs. 3 and 4 should be accompanied bysome discussion. The rate constants, k1 and k4, bothbelonging to the photoinitiating reaction (1), which isconsidered to be reversible, are very specific for thesystem considered. Uncertainties in the quantum yieldand radiation intensity are lumped into k1 and thevalues used cannot meaningfully be compared withvalues found in other studies (if these were available,so far none have been identified). The value of a, whichis related to the porosity development, is purelyempirical (see equation 23), and only has an influenceon the mass loss in the initial period preceding thestable mass loss period. XCL,max, the conversion ofelastically effective network chains at which the ablationfront begins to move, is a very important parameter asshown in the ‘‘Sensitivity analysis’’ section. It has notbeen possible to verify the value used for XCL,max (0.4),but it seems likely that it may be dependent on, e.g.,rain because Monney et al.15 suggest that ablation canbe severely increased by rainfalls. The value used forthe average diffusion coefficient of oxygen in theoxidation zone was 0.49 9 10�13 m2/s (50�C). Thisnumber can be compared with the value, 2.47 9 10�13
m2/s (50�C), measured by Colin et al.27 for a nonex-posed, pigment-free epoxy–amine coating with a glasstransition temperature of 210�C. The binder system,though epoxy–amine, is quite different to that ofNguyen et al., but because both systems are far belowtheir glass transition temperatures, the values might beexpected to be somewhat similar.47 However, a seriouscomplication is that the network present in theoxidation zone is quite different from that of thenonexposed binder matrix.55 Part of the epoxy back-bone structure is gone and oxidation products arepresent. The diffusion coefficient of oxygen in theoxidation zone is most likely a strong function ofposition because the porosity is high at the very outersurface13,56 and, in the model, falls to zero at theoxidation front. Possibly, the oxidation zone is onlyporous in the outer part—the low oxygen diffusioncoefficient used in the model is an indication ofthis—but investigations are needed to quantify thehypothesis. If porosity is neglected completely in themodel, a substantially less good fit for the mass loss inthe first 10 days or so is found. Equilibrium waterabsorption and oxygen solubility could also be differ-ent. It is not known how these changes will influencethe rate of oxygen diffusion, but Mailhot et al.52,53 havefound that some oxidation products can be in liquid orsolid form and be likely to generate a viscous layer, theproperties of which are unknown. Rivaton et al.55 evenmeasured an almost 40% decrease in the rate ofoxygen permeability after only 10 h UV radiation
0
2
1.95
1.85
1.9
1.8
8 Oxidation frontAblation front
6
4
2
0
2010 30
Time (days)
Pos
ition
of f
ront
s (μ
m)
Oxi
datio
n zo
ne th
ickn
ess
(μm
)
40 50
Fig. 4: Transient simulations of oxidation zone thickness(top) and positions of moving fronts (bottom) for a pigment-free epoxy–amine coating. Conditions and parameters arethe same as in the figure caption of Fig. 3
J. Coat. Technol. Res., 9 (4) 375–398, 2012
387

exposure. In addition, the uncertainty of the diffusionparameters and the relative humidity employed duringthe experiments have not been reported by Colinet al.27 The value used for the oxygen solubility couldalso be inaccurate. Seubert et al.57 found that oxygensolubility in UV-curable urethane acrylate clearcoatswas dependent on the curing conditions. So, it can beconcluded that the value used for the diffusion coef-ficient is presently the right order of magnitude, butsomewhat low compared with expectations. Onereason could be that there is an oxygen consumptiontaking place that has not been accounted for. This wastested by assuming that for each mole ROOHdegraded in reaction (5), b moles of oxygen isconsumed. However, when using the diffusion coeffi-cient provided by Colin et al.,27 it was only possible toget a good fit if b = 5 and this oxygen consumptionseems very high, though it cannot be ruled out as apossibility before a precise value for the diffusioncoefficient becomes available. Yet, it is, in principle,possible in this way to use b instead of Doxygen as anadjustable parameter.
Model verification using the data of Nguyen et al.12
(nano-pigmented systems)
Nguyen et al. have also measured the effect of nano-particles on the degradation behavior. In Fig. 5, com-parisons of simulations and experimental data for twolow-pigmented coatings are shown. One of the coatingscontains 0.72 wt% multiwalled carbon nanotubes(MWCNT) and the other 5 wt% nano-SiO2. A goodagreement between simulations and experimental datais evident. For the coating containing nano-SiO2, alladjustable parameters were the same as for theclearcoat in Fig. 3 and the difference in the relativemass loss (and associated ablation rates) can beattributed entirely to a difference in the initial dryfilm thickness (the small compositional effect on initialcrosslink and coating density is negligible). On theother hand, the rate of mass loss for the coatingcontaining MWCNT is smaller than that of theclearcoat. The constant rate of ablation (not shown)is reduced by 36% when the coating contains as little as0.72 wt% MWCNT. The effect of MWCNT is thoughtto be mechanical though the material can most likelyalso absorb UV radiation, similar to carbon black, butthe concentration is rather low for a strong absorptioneffect (for nano-ZnO, 1–4 wt% is required58). Aglanet al.59 have shown that as little as 0.1 wt% MWCNTcan improve the cohesiveness of an epoxy coating.Both hypotheses were tried by varying the values ofradiation intensity, Eo, and conversion of elasticallyeffective network chains where ablation sets in,XCL,max. Though a reasonable fit could be obtainedby decreasing Eo, corresponding to less radicals beingformed in reaction (1), the curvature was not quite asthe experimental data suggests it should be. IncreasingXCL,max from 0.4 to 0.6, on the other hand, resulted in
the very good fit shown in Fig. 5 suggesting that theeffect of MWCNT is mostly mechanical (an increase inXCL,max means that more bonds must be broken beforeablation sets in).
Contrary to the clearcoat data in Fig. 3, where arapid mass loss rate is observed after 2–3 days, thepigmented systems in Fig. 5 exhibit a more smoothtransition, which the model can predict very well. Thethickness of the stable oxidation zone is 1.96 lm in thetop figure and 1.97 lm in the bottom figure.
0.8
0.4
–0.4
–0.8
–1.2
–1.6
–0.8
–2.4
–3.2
–4.8
–5.6
–4
–1.6
–2
0
0
0 10 20 30
Time (days)
Mas
s lo
ss (
%)
Mas
s lo
ss (
%)
40 50
SimulationExperimental data
SimulationExperimental data
0.72 wt% MWCNT
5 wt% SiO2
Fig. 5: Comparison of model simulations (lines) withexperimental mass loss data (symbols) of an epoxy–aminecoating containing either 0.72 wt% multiwalled carbonnanotubes (MWCNT) or 5 wt% nano-SiO2 particles. Errorbars are also shown. The experimental data were takenfrom Nguyen et al.12 Conditions are the same as in thefigure caption of Fig. 3 except for the initial dry filmthickness, which was 146 lm for MWCNT (mo = 106.16 mg)and 95 lm for nano-SiO2 (mo = 72.27 mg), respectively.Adjustable parameters are the same as in Fig. 3 exceptthe parameter XCL,max, which is 0.6 for the coating withMWCNT. The remaining parameters are provided in Table 1
J. Coat. Technol. Res., 9 (4) 375–398, 2012
388

Concentration profiles in the oxidation zoneand entire coating
Concentration profiles, at times where the rate ofmovement of the fronts have become constant (i.e., astable oxidation zone thickness has been established),are shown in Fig. 6. It can be seen that the radicalconcentrations are very low and that there is a largedrop in oxygen concentration from the ablation to theoxidation front. The carbonyl concentration is highestat the ablation front and falls to zero at the oxidationfront. On the contrary, the crosslink density is lowest atthe ablation front and equal to that of the nonexposedcoating at the oxidation front. The porosity is 58% atthe ablation front and falls to zero at the oxidationfront (not shown). The radiation intensity is practicallyconstant over the thin oxidation zone (not shown).
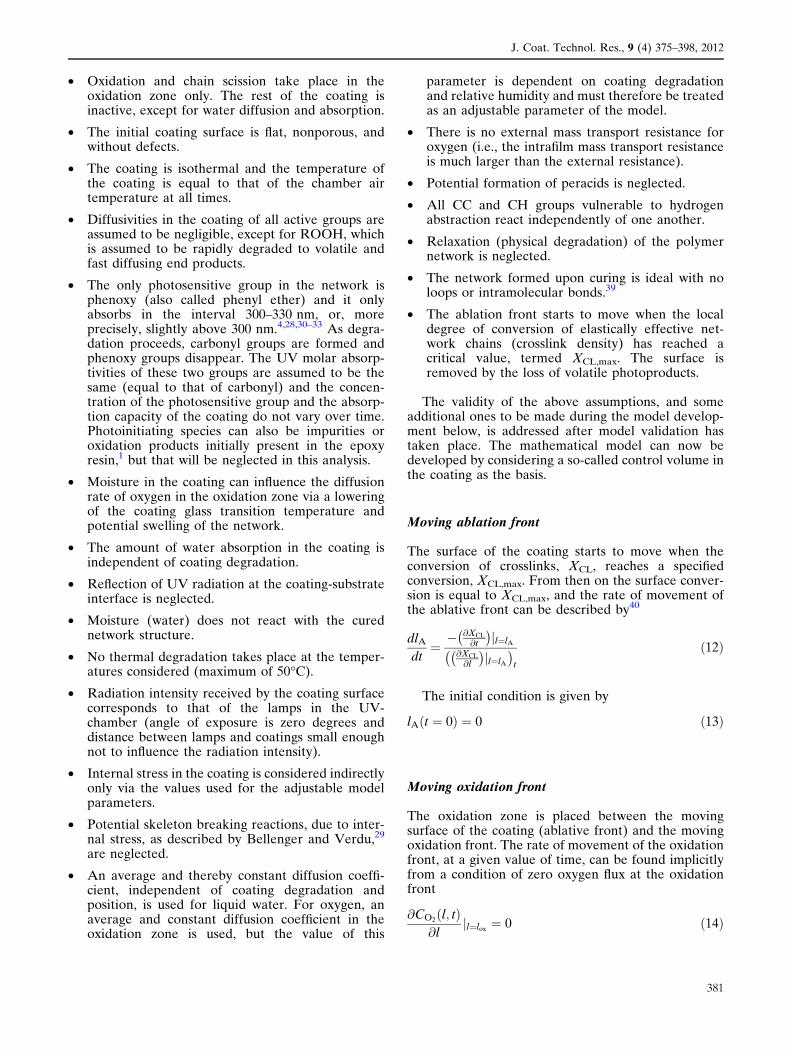
Oxygen and water concentration profiles in theentire coating, at two values of time, are shown inFig. 7 (note that coating thickness decreases over timedue to ablation). The oxygen profiles, due to rapidoxidation reactions, are very steep (practically vertical)at all times. Water, in liquid form, rapidly diffuses intothe entire coating and saturates it within 1–2 days. Dueto relative humidity (RHO = 45%) in the room wherethe coating was placed prior to UV exposure, thecoating already contains some water at t = 0, wherethe dimensionless concentration is unity. Following thewater absorption (or desorption under other condi-tions) is important because the oxygen diffusion rateinto the coating is a function of the glass transitiontemperature, which again depends on the water con-centration.1
Model verification using the data of Rezig et al.13
(clearcoat)
When validating a mathematical model it is best to useseveral independent sets of experimental data tochallenge the model. In the present case, another setof exposure data, using a Xenon lamp with filters(removing most infrared and some visible radiation),was published by Rezig et al.13 and are very useful as asupplement because ablation rates, as opposed to massloss data, were measured. In Fig. 8 a comparison ofsimulations and experimental data for an epoxy–aminecoating at a relative humidity of 75% is shown. It canbe seen that the model can predict the experimentaldata very well using adjustable parameters not verydifferent from those used in the simulations of Fig. 3.Again it should be noticed that the comparison in thetop figure can only be qualitative because absorbance(in transmission mode) only, and not absolute concen-tration, is available. A very important prediction is thelag time of about 10 days before the ablation frontstarts to move. As discussed earlier on, this is the timeit takes to break a certain fraction of the elasticallyeffective network chains on the coating surface.Monney et al.38 have also found an experimental lag
time of about 10 days under similar conditions. Thethickness of the stable oxidation zone, under theconditions of Fig. 8, is estimated by the model to 1lm. The ablation rate corresponding to Fig. 3 is 3.3times higher than that of Fig. 8. Temperature andrelative humidity are the same in the two experiments,so the difference found is due to a higher initialcrosslink density in Fig. 8, some variation in mechan-ical properties (XCL,max), and differences in the rate ofreaction (1) and in the rate of oxygen diffusion.
Exposure data for the same coating system as inFig. 8, but for a relative humidity of only 9%, is shown
1
0.8
CCCH2N
yR
107 x yROO
O2
C=O
0.6
0.4
0.2
0
0.004
0.003
0.002
0
0 0.2 0.4 0.6 0.8 1
0.001
Dim. position in oxidation zone
Dim
. con
c. o
f rad
ical
sD
imen
sion
less
con
cent
ratio
ns
Fig. 6: Stable (i.e., at times larger than about 20 days)dimensionless concentration profiles in the oxidation zone.Dimensionless concentrations are defined as Ci/CiO, whereCiO (initial concentration) for a given component, i, isprovided in the caption of Fig. 3. For the two radicals,CiO = CPhO and for oxygen CiO = 3.4 mol/m3 coating. Notethe additional scaling by a factor of 107 for ROOÆ. Thethickness of the stable oxidation zone is close to 2 lm (seeFig. 4). Conditions and parameters are the same as in thecaption of Fig. 3
J. Coat. Technol. Res., 9 (4) 375–398, 2012
389
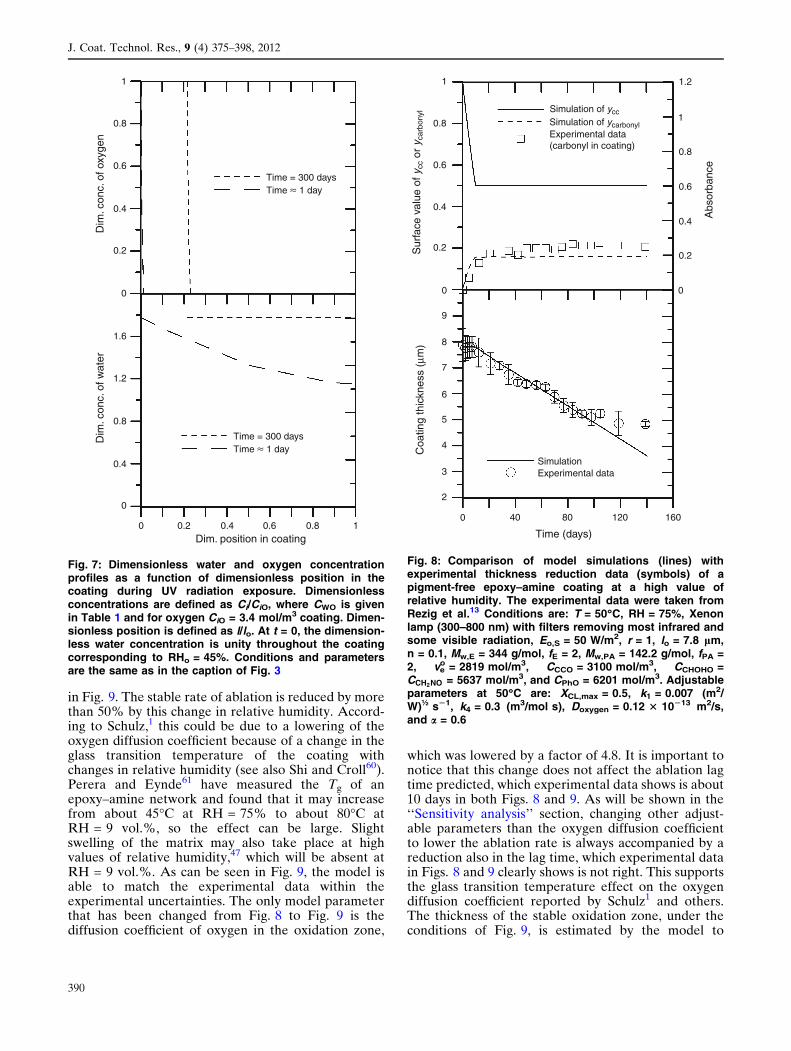
in Fig. 9. The stable rate of ablation is reduced by morethan 50% by this change in relative humidity. Accord-ing to Schulz,1 this could be due to a lowering of theoxygen diffusion coefficient because of a change in theglass transition temperature of the coating withchanges in relative humidity (see also Shi and Croll60).Perera and Eynde61 have measured the Tg of anepoxy–amine network and found that it may increasefrom about 45�C at RH = 75% to about 80�C atRH = 9 vol.%, so the effect can be large. Slightswelling of the matrix may also take place at highvalues of relative humidity,47 which will be absent atRH = 9 vol.%. As can be seen in Fig. 9, the model isable to match the experimental data within theexperimental uncertainties. The only model parameterthat has been changed from Fig. 8 to Fig. 9 is thediffusion coefficient of oxygen in the oxidation zone,
which was lowered by a factor of 4.8. It is important tonotice that this change does not affect the ablation lagtime predicted, which experimental data shows is about10 days in both Figs. 8 and 9. As will be shown in the‘‘Sensitivity analysis’’ section, changing other adjust-able parameters than the oxygen diffusion coefficientto lower the ablation rate is always accompanied by areduction also in the lag time, which experimental datain Figs. 8 and 9 clearly shows is not right. This supportsthe glass transition temperature effect on the oxygendiffusion coefficient reported by Schulz1 and others.The thickness of the stable oxidation zone, under theconditions of Fig. 9, is estimated by the model to
1
0.8
Time = 300 daysTime ≈ 1 day
Time = 300 daysTime ≈ 1 day
0.6
0.4
0.2
1.6
1.2
0.8
0.4
0
0 0.2 0.4 0.6 0.8 1
0
Dim. position in coating
Dim
. con
c. o
f wat
erD
im. c
onc.
of o
xyge
n
Fig. 7: Dimensionless water and oxygen concentrationprofiles as a function of dimensionless position in thecoating during UV radiation exposure. Dimensionlessconcentrations are defined as Ci/CiO, where CWO is givenin Table 1 and for oxygen CiO = 3.4 mol/m3 coating. Dimen-sionless position is defined as l/lo. At t = 0, the dimension-less water concentration is unity throughout the coatingcorresponding to RHo = 45%. Conditions and parametersare the same as in the caption of Fig. 3
1
0.8
1.2
1
0.8
0.6
0.4
0.2
0
0.6
0.4
0.2
0
9
8
7
6
5
4
3
2
0 40 80 120 160
Time (days)
Sur
face
val
ue o
f ycc
or
y car
bony
l
Abs
orba
nce
Coa
ting
thic
knes
s (μ
m)
Simulation of ycc
Simulation of ycarbonylExperimental data(carbonyl in coating)
SimulationExperimental data
Fig. 8: Comparison of model simulations (lines) withexperimental thickness reduction data (symbols) of apigment-free epoxy–amine coating at a high value ofrelative humidity. The experimental data were taken fromRezig et al.13 Conditions are: T = 50�C, RH = 75%, Xenonlamp (300–800 nm) with filters removing most infrared andsome visible radiation, Eo,S = 50 W/m2, r = 1, lo = 7.8 lm,n = 0.1, Mw,E = 344 g/mol, fE = 2, Mw,PA = 142.2 g/mol, fPA =2, ve
o = 2819 mol/m3, CCCO = 3100 mol/m3, CCHOHO =CCH2NO = 5637 mol/m3, and CPhO = 6201 mol/m3. Adjustableparameters at 50�C are: XCL,max = 0.5, k1 = 0.007 (m2/W)½ s21, k4 = 0.3 (m3/mol s), Doxygen = 0.12 3 10213 m2/s,and a = 0.6
J. Coat. Technol. Res., 9 (4) 375–398, 2012
390

0.5 lm. The oxidation zone thickness is determined bythe relative movements of the two fronts and in thiscase, the lower oxygen diffusion coefficient makes theoxidation front move more slowly relative to that ofthe ablation front (which in fact also moves slower).The rate of movement of the ablation front is stronglycoupled to the rate of movement of the oxidation frontand the ablation front can never overtake the oxidationfront.
Model verification using the dataof Guillot et al.14 (clearcoat)
The last experimental data set is taken from Guillotet al.14 who studied the ablation of a pigment-freeepoxy–amine coating during exposure by a Xenonlamp with filters that remove infrared radiation.
Unfortunately, the relative humidity during exposureis not provided. In Fig. 10 a comparison betweensimulations and experimental data is shown. Themodel is able to predict the ablation rate and theexpected ablation lag time using the adjustable param-eters provided in the figure caption. The ablation rateis about 10% lower than that corresponding to the datain Fig. 3. The thickness of the stable oxidation zone,under the conditions of Fig. 9, is estimated by themodel to 1.25 lm.
Sensitivity analysis
A sensitivity analysis of the model with respect toimportant parameters was performed under the con-ditions of Fig. 3. Each parameter was varied aroundthe estimated value used in the simulations of Fig. 3and the movement of the ablation front was used asmodel output. The ablation rate is not a function of thevalue of a and therefore it is not considered. First, theeffect of oxygen solubility and diffusivity can be seen inFig. 11. It is apparent that the stable ablation rate issensitive to both parameters, in particular the oxygensolubility. However, the lag time, preceding the move-ment of the ablation front, is only sensitive to theoxygen solubility, where it varies from 3.2 to 11.3 daysin Fig. 11 (top). This dependency is seen because anincrease in oxygen solubility increases the rate ofoxidation at the coating surface, where the coating isalways saturated with oxygen. On the other hand, anincreased rate of oxygen diffusion only increases therate of oxidation within the oxidation zone and not atthe surface, where saturation is always maintained dueto the absence of any external mass transport resis-tance of oxygen.
In Fig. 12 the effects of the rate constants k1 and k2
on the stable ablation rate and lag time are shown. Themodel is sensitive to both parameters because theycontrol the rate of photoinitiation and rate of radicaloxidation. A literature value for k2 was used in thiswork for all simulations, but it has not been confirmedthat it can be used for all radical oxidations. Bothparameters affect the rate of oxidation, also at thecoating surface, and therefore the lag time dependencyis seen. The effect of k4 on simulations is the same asthat of k1 as long as k3 has a high value (not shown).
Finally, the effect of XCL,max is shown in Fig. 13.Also for this parameter, a model dependency on boththe stable ablation rate and lag time is seen. XCL,max isexpected to be dependent on humidity, especially rain,and probably also internal stress or other phenomenathat influence the mechanical properties of the oxida-tion zone. Misovski et al.62 and Monney et al.15 havereported that the ablation rate of a coating can beincreased when it rains due to washing away ofphotodegradation products.
A last point to note is that since the effect of the rateconstants and XCL,max (and oxygen solubility for thatmatter) on the ablation rate are quite similar, it means
1
0.8
3
2.4
1.8
1.2
0.6
0
0.6
0.4
0.2
7.2
6.4
5.6
4.8
4
0 40 80 120 160
0
8
Time (days)
Sur
face
val
ue o
f ycc
or
y car
bony
l
Abs
orba
nce
Coa
ting
thic
knes
s (μ
m)
Simulation of yccSimulation of ycarbonylExperimental data(carbonyl in coating)
SimulationExperimental data
Fig. 9: Comparison of model simulations (lines) withexperimental thickness reduction data (symbols) of apigment-free epoxy–amine coating at a low value of relativehumidity. The experimental data were taken from Reziget al.13 Conditions are the same as in Fig. 8 except therelative humidity which is only 9% and the initial coatingthickness which is 6.6 lm. All parameter values are thesame as in Fig. 8 except Doxygen, which is 0.025 3 10213
m2/s (50�C)
J. Coat. Technol. Res., 9 (4) 375–398, 2012
391

that more than one combination of the adjustableparameters will fit the data (small changes in oneparameter can be counteracted by small changes inanother parameter). Therefore, the rate constants arenot ‘‘true’’ rate constants. Larger data sets are neededfor obtaining accurate values.
Analysis of rate phenomena potentially influencingthe oxidation zone thickness
It was shown in the preceding sensitivity analysis thatthe ablation rate and to some extent the ablation lagtime are dependent on the oxygen solubility anddiffusion coefficient in the oxidation zone, the variousrate constants, and the conversion of crosslinks at theablation front. This means that the overall rate ofdegradation and the thickness of the oxidation zoneare influenced by oxygen permeability (i.e., solubilityand diffusion coefficient), radical generation, andradical oxidation because all three rate processesinfluence the degradation behavior. An interestingquestion in relation to this that needs further discussionis whether the thickness of the oxidation zone isdetermined mainly by a lack of UV radiation or ofoxygen at the oxidation front. In the model of this
work, it was assumed that the concentration of oxygenis negligible at the oxidation front and that there is nooxygen present in the bulk coating, only in theoxidation zone. However, an alternative assumptioncould be that there is an abundance of oxygen in thecoating and that the UV radiation intensity is close tozero at the oxidation front. Both these assumptionsmay, in principle, lead to a thin surface oxidation zone.If both oxygen and UV radiation are present in thebulk of the coating then the oxidation zone would
10
8
6
4
2
0
0 20 40 60 80 100Time (days)
Pos
ition
of a
blat
ion
fron
t (μm
)
SimulationExperimental data
Fig. 10: Comparison of model simulations (lines) withexperimental thickness reduction data (symbols) of apigment-free epoxy–amine coating. The experimental datawere taken from Guillot et al.14 Conditions are: T = 44�C,RH = unknown, Xenon lamp with filters (300–800 nm),Eo,S = 5 W/m2 (assumed), r = 1, n = 0.1, Mw,E = 390 g/mol,fE = 2, Mw,PA = 170 g/mol, fPA = 2 (equivalent to four activehydrogens), ve
o = 2463 mol/m3, CCCO = 2709 mol/m3,CCHOHO = CCH2NO = 4926 mol/m3, and CPhO = 5419 mol/m3.Adjustable parameters at 44�C are: XCL,max = 0.3, k1 = 0.036(m2/W)½ s21, k4 = 0.25 (m3/mol s), Doxygen = 0.22 3 10213
m2/s, and a = 0.6
10
Seq/Seqo = 2
Doxygen/Doxygeno = 2
Doxygen/Doxygeno = 1
Doxygen/Doxygeno = 0.5
Seq/Seqo = 1
Seq/Seqo = 0.5
8
6
4
2
0
8
6
4
2
0
0 10 20 30 40 50Time (days)
Pos
ition
of a
blat
ion
fron
t (μm
)P
ositi
on o
f abl
atio
n fr
ont (
μm)
Fig. 11: Sensitivity plot with respect to oxygen solubilityand diffusion coefficient in a pigment-free epoxy–aminecoating. Conditions and parameters (except the one in thelegend) are the same as in the caption of Fig. 3. When theparameter value in the legend is equal to unity, itcorresponds to the simulation in Fig. 3. The stable thick-ness of the oxidation zone varies from 1.91 to 2.02 lm in thetop plot (highest thickness for largest value of Seq) andfrom 1.37 to 2.72 lm in the bottom plot (highest thicknessfor largest value of Doxygen)
J. Coat. Technol. Res., 9 (4) 375–398, 2012
392

extend over most of, or even the entire, coating, whichis not in agreement with experimental data for thecoating systems considered. It has been demonstratedby various methods (e.g., IR-ATR spectroscopy,38
X-ray analysis with EDS,37 and nano-indentation63)that the oxidation zone thickness in densely cross-linked epoxy coatings, with high glass transition tem-peratures, exposed to constant UV radiation is 1.8–2lm and that the rest of the coating is identical to theunexposed coating (both chemically and mechani-cally). It therefore seems plausible to assume thateither a lack of oxygen or of UV radiation in the bulk
of the coating has a strong influence on the oxidationzone thickness in these systems. However, it may notbe possible to make a general statement on this matterbecause it depends on the relative rates of oxygenpermeability in the coating, chemical reaction rates,and the UV radiation intensity. Rivaton et al.55 havemeasured photooxidation profiles in phenoxy resinsand shown that the oxidation zone after 6 days reacheda depth of about 100 lm in a 190-lm-thick pigment-free coating. The phenoxy resins applied werephysically drying binders (molecular weight of30,000–70,000 g/mol) that do not crosslink. Rivatonet al. state that the observed profile has to be mainlyattributed to limited oxygen diffusion, but also partlyto absorption by photoproducts. Similarly, Mailhotet al.52,53 have found a photooxidation profile thatreaches 300 lm into an epoxy–amine coating. In thiscase the cured resin had a glass transition temperatureof only �50�C. The dominating mechanisms thereforedepend very much on the epoxy coating systemconsidered when the oxidation zone thickness can varyfrom about 2 to 300 lm. In the case of other nonepoxybinders or coatings the oxidation zone thickness canbecome much wider than 2 lm (see e.g., Gerlocket al.64). For some multilayer systems delamination andcolor changes of base coats under unfortified clearcoatshave been observed, which is evidence that bothoxygen and UV radiation have penetrated the clear-coat. Discolored wood under clearcoats and occa-sional delaminations of clearcoats from basecoats on
10
8
6
4
2
0
8
6
4
2
0
0 10 20 30 40 50Time (days)
Pos
ition
of a
blat
ion
fron
t (μm
)P
ositi
on o
f abl
atio
n fr
ont (
μm)
k1/k1o = 2
k1/k1o = 1
k1/k1o = 0.5
k2/k2o = 2
k2/k2o = 1
k2/k2o = 0.5
Fig. 12: Sensitivity plot with respect to k1 and k2 in apigment-free epoxy–amine coating. Conditions and param-eters (except the one in the legend) are the same as in thecaption of Fig. 3. When the parameter value in the legend isequal to unity, it corresponds to the simulation in Fig. 3.The stable thickness of the oxidation zone varies from 1.64to 2.30 lm in the top plot (highest thickness for lowestvalue of k1) and from 1.41 to 2.71 lm in the bottom plot(highest thickness for lowest value of k2)
10
XCL,max = 0.3
XCL,max = 0.4
XCL,max = 0.5
8
6
4
2
0
0 10 20 30 40 50
Time (days)
Pos
ition
of a
blat
ion
fron
t (μm
)
Fig. 13: Sensitivity plot with respect to XCL,max in apigment-free epoxy–amine coating. Conditions and param-eters (except the one in the legend) are the same as in thecaption of Fig. 3. XCL,max = 0.4 corresponds to the simula-tion in Fig. 3. The stable thickness of the oxidation zonevaries from 1.91 to 1.96 lm (highest thickness for largestvalue of XCL,max)
J. Coat. Technol. Res., 9 (4) 375–398, 2012
393

automobiles exposed to UV radiation also suggest thatthere can be plenty of oxygen deep in a coating systemto facilitate photooxidation. Coming back to theepoxy–amine coatings of this work, the glass transitiontemperature and crosslink density are known to influ-ence greatly the permeability of oxygen in a coating.1
The model of this work is able to handle both a UVradiation and oxygen permeability limited zone thick-ness. The Beer–Lambert law (equation 16) takes intoaccount absorption of UV radiation and the front-tracking equation for the oxidation front (equation 14)handles the effect of oxygen. Which mechanism dom-inates is simply a matter of the parameter valuesprovided to the model. If the oxygen permeability isincreased then the zone thickness increases and if theabsorption of UV radiation is increased then the UVradiation intensity inside the coating is reduced. Thetransient development in the absorption of UV radi-ation, until a stable value is obtained (after 10–20 daysin the experiments used in this work), is not included inthe model. A molar absorptivity of UV radiation, equalto that of carbonyl groups, and a constant concentra-tion, equal to that of the original number of phenoxygroups, was used. Rivaton et al.55 have shown in theirFig. 2 that this assumption is not right for phenoxyresins, the UV (and visible) absorbance increases overthe 25 days considered in good agreement with thewell-known yellowing of many epoxy resins. To eval-uate the importance of the model assumption for thedensely crosslinked systems considered in this work,the Beer–Lambert law (equation 16) can be used.Assuming that a strong UV radiation absorptiongreatly influences the zone thickness, the concentrationof the absorbing species in the oxidation zone requiredcan be crudely calculated assuming a homogenousconcentration of absorbent in the oxidation zone. Theradiation intensity must be reduced to, say, 1% of theentering radiation so that El/Eo = 0.01. The molar UVabsorptivity, a, is taken to be that of carbonyl (seeTable 1), which is the main absorbent formed (seeRezig et al.13), and l is 2 lm (the experimental value forthe approximate zone thickness). Using the Beer–Lambert law, this gives an absorbent concentration of106 mol/m3. For comparison, the maximum absorbentconcentration that can possibly be formed if all CHOHand CH2N groups of the original network are assumedto form absorbing groups with absorption capacitiesequal to that of carbonyl is close to 9000 mol/m3 (usingconcentration data from the Fig. 1 caption of thiswork). Therefore, the concentration of carbonyl groupsrequired to obtain a UV radiation limited zonethickness is at least a factor of 100 too high and theassumption that the low oxygen permeability is themain reason for the thin zone thickness seems valid (atleast for the examples considered in this work). Thismechanism is also in agreement with the conclusions ofMonney and co-workers,65,66 who did the experimentalzone thickness measurements.
Further evidence that oxygen permeability influ-ences the rate of degradation is the simulations and
experimental data of Figs. 8 and 9 in this work, wherethe only parameter varied from Figs. 8 and 9 is therelative humidity, which was reduced from 75% to 9%.It was shown in a previous paragraph that both theconstant value of the ablation lag time and the largedrop in ablation rate observed experimentally, whenthe relative humidity is reduced, could be described bythe model via a reduction of the oxygen diffusioncoefficient only. This is in good agreement with manyreferences (e.g., Schulz1) stating that the diffusioncoefficient of oxygen is strongly dependent on relativehumidity because moisture reduces the glass transitiontemperature of the binder network. If, on the otherhand, the zone thickness should be limited by a strongabsorption of UV radiation then an alternative mech-anism for the change in the experimental data fromFigs. 8 and 9 is required. It has not been possible toidentify such a mechanism.
A consequence of this analysis is that there is littleabsorption of UV radiation in the 1–2 lm wideoxidation zone and therefore a description of thetransient development in the UV radiation absorptioncapacity is not required in the model (even though ittakes place). This is also in agreement with theexperience that commercial UV absorbers (unless usedin prohibitively high concentrations) can only provideweak protection of the outermost micrometers of aclearcoat and such additives must be used in combina-tion with free-radical scavengers (e.g., HALS) toprovide adequate protection against UV radiation.1,35
Furthermore, clearcoats (containing organic UVabsorbers in small amounts) are in general known toprovide less UV radiation protection than pigmentedsystems of, e.g., wooden substrates, which also suggeststhat UV radiation is not completely absorbed byphotoproducts in the top layers of coatings.
Schulz1 states that numerous studies have demon-strated that oxygen diffusion in transparent polymerfilms is the rate-determining step and refers to exper-iments in pure oxygen, as opposed to air, clearlyshowing an effect of oxygen concentration in the gasphase on the rate of degradation. Seubert et al.,57 onthe other hand, mention that the accepted belief hasbeen that the availability of oxygen was never a ratelimiting process in the photooxidation of binders, butthen also show that for UV-curable urethane acry-late clearcoats the oxidation can indeed be oxygendiffusion-limited.
Natural exposure vs artificial exposure
A challenging issue, assuming oxygen permeability hasa strong influence on the oxidation zone thickness, isthat a larger zone thickness could be expected undernatural weathering where the UV radiation intensity islower and night cycles would allow much deeperdiffusion of oxygen. The effect of lower radiationintensity can be investigated using the model simula-tions of Fig. 12. In this plot, k1 is varied a factor of 4
J. Coat. Technol. Res., 9 (4) 375–398, 2012
394

equivalent to a factor of 16 in the UV radiationintensity (see the square root dependency in equa-tion 7). Simulations suggest that such an increase inradiation intensity only leads to an increase in theoxidation zone thickness from 1.63 to 2.3 lm, which isprobably too small a change to be detected experimen-tally. The reason for this result is that simulations arenot very sensitive to the UV radiation intensity asdiscussed in the section on sensitivity analysis, in goodagreement with the data of Dubois et al.67 where thesame ablation rates were found for a light energy of 60and 75 W/m2. This experimental observation washypothesized by the authors as being due to a light-energy threshold above which the oxygen diffusiongradient in the thin layer limits the ablation rate.However, for many commercial coatings (e.g., forautomobiles) the addition of UV absorbers has beenfound to confine degradation to the top of the coatings.Therefore, in the more common case of wide oxidationzones in nonprotected coatings, UV absorbers can havea strong beneficial effect on the oxidation zone thick-ness, which will not be observed for the model coatingsof this work where the oxidation zone thickness is verylow (<2 lm) even in the absence of UV absorbers.
The effect of night cycles is interesting. During thenight there is no oxygen consumption and the nextmorning the coating will contain more oxygen. This isexpected to increase the rate of degradation. No datahave been found that can clarify this point directly, butin Fig. 4 in Dubois et al.,67 the linear decrease incoating thickness of a densely crosslinked epoxysystem as a function of cumulative radiation intensity(as opposed to time) is shown for two conditions ofnatural weathering and one condition of artificial UVradiation exposure (conditions of constant UV radia-tion intensity). The ablation rates are 4–6 times higherfor natural compared with artificial exposure. Duboiset al. ascribe this to the influence of rain and it is notpossible to confirm whether the increased oxygenconcentration during night cycles also adds to theincreased ablation rate. The thickness of the oxidationzone was not reported. Initially, in the artificialexposures considered in this work, there is a shortperiod where neither oxygen nor UV radiation shouldbe limited (coating contains oxygen and no photo-products are present). Under these conditions, thepresence of photoproducts deeper in the coating maybe expected, but such an observation has not beenreported by Monney and co-workers in their many
analyses of the oxidation zone thickness.37,38,63,65–67
The reason for this could be that the concentration ofphotoproducts does not reach a sufficiently high valuefor detection in the time available.
Summarizing, no data have been found that are instrong disagreement with the assumptions of this work,but it must also be emphasized that the assumptionsare only valid for the densely crosslinked model epoxysystems used for model validation and under constantartificial UV radiation exposure conditions in the
absence of any water spray or dark cycles. Mostcommercial coating systems, due to the binder typesand additives used, are expected to react much moreslowly with UV radiation and oxygen. In addition, theoxygen permeability may be higher and it seems likelythat such coatings may have greater oxygen content intheir depth.
Validation of model assumptions
The model is based on a number of simplifyingassumptions that have not all been verified in theabove discussion. Here, the most important ones arereaddressed.
Diffusivities in the coating of all active groups wereassumed to be negligible. This seems to be a reason-able assumption as discussed by Colin.27
Water absorption in the coating was assumed to beindependent of coating degradation. This is reasonablebecause the oxidation zone is very thin compared withthe initial thickness of the coating. However, Oosterb-roek et al.68 claim that it was not a good assumption fora weathered polyurethane clearcoat, where waterabsorption increased five times during weathering.
Reflection of UV radiation at the coating–substrateinterface was neglected. Depending on the type ofsubstrate used, this may not be a good assumption.However, the exact nature of the substrates used by thevarious investigators is rarely reported.
Skeleton breaking reactions, due to internal stress,was neglected. According to Bellenger and Verdu29 sucha scission reaction should lead to formation of aldehydegroups, which have not been observed by Rezig et al.13
Relaxation phenomena were also neglected because thecoatings were all allowed to cure at ambient conditions(see Croll et al.43 for more on this issue).
The porosity of the coating, at a given position in theoxidation zone, is assumed to be a function of thefraction of crosslinks that have been broken byreaction (1). This is a very crude assumption thatneeds further investigation. However, the benzene ringstructure disappears from at least the outer part of theoxidation zone12 so some porosity must be formed. Itmay be that a critical number of the initial crosslinksmust be broken before porosity can appear, but there ispresently no data available to confirm this.
Internal stress in the coating was considered indi-rectly only via the value used for the adjustableparameter XCL,max, which takes into account mechan-ical properties. Under cyclic exposure conditions,XCL,max may depend on the exposure history, but forthe constant conditions considered in this work, theapproximation seems adequate.
Moisture (water) does not react with the curedepoxy structure. This assumption was not confirmed.
It was also assumed that all active groups in thenetwork react independently of one another. Thisassumption has not been verified.
J. Coat. Technol. Res., 9 (4) 375–398, 2012
395

Summarizing, most assumptions are justified, butsome assumptions need confirmation. Presently, theuncertainties will be lumped into the values used forthe adjustable constants.
Conclusions
A mathematical model describing coating degradationunder constant artificial exposure conditions wasdeveloped. The relevant phenomena, photoinitiatedoxidation reactions, intrafilm oxygen permeability,water absorption and diffusion, reduction of crosslinkdensity, and development of a thin surface oxidationzone, were all included. Experimental data availablefor three independent epoxy–amine case studies can bequantitatively simulated by the model. An importantprediction of the model is that the thickness of thesurface oxidation zone, depending on the exposureconditions and binder systems employed, is between0.5 and 2 lm, in good agreement with experimentalobservations. Furthermore, it was confirmed thatdegradation rates, in the absence of UV absorbersand antioxidants, are quite dependent on oxygensolubility and the diffusion coefficient of oxygen inthe oxidation zone. The latter parameter is a strongfunction of relative humidity. The addition of less than1 wt% multiwalled carbon nanotubes was found tosignificantly improve the cohesiveness of the surfaceoxidation zone and thereby reduce the rate of coatingdegradation by more than 30%. There has been noattempt to model gloss loss, speciation of volatile endproducts, loss of adhesion, cracking, color change, orblistering. In addition it should be mentioned that thepresent model has only been validated for the modelepoxy systems considered and under constant artificialUV radiation exposure conditions in the absence ofany water spray or dark cycles. For other binder types(or lower crosslink densities) or when dark periods areincluded, the oxidation zone thickness may be sub-stantially larger than the 1–2 lm seen in this work,which may potentially render UV radiation absorptionin the outer degraded layers of the coating of moreimportance.
An important next step, encouraged by Floyd,25 willbe to consider dynamic conditions and thereby providesimulations of coating behavior in various cyclicexposure scenarios being used in accelerated testingequipment (Nichols et al.69 have recently suggested anew testing protocol). Subsequently, conditions ofnatural weathering should be considered. In addition,it may be investigated how the effects of, e.g., UVradiation absorbers and light stabilizers can beincluded in the model.
The model approach can be extended to othercoating systems provided experimental data and obser-vations are available for calibration of the model. Ifany essential special rate phenomena occur, e.g., ahydrolysis reaction17,48,50 or reactions of photoactivepigments,70 detailed experimental data are required
prior to incorporation of these rate-influencing steps inthe model.
In principle, the model can be used for predictingin-service coating behavior, based on well-controlledand extensive accelerated laboratory measurements,by calibration of the model parameters. This way, thestatistical influence of variation in raw materials andother uncertainties are lumped into the model param-eters. In this respect, the model is similar to thestatistical models. However, the reliability of thisextrapolation approach has not yet been studied. Themodel is best calibrated if all relevant data areprovided with the exposure data (see the caption ofFig. 3 for the data required). Furthermore, simulta-neous measurements of rates of mass loss, ablation,and formation of photoproducts, as well as oxidationzone thickness measurements, on the same well-char-acterized coatings would be very useful.
An important issue that needs further investigationis a more detailed characterization of the surfaceoxidation zone. The approximate thickness of this zoneand the surface morphology in the top 10–30 nm13,56
have been studied for epoxy–amine coatings, but theporosity, glass transition, and crosslink density profiles,phase behavior, and oxygen solubility and diffusionrates are needed to verify some of the assumptionsmade in this work. It would also be interesting to findout how the oxidation zone of densely crosslinkedepoxy–amine networks differ from that of othernetworks and full commercial coating systems.
Acknowledgments The author is grateful to themanuscript reviewers for their helpful comments.Financial support by J. C. Hempel’s Foundation isgratefully acknowledged.
Open Access This article is distributed under theterms of the Creative Commons Attribution Noncom-mercial License which permits any noncommercial use,distribution, and reproduction in any medium, providedthe original author(s) and source are credited.
References
1. Schulz, U, Accelerated Testing. Vincentz, Hannover (2009)2. Martin, J, Chin, JW, Nguyen, T, ‘‘Reciprocity Law Exper-
iments in Polymeric Photodegradation: A Critical Review.’’Prog. Org. Coat., 47 292–311 (2003)
3. Sørensen, PA, Kiil, S, Weinell, CE, Dam-Johansen, K,‘‘Anticorrosive Coatings—A Review.’’ J. Coat. Technol.Res., 6 (2) 135–177 (2009)
4. Wypych, G, Handbook of Material Weathering, 4th ed. ChemTech Publishing, Toronto (2008)
5. Gerlock, JL, Bauer, DR, Briggs, LM, ‘‘Photostability ofAcrylic/Melamine Enamels. Effect of Polymer Compositionand Polymerization Conditions on Photo-initiation Rates.’’Prog. Org. Coat., 15 197–208 (1987)
6. Dickie, RA, ‘‘Chemical Origins of Paint Performance.’’J. Coat. Technol., 66 (834) 29–37 (1994)
J. Coat. Technol. Res., 9 (4) 375–398, 2012
396

7. Martin, JW, Nguyen, T, Byrd, E, Dickens, B, Ned, E,‘‘Relating Laboratory and Outdoor Exposures of AcrylicMelamine Coatings I. Cumulative Damage Model andLaboratory Exposure Apparatus.’’ Polym. Degrad. Stab.,75 193–210 (2002)
8. Martin, JW, Chin, JW, Byrd, WE, Embree, E, Kraft, KM,‘‘An Integrating Sphere-Based Ultraviolet Exposure Cham-ber Design for the Photodegradation of Polymeric Materi-als.’’ Polym. Degrad. Stab., 63 297–304 (1999)
9. Bierwagen, GP, ‘‘The Science of Durability of OrganicCoatings: A Foreword.’’ Prog. Org. Coat., 15 179–185 (1987)
10. Verdu, J, Colin, X, Fayolle, B, Audouin, L, ‘‘Methodology ofLifetime Prediction in Polymer Aging.’’ J. Test. Eval., 35 (3)289–296 (2011)
11. Croll, S, Hinderliter, B, ‘‘Estimating Service Life Times inWeathering: An Optimistic View.’’ J. Coat. Technol. Res.,4 (3) 217–230 (2007)
12. Nguyen, T, Pellegrin, B, Bernard, X, Gu, J, Gorham, P,Stutzman, P, Shapiro, A, Byrd, E, Chin, J, ‘‘Degradation andNanoparticle Release of Nanocomposite Coatings Exposedto UV Radiation.’’ Coatings Science International, Nordwijk,The Netherlands, Book of abstracts, pp. 16–21, 2010
13. Rezig, A, Nguyen, T, Martin, D, Sung, L, Gu, X, Jasmin, J,Martin, J, ‘‘Relationship Between Chemical Degradationand Thickness Loss of an Amine-Cured Epoxy CoatingExposed to Different UV Environments.’’ J. Coat. Technol.Res., 3 (3) 173–184 (2006)
14. Guillot, L, Monney, L, Dubois, C, Chambaudet, A, ‘‘Testingof Organic Matrix Durability in Photochemical AgeingUsing Ablation Measurements.’’ Polym. Degrad. Stab., 72209–215 (2001)
15. Monney, L, Dubois, C, Chambaudet, A, ‘‘Ablation ofOrganic Matrix: Fundamental Response of a Photo-AgedEpoxy-Glass Fibre Composite.’’ Polym. Degrad. Stab., 56357–366 (1997)
16. Kiil, S, ‘‘Quantification of Simultaneous Solvent Evaporationand Chemical Curing of Thermoset Coatings.’’ J. Coat.Technol. Res., 7 (5) 569–586 (2010)
17. Bauer, DR, ‘‘Predicting In-Service Weatherability of Auto-motive Coatings: A New Approach.’’ J. Coat. Technol., 69(864) 85–96 (1997)
18. Martin, JW, ‘‘A Stochastic Model for Predicting the ServiceLife of Photolytically Degraded Poly(methyl methacrylate)Films.’’ J. Appl. Polym. Sci., 29 777–794 (1984)
19. Martin, JW, ‘‘Quantitative Characterization of SpectralUltraviolet Radiation-Induced Photodegradation in CoatingExposed in the Laboratory and the Field.’’ Prog. Org. Coat.,23 49–70 (1993)
20. Martin, JW, Saunders, SC, Wineburg, JP, Methodologies forPredicting the Service Life of Coatings Systems. Federation ofSocieties for Coatings Technology, Blue Bell, PA (1996)
21. Guseva, O, Brunner, S, Richner, P, ‘‘Service Life Predictionfor Aircraft Coatings.’’ Polym. Degrad. Stab., 82 1–13 (2003)
22. Dickens, B, ‘‘Model-Free Estimation of Outdoor Perfor-mance of a Model Epoxy Coating System Using AcceleratedTest Laboratory Data.’’ J. Coat. Technol. Res., 6 (4) 419–428(2009)
23. Hinderliter, B, Croll, S, ‘‘Monte Carlo Approach to Esti-mating the Photodegradation of Polymer Coatings.’’ J. Coat.Technol. Res., 2 (6) 483–491 (2005)
24. Wood, KA, Robien, SA, ‘‘A Quantitative Model forWeathering-Induced Mass Loss in Thermoplastic Paints,Chapter 30.’’ In: Martin, JW, Ryntz, RA, Chin, J, Dickie, RA(eds.) Service Life Prediction of Polymeric Materi-als—Global Perspectives. Springer, New York (2009)
25. Floyd, FL, ‘‘Implementing What We Have Learned, Chapter33.’’ In: Martin, JW, Ryntz, RA, Chin, J, Dickie, RA (eds.)Service Life Prediction of Polymeric Materials—GlobalPerspectives. Springer, New York (2009)
26. Monney, L, Dubois, C, Chambaudet, A, ‘‘Trapping andIdentification of Volatile Photo-Products of a Photo-Oxi-dised Epoxy Matrix.’’ Polym. Degrad. Stab., 66 17–22 (1999)
27. Colin, X, Marais, C, Verdu, J, ‘‘A New Method forPredicting the Thermal Oxidation of Thermoset Matri-ces—Application to an Amine Crosslinked Epoxy.’’ Polym.Test., 20 795–803 (2001)
28. Bellenger, V, Verdu, J, Francillette, J, Hoarua, P, ‘‘Photo-Oxidation of Epoxy Model Compounds.’’ Polym. Commun.,27 279–281 (1986)
29. Bellenger, V, Verdu, J, ‘‘Oxidative Skeleton Breaking inEpoxy-Amine Networks.’’ J. Appl. Polym. Sci., 30 363–374(1985)
30. Bellenger, V, Bouchard, C, Claverirolle, P, Verdu, J, ‘‘Photo-Oxidation of Epoxy Resins Cured by Non-AromaticAmines.’’ Polym. Photochem., 1 69–80 (1981)
31. Bellenger, V, Verdu, J, ‘‘Photo-Oxidation Amine Cross-linked Epoxies I. The DGEBA-DDM System.’’ J. Appl.Polym. Sci., 28 2599–2609 (1983)
32. Bellenger, V, Verdu, J, ‘‘Photo-Oxidation Amine Cross-linked Epoxies II. Influence of Structure.’’ J. Appl. Polym.Sci., 28 2677–2688 (1983)
33. Bellenger, V, Verdu, J, ‘‘Structure-Photooxidative Relation-ship of Amine-Crosslinked Epoxies.’’ Polym. Photochem., 5295–311 (1984)
34. Ollier-Dureault, V, Bosse, B, ‘‘Photooxidation of Anhy-dride-Cured Epoxies: FTIR Study of the Modifications of theChemical Structure.’’ J. Appl. Polym. Sci., 70 1221–1237(1998)
35. Wicks, ZW, Jones, FN, Pappas, SP, Wicks, DA, OrganicCoatings—Science and Technology, 3rd ed. Wiley, New York(2007)
36. Christensen, PA, Dilks, A, Egerton, TA, Temperley, J,‘‘Infrared Spectroscopic Evaluation of the Photodegradationof Paint.’’ J. Mater. Sci., 35 5353–5358 (2000)
37. Monney, L, Rouge, N, Dubois, C, Chambaudet, A, ‘‘Photo-chemical Degradation Study of an Epoxy Material by X-rayAnalysis.’’ Polym. Degrad. Stab., 62 367–371 (1998)
38. Monney, L, Rouge, N, Dubois, C, Chambaudet, A, ‘‘Photo-chemical Degradation Study of an Epoxy Material by IR-ATR Spectroscopy.’’ Polym. Degrad. Stab., 62 353–359 (1998)
39. Hill, L, ‘‘Calculation of Crosslink Density in Short ChainNetworks.’’ Prog. Org. Coat., 31 (3) 235–243 (1997)
40. Kiil, S, Bhatia, SK, Dam-Johansen, SK, ‘‘Solution of Tran-sient Problems with Steep Gradients: Novel Front-TrackingStrategy.’’ Chem. Eng. Sci., 50 (17) 2793–2799 (1995)
41. Levenspiel, O, Chemical Reaction Engineering, 3rd ed.Wiley, New York (1999)
42. Kiil, S, ‘‘Drying of Latex Films and Coatings: Reconsideringthe Fundamental Mechanisms.’’ Prog. Org. Coat., 57 236–250(2006)
43. Croll, SG, Shi, X, Fernando, BMD, ‘‘The Interplay ofPhysical Aging and Degradation During Weathering for TwoCrosslinked Coatings.’’ Prog. Org. Coat., 61 136–144 (2008)
44. Ramachandran, PA, Dudukovic, MP, ‘‘A Moving Finite-Element Collocation Method for Transient Problems withSteep Gradients.’’ Chem. Eng. Sci., 39 (7–8) 1321–1324(1984)
45. Maggana, C, Pissis, P, ‘‘Water Sorption and DiffusionStudies in an Epoxy Resin System.’’ J. Polym. Sci., 371165–1182 (1999)
J. Coat. Technol. Res., 9 (4) 375–398, 2012
397
46. De Neve, B, Shanahan, MER, ‘‘Water Absorption by anEpoxy Resin and Its Effect on the Mechanical Properties andInfra-Red Spectra.’’ Polymer, 34 (24) 5099–5105 (1993)
47. Zou, C, Dubois, C, Chambaudet, A, ‘‘The Effect of WaterAbsorption on the Dielectric Properties of Epoxy Nano-composites.’’ IEEE Trans. Dielectr. Insulation, 15 (1) 107–117 (2008)
48. Nguyen, T, Martin, JW, Byrd, E, Embree, N, ‘‘Effects ofRelative Humidity on Photodegradation of Acrylic-Mela-mine Coatings: A Quantitative Study.’’ Vol. 83, Proceedingsof PSME, ACS, Washington DC, pp. 118–119 (2000)
49. Bateman, L, ‘‘Olefin Oxidation.’’ Quart. Rev., 8 (2) 147–167(1954)
50. Bauer, DR, ‘‘Global Exposure Models for AutomotiveCoating Photo-Oxidation.’’ Polym. Degrad. Stab., 69 297–306 (2000)
51. Chin, JW, Martin, J, Embree, E, Byrd, E ‘‘The Use ofIntegrating Spheres as Uniform Sources for Accelerated UVWeathering of Advanced Materials.’’ Vol. 83, Proceedings ofASME, PSME fall meeting, ACS, August 20–24, WashingtonDC, pp. 145–146 (2000)
52. Mailhot, B, Morlat-Therias, S, Ouahioune, M, Gardette, J,‘‘Study of the Degradation of an Epoxy/Amine Resin 2:Kinetics and Depth-Profiles.’’ Macromol. Chem. Phys., 206585–591 (2005)
53. Mailhot, B, Morlat-Therias, S, Ouahioune, M, Gardette, J,‘‘Study of the Degradation of an Epoxy/Amine Resin 1:Photo- and Thermo-Chemical Mechanisms.’’ Macromol.Chem. Phys., 206 575–584 (2005)
54. Kiil, S, Weinell, CE, Pedersen, MS, Dam-Johansen, K,‘‘Analysis of Selfpolishing Antifouling Paints Using RotaryExperiments and Mathematical Modelling.’’ Ind. Eng. Chem.Res., 40 (18) 3906–3920 (2001)
55. Rivaton, A, Moreau, L, Gardette, J, ‘‘Photo-Oxidation ofPhenoxy Resins at Long and Short Wavelengths—I. Identi-fication of the Photoproducts.’’ Polym. Degrad. Stab., 58321–332 (1997)
56. Gu, XH, Nguyen, T, Oudina, M, Martin, D, Kidah, B,Jasmin, J, Rezig, A, Sung, LP, Byrd, E, Martin, JW,‘‘Microstructure and Morphology of Amine-Cured EpoxyCoatings Before and After Outdoor Exposures—An AFMStudy.’’ J. Coat. Technol. Res., 2 (7) 547–556 (2005)
57. Seubert, CM, Nichols, ME, Kucherov, AV, ‘‘Long-TermWeathering Behaviour of UV-curable Clearcoats: DepthProfiling of Photooxidation. UVA, and HALS Distribu-tions.’’ J. Coat. Technol. Res., 2 (7) 529–538 (2005)
58. Wessels, W, ‘‘Nanoscale Zinc Oxide for UV Stabilization inPaints and Coatings.’’ 18th SLF Congress, 8–10 October2006, Congress book, Helsingør, Denmark, pp. 93–100.
59. Aglan, A, Allie, A, Ludwick, A, Koons, L, ‘‘Formulation andEvaluation of Nano-Structured Polymeric Coatings forCorrosion Protection.’’ Surf. Sci. Technol., 202 370–378(2007)
60. Shi, X, Croll, SG, ‘‘Reduced Indentation Recovery Temper-ature at the Surface of a Crosslinked Epoxy Coating inHumid Conditions.’’ J. Coat. Technol. Res., 8 (4) 535–539(2011)
61. Perera, DY, Eynde, DV, ‘‘Moisture and TemperatureInduced Stresses (Hygrothermal Stresses) in Organic Coat-ings.’’ J. Coat. Technol., 59 (748) 55–63 (1987)
62. Misovski, T, Nichols, ME, Hardcastle, HK, ‘‘The Influenceof Water on the Weathering of Automotive Paint Systems,Chapter 20.’’ In: Martin, JW, Ryntz, RA, Chin, J, Dickie, RA(eds.) Service Life Prediction of Polymeric Materi-als—Global Perspectives. Springer, New York (2009)
63. Delobelle, P, Guillot, L, Dubois, C, Monney, L, ‘‘Photo-Oxidation Effects and Mechanical Properties of EpoxyMatrices: Young’s Modulus and Hardness Analyses byNano-Indentation.’’ Polym. Degrad. Stab., 77 465–475 (2002)
64. Gerlock, JL, Prater, TJ, Kaberline, SL, de Vries, JE,‘‘Assessment of Photooxidation in Multi-Layer CoatingSystems by Time-of-Flight Secondary Ion Mass Spectros-copy.’’ Polym. Degrad. Stab., 47 405–441 (1995)
65. Monney, L, Dubois, C, Chambaudet, A, ‘‘Evolution of theThin Photo-Oxidation Layer of an Epoxy Matrix DuringArtificial Photo-Ageing.’’ Die Angew. Makromol. Chem.,273 6–11 (1999)
66. Monney, L, Dubois, C, Villa, F, Chambaudet, A, ‘‘SurfaceRemoval of a Weathered Organic Glass.’’ J. Non-Cryst.Solids, 260 208–215 (1999)
67. Dubois, C, Monney, L, Bonnet, N, Chambaudet, A, ‘‘Deg-radation of an Epoxy-Glass-Fibre Under Photo-Oxidation/Leaching Complementary Constraints.’’ Compos. Part A, 30361–368 (1999)
68. Oosterbroek, M, Lammers, RJ, van der Ven, LGJ, Perera,DY, ‘‘Crack Formation and Stress Development inan Organic Coating.’’ J. Coat. Technol., 63 (797) 55–60(1991)
69. Nichols, ME, Boisseau, J, Pattison, L, Quill, J, Misovski, T,Peters, CA, Zhang, J, Henderson, K, Smith, D, Seebergh, JE,Berry, DH, ‘‘Accelerated Weathering Testing: A NewApproach to Anticipating Florida Exposure Results.’’ Coat-ings Science International, Nordwijk, The Netherlands, Bookof abstracts, p. 76 (2011)
70. Zhang, WR, Hinder, SJ, Smith, R, Lowe, C, Watts, JF, ‘‘AnInvestigation of the Effect of Pigment on the Degradation ofa Naturally Weathered Polyester Coating.’’ J. Coat. Technol.Res., 8 (3) 329–342 (2011)
J. Coat. Technol. Res., 9 (4) 375–398, 2012
398
Related Documents