Mock Data Retreat Mock Data Retreat Pam Lange Pam Lange TIE/ESA 7 TIE/ESA 7

Mock Data Retreat Pam Lange TIE/ESA 7. 2 Agenda Based on school’s need May be ½ day/ full day/ two days Work with district to determine needs –
Dec 13, 2015
Welcome message from author
This document is posted to help you gain knowledge. Please leave a comment to let me know what you think about it! Share it to your friends and learn new things together.
Transcript

Mock Data RetreatMock Data Retreat
Pam LangePam LangeTIE/ESA 7TIE/ESA 7
22
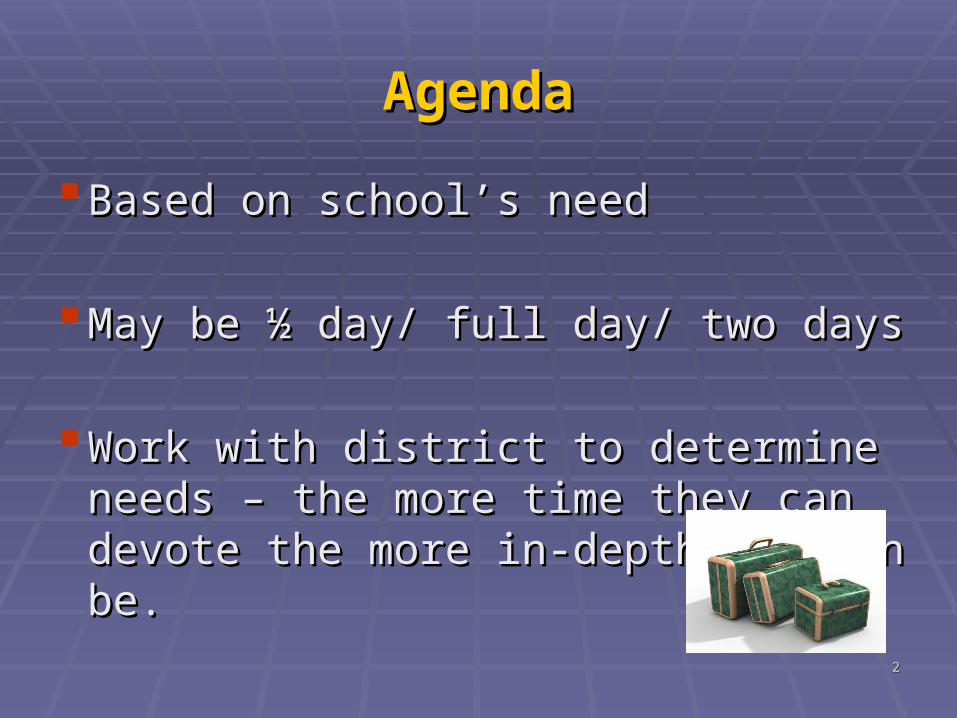
AgendaAgenda
Based on school’s needBased on school’s need
May be ½ day/ full day/ two daysMay be ½ day/ full day/ two days
Work with district to determine needs Work with district to determine needs – the more time they can devote the – the more time they can devote the more in-depth you can be.more in-depth you can be.
33
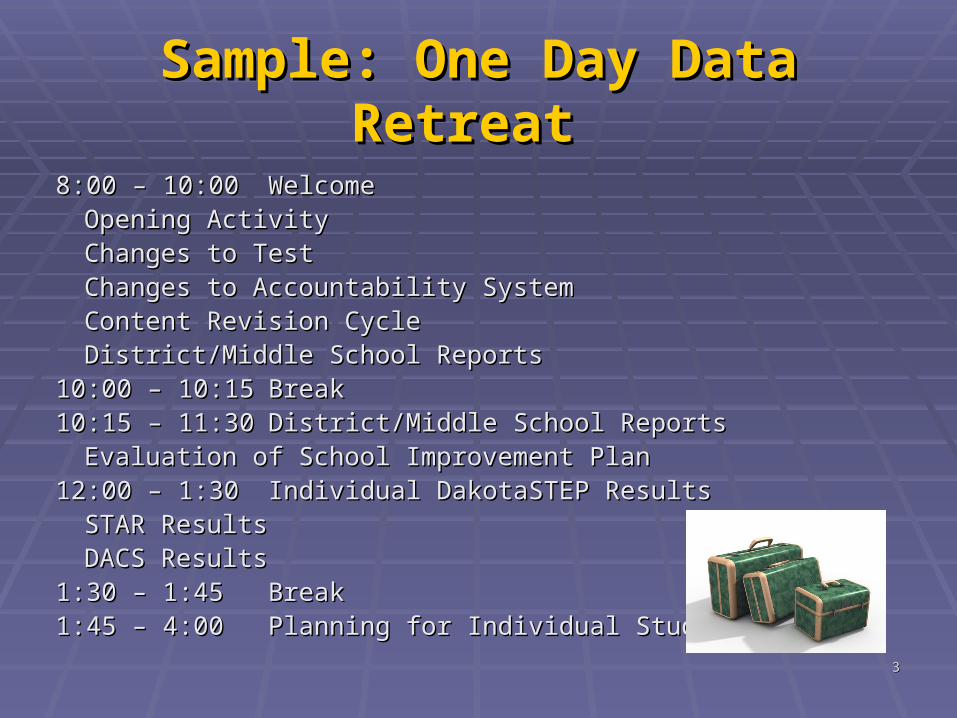
Sample: One Day Data Sample: One Day Data Retreat Retreat
8:00 – 10:008:00 – 10:00 WelcomeWelcomeOpening ActivityOpening ActivityChanges to TestChanges to TestChanges to Accountability SystemChanges to Accountability SystemContent Revision CycleContent Revision CycleDistrict/Middle School ReportsDistrict/Middle School Reports
10:00 – 10:1510:00 – 10:15 BreakBreak10:15 – 11:3010:15 – 11:30 District/Middle School ReportsDistrict/Middle School Reports
Evaluation of School Improvement PlanEvaluation of School Improvement Plan12:00 – 1:3012:00 – 1:30 Individual DakotaSTEP ResultsIndividual DakotaSTEP Results
STAR ResultsSTAR ResultsDACS ResultsDACS Results
1:30 – 1:451:30 – 1:45 BreakBreak1:45 – 4:001:45 – 4:00 Planning for Individual Student SuccessPlanning for Individual Student Success

44
OutcomesOutcomes To examine district-wide dataTo examine district-wide data
To examine building-level dataTo examine building-level data
To examine individual student To examine individual student achievement dataachievement data
To determine next stepsTo determine next steps

55
Ice BreakerIce Breaker
I always do some type of Ice Breaker - for sake of time, we won’t do one today!

66
Group NormsGroup Norms
Take care of personal needsTake care of personal needs
Mute cell phonesMute cell phones
Limit side conversationsLimit side conversations
Others???Others???
77
Team ReadinessTeam Readiness
Confidentiality Form
Assigning Roles

88
4 Lenses of Data4 Lenses of Data
Prioritize & Set Goals
Study & Plan
Successful
Strategies
Observe Patterns
& Hypothesize
StudentData
Program & Structures
Data
Family & Communit
y Data
Professional
Practices Data

99
District Data SourcesDistrict Data Sources
Data Matrix (Handout)Data Matrix (Handout)
Data Discussion GuideData Discussion Guide

1010
District Audit Tool District Audit Tool CategoriesCategories
Leadership ImplicationsLeadership Implications
Academic Content and Achievement StandardsAcademic Content and Achievement Standards
Curriculum/InstructionCurriculum/Instruction
Highly Qualified StaffHighly Qualified Staff
Professional DevelopmentProfessional Development
Assessment and AccountabilityAssessment and Accountability
School Culture/Climate School Culture/Climate
Budget and Resources Budget and Resources
Parents and Community Parents and Community

1111
District Audit Tool District Audit Tool CategoriesCategories
If you have the results from the If you have the results from the District Audit Tool and/or School District Audit Tool and/or School Profile this is where you would Profile this is where you would discuss some of those results – bring discuss some of those results – bring in to data discussion. Show how they in to data discussion. Show how they fit into the four lenses of data.fit into the four lenses of data.
Example:Example: Academic Content and Academic Content and Achievement StandardsAchievement Standards

1212
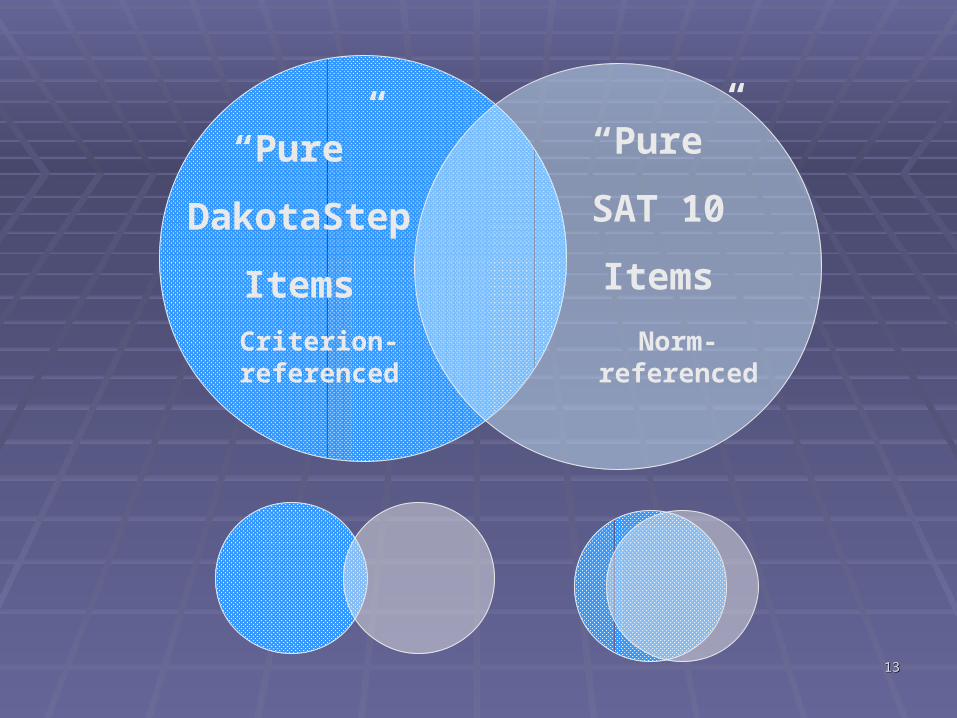
Student DataStudent DataDakotaSTEP ResultsDakotaSTEP Results
1313
“Pure”
DakotaStep
ItemsCriterion-referenced
“Pure”
SAT 10
Items
Norm-referenced

1414
Data Report TermsData Report Terms Scaled ScoreScaled ScoreHow well did this student How well did this student
score?score?
Cut ScoresCut ScoresWhat score is good What score is good
enough?enough? AdvancedAdvanced ProficientProficient BasicBasic Below BasicBelow Basic
AMOAMOHow many students How many students
scored proficient and scored proficient and advanced?advanced?
AYP AYP Is your school or district Is your school or district
above in every above in every category?category? ReadingReading MathMath Attendance or Attendance or
graduation rategraduation rate

1515
Annual Measurable Objectives up to 2014
K-8K-8 9-129-12
School School YearYear
ReadinReadingg MathMath ReadingReading MathMath
2005-20062005-2006 78%78% 65%65% 66%66% 54%54%
2006-20072006-2007 82%82% 65%65% 72%72% 54%54%
2007-20082007-20082008-20092008-2009 82%82% 72%72% 72%72% 63%63%
2009-20102009-2010 86%86% 72%72% 77%77% 63%63%
2010-20112010-2011 90%90% 79%79% 83%83% 72%72%
2011-20122011-2012 94%94% 86%86% 89%89% 81%81%
2012-20132012-2013 96%96% 93%93% 94%94% 90%90%
2013-20142013-2014 100%100% 100%100% 100%100% 100%100%

1616

1717
South Dakota State South Dakota State Content Standards Revision Content Standards Revision
CycleCycle
Science test was given in spring Science test was given in spring 2007. Districts 2007. Districts are notare not be held be held accountable for science content accountable for science content standards, but did receive results of standards, but did receive results of how students scored.how students scored.
At this point, the DakotaSTEP will At this point, the DakotaSTEP will not be aligned to Social Studiesnot be aligned to Social Studies

1818
Sat/DAT ToolSat/DAT Tool

1919
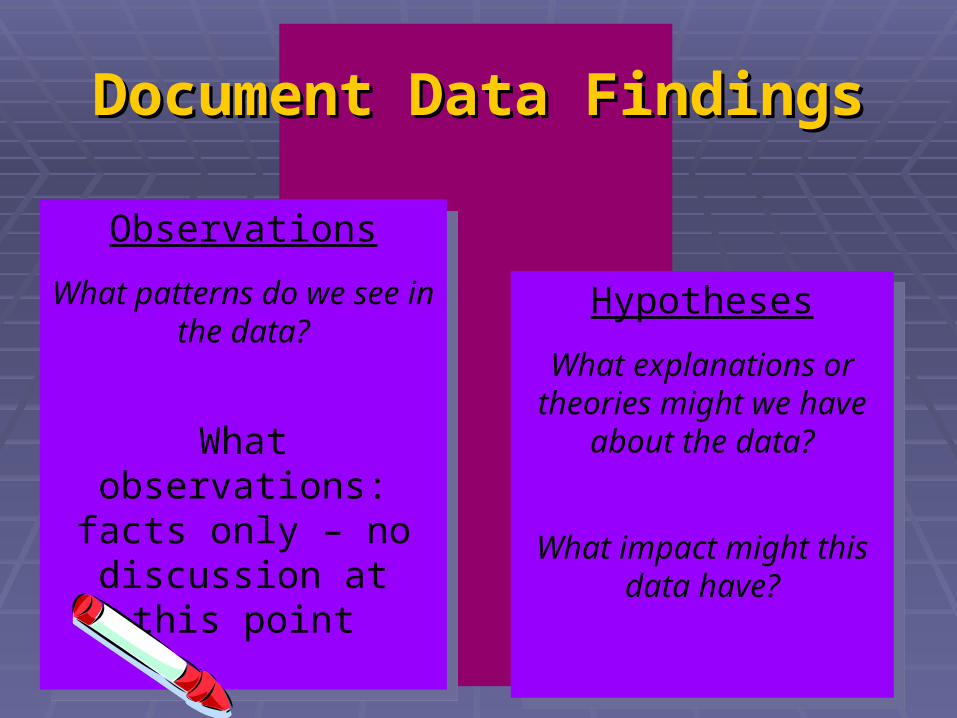
Document Data FindingsDocument Data Findings
Observations
What patterns do we see in the data?
What observations: facts only – no
discussion at this point
Observations
What patterns do we see in the data?
What observations: facts only – no
discussion at this point
Hypotheses
What explanations or theories might we
have about the data?
What impact might this data have?
Hypotheses
What explanations or theories might we
have about the data?
What impact might this data have?
2020
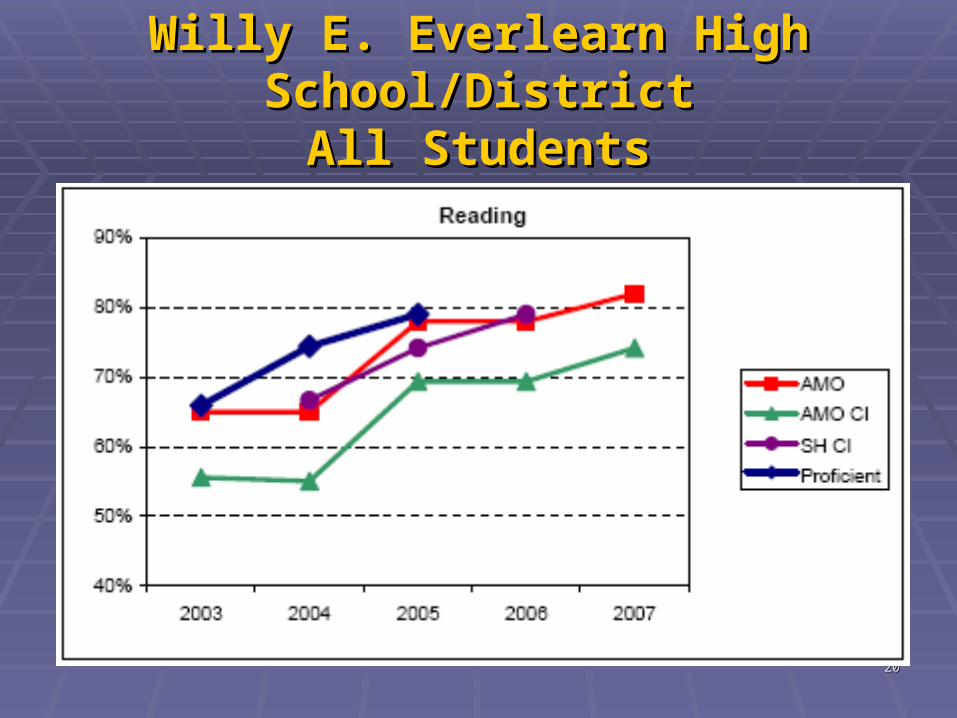
Willy E. Everlearn High Willy E. Everlearn High School/DistrictSchool/DistrictAll StudentsAll Students
2121
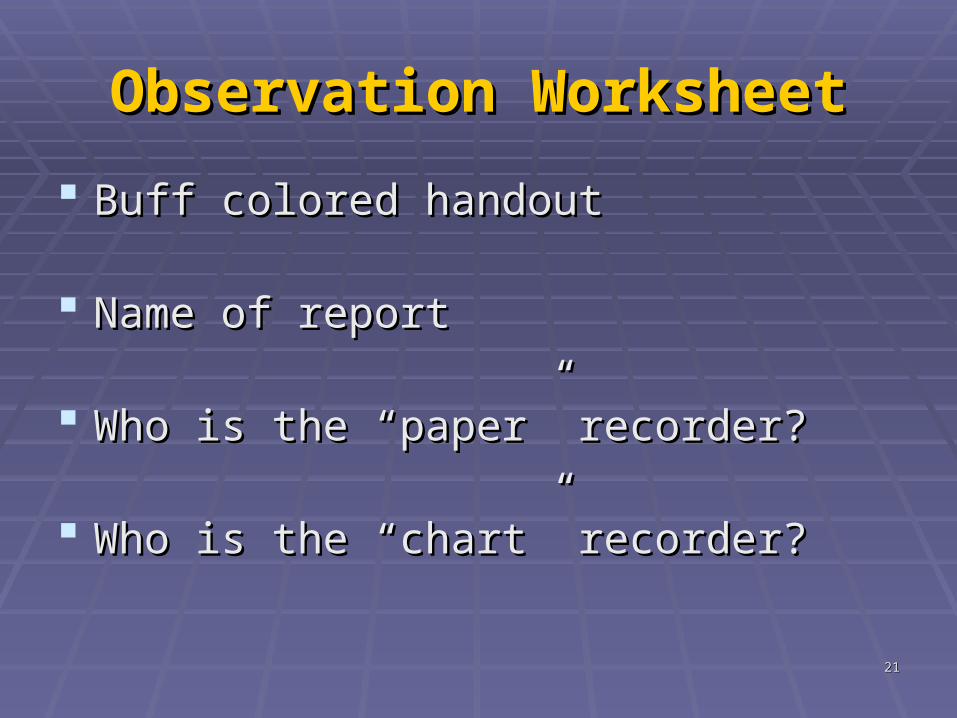
Observation WorksheetObservation Worksheet
Buff colored handoutBuff colored handout
Name of reportName of report
Who is the “paper” recorder?Who is the “paper” recorder?
Who is the “chart” recorder?Who is the “chart” recorder?
2222
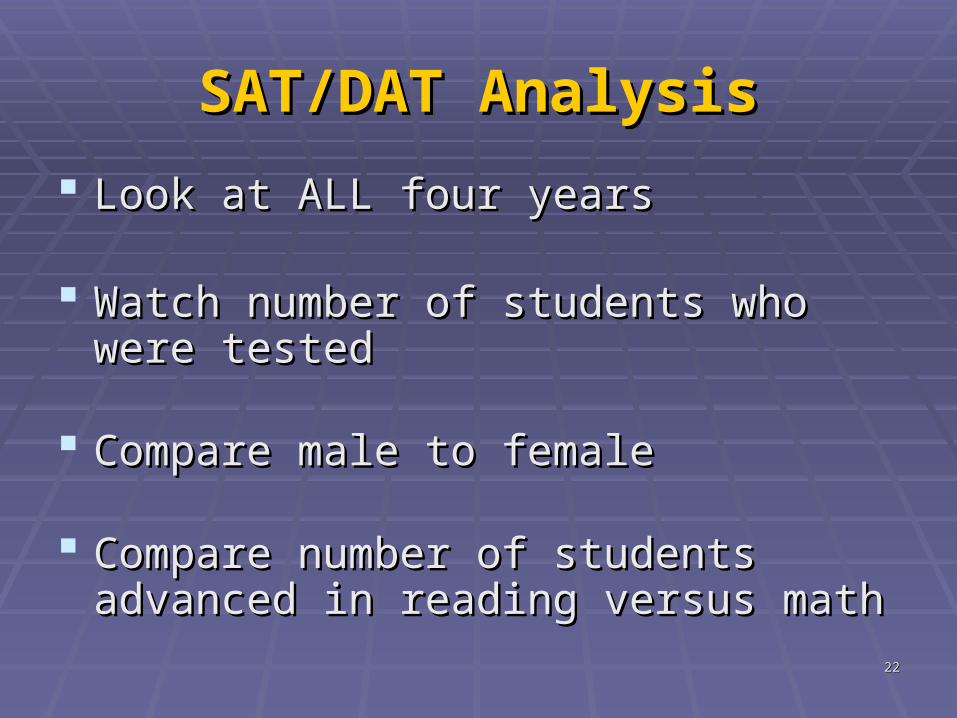
SAT/DAT AnalysisSAT/DAT Analysis
Look at ALL four yearsLook at ALL four years
Watch number of students who were Watch number of students who were testedtested
Compare male to femaleCompare male to female
Compare number of students Compare number of students advanced in reading versus mathadvanced in reading versus math
2323
Document Data FindingsDocument Data Findings
Observations
What patterns do we see in the data?
What observations: facts only – no
discussion at this point
Observations
What patterns do we see in the data?
What observations: facts only – no
discussion at this point
Hypotheses
What explanations or theories might we
have about the data?
What impact might this data have?
Hypotheses
What explanations or theories might we
have about the data?
What impact might this data have?
2424
Growth ReportsGrowth Reports
Focus of Report:Focus of Report:
Achievement GapsAchievement GapsAre we on target?Are we on target?

2525
Growth Report

2626
Growth ReportsGrowth Reports
►Is the group “All” students (black line) Is the group “All” students (black line) on target to meet AMO in subsequent on target to meet AMO in subsequent years?years?
►Is the group “Below Basic and Basic” Is the group “Below Basic and Basic” students (pink line) on target to meet students (pink line) on target to meet AMO in subsequent years?AMO in subsequent years?

2727
Growth ReportsGrowth Reports
Is the achievement gap getting Is the achievement gap getting smaller or larger? smaller or larger?
Are your students on target?Are your students on target?

2828
Looking at Individual Looking at Individual DataData
ConfidentialityConfidentiality
I will need these reports backI will need these reports back

2929
Document Data FindingsDocument Data Findings
Observations
What patterns do we see in the data?
What observations: facts only – no
discussion at this point
Observations
What patterns do we see in the data?
What observations: facts only – no
discussion at this point
Hypotheses
What explanations or theories might we
have about the data?
What impact might this data have?
Hypotheses
What explanations or theories might we
have about the data?
What impact might this data have?
3030
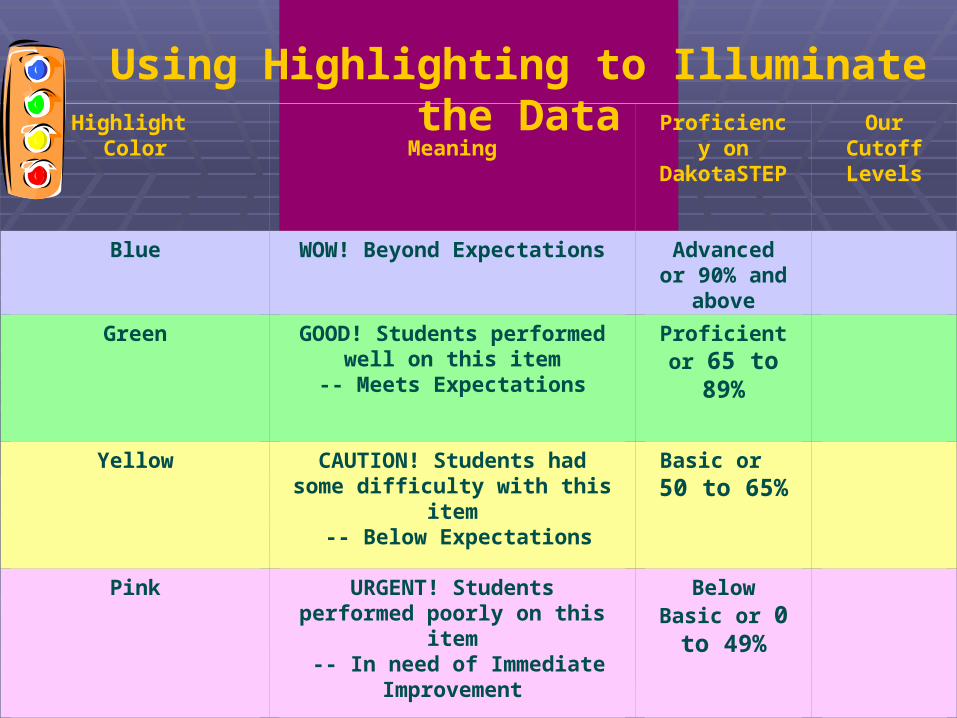
Highlight Color
Meaning
Proficiency on
DakotaSTEP
Our Cutoff Levels
Blue
WOW! Beyond Expectations
Advanced or 90% and
above
Green
GOOD! Students performed well on this
item-- Meets Expectations
Proficient or 65 to
89%
Yellow
CAUTION! Students had some difficulty with this
item -- Below Expectations
Basic or 50 to 65%
Pink URGENT! Students performed poorly on this
item -- In need of Immediate
Improvement
Below Basic or 0 to 49%
Using Highlighting to Illuminate the Data

3131
Individual Growth Individual Growth ReportsReports
Math – Blue/Reading – Math – Blue/Reading – PinkPink What observations can you make about What observations can you make about
students who have a negative growth?students who have a negative growth?
What surprises you about this group?What surprises you about this group?
What observations can you make about What observations can you make about students who have the greatest amount students who have the greatest amount of growth?of growth?
What surprises you about this group?What surprises you about this group?

3232
Individual Growth Individual Growth ReportsReports
Math – Blue/Reading – Math – Blue/Reading – PinkPink
What impact do these observations have What impact do these observations have at the classroom level?at the classroom level?
How can looking at individual student How can looking at individual student data drive our instructional practices in data drive our instructional practices in the classroom? Does it?the classroom? Does it?
3333
How close are we – How close are we – really?really?
Cut ScoresCut Scores
10 -15 points above 10 -15 points above

3434
Differentiated Differentiated InstructionInstruction
Based on the individual data, Based on the individual data, if you were asked to differentiate if you were asked to differentiate
student groups, student groups, how would you group them? how would you group them?
How would the groups differ for How would the groups differ for reading versus math?reading versus math?

3535
Student DataStudent DataNon-DakotaSTEPNon-DakotaSTEP

3636
CRT Report CRT Report
(Criterion Reference Testing)(Criterion Reference Testing) Website: E-MetricsWebsite: E-Metrics

3737
Document Data FindingsDocument Data Findings
Observations
What patterns do we see in the data?
What observations: facts only – no
discussion at this point
Observations
What patterns do we see in the data?
What observations: facts only – no
discussion at this point
Hypotheses
What explanations or theories might we
have about the data?
What impact might this data have?
Hypotheses
What explanations or theories might we
have about the data?
What impact might this data have?
3838
CRT Data CRT Data (Individual Standards)(Individual Standards)
Individual building reportIndividual building report
Seven questions per indicator Seven questions per indicator (combines standards) (combines standards)
Discuss the bell shaped curve Discuss the bell shaped curve theorytheory 60 to 65 percent60 to 65 percent
3939
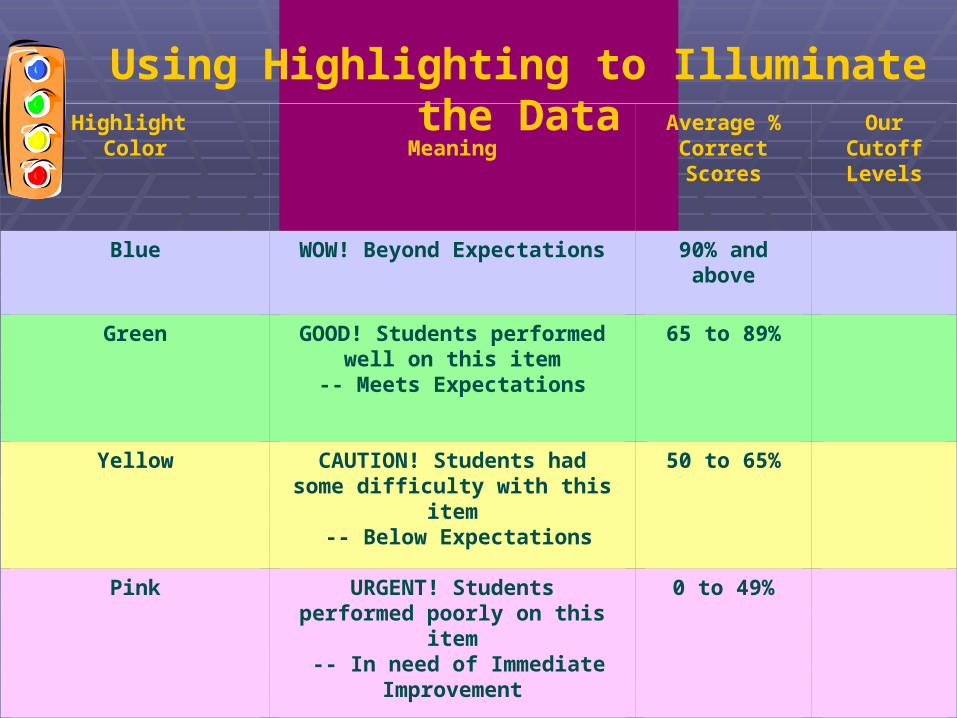
Highlight Color
Meaning
Average % Correct Scores
Our Cutoff Levels
Blue
WOW! Beyond Expectations
90% and above
Green
GOOD! Students performed well on this
item-- Meets Expectations
65 to 89%
Yellow
CAUTION! Students had some difficulty with this
item -- Below Expectations
50 to 65%
Pink URGENT! Students performed poorly on this
item -- In need of Immediate
Improvement
0 to 49%
Using Highlighting to Illuminate the Data
4040
State Content StandardsState Content Standards
Explain State ProcessExplain State Process Unpacked Standards (see handout)Unpacked Standards (see handout)
Math, Reading, ScienceMath, Reading, Science
http://doe.sd.gov/contentstandards/http://doe.sd.gov/contentstandards/
4141
CRT Data CRT Data (Individual Standards)(Individual Standards)
Brainstorm ideas about the low Brainstorm ideas about the low standardsstandards Why might they be low?Why might they be low? Are these standards that need to be high Are these standards that need to be high
priority?priority? What strategies are we currently using?What strategies are we currently using? What are some areas we could look at to What are some areas we could look at to
make sure we are covering these make sure we are covering these standards?standards?

4242
School ProfileSchool Profile
If you have school profile – If you have school profile –
what can you utilize at a data retreat?what can you utilize at a data retreat?

4343
Other Data SourcesOther Data Sources
At the building level, what other data At the building level, what other data sources do you have available?sources do you have available?
As a group, prioritize what you would As a group, prioritize what you would like to focus on next?like to focus on next?
Look at assessment matrixLook at assessment matrix
4444
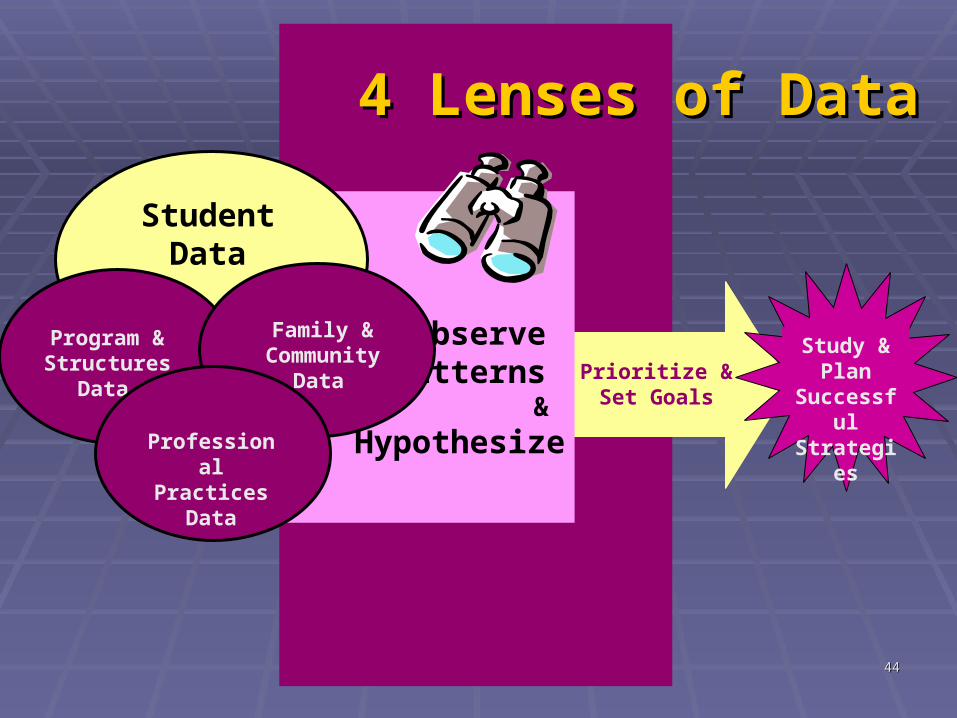
4 Lenses of Data4 Lenses of Data
Prioritize & Set Goals
Study & Plan
Successful
Strategies
Observe Patterns
& Hypothesize
StudentData
Program & Structures
Data
Family & Communit
y Data
Professional
Practices Data

4545
Where do we go from Where do we go from here?here?
What data do ALL staff members need to look at?What data do ALL staff members need to look at?
When/how can this happen?When/how can this happen?
How can this information be useful to you?How can this information be useful to you?
What other information can you add to this form?What other information can you add to this form?
What can we pull from other initiatives that will What can we pull from other initiatives that will help us when planning for student success?help us when planning for student success?
What can I do to help in the process?What can I do to help in the process?

4646
Three things that you still have Three things that you still have questions aboutquestions about
Two things that you feel really good Two things that you feel really good aboutabout
One thing that surprised youOne thing that surprised you
Check-Out
Related Documents