Mobile Phone Usage Preferences: The Contributing Factors of Personality, Social Anxiety and Loneliness Suyinn Lee • Cai Lian Tam • Qiu Ting Chie Accepted: 23 September 2013 Ó Springer Science+Business Media Dordrecht 2013 Abstract Psychological factors and social relationships are important components that influence an individual’s communication style. This paper aims to examine the association of personality factors, social anxiety (SA) and loneliness with mobile phone (MP) usage preferences on the basis of voice calling and text messaging. Malaysian MP users (N = 187) completed four questionnaires (Mobile Phone Usage Questionnaire, Big Five Inventory, Interaction Anxiousness Scale and UCLA Loneliness Scale) on paper or online via a web-link. Multiple regression analyses revealed that personality, SA and loneliness broadly predicted preferences for voice calling or text messaging. Further analyses examining the predictability of time spent on voice calls/text messaging and number of people called/exchanged text messages also revealed some significant findings in regards to the openness-to-experience personality dimension, loneliness and SA. The findings of this research have important implications to tailoring the delivery of psychological services to individuals diagnosed with chronic loneliness and SA. Keywords Big Five personality traits Social anxiety Loneliness Text messaging Voice calling 1 Introduction The mental health status in Malaysia has become significantly alarming. Malaysia’s Health Minister announced a 15.60 % increase in mental illness cases from year 2009 to 2010, equating to 400,227 cases nationwide (Borneo Post 2011). The Third National Health and Morbidity Survey (NHMS-III 2006) reported that 11.20 % of the Malaysian adult popu- lation were inclined to develop some type of psychiatric morbidity compared to 10.60 % in S. Lee C. L. Tam (&) Q. T. Chie School of Medicine and Health Sciences, Monash University Sunway Campus, Bandar Sunway, Selangor Darul Ehsan, Malaysia e-mail: [email protected] 123 Soc Indic Res DOI 10.1007/s11205-013-0460-2

Welcome message from author
This document is posted to help you gain knowledge. Please leave a comment to let me know what you think about it! Share it to your friends and learn new things together.
Transcript
Mobile Phone Usage Preferences: The ContributingFactors of Personality, Social Anxiety and Loneliness
Suyinn Lee • Cai Lian Tam • Qiu Ting Chie
Accepted: 23 September 2013� Springer Science+Business Media Dordrecht 2013
Abstract Psychological factors and social relationships are important components that
influence an individual’s communication style. This paper aims to examine the association
of personality factors, social anxiety (SA) and loneliness with mobile phone (MP) usage
preferences on the basis of voice calling and text messaging. Malaysian MP users
(N = 187) completed four questionnaires (Mobile Phone Usage Questionnaire, Big Five
Inventory, Interaction Anxiousness Scale and UCLA Loneliness Scale) on paper or online
via a web-link. Multiple regression analyses revealed that personality, SA and loneliness
broadly predicted preferences for voice calling or text messaging. Further analyses
examining the predictability of time spent on voice calls/text messaging and number of
people called/exchanged text messages also revealed some significant findings in regards to
the openness-to-experience personality dimension, loneliness and SA. The findings of this
research have important implications to tailoring the delivery of psychological services to
individuals diagnosed with chronic loneliness and SA.
Keywords Big Five personality traits � Social anxiety � Loneliness � Text
messaging � Voice calling
1 Introduction
The mental health status in Malaysia has become significantly alarming. Malaysia’s Health
Minister announced a 15.60 % increase in mental illness cases from year 2009 to 2010,
equating to 400,227 cases nationwide (Borneo Post 2011). The Third National Health and
Morbidity Survey (NHMS-III 2006) reported that 11.20 % of the Malaysian adult popu-
lation were inclined to develop some type of psychiatric morbidity compared to 10.60 % in
S. Lee � C. L. Tam (&) � Q. T. ChieSchool of Medicine and Health Sciences, Monash University Sunway Campus, Bandar Sunway,Selangor Darul Ehsan, Malaysiae-mail: [email protected]
123
Soc Indic ResDOI 10.1007/s11205-013-0460-2
year 1996. From the interpersonal paradigm perspective, social relationships are strongly
linked to individuals’ mental wellbeing (Segrin 2001). Impaired social relationships would
evolve into a source of stress capable of damaging individuals’ mental wellbeing. Befri-
enders Kuala Lumpur, which is a non-profit organisation providing free counselling ser-
vices, reported receiving 3,853 calls and 338 e-mails in the year 2009 and this signifies the
reality of inadequate social and emotional support among many individuals (Ramachan-
dran 2010). An exorbitant total of more than 25.18 billion text messages was also sent
through mobile phones (MP) in year 2010 (MCMC 2011).
MPs have evolved into the most widely used communication gadget in this era of high
technology (Katz and Aakhus 2002). This has been proven by local statistics, which shows
the rapid growth in the Malaysian MP market, with a total of 33.10 million MP sub-
scriptions as of year 2010 (MCMC 2011). The Hand Phone Users Survey (MCMC 2009)
reported that the largest proportion of MP users is those aged between 20–24 years.
Although there is a lack of information on the mental health status among Malaysian
youths (Nordin et al. 2010), youths between ages 16 and 19 years are more prone to having
mental health problems. The decline in mental wellbeing and further exposure to the use of
MPs in the later stage of youth will affect the mode or forms of communication (Malaysian
Psychiatric Association 2009).
The MP is a convenient and portable communication device that represents perpetual
contact as it facilitates social connectedness between individuals and the readiness to
communicate with each other (Katz and Aakhus 2002). MPs eliminates the need to search
for landline phones regardless of location and time (Leung and Wei 2000; Wei and Lo
2006). There are two main modes of communication in MPs—voice calling and text
messaging (MCMC 2007). Voice calling involves individuals speaking and having their
voice transmitted to the other party via a process similar to that of conventional telephones,
thus enabling both parties to have a verbal conversation in real-time. Conversely, text
messaging entails a text-based communication which requires one party to physically type
a text message about 160 characters long and send it to the recipient. Text messaging is
relatively cheaper and less obtrusive compared to voice calling (Ling and Yttri 2002). Both
voice calling and text messages are the modes of communication focused on in this study.
To promote effective communication in any mode, all forms of noise should be mini-
mised if not eliminated (Hargie 2011). Psychological factors such as personality, social
anxiety and loneliness could be sources of noise. For instance, these factors could cause
psychological noise by influencing individuals’ perception of MPs or having their feelings
and emotions affected by interaction via the MP (Bianchi and Phillips 2005; Reid and Reid
2007). Although the MP is an increasingly popular communication gadget, it has only
recently attracted the attention of psychology researchers. Extensively investigated areas
within the realms of MP literature include the effects of MP usage on driving performance
(Lesch and Hancock 2004; Owens et al. 2011; Patten et al. 2004; Rakauskas et al. 2004),
electromagnetic fields emitted from MPs and its influence on attention (Edelstyn and
Oldershaw 2002; Krause et al. 2000; Lee et al. 2003) and physiological aspects of the brain
(Ferreri et al. 2006; O’Keefe 2008). Research has also focused on the efficacy of MP usage
for therapy and health-based interventions (Bjerke et al. 2008; Carroll et al. 2011; Grassi
et al. 2007; Morak et al. 2008) as well as for educational purposes (Chen and Kinshuk
2005; Lu 2008; Markett et al. 2006; Wu and Chao 2008).
Besides that, researchers have also examined individuals’ motives for using MPs (Katz
and Aakhus 2002; Leung and Wei 2000; Ling and Yttri 2002; Wei and Lo 2006), negative
impacts of MP usage on aspects of wellbeing (Davidson and Lutman 2007; Khan 2008;
Loughran et al. 2005; Toda et al. 2006), the linguistic problems arising from text
S. Lee et al.
123
messaging (Berger and Coch 2010; McWilliam et al. 2009; Varnhagen et al. 2010; Wood
et al. 2011) and psychological characteristics that influence individuals’ preference for
particular MP communication modes (Butt and Phillips 2008; Reid and Reid 2007). But
there is limited literature associating aspects of personality, social anxiety and loneliness
with MP usage preferences.
Thus, this paper aims to address this gap by investigating whether personality, social
anxiety and loneliness predicted individuals’ MP usage preferences on the basis of voice
calling and text messaging. The subsequent section of this paper commences with a
background of the human interpersonal communication model, the concept of effective
communication and the conceptual framework of this study. This will be followed by the
research methodology, results, methodological strengths and limitations as well as a dis-
cussion of research findings. The paper ends with the implications of this research and
suggestions for future research.
2 The Interpersonal Communication Model and Conceptual Framework
Interpersonal communication is an information transmission process involving the sending
and receiving of messages between two or more individuals (Braithwaite and Baxter 2008).
The first model of communication developed by Shannon and Weaver (1949) served as a
basis from which other communication models have since been extensively formulated
(Barnlund 1970; Berlo 1960). Finnegan (2002) illustrated that communication models
essentially integrate the most elementary process of communication. It involved the sender
(source of message) encoding a piece of information as a message that is transmitted via a
communication channel pathway to the receiver (intended target audience of the message),
who decodes and applies meaning to it. The communication channel includes in-person
interactions, written messages on paper as well as verbal communication or electronic text
messages via MPs and computers.
Effective communication is achieved when the receiver successfully receives and
accurately assigns meaning to the message, as intended by the sender (Hargie 2011).
Success of the communicative act can be impaired following any interference or ‘‘noise’’
that would distort the message (Hargie 2011). This research will focus on psychological
noise (i.e., forces within an individual such as prejudices, feelings and emotions) that
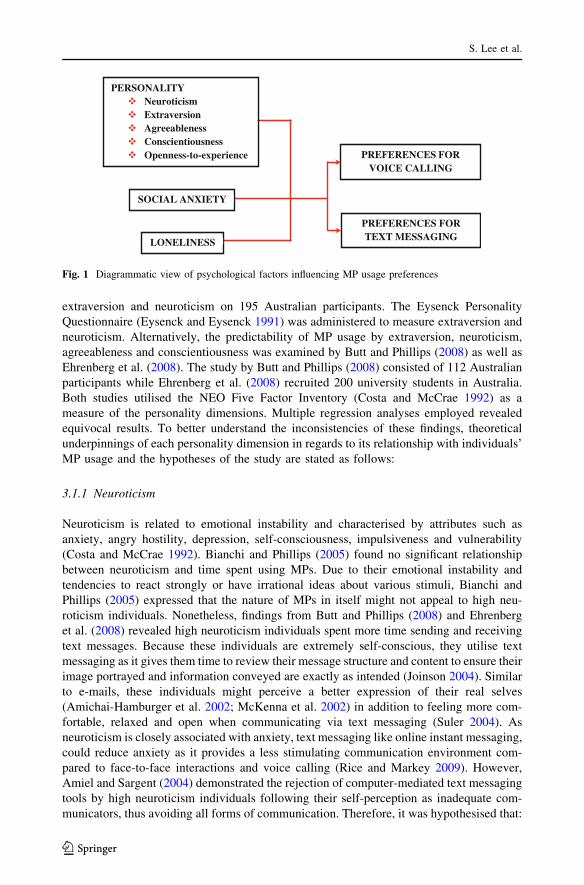
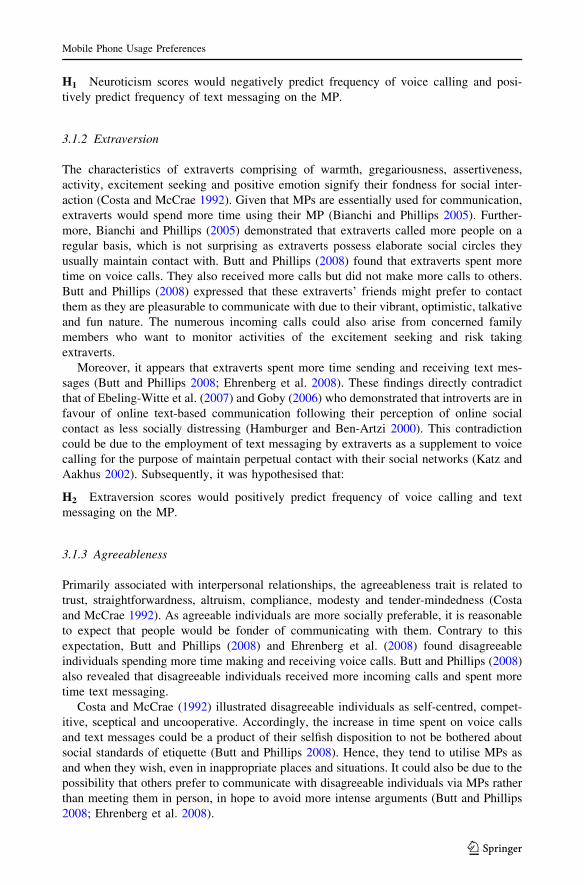
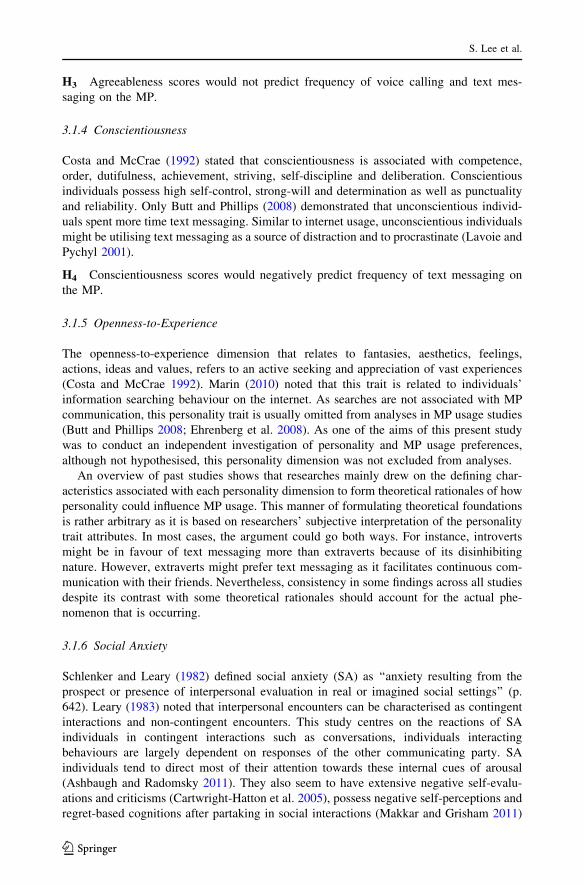
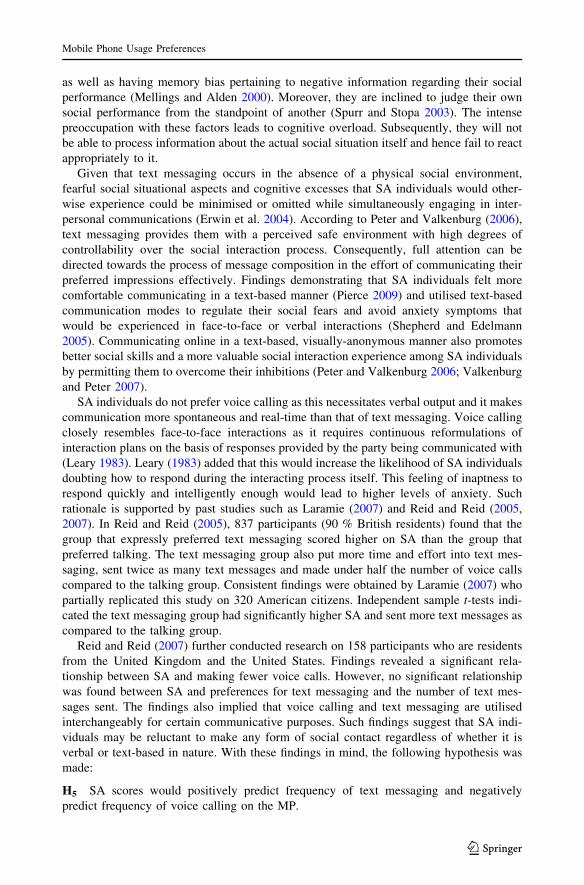
interferes with the ability to understand a message accurately. Figure 1 provides an outline
of the conceptual framework of psychological factors which may influence MP usage
preferences on the basis of voice calling and text messaging.
3 Psychological Factors and Hypotheses
3.1 Personality Dimensions
Personality is a unique constellation of enduring traits and dispositions that governs
individuals’ consistent cognitive, affective and behavioural patterns (Costa and McCrae
1995). Costa and McCrae’s (1992) five-factor model offers a comprehensive framework
summarising personality into five dimensions—neuroticism, extraversion, agreeableness,
conscientiousness and openness-to-experience. Studies have investigated associations
between these five personality dimensions and MP usage rather than MP usage preferences
per se. Bianchi and Phillips (2005) examined the predictability of MP usage by
Mobile Phone Usage Preferences
123
extraversion and neuroticism on 195 Australian participants. The Eysenck Personality
Questionnaire (Eysenck and Eysenck 1991) was administered to measure extraversion and
neuroticism. Alternatively, the predictability of MP usage by extraversion, neuroticism,
agreeableness and conscientiousness was examined by Butt and Phillips (2008) as well as
Ehrenberg et al. (2008). The study by Butt and Phillips (2008) consisted of 112 Australian
participants while Ehrenberg et al. (2008) recruited 200 university students in Australia.
Both studies utilised the NEO Five Factor Inventory (Costa and McCrae 1992) as a
measure of the personality dimensions. Multiple regression analyses employed revealed
equivocal results. To better understand the inconsistencies of these findings, theoretical
underpinnings of each personality dimension in regards to its relationship with individuals’
MP usage and the hypotheses of the study are stated as follows:
3.1.1 Neuroticism
Neuroticism is related to emotional instability and characterised by attributes such as
anxiety, angry hostility, depression, self-consciousness, impulsiveness and vulnerability
(Costa and McCrae 1992). Bianchi and Phillips (2005) found no significant relationship
between neuroticism and time spent using MPs. Due to their emotional instability and
tendencies to react strongly or have irrational ideas about various stimuli, Bianchi and
Phillips (2005) expressed that the nature of MPs in itself might not appeal to high neu-
roticism individuals. Nonetheless, findings from Butt and Phillips (2008) and Ehrenberg
et al. (2008) revealed high neuroticism individuals spent more time sending and receiving
text messages. Because these individuals are extremely self-conscious, they utilise text
messaging as it gives them time to review their message structure and content to ensure their
image portrayed and information conveyed are exactly as intended (Joinson 2004). Similar
to e-mails, these individuals might perceive a better expression of their real selves
(Amichai-Hamburger et al. 2002; McKenna et al. 2002) in addition to feeling more com-
fortable, relaxed and open when communicating via text messaging (Suler 2004). As
neuroticism is closely associated with anxiety, text messaging like online instant messaging,
could reduce anxiety as it provides a less stimulating communication environment com-
pared to face-to-face interactions and voice calling (Rice and Markey 2009). However,
Amiel and Sargent (2004) demonstrated the rejection of computer-mediated text messaging
tools by high neuroticism individuals following their self-perception as inadequate com-
municators, thus avoiding all forms of communication. Therefore, it was hypothesised that:
PREFERENCES FOR VOICE CALLING
PREFERENCES FOR TEXT MESSAGING
PERSONALITYNeuroticismExtraversionAgreeablenessConscientiousnessOpenness-to-experience
SOCIAL ANXIETY
LONELINESS
Fig. 1 Diagrammatic view of psychological factors influencing MP usage preferences
S. Lee et al.
123
H1 Neuroticism scores would negatively predict frequency of voice calling and posi-
tively predict frequency of text messaging on the MP.
3.1.2 Extraversion
The characteristics of extraverts comprising of warmth, gregariousness, assertiveness,
activity, excitement seeking and positive emotion signify their fondness for social inter-
action (Costa and McCrae 1992). Given that MPs are essentially used for communication,
extraverts would spend more time using their MP (Bianchi and Phillips 2005). Further-
more, Bianchi and Phillips (2005) demonstrated that extraverts called more people on a
regular basis, which is not surprising as extraverts possess elaborate social circles they
usually maintain contact with. Butt and Phillips (2008) found that extraverts spent more
time on voice calls. They also received more calls but did not make more calls to others.
Butt and Phillips (2008) expressed that these extraverts’ friends might prefer to contact
them as they are pleasurable to communicate with due to their vibrant, optimistic, talkative
and fun nature. The numerous incoming calls could also arise from concerned family
members who want to monitor activities of the excitement seeking and risk taking
extraverts.
Moreover, it appears that extraverts spent more time sending and receiving text mes-
sages (Butt and Phillips 2008; Ehrenberg et al. 2008). These findings directly contradict
that of Ebeling-Witte et al. (2007) and Goby (2006) who demonstrated that introverts are in
favour of online text-based communication following their perception of online social
contact as less socially distressing (Hamburger and Ben-Artzi 2000). This contradiction
could be due to the employment of text messaging by extraverts as a supplement to voice
calling for the purpose of maintain perpetual contact with their social networks (Katz and
Aakhus 2002). Subsequently, it was hypothesised that:
H2 Extraversion scores would positively predict frequency of voice calling and text
messaging on the MP.
3.1.3 Agreeableness
Primarily associated with interpersonal relationships, the agreeableness trait is related to
trust, straightforwardness, altruism, compliance, modesty and tender-mindedness (Costa
and McCrae 1992). As agreeable individuals are more socially preferable, it is reasonable
to expect that people would be fonder of communicating with them. Contrary to this
expectation, Butt and Phillips (2008) and Ehrenberg et al. (2008) found disagreeable
individuals spending more time making and receiving voice calls. Butt and Phillips (2008)
also revealed that disagreeable individuals received more incoming calls and spent more
time text messaging.
Costa and McCrae (1992) illustrated disagreeable individuals as self-centred, compet-
itive, sceptical and uncooperative. Accordingly, the increase in time spent on voice calls
and text messages could be a product of their selfish disposition to not be bothered about
social standards of etiquette (Butt and Phillips 2008). Hence, they tend to utilise MPs as
and when they wish, even in inappropriate places and situations. It could also be due to the
possibility that others prefer to communicate with disagreeable individuals via MPs rather
than meeting them in person, in hope to avoid more intense arguments (Butt and Phillips
2008; Ehrenberg et al. 2008).
Mobile Phone Usage Preferences
123
H3 Agreeableness scores would not predict frequency of voice calling and text mes-
saging on the MP.
3.1.4 Conscientiousness
Costa and McCrae (1992) stated that conscientiousness is associated with competence,
order, dutifulness, achievement, striving, self-discipline and deliberation. Conscientious
individuals possess high self-control, strong-will and determination as well as punctuality
and reliability. Only Butt and Phillips (2008) demonstrated that unconscientious individ-
uals spent more time text messaging. Similar to internet usage, unconscientious individuals
might be utilising text messaging as a source of distraction and to procrastinate (Lavoie and
Pychyl 2001).
H4 Conscientiousness scores would negatively predict frequency of text messaging on
the MP.
3.1.5 Openness-to-Experience
The openness-to-experience dimension that relates to fantasies, aesthetics, feelings,
actions, ideas and values, refers to an active seeking and appreciation of vast experiences
(Costa and McCrae 1992). Marin (2010) noted that this trait is related to individuals’
information searching behaviour on the internet. As searches are not associated with MP
communication, this personality trait is usually omitted from analyses in MP usage studies
(Butt and Phillips 2008; Ehrenberg et al. 2008). As one of the aims of this present study
was to conduct an independent investigation of personality and MP usage preferences,
although not hypothesised, this personality dimension was not excluded from analyses.
An overview of past studies shows that researches mainly drew on the defining char-
acteristics associated with each personality dimension to form theoretical rationales of how
personality could influence MP usage. This manner of formulating theoretical foundations
is rather arbitrary as it is based on researchers’ subjective interpretation of the personality
trait attributes. In most cases, the argument could go both ways. For instance, introverts
might be in favour of text messaging more than extraverts because of its disinhibiting
nature. However, extraverts might prefer text messaging as it facilitates continuous com-
munication with their friends. Nevertheless, consistency in some findings across all studies
despite its contrast with some theoretical rationales should account for the actual phe-
nomenon that is occurring.
3.1.6 Social Anxiety
Schlenker and Leary (1982) defined social anxiety (SA) as ‘‘anxiety resulting from the
prospect or presence of interpersonal evaluation in real or imagined social settings’’ (p.
642). Leary (1983) noted that interpersonal encounters can be characterised as contingent
interactions and non-contingent encounters. This study centres on the reactions of SA
individuals in contingent interactions such as conversations, individuals interacting
behaviours are largely dependent on responses of the other communicating party. SA
individuals tend to direct most of their attention towards these internal cues of arousal
(Ashbaugh and Radomsky 2011). They also seem to have extensive negative self-evalu-
ations and criticisms (Cartwright-Hatton et al. 2005), possess negative self-perceptions and
regret-based cognitions after partaking in social interactions (Makkar and Grisham 2011)
S. Lee et al.
123
as well as having memory bias pertaining to negative information regarding their social
performance (Mellings and Alden 2000). Moreover, they are inclined to judge their own
social performance from the standpoint of another (Spurr and Stopa 2003). The intense
preoccupation with these factors leads to cognitive overload. Subsequently, they will not
be able to process information about the actual social situation itself and hence fail to react
appropriately to it.
Given that text messaging occurs in the absence of a physical social environment,
fearful social situational aspects and cognitive excesses that SA individuals would other-
wise experience could be minimised or omitted while simultaneously engaging in inter-
personal communications (Erwin et al. 2004). According to Peter and Valkenburg (2006),
text messaging provides them with a perceived safe environment with high degrees of
controllability over the social interaction process. Consequently, full attention can be
directed towards the process of message composition in the effort of communicating their
preferred impressions effectively. Findings demonstrating that SA individuals felt more
comfortable communicating in a text-based manner (Pierce 2009) and utilised text-based
communication modes to regulate their social fears and avoid anxiety symptoms that
would be experienced in face-to-face or verbal interactions (Shepherd and Edelmann
2005). Communicating online in a text-based, visually-anonymous manner also promotes
better social skills and a more valuable social interaction experience among SA individuals
by permitting them to overcome their inhibitions (Peter and Valkenburg 2006; Valkenburg
and Peter 2007).
SA individuals do not prefer voice calling as this necessitates verbal output and it makes
communication more spontaneous and real-time than that of text messaging. Voice calling
closely resembles face-to-face interactions as it requires continuous reformulations of
interaction plans on the basis of responses provided by the party being communicated with
(Leary 1983). Leary (1983) added that this would increase the likelihood of SA individuals
doubting how to respond during the interacting process itself. This feeling of inaptness to
respond quickly and intelligently enough would lead to higher levels of anxiety. Such
rationale is supported by past studies such as Laramie (2007) and Reid and Reid (2005,
2007). In Reid and Reid (2005), 837 participants (90 % British residents) found that the
group that expressly preferred text messaging scored higher on SA than the group that
preferred talking. The text messaging group also put more time and effort into text mes-
saging, sent twice as many text messages and made under half the number of voice calls
compared to the talking group. Consistent findings were obtained by Laramie (2007) who
partially replicated this study on 320 American citizens. Independent sample t-tests indi-
cated the text messaging group had significantly higher SA and sent more text messages as
compared to the talking group.
Reid and Reid (2007) further conducted research on 158 participants who are residents
from the United Kingdom and the United States. Findings revealed a significant rela-
tionship between SA and making fewer voice calls. However, no significant relationship
was found between SA and preferences for text messaging and the number of text mes-
sages sent. The findings also implied that voice calling and text messaging are utilised
interchangeably for certain communicative purposes. Such findings suggest that SA indi-
viduals may be reluctant to make any form of social contact regardless of whether it is
verbal or text-based in nature. With these findings in mind, the following hypothesis was
made:
H5 SA scores would positively predict frequency of text messaging and negatively
predict frequency of voice calling on the MP.
Mobile Phone Usage Preferences
123
3.1.7 Loneliness
Loneliness is essentially defined as actual or perceived deficits in meaningful interpersonal
relationships accompanied by distressing and unpleasant experiences (Peplau and Perlman
1982). Lonely individuals typically possess poor social skills and are relationally incom-
petent (Jones et al. 1990; Spitzberg and Canary 1985). They have a tendency to talk less in
conversations (Sloan and Solano 1984) and are reluctant to be involved in social inter-
actions in addition to displaying inappropriately high or low levels of self-disclosure
(Solano et al. 1982). Additionally, lonely individuals possess low self-esteem, negative
emotions and poor social contact resulting in them having small social networks, spending
most time alone and engaging in few social activities (Green et al. 2001; Jones et al. 1990).
Several studies have examined the link between loneliness and MP usage (Jin and Park
2010; Laramie 2007; Reid and Reid 2005, 2007; Takao et al. 2009) using the UCLA
Loneliness Scale version 3 (Russell 1996). Findings indicated that the group that preferred
text messaging was significantly lonelier than the voice calling group (Laramie 2007; Reid
and Reid 2005). These findings echoed that of McKenna et al.’s (2002) internet commu-
nication study which found that lonely individuals have social skills deficits and are
subsequently more comfortable expressing their true feelings and opinions in a text-based
manner. In addition, lonely individuals were less socially passive in text-based commu-
nication (Bonetti et al. 2010; Peter and Valkenburg 2006). They were willing to com-
municate more frequently about personal, intimate and more diverse topics. Hence, lonely
individuals are using text messaging to compensate for their weak social skills.
On the contrary, Reid and Reid (2007) revealed that lonely individuals expressly pre-
ferred talking rather than text messaging. Loneliness was also significantly related to more
voice calls made but not fewer text messages sent. Reid and Reid (2007) explained their
findings based on the notion that loneliness arises from an unsatisfied need for love and
belonging following the absence of social relationships (Baumeister and Leary 1995).
Nonetheless, mere social contact does not decrease individuals’ level of loneliness; instead
it might even enhance it. Although the quantity of social contacts might be important to
some, it is the quality of these social relationships that actually decrease individuals’
susceptibility towards loneliness. Thus, lonely individuals would be fonder of voice calling
due to its relatively more personal, intimate and expressive nature. This rationale was
supported by Hu (2009), whose research reflected that text-based communication among
chronically lonely individuals (loneliness experienced over a long term) resulted in
heightened levels of mood loneliness as compared to face-to-face communication. This
might indicate that the significantly higher level of loneliness experienced by the text
messaging group in Laramie (2007) and Reid and Reid (2005) could actually be a con-
sequence following excessive text messaging activities rather than loneliness as a precursor
of text messaging.
Takao et al. (2009) investigated the predictability of MP usage by loneliness on 444
Japanese university students using a Japanese translated version of the UCLA Loneliness
Scale. Results showed that low loneliness individuals spent more time conversing and
sending text messages. They also conversed and exchanged text messages with a greater
number of people. Takao et al. (2009) attributed these findings to the inherent nature of
Japanese students who have a propensity to frequently make voice calls and send text
messages regardless of whether they are lonely or not. Furthermore, Ogata et al. (2006 as
cited in Takao et al. 2009) found that frequent use of MPs reduced loneliness of high
school students. Conversely, Jin and Park’s (2010) study on 232 students from two South
Western universities found that loneliness was not directly related voice calling and text
S. Lee et al.
123
messaging frequency. Further analyses revealed that loneliness affected MP usage only by
way of face-to-face interactions. Drawing on the characteristics of lonely individuals as
previously stated, Jin and Park (2010) argued that lonely individuals might be discouraged
to communicate with others in person. Following their infrequent face-to-face interactions,
they might have limited individuals to call or even no reason to communicate with others.
Consequently, a decrease in MP usage would occur.
The literature findings were relatively inconsistent but based on the rationale of the
majority of research studies, the following hypothesis was formed:
H6 Loneliness scores would positively predict frequency of voice calling and negatively
predict frequency of text messaging on the MP.
4 Materials and Methods
4.1 Participants
Data was collected and analysed from 187 participants (89 men, 98 women), who were
recruited via personal appeal from Monash University Sunway Campus, one selected
organisation and the general public around Selangor and Kuala Lumpur. The age range was
between 19 and 59 years (M = 26.69, SD = 8.80), and the sample comprised of Chinese
(85.00 %), Indians (7.50 %) and Malays (7.50 %). The participants consist of 38.5 %
students and 61.5 % working adults. The highest level of education for majority of the
participants’ was a Degree (61.00 %). Only 136 participants (72.7 %) reported their
monthly income/allowances with an average of RM 2,956.29 (SD = 3,197.27). The par-
ticipants were of Malaysian nationality. The criteria for participation were they had to own
at least one MP which they used regularly and were at least 18 years of age.
4.2 Instruments
Four self-report questionnaires were utilised in this study:
(a) Mobile Phone Usage Questionnaire (MPUQ): The MPUQ was devised for this study
and contained two sections. The first recorded participants’ demographic information
while the second addressed participants’ MP usage on a typical day.
(b) Big Five Inventory (BFI) (John et al. 2008): Contained 44 items measuring five
personality trait dimensions—Neuroticism, Extraversion, Agreeableness, Conscien-
tiousness and Openness-to-experience. Higher scores indicate more dominant
personality traits. The BFI demonstrates high degrees of internal consistency with
Cronbach’s Alphas ranging from 0.79 to 0.87 across all five dimensions (M = 0.83)
and good convergent validity to the NEO-FFI ranging from 0.72 to 0.81 (M = 0.77).
(c) Interaction Anxiousness Scale (IAS) (Leary 1983): A 15 item scale utilised to assess
participants’ level of SA. Responses from four negatively worded items were recoded
and all 15 items were totalled up to obtain an aggregate score for SA. The total score
for this scale can vary from 15 to 75 with higher scores indicating higher levels of SA.
The IAS displayed high degrees of internal consistency (a = 0.89) and good 8 week
test–retest reliability (Reliability Coefficient = 0.80) as well as construct validity as
indicated by strong correlations with several similar scales.
(d) UCLA Loneliness Scale version 3 (ULS) (Russell 1996): The 20 item ULS was
utilised to assess participants’ subjective feelings of loneliness. The nine negatively
Mobile Phone Usage Preferences
123
worded items were reversed scored and all the items were totalled up to provide an
aggregate score for loneliness. Total scores on this scale can range from 20 to 80 with
higher scores indicating higher degrees of loneliness. This scale presents high levels
of internal consistency (a = 0.89–0.94) and good test retest reliability over a 1 year
period (Reliability Coefficient = 0.73). Significant construct and convergent validity
were also present.
4.3 Design
The study employed a correlational design. The predictor variables were personality
dimensions (neuroticism, extraversion, agreeableness, conscientiousness and openness-to-
experience), social anxiety and loneliness, operationalised by the aggregate scores on their
corresponding scales. The dependent variables (DV) included preferences for voice calling
and text messaging on the MP. As the number of voice calls made and received per day
were highly correlated (r = .79), they were totalled up to form a composite variable of
voice calling frequency. Preference for voice calling was operationalised by voice calling
frequency. Similarly, number of text messages sent and received per day were highly
correlated (r = .96). Thus, they were summed up to create a composite variable of text
messaging frequency that operationalised preference for text messaging.
4.4 Procedure
Prior to data collection, ethics approval was attained from the Monash University Human
Research Ethics Committee. Interested participants were given an explanatory statement
and verbally briefed about the study. Participants were offered the choice to complete the
questionnaires on paper or online via a web-link. Under non-speeded conditions partici-
pants responded to the MPUQ followed by the BFI, IAS and ULS.
5 Results
Online and paper questionnaire responses were analysed using SPSS version 17. No
missing values were identified. Participants’ raw data were scored appropriately with
regards to the scoring manuals provided for the respective scales and entered into SPSS 18
for analysis. The means and standard deviations of all the variables were calculated.
Analyses of the predictor variables and dependent variables (i.e., standard and hierarchical
multiple regression analyses) were performed based on several assumptions. According to
Miles and Shevlin (2001), the research had to be carried out with a sufficient sample size to
be of scientific value. Secondly, the absence of multicollinearity of the predictors is
assumed with correlations between predictors (r \ .9). Thirdly, extreme outliers should be
deleted from the data set. astly, the assumption of homoscedasticity was applied in which
the variance of residuals is equal for all predicted DV scores.
In total, twelve separate multiple regression analyses were computed to test the effects
of predictors on the DVs (MP usage) in a controlled manner as shown below:
Step 1: Hierarchical multiple regressions were performed for each of the 4 dependent
variables according to two models.
Model 1. Social anxiety
S. Lee et al.
123
Model 2. Social anxiety ? Personality (Conscientiousness, Extraversion, Agreeable-
ness, Neuroticism dimensions)
Model 1 tested the consistency of findings from the current research with findings from
past studies on social anxiety. Model 2 tested the aim of the current research or more
precisely, whether including personality dimensions would improve the overall predictive
strength of the model in addition to social anxiety. Only four personality dimensions were
included in the analyses. Openness to New Experience was excluded as there were
inconclusive findings from past literature documenting its influence on MP usage.
Step 2: Similar to Step 1, hierarchical multiple regressions were performed for each of
the 4 dependent variables.
Model 1. Loneliness
Model 2. Loneliness ? Personality (Conscientiousness, Extraversion, Agreeableness,
Neuroticism dimensions)
In step 2, Model 1 tested the consistency of findings from the current research with
findings from past studies on loneliness. Model 2 tested the aim of the current research or
specifically, whether including personality dimensions would improve the overall pre-
dictive strength of the model in addition to loneliness.
Step 3: Standard multiple regression was performed for each of the 4 dependent
variables.
Model 1. Personality (Conscientiousness, Extraversion, Agreeableness, Neuroticism
dimensions)
Only one model was tested to study the sole effects of personality dimensions as
predictors. Consistency between findings from the current research with past studies was
also examined.
5.1 Analysis of Predictor Variables
Scores for the predictor variables were summed according to their respective scoring
instructions. The means, standard deviations, maximum and minimum values, scale means
and mean differences were computed for each predictor variable and illustrated in Table 1.
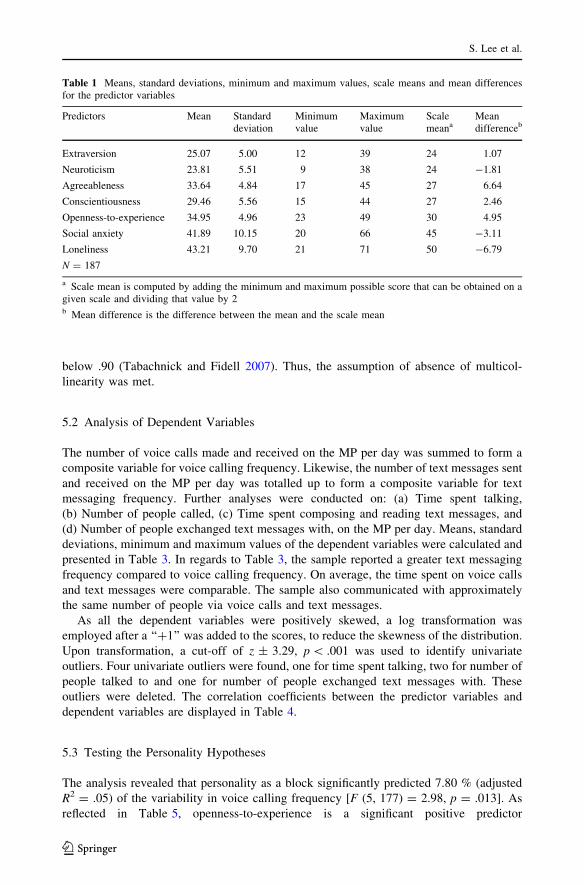
There are no published norms for the BFI. However, as illustrated in Table 1, agree-
ableness appeared to have the largest mean difference of 6.64-points above the scale mean
while neuroticism had a mean difference of 1.81-points below the scale mean. This could
indicate that the present sample is relatively agreeable and emotionally stable. Norms for
the IAS and UCLALS were only available for Western samples (Leary and Kowalski 1987;
Russell 1996). Mean SA scores in this present study is 2.99-points higher than that of a
Western university student sample (M = 38.90, SD = 9.70) while the mean loneliness
scores is 3.13-points higher than that of a Western college student sample (M = 40.08,
SD = 9.50).
There were no significant deviations from normality for all predictors. An inspection for
univariate outliers utilised a cut-off of z ± 3.29, p \ .001. One case with a univariate
outlier identified for agreeableness was deleted. Mahalanobis distance was employed to
detect multivariate outliers. One case was such that the Tolerance value was [22.46 (v2,
df = 6, p \ .001) was excluded. Pearson’s correlations were calculated for all predictors to
assess for multicollinearity. The correlation coefficients are presented in Table 2. Although
some significant correlations were present in Table 2, all correlation coefficients were
Mobile Phone Usage Preferences
123
below .90 (Tabachnick and Fidell 2007). Thus, the assumption of absence of multicol-
linearity was met.
5.2 Analysis of Dependent Variables
The number of voice calls made and received on the MP per day was summed to form a
composite variable for voice calling frequency. Likewise, the number of text messages sent
and received on the MP per day was totalled up to form a composite variable for text
messaging frequency. Further analyses were conducted on: (a) Time spent talking,
(b) Number of people called, (c) Time spent composing and reading text messages, and
(d) Number of people exchanged text messages with, on the MP per day. Means, standard
deviations, minimum and maximum values of the dependent variables were calculated and
presented in Table 3. In regards to Table 3, the sample reported a greater text messaging
frequency compared to voice calling frequency. On average, the time spent on voice calls
and text messages were comparable. The sample also communicated with approximately
the same number of people via voice calls and text messages.
As all the dependent variables were positively skewed, a log transformation was
employed after a ‘‘?1’’ was added to the scores, to reduce the skewness of the distribution.
Upon transformation, a cut-off of z ± 3.29, p \ .001 was used to identify univariate
outliers. Four univariate outliers were found, one for time spent talking, two for number of
people talked to and one for number of people exchanged text messages with. These
outliers were deleted. The correlation coefficients between the predictor variables and
dependent variables are displayed in Table 4.
5.3 Testing the Personality Hypotheses
The analysis revealed that personality as a block significantly predicted 7.80 % (adjusted
R2 = .05) of the variability in voice calling frequency [F (5, 177) = 2.98, p = .013]. As
reflected in Table 5, openness-to-experience is a significant positive predictor
Table 1 Means, standard deviations, minimum and maximum values, scale means and mean differencesfor the predictor variables
Predictors Mean Standarddeviation
Minimumvalue
Maximumvalue
Scalemeana
Meandifferenceb
Extraversion 25.07 5.00 12 39 24 1.07
Neuroticism 23.81 5.51 9 38 24 -1.81
Agreeableness 33.64 4.84 17 45 27 6.64
Conscientiousness 29.46 5.56 15 44 27 2.46
Openness-to-experience 34.95 4.96 23 49 30 4.95
Social anxiety 41.89 10.15 20 66 45 -3.11
Loneliness 43.21 9.70 21 71 50 -6.79
N = 187
a Scale mean is computed by adding the minimum and maximum possible score that can be obtained on agiven scale and dividing that value by 2b Mean difference is the difference between the mean and the scale mean
S. Lee et al.
123
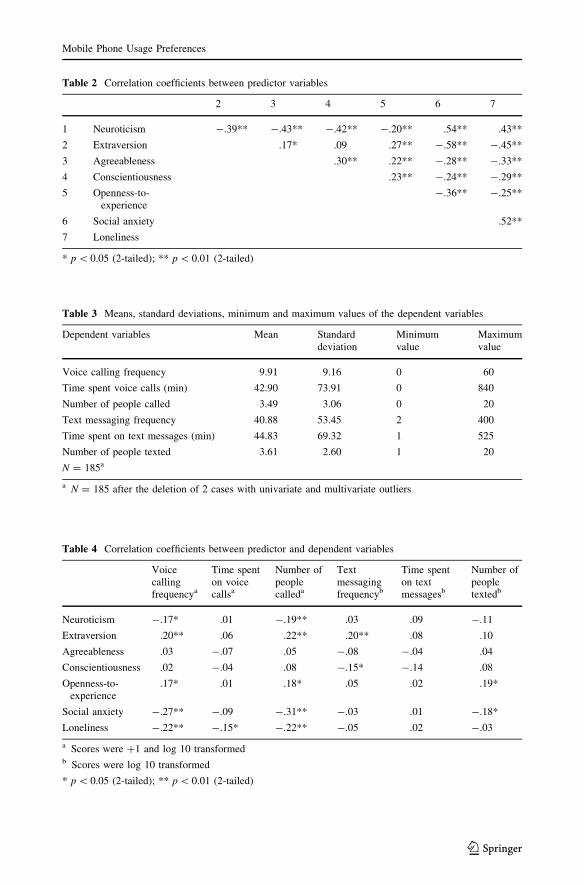
Table 2 Correlation coefficients between predictor variables
2 3 4 5 6 7
1 Neuroticism -.39** -.43** -.42** -.20** .54** .43**
2 Extraversion .17* .09 .27** -.58** -.45**
3 Agreeableness .30** .22** -.28** -.33**
4 Conscientiousness .23** -.24** -.29**
5 Openness-to-experience
-.36** -.25**
6 Social anxiety .52**
7 Loneliness
* p \ 0.05 (2-tailed); ** p \ 0.01 (2-tailed)
Table 3 Means, standard deviations, minimum and maximum values of the dependent variables
Dependent variables Mean Standarddeviation
Minimumvalue
Maximumvalue
Voice calling frequency 9.91 9.16 0 60
Time spent voice calls (min) 42.90 73.91 0 840
Number of people called 3.49 3.06 0 20
Text messaging frequency 40.88 53.45 2 400
Time spent on text messages (min) 44.83 69.32 1 525
Number of people texted 3.61 2.60 1 20
N = 185a
a N = 185 after the deletion of 2 cases with univariate and multivariate outliers
Table 4 Correlation coefficients between predictor and dependent variables
Voicecallingfrequencya
Time spenton voicecallsa
Number ofpeoplecalleda
Textmessagingfrequencyb
Time spenton textmessagesb
Number ofpeopletextedb
Neuroticism -.17* .01 -.19** .03 .09 -.11
Extraversion .20** .06 .22** .20** .08 .10
Agreeableness .03 -.07 .05 -.08 -.04 .04
Conscientiousness .02 -.04 .08 -.15* -.14 .08
Openness-to-experience
.17* .01 .18* .05 .02 .19*
Social anxiety -.27** -.09 -.31** -.03 .01 -.18*
Loneliness -.22** -.15* -.22** -.05 .02 -.03
a Scores were ?1 and log 10 transformedb Scores were log 10 transformed
* p \ 0.05 (2-tailed); ** p \ 0.01 (2-tailed)
Mobile Phone Usage Preferences
123
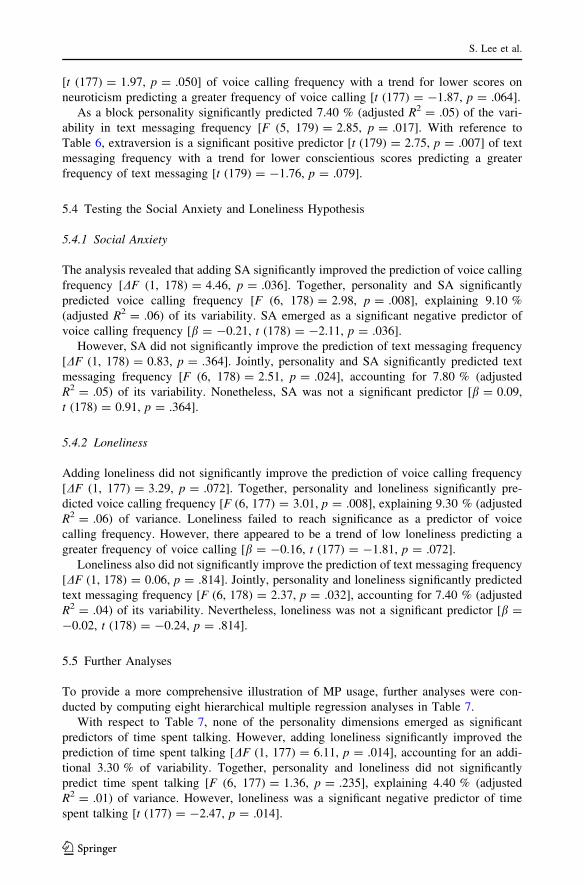
[t (177) = 1.97, p = .050] of voice calling frequency with a trend for lower scores on
neuroticism predicting a greater frequency of voice calling [t (177) = -1.87, p = .064].
As a block personality significantly predicted 7.40 % (adjusted R2 = .05) of the vari-
ability in text messaging frequency [F (5, 179) = 2.85, p = .017]. With reference to
Table 6, extraversion is a significant positive predictor [t (179) = 2.75, p = .007] of text
messaging frequency with a trend for lower conscientious scores predicting a greater
frequency of text messaging [t (179) = -1.76, p = .079].
5.4 Testing the Social Anxiety and Loneliness Hypothesis
5.4.1 Social Anxiety
The analysis revealed that adding SA significantly improved the prediction of voice calling
frequency [DF (1, 178) = 4.46, p = .036]. Together, personality and SA significantly
predicted voice calling frequency [F (6, 178) = 2.98, p = .008], explaining 9.10 %
(adjusted R2 = .06) of its variability. SA emerged as a significant negative predictor of
voice calling frequency [b = -0.21, t (178) = -2.11, p = .036].
However, SA did not significantly improve the prediction of text messaging frequency
[DF (1, 178) = 0.83, p = .364]. Jointly, personality and SA significantly predicted text
messaging frequency [F (6, 178) = 2.51, p = .024], accounting for 7.80 % (adjusted
R2 = .05) of its variability. Nonetheless, SA was not a significant predictor [b = 0.09,
t (178) = 0.91, p = .364].
5.4.2 Loneliness
Adding loneliness did not significantly improve the prediction of voice calling frequency
[DF (1, 177) = 3.29, p = .072]. Together, personality and loneliness significantly pre-
dicted voice calling frequency [F (6, 177) = 3.01, p = .008], explaining 9.30 % (adjusted
R2 = .06) of variance. Loneliness failed to reach significance as a predictor of voice
calling frequency. However, there appeared to be a trend of low loneliness predicting a
greater frequency of voice calling [b = -0.16, t (177) = -1.81, p = .072].
Loneliness also did not significantly improve the prediction of text messaging frequency
[DF (1, 178) = 0.06, p = .814]. Jointly, personality and loneliness significantly predicted
text messaging frequency [F (6, 178) = 2.37, p = .032], accounting for 7.40 % (adjusted
R2 = .04) of its variability. Nevertheless, loneliness was not a significant predictor [b =
-0.02, t (178) = -0.24, p = .814].
5.5 Further Analyses
To provide a more comprehensive illustration of MP usage, further analyses were con-
ducted by computing eight hierarchical multiple regression analyses in Table 7.
With respect to Table 7, none of the personality dimensions emerged as significant
predictors of time spent talking. However, adding loneliness significantly improved the
prediction of time spent talking [DF (1, 177) = 6.11, p = .014], accounting for an addi-
tional 3.30 % of variability. Together, personality and loneliness did not significantly
predict time spent talking [F (6, 177) = 1.36, p = .235], explaining 4.40 % (adjusted
R2 = .01) of variance. However, loneliness was a significant negative predictor of time
spent talking [t (177) = -2.47, p = .014].
S. Lee et al.
123
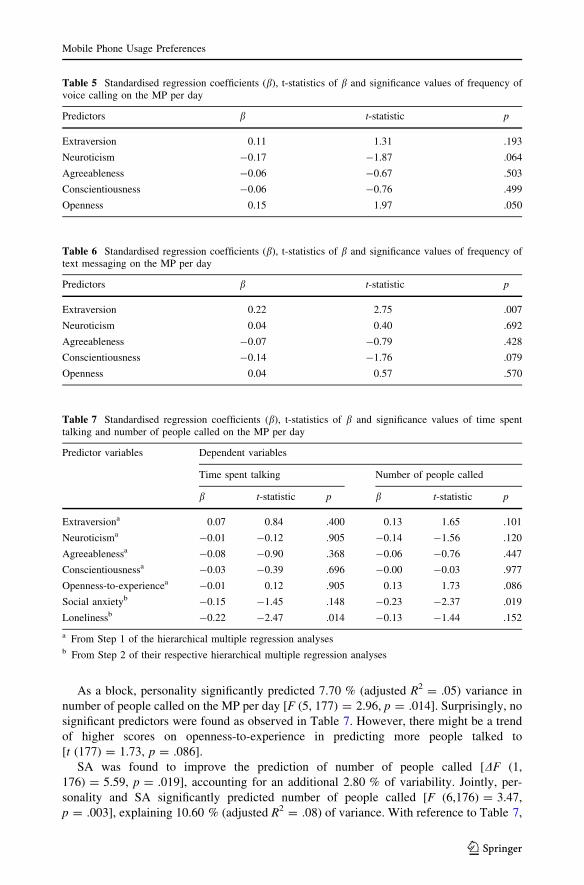
As a block, personality significantly predicted 7.70 % (adjusted R2 = .05) variance in
number of people called on the MP per day [F (5, 177) = 2.96, p = .014]. Surprisingly, no
significant predictors were found as observed in Table 7. However, there might be a trend
of higher scores on openness-to-experience in predicting more people talked to
[t (177) = 1.73, p = .086].
SA was found to improve the prediction of number of people called [DF (1,
176) = 5.59, p = .019], accounting for an additional 2.80 % of variability. Jointly, per-
sonality and SA significantly predicted number of people called [F (6,176) = 3.47,
p = .003], explaining 10.60 % (adjusted R2 = .08) of variance. With reference to Table 7,
Table 5 Standardised regression coefficients (b), t-statistics of b and significance values of frequency ofvoice calling on the MP per day
Predictors b t-statistic p
Extraversion 0.11 1.31 .193
Neuroticism -0.17 -1.87 .064
Agreeableness -0.06 -0.67 .503
Conscientiousness -0.06 -0.76 .499
Openness 0.15 1.97 .050
Table 6 Standardised regression coefficients (b), t-statistics of b and significance values of frequency oftext messaging on the MP per day
Predictors b t-statistic p
Extraversion 0.22 2.75 .007
Neuroticism 0.04 0.40 .692
Agreeableness -0.07 -0.79 .428
Conscientiousness -0.14 -1.76 .079
Openness 0.04 0.57 .570
Table 7 Standardised regression coefficients (b), t-statistics of b and significance values of time spenttalking and number of people called on the MP per day
Predictor variables Dependent variables
Time spent talking Number of people called
b t-statistic p b t-statistic p
Extraversiona 0.07 0.84 .400 0.13 1.65 .101
Neuroticisma -0.01 -0.12 .905 -0.14 -1.56 .120
Agreeablenessa -0.08 -0.90 .368 -0.06 -0.76 .447
Conscientiousnessa -0.03 -0.39 .696 -0.00 -0.03 .977
Openness-to-experiencea -0.01 0.12 .905 0.13 1.73 .086
Social anxietyb -0.15 -1.45 .148 -0.23 -2.37 .019
Lonelinessb -0.22 -2.47 .014 -0.13 -1.44 .152
a From Step 1 of the hierarchical multiple regression analysesb From Step 2 of their respective hierarchical multiple regression analyses
Mobile Phone Usage Preferences
123
SA was a significant negative predictor of number of people called [t (176) = -2.37,
p = .019].
Standardised regression coefficients (b), t-statistics of b and significance values of time
spent composing and reading text messages as well as number of people exchanged text
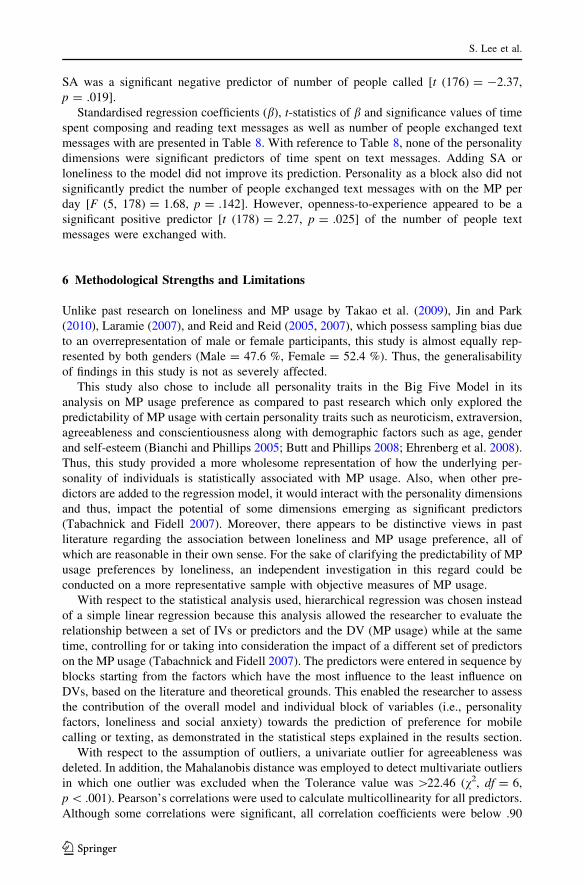
messages with are presented in Table 8. With reference to Table 8, none of the personality
dimensions were significant predictors of time spent on text messages. Adding SA or
loneliness to the model did not improve its prediction. Personality as a block also did not
significantly predict the number of people exchanged text messages with on the MP per
day [F (5, 178) = 1.68, p = .142]. However, openness-to-experience appeared to be a
significant positive predictor [t (178) = 2.27, p = .025] of the number of people text
messages were exchanged with.
6 Methodological Strengths and Limitations
Unlike past research on loneliness and MP usage by Takao et al. (2009), Jin and Park
(2010), Laramie (2007), and Reid and Reid (2005, 2007), which possess sampling bias due
to an overrepresentation of male or female participants, this study is almost equally rep-
resented by both genders (Male = 47.6 %, Female = 52.4 %). Thus, the generalisability
of findings in this study is not as severely affected.
This study also chose to include all personality traits in the Big Five Model in its
analysis on MP usage preference as compared to past research which only explored the
predictability of MP usage with certain personality traits such as neuroticism, extraversion,
agreeableness and conscientiousness along with demographic factors such as age, gender
and self-esteem (Bianchi and Phillips 2005; Butt and Phillips 2008; Ehrenberg et al. 2008).
Thus, this study provided a more wholesome representation of how the underlying per-
sonality of individuals is statistically associated with MP usage. Also, when other pre-
dictors are added to the regression model, it would interact with the personality dimensions
and thus, impact the potential of some dimensions emerging as significant predictors
(Tabachnick and Fidell 2007). Moreover, there appears to be distinctive views in past
literature regarding the association between loneliness and MP usage preference, all of
which are reasonable in their own sense. For the sake of clarifying the predictability of MP
usage preferences by loneliness, an independent investigation in this regard could be
conducted on a more representative sample with objective measures of MP usage.
With respect to the statistical analysis used, hierarchical regression was chosen instead
of a simple linear regression because this analysis allowed the researcher to evaluate the
relationship between a set of IVs or predictors and the DV (MP usage) while at the same
time, controlling for or taking into consideration the impact of a different set of predictors
on the MP usage (Tabachnick and Fidell 2007). The predictors were entered in sequence by
blocks starting from the factors which have the most influence to the least influence on
DVs, based on the literature and theoretical grounds. This enabled the researcher to assess
the contribution of the overall model and individual block of variables (i.e., personality
factors, loneliness and social anxiety) towards the prediction of preference for mobile
calling or texting, as demonstrated in the statistical steps explained in the results section.
With respect to the assumption of outliers, a univariate outlier for agreeableness was
deleted. In addition, the Mahalanobis distance was employed to detect multivariate outliers
in which one outlier was excluded when the Tolerance value was [22.46 (v2, df = 6,
p \ .001). Pearson’s correlations were used to calculate multicollinearity for all predictors.
Although some correlations were significant, all correlation coefficients were below .90
S. Lee et al.
123
(Tabachnick and Fidell 2007) and thus, the assumption of absence of multicollinearity was
met.
A methodological concern that often arises in research is the risk of finding spurious
effects. According to Anderson et al. (2001), spurious effects occur in 5 situations: (a) the
analysis is largely exploratory, (b) the research objective is ambiguous, (c) sample size is
small relative to the number of estimated parameters, (d) the collection of high dimensional
data with little theoretical framework to guide analysis, and (e) the application of data
dredging, in which patterns of results are studies and models are built for further analysis.
Inferences are then made based on the final model (Chatfield 1995). In the case of this
research, it is confirmatory in nature rather than exploratory because past researches
(Lavoie and Pychyl 2001; Erwin et al. 2004; Bianchi and Phillips 2005; Butt and Phillips
2008; Ehrenberg et al. 2008; Jin and Park 2010) have demonstrated the relationship
between the IVs (i.e., Big Five personality factors, social anxiety and loneliness) with the
DV (MP usage). The research objective was direct and each hypothesis was examined in a
consistent order using hierarchical regression. The required sample size for this research
was calculated according to the formula proposed by Tabachnick and Fidell (2007):
N [ 50þ 8 m N ¼ number of participants; m ¼ number of IVsð ÞTaking into consideration of 7 IVs in this research, N [ 106. With the current sample
size of 187 participants, the minimum sample size requirement was met. In addition, the
conceptual framework of this research was visualised a priori rather than inferred after data
analysis. Nevertheless, some of the hypotheses were unsupported from research outputs
which indicated only almost significant or insignificant individual predictors that estimate
respective MP usage measure. Such findings of almost significant predictors might also
indicate that these predictors are in fact not strong predictors of MP usage preference.
The researchers are also aware that there is a methodological limitation in regards to the
participants who were recruited from one geographical location. It is therefore suggested
that future research in this aspect should employ larger sample sizes and recruit partici-
pants from other geographical locations to ensure greater generalisability of results. Due to
time restrictions, the researchers were unable to explore other alternative hypotheses that
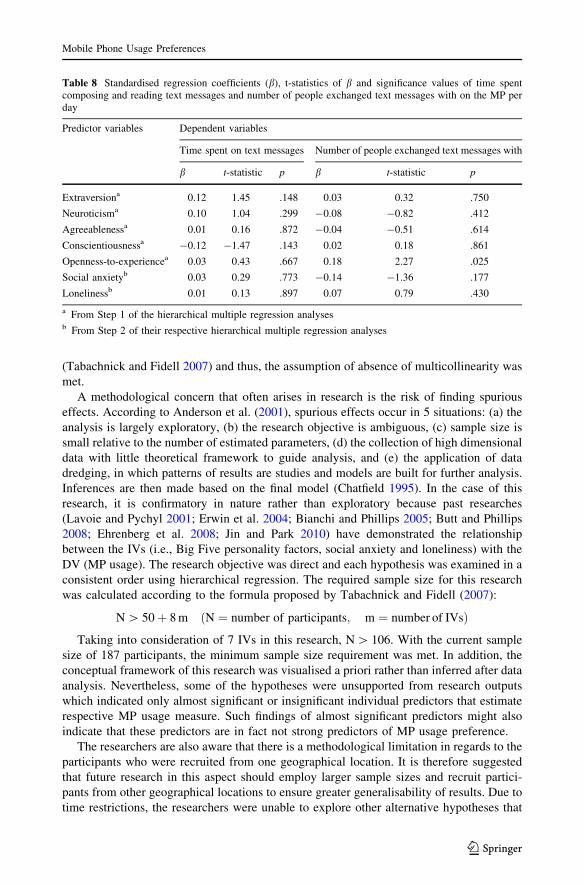
Table 8 Standardised regression coefficients (b), t-statistics of b and significance values of time spentcomposing and reading text messages and number of people exchanged text messages with on the MP perday
Predictor variables Dependent variables
Time spent on text messages Number of people exchanged text messages with
b t-statistic p b t-statistic p
Extraversiona 0.12 1.45 .148 0.03 0.32 .750
Neuroticisma 0.10 1.04 .299 -0.08 -0.82 .412
Agreeablenessa 0.01 0.16 .872 -0.04 -0.51 .614
Conscientiousnessa -0.12 -1.47 .143 0.02 0.18 .861
Openness-to-experiencea 0.03 0.43 .667 0.18 2.27 .025
Social anxietyb 0.03 0.29 .773 -0.14 -1.36 .177
Lonelinessb 0.01 0.13 .897 0.07 0.79 .430
a From Step 1 of the hierarchical multiple regression analysesb From Step 2 of their respective hierarchical multiple regression analyses
Mobile Phone Usage Preferences
123
may have arisen from the analysis. Thus, other potential psychological characteristics that
could influence individuals preferred modes of MP usage should be further investigated.
7 Discussion and Conclusion
A summary of the study findings are as follows:
• Hypothesis 3 was fully supported:
Hypothesis (3) Agreeableness scores would not predict frequency of voice calling and
text messaging
Agreeableness was not a significant predictor of voice calling or text messaging fre-
quency. It was reasoned that disagreeable individuals would not have a particular pref-
erence for these communication modes as they would utilise whichever mode they desire
as and when they wish to. Although disagreeable individuals spent more time on voice
calls and text messages (Butt and Phillips 2008; Ehrenberg et al. 2008), present findings
were insignificant in respect to those associations. It might suggest that people are inclined
to communicate with agreeable and disagreeable individuals via MP for different reasons,
resulting in no significant prediction. As agreeable individuals are socially desirable,
people would be fond of interacting with them (Costa and McCrae 1992). Alternatively,
people would also rather communicate with disagreeable individuals via MP rather than
meeting them in person in hope to avoid serious arguments (Butt and Phillips 2008;
Ehrenberg et al. 2008).
• Hypotheses 2 and 5 were only partially supported:
Hypothesis (2) Extraversion scores would positively predict frequency of voice calling
and text messaging
Although extraversion did not predict voice calling frequency, the findings revealed that
extraverts had a higher text messaging frequency. Based on the inherent nature of extraverts
to be fond of social interactions, the numerous text messages exchanged reflect their tendency
to stay in contact with their social networks (Katz and Aakhus 2002). Despite the expectation
that a similar finding would be attained for voice calling frequency, the insignificant asso-
ciation in this aspect might suggest that extraverts have a preference for face-to-face inter-
actions as opposed to communication via voice calls (Amichai-Hamburger et al. 2002).
Hypothesis (5) SA scores would positively predict frequency of text messaging and
negatively predict frequency of voice calling
SA was found to be an insignificant predictor of text messaging frequency. However,
SA predicted a lower voice calling frequency which reflects a dispreference for voice
calling. Although SA individuals are reluctant to engage in text-based or verbal social
interactions, under obligatory circumstances, they would still prefer communicating via
text messages as opposed to voice calling.
• Hypotheses (1), (4) and (6) were not supported:
Hypothesis (1) Neuroticism scores would negatively predict frequency of voice calling
and positively predict frequency of text messaging,
S. Lee et al.
123
Neuroticism did not significantly predict text messaging frequency. However, there
appeared to be a trend for high neuroticism individuals to have a lower voice calling
frequency. High neuroticism individuals are defined by their emotionally unstable nature
(Costa and McCrae 1992). Hence, their dispreference for voice calling might be due to
concerns about being instantaneously triggered or agitated during the communication
process occurring in real-time (Bianchi and Phillips 2005). The insignificant relationship
between neuroticism and text messaging preferences might reflect text messaging as a
preferred communication mode regardless of the level of neuroticism. It might also indi-
cate that individuals with high neuroticism prefer avoiding all forms of communication
following their perception that they might be misjudged or misinterpreted (Amiel and
Sargent 2004). Nonetheless, these insignificant findings could be due to the relatively
emotionally stable characteristic of these individuals. Thus, the probable preference of text
messaging by individuals with high neuroticism was not manifested in the findings.
Hypothesis (4) Conscientiousness scores would negatively predict frequency of text
messaging
Conscientiousness was not a significant predictor of text messaging frequency. Nev-
ertheless, a trend existed among individuals with lower conscientiousness scores to have
higher text messaging frequency. This is in congruent with the expectation that uncon-
scientious individuals prefer using text messaging as a means to procrastinate (Lavoie and
Pychyl 2001).
Hypothesis (6) Loneliness scores would positively predict frequency of voice calling and
negatively predict frequency of text messaging
Individuals with high loneliness scores had lower voice calling frequencies. This reflects
a lack of preference for voice calling by lonely individuals. Subsequently, it was revealed
that loneliness predicted significantly less time spent on voice calls. As individuals who are
deficient in social skills such as excessive levels of self-disclosure (Solano et al. 1982),
experiencing low self-esteem and negative emotions (Jones et al. 1990), the people sur-
rounding them might feel less fond of interacting with them in spite of their longing to
intimately communicate with others. The study also found loneliness was an insignificant
predictor of text messaging frequency. This can be attributed to the reason that text
messaging is a preferred communication mode by everyone, regardless of individuals’
levels of loneliness.
Although no hypothesis was devised for openness-to-experience, the study demon-
strated that open individuals had a higher voice calling frequency. They also exchanged
text messages with significantly more people and had a trend to call more people.
According to Costa and McCrae (1992), open individuals are intellectually inquisitive and
thus, enjoy in-depth discussions about philosophy, art and unconventional ideas. These
characteristics could account for open individuals’ voice calling preference and their
interactions with more people. Voice calls allow open individuals to have discussions and
better express their thoughts, ideas and opinions. Others might also be inclined to seek
input from open individuals regarding practical and emotional matters, given that they are
usually capable of providing insight, options and solutions to these issues.
Overall, the insight gained from this study on psychological factors that influence
individuals’ inclination towards voice calling or text messaging is valuable, particularly for
those who are psychosocially maladjusted such as individuals with high levels of SA and
loneliness. Such knowledge could be utilised to match individuals’ preferred communi-
cation modes to the actual communication mediums employed in their interpersonal
Mobile Phone Usage Preferences
123
interactions. This is particularly beneficial for the delivery of psychological services to
clients via e-therapy or e-counselling, social skills intervention programs as well as other
behavioural modification programs that requires constant monitoring, interaction or pro-
vision of information to the client. These findings are also useful in an educational setting
to facilitate the delivery of academic information to students as well as encourage more
effective teacher-student interaction which would enhance the quality and efficacy of
students’ learning experiences.
8 Suggestions for Future Research
The use of self-report estimates of MP usage as an indirect measure of preferences for
voice calling or text messaging in this study are less accurate than objective data as it is
prone to over or underestimation. Thus, future research could be conducted using objective
measures of actual MP usage by having participants keep weekly MP logs. Alternatively, a
more comprehensive tool for assessing MP usage preferences could be developed and
utilised rather than relying on MP usage measures only.
The participants in this research were recruited from one geographical location. It is
therefore suggested that future research should employ larger sample sizes and recruit
participants from other geographical locations to ensure greater generalisability of results
and greater power in the analyses. Other potential psychological characteristics that could
influence individuals preferred modes of MP usage should be further investigated provided
the time and resources permits.
Last but not least, the review of MP usage literature revealed that the psychological
characteristics such as personality, SA and loneliness do possess some degree of influence
on individuals’ preferred modes of MP communication despite notable inconsistencies in
the findings. Future studies could also extend present studies by investigating other factors
that may contribute to the relationship between loneliness and individuals’ preferred modes
of MP communication as a way to clarify such discrepancies. Significant findings obtained
could be exploited to promote the quality of communication among individuals in the
effort of building and sustaining superior interpersonal relationships.
References
Amichai-Hamburger, Y., Wainapel, G., & Fox, S. (2002). On the internet no one knows I’m an introvert:Extroversion, neuroticism, and internet interaction. CyberPsychology and Behavior, 5(2), 125–128.
Amiel, T., & Sargent, S. L. (2004). Individual differences in internet usage motives. Computers in HumanBehaviour, 20(6), 711–726.
Anderson, D. R., Burnham, K. P., Gould, W. R., & Cherry, S. (2001). Concerns about finding effects that areactually spurious. Wildlife Society Bulletin, 29(1), 311–316.
Ashbaugh, A. R., & Radomsky, A. S. (2011). Memory for physiological feedback in social anxiety disorder:The role of fear of bodily sensations. Cognitive Therapy and Research, 35(4), 304–316.
Barnlund, D. C. (1970). A transactional model of communication. In J. Atkin, A. Goldberg, G. Meyers, & J.Stewart (Eds.), Language behavior: A book of readings (pp. 43–61). The Hague: Mouton andCompany.
Baumeister, R. F., & Leary, M. R. (1995). The need to belong: Desire for interpersonal attachments as afundamental human motivation. Psychological Bulletin, 117(3), 497–529.
Berger, N. I., & Coch, D. (2010). Do u txt? Event-related potentials to semantic anomalies in standard andtexted English. Brain and Language. doi:10.1016/j.bandl.2010.02.002.
Berlo, D. K. (1960). The process of communication. New York: Holt, Rinehart, & Winston.
S. Lee et al.
123
Bianchi, A., & Phillips, J. G. (2005). Psychological predictors of problem mobile phone use. CyberPsy-chology and Behavior, 8(1), 39–51.
Bjerke, T. N., Kummervold, P. E., Christiansen, E. K., & Hjortdahl, P. (2008). ‘‘It made me feel con-nected’’—An exploratory study on the use of mobile SMS in follow-up care for substance abusers…short message service. Journal of Addictions Nursing, 19(4), 195–200.
Bonetti, L., Campbell, M. A., & Gilmore, L. (2010). The relationship of loneliness and social anxiety withchildren’s and adolescents’ online communication. Cyberpsychology, Behavior, and Social Network-ing, 13(3), 279–285.
Borneo Post. (2011). Ministry stamping rise in mental illness. http://www.theborneopost.com/2011/01/19/ministry-stamping-rise-in-mental-illness-%E2%80%94-liow/. Accessed 17 Sept 2011.
Braithwaite, D. O., & Baxter, L. A. (2008). Introduction: Meta-theory and theory in interpersonal com-munication. In L. A. Baxter & D. O. Braithwaite (Eds.), Engaging theories in interpersonal com-munication: Multiple perspectives (pp. 1–18). Thousand Oaks, CA: Sage Publications.
Butt, S., & Phillips, J. G. (2008). Personality and self-reported mobile phone use. Human Behavior, 24(2),346–360.
Carroll, A. E., DiMeglio, L. A., Stein, S., & Marrero, D. G. (2011). Using a cell phone-based glucosemonitoring system for adolescent diabetes management. The Diabetes Educator. doi:10.1177/0145721710387163.
Cartwright-Hatton, S., Tschernitz, N., & Gomersall, H. (2005). Social anxiety in children: Social skillsdeficit, or cognitive distortion? Behavior Research and Therapy, 43(1), 131–141.
Chatfield, C. (1995). Model uncertainty, data mining and statistical inference. Journal of the Royal Sta-tistical Society, Series A, 158, 419–466.
Chen, J., & Kinshuk, D. (2005). Mobile technology in educational services. Journal of Educational Mul-timedia and Hypermedia, 14(1), 89–107.
Costa, P. T., Jr., & McCrae, R. R. (1992). NEO PI-R professional manual. Odessa, FL: PsychologicalAssessment Resources Inc.
Costa, P. T., Jr., & McCrae, R. R. (1995). Domains and facets: Hierarchical personality assessment using therevised NEO personality inventory. Journal of Personality Assessment, 64(1), 21–50.
Davidson, H. C., & Lutman, M. E. (2007). Survey of mobile phone use and their chronic effects on thehearing of a student population. International Journal of Audiology, 46(3), 113–118.
Ebeling-Witte, S., Frank, M. L., & Lester, D. (2007). Shyness, internet use and personality. CyberPsy-chology and Behavior, 10(5), 713–716.
Edelstyn, N., & Oldershaw, A. (2002). The acute effects of exposure to the electromagnetic field emitted bymobile phones on human attention. NeuroReport, 13(1), 119–121.
Ehrenberg, A., Juckes, S., White, K. M., & Walsh, S. P. (2008). Personality and self-esteem as predictors ofyoung people’s technology use. CyberPsychology and Behavior, 11(6), 739–741.
Erwin, B. A., Turk, C. L., Heimberg, R. G., Fresco, D. M., & Hantula, D. A. (2004). The internet: Home to asevere population of individuals with social anxiety. Journal of Anxiety Disorders, 18(5), 629–646.
Eysenck, H. J., & Eysenck, S. B. G. (1991). Eysenck personality scales (EPS Adult). London: Hodder&Stoughton.
Ferreri, F., Curcio, G., Pasqualetti, P., De Gennaro, L., Fini, R., & Rossini, P. M. (2006). Mobile phoneemissions and human brain excitability. Annals of Neurology, 60(2), 188–196.
Finnegan, R. (2002). Communicating: The multiple modes of human interconnection. London: Routledge.Goby, V. P. (2006). Personality and online/offline choices: MBTI profiles and favoured communication
modes in a Singapore study. CyberPsychology and Behavior, 9(1), 5–13.Grassi, A., Preziosa, A., Villani, D., & Riva, G. (2007). Cellular phones for reducing battlefield stress:
Rationale and a preliminary research. Studies in Health Technology and Informatics, 125, 400–405.Green, L. R., Richardson, D. R., Schatten, E. C., Lago, T., & Sorensen, J. G. (2001). Network correlates of
social and emotional loneliness in young and older adults. Personality and Social Psychology Bulletin,27, 281–288.
Hamburger, Y. A., & Ben-Artzi, E. (2000). The relationship between extraversion and neuroticism and thedifferent uses of the Internet. Computers in Human Behavior, 16(4), 441–449.
Hargie, O. (2011). Skilled interpersonal communication: Research, theory and practice (5th ed.). EastSussex: Routledge.
Hu, M. (2009). Will online chat help alleviate mood loneliness? Cyberpsychology and Behavior: The Impactof the Internet, Multimedia and Virtual Reality on Behavior and Society. doi:10.1089/cpb.2008.0134.
Jin, B., & Park, N. (2010). In-person contact begets calling and texting: Interpersonal motives for cell phoneuse, face-to-face interaction, and loneliness. Cyberpsychology, Behavior, and Social Networking,13(6), 611–618.
Mobile Phone Usage Preferences
123
John, O. P., Naumann, L. P., & Soto, C. J. (2008). Paradigm shift to the integrative big-five trait taxonomy:History, measurement, and conceptual issues. In O. P. John, R. W. Robins, & L. A. Pervin (Eds.),Handbook of personality: Theory and research (pp. 114–158). New York: Guilford Press.
Joinson, A. N. (2004). Self-esteem, interpersonal risk, and preference for e-mail to face-to-face commu-nication. CyberPsychology and Behavior, 7(4), 472–478.
Jones, W. H., Rose, J., & Russell, D. W. (1990). Loneliness and social anxiety. In H. Leitenberg (Ed.),Handbook of social and evaluation anxiety (pp. 247–266). New York: Plenum Press.
Katz, J. E., & Aakhus, M. (2002). Perpetual contact: Mobile communication, private talk, public perfor-mance. Cambridge: Cambridge University Press.
Khan, M. M. (2008). Adverse effects of excessive mobile phone use. International Journal of OccupationalMedicine and Environmental Health, 21(4), 289–293.
Krause, C. M., Sillanmaki, L., Koivisto, M., Haggqvist, A., Saarela, C., Revonsuo, A., et al. (2000). Effectsof electromagnetic fields emitted by cellular phones on the electroencephalogram during a visualworking memory task. International Journal of Radiation Biology, 76(12), 1659–1667.
Laramie, D. J. (2007). Emotional and behavioural aspects of mobile phone use. Doctoral dissertation,Alliant International University, Alhambra, California.
Lavoie, J., & Pychyl, T. (2001). Cyber-slacking and the procrastination superhighway: A web based surveyof online procrastination, attitudes and emotions. Social Science Computer Reviews, 19(4), 431–444.
Leary, M. R. (1983). Social anxiousness: The construct and its measurement. Journal of PersonalityAssessment, 47(1), 66–75.
Leary, M. R., & Kowalski, R. M. (1987). Manual for the interaction anxiousness scale. Social andBehavioral Sciences Documents, 16, 2.
Lee, T. M. C., Lam, P. K., Yee, L. T. S., & Chan, C. C. H. (2003). The effect of the duration of exposure tothe electromagnetic field emitted by mobile phones on human attention. NeuroReport, 14, 1361–1364.
Lesch, M. F., & Hancock, P. A. (2004). Driving performance during concurrent cell-phone use: Are driversaware of their performance decrements. Accident Analysis and Prevention, 36(3), 471–480.
Leung, L., & Wei, R. (2000). More than just talk on the move: Uses and gratifications of the cellular phone.Journalism and Mass Communication Quarterly, 77(2), 308–320.
Ling, R., & Yttri, B. (2002). Hyper-co-ordination via mobile phones in Norway. In J. E. Katz & M. Aakhus(Eds.), Perpetual contact: Mobile communication, private talk and public performance (pp. 139–169).Cambridge: Cambridge University Press.
Loughran, S. P., Wood, A. W., Barton, J. M., Croft, R. J., Thompson, B., & Stough, C. (2005). The effect ofelectromagnetic fields emitted by mobile phones on human sleep. NeuroReport, 16, 1973–1976.
Lu, M. (2008). Effectiveness of vocabulary learning via mobile phone. Journal of Computer AssistedLearning. doi:10.1111/j.1365-2729.2008.00289.x.
Makkar, S. R., & Grisham, J. R. (2011). Social anxiety and the effects of negative self-imagery on emotion,cognition, and post-event processing. Behavior Research and Therapy, 49(10), 654–664.
Malaysian Psychiatric Association. (2009). Mental health: It’s nothing to be ashamed of. http://www.psychiatry-malaysia.org/article.php?aid=1143. Accessed 26 June 2013.
Marin, J. (2010). An examination of social anxiety, relationship support, self-esteem, personality traits, andmotivations for online gaming and internet usage. Doctoral dissertation, Southern Illinois University,Carbondale, Illinois.
Markett, C., Sanchez, A., Weber, S., & Tangney, B. (2006). Using short message service to encourageinteractivity in the classroom. Computers & Education, 46, 280–293.
McKenna, K. Y. A., Green, A. S., & Gleason, M. E. J. (2002). Relationship formation on the internet:What’s the big attraction? Journal of Social Issues, 58(1), 9–31.
MCMC. (2007). Malaysian communications and multimedia commissions (MCMC). Annual Report 2007.http://www.skmm.gov.my/skmmgovmy/files/attachments/AR_2007.pdf. Accessed 17 Sept 2011.
MCMC. (2009). Malaysian Communications and Multimedia Commissions (MCMC) Annual Report 2009.http://www.skmm.gov.my/skmmgovmy/files/attachments/SKMM_Annual_Report_2009.pdf. Acces-sed 17 Sept 2011.
MCMC. (2011). Malaysian communications and multimedia commissions (MCMC). Annual Report 2011.http://www.skmm.gov.my/skmmgovmy/media/General/pdf/SKMM_2011.pdf. Accessed 17 Sept 2011.
McWilliam, L., Schepman, A., & Rodway, P. (2009). The linguistic status of text message abbreviations: Anexploration using a Stroop task. Computers in Human Behavior, 25(4), 970–974.
Mellings, T. M. B., & Alden, L. E. (2000). Cognitive process in social anxiety: The effects of self-focusedattention, rumination, and mood-congruent memory retrieval. Behavior Research and Therapy, 3,243–257.
Miles, J., & Shevlin, M. (2001). Applying regression and correlation. London: Sage Publication.
S. Lee et al.
123
Morak, J., Schindler, K., Goerzer, E., Kastner, P., Toplak, H., Ludvik, B., et al. (2008). A pilot study ofmobile phone-based therapy for obese patients. Journal of Telemedicine and Telecare, 14, 147–149.
NHMS-III. (2006). National Health and Morbidity Survey-III. http://www.nih.gov.my/. Accessed 17 Sept2011.
Nordin, N. M., Talib, M. A., Yaacob, S. N., & Sabran, M. S. (2010). A study on selected demographiccharacteristics and mental health of young adults in public higher learning institutions in Malaysia.Global Journal of Health Science, 2(2), 104–110.
O’Keefe, S. (2008). Does the use of cell phones cause brain tumors? Clinical Journal of Oncology Nursing.doi:10.1188/08.CJON.671-672.
Owens, J. M., McLaughlin, S. B., & Sudweeks, J. (2011). Driver performance while text messaging usinghandheld and in-vehicle systems. Accident Analysis and Prevention, 43(3), 939–947.
Patten, C. J., Kircher, A., Ostlund, J., & Nilsson, L. (2004). Using mobile telephones: Cognitive workloadand attention resource allocation. Accident Analysis and Prevention, 36(3), 341–350.
Peplau, L. A., & Perlman, D. (1982). Perspectives on loneliness. In L. Peplau & D. Perlman (Eds.),Loneliness: A sourcebook of current theory, research, and therapy (pp. 1–20). New York: Wiley-Interscience.
Peter, J., & Valkenburg, P. M. (2006). Research note: Individual differences in perceptions of internetcommunication. European Journal of Communication, 21(2), 213–226.
Pierce, T. (2009). Social anxiety and technology: Face-to-face communication versus technological com-munication among teens. Computers in Human Behavior, 25(6), 1367–1372.
Rakauskas, M. E., Gugerty, L. J., & Ward, N. J. (2004). Effects of naturalistic cell phone conversations ondriving performance. Journal of Safety Research, 35(4), 453–464.
Ramachandran, S. (2010). Suicide rates in Malaysia are on the rise. http://www.asiaone.com/Health/News/Story/A1Story20100829-234450.html. Accessed 17 Sept 2011.
Reid, D. J., & Reid, F. J. M. (2005). Text mates and text circles: Insights into the social ecology of SMS textmessaging. In L. Hamill & A. Lasen (Eds.), Mobile world: Past, present and future (pp. 105–118).London: Springer.
Reid, D. J., & Reid, F. J. M. (2007). Text or talk? Social anxiety, loneliness, and divergent preferences forcell phone use. CyberPsychology and Behavior, 10(3), 424–435.
Rice, L., & Markey, P. M. (2009). The role of extraversion and neuroticism in influencing anxiety followingcomputer-mediated interactions. Personality and Individual Differences, 46(1), 35–39.
Russell, D. W. (1996). UCLA Loneliness Scale (Version 3): Reliability, validity, and factor structure.Journal of Personality Assessment, 66(1), 20–40.
Schlenker, B. R., & Leary, M. R. (1982). Social anxiety and self-presentation: A conceptualization model.Psychological Bulletin, 92(3), 641–669.
Segrin, C. (2001). Interpersonal processes in psychological problems. New York: The Guilford Press.Shannon, C. E., & Weaver, W. (1949). The mathematical theory of communication. Urbana: University of
Illinois Press.Shepherd, R., & Edelmann, R. J. (2005). Reasons for internet use and social anxiety. Personality and
Individual Differences, 39(5), 948–958.Sloan, W. W., & Solano, C. H. (1984). The conversational styles of lonely males with strangers and
roommates. Personality and Social Psychology Bulletin, 10, 293–301.Solano, C. H., Batten, P. B., & Parrish, E. (1982). Loneliness and patterns of self-disclosure. Journal of
Personality and Social Psychology, 43, 524–531.Spitzberg, B. H., & Canary, D. J. (1985). Loneliness and relationally competent communication. Journal of
Social and Personal Relationships, 2(4), 387–402.Spurr, J. M., & Stopa, L. (2003). The observer perspective: Effects on social anxiety and performance.
Behavior Research and Therapy, 41(9), 1009–1028.Suler, J. (2004). The online disinhibition effect. CyberPsychology and Behavior, 7(3), 321–326.Tabachnick, B. G., & Fidell, L. S. (2007). Using multivariate statistics (5th ed.). Boston, MA: Pearson
Education Inc.Takao, M., Takahashi, S., & Kitamura, M. (2009). Addictive personality and problematic mobile phone use.
CyberPsychology and Behavior, 12(5), 501–507.Toda, M., Monden, K., Kubo, K., & Morimoto, K. (2006). Mobile phone dependence and health-related
lifestyle of university students. Social Behavior and Personality, 34(10), 1277–1284.Valkenburg, P. M., & Peter, J. (2007). Preadolescents’ and adolescents’ online communication and their
closeness to friends. Developmental Psychology, 43(2), 267–277.Varnhagen, C. K., McFall, G. P., Pugh, N., Routledge, L., Surnida-MacDonald, H., &Wong, T. E. (2010).
Lol: New language and spelling in instant messaging. Reading and Writing: An InterdisciplinaryJournal. doi:10.1007/s11145-009-9181-y.
Mobile Phone Usage Preferences
123
Wei, R., & Lo, V.-H. (2006). Staying connected while on the move: Cell phone use and social connect-edness. New Media and Society, 8, 53–72.
Wood, C., Jackson, E., Hart, L., Plester, B., & Wilde, L. (2011). The effect of text messaging on 9- and10-year-old children’s reading, spelling and phonological processing skills. Journal of ComputerAssisted Learning. doi:10.1111/j.1365-2729.2010.00398.x.
Wu, T., & Chao, H. (2008). Mobile e-learning for next generation communication environment. Interna-tional Journal of Distance Education Technologies, 6(4), 1–13.
S. Lee et al.
123
Related Documents