Entrepreneurial Marketing

Welcome message from author
This document is posted to help you gain knowledge. Please leave a comment to let me know what you think about it! Share it to your friends and learn new things together.
Transcript

Entrepreneurial Marketing
563
Mobile Marketing Potensial as Sales Alternative
Yulius Hari
Widya Kartika University, Surabaya, Indonesia
Abstract
The development of information technology and the internet are growing so rapidly in this age of globalization,
which also directly affects in the field of marketing. Utilization of direct technology provides many benefits in
the form of freedom from attachment to place and provide time effectiveness and expand the scope. From time to
time, especially in Indonesia, the development of mobile communications has far exceeded the number of
internet subscribers and fixed telephone. As reported by the Association of Indonesian Cellular Phone, until the
end of 2009 the number of mobile phone subscribers is estimated at 96.41 million subscribers, while the number
of internet customer from the latest data compiled by APJII (Association of Indonesian Internet Service
Providers) in the year 2007 the number of internet subscribers reached only 25 million subscribers. This shows
the tremendous potential of mobile technology development, especially in the field of marketing. This study tries
to provide a new system that utilizes mobile technology as an alternative in the sale, so the more attractive and
interesting, and may provide information to customers quickly, without time and space constraints.
Keywords: mobile marketing, mobile commerce, alternative, e-commerce
1. Introduction The development of information technology
is rapidly evolving in the era of globalization is
also directly affect the technology in the field of
trade. Utilization of information technology
provides the advantage of freedom from
attachment to place and gives the effectiveness
of time. Information technology can be used as
an intermediary between sellers and prospective
buyers in the trade so that transactions can take
place more flexible and thus can cover a wider
scope.
As we know that nowadays, the internet is a
communications media that are popular in
Indonesia and abroad. Many reasons for
choosing the background for the Internet as a
medium of their communication, these reasons
include the ease and comfort in communicating
through the Internet, because the Internet is a
vast communications network so that all people
everywhere in the world can communicate and exchange information quickly.
From year to year, internet users, especially
in Indonesia are increasing rapidly, from the
latest data compiled by APJII (Association of
Indonesian Internet Service Provider) internet
users increasingly have increased. From their
latest data, during the year 2007, internet users in Indonesia has reached 25 million people,
whereas earlier in the year of internet users
numbered about 18 million people. These data
show that only in one year, the increase of
internet users has reached 39%. Actually not too
surprising rise of internet users because more
and more cafe-cafe, besides a cell phone has
become a lifestyle also has been equipped with
GPRS facility to access the internet. From a
variety of easy access to the internet, APJII estimates that in 2008 Internet users will
increase by 40%. With the community-growing
internet familiarly, Indonesia is an opportunity
for entrepreneurs to further develop an online
sales system.
One common form of trade is the buyers
and sellers meet at a certain location, and at the
time specified. Sellers offer products and
waiting buyers who need the product.
Fundamental weakness of the old trading
system is the attachment between the place and
time, and comparisons as well as difficulty in
getting clear product information.
Mobile commerce or m-commerce in the
hierarchy is in the online sales system or better
known as e-commerce. So, the general principle
of the m-commerce adopt e-commerce, only
specifically using mobile devices as a media
delivery.
During this limited product trading model
using the e-commerce and the media still not
many use the m-Commerce as a potential
medium for commerce. The author tries to
develop a system model m-commerce are also
adopting a business process longer but develop
into a form of offering a more attractive and
interesting.
564
1.1 Problem Identification The problems that have been identified are
following issues:
• How to model the system can become a
more attractive alternative to selling
• How to model the system that allows buyers
to get information and competitive price
• How models system would allow the seller
to market their products
• How to model the system that makes buying
and selling transactions become more
efficient and safer.
• How to model information systems that can
capture buyers.
1.2 Purpose From the formulation of the problem, the
purposes of this study are:
1) Provide product information for buyers
2) Provide process online transactions
3) Provide a system that makes sellers in
marketing their products
4) Improving the efficiency of business people
working
5) Solicit buyer’s information which can then
be used for various needs.
2. Literature Review 2.1 E-Commerce
Electronic Commerce (e-commerce) is
defined as the process of buying and selling of
products, services, and information made
electronically by using a computer network.
One of the networks used is the internet.
Meanwhile Kalakota and Whinston define e-
Commerce from several perspectives, namely:
1) From the perspective of communication, e-
commerce is sending the information,
products/services, or payments via
telephone networks, or other
communication channels,
2) from the perspective of business processes,
e-commerce is the application of the
technology to automate business
transactions and work flow,
3) from the perspective of service, e-commerce
is a tool used to reduce costs in ordering and
delivery; and
4) from the perspective of online, e-commerce provides the ability to sell and buy products
and information through the Internet and
other online services network.
Furthermore, Yuan Gao, in Encyclopedia of
Information Science and Technology (2005),
said e-commerce is the use of computer
networks to conduct business communications
and commercial transaction. Then on the website e-commerce net, e-commerce is defined
as an activity to sell merchandise andor services
via the internet. All the elements involved in the
practical business application here, such as
customer service, products available, payment
methods, guarantee the products sold, the way
of promotion and so forth.
All of the definitions described above have
in common are basically covering the
components of the transaction (buyer, seller,
goods, services, and information), subjects and
objects involved, and the media used (in this
case is the internet).
The development of information technology
particularly the internet was a contributing
factor the development of e-commerce. The
internet is a global network that brings together
worldwide computer network, allowing the
intertwining of communication and interaction
between each other throughout the world. By linking with the internet company’s computer
network, companies can establish business
relationships with business partners or
customers more efficiently. Until now, the
internet is an ideal infrastructure for running e-
commerce, so that the term e-commerce has
become synonymous with doing business on the internet.
Exchange of information in e-commerce
made in digital format so that the need for
sending data in printed form can be eliminated.
By using computer systems interconnected via
telecommunications networks, business
transactions can be done automatically and in a
short time. As a result, the information required
for business transactions available when
required. By doing business electronically,
companies can reduce costs for information
delivery. Process transactions that take place
quickly also result in increased productivity of
the company (dasril.wordpress.com, 2009)
By using information technology, e-
commerce can be used as a solution to help
companies face pressure to develop the
company and business. The high pressure of
business that arises due to the high level of
competition requires companies to provide a response. Use of e-commerce can improve cost
efficiency and productivity of the company, thus
increasing the firm’s ability to compete.
565
2.2 M-Commerce M-commerce or m-commerce (Mobile-
Commerce, mcommerce) is a system of
electronic commerce (e-commerce) using
portable equipment mobile such as mobile phones, smart phones, PDAs, notebooks, and
others. At the time computer users move from
one place to another (while in the car, for
example), computer users can make sale and
purchase of products on the Internet by using
this system for m-commerce. In addition to m-
commerce, the other terms frequently used are
m-business (Mobile Business). Basically, m-
commerce is a combination of electronic
commerce (e-commerce) with mobile
computing. It could be said that m-commerce is
e-commerce within the wireless environment.
Like e-commerce in general, the use of m-
commerce can be transacted over the internet,
personal communications networks, smart
cards, and other infrastructure. M-commerce
provides opportunities to provide new services
for existing customers, and to attract new
customers (id.wikipedia.org, 2009).
Each device has different characteristics that may affect the level of usage, and
applications m-commerce system that can be
used. Characteristics of the device that greatly
affect the system m-commerce, among others:
• The size and color of the display.
• Input devices, such as the trackpad and
keyboard keypad.
• Memory and CPU.
• Network connections and bandwidth .
• Operating system.
• Smart card reader.
M-commerce was born after an e-commerce
is generally done through the internet media. M-
commerce births were mainly triggered by high
mobile phone penetration rates around the
world. Compared to other e-commerce system
of m-commerce advantages are as follows: 1. Ubiquity: user can access from anywhere
and anytime.
2. Security: generally handset equipped with a
smart card reader and smart card of his own.
So that can be used as a secret
authentication key.
3. Localization: allows the application of
location based services.
4. Convenience: the size and weight of the
handset makes the user comfortable in
transacting.
5. Personalization: mobile phones are personal
devices, making it possible to offer services
and products that are personal.
However, as has been quoted from Indra Purnama (2005), among several advantages as
mentioned above, m-commerce also has some
shortcomings:
• The limitation of the device.
• The level of diversity of devices, networks
and operating systems is very high,
requiring the standardization of inter-vendor
platforms. Among others, have been
overcome by the J2ME.
• The high rate of lost and stolen mobile
phones.
• Increasing the level of vulnerability to
security when data is transferred over the air
interface.
2.3 xHTML MP
Extensible Hypertext Markup Language Mobile Profile xHTML MP or shortened with a
markup language defined in the Wireless
Application Protocol (WAP) 2.0, which is a
communication protocol for wireless
applications made by the WAP forum, which
this time have turned into the Open Mobile
Alliance (OMA ). xHTML itself is actually a
combination of Hypertext Markup Language
(HTML) that has been commonly used as a
programming language to build a site on the
internet today and Extensible Markup Language
(XML). Addition of the term Mobile Profile
XHTML MP means a specialized programming
language to build applications that can be read
via mobile devices, such as cell phones (mobile
phones), PDA or Smartphone. xHTML MP is
part of xHTML, therefore the syntax and rules
in writing applications using xHTML MP
following the syntax and rules as xHTML.
3. Design, Model, & Implementation In the modern business world today which
put the convenience and speed of transactions, m-commerce is an alternative way of trading
that can benefit all parties, either party
customers, as well as the manufacturers and
sellers (retailers). Benefits for the consumer
include:
1. Time efficiency, by using m-commerce,
shopping is becoming shorter time, because
consumers do not need to go to a place to
buy an item. Consumers just need to sit in
566
front of computers connected to the internet,
then look for sites that provide goods to be
purchased. Different if we shopped in the
market, we will take a lot of time to travel
from home to the market, not to mention us a lot of wasted time to bargain a good price
and also need time to choose what goods to
be purchased.
2. Factor prices of goods, usually the prices of
goods sold through the m-commerce is
more expensive than the price in a store, it
is because the distribution channels from
producers of goods to the seller shorter
compared with conventional stores.
3. With m-commerce, consumers can conduct
transactions anywhere and anytime without
any restriction of time and place, it is an
obstacle that we encounter when we are still
transacting in a particular place (the markets
or shops), very rarely shop or market- stores
open 24 hours a day.
4. Comfort factor, m-commerce transactions
are promising in the comfort of the
consumers, they need not jostle like in the
market, no need to queue in the process of payment and they also do not have to worry
about the possibility of a pickpocket or
mugger.
As for sellers and producers, the use of m-
commerce will bring benefits in the form:
1. Reduce operational costs, especially costs associated with paper, such as: the cost of
letters, notes, bills, receipts and others. That
is because all-DTA data, customer data,
data products or sales data has been stored
in the database so it does not need to be
printed into the paper.
2. The absence of late payments and these
payments can be checked immediately,
That's because the process of payment is by
credit card, so payment will be timely,
because before the payment process
declared valid, the transaction is not
considered complete sales and orders not
yet delivered the goods.
With m-commerce, consumers will be more
extensive coverage, as in m-commerce
transactions are not restricted by
geographical location of a particular region,
the transaction can be made between
regions or between countries, it is very different from conventional transactions
where consumers only limited coverage in a
certain areas.
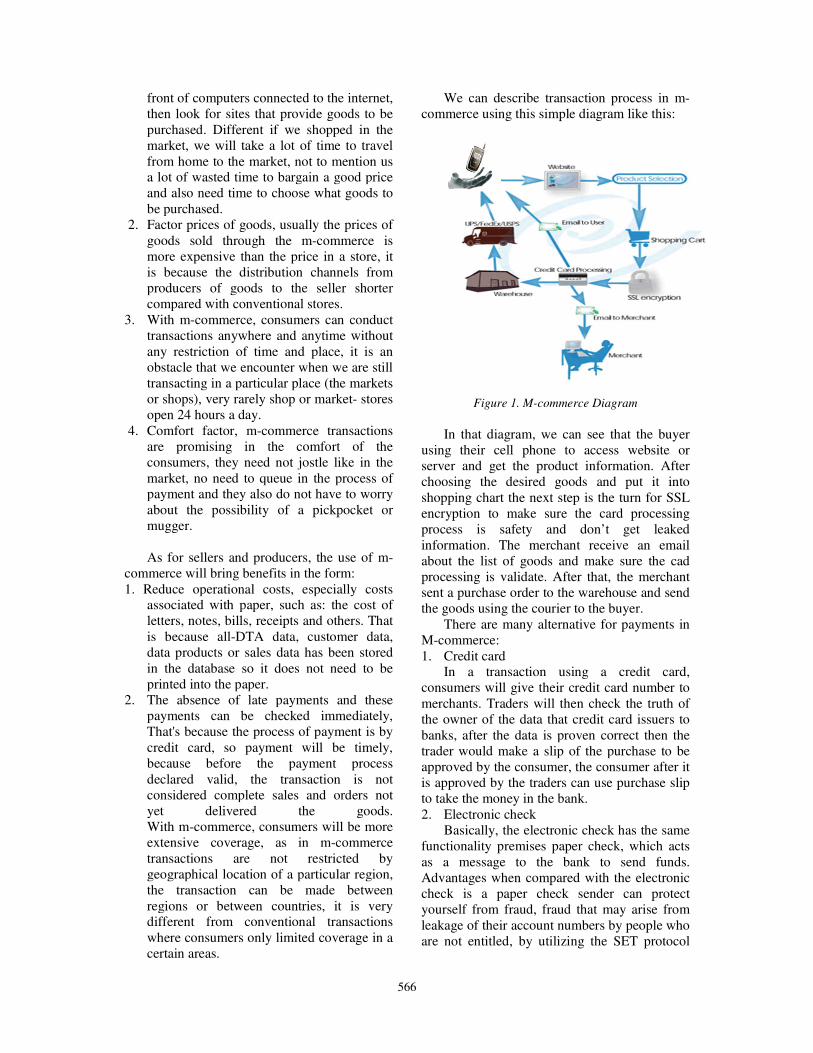
We can describe transaction process in m-
commerce using this simple diagram like this:
Figure 1. M-commerce Diagram
In that diagram, we can see that the buyer
using their cell phone to access website or
server and get the product information. After
choosing the desired goods and put it into
shopping chart the next step is the turn for SSL
encryption to make sure the card processing
process is safety and don’t get leaked
information. The merchant receive an email
about the list of goods and make sure the cad
processing is validate. After that, the merchant
sent a purchase order to the warehouse and send
the goods using the courier to the buyer.
There are many alternative for payments in
M-commerce:
1. Credit card In a transaction using a credit card,
consumers will give their credit card number to
merchants. Traders will then check the truth of
the owner of the data that credit card issuers to
banks, after the data is proven correct then the
trader would make a slip of the purchase to be
approved by the consumer, the consumer after it
is approved by the traders can use purchase slip
to take the money in the bank.
2. Electronic check
Basically, the electronic check has the same
functionality premises paper check, which acts
as a message to the bank to send funds.
Advantages when compared with the electronic
check is a paper check sender can protect
yourself from fraud, fraud that may arise from
leakage of their account numbers by people who
are not entitled, by utilizing the SET protocol
567
(for discussion of the SET protocol are
discussed in more detail in section others).
Website that provides the explanation of how
this payment is http://www.icheck.com.
3. Digital cash (e-cash) E-cash is actually a special account for
payment via the internet. The account was
opened using a credit card belonging to before.
Customers only need to fill in your e-cash to
use. Value for money no more formed from
strands of bits, the bank may debit our accounts
with a number of withdrawals, which is equal to
the value of money used. Banks can do the
validation of each such withdrawal by a digital
marker (digital stamp) before transmit it into our
computer. The example for this method is using
PayPal (http://www.paypal.com).
4. Smart card
In Singapore, a smart card is known as cash
card. In principle, the use of smartcard usage
is similar to ATM cards that we usually used
for shopping, which is when we enter into
transactions to purchase certain goods, the
money directly debited from our account at
the bank. For payments on the internet, the user must have a smart card reader. In use, a
special instrument is connected to the serial
port on the computer. During the transaction,
the smart card must swipe to the tool, so a
computer can read the chip embedded in the
card. For software, used software called e-
wallet. Example web site that has provided for payment smartcard is
http://www.discvault.com.
Although relatively many companies that
have installed the homepage, there is only a
little that use it as a means of commerce trade
online. Most of the homepages it functioned
more as a media information and product
introductions. According Adji Gunawan,
Associate Partner and Group Head of
Technology Competency Andersen Consulting,
in general there are three stages to the e-
commerce, namely: presence, interactivity and
transactions. Today, most company-owned
home in Indonesia only reached the stage
presence, yet at the stage of the transaction. In
the end, technological development and
improvement of internet users in Indonesia will
make m-commerce into a business that
promises.
4. Conclusion Indonesian territory consists of the islands
that have a very large population is an
opportunity to further develop m-commerce as
an alternative way of trading.
With m-commerce, buying and selling
transactions will not be familiar with the
geographical location of a particular region, so
that the community at the eastern tip of
Indonesia will be able to transact with residents
at the western end of Indonesia.
Many factors that face, but with changing times,
the authors believe that someday pile of almost
all the Indonesian people will be familiar with
m-commerce as a model of their trade
transactions.
References Atmojo, W.T., (2005), “E-Commerce dan
perkembangannya di indonesia”, Journal.
n.n., n.t., (2009), Retrieved from
http://dasril.wordpress.com/e-
commerce/pengertian-e-commerce/.
n.n., n.t., (2009), Retrieved from
http://id.wikipedia.org/wiki/M-dagang.
Jusak, (2008), Kreasi Situs Mobile Internet
dengan XHTML MP, Jakarta: Prestasi Pustaka.
Nugroho, A., (2006), E-Commerce, Memahami
Perdagangan Modern di Dunia Maya,
Bandung: Informatika.
Nugroho, A., (2006), Pengantar Ilmu Komputer
dan Sistem Informasi, Bandung: Informatika.
Purbo, O.W., (2000) Mengenal E-Commerce,
Jakarta: PT Elex Media Komputindo.
Purnama, I., (2005), “Sekurity aspect of e-
commerce adoption in Indonesia”, Journal.
Sanusi, A.M., (2001), E-Commerce, Hukum dan
Solusinya, Jakarta: PT. Mizan Grafika Sarana.
Welling, L. & Thomson, L., (2001), PHP and
MySQL Web Development, Indianapolis: Sams
Publishing.
569
The Influence of Marketing Program of JIF’s Brand to Face National and
International Company toward Customer Loyalty
Meriza Hendri, Sari Dewi Oktari
Widyatama University, Bandung, Indonesia
Abstract
Cibaduyut has been known as center of shoe producers. But, a lot of shoes from national or international
company offered to Bandung people. Consequently, shoe industry has high competition but there is a small
company offers JIF’s Brand. This micro enterprise is owned by a house wife. She has a unique marketing
program to win competition and until now, she has loyal customers. Unfortunately, competitors had able to
influence JIF’s customers. The goal of this research is to know and analysis how is the marketing program,
customer loyalty and it’s influence on customer loyalty. Research objects are individual costumer of JIF’S. This
study uses descriptive-verificative method with descriptive and explanatory survey. Sample is 50 customers.
Path analysis is used to analyze data. Marketing mix gives positive influence on customer loyalty.
Simultaneously, product, price, place and promotion influence customer loyalty of JIF’s. It’s too small with
17.8%. Based on analytical to this data, most of factors influence customer loyalty is personal of JIF’s owner.
In a micro business, owner becomes the most important factor influence customers to buy products. Partially,
price becomes the only one factor that influence customer loyalty. Product, place and promotion do not give
influence.
Keywords: micro business, marketing mix, customer loyalty
1. Introduction Indonesian government concerns on shoe
industry which had been introduced since
2008 by involving Mr. Jusuf Kalla, former
Indonesian Vice President to drive national
shoe industry as one of Indonesian main
industry. Indonesian is encouraged to use
national shoe brand than imported branded
(http//www.sctv.co id).
One of shoe center that was developed is
Cibaduyut in Bandung and to make it real, Mr.
Jusuf Kalla allowed his name to be a brand of
shoe that are produced by Cibaduyut shoe
makers. (Http//www.kompas.com).
From the history, Shoe industry has been
known in Bandung and other cities in
Indonesia. Every visitor will come by to
Cibaduyut when they come to Bandung.
Unfortunately, competitions among shoe
brands in Bandung have been becoming higher
and higher. It is also caused by
implementation of ASEAN China Free Trade
Area in 2010. Shoe makers and other shoe
business owners have to face tight competition
from foreign business men especially from
China that has been known for their cheaper
products.
Local government of Bandung has focused
to develop Bandung by appointing Cibaduyut
as shoe center. The goal of this program is to
increase and to introduce that Bandung has
shoe center and Bandung people should come
to this area as well as tourist. One of local
micro company which runs shoe business is
JIF’s. It is owned by a house wife and she set
up it in 1999 when she was still a student in
one of private University, in Bandung. She
was inspired by demand of her environment on
shoes, especially her friends and lecturers.
She realizes that her company is a micro
scales, she uses unique business strategy that
is suited to her capability. One of unique
strategy is she has no factory and no store to
display her products. The only one she has is
only her small car that accompanies her to
offer her products everywhere. Meanwhile, her
house is used for making design, print and
delivery it to the customers.
Another uniqueness of JIF’s business is
the way she produces her products. She
cooperates with one of home industry and
order to produce shoes based on her request. It
does not need big investment to run business
like this.
Third uniqueness is the marketing
program. Even it is a small company, but the
owner uses marketing concept to market her
products.
Philip Kotler dan Kevin Keller said that
marketing is about identifying and meeting
human needs. One of the shortest good
definitions of marketing is “meeting needs
570
profitably” (Kotler and Keller, 2009: 45).
Marketing program can be divided into
product, price, place and promotion. All of
these variables are used by JIF’s to market the
product.
Product offered by JIF’s is shoe for man
and ladies and it is made of best quality
material. Design of shoe is latest mode and
consumers can order based on their need and
want.
Colors of the shoe can be chosen by
customers because JIF’s offers more than 20
kinds of colors. It is different from other
company that offers limited alternatives.
Sometimes, they just offer what they have
produced and cannot fulfilled each customer
demand. Other advantages of JIF’s shoe are
quality sew of the shoe. Even the shoe was
often watered when rainy days, the shoe won’t
be broken.
Price of JIF’s shoe is competitive
compared to other brands. Shoe for man is
from Rp. 200.000 to 250.000, while for
woman is from Rp. 175.000 to
Rp.225.000/pair. The differences of this shoe
to others are product quality, designs and
models. Those variables are better than
competitors. Payment of shoe is not directly
when consumer orders the products. They can
pay a week after receiving the product and it
becomes an interested point for the customers
to buy JIF’s shoe.
Distribution is one of the most important
things that is considered by JIF’s owner.
Customers do not have to pick up the shoe but
it will be delivered to the customers. Delivery
system is very important and become value
added while owners offer the product to
customers.
Promotion is not the main tools for owners
to introduce products. No advertisement, no
catalog, no publicity and no sales promotion.
The only one promotional activity is personal
selling that is executed directly by owners
from campus to campus and office to office.
Another way is by using facebook to
communicate the product.
Until now, amount of JIF’s customers are
276 that is recorded on JIF’s book. They are
from different jobs, different ages and
different educational background. They buy
JIF’s product not only one pair but also more
than one pairs.
Unfortunately, owner faces a competition
from other products that are offered by
distributors to the same customers. They offer
with lower price but quality is worse than
JIF’s shoe. Implication of this condition is
some existing customers moved to competitors
and do not buy JIF’s Shoe. But, it didn’t take
for long time because after a month, they
moved back to JIF’s again and order the
product.
This condition is supposed related to
customer loyalty on JIF’s shoe and there for,
research question are how is the consumer
response on marketing mix program, how is
consumer loyalty and how is the influence of
marketing mix toward customer loyalty.
The goal of this research are to know and
analysis marketing program, customer loyalty
and the influence of marketing program
toward customer loyalty.
571
2. Relevant Theories Marketing Management is the process of
planning and executing the conception,
pricing, promotion, and distribution of ideas,
goods, and services to create exchange that
satisfy individuals and organizations goals.”
(http//www.marketingpower.com/library/dicti
onary). Kotler dan Keller said that marketing
is an organizational function and a set of
process for creating, communicating, and
delivering value to customers and for
managing customer relationships in ways that
benefit the organization and its stakeholders
(Kotler & Keller, 2009: 45).
Marketing Mix is the set of marketing
tools that the firm uses to pursue is marketing
objectives in the target market (Kotler, 2006 :
425).
Marketing program becomes marketing
stimuli at the customer purchase decision.
Post purchase behavior is loyalty and
loyalty is defined as non random purchase
expressed over time by some decision making
unit (Griffin, 2002).
Lovelock said that loyalty is a customer’s
commitment to continue patronizing a specific
firm over an extended period time (Lovelock,
2007: 629)
Griffin describes four characteristic of
loyal customer:
a. Makes regular Report Purchase.
b. Purchases across product and service lies.
c. Refers other
d. Demonstrates animmunity to the full of
the competition (Griffin, 2002: 31).
Based on the literature review, research
paradigm can be seen below:
Figure 2. Research Paradigm
Hyphoteses of this research is marketing
mix has positive influence on customer loyalty
simultaneously. While minor hypothesis are
a. Product has positive influence on
customer loyalty
b. Price has positive influence on customer
loyalty
c. Place has positive influence on customer
loyalty
d. Promotion has positive influence on
customer loyalty
3. Design, Model, and Implementation Research object is JIF’s customers who
consist of Lecturers, students and employees
in Bandung. Management of JIF’s is also
research object.
This study uses descriptive-verificative
method with descriptive and explanatory
survey. Path analysis is used to analyze data.
Sampling technique is simple random
sampling with amount sample will be based on
276 populations and uses formula to calculate
sample:
1 (d) N
N n
2+
=
N : Amount of population
n : Sample
d : Precision
n = 276/[(276 x (10%)2) + 1] = 49.6
Minimum respondent is 50 customers.
Based on questioner distribution and
calculated by SPSS 15, validity of each
indicator is above 0.3 which means the
instruments are valid. While the reliability is
above 0.7 and it indicates questioners are
reliable.
4. Implication/Result 4.1 Profile
Profiles of respondents are based on sex,
ages, job, monthly income and outcome.
4.1.1 Sex
It consists of male and female of
respondents:
Source: Data collection, March-April 2010.
Graphic 1. Sex
Customer
Loyalty
Marketing Mix
1. Product
2. Price
3. Place
4. Promotion
572
92% of respondents are female and 8% are
male. It indicates majority of JIFS customers
is female who buys shoes. But, they also buy
shoe for their husband, brother or son. While
8% of respondents are man buys shoes for
their wives.
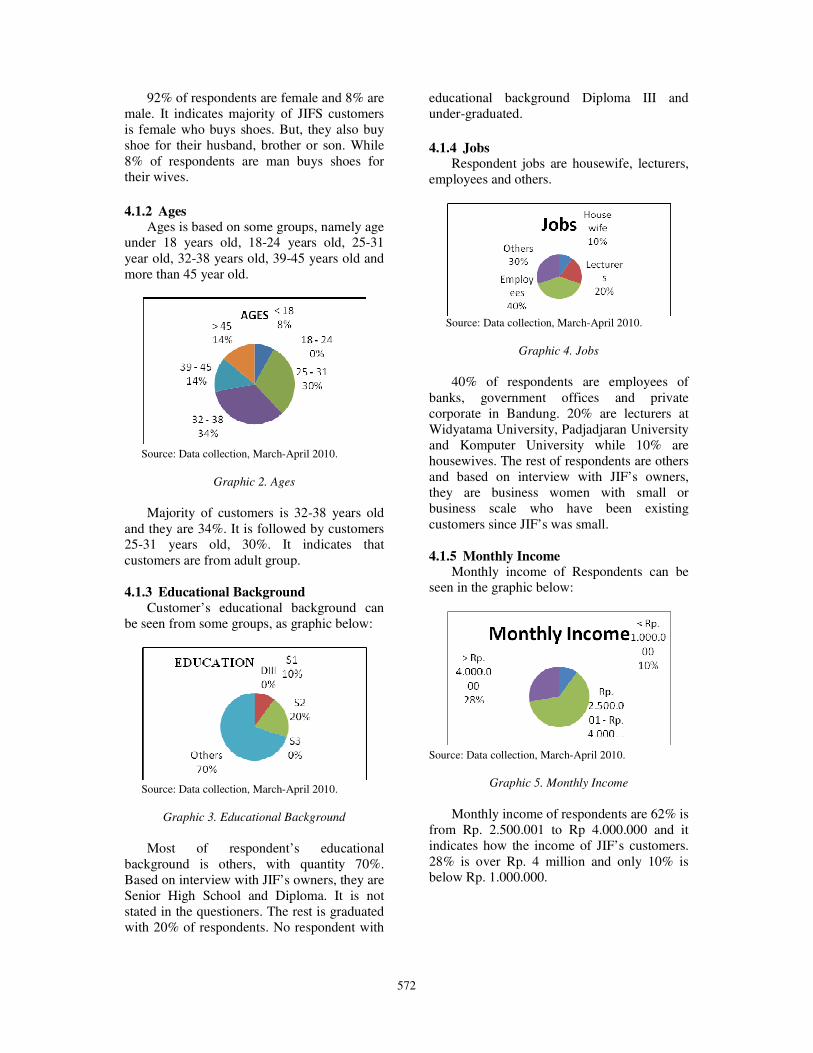
4.1.2 Ages
Ages is based on some groups, namely age
under 18 years old, 18-24 years old, 25-31
year old, 32-38 years old, 39-45 years old and
more than 45 year old.
Source: Data collection, March-April 2010.
Graphic 2. Ages
Majority of customers is 32-38 years old
and they are 34%. It is followed by customers
25-31 years old, 30%. It indicates that
customers are from adult group.
4.1.3 Educational Background
Customer’s educational background can
be seen from some groups, as graphic below:
Source: Data collection, March-April 2010.
Graphic 3. Educational Background
Most of respondent’s educational
background is others, with quantity 70%.
Based on interview with JIF’s owners, they are
Senior High School and Diploma. It is not
stated in the questioners. The rest is graduated
with 20% of respondents. No respondent with
educational background Diploma III and
under-graduated.
4.1.4 Jobs
Respondent jobs are housewife, lecturers,
employees and others.
Source: Data collection, March-April 2010.
Graphic 4. Jobs
40% of respondents are employees of
banks, government offices and private
corporate in Bandung. 20% are lecturers at
Widyatama University, Padjadjaran University
and Komputer University while 10% are
housewives. The rest of respondents are others
and based on interview with JIF’s owners,
they are business women with small or
business scale who have been existing
customers since JIF’s was small.
4.1.5 Monthly Income
Monthly income of Respondents can be
seen in the graphic below:
Source: Data collection, March-April 2010.
Graphic 5. Monthly Income
Monthly income of respondents are 62% is
from Rp. 2.500.001 to Rp 4.000.000 and it
indicates how the income of JIF’s customers.
28% is over Rp. 4 million and only 10% is
below Rp. 1.000.000.
573
4.2 Marketing Mix
4.2.1 Product
Product is a bundle of physical, service
and symbolic attributes designed to satisfy a
customer’s want and needs (Boone and Kurtz,
2005: 305).
Product of JIF’s will be seen from some
indicators related to JIF’s. Some of them are
model, design, raw material, brand name,
packaging and services. All of these indicators
are used to describe JIF’s product. Customer’s
response can be seen at table below:
Table 1. Customer’s Response on JIF’s Product
No. Indicators Score Meaning
1 Suitability of products
with customer's need 221 very suit
2 Product's model 216 very
interested
3 Suitability of size 207 Suits
4 Product's design 213 very
interested
5 Easiness to remember
JIF's brand 206 Easy
6 Service 215 very
interested
7 Durability of products
raw material 213
very
durable
8 Durability of product
sewing 208 durable
9 Conformance 213 very
comfort
10 Packaging 191 Interest
Source: Data collection, March-April 2010.
Respondent said that product and their
need is very suit. Suitability is related to their
need to the shoe which generally is used for
working. While size is only responded suit to
them. Product model, product design and
service offered by JIF’s owner are supposed
very interested. Customers can order shoe
model as well as design based on their interest.
Besides that, JIF’s owner also offers latest
model and design to the customer. It’s the
reason why customers are very interested to
the model and design. Unfortunately,
packaging is only responded as interested and
it’s the lowest score. Based on our interview to
JIF’s owner, she does not pay attention to
packaging because she thinks that the most
important to the customers is product quality,
design and model.
Customer is easy to remember JIF’s brand.
When they hear or see JIF’s brand, they
directly remember product quality offers JIF’s.
Durability of JIF’s shoe is responded very
durable for the raw material while durable for
shoe sew. Quality is the key point for JIF’s to
compete with others. All JIF’s products are
guaranted by JIF’s owners since the beginning.
4.2.2 Price
American Marketing Association: price is
the formal ratio that indicates the quantities of
money goods or services needed to acquire a
given quantity of goods or services
(www.marketingpower.com). Customer
respond to price is
Table 2. Customer’s Rresponse on JIF’s Price
No. Indicators Score Meaning
1 Price 179 cheap
2 Achievability of
price 200 achievable
3 Suitability of
price and quality 210 suits
4 Clearness of price 211 very clear
5 Discount 126 not clear
6 Payment period 216 very interested
7 Payment method 215 very interested
Source: Data collection, March-April 2010.
Respondents said that the price of JIF’s is
cheap and they can buy it. JIF’s price suits to
the product quality Compared to quality of raw
material and sew. Payment period and
payment method is responded to be very
interested since customers do not have to pay
directly but a week after they order the shoe.
Information about price is very clear to
customers because they know how much the
costs of each pair. Unfortunately, discount is
supposed not clear to them. After doing and
interview to JIF’s owner, she does not give
discount to every customer but to anyone who
wants to help her becoming a connector to
new market. That’s why most of customers do
not know about discount.
4.2.3 Place
Marketing channels are set of
interdependent organizations involved in the
process of making a product or service
available for use or consumption (Kotler &
Keller, 2009: 787). Customer respond to place
is
574
Table 3. Customer’s Response on JIF’s Place
No. Indicators Score Meaning
1 Easiness of getting
products 183 easy
2 Delivery system 210 interest
Source: Data collection, March-April 2010.
Respondents said that the feel easy to get
JIF’s product and also interested to the
delivery system. JIF’s owners deliver the
product directly to the customers.
4.2.4 Promotion Promotion means “to move forward” and
in marketing, promotion has a similar
meaning, namely to motivate (or move, in a
sense) customers to action (Shimp, 1993: 6).
The objectives of promotion are
1. Informing prospective customers about the
product, services and terms of sale
2. Persuading people to prefer particular
products and brands, shop in certain
stores, attend particular entertainment
events, and perform a variety of other
behavior
3. Inducing action from customers such that
buying behavior is directed toward the
marketer’s offering and is undertaken
immedietly rather than delayed (Shimp,
1993:7)
JIF’s management is only uses personal
selling and face book for promotion and the
response can be seen below:
Table 4. Customer’s Response on JIF’s Promotion
No. Indicators Score Meaning
1 Personal selling 216 very
interested
2 Promotion through
facebook 135 less interest
Source: Data collection, March-April 2010
Customer is very interested on personal
selling of JIF’s owners. Unfortunately,
promotion through facebook is responded less
interested since it is new and has not been
familiar yet to the customers.
4.3 Customer Loyalty
JIF’s customer loyalty can be seen through
four indicators
Table 5. Customer Loyalty
No. Indicators Score Meaning
1 Repeat purchase 210 agree
2 Buy other products 209 agree
3 Recommendation to
others 210 agree
4 Refuse competitor's
products 132 less agree
Source: Data collection, March-April 2010.
Respondents agree that they do repeat
purchase. It indicates that customers buy JIF’s
product after they buy the first product. They
also buy product besides shoe such as sandals
that offered by JIF’s.
Recommendation to others is also
executed by respondents. Based on interview
with JIF’s owners, customers often do word of
mouth among customers and to others. Most
of them recommends to friends and family.
Unfortunately, they less agree on
statement that they refuse competitor’s
product. It means that they will buy other
competitor product and it will harm JIF’s.
4.4 The Influence of Marketing Mix
towards Customer Loyalty
4.4. The Influence of Marketing Mix
towards Customer Loyalty
Simultaneously
Hyphoteses:
H0: Marketing mix does not give positive
influence on customer loyalty
H1: Marketing mix gives positive influence on
customer loyalty
By using SPSS 15, the result of
questioners:
Table 6. ANNOVA
ANOVAb
.964 4 .241 2.437 .061a
4.448 45 .099
5.411 49
Regression
Residual
Total
Model1
Sum ofSquares df Mean Square F Sig.
Predictors: (Constant), x4, x3, x1, x2a.
Dependent Variable: yb.
Significance level is smaller than 0.05, so
H nul is rejected and H1 is accepted. It means
marketing mix gives positive influence on
customer loyalty.
575
The influence of marketing mix toward
customer loyalty can be seen from
determination coefficient (R square).
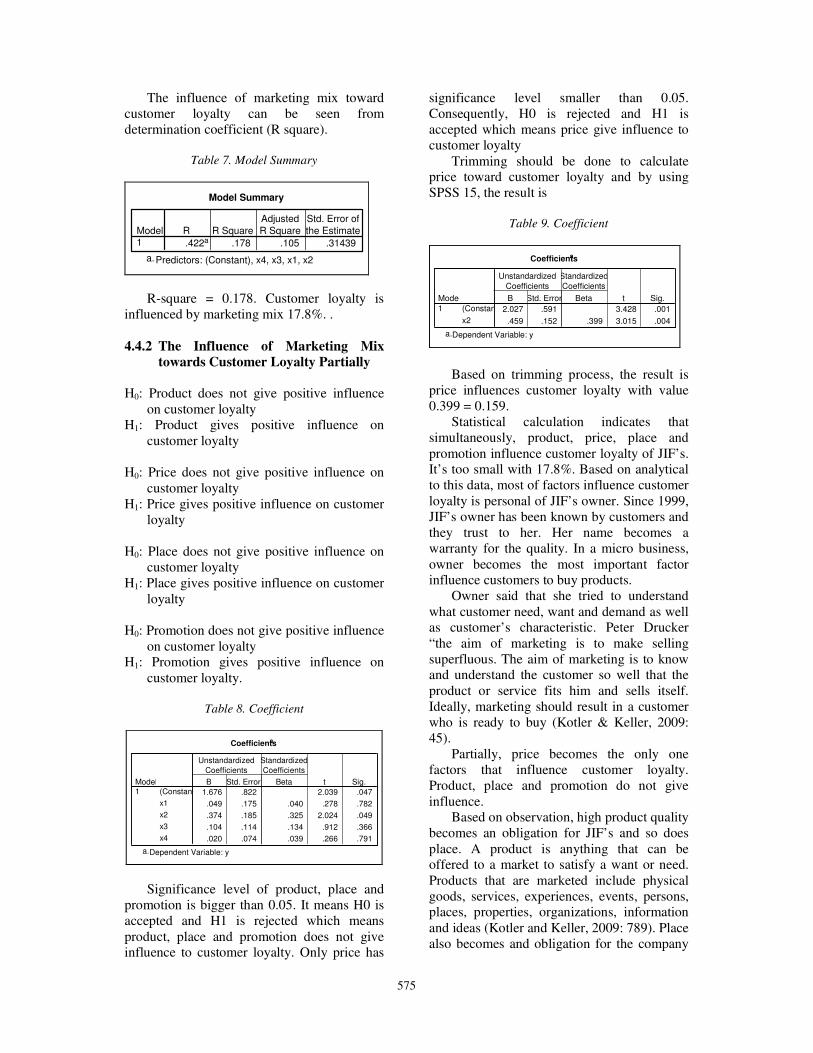
Table 7. Model Summary
Model Summary
.422a .178 .105 .31439
Model1
R R SquareAdjustedR Square
Std. Error ofthe Estimate
Predictors: (Constant), x4, x3, x1, x2a.
R-square = 0.178. Customer loyalty is
influenced by marketing mix 17.8%. .
4.4.2 The Influence of Marketing Mix
towards Customer Loyalty Partially
H0: Product does not give positive influence
on customer loyalty
H1: Product gives positive influence on
customer loyalty
H0: Price does not give positive influence on
customer loyalty
H1: Price gives positive influence on customer
loyalty
H0: Place does not give positive influence on
customer loyalty
H1: Place gives positive influence on customer
loyalty
H0: Promotion does not give positive influence
on customer loyalty
H1: Promotion gives positive influence on
customer loyalty.
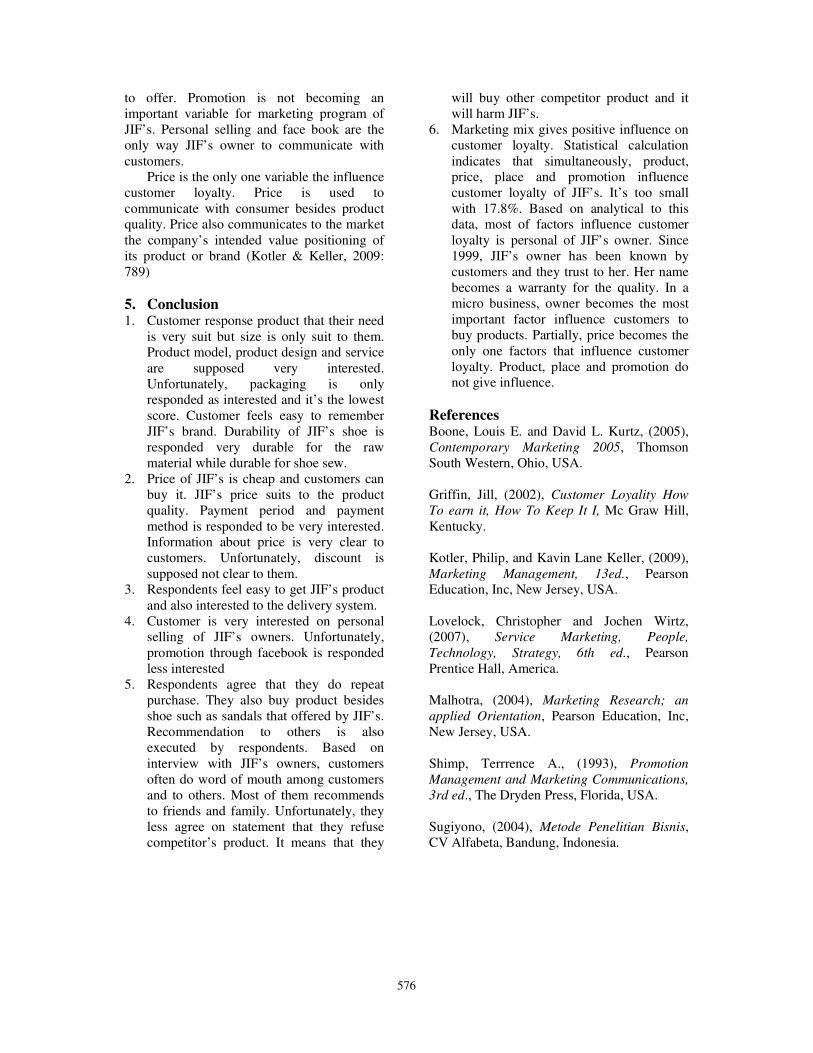
Table 8. Coefficient
Coefficientsa
1.676 .822 2.039 .047
.049 .175 .040 .278 .782
.374 .185 .325 2.024 .049
.104 .114 .134 .912 .366
.020 .074 .039 .266 .791
(Constant)
x1
x2
x3
x4
Model1
B Std. Error
UnstandardizedCoefficients
Beta
StandardizedCoefficients
t Sig.
Dependent Variable: ya.
Significance level of product, place and
promotion is bigger than 0.05. It means H0 is
accepted and H1 is rejected which means
product, place and promotion does not give
influence to customer loyalty. Only price has
significance level smaller than 0.05.
Consequently, H0 is rejected and H1 is
accepted which means price give influence to
customer loyalty
Trimming should be done to calculate
price toward customer loyalty and by using
SPSS 15, the result is
Table 9. Coefficient
Coefficientsa
2.027 .591 3.428 .001
.459 .152 .399 3.015 .004
(Constant)
x2
Model1
B Std. Error
UnstandardizedCoefficients
Beta
StandardizedCoefficients
t Sig.
Dependent Variable: ya.
Based on trimming process, the result is
price influences customer loyalty with value
0.399 = 0.159.
Statistical calculation indicates that
simultaneously, product, price, place and
promotion influence customer loyalty of JIF’s.
It’s too small with 17.8%. Based on analytical
to this data, most of factors influence customer
loyalty is personal of JIF’s owner. Since 1999,
JIF’s owner has been known by customers and
they trust to her. Her name becomes a
warranty for the quality. In a micro business,
owner becomes the most important factor
influence customers to buy products.
Owner said that she tried to understand
what customer need, want and demand as well
as customer’s characteristic. Peter Drucker
“the aim of marketing is to make selling
superfluous. The aim of marketing is to know
and understand the customer so well that the
product or service fits him and sells itself.
Ideally, marketing should result in a customer
who is ready to buy (Kotler & Keller, 2009:
45).
Partially, price becomes the only one
factors that influence customer loyalty.
Product, place and promotion do not give
influence.
Based on observation, high product quality
becomes an obligation for JIF’s and so does
place. A product is anything that can be
offered to a market to satisfy a want or need.
Products that are marketed include physical
goods, services, experiences, events, persons,
places, properties, organizations, information
and ideas (Kotler and Keller, 2009: 789). Place
also becomes and obligation for the company
576
to offer. Promotion is not becoming an
important variable for marketing program of
JIF’s. Personal selling and face book are the
only way JIF’s owner to communicate with
customers.
Price is the only one variable the influence
customer loyalty. Price is used to
communicate with consumer besides product
quality. Price also communicates to the market
the company’s intended value positioning of
its product or brand (Kotler & Keller, 2009:
789)
5. Conclusion 1. Customer response product that their need
is very suit but size is only suit to them.
Product model, product design and service
are supposed very interested.
Unfortunately, packaging is only
responded as interested and it’s the lowest
score. Customer feels easy to remember
JIF’s brand. Durability of JIF’s shoe is
responded very durable for the raw
material while durable for shoe sew.
2. Price of JIF’s is cheap and customers can
buy it. JIF’s price suits to the product
quality. Payment period and payment
method is responded to be very interested.
Information about price is very clear to
customers. Unfortunately, discount is
supposed not clear to them.
3. Respondents feel easy to get JIF’s product
and also interested to the delivery system.
4. Customer is very interested on personal
selling of JIF’s owners. Unfortunately,
promotion through facebook is responded
less interested
5. Respondents agree that they do repeat
purchase. They also buy product besides
shoe such as sandals that offered by JIF’s.
Recommendation to others is also
executed by respondents. Based on
interview with JIF’s owners, customers
often do word of mouth among customers
and to others. Most of them recommends
to friends and family. Unfortunately, they
less agree on statement that they refuse
competitor’s product. It means that they
will buy other competitor product and it
will harm JIF’s.
6. Marketing mix gives positive influence on
customer loyalty. Statistical calculation
indicates that simultaneously, product,
price, place and promotion influence
customer loyalty of JIF’s. It’s too small
with 17.8%. Based on analytical to this
data, most of factors influence customer
loyalty is personal of JIF’s owner. Since
1999, JIF’s owner has been known by
customers and they trust to her. Her name
becomes a warranty for the quality. In a
micro business, owner becomes the most
important factor influence customers to
buy products. Partially, price becomes the
only one factors that influence customer
loyalty. Product, place and promotion do
not give influence.
References Boone, Louis E. and David L. Kurtz, (2005),
Contemporary Marketing 2005, Thomson
South Western, Ohio, USA.
Griffin, Jill, (2002), Customer Loyality How
To earn it, How To Keep It I, Mc Graw Hill,
Kentucky.
Kotler, Philip, and Kavin Lane Keller, (2009),
Marketing Management, 13ed., Pearson
Education, Inc, New Jersey, USA.
Lovelock, Christopher and Jochen Wirtz,
(2007), Service Marketing, People,
Technology, Strategy, 6th ed., Pearson
Prentice Hall, America.
Malhotra, (2004), Marketing Research; an
applied Orientation, Pearson Education, Inc,
New Jersey, USA.
Shimp, Terrrence A., (1993), Promotion
Management and Marketing Communications,
3rd ed., The Dryden Press, Florida, USA.
Sugiyono, (2004), Metode Penelitian Bisnis,
CV Alfabeta, Bandung, Indonesia.
577
Brand Performance: Independent vs Company-Owned
Brand Community
Antonius Benipra Adinugraha, Amalia E. Maulana
Binus Business School, Jakarta, Indonesia
Abstract
Strategi pemasaran berbasis brand community memiliki keuntungan tersendiri. perusahaan mendapatkan
sarana promosi gratis yaitu melallui word-of-mouth dari anggota komunitas, selain itu perusahaan juga dapat
mendapat data konsumen dengan lebih mudah. walaupun dengan berbagai keuntungan yang ditawarkan
dengan adanya online brand community ini, anggota dari brand community tidak dapat dianggap sebagai suatu
komunitas yang homogen, sebab bagaimana pun juga masing-masing individu dalam komunitas memiliki
motivasi yang berbeda untuk bergabung dalam suatu brand community.
Pertanyaan yang muncul dikalangan pemilik brand adalah manakah yang lebih menguntungkan? Mendirikan
dan mengelola sendiri komunitas berbasis brand ini atau hanya cukup mendukung dan mensponsori brand
community yang telah mengusung brand mereka?
Penelitian dilakukan pada dua tipe komunitas brand. Yang pertama adalah yang komunitas E30 Register
BMWCCI, yaitu komunitas pendukung brand yang independen. Kedua, komunitas brand yang dibentuk oleh
perusahaan sendiri, yaitu Yaris Groovynations.
Pada kedua komunitas tersebut diuji brand performance dari sisi attitude toward brand, brand involvement,
brand loyalty, community participation dan online sense of community.
Hasil penelitian menunjukkan bahwa terdapat perbedaan brand performance yang signifikan diantara dua jenis
komunitas ini. Komunitas independen terbukti lebih tinggi brand performance nya. Ini penting diketahui oleh
para brand owner yang sedang mempertimbangkan untuk membuat sendiri komunitas brand nya.
Keywords: brand community, brand performance, attitude toward brand, brand involvement, brand loyalty,
community participation, online sense of community
1. Introduction Identitas sebuah komunitas merupakan hal
yang sangat penting untuk menunjukkan
eksistensinya di masyarakat. Dalam hal ini,
identitas komunitas yang dimaksud adalah
sebuah komunitas dalam konteks pemasaran
yang bukan hanya representasi dari perusahaan
atau merek produk tertentu, namun juga komunitas sebagai lambang sebuah loyalitas,
fanatisme, sekaligus sarana mempererat
hubungan antara sesama anggota.
Brand Community, namanya. Sebuah
strategi pemasaran yang memiliki keunikan
tersendiri. Brand Community dapat berupa
komunitas yang dibentuk oleh pemilik merek
maupun dimulai secara independen oleh orang-
orang yang memiliki kedekatan emosional
terhadap merek tertentu. Sesuai dengan
pengertiannya, segala komunitas yang mengarah
pada suatu merek tertentu dapat dikatakan
sebagai komunitas merek. Baik komunitas tersebut dikelola oleh perusahaan pemilik merek
maupun dimulai secara independen oleh orang-
orang yang fanatik terhadap suatu merek
(Muniz dan O’Guinn, 2001). Meski anggota
sebuah Brand Community tidak dapat disebut
sebagai sebuah komunitas yang homogen,
karena bergabungnya tiap-tiap individu
memiliki motivasi yang berbeda, keanggotaan
dalam sebuah Brand Community memberi
manfaat yang lebih bagi anggotanya, dan tidak
terkecuali keuntungan juga bagi merek yang menaunginya.
Manfaat Brand Community bagi perusahaan
antara lain: produk yang mereka luncurkan
dapat dipromosikan lebih luas, perusahaan
mendapatkan promosi gratis yaitu melalui word-
of-mouth dari anggota komunitas, sekaligus
mengetahui perilaku pelanggan dan bagaimana
mereka berinteraksi dengan produk mereka.
Sebaliknya, bagi anggota komunitas tersebut,
berbagai fasilitas ditawarkan baik yang
didukung oleh perusahaan yang bersangkutan
maupun fasilitas mandiri yang dilakukan dari,
oleh, dan untuk anggota komunitas tersebut.
Brand Community, sebagai sarana
komunikasi antara anggota menjadi lebih mudah
dengan semakin berkembangnya teknologi
informasi secara online saat ini. Sicilia dan
Palazon (2007), mengartikan online brand
community sebagai sekelompok individual
dengan persamaan minat terhadap merek tertentu dan berkomunikasi satu sama lain
melalui media elektronik yang difasilitasi oleh
578
perusahaan pemilik merek. Adanya brand
community online memfasilitasi anggota
komunitas untuk dapat selalu terhubung dan
meningkatkan kedekatan emosional baik antar
sesama anggota komunitas maupun dengan perusahaan pemilik merk. Meski sebuah
penelitian yang dilakukan oleh Kozinets (1999)
menunjukkan bahwa hubungan antara anggota
komunitas menjadi lebih penting daripada
hubungan anggota komunitas dengan
perusahaan pemilik brand.
Dari pentingnya sebuah eksistensi brand
community di masyarakat sebagai sebuah
strategi pemasaran, baik komunitas tersebut
adalah komunitas independen maupun
komunitas yang dibentuk oleh pemilik brand,
muncul pertanyaan di kalangan pemilik brand,
manakah yang lebih menguntungkan?
Mendirikan dan mengelola sendiri komunitas
berbasis brand ini atau hanya cukup mendukung
dan mensponsori brand community yang telah
mengusung brand mereka?
Tujuan dari penelitian ini adalah untuk
membandingkan antara dua jenis brand
community, yaitu independent brand community dan company brand community
dengan melakukan analisis brand performance
dari sisi attitude toward brand, brand
involvement, brand loyalty, community
participation dan online sense of community
yang diharapkan dapat menjadi acuan bagi para
pemimpin perusahaan yang akan menerapkan strategi pemasaran berbasis komunitas dan
menjadi masukan bagi perusahaan yang telah
menerapkannya.
Penelitian akan dilakukan pada dua
komunitas maya yang mewakili dua brand yang
ada di Indonesia. Yaitu Yaris Groovynations
sebagai representasi brand community yang
didirikan dan dikelola oleh perusahaan sebagai
wadah bagi pengguna kendaraan Toyota Yaris,
dan E30 Register BMWCCI sebagai
representasi brand community independen
untuk pencita kendaraan BMW. Kedua brand
community tersebut terpilih sebagai fokus
penelitian karena dianggap sebagai brand
community mapan yang ditandai dengan
dilakukannya ritual komunitas secara rutin.
2. Literature Review Penelitian yang mengangkat mengenai
keberadaan brand community telah diungkap
dalam beberapa penelitian seperti Brand
Community (Muniz dan O’Guinn, 2001),
Building Brand Community (McAlexander,
2002), dan beberapa penelitian lain Quester dan
Lim (2003), Cova dan Pace (2006).
Berikut akan dijelaskan definisi dari setiap
construct yang dipakai dalam studi ini, yaitu
attitude toward the brand, brand involvement, brand loyalty, serta online sense of community.
Lalu menjelaskan berbagai pemikiran tentang
hubungannya dengan online komunitas yang
lebih menguntungkan bagi perusahaan.
2.1 Attitude toward Brand Apa yang membuat konsumen bergabung ke
dalam sebuah brand community? Pertanyaan ini
telah banyak ditanyakan oleh peneliti pemasaran
dengan sangat bervariasi. Namun heterogenitas
motivasi dari konsumen-konsumen yang
tergabung dalam sebuah brand community
kiranya akan membuat jawaban pertanyaan
diatas akan menjadi sangat variatif.
Ouwersloot dan Schroder (2006)
mengusulkan empat kemungkinan motivasi
konsumen untuk bergabung dalam komunitas,
yang diambil dari berbagai literatur perilaku
konsumen.
• Mendapatkan ketenteraman hati akan
kualitas. Selain itu, brand community
menyediakan suatu hubungan ke perusahaan
sehingga konsumen dapat merasa lebih
tenang. Dalam prakteknya, komunitas dapat
berfungsi sebagai sarana untuk bertukar
pengalaman mengenai pemeliharaan,
perbaikan, penyesuaian, atau bahkan
penggunaan dasar suatu produk.
• Menyatakan keterlibatan mereka dengan
produk dari merek tersebut. Kategori
produk dengan keterlibatan yang tinggi
adalah dimana biasanya konsumen ingin
merasa terhubung (Zaichkowsky, 1985) dan
bahkan melebihi hanya pada saat konsumsi
saja. Dalam hal ini, komunitas berfungsi menguatkan atau memperpanjang
pengalaman mengkonsumsi.
• Konsumen mungkin memerlukan konsumsi
bersama dan oleh karena itu mereka
bergabung dengan brand community.
Produk yang dikonsumsi bersama biasanya
lebih cocok untuk membangun suatu
komunitas (Schau dan Muniz, 2002), yang
berfungsi sebagai semacam tempat
pertemuan di mana anggota dapat
mengkonsumsi produk secara bersama.
• Keinginan mengikuti gaya hidup dari fungsi
simbolik merek tersebut. Contohnya untuk
merek dengan makna simbol yang penting,
579
seperti Harley-Davidson, maka komunitas
dapat memperkuat makna tersebut dan
menawarkan tempat pertemuan di mana
anggota dapat menyatakan kesetiaan mereka
kepada simbol tersebut.
2.2 Brand Involvement
Involvement didefinisikan sebagai salah
satu dari persepsi sudut pandang pribadi
relevansinya terhadap obyek (Krugman, 1967;
Mitchell, 1979). Konsumen akan lebih
termotivasi untuk lebih mengenal keunikan
sebuah produk jika mereka merasa telah terlibat
pada sebuah merek tertentu. Motivasi inilah
yang menjadi modal utama bagi konsumen
untuk ikut berpartisipasi dalam sebuah brand
community.
Menjadikan konsumen untuk merasa terlibat
pada sebuah brand, perusahaan sangat perlu
untuk memandang segi cognitive dan affective
dari konsumen. Apabila keterlibatan cognitive
mengarah kepada pencarian informasi suatu
fitur produk, maka keterlibatan affective lebih
berfokus pada kualitas simbolik dan kesan dari
suatu produk (Mittal, 1987). Pemahaman akan kedua hal ini akan memberikan pengaruh positif
terhadap sebuah merek demi meningkatkan
pangsa pasar, pangsa konsumen, dan
profitabilitas.
2.3 Brand Loyalty
Definisi brand loyalty sebagai komitmen kuat konsumen untuk kembali membeli produk
atau penawaran kembali berlangganan layanan
secara konsisten di masa yang akan datang,
sehingga menyebabkan pembelian berulang
merek yang sama atau seperangkat produk,
tanpa dipengaruhi situasi (Oliver, 1999). Meski
demikian, pembelian berulang hanya bersifat
penerimaan senentara dari konsumen.
Pembelian berulang diperluas oleh pendapat
Jacoby dan Kyner (1973) mengenai konsep
loyalitas merek behavioral sebagai perilaku
konsumen yang membeli produk secara
berulang dan loyalitas attitudinal yang mewakili
komitmen konsumen untuk membeli produk
yang sama dengan mempertimbangkan nilai-
nilai unik yang terdapat pada sebuah produk.
Tyebjee (1977) menunjukkan bahwa konsumen
dengan keterlibatan yang rendah dicirikan oleh
rendahnya loyalitas merek dan selalu mencari
alternatif. Dia berpendapat bahwa semakin tinggi keterlibatan dengan suatu merek, maka
semakin besar komitmen, dan bahkan loyalitas
terhadap merek. Hal tersebut sejalan dengan
pentingnya brand involvement, sehingga
perusahaan memiliki kewajiban untuk
melibatkan konsumen dalam brand yang
dimilikinya untuk menguatkan loyalitas
konsumen.
2.4 Community Participation
Community participation adalah elemen
penting untuk menjaga keberlangsungan suatu
community (Koh dan Kim, 2004). Partisipasi
disini dapat mengembangkan rasa kebersamaan
sebagai sarana untuk saling bertukar pandapat,
informasi, dan memberikan dukungan
emosional antara anggota komunitas. Hal – hal
inilah yang menjadi salah satu tujuan para
pendiri sebuah brand community, karena dari
kegiatan inilah pengenalan anggota terhadap
komunitas akan terdorong dan akibatnya nilai
dari mengikuti komunitas dapat ditingkatkan
(Algesheimer et.al., 2005). Menurut Ridings
(2002) bahwa tingkat respon anggota komunitas
adalah kunci untuk meningkatkan partisipasi
anggota komunitas lainnya.
2.5 Online Sense of Community Beberapa penelitian terbaru yang telah
mengangkat mengenai online sense of
community diantaranya: Brand Community
(Muniz dan O’guinn, 2001); Sense of
community: an exploratory study of US
consumers of financial services (Fraering dan
Minor, 2005); Exploring Sense of Community in the Online Environment: Using Netnography
(Maulana dan Krisnawati, 2009).
Dalam penelitian Muniz dan O’guinn
(2001) dikatakan bahwa sense of community
mempunyai 3 komponen dasar yaitu:
1. Consciousness of kind
Para anggota komunitas merasakan
hubungan yang erat berkaitan dengan suatu
merek, tetapi yang lebih penting adalah
mereka merasakan hubungan yang lebih
erat satu sama lain.
2. Ritual and traditions
Hal ini mewakili proses sosial utama
dimana arti sebuah komunitas direproduksi
dan disebarkan di dalam maupun di luar
komunitas.
3. Moral responsibility
Merupakan apa yang kemudian dapat
menghasilkan tindakan kolektif dan
berkontribusi terhadap meleburnya suatu kelompok
580
3. Metodologi Riset Tujuan terbentuknya brand community yang
dimulai secara independen oleh konsumen dapat
beragam. Mulai dari sebagai sarana pertukaran
informasi sesama pengguna merek yang sama,
sampai sebagai sarana untuk menyerang
perusahaan pemilik merek. Meski kedua jenis
komunitas ini memiliki tujuan dan latar
belakang yang berbeda dalam pendiriannya,
namun pada prinsipnya suatu komunitas dapat
bertahan jika terdapat komitmen dari
anggotanya dan mendapatkan dukungan dari
perusahaan pemilik brand (bagi company brand
community), pada akhirnya, keberlangsungan
suatu brand community akan memberikan
manfaat kepada kedua belah pihak baik
konsumen dan company.
Tahapan penelitian yang dilakukan untuk
membandingkan antara kedua brand community
tersebut adalah:
• Melakukan studi literatur mengenai
penelitian-penelitian yang mengangkat
mengenai online brand community.
• Menentukan desain penelitian yang
digunakan dalam penelitian ini. Sehubungan
dengan topik permasalahan yang dibahas,
maka penelitian ini dilakukan secara
deskriptif kuantitatif non kausal, sehingga
didapatkan perbedaab antara kedua jenis
brand community
• Menentukan instrumen penelitian.
Instrumen yang dipakai diambil dari
beberapa variabel yang pernah dipakai
dalam penelitian-penelitian sebelumnya untuk mendapatkan karakteristik dari brand
community. Instrumen tersebut kemudian
disusun dalam kedalam sebuah table untuk
mempermudah indentifikasi variabel-
variabel yang ada.
• Menentukan brand community yang akan
diteliti dan melakukan survey. Komunitas
tidak terbatas pada jenis produk tetapi syarat
dasar yang harus dipenuhi bahwa komunitas
tersebut aktif dan “hidup”. Hasil dari
kuesioner kemudian dianalisis dan dipadukan dengan konsep yang ada guna
mendapatkan hasil analisis yang tepat dan
akurat.
3.1 Independent Brand Community BMW Seri 3 yang lebih dikenal dengan
kode E30, sejak peluncurannya di tahun 1986
ini hingga sekarang masih dekat di hati para
penggemarnya. Dengan brand Eropa yang sudah
terjamin kualitasnya, mesin yang mumpuni pada
jamannya serta desain menarik menjadikan
mobil tipe ini sangat diidolakan para remaja.
Seiring dengan berjalannya waktu. Mobil
jenis ini tidak kehilangan pecintanya. Maka sebuah komunitas yang berada di bawah payung
besar BMWCCI (BMW Car Club of Indonesia)
asuhan Gerry Nasution tetap “eksis” dengan
Seri -3 generasi lawas. Para pencinta mobil ini
menamakan dirinya dengan komunitas E30
Register. Awalnya, komunitas ini dibentuk
tahun 2006 di kota Bandung, dengan
kebersamaan yang solid hingga akhirnya
melebarkan sayap ke Jakarta. Karena vakumnya
kegiatan dan tatap muka langsung, atas inisiatif
dari penggemar BMW E30, pada akhir tahun
2008 dibentuk sebuah forum online untuk
menghidupkan kembali komunitas ini.
Komunitas ini dikategorikan sebagai
komunitas merek Independen atau Independent
Brand Community (IBC).
3.2 Company Brand Community Semenjak awal peluncurannya di Indonesia
pada medio tahun 2006 Toyota Yaris memang diposisikan sebagai mobil dengan karakter
muda serta mampu mendukung gaya hidup
kaum urban di perkotaan. Bersamaan dengan
peluncuran Toyota Yaris maka dibentuklah
komunitas TYCI (Toyota Yaris Club Indonesia)
dengan mengikuti desain klub resmi bukan
hanya sebagai komunitas biasa. TYCI mengarah kepada klub yang berdasarkan AD/ART dan
bernaung dibawah Toyota Astra Motor dan IMI.
Seiring berjalannya waktu dan munculnya
fenomena social networking, komunitas ini
memindahkan situs mereka dari
www.yarisgroovy.com ke situs social network
Facebook. Komunitas Yaris Groovynations
digunakan perusahaan sebagai sarana untuk
memberikan informasi kepada anggota
komunitas mengenai kegiatan atau promosi
yang sedang berlangsung. Selain bertukar
informasi sesama anggota komunitas, Toyota
Astra Motor sering mengadakan kegiatan bagi
para anggotanya dan pengguna Yaris yang
belum menjadi anggota komunitas ini.
Komunitas ini dikategorikan sebagai
komunitas merek buatan perusahaan atau
Company Brand Community (CBC).
3.3 Variabel Penting dalam Penelitian Berdasarkan uraian sebelumnya bahwa
penelitian ini akan membandingkan
karakteristik dari dua jenis komunitas, maka
581
variabel-variabel yang akan digunakan dalam
penelitian ini dapat digambarkan menjadi
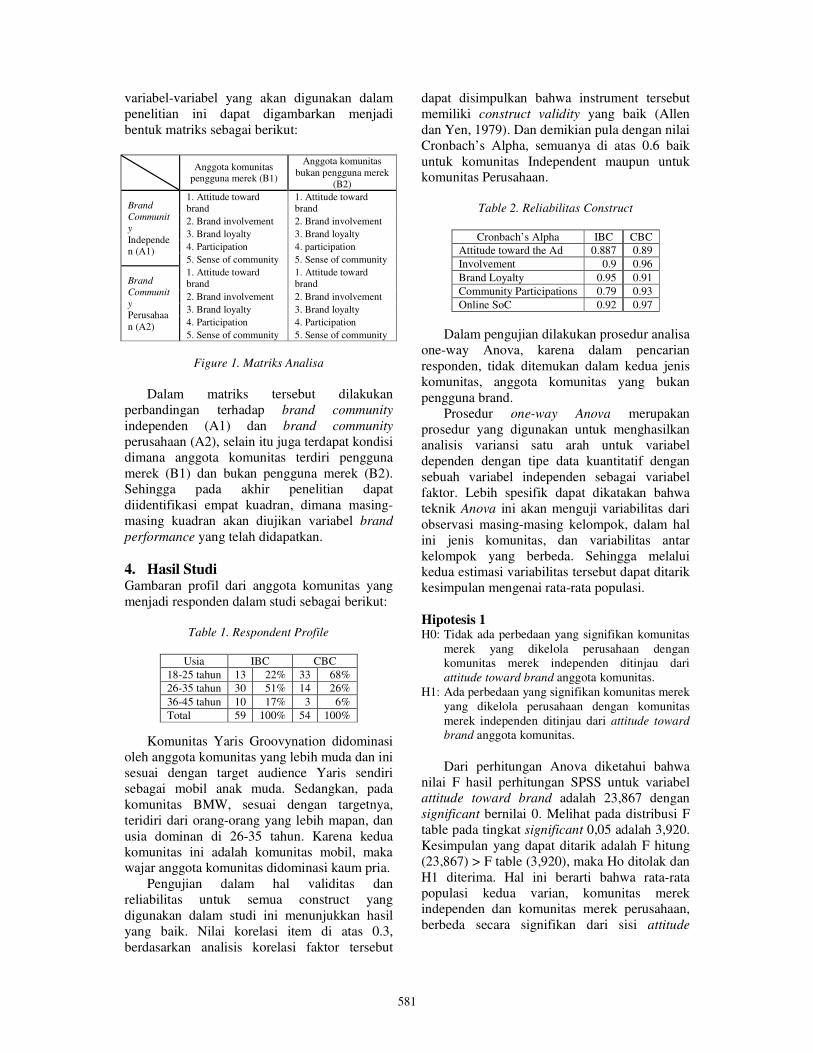
bentuk matriks sebagai berikut:
Anggota komunitas pengguna merek (B1)
Anggota komunitas
bukan pengguna merek
(B2)
Brand
Communit
y
Independen (A1)
1. Attitude toward
brand
1. Attitude toward
brand
2. Brand involvement 2. Brand involvement
3. Brand loyalty 3. Brand loyalty
4. Participation 4. participation
5. Sense of community 5. Sense of community
Brand
Communit
y Perusahaa
n (A2)
1. Attitude toward
brand
1. Attitude toward
brand
2. Brand involvement 2. Brand involvement
3. Brand loyalty 3. Brand loyalty
4. Participation 4. Participation
5. Sense of community 5. Sense of community
Figure 1. Matriks Analisa
Dalam matriks tersebut dilakukan
perbandingan terhadap brand community
independen (A1) dan brand community
perusahaan (A2), selain itu juga terdapat kondisi
dimana anggota komunitas terdiri pengguna
merek (B1) dan bukan pengguna merek (B2). Sehingga pada akhir penelitian dapat
diidentifikasi empat kuadran, dimana masing-
masing kuadran akan diujikan variabel brand
performance yang telah didapatkan.
4. Hasil Studi Gambaran profil dari anggota komunitas yang
menjadi responden dalam studi sebagai berikut:
Table 1. Respondent Profile
Komunitas Yaris Groovynation didominasi
oleh anggota komunitas yang lebih muda dan ini
sesuai dengan target audience Yaris sendiri
sebagai mobil anak muda. Sedangkan, pada
komunitas BMW, sesuai dengan targetnya,
teridiri dari orang-orang yang lebih mapan, dan
usia dominan di 26-35 tahun. Karena kedua
komunitas ini adalah komunitas mobil, maka wajar anggota komunitas didominasi kaum pria.
Pengujian dalam hal validitas dan
reliabilitas untuk semua construct yang
digunakan dalam studi ini menunjukkan hasil
yang baik. Nilai korelasi item di atas 0.3,
berdasarkan analisis korelasi faktor tersebut
dapat disimpulkan bahwa instrument tersebut
memiliki construct validity yang baik (Allen
dan Yen, 1979). Dan demikian pula dengan nilai
Cronbach’s Alpha, semuanya di atas 0.6 baik
untuk komunitas Independent maupun untuk komunitas Perusahaan.
Table 2. Reliabilitas Construct
Cronbach’s Alpha IBC CBC
Attitude toward the Ad 0.887 0.89
Involvement 0.9 0.96
Brand Loyalty 0.95 0.91
Community Participations 0.79 0.93
Online SoC 0.92 0.97
Dalam pengujian dilakukan prosedur analisa
one-way Anova, karena dalam pencarian
responden, tidak ditemukan dalam kedua jenis
komunitas, anggota komunitas yang bukan
pengguna brand.
Prosedur one-way Anova merupakan
prosedur yang digunakan untuk menghasilkan
analisis variansi satu arah untuk variabel
dependen dengan tipe data kuantitatif dengan
sebuah variabel independen sebagai variabel
faktor. Lebih spesifik dapat dikatakan bahwa
teknik Anova ini akan menguji variabilitas dari
observasi masing-masing kelompok, dalam hal
ini jenis komunitas, dan variabilitas antar
kelompok yang berbeda. Sehingga melalui
kedua estimasi variabilitas tersebut dapat ditarik
kesimpulan mengenai rata-rata populasi.
Hipotesis 1 H0: Tidak ada perbedaan yang signifikan komunitas
merek yang dikelola perusahaan dengan
komunitas merek independen ditinjau dari
attitude toward brand anggota komunitas.
H1: Ada perbedaan yang signifikan komunitas merek
yang dikelola perusahaan dengan komunitas
merek independen ditinjau dari attitude toward
brand anggota komunitas.
Dari perhitungan Anova diketahui bahwa
nilai F hasil perhitungan SPSS untuk variabel
attitude toward brand adalah 23,867 dengan
significant bernilai 0. Melihat pada distribusi F
table pada tingkat significant 0,05 adalah 3,920.
Kesimpulan yang dapat ditarik adalah F hitung
(23,867) > F table (3,920), maka Ho ditolak dan
H1 diterima. Hal ini berarti bahwa rata-rata
populasi kedua varian, komunitas merek independen dan komunitas merek perusahaan,
berbeda secara signifikan dari sisi attitude
Usia IBC CBC
18-25 tahun 13 22% 33 68%
26-35 tahun 30 51% 14 26%
36-45 tahun 10 17% 3 6%
Total 59 100% 54 100%
582
toward brand. Sedangkan apabila kita melihat
sub-variabel dari attitude toward brand, yaitu:
1. Consumer – Company, F hitung (0,433) < F
table (3,920), maka kedua varian adalah
sama untuk sub-variabel consumer-
company.
2. Consumer – Product, F hitung (19,981) > F
table (3,920), maka kedua varian berbeda
untuk sub-variabel consumer-product.
3. Consumer – Consumer, F hitung (36,713) >
F table (3,920), maka kedua varian berbeda
untuk sub-variabel consumer-consumer.
4. Consumer – Brand, F hitung (12,044) > F
table (3,920), maka kedua varian berbeda
untuk sub-variabel consumer-brand.
Hipotesis 2 H0: Tidak ada perbedaan yang signifikan komunitas
merek yang dikelola perusahaan dengan
komunitas merek independen ditinjau dari brand
involvement anggota komunitas.
H1: Ada perbedaan yang signifikan komunitas merek
yang dikelola perusahaan dengan komunitas
merek independen ditinjau dari brand
involvement anggota komunitas.
Dari perhitungan Anova diketahui bahwa
nilai F hasil perhitungan SPSS untuk variabel
brand involvement adalah 10,293 dengan
significant bernilai 0,002. Melihat pada
distribusi F table pada tingkat significant 0,05
adalah 3,920. Kesimpulan yang dapat ditarik
adalah F hitung (10,293) > F table (3,920),
maka Ho ditolak dan H1 diterima. Hal ini
berarti bahwa rata-rata populasi kedua varian,
komunitas merek independen dan komunitas
merek perusahaan, berbeda secara signifikan
dari sisi brand involvement.
Hipotesis 3 H0: Tidak ada perbedaan yang signifikan komunitas
merek yang dikelola perusahaan dengan
komunitas merek independen ditinjau dari brand
loyalty anggota komunitas.
H1: Ada perbedaan yang signifikan komunitas merek
yang dikelola perusahaan dengan komunitas
merek independen ditinjau dari brand loyalty
anggota komunitas.
Dari perhitungan Anova diketahui bahwa
nilai F hasil perhitungan SPSS untuk variabel
brand loyalty adalah 20,744 dengan significant
bernilai 0. Melihat pada distribusi F table pada
tingkat significant 0,05 adalah 3,920.
Kesimpulan yang dapat ditarik adalah F hitung
(20,744) > F table (3,920), maka Ho ditolak dan
H1 diterima. Hal ini berarti bahwa rata-rata
populasi kedua varian, komunitas merek
independen dan komunitas merek perusahaan,
berbeda secara signifikan dari sisi brand loyalty.
Hipotesis 4 H0: Tidak ada perbedaan yang signifikan komunitas
merek yang dikelola perusahaan dengan
komunitas merek independen ditinjau dari
community participation anggota komunitas.
H1: Ada perbedaan yang signifikan komunitas merek
yang dikelola perusahaan dengan komunitas
merek independen ditinjau dari community
participation anggota komunitas.
Dari perhitungan Anova diketahui bahwa
nilai F hasil perhitungan SPSS untuk variabel
community participation adalah 16,422 dengan
significant bernilai 0. Melihat pada distribusi F
table pada tingkat significant 0,05 adalah 3,920.
Kesimpulan yang dapat ditarik adalah F hitung
(16,422) > F table (3,920), maka H0 ditolak dan H1 diterima. Hal ini berarti bahwa rata-rata
populasi kedua varian, komunitas merek
independen dan komunitas merek perusahaan,
berbeda secara signifikan dari sisi community
participation.
Hipotesis 5 H0: Tidak ada perbedaan yang signifikan komunitas
merek yang dikelola perusahaan dengan
komunitas merek independen ditinjau dari online
sense of community anggota komunitas.
H1: Ada perbedaan yang signifikan komunitas merek
yang dikelola perusahaan dengan komunitas
merek independen ditinjau dari online sense of
community anggota komunitas.
Dari perhitungan Anova diketahui bahwa
nilai F hasil perhitungan SPSS untuk variabel
online sense of community adalah 22,128
dengan significant bernilai 0. Melihat pada
distribusi F table pada tingkat significant 0,05
adalah 3,920. Kesimpulan yang dapat ditarik
adalah F hitung (22,128) > F table (3,920), maka Ho ditolak dan H1 diterima. Hal ini
berarti bahwa rata-rata populasi kedua varian,
komunitas merek independen dan komunitas
merek perusahaan, berbeda secara signifikan
dari sisi online sense of community.
5. Diskusi 5.1 Attitude toward Brand
Ditemukan bahwa dalam Komunitas IBC
BMW, anggota tidak terlalu memperhatikan
hubungan antara mereka dengan perusahaan. Ini
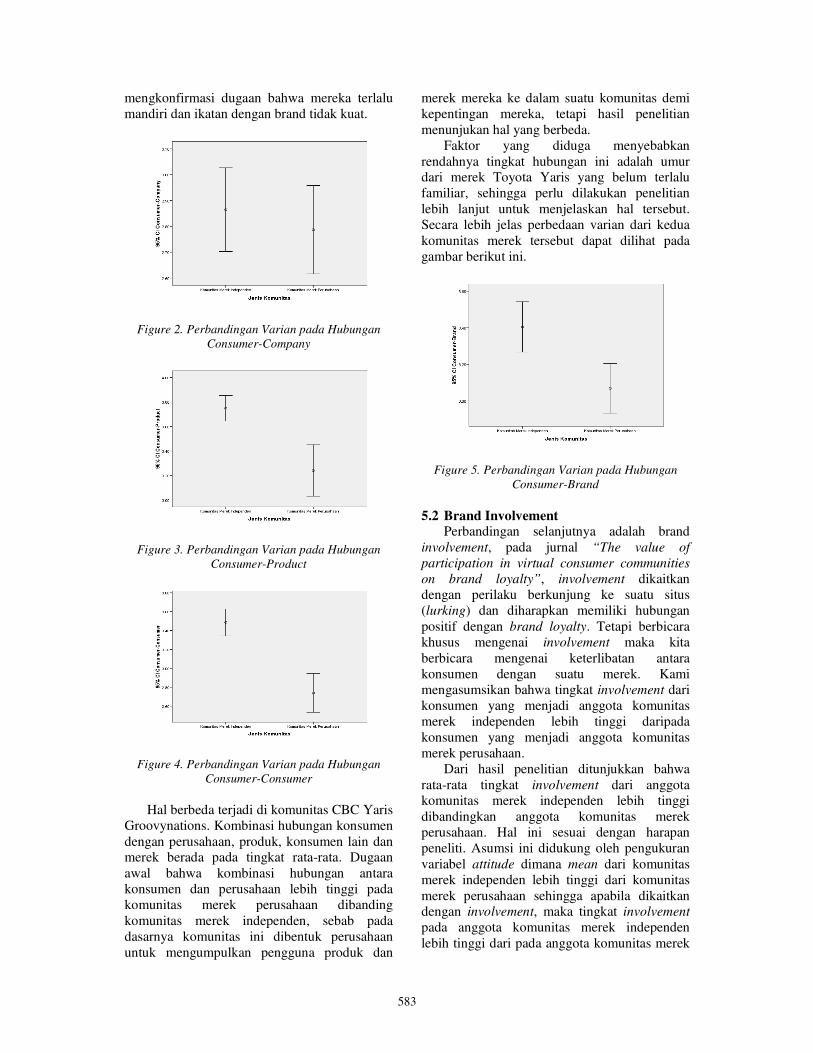
583
mengkonfirmasi dugaan bahwa mereka terlalu
mandiri dan ikatan dengan brand tidak kuat.
Figure 2. Perbandingan Varian pada Hubungan
Consumer-Company
Figure 3. Perbandingan Varian pada Hubungan
Consumer-Product
Figure 4. Perbandingan Varian pada Hubungan
Consumer-Consumer
Hal berbeda terjadi di komunitas CBC Yaris
Groovynations. Kombinasi hubungan konsumen
dengan perusahaan, produk, konsumen lain dan merek berada pada tingkat rata-rata. Dugaan
awal bahwa kombinasi hubungan antara
konsumen dan perusahaan lebih tinggi pada
komunitas merek perusahaan dibanding
komunitas merek independen, sebab pada
dasarnya komunitas ini dibentuk perusahaan
untuk mengumpulkan pengguna produk dan
merek mereka ke dalam suatu komunitas demi
kepentingan mereka, tetapi hasil penelitian
menunjukan hal yang berbeda.
Faktor yang diduga menyebabkan
rendahnya tingkat hubungan ini adalah umur dari merek Toyota Yaris yang belum terlalu
familiar, sehingga perlu dilakukan penelitian
lebih lanjut untuk menjelaskan hal tersebut.
Secara lebih jelas perbedaan varian dari kedua
komunitas merek tersebut dapat dilihat pada
gambar berikut ini.
Figure 5. Perbandingan Varian pada Hubungan
Consumer-Brand
5.2 Brand Involvement Perbandingan selanjutnya adalah brand
involvement, pada jurnal “The value of
participation in virtual consumer communities
on brand loyalty”, involvement dikaitkan
dengan perilaku berkunjung ke suatu situs
(lurking) dan diharapkan memiliki hubungan
positif dengan brand loyalty. Tetapi berbicara
khusus mengenai involvement maka kita
berbicara mengenai keterlibatan antara
konsumen dengan suatu merek. Kami
mengasumsikan bahwa tingkat involvement dari
konsumen yang menjadi anggota komunitas
merek independen lebih tinggi daripada
konsumen yang menjadi anggota komunitas
merek perusahaan.
Dari hasil penelitian ditunjukkan bahwa
rata-rata tingkat involvement dari anggota komunitas merek independen lebih tinggi
dibandingkan anggota komunitas merek
perusahaan. Hal ini sesuai dengan harapan
peneliti. Asumsi ini didukung oleh pengukuran
variabel attitude dimana mean dari komunitas
merek independen lebih tinggi dari komunitas
merek perusahaan sehingga apabila dikaitkan dengan involvement, maka tingkat involvement
pada anggota komunitas merek independen
lebih tinggi dari pada anggota komunitas merek
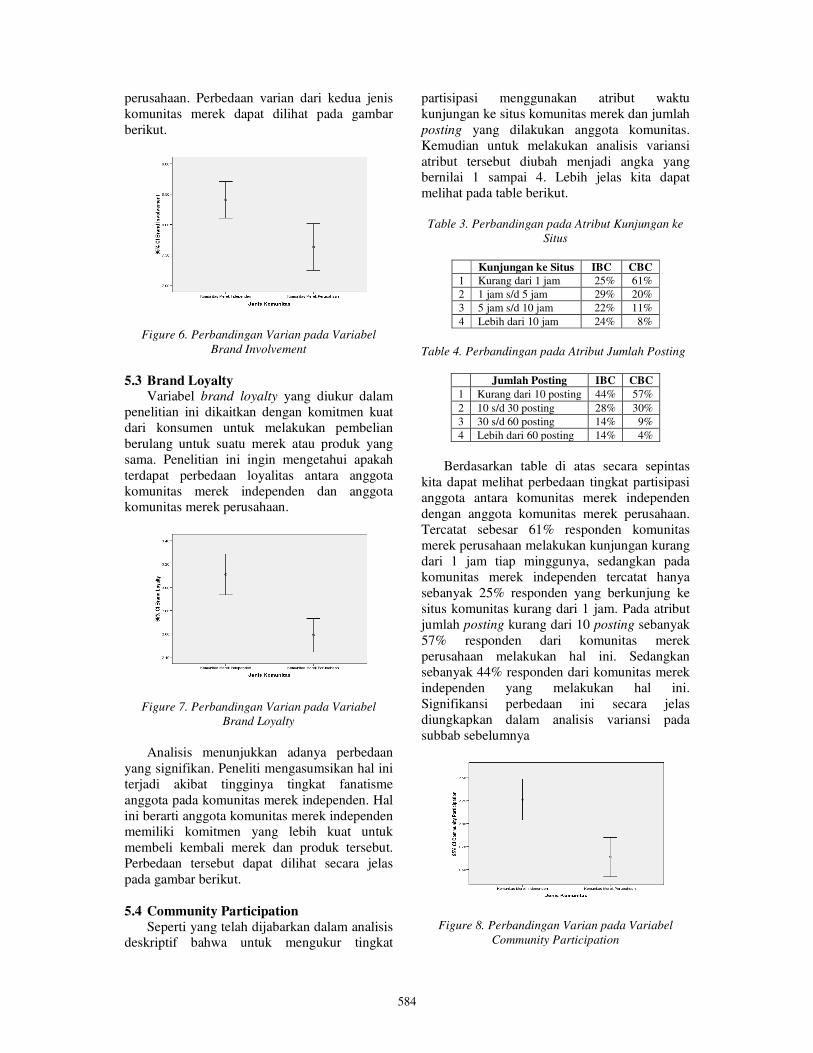
584
perusahaan. Perbedaan varian dari kedua jenis
komunitas merek dapat dilihat pada gambar
berikut.
Figure 6. Perbandingan Varian pada Variabel
Brand Involvement
5.3 Brand Loyalty Variabel brand loyalty yang diukur dalam
penelitian ini dikaitkan dengan komitmen kuat
dari konsumen untuk melakukan pembelian
berulang untuk suatu merek atau produk yang
sama. Penelitian ini ingin mengetahui apakah
terdapat perbedaan loyalitas antara anggota
komunitas merek independen dan anggota komunitas merek perusahaan.
Figure 7. Perbandingan Varian pada Variabel
Brand Loyalty
Analisis menunjukkan adanya perbedaan
yang signifikan. Peneliti mengasumsikan hal ini
terjadi akibat tingginya tingkat fanatisme
anggota pada komunitas merek independen. Hal
ini berarti anggota komunitas merek independen memiliki komitmen yang lebih kuat untuk
membeli kembali merek dan produk tersebut.
Perbedaan tersebut dapat dilihat secara jelas
pada gambar berikut.
5.4 Community Participation
Seperti yang telah dijabarkan dalam analisis deskriptif bahwa untuk mengukur tingkat
partisipasi menggunakan atribut waktu
kunjungan ke situs komunitas merek dan jumlah
posting yang dilakukan anggota komunitas.
Kemudian untuk melakukan analisis variansi
atribut tersebut diubah menjadi angka yang bernilai 1 sampai 4. Lebih jelas kita dapat
melihat pada table berikut.
Table 3. Perbandingan pada Atribut Kunjungan ke
Situs
Kunjungan ke Situs IBC CBC
1 Kurang dari 1 jam 25% 61%
2 1 jam s/d 5 jam 29% 20%
3 5 jam s/d 10 jam 22% 11%
4 Lebih dari 10 jam 24% 8%
Table 4. Perbandingan pada Atribut Jumlah Posting
Jumlah Posting IBC CBC
1 Kurang dari 10 posting 44% 57%
2 10 s/d 30 posting 28% 30%
3 30 s/d 60 posting 14% 9%
4 Lebih dari 60 posting 14% 4%
Berdasarkan table di atas secara sepintas
kita dapat melihat perbedaan tingkat partisipasi
anggota antara komunitas merek independen
dengan anggota komunitas merek perusahaan.
Tercatat sebesar 61% responden komunitas
merek perusahaan melakukan kunjungan kurang
dari 1 jam tiap minggunya, sedangkan pada
komunitas merek independen tercatat hanya
sebanyak 25% responden yang berkunjung ke
situs komunitas kurang dari 1 jam. Pada atribut
jumlah posting kurang dari 10 posting sebanyak
57% responden dari komunitas merek
perusahaan melakukan hal ini. Sedangkan
sebanyak 44% responden dari komunitas merek
independen yang melakukan hal ini.
Signifikansi perbedaan ini secara jelas
diungkapkan dalam analisis variansi pada
subbab sebelumnya
Figure 8. Perbandingan Varian pada Variabel
Community Participation
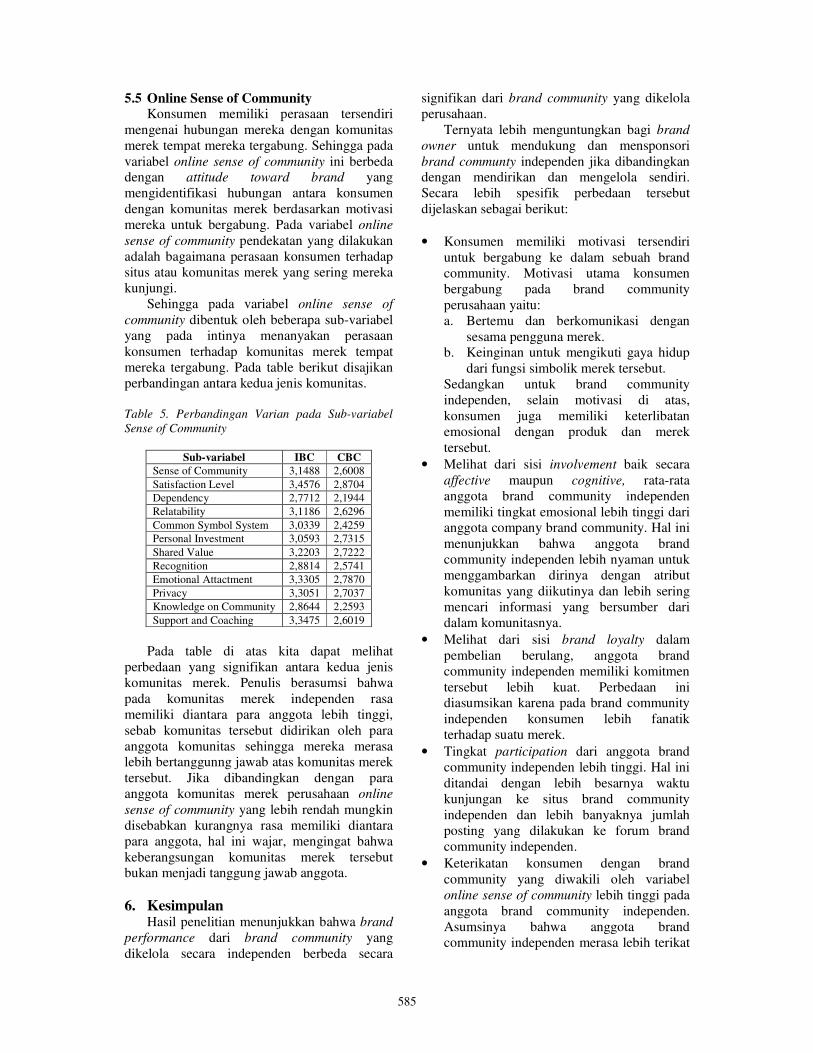
585
5.5 Online Sense of Community Konsumen memiliki perasaan tersendiri
mengenai hubungan mereka dengan komunitas
merek tempat mereka tergabung. Sehingga pada
variabel online sense of community ini berbeda dengan attitude toward brand yang
mengidentifikasi hubungan antara konsumen
dengan komunitas merek berdasarkan motivasi
mereka untuk bergabung. Pada variabel online
sense of community pendekatan yang dilakukan
adalah bagaimana perasaan konsumen terhadap
situs atau komunitas merek yang sering mereka
kunjungi.
Sehingga pada variabel online sense of
community dibentuk oleh beberapa sub-variabel
yang pada intinya menanyakan perasaan
konsumen terhadap komunitas merek tempat
mereka tergabung. Pada table berikut disajikan
perbandingan antara kedua jenis komunitas.
Table 5. Perbandingan Varian pada Sub-variabel
Sense of Community
Sub-variabel IBC CBC
Sense of Community 3,1488 2,6008
Satisfaction Level 3,4576 2,8704
Dependency 2,7712 2,1944
Relatability 3,1186 2,6296
Common Symbol System 3,0339 2,4259
Personal Investment 3,0593 2,7315
Shared Value 3,2203 2,7222
Recognition 2,8814 2,5741
Emotional Attactment 3,3305 2,7870
Privacy 3,3051 2,7037
Knowledge on Community 2,8644 2,2593
Support and Coaching 3,3475 2,6019
Pada table di atas kita dapat melihat
perbedaan yang signifikan antara kedua jenis
komunitas merek. Penulis berasumsi bahwa
pada komunitas merek independen rasa
memiliki diantara para anggota lebih tinggi,
sebab komunitas tersebut didirikan oleh para
anggota komunitas sehingga mereka merasa lebih bertanggunng jawab atas komunitas merek
tersebut. Jika dibandingkan dengan para
anggota komunitas merek perusahaan online
sense of community yang lebih rendah mungkin
disebabkan kurangnya rasa memiliki diantara
para anggota, hal ini wajar, mengingat bahwa
keberangsungan komunitas merek tersebut bukan menjadi tanggung jawab anggota.
6. Kesimpulan Hasil penelitian menunjukkan bahwa brand
performance dari brand community yang
dikelola secara independen berbeda secara
signifikan dari brand community yang dikelola
perusahaan.
Ternyata lebih menguntungkan bagi brand
owner untuk mendukung dan mensponsori
brand communty independen jika dibandingkan dengan mendirikan dan mengelola sendiri.
Secara lebih spesifik perbedaan tersebut
dijelaskan sebagai berikut:
• Konsumen memiliki motivasi tersendiri
untuk bergabung ke dalam sebuah brand
community. Motivasi utama konsumen
bergabung pada brand community
perusahaan yaitu:
a. Bertemu dan berkomunikasi dengan
sesama pengguna merek. b. Keinginan untuk mengikuti gaya hidup
dari fungsi simbolik merek tersebut.
Sedangkan untuk brand community
independen, selain motivasi di atas,
konsumen juga memiliki keterlibatan
emosional dengan produk dan merek
tersebut.
• Melihat dari sisi involvement baik secara
affective maupun cognitive, rata-rata
anggota brand community independen
memiliki tingkat emosional lebih tinggi dari anggota company brand community. Hal ini
menunjukkan bahwa anggota brand
community independen lebih nyaman untuk
menggambarkan dirinya dengan atribut
komunitas yang diikutinya dan lebih sering
mencari informasi yang bersumber dari
dalam komunitasnya.
• Melihat dari sisi brand loyalty dalam
pembelian berulang, anggota brand
community independen memiliki komitmen
tersebut lebih kuat. Perbedaan ini diasumsikan karena pada brand community
independen konsumen lebih fanatik
terhadap suatu merek.
• Tingkat participation dari anggota brand
community independen lebih tinggi. Hal ini
ditandai dengan lebih besarnya waktu
kunjungan ke situs brand community
independen dan lebih banyaknya jumlah
posting yang dilakukan ke forum brand
community independen.
• Keterikatan konsumen dengan brand
community yang diwakili oleh variabel
online sense of community lebih tinggi pada
anggota brand community independen.
Asumsinya bahwa anggota brand
community independen merasa lebih terikat
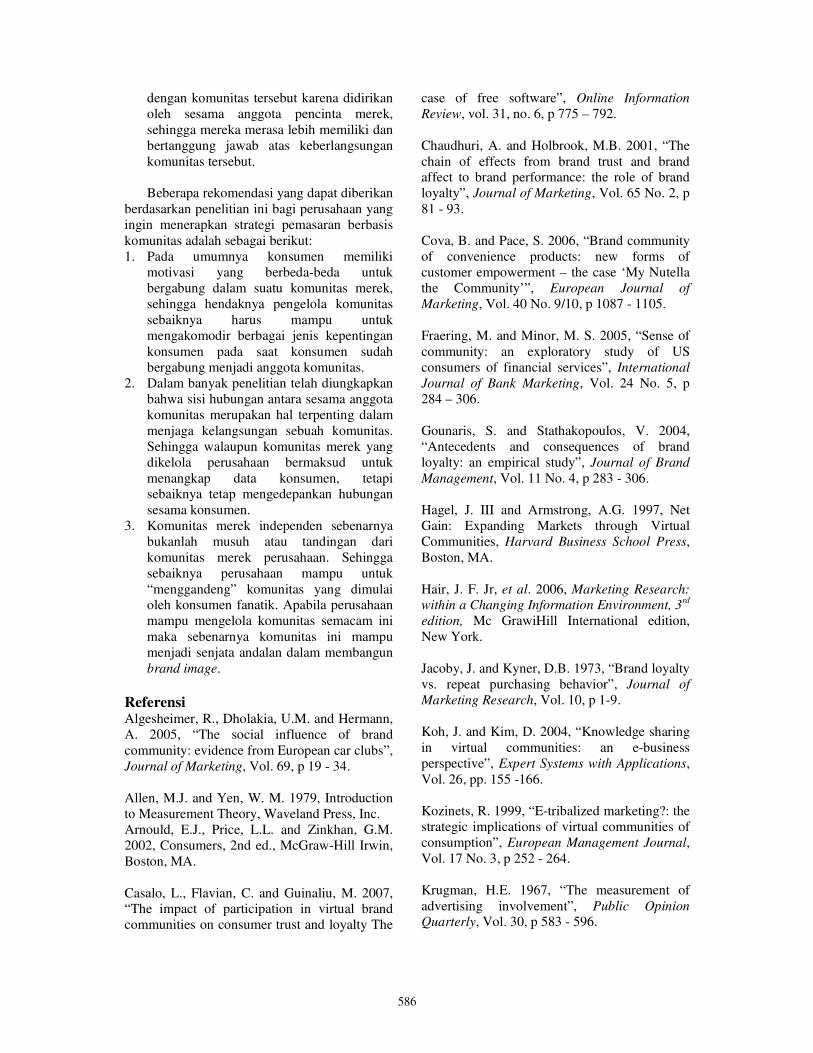
586
dengan komunitas tersebut karena didirikan
oleh sesama anggota pencinta merek,
sehingga mereka merasa lebih memiliki dan
bertanggung jawab atas keberlangsungan
komunitas tersebut.
Beberapa rekomendasi yang dapat diberikan
berdasarkan penelitian ini bagi perusahaan yang
ingin menerapkan strategi pemasaran berbasis
komunitas adalah sebagai berikut:
1. Pada umumnya konsumen memiliki
motivasi yang berbeda-beda untuk
bergabung dalam suatu komunitas merek,
sehingga hendaknya pengelola komunitas
sebaiknya harus mampu untuk
mengakomodir berbagai jenis kepentingan
konsumen pada saat konsumen sudah
bergabung menjadi anggota komunitas.
2. Dalam banyak penelitian telah diungkapkan
bahwa sisi hubungan antara sesama anggota
komunitas merupakan hal terpenting dalam
menjaga kelangsungan sebuah komunitas.
Sehingga walaupun komunitas merek yang
dikelola perusahaan bermaksud untuk
menangkap data konsumen, tetapi sebaiknya tetap mengedepankan hubungan
sesama konsumen.
3. Komunitas merek independen sebenarnya
bukanlah musuh atau tandingan dari
komunitas merek perusahaan. Sehingga
sebaiknya perusahaan mampu untuk
“menggandeng” komunitas yang dimulai oleh konsumen fanatik. Apabila perusahaan
mampu mengelola komunitas semacam ini
maka sebenarnya komunitas ini mampu
menjadi senjata andalan dalam membangun
brand image.
Referensi Algesheimer, R., Dholakia, U.M. and Hermann,
A. 2005, “The social influence of brand
community: evidence from European car clubs”,
Journal of Marketing, Vol. 69, p 19 - 34.
Allen, M.J. and Yen, W. M. 1979, Introduction
to Measurement Theory, Waveland Press, Inc.
Arnould, E.J., Price, L.L. and Zinkhan, G.M.
2002, Consumers, 2nd ed., McGraw-Hill Irwin,
Boston, MA.
Casalo, L., Flavian, C. and Guinaliu, M. 2007, “The impact of participation in virtual brand
communities on consumer trust and loyalty The
case of free software”, Online Information
Review, vol. 31, no. 6, p 775 – 792.
Chaudhuri, A. and Holbrook, M.B. 2001, “The
chain of effects from brand trust and brand affect to brand performance: the role of brand
loyalty”, Journal of Marketing, Vol. 65 No. 2, p
81 - 93.
Cova, B. and Pace, S. 2006, “Brand community
of convenience products: new forms of
customer empowerment – the case ‘My Nutella
the Community’”, European Journal of
Marketing, Vol. 40 No. 9/10, p 1087 - 1105.
Fraering, M. and Minor, M. S. 2005, “Sense of
community: an exploratory study of US
consumers of financial services”, International
Journal of Bank Marketing, Vol. 24 No. 5, p
284 – 306.
Gounaris, S. and Stathakopoulos, V. 2004,
“Antecedents and consequences of brand
loyalty: an empirical study”, Journal of Brand
Management, Vol. 11 No. 4, p 283 - 306.
Hagel, J. III and Armstrong, A.G. 1997, Net
Gain: Expanding Markets through Virtual
Communities, Harvard Business School Press,
Boston, MA.
Hair, J. F. Jr, et al. 2006, Marketing Research:
within a Changing Information Environment, 3rd
edition, Mc GrawiHill International edition,
New York.
Jacoby, J. and Kyner, D.B. 1973, “Brand loyalty
vs. repeat purchasing behavior”, Journal of
Marketing Research, Vol. 10, p 1-9.
Koh, J. and Kim, D. 2004, “Knowledge sharing
in virtual communities: an e-business
perspective”, Expert Systems with Applications,
Vol. 26, pp. 155 -166.
Kozinets, R. 1999, “E-tribalized marketing?: the
strategic implications of virtual communities of
consumption”, European Management Journal,
Vol. 17 No. 3, p 252 - 264.
Krugman, H.E. 1967, “The measurement of
advertising involvement”, Public Opinion
Quarterly, Vol. 30, p 583 - 596.
587
Malhotra, Naresh K. 2007, Marketing Research
An Applied Orientation. Prentice Hall, United
State of America.
Maulana, A.E. and Eckhardt, G.M. 2007, “Just friends, good acquaintances or soulmates? An
exploration of web site connectedness”,
Qualitative Market Research: An International
Journal, vol. 10, no. 3, p 227 – 242.
Maulana, A.E. and Krisnawati, I. 2009,
“Exploring Sense of Community in the Online
Environment: Using Netnography”.
Proceedings, IICIES 2009.
McAlexander, J.H., Kim, S.H. and Roberts,
S.D. 2003, “Loyalty: the influences of
satisfaction and brand community integration”,
Journal of Marketing – Theory and Practice,
Fall, p 1 - 11.
McAlexander, J.H., Schouten, J.W. and Koenig,
H.F. 2002, “Building brand community”,
Journal of Marketing, Vol. 66 No. 1, p 38 - 54.
McMillan, D.W., and Chavis, D.M. 1986.
“Sense of Community: A definition and theory”,
American Journal of Community Psychology,
14(1), p 6 - 23.
Mitchell, A.A. 1979, “Involvement: a
potentially important mediator of consumer behavior”, Advances in Consumer Research,
Vol. 6, p 191 - 196.
Mittal, B. 1987, “A framework for relating
consumer involvement to lateral brain
functioning”, in Wallendorf, M. and Anderson,
P., Advances in Consumer Research,Vol. 14,
Association for Consumer Research, Provo, UT,
p 41- 45.
Muniz, A.M. Jr and O’Guinn, T.C. 2001,
“Brand community”, Journal of Consumer
Research, Vol. 27, March, p 412 - 432.
Muniz, A.M. Jr and Schau, H.J. 2005,
“Religiosity in the abandoned Apple Newton
brand community”, Journal of Consumer
Research, Vol. 31, p 737 - 747.
Nelson, P. 1970, “Information and consumer
behavior”, Journal of Political Economy, Vol. 78, p 311 - 329.
Neuman, W. L. 1997, Social Research Methods:
Qualitative and Quantitative Approaches, 3rd
edition, Allyn & Bacon, United States of
America.
Ouwersloot, H. and Odekerken-Schroder, G.
2007, “Who’s who in brand communities – and
why?”, European Journal of Marketing, vol. 42,
no. 5/6, p 571 – 585.
Park, C.W. and Young, S.M. 1983, “Types and
levels of involvement and brand attitude
formation”, Advances in Consumer Research,
Vol. 10, p 320 - 324.
Quester, P and Lim, A.L. 2003, Product
involvement/brand loyalty: is there a link?”,
Journal of Product & Brand Management, vol. 12, no. 1, p 22 – 39.
Ridings, C.M., Gefen, D. and Arinze, B. 2002,
“Some antecedents and effects of trust in virtual
communities”, Journal of Strategic Information
Systems, Vol. 11 Nos 3-4, p 271 - 295.
Schau, H.J. and Muniz, A.M. Jr. 2002, “Brand
communities and personal identities:
negotiations in cyberspace”, Advances in
Consumer Research, Vol. 29, p 344 - 349.
Schouten, J.W. and McAlexander, J. (1995),
“Subcultures of consumption: an ethnography of
the new bikers”, Journal of Consumer
Research, Vol. 22 No. 1, p 43 - 61.
Tyebjee, T.T. 1977, “Refinement of the
involvement concept: an advertising planning
point of view”.
Zaichkowsky, J.L. 1985, “Measuring the
involvement construct”, Journal of Consumer
Research, Vol. 12 No. 3, p 341-52.
589
Analysis of the Factors that Influence Consumer Purchase Decisions in the
Snack Product (Case study in BANCI as an Alternative Healthy Food)
Wati Susilawati1, Abdullah Ramdani2, Dini Turipanam Alamanda3, M. Okta Lesmana4 1,2,4Faculty of Economic, University of Garut, Indonesia
3School of Business and Management (SBM), Institute of Technology Bandung (ITB), Indonesia
Abstract
Snacking is one way to get satisfaction from the crush of life’s stresses. In fact, more frequent snacking
leads a person to be pursued by guilt that obesity and unhealthy living patterns are occurring. BANCI
(Banana Chocochip) produces a Banana Chocolate Chip product which is a product of innovation and
creation that could be a good alternative and a healthy snack. In this paper, we identify the determinant
factors on which the consumer makes their purchasing decisions based on product attributes like price,
quality, packaging, branding, warranties, and service. Based on the results of research, the critical
attributes in the purchase decision are brand, quality, and price attributes
Key words: snacking, Banana Chocochip, determinant factors, purchasing decisions
1. Introduction In any economic conditions, competition in
the business world is stricter because almost all businesses started globally oriented. Business
phenomenon, which occurs in the face of the
free market in the present and the future, is
more complex to achieve competitive
advantage. A lot of business organizations are
doing efforts to achieve competitive advantage
by making changes in production processes, equipment, services or activities undertaken
relating to the creation of added value.
Therefore, companies always keep trying to do
the formulation and improvement of businesses
in order to win the competition. Looking at the increasingly volatile
economic activities not only in Indonesia but also in the world, making people have desire to
become an entrepreneur. Students were not free
from this phenomenon, therefore, this
phenomenon makes student is required to be
creative so that when it has graduated from
college, and students are able to self-reliance. Nowadays, people make a banana as a
snack with the process into a wide range of
foods such as banana compote, fried bananas,
banana chips etc. Everyone else has to know
and feel the delights of banana chips, banana
chips on the market currently has a sweet and
salty taste, which is the sweet taste of banana chips is derived from refined sugar or melted
and combined into the banana chips. The sweet
taste can be replaced with other food ingredients
that more healthy. One of them is by using
chocolate.
A combination chocolate and banana chip is
a good form of snacks, rich of nutritious and
innovative because chocolate banana chips have
not been made. And this combination chocolate
and banana chip is called BANCI.
This paper, identify the determinant factors
on which the consumer makes their purchasing decisions based on product attributes like price,
quality, packaging, branding, warranties, and
service related to BANCI.
2. Literature Review To understand consumer behavior, there are
many underlying factors that influence a person
in making decisions to purchase certain
products or brands. Lysonski, et al., (1996) in
Silayoi and Speede (2004) mentioned that the consumer decision-making can be defined as a
mental orientation characterizing a consumer's
approach to making choice. This approach is
associated with cognitive and affective
orientation in the decision making process.
In a large proportion, consumer-buying
behavior is often preceded and influenced by
many stimuli from outside, either marketing
stimuli as well as from other environmental
stimuli. Marketing stimuli consist of the four Ps:
product, price, place, and promotion. Other
stimuli include the significant forces and events
in the buyer's environment: economic, technological, political and cultural (Kotler, et
al., 2005).
Products are the main reason for consumers
in their purchase, considering the benefits that
are included in a product is actually sought after
by consumers. In the process of purchasing,
590
consumers often do a search of information and
evaluate various alternative products to avoid
possible negative risks (Kotler, et al., 2005).
Therefore, marketers need to consider the issues
in the product including product attributes will be offered to the market.
Kotler (2000) states that "the product
attribute is a component of the product property
which ensure that these products meet the needs
and desires of the buyer. Attributes inherent in a
consumer product are used to assess and
measure the suitability of product characteristics
with the need and desire of the consumer. For
companies that are able to know what attributes
could influence the purchasing decision, they
can determine the strategy to develop and refine
the product to be able to meet consumer
expectations.
A product must have the attributes that
support it. Some important factors to consider
attributes such as price, quality, branding,
packaging, size, label, service (Kotler, 2000).
According to the American Marketing
Association (Kotler, 2000), a brand is a name,
term, sign, symbol, design, or a combination of those things, which are intended to identify the
goods or services from a person or group of
sellers and to differentiate it from competitors'
products. A brand gives a series in which the
promise of trust, consistency, and hope. Thus,
the brand is very important, for both consumers
and producers (Riana, 2008). For consumers, the brand is useful to simplify the purchasing
decision process and a guarantee of quality.
Conversely, for the manufacturer, the brand can
help the efforts to build loyalty and ongoing
relationship with consumers.
Other attributes of the product that are an
important consideration is the quality of the
product. Quality of products offered is one of
the important components for the company. The
product quality is one tool in creating
competitive advantage for companies (Kotler, et
al., 2005). The importance of quality image can
provide benefits in the form of consumer
purchase intentions (Tsiotsou, 2005).
Furthermore, Tsiotsou (2005) mentions that
some of the research (Carman, 1990; Boulding,
Staelin, & Zeithaml, 1993; and Parasuraman, et
al., 1996) supports the existence of a positive
direct effect on the quality of consumer
purchase intentions. Apart from product quality, product
packaging has a role in providing purchasers
stimuli. The use of packaging elements
(packaging) becomes an important issue in
purchasing decisions for products with low
involvement of consumers (Estiri, et al., 2010).
Silayoi and Speede (2004) said there are five
major elements in packaging that has the potential to influence the buying decisions. The
fifth element was grouped into two categories of
visual elements and information. Aspects of the
visual elements consist of graphics, size, and
shape of packaging. Elements of the information
and the technology used presented. Research
conducted Estiri, et al. (2010) about the element
on the packaged food product category has an
impact on changing behavior at three stages
namely the purchase of pre-purchase, purchase
and post-purchase.
On the other hand, the majority of
consumers, particularly for low involvement
products and consumers who are price sensitive,
the price is often a consideration in purchasing
decisions. Price is an amount of money charged
for a product, or the amount of value in
exchange for the benefits consumers because it
owns or uses the product (Kotler, et al., 2005).
Problems related to product warranties are promised in the warranty service. Is a product of
service activities that require special attention
because of product management itself is
increasingly sophisticated and complex,
consumer dissatisfaction is increasing and all
getting difficult to overcome by the service
product itself? In general, companies must be able to
understand what the needs and desires of
consumers towards the products of which
consist of an affordable price, good quality,
satisfactory service and taste that can meet
consumer tastes. Through an understanding of
consumer behavior in choosing a product,
marketers can understand the truth of what their
needs and desires of consumers, consumer
background, reasons for purchasing the product,
as well as the condition of how goods and
services are purchased.
3. Research Design The research design is descriptive. This
study focuses on consumer purchasing decisions based on consumers' responses to product
attributes. Thus, the research instrument is
directed at product attributes such as brand,
quality, service, packaging, price, and warranty.
The data was collected using questionnaires.
Each item in question is using the measuring
scale of 1-7. Response 1 indicates disagreement
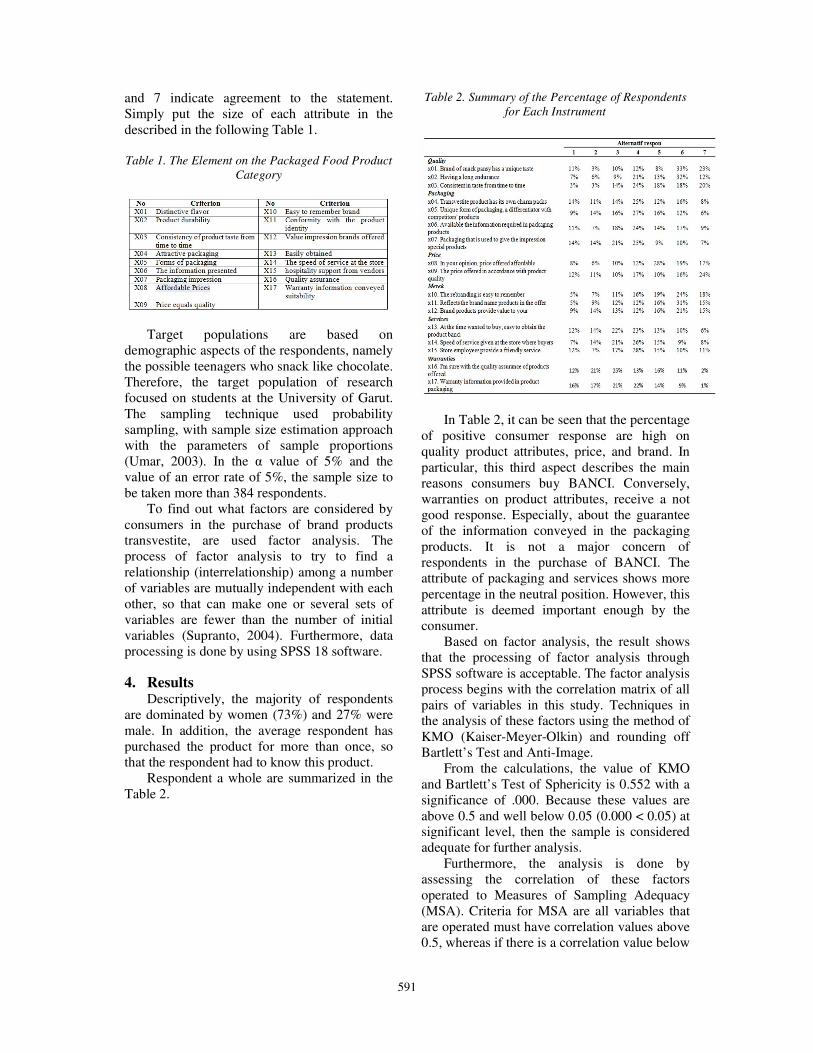
591
and 7 indicate agreement to the statement.
Simply put the size of each attribute in the
described in the following Table 1.
Table 1. The Element on the Packaged Food Product
Category
Target populations are based on
demographic aspects of the respondents, namely
the possible teenagers who snack like chocolate.
Therefore, the target population of research
focused on students at the University of Garut.
The sampling technique used probability
sampling, with sample size estimation approach
with the parameters of sample proportions
(Umar, 2003). In the α value of 5% and the
value of an error rate of 5%, the sample size to
be taken more than 384 respondents.
To find out what factors are considered by
consumers in the purchase of brand products transvestite, are used factor analysis. The
process of factor analysis to try to find a
relationship (interrelationship) among a number
of variables are mutually independent with each
other, so that can make one or several sets of
variables are fewer than the number of initial
variables (Supranto, 2004). Furthermore, data
processing is done by using SPSS 18 software.
4. Results Descriptively, the majority of respondents
are dominated by women (73%) and 27% were
male. In addition, the average respondent has
purchased the product for more than once, so
that the respondent had to know this product.
Respondent a whole are summarized in the
Table 2.
Table 2. Summary of the Percentage of Respondents
for Each Instrument
In Table 2, it can be seen that the percentage
of positive consumer response are high on
quality product attributes, price, and brand. In
particular, this third aspect describes the main
reasons consumers buy BANCI. Conversely,
warranties on product attributes, receive a not
good response. Especially, about the guarantee
of the information conveyed in the packaging
products. It is not a major concern of
respondents in the purchase of BANCI. The
attribute of packaging and services shows more
percentage in the neutral position. However, this
attribute is deemed important enough by the
consumer.
Based on factor analysis, the result shows
that the processing of factor analysis through
SPSS software is acceptable. The factor analysis
process begins with the correlation matrix of all
pairs of variables in this study. Techniques in the analysis of these factors using the method of
KMO (Kaiser-Meyer-Olkin) and rounding off
Bartlett’s Test and Anti-Image.
From the calculations, the value of KMO
and Bartlett’s Test of Sphericity is 0.552 with a
significance of .000. Because these values are
above 0.5 and well below 0.05 (0.000 < 0.05) at significant level, then the sample is considered
adequate for further analysis.
Furthermore, the analysis is done by
assessing the correlation of these factors
operated to Measures of Sampling Adequacy
(MSA). Criteria for MSA are all variables that
are operated must have correlation values above
0.5, whereas if there is a correlation value below
592
0.5 means not eligible for the MSA. At the
output, value of MSA was obtained under 0.5
that is on factor value of the packaging gives the
impression X07 and X17 special about the
security of information provided in product packaging. Therefore, both factors are removed
from the processing and return analysis.
The result of factor analysis after reducing
the value obtained x02 and x17 KMO and
Bartlett’s Test of Sphericity is 0.622 with a
significance of .000. Furthermore, the MSA
values in the table is not found correlation
values of each factor which is smaller than 0.5.
Thus, data analysis continued in the process of
extraction, where the process of extraction of
the factors used to determine the types of
variables that will be used, ie, variables
involving the total variance, more than one that
needs to be taken into account.
Results of factor analysis shows that of the
15 factors measured can be summarized into
three main factors that determine consumer-
buying products BANCI. Here is a summary of
the third grouping of these factors after the
rotation process.
Table 3. Rotated Component Matrixa
Component
1 2 3
x01 ,761 ,563 -,122
x02 ,922 ,169 ,185
x03 ,170 ,936 ,246
x04 ,909 ,167 ,177
x05 ,578 ,229 ,352
x06 ,563 ,761 -,122
x08 ,313 ,217 ,895
x09 ,425 ,263 ,546
x10 ,388 ,778 ,306
x11 ,155 ,892 ,284
x12 ,462 ,331 ,695
x13 ,895 ,217 ,313
x14 ,170 ,936 ,246
x15 ,918 ,147 ,267
x16 ,895 ,217 ,313
Extraction Method: Principal Component Analysis.
Rotation Method: Varimax with Kaiser Normalization.
a. Rotation converged in 5 iterations.
Based on the results processed at the second
table, then it is made a summary of each factor
by grouping that is formed into the following
table.
Table 4. Summary of Grouping Factor Results
5. Conclusion A consumer’s purchasing decision, in this
case is the purchase of snack food products will
be influenced by stimuli factors of the
marketing mix product itself. Factors that a
stimulus or influence a consumer’s decisions are
based on the inherent attributes of products such
as product quality, price, brand, service and
warranties. Then, from these dimensions are
translated into a number of factors that influence
a consumer decision in purchasing. As for the
determinants of consumer decisions for BANCI
is a quality product, brand and price.
References Brassington, F. & S. Pettitt, (2005), Essential of
Marketing, England: Pearson Education
Limited.
Estiri, M., et al., (2010), “Food Product
Consumer behavior: the role of packaging
elements”, Journal of Applied Science 10(7):
535-543.
Jahre, M. & C.J. Hatteland, (2004), “Packages
and physical distribution: Implications for
integration and standardisation”, International
Journal of Physical Distribution & Logistics
Management 34(2): 123-139.
Kotler, Philip, (2000), Manajemen Pemasaran
Edisi Milenium, Jakarta: Prenhallindo.
Kotler, P., et al., (2005), Principle of Marketing,
fourth European Edition, London: Prentice Hall
Education Limited.
Riana, G., (2008), “Pengaruh Trust in a Brand
terhadap Brand Loyalty Pada Konsumen Air
Minum Aqua di Kota Denpasar”, BULETIN
STUDI EKONOMI 13(2).
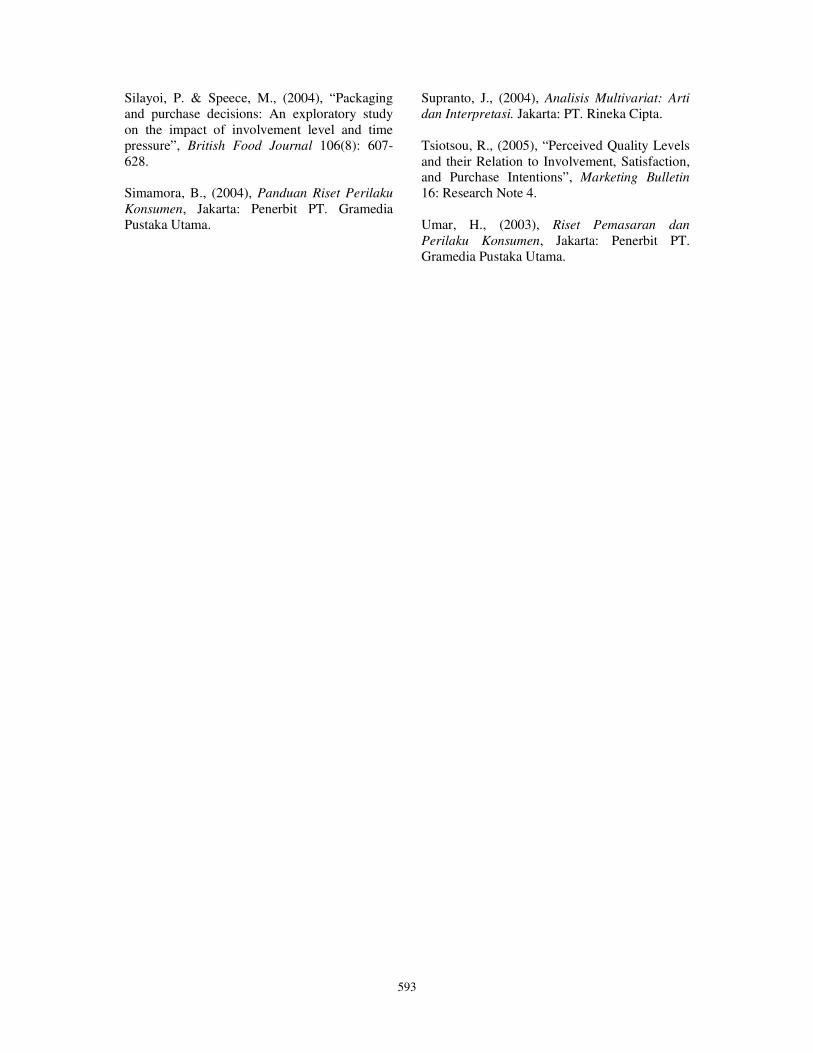
593
Silayoi, P. & Speece, M., (2004), “Packaging
and purchase decisions: An exploratory study
on the impact of involvement level and time
pressure”, British Food Journal 106(8): 607-
628.
Simamora, B., (2004), Panduan Riset Perilaku
Konsumen, Jakarta: Penerbit PT. Gramedia
Pustaka Utama.
Supranto, J., (2004), Analisis Multivariat: Arti
dan Interpretasi. Jakarta: PT. Rineka Cipta.
Tsiotsou, R., (2005), “Perceived Quality Levels
and their Relation to Involvement, Satisfaction, and Purchase Intentions”, Marketing Bulletin
16: Research Note 4.
Umar, H., (2003), Riset Pemasaran dan
Perilaku Konsumen, Jakarta: Penerbit PT.
Gramedia Pustaka Utama.
595
Demographic Aspects: The Missing Source of Business Opportunities
(A Case Study in Depok District Demography, West Java)
Aris Budi Setyawan1, Ichwan Suyudi
2
1Faculty of Economics, Gunadarma University, Jakarta
2Faculty of Letters, Gunadarma University, Jakarta
Abstract
One-key success in the business is the ability of entrepreneurs to find and explore the existing potential
opportunities. For small and medium business, this will become increasingly important due to various
limitations. Such business scale needs to be able to compete with large-scale business, regarding several
possible advantages of niche and market potentials.
Demographic aspects that reflect various profiles of consumers should be considered by small and medium
enterprises (SMEs) to produce and sell their products and services. However, the various opportunities that
are reflected in the demographic profile have not been widely used by these businesses. Many opportunities
and business strategies are not properly applied in SMEs.
This paper shows how the demographic profiles in Depok, West Java, can be a source of information on
business opportunities and as a basis for determining the business strategy to improve the marketing
performance of SMEs. The study was conducted by using secondary data from Depok during 2008
publications. Analysis was performed by descriptive and map potential opportunities based on Depok
demographic profiles.
The result shows that the demographic profiles, such as distribution of population by region, gender
composition, income distribution, composition and distribution of education level, the types of work
distribution, and other demographic profiles, can be used as significant information on business
opportunities. By using this various information, SMEs can determine what products should be manufactured
and marketed, which segments should be targeted, what price should the goods and services provided, and
many other marketing strategies. Thus, the utilization of alternative demographic profiles can be an
important information to improve the marketing performance of SMEs especially in Depok. Therefore, SMEs
can compete with any other business-scale.
Keywords: Demographic Aspects, Business Opportunities, Marketing Strategies, and Business performance
1. Introduction The achievement of national small and
medium businesses has exceeded the
operating performance of large scale. Yet
there are still many limitations and problems
encountered in this scale business that need
to be overcome. One of the problems that is
fundamental is the ability to access the
market.
Using limited resources, small and
medium businesses are not able to compete
in terms of products and services to market
their services. For example, large-scale
businesses can easily access the market
through various promotional advertisements
in the media that have wide broad, such as
TV, national newspapers, and the like. With
the support of a large marketing budget, use
of the stars of the popular ads, making large
scale businesses increasingly look more
easily access and control of the market.
Meanwhile, in the case of small businesses
market their products still rely on marketing
strategies which tend to 'ordinary' alone, such
as creating brochures, leaflets installation,
use and distribution of business cards, and
the like, so the results are less than optimal,
especially when associated with increased
performance expectations business better.
Actually the current small and medium
enterprises have started to use and exploit the
media with wider reach, such as radio and the
Internet (online marketing). But not all small
and medium-sized businesses are able to do
so.
In general we can say that to be
competitive with large-scale effort, it requires
efforts with an emphasis on creative effort,
and jelly in the view of business
opportunities, especially in a niche that has
596
not or is unwilling to enter the large-scale
business.
Business opportunities might come
from many sources, but not all businesses
can view and take advantage of these
opportunities. The importance of
demographic aspects in the development of
business gets increased (Bell, 2002).
Demographic aspects, such as population,
gender and age composition, population
distribution, and other demographic aspects
with a variety of information and market
opportunities can determine a better
marketing strategy (Swanson, 2007).
Demographic information may also help
predict future business opportunities, "You
cannot understand the future without
demographics" (Zolli, 2006). With
demographic information, small and medium
enterprises can also more fully in predicting
market trends in the future (Loreto, 2008)
For example, in a national scale,
Indonesia has a demographic profile as
follows:
The population of Indonesia: 240,271,522
(July 2009 est.)
Age structure of population:
0-14 years: 28.1% (male 34,337,341 / female
33,162,207)
15-64 years: 66% (male 79,549,569 / female
78,918,321)
65 years and over: 6% (male 6,335,208 /
female 7,968,876) (2009 est.)
The average age of residents:
total: 27.6 years
male: 27.1 years
female: 28.1 years (2009 est.)
Urban population: 52% of the total
population (2008)
Ethnic groups:
Sienk 40.6%, Sundanese 15%, Madurese
3.3%, Minangkabau 2.7%, 2.4% Betawi,
Bugis 2.4%, Banten 2%, Banjar 1.7%, other
unspecified or 9.29% (2000 census)
Religion:
Muslim 86.1%, Protestant 5.7%, Roman
Catholic 3%, Hindu 1.8%, other or
unspecified 3.4% (2000 census)
Income per capita: $ 4,000 (2009 est.)
From the information aspects of the
national demographics, national business
should make this as a business opportunity.
The total population of nearly 250 million
represents an enormous market. 66% of the
population aged 15-64 years informing that
businesses can concentrate on producing and
marketing products and services needed by
that age group, and also the needs of the age
group below 15 years are also quite large
(28.1%). Specific products and services can
be focused to the needs of consumers with an
age 20 years, because the data showed a
median age of 27 sd 28 years. There are
many other marketing strategies that can be
taken based on demographic information.
However, the demographic data is still
overlooked by small and medium-sized
businesses. Particularly those related to
demographic data areas or regions in their
respective places of business. If it is done, it
is not an exaggeration to say that so many
business opportunities and market niches that
can be discovered and utilized, can be
arranged so that an appropriate marketing
strategy. Error in seeing opportunities and
define strategies will have a negative impact
in the development of small and medium
business.
Therefore, the demographic aspects
need to be utilized and managed properly,
because Demographic change does not
automatically imply Also Negative
Consequences but creates room for
opportunities (Kohlbacher and Herstatt,
2008).
This paper aims to provide an
overview to the small and medium-sized
businesses in the city of Depok, on the
various business opportunities and niche
markets of the information contained in the
geographic data of Depok, so that businesses
can be more focused in developing business
through marketing strategies.
2. Theory
Demography is one important aspect in
any discussion related to the profile of a
597
nation or region. The definitions of
demography are as the following:
Demography is the scientific study of
population, mainly related to the number /
large population, the structure and its
development (the United Nations
Multilingual Demographic). Demographics
are also defined as the science of learning
about the large, composition, distribution,
and changes in population (Donald J. Bogue,
1885)
Meanwhile, in a popular dictionary
Wikipedia, the demographic is defined as the
study of population dynamics, including
size, structure, and distribution of population,
and how the population changed over time
due to births, deaths, migration and
elderness.
Based on the definitions above,
associated with business opportunities and
marketing strategies, the business
opportunities may arise, loose / reduce,
change according to changes in the
population profile. So the required business
and marketing strategies will also depend on
the changes.
Basically, the ideas and efforts can be
found, felt, and heard every day in the
neighborhood (Ismawan, 2007). From
various sources, business opportunities can
also arise from different events and
phenomena of everyday life, including:
• The ideas and creative efforts of
continuous
• When everyone asks about a product, it is
not available in the market.
• When there are no competitors or others
who want to serve a community need
• When we are only able to provide and
meet those needs
• When the market is still very wide while
the products available is still small and
less (demand greater than the offer)
• When the product has a history of
recurrent or life cycle
• When people are starting not to believe in
the current product
• Although we do not expect, but when a
disaster happens, usually there also exist
opportunities
• When competitors make mistakes in their
products • When the community started to increase
its purchasing ability
The results of research that discussed
the use of demographic information, generate
some findings as follows (Regmi, at.all, 21-
22), among others:
• Low income countries a greater portion of
Spend on their budget on necessities Poor
'food, while Richer countries spend a
greater proportion of on their income on
luxuries. With this result, small and
medium-sized businesses can take some
wisdom, which if existing demographic
information shows the increase in revenue
in the population, then the probability of
producing a fairly small and medium
business 'luxury' will potentially increase
the demand.
• Changes in per capita income of
developing countries are often correlated
with urbanization, which in turn affects
food consumption patterns. The results
can also be input, which if the population
increased their income demographic
information, it will affect the activities of
urbanization.
• Changes in the size, composition and
distribution of the population have
substantial implications for the marketing
of products and services, and over the past
two decades a thriving industry has
emerged, Concerned with the application
of tools to business Demographic (Bell,
2002)
3. Result and Discussion
This Discussion will begin with the
presentation of the demographic profile of
Depok and followed with the implication.
Business strategies can be developed by
small and medium-sized businesses in the
city of Depok.
3.1. Demographic Profiles of Depok
Demographic information shows that
in 2008 Depok has a total population reached
1,503,677 people, consisting of female
populations 723.585 and male populations
598
780.092, with 3.43 percent growth rate and
sex ratio in the city of Depok is 102.
Distribution of the population is based
on the district can be seen in the following
figure.
Figure 1. Population Distribution Based on
Depok District
Source: Population Projections of BPS Depok,
2008, processed
The figure above shows that there are some
districts that have the biggest populations,
namely Sukmajaya and Cimanggis.
Meanwhile, Beji only has 143.190
populations. Based on the age distribution, urban
population of Depok ranges from 25 to 35
years, and at the age of 0 to 10 years. In age
distribution, even with a small difference, but
Male are more than female, for almost age
groups, as shown in the figure below.
Figure 2. Distribution of Population based on
Age and Gender
Source: Population Projections of BPS Depok,
2008, processed
Furthermore, the majority of the
population working in the field of Lodgings
and Communications, Finance, Insurance,
Rental Buildings, Land, and Business
Services (40%), in the field of trade and
hotels (25%), and social services (20%), the
rest work in manufacturing industry and
other fields, as shown in the following figure.
Figure 3. Population Distribution of Depok Based
on Fields of Works
Source : Sakernas , 2007
Related to activities in the population
in the city of Depok, demographic
information shows that the majority of the
population is the status of workers (70%),
school (13%), housekeeping (2%),
unemployed 8%, the rest other status, as
shown in the following figure:
Figure 4. Population Distribution of Depok Based
on Activities Within a Week
Source: Sakernas, 2007
3.2. Depok City Demographic
Implications For Business
Various information from the
demographic profile Depok are often
overlooked by small and medium-sized
businesses in the city of Depok as a source of
business opportunities and the basis for
determining business strategy, particularly in
terms of production and marketing. From
observations in the field very aesthetically,
that the production and marketing process are
based more on market needs and trends of
daily production or orders. There has been no
activity relative production and marketing of
small and medium-sized businesses that are
599
based on certain demographic aspects. As an
example of 'not yet' there are SMEs that do
produce and deliver specific services or
consumers focus more on children, because
they know that in those areas the majority of
its population are children. Also, people have
not yet choosen a business location because
they still focuse on the housewives in certain
areas, after identifying that the majority of
the populations work as housewives.
The selection of target market that is
currently done is generally done by
businesses in almost every business, based on
demand trends, strategic locations, the ease
of raw materials, and so on. Basic
considerations like this is not wrong, but the
use of geographic information is believed to
be a source of alternative business
opportunities for small and medium
enterprises to compete with large-scale effort,
by looking at the existing opportunities and
niche markets and has not been taken by the
big-scale business.
From the description of the
demographic profile of the city of Depok, can
be used by small and medium-sized
businesses to take advantage of business
opportunities that exist with some of the
following business strategies:
1. With a population that reaches
approximately 1.5 million people, try to
get as many customers as possible. With
the successful control of 5% only (about
75,000 people) as customers, profits are
enormous. For example, if 75 thousand
people are willing to buy products with a
net profit of Rp. 100, - only, the total
profits of small and medium businesses
have reached USD 7.5 million, -. When
consumption of the products or services
are performed customers two times in a
month alone, the benefits have been very
promising. By leveraging demographic
information Depok above, to obtain these
benefits, you need to do is one or
kominasi from some of the following:
a. Because most populations are in the
district of Kota Depok Cimanggis and
Sukma java, prioritize and strive to get as
many customers as possible in these two
districts, regardless the markets in other
districts
b. Because the majority of people aged
between 25 sd 35 years and between 0 s.d.
10 years, focus on the products / services
to be marketed as well as productive age
and children. In the garment business,
clothes are prioritized to the needs of
adults and children, because those ages
are very potential market.
c. Because most residents work in the field
of Lodgings and Communications,
Finance, Insurance, Rental Property,
Land, Business Services and also in the
field of trade and hotels, the focus and
priority on the production and services in
this market are prioritized.
d. Because 70% of the population are
workers Depok, production and sell
products and services for workers, such as
work clothes, stationary, electronic
equipment supporting the work, and the
like. Market and college students are also
quite good, so that businesses in this area
can also be performed. e. Pay attention to other geographical
information such as gender composition,
purchasing power, and many more and
and use that information to focus aktivtas
business (production and marketing) for
business opportunities.. f. With a variety of demographic
information, all business ventures,
ranging from product development,
pricing, promotion, other marketing mix,
services should be directed in accordance
with the options specified demographic
information.
‘Conventional’ Production and
marketing strategies 'conventional' which is
currently been undertaken by small and
medium-sized businesses in the city of
Depok, still remains relevant to perform, but
need to be synergized with the existing
demographic information in Depok.
3.3. Other Demographic Pattern
In addition to demographic
information in Depok, small businesses and
medium enterprises can also use the
information from the demographic pattern
that has been generated by some previous
600
studies, with some adjustments. One of these
demographic patterns are the following. Source : www.ers.usda.gov.
The table above shows that
information for the Indonesian population
(including those in low-income groups) when
the study was made, most of the budget
allocated for food consumption and tobacco /
cigarettes (52.58%), followed by some
budget allocations on the consumption of
other commodities. From the global
information business small and medium
enterprises in Depok City can also take the
information that in Indonesia, Depok City is
no exception, the field of food and tobacco
businesses do have the greatest business
opportunities, followed by business
opportunities in other commodities.
4. Conclusions and Recommendations
Efforts to increase the performance of
small and medium enterprises can be done in
various ways. Business strategy, particularly
in terms of producing and marketing
products and services are made at this time
for granted, but the perpetrators of this
business, especially in the city of Depok, still
seems to forget and not take advantage of a
variety of demographic information
available.
Demographic information is
specifically can be the basis of business
segments, at least for purposes of
determining the intended market,
determining the type of product to be
produced and marketed, the price to be
determined, and so on, whether for business
or for the prediction of current and future
business .
In the city of Depok, small and
medium-sized businesses can produce and
market in the region with the greatest
concentration of population (Cimanggis and
Sukmajaya), with a more obvious target age,
they are children and adults with a focus on
the workers. Marketing to the needs of
students are potential as well.
Taking advantage of this demographic
information Depok City, a business strategy
that has been done before can be equipped
with a strategy based on the demographic
aspects of this, so the results can be
improved, and mistakes can be reduced.
Finally, the authors recommend a few
things as follows:
1. To the provider of demographic data for
those institutions (government, Bapeda,
BPS Depok, NGOs, Universities and
colleges), they should be willing to
publish data or studies demographics for
the benefit of small and medium
enterprises with access to demographic
data more easily and cheaply.
2. To small and medium-sized businesses,
use a variety of geographic information as
often and as much as possible to complete
the analysis of business opportunities and
determine strategies that have been made
at this time, so that mistakes can be
avoided and measures of business
performance can be improved.
Reference Andrew Zolli, 2006, Demographics: The
Population Hourglass
Anita Regmi, at al., Cross-Country Analysis
of Food Consumption Patterns, Changing
Structure of Global Food Consumption and
Trade / WRS-01-1, Economic Research
Service/USDA
Biro Pusat Statistik Kota Depok, Kota Depok
Dalam Angka 2009
David A. Swanson and Peter A. Morrison,
2007 Teaching Business Demography Using
Case Studies*
Food Corporate Document Repository, FAO,
Global and regional food consumption
patterns and trends
601
James Seale, Jr., Anita Regmi, and Jason
Bernstein, 2003, International Evidence on
Food Consumption Patterns, Technical
Bulletin Number 1904
Kohlbacher dan Herstatt, 2008, The Silver
Market Phenomenon
Martin Bell, The Business of Demography,
School of Geography, Planning and
Architecture, The University of Queensland,
Queensland 4072 , Paper prepared for the
Eleventh Biennial Conference of the
Australian Population Association, Sydney,
2-4 October 2002
Richard Loreto, ….., A Window on the
Future:The Impacts of Demographic Trends
on Your Business, Applying Demographics
to Business Strategy
http://www.woopidoo.com/articles/ra2-
business-ideas.htm
http://www.woopidoo.com/articles/jimrohn3
opportunity.htm
123independenceday.com.
603
The Effect of Price Discount and Word-of-Mouth toward
Consumer’s Purchase Intention and Willingness to Pay
(Case Study on Crocs™)
Ivan Prasetya, Mustika Sufiati Purwanegara
School of Business and Management (SBM), Bandung Institute of Technology (ITB), Indonesia
Abstract
Objectives – This study aims to seek evidence if there are any differences between purchase intention and
willingness to pay. In addition, this study also aims to find out the effects of price discount and word-of-mouth
on the consumer’s purchase intention and their willingness to pay.
Research Design/Methodology – This study uses lab experimental design. Respondents are divided into two
groups. In the first group, they are given a 50% discount treatment and a positive word-of-mouth, while in the
second group, they are given a 70% discount treatment and a negative word-of-mouth. Multivariate Analysis
of Variance (MANOVA) is used to see how independent variables – price discount and moderating variable –
word-of-mouth influence the dependent variable – purchase intention and willingness to pay.
Findings – The results of this study indicate that consumers have a more positive attitude on purchase
intention than the willingness to pay. Consumers also have a more positive attitude on providing a greater
discount. In addition, word-of-mouth influences consumer attitudes. Positive word-of-mouth that is given in
the first group (with a 50% discount) improves consumer’s purchase intention and raises the willingness to
pay to be greater than in the second group who receives a negative word-of-mouth (with 70% discount).
Keywords: price discount, word-of-mouth, purchase intention, willingness to pay, Crocs™
1. Introduction In human life, footwear is one of the basic
needs that must always be fulfilled. Viewed
from functional aspect, people use footwear to
protect their foots from rough objects and dirt.
But now, in choosing footwear, people tend to
be more concerned with the emotional aspect
rather than the functional itself. By wearing
certain type, model and design of footwear,
many people wish to be more fashionable and
cool.
Crocs, Inc. is a footwear company that was
founded in 2002 by George B. Boedecker, Jr.
and is headquartered in Colorado, United States.
The core product are shoes for children, men
and women with Crocs™ trademark. All
Crocs™ brand shoes feature Crocs’ proprietary
closed-cell resin, Croslite™, which represents a
substantial innovation in footwear. The
Croslite™ material enables Crocs to produce
soft, comfortable, lightweight, superior-
gripping, non-marking and odor-resistant shoes.
Originally, its products designed
specifically as spa slipper (for health) and
footwear in outdoor activities (anti slip
footwear). But, since Crocs™ introduced its
products at Florida Boat Show Exhibitions, its
popularity had soared rapidly. Today, Crocs ™
products are sold in over 125 countries and
available in various models and colors.
Currently, we can easily find people
wearing Crocs™ in many big cities in
Indonesia. This opportunity is seized by
businessmen (mainly from China) to produce
non-genuine (aka counterfeit aka replica) crocs
products at a lower price.
If a pair of authentic Crocs™ is priced
around Rp 450.000, now we can buy a pair of
crocs look-alike with only Rp 20.000, even
though its quality is far below the authentic one.
If we want to have a crocs replica with a quality
that's about the same with authentic Crocs™,
they are available in the market for around Rp
200.000. Although the price of crocs replica is
far below than the authentic one, many
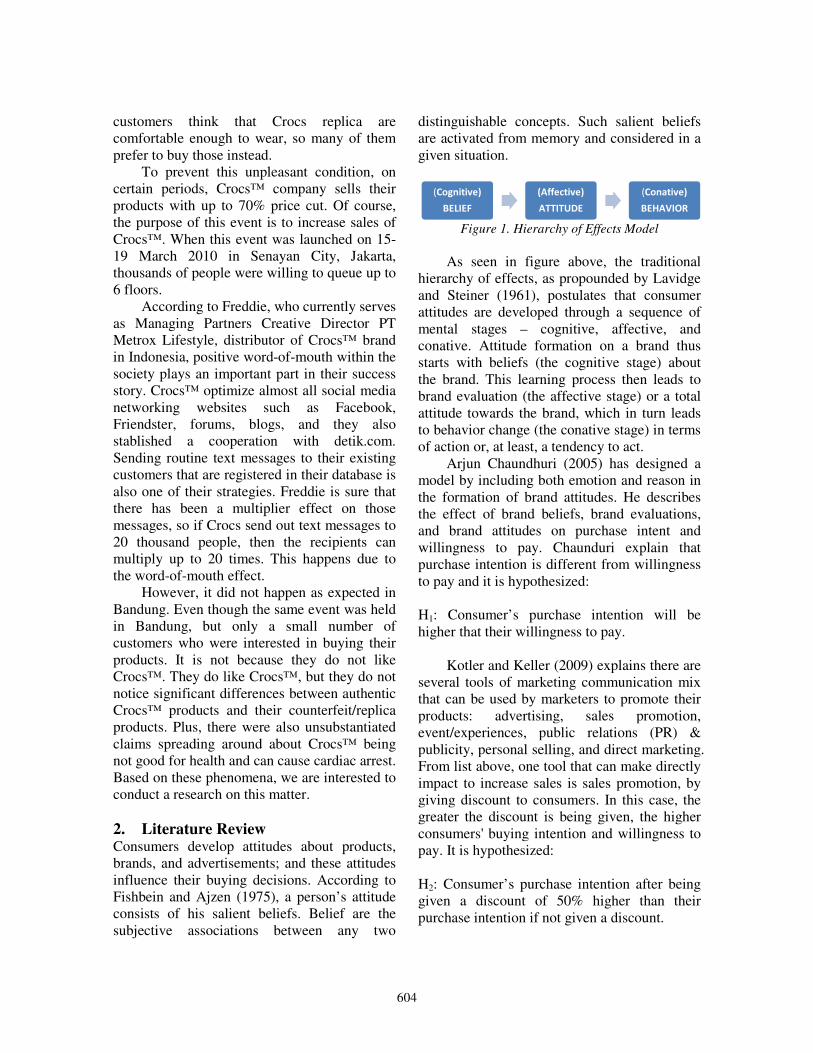
604
customers think that Crocs replica are
comfortable enough to wear, so many of them
prefer to buy those instead.
To prevent this unpleasant condition, on
certain periods, Crocs™ company sells their
products with up to 70% price cut. Of course,
the purpose of this event is to increase sales of
Crocs™. When this event was launched on 15-
19 March 2010 in Senayan City, Jakarta,
thousands of people were willing to queue up to
6 floors.
According to Freddie, who currently serves
as Managing Partners Creative Director PT
Metrox Lifestyle, distributor of Crocs™ brand
in Indonesia, positive word-of-mouth within the
society plays an important part in their success
story. Crocs™ optimize almost all social media
networking websites such as Facebook,
Friendster, forums, blogs, and they also
stablished a cooperation with detik.com.
Sending routine text messages to their existing
customers that are registered in their database is
also one of their strategies. Freddie is sure that
there has been a multiplier effect on those
messages, so if Crocs send out text messages to
20 thousand people, then the recipients can
multiply up to 20 times. This happens due to
the word-of-mouth effect.
However, it did not happen as expected in
Bandung. Even though the same event was held
in Bandung, but only a small number of
customers who were interested in buying their
products. It is not because they do not like
Crocs™. They do like Crocs™, but they do not
notice significant differences between authentic
Crocs™ products and their counterfeit/replica
products. Plus, there were also unsubstantiated
claims spreading around about Crocs™ being
not good for health and can cause cardiac arrest.
Based on these phenomena, we are interested to
conduct a research on this matter.
2. Literature Review Consumers develop attitudes about products,
brands, and advertisements; and these attitudes
influence their buying decisions. According to
Fishbein and Ajzen (1975), a person’s attitude
consists of his salient beliefs. Belief are the
subjective associations between any two
distinguishable concepts. Such salient beliefs
are activated from memory and considered in a
given situation.
Figure 1. Hierarchy of Effects Model
As seen in figure above, the traditional
hierarchy of effects, as propounded by Lavidge
and Steiner (1961), postulates that consumer
attitudes are developed through a sequence of
mental stages – cognitive, affective, and
conative. Attitude formation on a brand thus
starts with beliefs (the cognitive stage) about
the brand. This learning process then leads to
brand evaluation (the affective stage) or a total
attitude towards the brand, which in turn leads
to behavior change (the conative stage) in terms
of action or, at least, a tendency to act.
Arjun Chaundhuri (2005) has designed a
model by including both emotion and reason in
the formation of brand attitudes. He describes
the effect of brand beliefs, brand evaluations,
and brand attitudes on purchase intent and
willingness to pay. Chaunduri explain that
purchase intention is different from willingness
to pay and it is hypothesized:
H1: Consumer’s purchase intention will be
higher that their willingness to pay.
Kotler and Keller (2009) explains there are
several tools of marketing communication mix
that can be used by marketers to promote their
products: advertising, sales promotion,
event/experiences, public relations (PR) &
publicity, personal selling, and direct marketing.
From list above, one tool that can make directly
impact to increase sales is sales promotion, by
giving discount to consumers. In this case, the
greater the discount is being given, the higher
consumers' buying intention and willingness to
pay. It is hypothesized:
H2: Consumer’s purchase intention after being
given a discount of 50% higher than their
purchase intention if not given a discount.
(Cognitive)
BELIEF
(Affective)
ATTITUDE
(Conative)
BEHAVIOR
605
H3: Consumer’s purchase intention after being
given a discount of 70% higher than their
purchase intention if not given a discount.
H4: Consumer’s purchase intention by giving
discount of 70% is higher than if only given a
discount of 50%
H5: Consumer’s willingness to pay after being
given a discount of 50% higher than their
willingness to pay if not given a discount.
H6: Consumer’s willingness to pay after being
given a discount of 70% higher than their
willingness to pay if not given a discount.
H7: Consumer’s willingness to pay by giving
discount of 70% is higher than if only given a
discount of 50%.
In 1940, Paul Lazarsfeld, founder of the
doctoral degrees in Mathematics and the
Bureau of Applied Social Research, conducted
interviews of 600 Erie Country residents (Ohio,
USA). The goal is to find out how big the mass
media role in changing the choices of voters in
General Election.
At that time people thought that the mass
media very effectively change the choices of
voters. That's why millions dollars spent on
campaigns of candidates on mass media such as
radio and newspapers. Apparently,
Lazardsfeld’s finding is astonishing and shows
that the influence of mass media on the choice
of voters is very small.
These results make Lazardsfeld propose
theorem about "Two Steps Flow of
Communication". At the first step, the mass
media should influence opinion leaders. And
then, opinion leaders will influence other
individuals. Other Lazardsfeld’s research shows
that the influence of mass media is much
smaller than word-of-mouth.
According to George R. Silverman, as
quoted in the book Marketing Communication
(2005:193), “word-of-mouth was positive or
negative communication of products, services,
and ideas via personal communication of
people who have no commercial vested interest
in making that recommendation”.
Figure 2. Theoritical Framework
For this case, although price discount
could increase consumer’s purchase intention
and willingness to pay, but if consumer
previously received negative word-of-mouth,
then it will reduce their purchase intention and
willingness to pay. And it is hipothesized:
H8: Positive word-of-mouth will increase
consumer’s purchase intention.
H9: Negative word-of-mouth will decrease
consumer’s purchase intention.
H10: Although giving a discount of 50% lower
than 70%, but because the existence of word-
of-mouth, consumer’s purchase intentions by
being given a discount of 50% with positive
word-of-mouth will be higher than consumer’s
purchase intention by given discount of 70%
with negative word-of-mouth.
H11: Positive word-of-mouth will increase
consumer’s willingness to pay.
H12: Negative word-of-mouth will decrease
consumer’s willingness to pay.
H13: Although giving a discount of 50% lower
than 70%, but because the existence of word-
of-mouth, consumer’s willingness to pay by
being given a discount of 50% with positive
word-of-mouth will be higher than consumer’s
willingness to pay by given discount of 70%
with negative word-of-mouth.
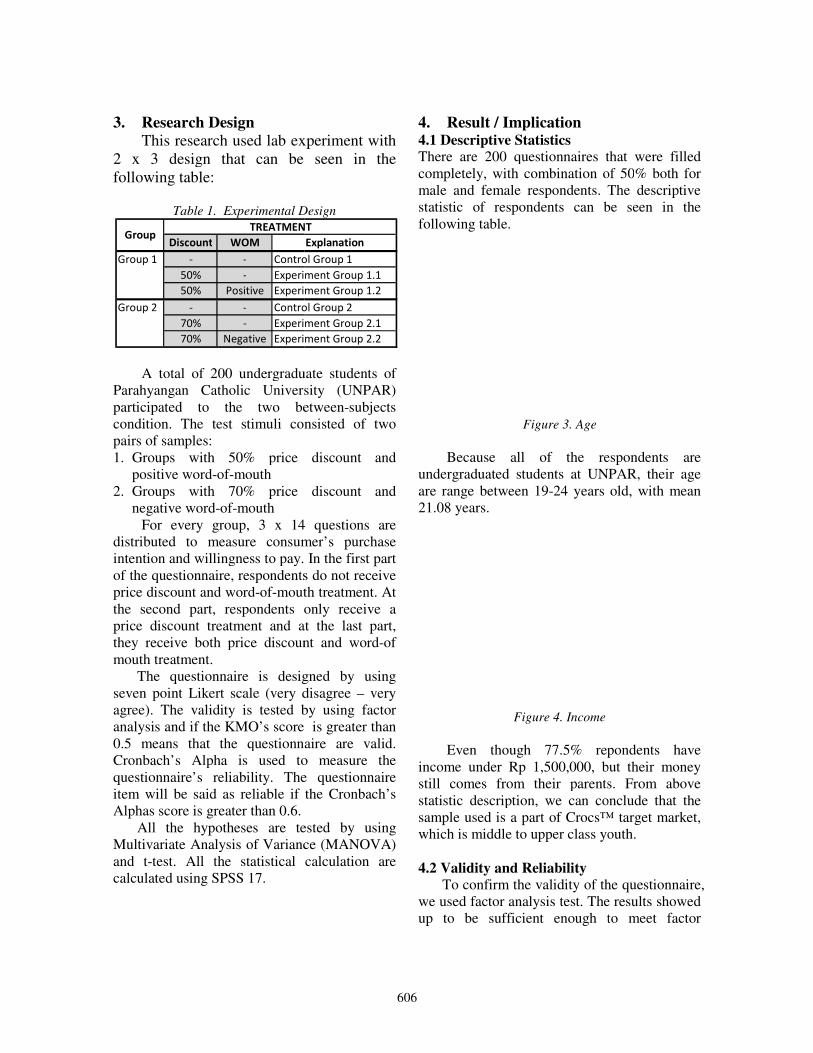
3. Research Design
This research used lab experiment with
2 x 3 design that can be seen in the
following table:
Table 1. Experimental Design
A total of 200 undergraduat
Parahyangan Catholic University (UNPAR)
participated to the two between
condition. The test stimuli consisted of two
pairs of samples:
1. Groups with 50% price discount and
positive word-of-mouth
2. Groups with 70% price discount and
negative word-of-mouth
For every group, 3 x 14 questions are
distributed to measure consumer’s purchase
intention and willingness to pay.
of the questionnaire, respondents
price discount and word-of-mouth treatment. At
the second part, respondents only receive a
price discount treatment and at the last part,
they receive both price discount and word
mouth treatment.
The questionnaire is design
seven point Likert scale (very disag
agree). The validity is tested by using factor
analysis and if the KMO’s score is greater than
0.5 means that the questionnaire are valid.
Cronbach’s Alpha is used to measure the
questionnaire’s reliability. The questionnaire
item will be said as reliable if the Cronbach’s
Alphas score is greater than 0.6.
All the hypotheses are tested by using
Multivariate Analysis of Variance (MANOVA)
and t-test. All the statistical calculation are
calculated using SPSS 17.
Discount WOM
Group 1 - - Control Group 1
50% - Experiment Group 1.1
50% Positive Experiment Group 1.2
Group 2 - - Control Group 2
70% - Experiment Group 2.1
70% Negative Experiment Group 2.2
TREATMENTGroup
606
This research used lab experiment with
2 x 3 design that can be seen in the
Table 1. Experimental Design
undergraduate students of
Parahyangan Catholic University (UNPAR)
participated to the two between-subjects
muli consisted of two
Groups with 50% price discount and
70% price discount and
For every group, 3 x 14 questions are
distributed to measure consumer’s purchase
lingness to pay. In the first part
questionnaire, respondents do not receive
mouth treatment. At
part, respondents only receive a
price discount treatment and at the last part,
they receive both price discount and word-of
is designed by using
disagree – very
The validity is tested by using factor
analysis and if the KMO’s score is greater than
0.5 means that the questionnaire are valid.
Cronbach’s Alpha is used to measure the
questionnaire’s reliability. The questionnaire
as reliable if the Cronbach’s
Alphas score is greater than 0.6.
All the hypotheses are tested by using
Multivariate Analysis of Variance (MANOVA)
test. All the statistical calculation are
4. Result / Implication 4.1 Descriptive Statistics There are 200 questionnaires that
completely, with combination of 50
male and female respondents. The descriptive
statistic of respondents can be seen in the
following table.
Figure 3. Age
Because all of the respondents are
undergraduated students at UNPAR, their age
are range between 19-24 years old, with mean
21.08 years.
Figure 4. Income
Even though 77.5% repondents have
income under Rp 1,500,000, but their money
still comes from their parents. From above
statistic description, we can conclude that the
sample used is a part of Crocs™
which is middle to upper class youth.
4.2 Validity and Reliability
To confirm the validity of the questionnaire,
we used factor analysis test. The
up to be sufficient enough to meet factor
Explanation
Control Group 1
Experiment Group 1.1
Experiment Group 1.2
Control Group 2
Experiment Group 2.1
Experiment Group 2.2
TREATMENT
questionnaires that were filled
combination of 50% both for
The descriptive
statistic of respondents can be seen in the
respondents are
undergraduated students at UNPAR, their age
24 years old, with mean
Even though 77.5% repondents have
1,500,000, but their money
still comes from their parents. From above
statistic description, we can conclude that the
™ target market,
which is middle to upper class youth.
ty of the questionnaire,
he results showed
to be sufficient enough to meet factor
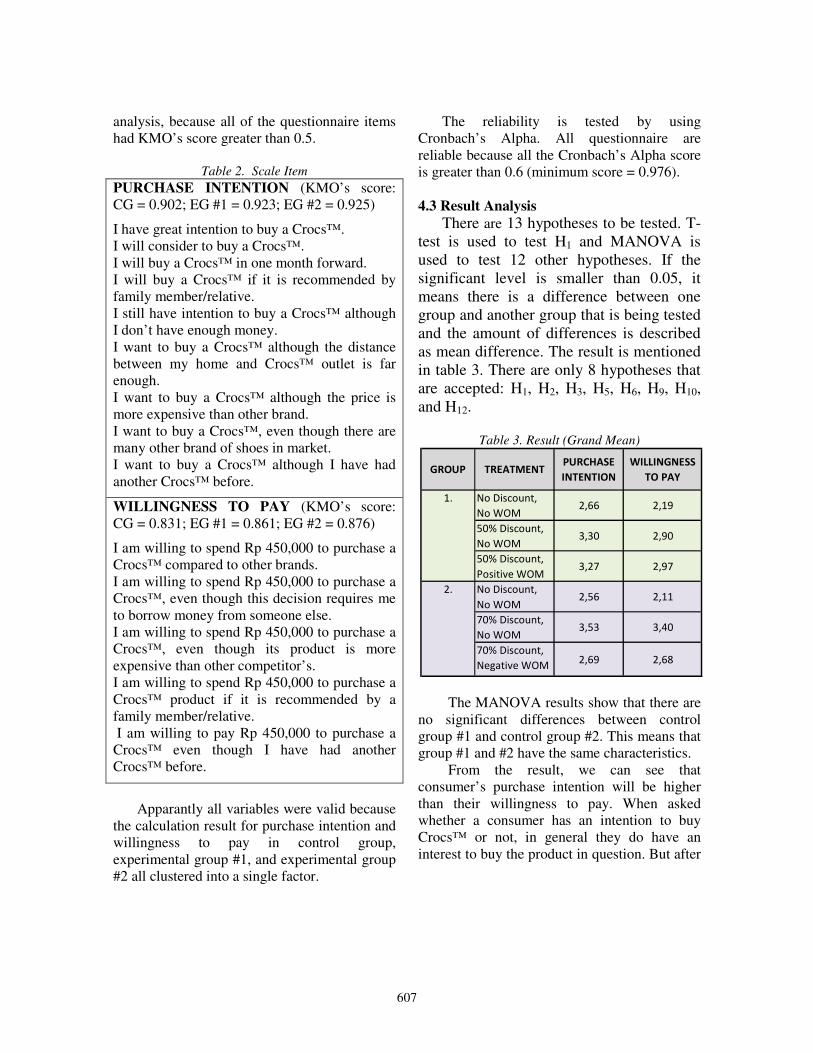
607
analysis, because all of the questionnaire items
had KMO’s score greater than 0.5.
Table 2. Scale Item
PURCHASE INTENTION (KMO’s score:
CG = 0.902; EG #1 = 0.923; EG #2 = 0.925)
I have great intention to buy a Crocs™.
I will consider to buy a Crocs™.
I will buy a Crocs™ in one month forward.
I will buy a Crocs™ if it is recommended by
family member/relative.
I still have intention to buy a Crocs™ although
I don’t have enough money.
I want to buy a Crocs™ although the distance
between my home and Crocs™ outlet is far
enough.
I want to buy a Crocs™ although the price is
more expensive than other brand.
I want to buy a Crocs™, even though there are
many other brand of shoes in market.
I want to buy a Crocs™ although I have had
another Crocs™ before.
WILLINGNESS TO PAY (KMO’s score:
CG = 0.831; EG #1 = 0.861; EG #2 = 0.876)
I am willing to spend Rp 450,000 to purchase a
Crocs™ compared to other brands.
I am willing to spend Rp 450,000 to purchase a
Crocs™, even though this decision requires me
to borrow money from someone else.
I am willing to spend Rp 450,000 to purchase a
Crocs™, even though its product is more
expensive than other competitor’s.
I am willing to spend Rp 450,000 to purchase a
Crocs™ product if it is recommended by a
family member/relative.
I am willing to pay Rp 450,000 to purchase a
Crocs™ even though I have had another
Crocs™ before.
Apparantly all variables were valid because
the calculation result for purchase intention and
willingness to pay in control group,
experimental group #1, and experimental group
#2 all clustered into a single factor.
The reliability is tested by using
Cronbach’s Alpha. All questionnaire are
reliable because all the Cronbach’s Alpha score
is greater than 0.6 (minimum score = 0.976).
4.3 Result Analysis
There are 13 hypotheses to be tested. T-
test is used to test H1 and MANOVA is
used to test 12 other hypotheses. If the
significant level is smaller than 0.05, it
means there is a difference between one
group and another group that is being tested
and the amount of differences is described
as mean difference. The result is mentioned
in table 3. There are only 8 hypotheses that
are accepted: H1, H2, H3, H5, H6, H9, H10,
and H12.
Table 3. Result (Grand Mean)
The MANOVA results show that there are
no significant differences between control
group #1 and control group #2. This means that
group #1 and #2 have the same characteristics.
From the result, we can see that
consumer’s purchase intention will be higher
than their willingness to pay. When asked
whether a consumer has an intention to buy
Crocs™ or not, in general they do have an
interest to buy the product in question. But after
GROUP TREATMENTPURCHASE
INTENTION
WILLINGNESS
TO PAY
1. No Discount,
No WOM2,66 2,19
50% Discount,
No WOM3,30 2,90
50% Discount,
Positive WOM3,27 2,97
2. No Discount,
No WOM2,56 2,11
70% Discount,
No WOM3,53 3,40
70% Discount,
Negative WOM2,69 2,68
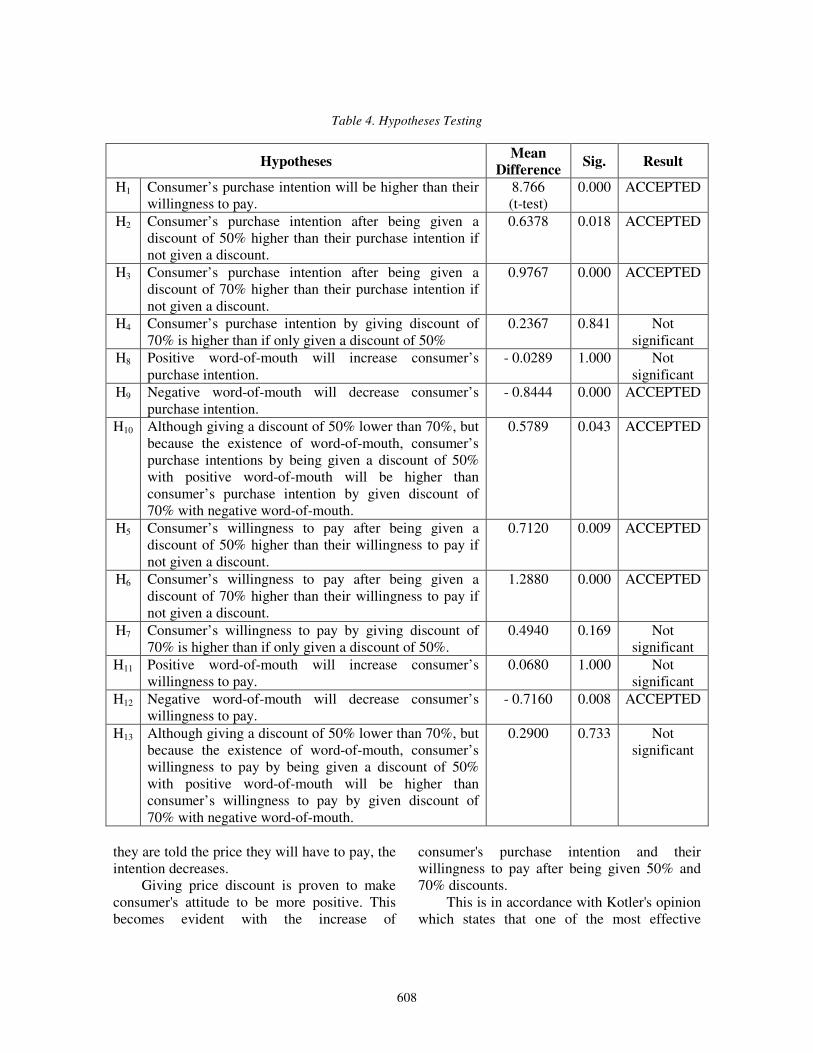
608
Table 4. Hypotheses Testing
Hypotheses Mean
Difference Sig. Result
H1 Consumer’s purchase intention will be higher than their
willingness to pay.
8.766
(t-test)
0.000 ACCEPTED
H2 Consumer’s purchase intention after being given a
discount of 50% higher than their purchase intention if
not given a discount.
0.6378 0.018 ACCEPTED
H3 Consumer’s purchase intention after being given a
discount of 70% higher than their purchase intention if
not given a discount.
0.9767 0.000 ACCEPTED
H4 Consumer’s purchase intention by giving discount of
70% is higher than if only given a discount of 50%
0.2367 0.841 Not
significant
H8 Positive word-of-mouth will increase consumer’s
purchase intention.
- 0.0289 1.000 Not
significant
H9 Negative word-of-mouth will decrease consumer’s
purchase intention.
- 0.8444 0.000 ACCEPTED
H10 Although giving a discount of 50% lower than 70%, but
because the existence of word-of-mouth, consumer’s
purchase intentions by being given a discount of 50%
with positive word-of-mouth will be higher than
consumer’s purchase intention by given discount of
70% with negative word-of-mouth.
0.5789 0.043 ACCEPTED
H5 Consumer’s willingness to pay after being given a
discount of 50% higher than their willingness to pay if
not given a discount.
0.7120 0.009 ACCEPTED
H6 Consumer’s willingness to pay after being given a
discount of 70% higher than their willingness to pay if
not given a discount.
1.2880 0.000 ACCEPTED
H7 Consumer’s willingness to pay by giving discount of
70% is higher than if only given a discount of 50%.
0.4940 0.169 Not
significant
H11 Positive word-of-mouth will increase consumer’s
willingness to pay.
0.0680 1.000 Not
significant
H12 Negative word-of-mouth will decrease consumer’s
willingness to pay.
- 0.7160 0.008 ACCEPTED
H13 Although giving a discount of 50% lower than 70%, but
because the existence of word-of-mouth, consumer’s
willingness to pay by being given a discount of 50%
with positive word-of-mouth will be higher than
consumer’s willingness to pay by given discount of
70% with negative word-of-mouth.
0.2900 0.733 Not
significant
they are told the price they will have to pay, the
intention decreases.
Giving price discount is proven to make
consumer's attitude to be more positive. This
becomes evident with the increase of
consumer's purchase intention and their
willingness to pay after being given 50% and
70% discounts.
This is in accordance with Kotler's opinion
which states that one of the most effective
609
marketing communication tools in increasing
sales is sales promotion, in which one of the
tools used is by giving price discount.
However, giving a greater price discount
does not improve consumer's attitude
significantly. This is proven by a lack of
significant difference in consumer's purchase
intention and their willingness to pay after
being given a 70%, compared with being given
a 50% discount.
Even though giving discounts can make
consumer's attitude be more positive, but if that
consumer has had a negative word-of-mouth,
then it will decrease the consumer's purchase
intention and willingness to pay. Even though
the company gives a 70% discount, but if there
is a negative word-of-mouth, then the
consumer's attitude is no different than those
without a discount and without word-of-mouth
(control group).
Even though a negative word-of-mouth is
greatly harmful, but the existence of positive
word-of-mouth does not give beneficial effects
to the company. This is proven by the
consumer’s attitude that is not different before
and after having a positive WOM treatment
(experimental group 1.1 and 1.2).
5. Conclusion From this research, we can conclude that
there is a difference between consumer’s
purchase intention and their willingness to pay.
Giving price discount can turn both consumers’
attitudes to a positive direction
However, the company needs to be
cautious when planning their promotional
strategy because the cost to hold a sale event is
not cheap. In the other hand, even if the
company keeps on the promotion, but if the
community has been spoiled by negative
rumors, this can decrease the positive effect
from the price discount, so the consumer’s
purchase intention and their willingness to pay
will stay low.
This research has some limitations. The
first limitation is the chosen respondents are
UNPAR students, so it is probable that the
phenomenon only occurs in UNPAR, for teens
and youths aged 19-24 and from middle class to
upper class social status.
The second limitation is that we only use
one communication mix tool which is sales
promotion (by using price discount), out of 6
communication mix tools available, so that this
research cannot be generalized to measure the
effect of communication mix toward
consumer’s attitude.
The third limitation is the product being
analyzed is Crocs™. This will not hold true
when implemented to other products. Maybe in
the future, there will be another research to fix
current limitations.
References Chaunduri, Arjun, (2006), “Emotion and
Reason in Consumer Behavior,” Elsevier:
Oxford.
Kotler, P. and K. L. Keller. (2009). 13th edition.
“Marketing Management,” New Jersey:
Prentice Hall, Inc.
Mowen, J. C. and Minor, M. S. (2002). 4th
edition. “Consumer Behavior,” New Jersey:
Prentice Hall.
Schiffman, L. G. and Leslie Kazar Kanuk.
(2004). 8th edition. “Consumer Behavior,” New
Jersey: Prentice Hall, Inc.
Sekaran, Uma. (2003). 4th edition. “Research
Methods for Business; A skill-Building
Approach,” New York: John Wiley and Sons.
Silverman, George R. (2005). Marketing
Communication. New York: Oxford.
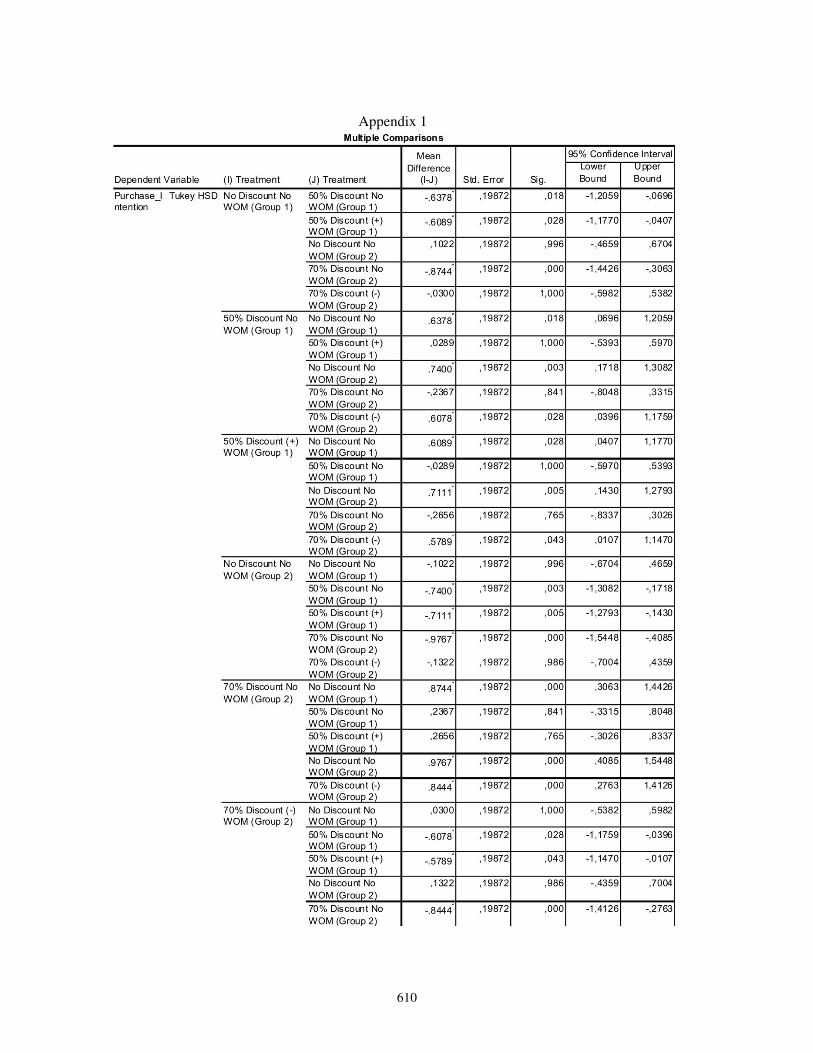
610
Appendix 1
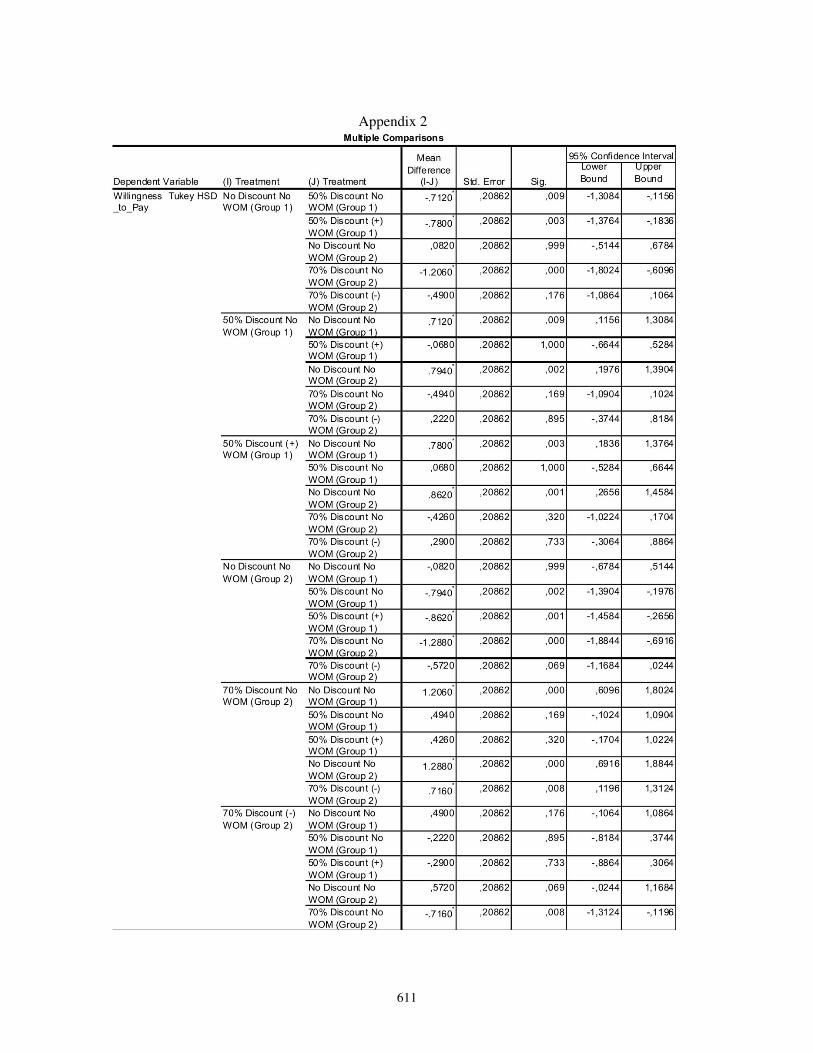
611
Appendix 2
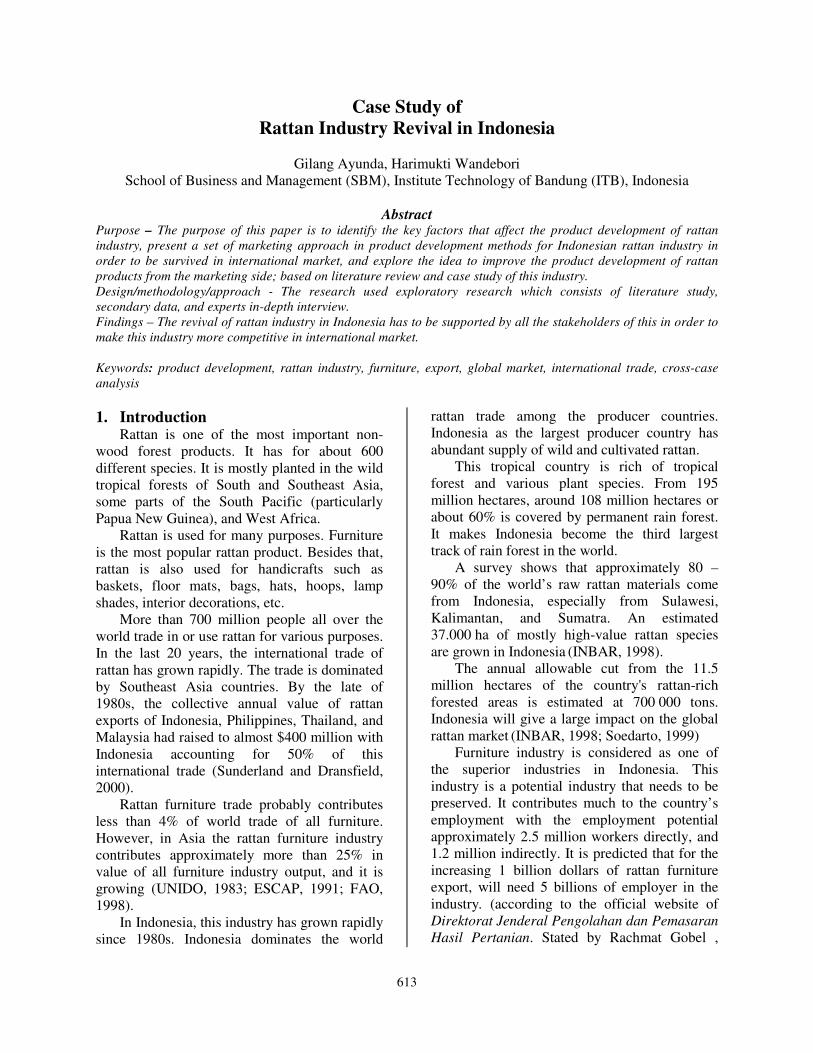
613
Case Study of
Rattan Industry Revival in Indonesia
Gilang Ayunda, Harimukti Wandebori
School of Business and Management (SBM), Institute Technology of Bandung (ITB), Indonesia
Abstract
Purpose – The purpose of this paper is to identify the key factors that affect the product development of rattan
industry, present a set of marketing approach in product development methods for Indonesian rattan industry in
order to be survived in international market, and explore the idea to improve the product development of rattan
products from the marketing side; based on literature review and case study of this industry.
Design/methodology/approach - The research used exploratory research which consists of literature study,
secondary data, and experts in-depth interview.
Findings – The revival of rattan industry in Indonesia has to be supported by all the stakeholders of this in order to
make this industry more competitive in international market.
Keywords: product development, rattan industry, furniture, export, global market, international trade, cross-case
analysis
1. Introduction Rattan is one of the most important non-
wood forest products. It has for about 600
different species. It is mostly planted in the wild
tropical forests of South and Southeast Asia,
some parts of the South Pacific (particularly
Papua New Guinea), and West Africa.
Rattan is used for many purposes. Furniture
is the most popular rattan product. Besides that,
rattan is also used for handicrafts such as
baskets, floor mats, bags, hats, hoops, lamp
shades, interior decorations, etc.
More than 700 million people all over the
world trade in or use rattan for various purposes.
In the last 20 years, the international trade of
rattan has grown rapidly. The trade is dominated
by Southeast Asia countries. By the late of
1980s, the collective annual value of rattan
exports of Indonesia, Philippines, Thailand, and
Malaysia had raised to almost $400 million with
Indonesia accounting for 50% of this
international trade (Sunderland and Dransfield,
2000).
Rattan furniture trade probably contributes
less than 4% of world trade of all furniture.
However, in Asia the rattan furniture industry
contributes approximately more than 25% in
value of all furniture industry output, and it is
growing (UNIDO, 1983; ESCAP, 1991; FAO,
1998).
In Indonesia, this industry has grown rapidly
since 1980s. Indonesia dominates the world
rattan trade among the producer countries.
Indonesia as the largest producer country has
abundant supply of wild and cultivated rattan.
This tropical country is rich of tropical
forest and various plant species. From 195
million hectares, around 108 million hectares or
about 60% is covered by permanent rain forest.
It makes Indonesia become the third largest
track of rain forest in the world.
A survey shows that approximately 80 –
90% of the world’s raw rattan materials come
from Indonesia, especially from Sulawesi,
Kalimantan, and Sumatra. An estimated
37.000 ha of mostly high-value rattan species
are grown in Indonesia (INBAR, 1998).
The annual allowable cut from the 11.5
million hectares of the country's rattan-rich
forested areas is estimated at 700 000 tons.
Indonesia will give a large impact on the global
rattan market (INBAR, 1998; Soedarto, 1999)
Furniture industry is considered as one of
the superior industries in Indonesia. This
industry is a potential industry that needs to be
preserved. It contributes much to the country’s
employment with the employment potential
approximately 2.5 million workers directly, and
1.2 million indirectly. It is predicted that for the
increasing 1 billion dollars of rattan furniture
export, will need 5 billions of employer in the
industry. (according to the official website of
Direktorat Jenderal Pengolahan dan Pemasaran
Hasil Pertanian. Stated by Rachmat Gobel ,
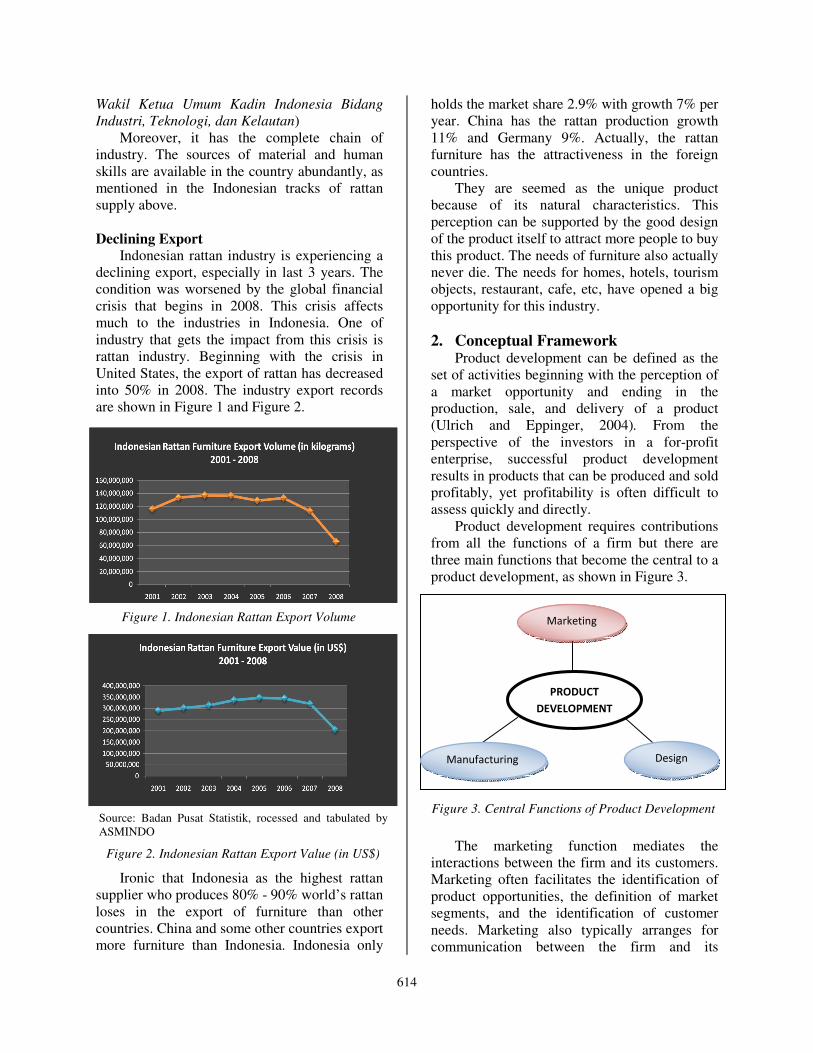
614
Wakil Ketua Umum Kadin Indonesia Bidang
Industri, Teknologi, dan Kelautan)
Moreover, it has the complete chain of
industry. The sources of material and human
skills are available in the country abundantly, as
mentioned in the Indonesian tracks of rattan
supply above.
Declining Export
Indonesian rattan industry is experiencing a
declining export, especially in last 3 years. The
condition was worsened by the global financial
crisis that begins in 2008. This crisis affects
much to the industries in Indonesia. One of
industry that gets the impact from this crisis is
rattan industry. Beginning with the crisis in
United States, the export of rattan has decreased
into 50% in 2008. The industry export records
are shown in Figure 1 and Figure 2.
Ironic that Indonesia as the highest rattan
supplier who produces 80% - 90% world’s rattan
loses in the export of furniture than other
countries. China and some other countries export
more furniture than Indonesia. Indonesia only
holds the market share 2.9% with growth 7% per
year. China has the rattan production growth
11% and Germany 9%. Actually, the rattan
furniture has the attractiveness in the foreign
countries.
They are seemed as the unique product
because of its natural characteristics. This
perception can be supported by the good design
of the product itself to attract more people to buy
this product. The needs of furniture also actually
never die. The needs for homes, hotels, tourism
objects, restaurant, cafe, etc, have opened a big
opportunity for this industry.
2. Conceptual Framework Product development can be defined as the
set of activities beginning with the perception of
a market opportunity and ending in the
production, sale, and delivery of a product
(Ulrich and Eppinger, 2004). From the
perspective of the investors in a for-profit
enterprise, successful product development
results in products that can be produced and sold
profitably, yet profitability is often difficult to
assess quickly and directly.
Product development requires contributions
from all the functions of a firm but there are
three main functions that become the central to a
product development, as shown in Figure 3.
The marketing function mediates the
interactions between the firm and its customers.
Marketing often facilitates the identification of
product opportunities, the definition of market
segments, and the identification of customer
needs. Marketing also typically arranges for
communication between the firm and its
PRODUCT
DEVELOPMENT
Design Manufacturing
Marketing
Figure 3. Central Functions of Product Development
Figure 1. Indonesian Rattan Export Volume
(in kilograms)
Figure 2. Indonesian Rattan Export Value (in US$)
Source: Badan Pusat Statistik, rocessed and tabulated by
ASMINDO
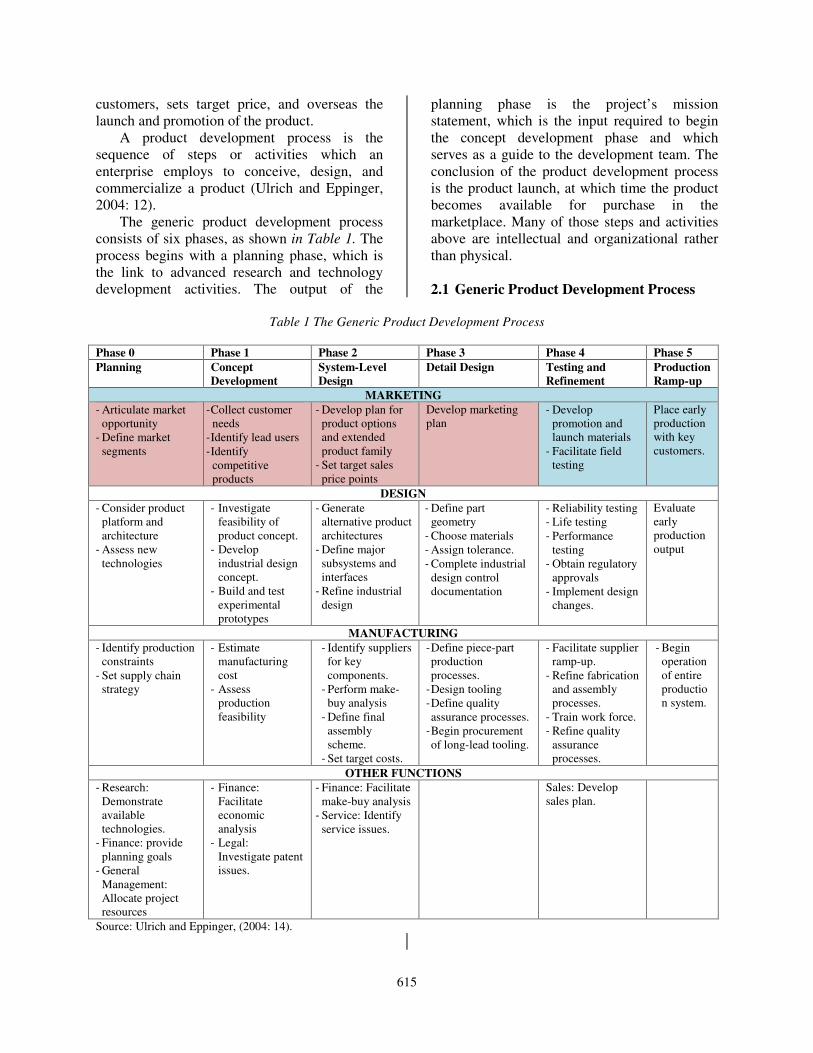
615
customers, sets target price, and overseas the
launch and promotion of the product.
A product development process is the
sequence of steps or activities which an
enterprise employs to conceive, design, and
commercialize a product (Ulrich and Eppinger,
2004: 12).
The generic product development process
consists of six phases, as shown in Table 1. The
process begins with a planning phase, which is
the link to advanced research and technology
development activities. The output of the
planning phase is the project’s mission
statement, which is the input required to begin
the concept development phase and which
serves as a guide to the development team. The
conclusion of the product development process
is the product launch, at which time the product
becomes available for purchase in the
marketplace. Many of those steps and activities
above are intellectual and organizational rather
than physical.
2.1 Generic Product Development Process
Table 1 The Generic Product Development Process
Phase 0 Phase 1 Phase 2 Phase 3 Phase 4 Phase 5
Planning Concept
Development
System-Level
Design
Detail Design Testing and
Refinement
Production
Ramp-up
MARKETING
- Articulate market
opportunity
- Define market
segments
- Collect customer
needs
- Identify lead users
- Identify
competitive
products
- Develop plan for
product options
and extended
product family
- Set target sales
price points
Develop marketing
plan
- Develop
promotion and
launch materials
- Facilitate field
testing
Place early
production
with key
customers.
DESIGN
- Consider product
platform and
architecture
- Assess new
technologies
- Investigate
feasibility of
product concept.
- Develop
industrial design
concept.
- Build and test
experimental
prototypes
- Generate
alternative product
architectures
- Define major
subsystems and
interfaces
- Refine industrial
design
- Define part
geometry
- Choose materials
- Assign tolerance.
- Complete industrial
design control
documentation
- Reliability testing
- Life testing
- Performance
testing
- Obtain regulatory
approvals
- Implement design
changes.
Evaluate
early
production
output
MANUFACTURING
- Identify production
constraints
- Set supply chain
strategy
- Estimate
manufacturing
cost
- Assess
production
feasibility
- Identify suppliers
for key
components.
- Perform make-
buy analysis
- Define final
assembly
scheme.
- Set target costs.
- Define piece-part
production
processes.
- Design tooling
- Define quality
assurance processes.
- Begin procurement
of long-lead tooling.
- Facilitate supplier
ramp-up.
- Refine fabrication
and assembly
processes.
- Train work force.
- Refine quality
assurance
processes.
- Begin
operation
of entire
productio
n system.
OTHER FUNCTIONS
- Research:
Demonstrate
available
technologies.
- Finance: provide
planning goals
- General
Management:
Allocate project
resources
- Finance:
Facilitate
economic
analysis
- Legal:
Investigate patent
issues.
- Finance: Facilitate
make-buy analysis
- Service: Identify
service issues.
Sales: Develop
sales plan.
Source: Ulrich and Eppinger, (2004: 14).
616
3. Methodology 3.1 Exploratory Research Design
� Literature Study
The literature study was used in
understanding the basic concept of product
development and its generic model, market
opportunities, market segmentation (segmenting
international market), and customer needs,
wants, and demand. The findings from literature
study were used as the guidelines in doing every
stage of the research.
� Secondary Data
The secondary data, which is statistical data,
was used to give the illustration of the general
condition of rattan industry, both locally and
globally. The data was the statistics of
Indonesian exports and imports (in volume and
value).
� Expert In-Depth Interview This method was conducted to verify the
current conditions, product attributes,
competitors, target market, customer needs, lead
users, competitive products, product option and
extended product family, target sales price
points, and marketing plan. The interview was
conducted to the main stakeholders of rattan
furniture rattan industry, who are the producers,
related association, and raw material suppliers.
The producers are:
1. PT. Erlangga Bina Niaga Harmonia
2. CV. Indosurya Mahakam
3. Yamakawa Rattan International Co., Ltd.
Two of those companies, who are PT.
Erlangga Bina Niaga Harmonia and CV.
Indosurya Mahakam, are the local company.
One of them, who is Yamakawa Rattan
International Co., Ltd, is non-Indonesian
company. It is a Japanese company. Those
companies were chosen to be the sources of
interview because of some considerations. They
are the mid-up rattan producers in the industry
region, which is located in Cirebon, West Java.
They also tend to be the trendsetters of the other
producers who are in the mid-low range. Besides
that, most entrepreneurs from those companies
know much about the rattan furniture industry.
The related association of the rattan
furniture industry that is interviewed was
Indonesia Furniture Industry & Handicraft
Association (ASMINDO). ASMINDO now
stands strong as the supreme body of the
furniture business community. This association
plays a vital role as the official furniture body
responsible for maintaining a regular dialogue
with government and for consultation with
various government agencies and with the
private sector, domestically or internationally.
ASMINDO is also responsible for initiatives to
further establish and develop Indonesia’s
furniture and handicraft industries, including
improving quality control, promotion, and
marketing. ASMINDO has a membership
strength more than 2000 companies, all of which
reengage in the manufacturing and exporting of
furniture and furniture related products, wood
working and also handicraft.
4. Case Studies 4.1 Key Success Factors of the Product
Development of Rattan Industry
The data analyses show some key factors
that affect the product development of rattan
industry in Indonesia. They are:
� Macro environment
� Government Policy
� Market Segmentation
� Research and Development
� Human Resources
In overall, the macro environment which is
the global market condition affects much to the
product development of rattan industry in
Indonesia. When the global market condition is
going down, the sustainability of this industry is
also threatened because they are oriented in the
global market. It is proved by the recent
condition, when the global economic crisis hit
some countries, almost 50 % producers of rattan
product, especially in furniture were bankrupt. It
creates the domino effect to the raw materials
suppliers which faced the oversupplies when the
industry doesn’t much utilize the raw materials.
Besides that, the government policy which
now being the hottest issue in this industry, is
also identified as a factor that being concerned
almost all stakeholders of this industry that
affect to the growth of rattan industry. The
availability of raw materials is very important
for the producers. By the raw rattan export
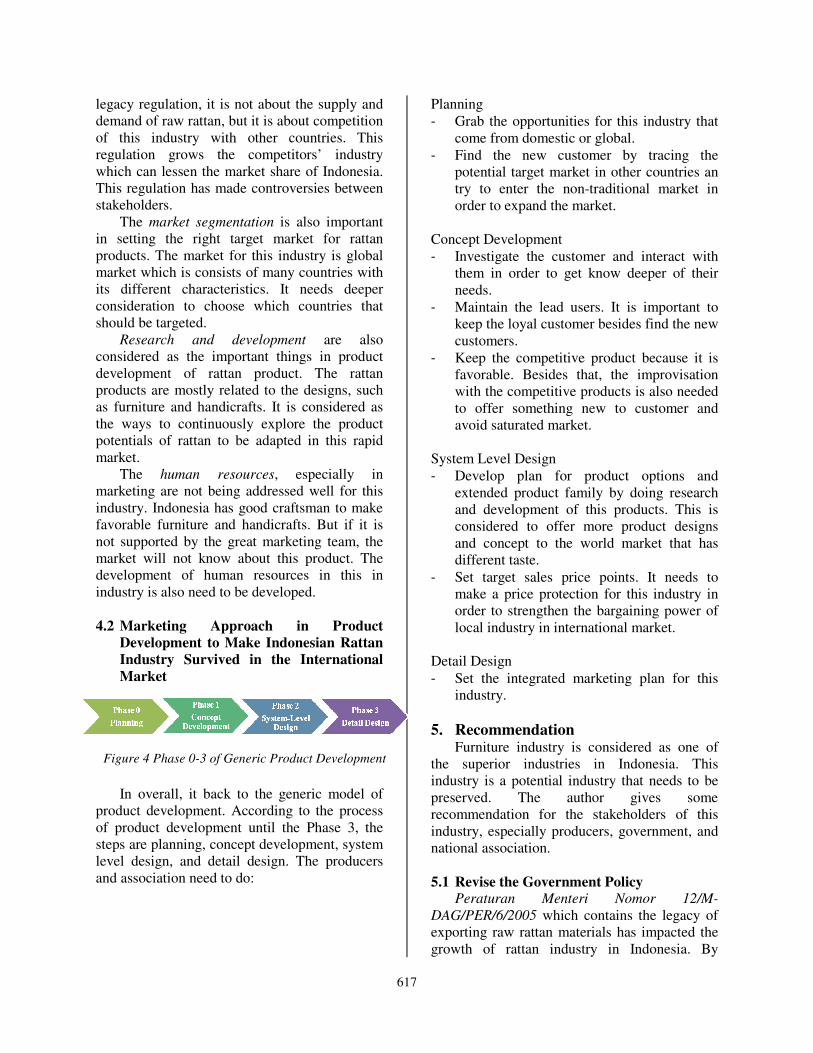
617
legacy regulation, it is not about the supply and
demand of raw rattan, but it is about competition
of this industry with other countries. This
regulation grows the competitors’ industry
which can lessen the market share of Indonesia.
This regulation has made controversies between
stakeholders.
The market segmentation is also important
in setting the right target market for rattan
products. The market for this industry is global
market which is consists of many countries with
its different characteristics. It needs deeper
consideration to choose which countries that
should be targeted.
Research and development are also
considered as the important things in product
development of rattan product. The rattan
products are mostly related to the designs, such
as furniture and handicrafts. It is considered as
the ways to continuously explore the product
potentials of rattan to be adapted in this rapid
market.
The human resources, especially in
marketing are not being addressed well for this
industry. Indonesia has good craftsman to make
favorable furniture and handicrafts. But if it is
not supported by the great marketing team, the
market will not know about this product. The
development of human resources in this in
industry is also need to be developed.
4.2 Marketing Approach in Product
Development to Make Indonesian Rattan
Industry Survived in the International
Market
In overall, it back to the generic model of
product development. According to the process
of product development until the Phase 3, the
steps are planning, concept development, system
level design, and detail design. The producers
and association need to do:
Planning
- Grab the opportunities for this industry that
come from domestic or global.
- Find the new customer by tracing the
potential target market in other countries an
try to enter the non-traditional market in
order to expand the market.
Concept Development
- Investigate the customer and interact with
them in order to get know deeper of their
needs.
- Maintain the lead users. It is important to
keep the loyal customer besides find the new
customers.
- Keep the competitive product because it is
favorable. Besides that, the improvisation
with the competitive products is also needed
to offer something new to customer and
avoid saturated market.
System Level Design
- Develop plan for product options and
extended product family by doing research
and development of this products. This is
considered to offer more product designs
and concept to the world market that has
different taste.
- Set target sales price points. It needs to
make a price protection for this industry in
order to strengthen the bargaining power of
local industry in international market.
Detail Design
- Set the integrated marketing plan for this
industry.
5. Recommendation Furniture industry is considered as one of
the superior industries in Indonesia. This
industry is a potential industry that needs to be
preserved. The author gives some
recommendation for the stakeholders of this
industry, especially producers, government, and
national association.
5.1 Revise the Government Policy Peraturan Menteri Nomor 12/M-
DAG/PER/6/2005 which contains the legacy of
exporting raw rattan materials has impacted the
growth of rattan industry in Indonesia. By
Figure 4 Phase 0-3 of Generic Product Development
618
exporting raw materials to the competitor
countries that actually don’t have the materials,
it grows the rattan industry in those countries.
The market that should be dominated by
Indonesia, then shared with other countries.
Worst, Indonesia as the rattan producer country
hold a small market shares than others who
don’t have rattan.
The revision should aim at the export of the
final product rather than raw products. By
exporting the final product, it will create more
value for Indonesia. From the social side, it
creates more jobs if Indonesia focuses on the
export of final products. It is so in the economic
side. According to the historical data from
Departemen Perindustrian in 2001 – 2004 when
Indonesia didn’t export the raw materials, the
amount of companies increased from 923
companies to 1060 companies. The employment
also increased from 51,432 to 61,140 employees.
From the side of employment, the manufacture
sector absorbs more employees than the raw
material sector. Since 2007, the declining felt
significant. A company that is usually able to
export 120 containers / year, then they are only
able to export 15-20 containers / year. Worst,
many companies was bankrupt.
This can be attempted by the law steps for
that policy. By taking a deep understanding of
Undang-Undang Dasar 1945, especially Pasal
33 ayat 3, “Bumi dan air dan kekayaan alam
yang terkandung di dalamnya dikuasai oleh
negara dan dipergunakan untuk sebesar-besar
kemakmuran rakyat”, the people’s wealth here
should be more interpreted and focused on the
employment. When the raw rattan is exported,
hundreds of employees in manufacturing sector
are fired.
5.2 Shortcut the Distribution by Opening
Branches in the Targeted Countries
Mostly, the producers sell the product
indirectly to the end-customer. They sell it to the
intermediary (e.g. wholesalers) then the
intermediary sell it to the end-customers. With
this condition, the total profit margins will be
mostly owned by the intermediaries. The price
for the end-customer in international market can
be five or six times higher from the actual price.
Though it is already added with freight, landed
costs, and management costs, it is much smaller
that intermediary price to the end-customer.
By shortcutting the distribution, which
opening representative of Indonesian producers
in the targeted countries, the profit margin will
be allocated more for the producers. Besides
that, Indonesia also will have more bargaining
position. This idea is difficult and expensive to
be implemented, especially for the small
medium enterprises. Thus, it can be done by
synergizing all the stakeholders. The framework
is shown in Figure5.3. The commercial
intermediary is replaced by the national
representative. The national representative
covers producers, not only developed enterprises
but also small-medium enterprises; suppliers,
and banks.
The purpose of this replacement is to
reallocate the high profit margin that owned by
intermediaries to be something worthwhile for
the local industry. The profit margins that
approximately 5-6 times higher than FOB prices
can be allocated for local industry to be used for:
1. Producers Development
2. Research and Development (in product and
market)
3. Human Resources Development
4. Representatives Establishment
This representative can be formed by
collaborating state-owned company (e.g. PT.
Perusahaan Perdagangan Indonesia) with
Ministry of Industry and Ministry of Trade to
have trade in international market. PT.
Perusahaan Perdagangan Indonesia (PT. PPI) or
in other countries is known as ITC (Indonesia
Trading Company) is a trading house state-
owned company who has experienced in export,
import, and distribution. It has three main
bankers, which are Bank Mandiri, Bank Central
Asia, and Bank Mega.
Figure 5. Rattan Products Distribution Shortcut
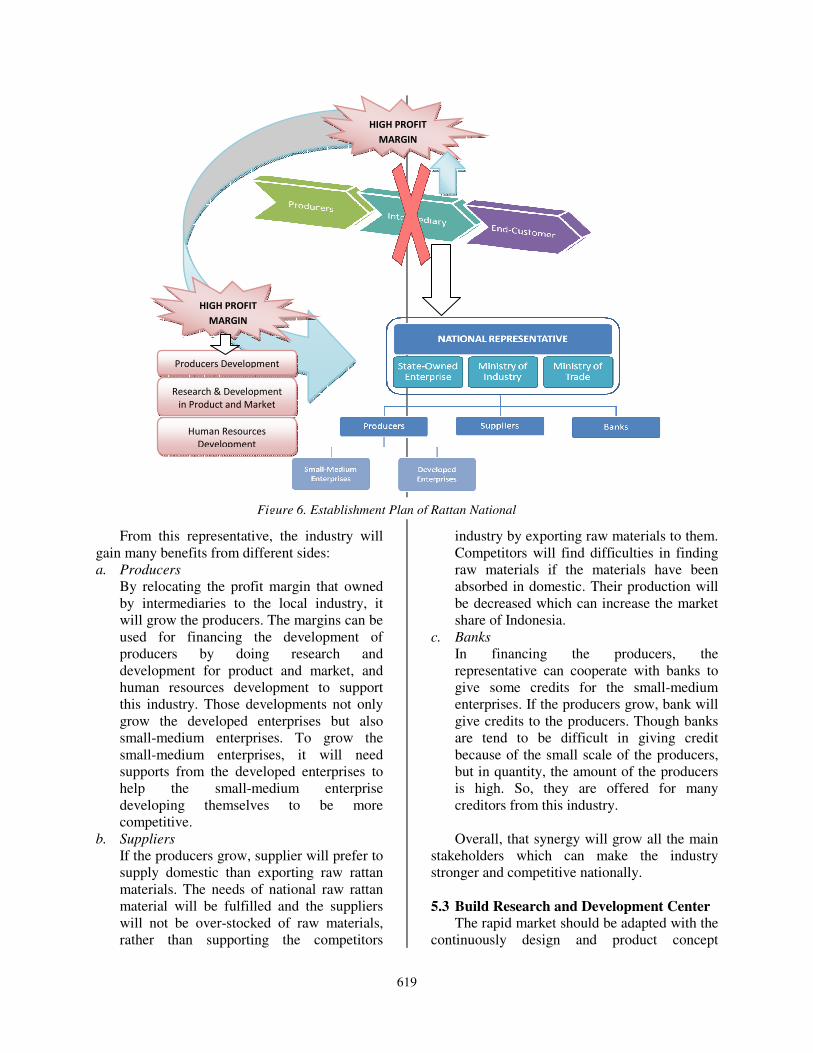
619
From this representative, the industry will
gain many benefits from different sides:
a. Producers
By relocating the profit margin that owned
by intermediaries to the local industry, it
will grow the producers. The margins can be
used for financing the development of
producers by doing research and
development for product and market, and
human resources development to support
this industry. Those developments not only
grow the developed enterprises but also
small-medium enterprises. To grow the
small-medium enterprises, it will need
supports from the developed enterprises to
help the small-medium enterprise
developing themselves to be more
competitive.
b. Suppliers
If the producers grow, supplier will prefer to
supply domestic than exporting raw rattan
materials. The needs of national raw rattan
material will be fulfilled and the suppliers
will not be over-stocked of raw materials,
rather than supporting the competitors
industry by exporting raw materials to them.
Competitors will find difficulties in finding
raw materials if the materials have been
absorbed in domestic. Their production will
be decreased which can increase the market
share of Indonesia.
c. Banks
In financing the producers, the
representative can cooperate with banks to
give some credits for the small-medium
enterprises. If the producers grow, bank will
give credits to the producers. Though banks
are tend to be difficult in giving credit
because of the small scale of the producers,
but in quantity, the amount of the producers
is high. So, they are offered for many
creditors from this industry.
Overall, that synergy will grow all the main
stakeholders which can make the industry
stronger and competitive nationally.
5.3 Build Research and Development Center
The rapid market should be adapted with the
continuously design and product concept
HIGH PROFIT
MARGIN
Producers Development
Research & Development
in Product and Market
Human Resources
Development
HIGH PROFIT
MARGIN
Figure 6. Establishment Plan of Rattan National
620
exploration. The research and development
center that can be implemented nationally or
regionally may help the producers to explore
more the products.
In furniture business, design has become
something important. No new design, no
business. Some important aspects in design that
should be considered are:
a. Art
How the art touches in furniture can create
beauty and attract the customers. The art of
creating rattan products and how to combine
the different processes of crafting (e.g.
weaving) can be the uniqueness to attract the
customers.
b. Taste
The art is important to be adjusted with the
taste in every country or region. Every
country has different tastes that can’t be
generalized one each other. By
understanding the taste of each country or
region, the product will be more acceptable
for the customers.
c. Ergonomics
The ergonomics is one of the important
aspects in creating rattan products. The
products are comfortable to be used by the
customers. It will create the customers’
satisfaction. With its natural materials, it
needs the perfect processes to make it
ergonomic when used by customers.
d. Make Ability
The products that are already planned are
makeable by the producers considering the
raw materials, technique, and technology
that are available. So, the design is not only
desired and planned but also possible to be
realized.
e. Stack Ability
When the products are exported to other
countries, they are loaded in containers.
With the transportation costs, the exported
quantities have to be efficient. So, it is
important to consider that the designs make
the products are stackable in the container
when it will be exported.
f. Raw Material Stocks
The raw material stocks have to support the
design. In other words, a design is difficult
to be implemented if the required materials
are not available. By exploring the design
with the abundant supplies, it will utilize all
the rattan supplies in order to be not over-
stocked.
g. Constructive Aspect
The quality of the product is very important.
The customers’ satisfaction and loyalty will
come from this aspect. The construction of
the product (e.g. for furniture) is need to be
considered, whether it stands strong or not.
The research and development center is not
only for the development in design but it can be
also integrated to the production technique in
order to have the efficient technology in
producing rattan, such as for forming or
finishing.
5.4 Open Local Market There is a good opportunity for the local
market. Remembering that Indonesia is also one
of countries that become a tourist destination,
this industry can get more serious in this market.
This tourism sector provides many hotels,
resorts, restaurant, etc, to be targeted by this
industry.
Besides that, the government also has
launched the program to use the local product.
The program named “Program Seratus Persen
Cinta Indonesia” is aimed to increase the
competitiveness of Indonesian products with
other countries’. This program persuades
Indonesian people, who stay in Indonesia or
abroad, to use Indonesian products. This
program can support the growth of this industry
in local market.
5.5 Set Trends to Stimulate Markets Furniture can be attached by trend that can
change periodically. For example, make the
furniture become like fashion, which can change
periodically in spring-summer and winter-fall
with various design options. It can stimulate the
market to consume furniture more frequently.
The continuous trends will be able to be
implemented if this industry is supported by the
continuous designs. When the design is rapidly
changing, the market will be stimulated to
consume it more and more because there will be
something new about furniture that can be
offered to customer in the next periods. For
example is like cell phone. Now, people
621
consume more cell phone in their life because
they are offered by the various designs and
features of the cell phone.
References Ulrich, K.T. & Eppinger, S.D., 2004, Product
Design and Development, Singapore, Mc Graw
Hill.
Armstrong, G. & Kotler, P., 2007, Marketing An
Introduction (8th Edition), New Jersey, Pearson
Education.
Cravens, D.W. & Piercy, N.F., 2007, Strategic
Marketing (9th Edition), Singapore, Mc Graw
Hill.
Yin, R.K., 2003, Case Study Research, Design
and Methods (3rd
Edition), USA, Sage
Publication,
Hasan, A., 2008. Marketing, Yogyakarta,
Medpress.
ASMINDO, 2009, Indonesia Furniture & Craft
Directory 2009, Jakarta, ASMINDO.
Widigdya, N., Final Project: The Study of
Perception Differences Between Repeat
Purchasers and Discontinued Users Toward
Coca cola Brand, Bandung, 2007.
Hatta Sinatra, from CV. Indosurya Mahakam,
in-depth interview by Gilang Ayunda, Cirebon,
July 5th 2009.
Satori, from Yamakawa Rattan International
Co., Ltd, in-depth interview by Gilang Ayunda,
Cirebon, July 6th 2009.
Lingga, from PT. Erlangga Bina Niaga
Harmonia, in-depth interview by Gilang
Ayunda, Cirebon, July 3rd
2009.
Buchori, from CV. Nusantara Rattan, in-depth
interview by Gilang Ayunda, Cirebon, July 6th
2009.
Indra, from Asosiasi Industri Permebelan &
Kerajinan Indonesia (ASMINDO), in-depth
interview by Gilang Ayunda, Jakarta, July 10th
2009.
Elvis, from CV. Sulawesi Jaya, in-depth
interview by Gilang Ayunda, Cirebon, July 3rd
2009.
http://pphp.deptan.go.id/index.php?mod=detail_
informasi&sub=1&fuse=279.
http://www.export-import-
indonesia.com/blog/larangan-ekspor-rotan-
diberlakukan-akhir-2008.html.
http://www.kapanlagi.com/h/0000181122.html.
http://id.news.yahoo.com/antr/20090528/tbs-
revisi-aturan-ekspor-rotan-harus-seg-
251e945.html.
http://mybusinessblogging.com/entrepreneur/20
08/10/18/pengaruh-krisis-global-terhadap-
ekspor-rotan/.
http://bisniskeuangan.kompas.com/read/xml/200
9/03/15/15330034/Aturan.Ekspor.Rotan.Direvisi
.
http://zakyalhamzah.blogspot.com/2009/04/eksp
or-rotan-bikin-risau-presiden.html.
http://www.antara.co.id/view/?i=1238134771&
c=EKB&s=.
http://beritasore.com/2009/03/27/menperin-
fahmi-idris-minta-ekspor-rotan-distop-
pengrajin-rotan-ibarat-tikus-mati-di-lumbung-
padi/.
http://www.businessdictionary.com/definition/m
arket-opportunity.html.
http://www.buseco.monash.edu.au/mkt/dictionar
y/mmm.html.
http://www.marketingpower.com/_layouts/Dictio
nary.aspx?dLetter=S#situation+analysis.
623
Telkom Speedy Brand Performance Assessment by Using Brand Building
Model Approach: A Survey in Bandung
Sri Anindianti, Harimukti Wandebori
School of Business and Management (SBM), Institute of Technology Bandung (ITB), Indonesia
Abstract
Purpose - The objective of this research was to analyze current Telkom Speedy Brand Performance by using Brand
Building Model. The model consists of three dimensions, which are Positioning the Brand, Communicating the
Brand Message, and Delivering the Brand Performance. This objective was done by comparing the factors
influenced in reaching good performance of internet service brand performance according to internet users’
perspectives and how customers perceived Telkom Speedy in performing those factors. In each of dimensions,
Telkom Speedy Brand should make an excellent performance to achieve strong brand.
Design/Methodology/approach – A grounded theory approach is adopted, in-depth interview with Telkom Speedy
parties, as the main object of this research were carried out, and 300 respondents were involved to fill the
questionnaires.
Findings - The findings showed that Telkom Speedy performances in every element of three dimensions were
relatively reach good position. Some of strengths factors of Telkom Speedy are in their performance in giving
positive emotional benefit to the customers, providing attractive packages, and attaining customer satisfaction.
Meanwhile, the weakness factors are in Telkom Speedy fair performance on attaining positive association of good
stability of internet connection and low customer knowledge toward promotional program held by Telkom Speedy.
Research Limitations/ Implications - The research only focused in assessing Telkom Speedy Brand Performance
from the perspectives of Telkom Speedy users in Bandung.
Originality/value – The results provide valuable insights into Telkom Speedy brand management in defining
strengths and weakness factors of Speedy performance, and therefore Telkom Speedy may improve efficient
branding strategy to increase their performance and thus maintain market share.
Keywords: brand building, brand performance, strong brand
1. Introduction Telkom Speedy
In this globalization era, where the
information transaction is highly required by
most daily activities, the need of internet has
also become increasing significantly. It makes
the business of internet provider become
prosperous in many ways. One of the major
players for internet provider in Indonesia is
Telkom Speedy, which owned by PT
Telekomunikasi Indonesia Tbk. (PT. Telkom),
the market leader for telecommunication
operators in Indonesia. Telkom Speedy launched
in 2006, it offers high speed internet access
(Broadband Internet Access) to the customers by
minimum 384 kbps (downstream) data speed.
Since the first launched in 2006, Telkom Speedy
keep continuously increase their market share. In
2007, Speedy could attract six thousands
customers, and by the end of May 2009, the
numbers of customers is reaching up to thirty
five thousands customers. Good image and
performance of PT. Telkom seems play
important part in supporting Telkom Speedy to
gain market trust and attention.
Speedy is a high-speed Internet service from
PT.Telkom, with Asymmetric Digital Subscriber
Line (ADSL) access technology that allows
simultaneous data, voice, and video
communication through copper wire telephone
lines. This technology becomes one unique point
of Speedy because it differentiates Speedy with
the other internet service providers; Telkom
Speedy is the only one internet provider that
requires ready-to broadband-phone in
customer’s residential to be able to access the
service of Speedy. In further implementation in
providing internet service, Speedy provides
some packages to fulfill various customers’
needs and requirement.
Brands – Definition
As this research is focused on Internet
Service Provider brand performance, it is better
to understand about the definition about the
brand itself. Brand can be defined as “a name,
624
term, sign, symbol, or design, or the
combination of them which is intended the
goods and services of sellers and to differentiate
them from those of competitors”. A Brand is
thus a product or services that add dimensions
that differentiate it in some way from other
products or services designed to satisfy the same
need (Kotler & Keller, 2006: 256). These
individual brands components are here called
“brand identities”. The marketing program can
contribute to consumers’ understanding of the
brand and how they value it. “Creating a
successful brand entails blending all these
various elements together in a unique way- the
product or service has to be of high quality and
appropriate to consumers needs, the brand name
must be appealing and in tune with the
consumer’s perceptions of the products, the
packaging, promotion, pricing, and all other
elements must similarly meet the tests of
appropriateness, appeal, and differentiation”
(John Murphy, 1988).
There are also some definitions arisen from
some marketers toward brand definitions:
• A brand is an identifiable entity that makes
specific promises of value (Dave Dolak,
2003).
• Brand is beyond the physical entity. It is the
creation of awareness, reputation, and
prominence; on other intangible aspects in
the market (Keller, 2003).
• A brand is the amalgam of the physical
product and the notional images that go with
the brand (Parameswaran, 2001).
In today’s sophisticated marketing era,
“brand” terms is no longer unfamiliar in
customer mind. As many products and services
provided by lot of firms have many points of
parities, brand does matters to differentiate it
from each others product. Brand is a name that
influence and it have to attached saliency,
differentiability, intensity, and trust. Product
which has a powerful brand will be much easier
to be marketed and accepted by the market. The
insights of customers perspective toward brand
then should be explore to measure brand
performance which quite important to ensure
firm’s sustainability.
Strong Brand Every expertise in marketing field has their
own definition toward “strong brand”. Though
there are lots of interpretations of what the
strong brand means, writer can see some
commonalities of what should be achieved by
strong brands. Some of the most important
points are:
• The key to a strong Brand over time is
consistency with the Brand Identity (Aaker).
The key step is to create a broad brand
vision or identity that recognizes a brand as
something greater than a set of attributes
that can be imitated or surpassed. In
particular, Aaker suggests that a company
consider its brand not just as a product or
service, but as an organization, a person and
a symbol.
• A successful brand is an identifiable
product, service, person or place, augmented
in such a way that the buyer or user
perceives relevant, unique added values
which match their needs most closely
(Chernatony and McDonald, 1998).
• Strong brands are more likely to shape and
substance. They evoke a more extensive,
richer set of associations. Visual images and
words or phrases linked with strong brands
are likely to be more easily retrieved from
memory (Leavit, 1987).
Brand Performance
Brand performance is defined as the relative
measurement of the brand’s success in the
marketplace (Aron O’Cass, Liem Viet Ngo,
2006). It can be seen as how the brand achieving
the organization’s established objectives for it in
the marketplace. As brand play a role by
creating competitive advantages with product
performance and through non-product related, it
also provide a number of benefits to an
organization such a stronger cash flow and
earnings (Berry, 1988; Yovovich, 1988). In this
research, some factors from Brand Building
Model were used to assess the brand
performance of Telkom Speedy.
Brand Performance in Internet Service
Provider Industry
Researcher adopt PCDL Brand Building
model as developed by Bhimrao M. Ghodeswar,
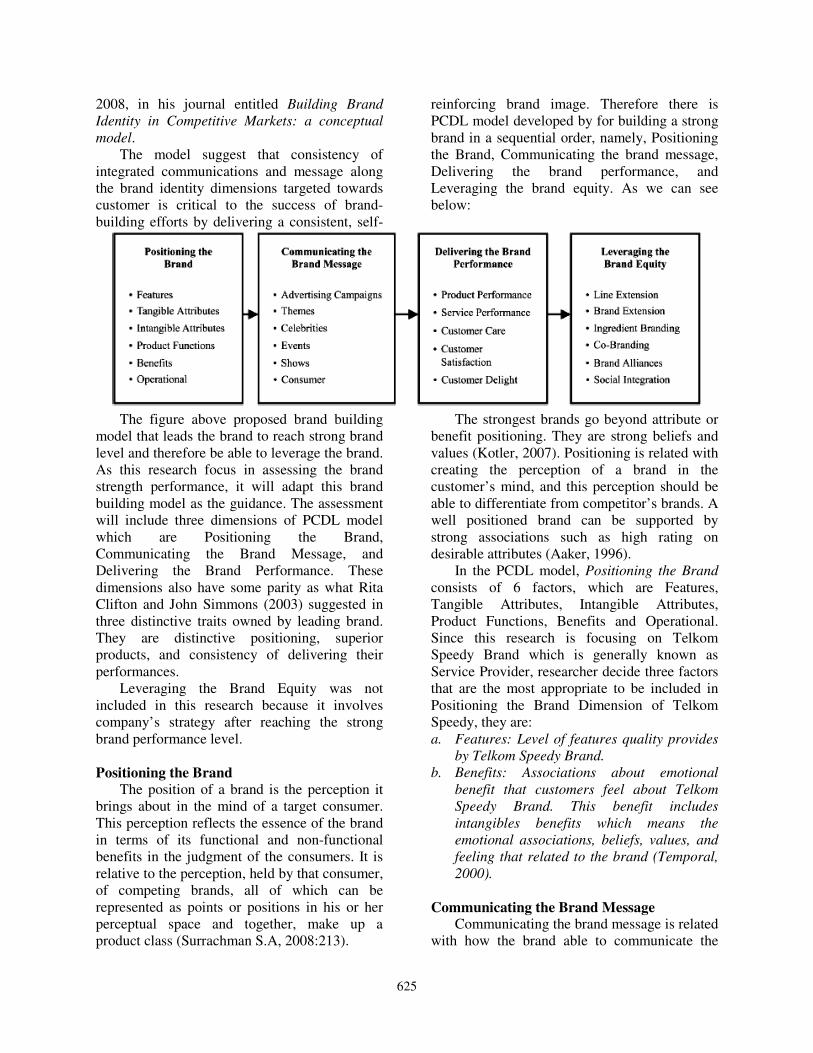
625
2008, in his journal entitled Building Brand
Identity in Competitive Markets: a conceptual
model.
The model suggest that consistency of
integrated communications and message along
the brand identity dimensions targeted towards
customer is critical to the success of brand-
building efforts by delivering a consistent, self-
reinforcing brand image. Therefore there is
PCDL model developed by for building a strong
brand in a sequential order, namely, Positioning
the Brand, Communicating the brand message,
Delivering the brand performance, and
Leveraging the brand equity. As we can see
below:
The figure above proposed brand building
model that leads the brand to reach strong brand
level and therefore be able to leverage the brand.
As this research focus in assessing the brand
strength performance, it will adapt this brand
building model as the guidance. The assessment
will include three dimensions of PCDL model
which are Positioning the Brand,
Communicating the Brand Message, and
Delivering the Brand Performance. These
dimensions also have some parity as what Rita
Clifton and John Simmons (2003) suggested in
three distinctive traits owned by leading brand.
They are distinctive positioning, superior
products, and consistency of delivering their
performances.
Leveraging the Brand Equity was not
included in this research because it involves
company’s strategy after reaching the strong
brand performance level.
Positioning the Brand
The position of a brand is the perception it
brings about in the mind of a target consumer.
This perception reflects the essence of the brand
in terms of its functional and non-functional
benefits in the judgment of the consumers. It is
relative to the perception, held by that consumer,
of competing brands, all of which can be
represented as points or positions in his or her
perceptual space and together, make up a
product class (Surrachman S.A, 2008:213).
The strongest brands go beyond attribute or
benefit positioning. They are strong beliefs and
values (Kotler, 2007). Positioning is related with
creating the perception of a brand in the
customer’s mind, and this perception should be
able to differentiate from competitor’s brands. A
well positioned brand can be supported by
strong associations such as high rating on
desirable attributes (Aaker, 1996).
In the PCDL model, Positioning the Brand
consists of 6 factors, which are Features,
Tangible Attributes, Intangible Attributes,
Product Functions, Benefits and Operational.
Since this research is focusing on Telkom
Speedy Brand which is generally known as
Service Provider, researcher decide three factors
that are the most appropriate to be included in
Positioning the Brand Dimension of Telkom
Speedy, they are:
a. Features: Level of features quality provides
by Telkom Speedy Brand.
b. Benefits: Associations about emotional
benefit that customers feel about Telkom
Speedy Brand. This benefit includes
intangibles benefits which means the
emotional associations, beliefs, values, and
feeling that related to the brand (Temporal,
2000).
Communicating the Brand Message Communicating the brand message is related
with how the brand able to communicate the
626
brand position existed. It is very important to
develop suitable communication strategy to
ensure the brand message is clearly delivered
and appealing for the customers.
Communicating the brand message also strongly
related with the brand image that companies are
going to build. The most important thing here in
communicating the brand message is the
consistency of brand identity dimensions. Better
advertising is born out of a total understanding
of all the variables impacting the brand
(Parameswaran, 2001). Therefore, all variables
involve in advertising should be well planed to
attain success of brand communication. Broadly
there are two types of measurable of brand
communications; they are effects on sales and
consumer response. This research only focus on
consumer response toward brand
communication.
There are 2 factors measured in
Communicating the Brand Message Dimension
of Telkom Speedy, they are:
a. Advertising Campaigns: Level of the quality
of themes, Celebrities, and Events held by
Telkom Speedy.
b. Consumer Knowledge: Level of customer
knowledge toward Telkom Speedy’s
products and promotions.
Delivering the Brand Performance Delivering the brand performance is related
with the consistency of the performance of the
brand to deliver what they have already offers.
This is the most important part of brand building
since in delivering the brand performance,
company will directly involve with customers,
or at least this stage will be the closest distance
between company and customers. The
companies need to set “operational standard” in
all areas affecting day-to-day brand-related
activities which can be applied to behaviors,
management practices, service provision,
customer relationship management, performance
achievement, and so on (Klaus and Ludlow,
2002). Delivering high-quality services that
aligned with a compelling vision and genuine
commitment to customer satisfaction are very
important to compete in this service industry.
After some literature review, researcher
believes that there are three factors on
Delivering the Brand Performance Dimensions
that are appropriate for this research, they are:
a. Service Performance: Level of service
performance delivered by Telkom Speedy.
b. Customer Care: Level of Telkom Speedy’s
readiness to solve customer’s complaints.
c. Customer Satisfaction: Level of overall
Telkom Speedy’s brand performance to
satisfy the customers.
2. Methodology Sample and Data Collection
This research involved exploratory and
descriptive research. Exploratory research was
done by having literature study and doing in-
depth interview with Telkom Speedy parties.
From Telkom Speedy parties, researcher gets the
perspectives from them about their brand
strategy within brand building model.
Descriptive research was done by developing
questionnaire to assess Telkom Speedy
performance in various factors inside brand
building model.
Because the result of Telkom Speedy brand
performance assessment will be non-
comparative, the target populations of this
research was involved the customers of Telkom
Speedy. Meanwhile, a half number of
questionnaires distributed were also involving
non-Speedy users to get the general perception
toward factors influenced brand performance. In
this research, writer used Simple Random
Sampling. In Simple Random Sampling, each
element in the population has a known and equal
probability of selection (Malhotra, Peterson,
2006; 335).
Population of this research is the customer
of Speedy Home User in Bandung. Total
numbers of Speedy Home User in Bandung by
May 2009 is 35.000. This research uses 7% of
error. Therefore, refers to the Slovin’s formula,
the number of population required in this
research is 200 samples. Besides 200
respondents from Telkom Speedy users, this
research also involving 100 respondents from
non-Speedy users. This data from 100
respondents of non-Speedy users will be
combined with 100 data from Speedy users to
get the analysis of ideal performance of internet
service provider in general. It is then compared
with the analysis of Telkom Speedy
627
performance assessment resulted only from 200
Telkom Speedy users. Questionnaires distributed
through some colleges (ITB, UPI, and STT
Telkom) and Telkom office, where most people
are using internet for their daily activities.
Measures
The variable measurements were use in the
questionnaires is Semantic Differential Scale. It
is a seven-point rating scale on which the end
points adjectives representing opposites.
Semantic differential scale is commonly used for
rating a brand, which means it will be
appropriate for this research. Other part of
questionnaire were used Likert-scale to measure
the degree of agreement to every factor in brand
performance.
3. Results Positioning the Brand Telkom Speedy
In order to get the perspective from PT.
Telkom Tbk, writer conducted an exploratory
research by open-ended questions and discussion
with Marketing Management of Telkom Speedy.
From the Brand Architecture created by
Telkom, Telkom Speedy is classified in “one
brand product range”, which means Speedy
brand name will be used in every service and
product created by Telkom Speedy. For
example, Speedy keep using Speedy brand name
for its wi-fi service as well as its internet cable
service. Meanwhile, as the Brand Positioning of
Speedy is “Providing broadband internet access
service in high speed and high stability
connection to support customers’ needs”,
Telkom Speedy are focusing in attaining good
association toward high speed internet access
with a good stability of connection.
Telkom Speedy always try to understand the
market needs. It proved by some modifications
on segmenting Speedy’s target market and
develops some appropriate marketing promo to
attract and fulfill customer’s needs. The
segmentations made by classifying market
according to several aspects, and some of
important aspects that mostly concerned by
Speedy are Social Economic Scale (SES), Life
Style, and Benefit. From SES, Speedy main
target are people with Class A, B, and C of
social economy class, which means Speedy is
thus focus to attract people with medium to high
social economy class. From Life Style, Telkom
Speedy divide their market segment into some
groups according to the life style of customer,
such as technology-seeker and non-technology
user. Meanwhile for benefit, Telkom Speedy
segmenting their market according to benefits
expected by the customers of using Speedy, such
as entertainment, education, games, and also
business-focus. After creating segmenting,
targeting, and positioning strategy, Telkom
Speedy then created variances of internet
package to fulfill their customers’ requirements.
From the Brand perspective itself, Telkom
believe that they already had a strong and well-
performed brand in the market. It is proved by
the fact that Telkom Speedy is remained the
market leader for internet service provider in
Indonesia, by holding 85% of Indonesia ISP
market share (Mr. Syafrawi, private interview,
28/06/2009).
Somehow, the ADSL technology used by
Speedy which become the strength of Speedy to
deliver high speed access of internet is also
become the weakness of Telkom Speedy at the
same time. Because ADSL technology will
requires users to have line-phone in their place.
The presence of mobile internet technology
could threaten Telkom Speedy market share. For
the comparison, Telkom Speedy market share
position in mobile internet access is 43%,
followed by Telkomsel Flash which holds 17%,
and then Indosat with 7.7% market share.
Meanwhile, in category cable internet access,
Speedy holds 76% market share, which followed
by Fastnet with 12% market share. In the other
side, PT. Telkom Tbk. are expecting the
presence of Speedy to help them sustain the
growth of fix phone-line which its now being
threaten by mobile phones.
Speedy focused on positioning themselves
as the high-speed internet access provider, by
maintaining quality and improving high stability
internet connection. Compared with Telkomnet
Instan, the first internet provider in Indonesia, it
only provide internet access with 53 kbps data
speed, Speedy is somehow became the
refreshment in internet provider industry which
it provide minimum speed of 384 kbps
(downstream). The main challenge for Speedy
now is to keep maintains market trust about the
quality of Speedy internet connection.
628
Communicating “Speed that You Can Trust”
As one of the new entrance of Internet
Service Provider in Indonesia, Telkom Speedy
still focus in building awareness and attain
desirable positioning in customers minds. In
Brand Communication Strategy, Telkom Speedy
has done Integrated Marketing Communication
(IMC) by creating Above The Line strategy and
Below The Line Strategy.
Above The Line strategy was done by
creating Television Commercial Advertising,
press conference, and putting print-ads in
newspapers. All of them are have the same
mission which is to create awareness and to
expose Telkom Speedy position as trustworthy
high speed internet access.
Telkom Speedy also continuously created
promotional event and made collaboration with
several parties and institutions as their Below
The Line strategy to building awareness and to
attract the customers. For example, Telkom
Speedy makes joint promo with Kentucky Fried
Chicken (KFC) to grab the youth market. The
joint promo is by covering provision of access of
Hotspot Speedy at 116 outlets of KFC. Speedy
and KFC are also organizing Off Air events
together. To provide free hot-spot Speedy
internet in certain place is one of Telkom
Speedy gimmicks strategy to grab the market.
Furthermore, in its brand strategy, Telkom
Speedy smart enough by differencing the areas
according to the presence of competitors. We
know that Telkom Speedy is one of ISP that its
coverage is reaching almost all areas in
Indonesia (since its using basic infrastructure
from Telkom). So, in certain areas, where
Speedy do not have competitors, Speedy do
direct penetration. Speedy create awareness and
doing promotional event to gain market. Speedy
also set the standard price (tend to high price)
because Speedy could positioned themselves as
the only ISP in that areas. In contrary, for the
area where Telkom Speedy have lots of
competitors, such as Bandung, Jakarta, and other
big cities, Speedy focus on direct selling and
setting competitive price (attaining special price
and discount) and sometimes provide gimmicks
to attract customers.
In fact, Telkom Speedy rather to focus on
Below The Line strategy because they believe
that direct approach to customers is the most
effective way to gain market awareness and
trust. TVC is only used as a tool to build broader
awareness of Speedy and creating association of
Speed that you can trust in market minds.
Speedy create bundling modem and content.
By providing various bundling modem and
content, customer may choose the most suitable
package according to their needs. For example,
Speedy launch Speedy Cermat bundling modem
which targeted for students. This package is free
from activation-charge and including
subscription charge-discount up to 28%. It is
also provide free internet charge starts from 8
p.m until 5 a.m with 15 hours time quota per
month.
Telkom Speedy did create some promotional
program and campaign in Speedy coverage area
(more than 61 cities in Indonesia). One of
promotional program done by Telkom Speedy to
attract rural market and urban schools is
education campaign which is “Internet Goes to
School” (www.mix.co.id). Together with the
government institution, Speedy provide internet
education and promotional internet access to the
rural area.
Speedy focused on Below The Line is
become their main strategy to build awareness,
attract market and sustain customers loyalty.
Direct approach toward people in community
seems more effective for Speedy in
communicating their brand message.
Telkom Speedy in Delivering the Brand
Performance
As the internet service provider, Telkom
Speedy believe that providing good internet
connection and good customer service to satisfy
the customers are the keys to reach good brand
performance and thus increase their brand’s
strength. Telkom Speedy creating standard
performance based on three basic points, which
are competitors analysis, internal capabilities,
and market needs and wants analysis. (Mr.Purba,
private interview, 28/06/2009).
The main function of service delivered by
Telkom Speedy is actually after-sales-service,
because the installation service processed only
conducted once, when customer first install
Telkom Speedy. In giving After Sales Service,
Speedy divide the service into three types of
services which are switching package, complaint
629
handling (product and service terms, and billing
complaint), and quitting from Telkom Speedy
subscription. This three difference kind of
services is created to enhance customer service
delivering.
Speedy provide three interfaces in delivering
the service, which are direct customers service
care on Plasa Telkom, call centre 147, and
online service through Speedy website. To ease
customers accessibility to reach Telkom Speedy
customer care service, Plasa Telkom is putted in
some strategic areas. And for the customer who
wants to raise complaint or asking some
questions related with Telkom Speedy but did
not have much time to directly come to Plasa
Telkom, Speedy always ready with 147-call
centre. Customers may complaint about the line-
error and asking about modem setting through
the call. There will be customers’ service care
staff who will guide the customers to fix the
wrong setting internet connection and answering
customers’ question. Furthermore, Telkom
Speedy also develop website to distribute the
information about Speedy program, promotional
activities, and also to access customers account.
One of the imperative strategies done by
Telkom Speedy to provide satisfying service for
the customer is by providing guarantee for every
service delivered. For example, customer who
wants to change the internet package, Telkom
Speedy guarantee that the new package will be
started within 24 hours after the customers raise
the issue, otherwise customer would be given
special discount in billing payment in that
month. Terms and conditions arranged to
enhance Telkom Speedy service performance.
Telkom Speedy also conduct Performance
Review every month to measure customers
service care staff skills. One of the
measurements is time in giving complaint-
handling service. As the ISP with slogan high
speed internet access, Speedy try to also
consistent with their slogan to provide fast
service to customers.
There are actually three main areas where
Speedy did maintain to attain customers
satisfaction, they are Moment of truth, Product
Quality, and Price belief. Moment of Truth is
the direct interaction between customers and
Telkom Speedy customer care staff. In this part,
customer care staff should made a professional,
skillful, and hospitality service to impress the
customers. Speedy also improved product
quality and try to always develop innovation for
their product. Telkom Speedy main product is
the ADSL cable itself. Speedy try to enhance the
function of the product. For example, now
Speedy try to develop APTV, which is
Television connection through ADSL.
Meanwhile, in setting up the price, Speedy
believe they already set the appropriate price.
Speedy try to gain market trust so market could
perceived that the price is worth with the
product and service provided by Speedy.
To enhance customers’ services staff
professionalism, Speedy trained the staff with
Telkom Culture, Service ethic and attitude,
Communication Skills, Product Knowledge, and
Tools Operational Skill. Training and vacation is
held yearly to refresh customer service care staff
so they could always make a better performance
for the customers.
Decision Criteria in Choosing Internet
Service Provider
Before analyzing the performance of
Telkom Speedy brand Performance, it is better
to firstly understand general people perception
toward factors attained for internet service
provider brand.
Features
The feature of service provided such as various
internet packages is one of factors that should be
considered by the internet service provider. The
internet package should be well-arranged and
proportional in terms of price, speed, and other
quotas so the customers will be interest in
choosing the most suitable internet package
according to their needs.
Positive Association
Both in choosing and using the internet service
from one ISP, internet users required the
positive association of the ISP they select. High
stability internet connection belief is also should
be attained to gain customers trust and also
creates positive image in customers minds.
Emotional Benefits
Reliable internet connection is highly required
by the internet user. The basic function of
internet is to support people daily activities for
works, education, entertainment, and game.
Most people are relying their activities on
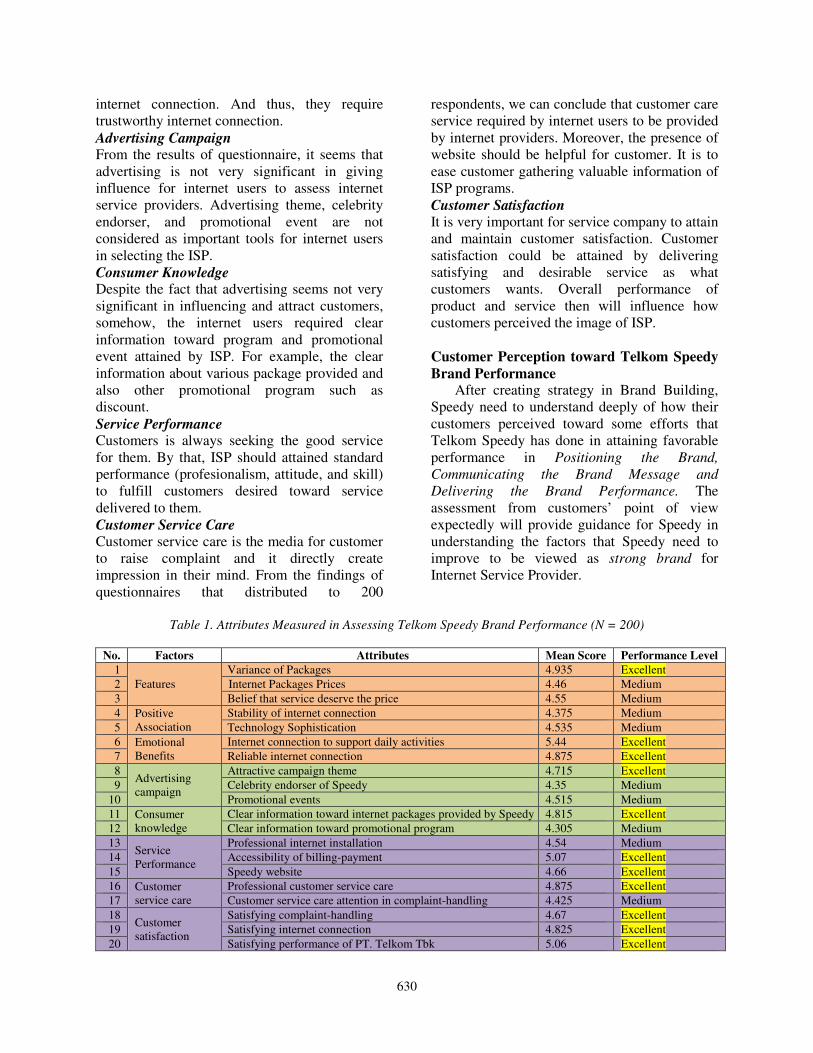
630
internet connection. And thus, they require
trustworthy internet connection.
Advertising Campaign
From the results of questionnaire, it seems that
advertising is not very significant in giving
influence for internet users to assess internet
service providers. Advertising theme, celebrity
endorser, and promotional event are not
considered as important tools for internet users
in selecting the ISP.
Consumer Knowledge
Despite the fact that advertising seems not very
significant in influencing and attract customers,
somehow, the internet users required clear
information toward program and promotional
event attained by ISP. For example, the clear
information about various package provided and
also other promotional program such as
discount.
Service Performance
Customers is always seeking the good service
for them. By that, ISP should attained standard
performance (profesionalism, attitude, and skill)
to fulfill customers desired toward service
delivered to them.
Customer Service Care
Customer service care is the media for customer
to raise complaint and it directly create
impression in their mind. From the findings of
questionnaires that distributed to 200
respondents, we can conclude that customer care
service required by internet users to be provided
by internet providers. Moreover, the presence of
website should be helpful for customer. It is to
ease customer gathering valuable information of
ISP programs.
Customer Satisfaction
It is very important for service company to attain
and maintain customer satisfaction. Customer
satisfaction could be attained by delivering
satisfying and desirable service as what
customers wants. Overall performance of
product and service then will influence how
customers perceived the image of ISP.
Customer Perception toward Telkom Speedy
Brand Performance After creating strategy in Brand Building,
Speedy need to understand deeply of how their
customers perceived toward some efforts that
Telkom Speedy has done in attaining favorable
performance in Positioning the Brand,
Communicating the Brand Message and
Delivering the Brand Performance. The
assessment from customers’ point of view
expectedly will provide guidance for Speedy in
understanding the factors that Speedy need to
improve to be viewed as strong brand for
Internet Service Provider.
Table 1. Attributes Measured in Assessing Telkom Speedy Brand Performance (N = 200)
No. Factors Attributes Mean Score Performance Level
1
Features
Variance of Packages 4.935 Excellent
2 Internet Packages Prices 4.46 Medium
3 Belief that service deserve the price 4.55 Medium
4 Positive
Association
Stability of internet connection 4.375 Medium
5 Technology Sophistication 4.535 Medium
6 Emotional
Benefits
Internet connection to support daily activities 5.44 Excellent
7 Reliable internet connection 4.875 Excellent
8 Advertising
campaign
Attractive campaign theme 4.715 Excellent
9 Celebrity endorser of Speedy 4.35 Medium
10 Promotional events 4.515 Medium
11 Consumer
knowledge
Clear information toward internet packages provided by Speedy 4.815 Excellent
12 Clear information toward promotional program 4.305 Medium
13 Service
Performance
Professional internet installation 4.54 Medium
14 Accessibility of billing-payment 5.07 Excellent
15 Speedy website 4.66 Excellent
16 Customer
service care
Professional customer service care 4.875 Excellent
17 Customer service care attention in complaint-handling 4.425 Medium
18 Customer
satisfaction
Satisfying complaint-handling 4.67 Excellent
19 Satisfying internet connection 4.825 Excellent
20 Satisfying performance of PT. Telkom Tbk 5.06 Excellent
631
Findings from Item No.1 until Item No.7
From the results of questionnaires, there are
some conclusions from factors in Positioning the
Brand. Firstly, as the internet service provider,
the feature of service provided such as various
internet packages is one of factors that should be
considered by the company. The internet
package should be well-arranged and
proportional in terms of price, speed, and other
quotas so the customers will be interest in
choosing the most suitable internet package
according to their needs. In this element, Telkom
Speedy had made a good performance by
providing various attractive packages and setting
reasonable-economical price. Meanwhile,
Telkom Speedy performance in Positioning
Telkom Speedy as internet service provider that
delivers high speed internet access still not reach
an excellent level due to the lack stability
internet connection that only reach medium
score. It is because the limitation technology
used by Telkom Speedy. Somehow, Speedy had
performed well in creating positive emotional
benefits in customer’s minds.
Overall, Telkom Speedy performance in
Brand Positioning is on good performance, but
Speedy need to improve in certain factors such
as technology and reliability of internet
connection so that Speedy could perform better
to prove their slogan which is high speed
internet access.
Findings from Item No.8 until Item No.12
Overall Telkom Speedy’s performance in
Communicating the Brand Message is relatively
good. It indicates by some factors which are on
excellent level, especially in attaining attractive
advertising and campaign theme and providing
clear information guideline of Telkom Speedy
features offered to customers. Telkom Speedy’s
effort to communicate the brand message
through advertising and promotional program
should be well organized to keep increase
customer’s knowledge toward it, especially for
certain factors which considered very important
for internet users such as clear information of
promotional event.
Current performance also indicates that Speedy
is not focus on aggressive television commercial
advertising, but rather to focus on direct
approach to customers to give information
toward features and promotional program
offered by Speedy. Other promotional events are
only held without any significant influence to
increase customer’s attention and awareness to
Speedy brand.
Findings from Item No.13 until Item No.20
Service Performance is the most important
part which must be well-performed by internet
service providers. From the findings of
questionnaires that distributed to 200
respondents, we can conclude that internet
service performance, customer care service, and
satisfying performance are required by internet
users to be provided by internet providers. In
this dimensions, Telkom Speedy has achieved
quite satisfying score which proved Speedy as
one of the best internet service provider. Some
strong factors of Telkom Speedy in this
dimensions are easy access of billing-payment,
attentive complaint-handling service, satisfying
internet connection network, and good
performance of PT. Telkom Tbk.
One of factor need to be concerned now by
Speedy in this part is to increase the
profesionalism and attitude of customer service
care, because customer service care are the key
in building customers impression and thus
influence the satisfaction for them in accepting
the service provided.
Strengths and Weaknesses of Telkom Speedy
Brand Performance In Positioning the Brand, Telkom Speedy
had achieved successful performance in creating
positive emotional benefits in customers’ minds.
Somehow, Speedy still weak in attaining
positive association of stability of internet
connection in most of customers mind.
Therefore Telkom Speedy should improve their
performance in that part to achieve success in
the brand positioning and also to strengthen their
position as one of internet provider which
obtains high quality of internet connection.
In Communicating the Brand Message,
Telkom Speedy had performed well especially
in attaining attractive campaign theme which is
“Speed that you can trust”. Moreover, Speedy
also had made an excellent performance in
providing clear information about internet
package to customers. Other factors in
632
communicating the brand message, Speedy had
performed well by selecting their brand
endorser, but it’s not the factor that will greatly
create impact to increase Speedy performance in
this dimensions. In fact, Telkom Speedy needs
to improve their indirect marketing strategy to
keep attract the market. Other factors such as
creating attractive promotional event which
become the weak factor in Telkom Speedy brand
performance should be improved to
communicate the brand message to the
customers.
In Delivering the Brand Performance,
Telkom Speedy had made excellent performance
especially in attaining customers’ satisfaction in
complaint-handling service, good internet
network connection, and company performance.
Speedy performance also very well in giving
easy access for billing payment and delivering
professional customers’ service. Somehow,
Telkom Speedy performance on providing
customer service care with attention still need to
be improved, because the internet users are
required good customer care service attention.
4. Conclusions and Recommendations In conclusion, to become a strong brand,
there are several dimensions which must be well
performed by the brand. Accordingly to
literature review, the dimensions in Brand
Building Models are Positioning the Brand,
Communicating the Brand Message, and
Delivering the Brand Performance, whereas
each of them is needed to be outperformed
appropriately. In this research, we can conclude
that there are some factors needed to be
considered by Telkom Speedy to improve their
brand performance in the market. From
Dimension “Positioning the Brand”, the factors
that mostly required by the customers is positive
emotional benefit which had already performed
well by Telkom Speedy. In this dimension,
Speedy need to strengthen the positive
association in customers mind. Secondly, from
Dimension “Communicating the Brand
Message”, Speedy mostly need to concern
toward promotional event and program and give
the customers enough information toward it,
because to increase customer knowledge and
awareness is goals of this dimension. Speedy’s
performance in this dimension is relatively good.
Meanwhile, the Speedy brand performance on
“Delivering the Brand Performance” dimension
is relatively achieve excellent performance,
especially in attaining customer satisfaction for
complaint-handling service, internet
connectivity quality, and overall performance of
the company, PT. Telkom Tbk.
From the research findings, Telkom Speedy
only had achieved an excellent performance in
half factors of internet service providers. Thus,
Speedy performance in some element of brand
building dimensions was still required to be
improved. Firstly, by increasing the performance
in positioning dimensions, Speedy should have
to be more critical in setting and wrapping up
the features. Secondly, as the internet service
provider, Speedy should attain favorable
positive association of using Telkom Speedy.
Speedy could also strengthen their positioning as
internet service provider that delivers high
access of internet.
Meanwhile, for the dimensions of
communicating the brand message, Speedy
should arrange better appropriate brand
communication strategy and keep increase
customers awareness toward promotional
program and event. To achieve desired goals of
their communication, companies need to break
the clutter by evolving innovative ways to attract
the attention of the target audience (Bhimrao M.
Ghodeswar, 2008). The last one is Speedy
should keep increase their brand performance
service delivering through better performance on
service quality to increase customer satisfaction.
As the service company, where Speedy interact
directly with customer, the impression of
professional customer service quality is very
important to increase the image quality of
Telkom Speedy Brand. It can be done by
improving skills and attitudes of customer-
service-care’s staff in handling service to the
customers.
Further Research
Further research may conduct to provide
deeper understanding about Telkom Speedy
performance compared with its main
competitors. By that, hopefully Telkom Speedy
able to identify its strength and weak factors
compared with their competitor, and thus create
633
appropriate strategy to keep enhance the
competitors.
References Book and Journal Sources
Aron O’Cass and Liem Viet Ngo, 2007, Market
Orientation versus innovative culture: two routes
to superior brand performance. European
Journal of Marketing (Vol. 41 No.7/8, 2007).
Bhimrao M. Ghodeswar, 2008, Building Brand
Identity in Competitive Markets: a Conceptual
Model. Journal of Product and Brand
Management Emerald.
Clifton, Rita & Simmons, John, 2007, Brands
and Branding, Bloomberg: The Economist.
Churcill, Gilbert A. & Iacobucci, Dawn., 2005,
Marketing Research: A Methodogical Approach.
9th ed., South Western: Thomson.
Keller, K.L, 2003. Strategic Brand
Management: Building, Meauring, and
Managing Brand Equity, 2nd
ed., Pearson
Education.
Kotler, Philip & Armstrong, Gary, 2007,
Marketing An Introduction. 8ed, New Jersey:
Pearson International edition.
Sri Rahayu, 2005, SPSS versi 12.00 dalam Riset
Pemasaran, Bandung: Alfabeta.
Surachman S.A. Bandung, 2008, Dasar-Dasar
Manajemen Merek: Alat Pemasaran untuk
Memenangkan Persaingan, Bandung: Bayu
Media Publising.
Website Sources
www.telkomspeedy.com.
http://www.goodnetwork.us/component/option,c
om_docman/task,doc_download/gid,190/Itemid,
96/.
http://www.davedolak.com/articles/dolak4.htm.
http://www.brandingasia.com/columns/temporal
10.htm.
http://mix.co.id/index.php?option=com_content
&task=view&id=253&Itemid=149.
635
A Study of New Prescribed Medical Product Acceptance
Case of Bandung and Surabaya, Indonesia
Reza A. Nasution, Sonny Rustiadi, Dina Dellyana
School of Business & Management (SBM), Institute of Technology Bandung (ITB), Indonesia
Abstract
Indonesians often feel unease with new developed products specifically prescribed Indonesian medical products.
Not only the public in general is unease, but also the acceptability from the medical profession of these products
is somewhat have differing opinions. The creation of new prescribed medical product consist of complicated
and demanding procedures of opportunity identification and evaluation; concept generation; concept
evaluation; and development stage that include technical task and marketing task; and the product launching
(Crawford, et al., 2005). Medical manufacturer have to be in confidence that a new medical product is not only
ready to use but profitable as well. Prescribed medical product usage is always driven by medical doctors.
Thus, the successful rate of a new prescribed medical product is greatly influence by these medical doctors.
In this research we used field survey to collect primary data by means of focus group discussions,
questionnaires, and in-depth interviews. Our respondents consist of 178 medical doctors from Bandung and
Surabaya region. Our survey is aimed at identifying perception of new prescribed medical products from
medical doctor’s point of view. The research shows that most of medical doctors have perceptions that this new
prescribed medical product is need to be socialized to patients at the same time to the medical doctors, needed
for preventive, easy to use and effective. Conclusions and recommendations are then provided in the end of the
paper to increase successful rate of a launching new prescribed medical products.
Keywords: new prescribed medical products, acceptance rate driver, medical doctors
1. Introduction
In today globalization era, indicated with
high flow of information and high speed
communications, consumers are more
demanding and are normally aware of all
options available in the market. Further, they
are forcing manufacturers to address the
shortcoming of products. Thus, the risk is
getting greater for the manufacturers, because
the cost involved in the process is very high.
All of this calls for efficient management of
new product introduction. The real challenge
for new product manufacturers is to establish
empathy with the customer. Manufacturers
need to get out of a seller’s mindset and tuned
into user’s and/or customers’ mindset to find a
way to discover the customer’s actual needs.
Customers—especially here in
Indonesia—often feel unease with new
developed products, specifically prescribed
Indonesian medical products. Not only the
public in general is unease, but also the
acceptability from the medical profession of
these products is somewhat have differing
opinions. The creation of new prescribed
medical product follows complicated and
demanding procedures of opportunity
identification and evaluation; concept
generation; concept evaluation; and
development stage that include technical task
and marketing task; and the product launching
(Crawford, et al., 2005). Medical manufacturer
have to be confidence that a new medical
product is not only ready to use but profitable
as well. Prescribed medical product usage is
always driven by medical doctors. Thus, the
successful rate of a new prescribed medical
product is greatly influence by these medical
doctors.
2. Literature Review
In pharmaceutical industry and business,
the marketing provisions required are more
rigid. Provisions are considered more
significance than the sales target. The
pharmaceutical marketing activity should be
done to the right product, in the right quantity,
at the correct place and the right price as well
as the correct time. (Smith, Mickey C., E.M.
“Mick” Kolasa et al 2002)
In the manner of consumer-oriented
company paradigm, the business will continue
to grow and sustainable because of the value
foundation and customer satisfaction
(Sampurno, 2009)
According to economic theory of demand,
a commodity is determined by numerous
factors: consumer preferences, purchasing
power and price. Consumer demand can arise
when there is a consumer desire to buy and
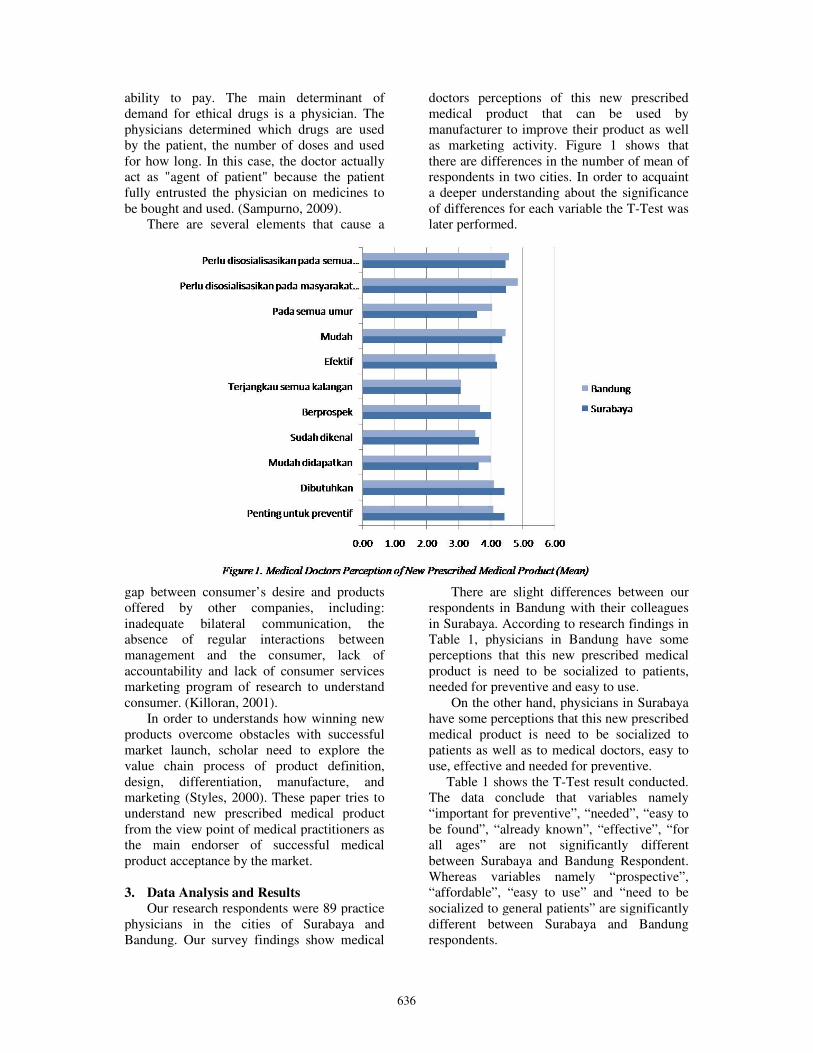
636
ability to pay. The main determinant of
demand for ethical drugs is a physician. The
physicians determined which drugs are used
by the patient, the number of doses and used
for how long. In this case, the doctor actually
act as "agent of patient" because the patient
fully entrusted the physician on medicines to
be bought and used. (Sampurno, 2009).
There are several elements that cause a
gap between consumer’s desire and products
offered by other companies, including:
inadequate bilateral communication, the
absence of regular interactions between
management and the consumer, lack of
accountability and lack of consumer services
marketing program of research to understand
consumer. (Killoran, 2001).
In order to understands how winning new
products overcome obstacles with successful
market launch, scholar need to explore the
value chain process of product definition,
design, differentiation, manufacture, and
marketing (Styles, 2000). These paper tries to
understand new prescribed medical product
from the view point of medical practitioners as
the main endorser of successful medical
product acceptance by the market.
3. Data Analysis and Results
Our research respondents were 89 practice
physicians in the cities of Surabaya and
Bandung. Our survey findings show medical
doctors perceptions of this new prescribed
medical product that can be used by
manufacturer to improve their product as well
as marketing activity. Figure 1 shows that
there are differences in the number of mean of
respondents in two cities. In order to acquaint
a deeper understanding about the significance
of differences for each variable the T-Test was
later performed.
There are slight differences between our
respondents in Bandung with their colleagues
in Surabaya. According to research findings in
Table 1, physicians in Bandung have some
perceptions that this new prescribed medical
product is need to be socialized to patients,
needed for preventive and easy to use.
On the other hand, physicians in Surabaya
have some perceptions that this new prescribed
medical product is need to be socialized to
patients as well as to medical doctors, easy to
use, effective and needed for preventive.
Table 1 shows the T-Test result conducted.
The data conclude that variables namely
“important for preventive”, “needed”, “easy to
be found”, “already known”, “effective”, “for
all ages” are not significantly different
between Surabaya and Bandung Respondent.
Whereas variables namely “prospective”,
“affordable”, “easy to use” and “need to be
socialized to general patients” are significantly
different between Surabaya and Bandung
respondents.
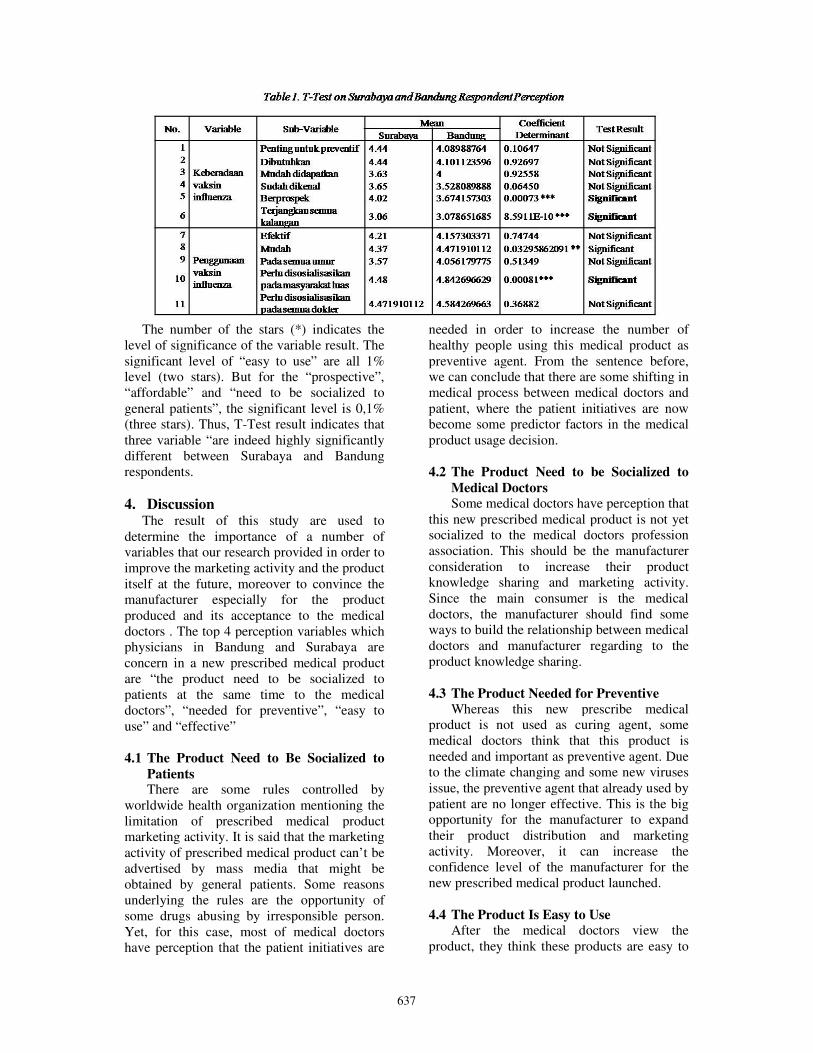
637
The number of the stars (*) indicates the
level of significance of the variable result. The
significant level of “easy to use” are all 1%
level (two stars). But for the “prospective”,
“affordable” and “need to be socialized to
general patients”, the significant level is 0,1%
(three stars). Thus, T-Test result indicates that
three variable “are indeed highly significantly
different between Surabaya and Bandung
respondents.
4. Discussion The result of this study are used to
determine the importance of a number of
variables that our research provided in order to
improve the marketing activity and the product
itself at the future, moreover to convince the
manufacturer especially for the product
produced and its acceptance to the medical
doctors . The top 4 perception variables which
physicians in Bandung and Surabaya are
concern in a new prescribed medical product
are “the product need to be socialized to
patients at the same time to the medical
doctors”, “needed for preventive”, “easy to
use” and “effective”
4.1 The Product Need to Be Socialized to
Patients There are some rules controlled by
worldwide health organization mentioning the
limitation of prescribed medical product
marketing activity. It is said that the marketing
activity of prescribed medical product can’t be
advertised by mass media that might be
obtained by general patients. Some reasons
underlying the rules are the opportunity of
some drugs abusing by irresponsible person.
Yet, for this case, most of medical doctors
have perception that the patient initiatives are
needed in order to increase the number of
healthy people using this medical product as
preventive agent. From the sentence before,
we can conclude that there are some shifting in
medical process between medical doctors and
patient, where the patient initiatives are now
become some predictor factors in the medical
product usage decision.
4.2 The Product Need to be Socialized to
Medical Doctors
Some medical doctors have perception that
this new prescribed medical product is not yet
socialized to the medical doctors profession
association. This should be the manufacturer
consideration to increase their product
knowledge sharing and marketing activity.
Since the main consumer is the medical
doctors, the manufacturer should find some
ways to build the relationship between medical
doctors and manufacturer regarding to the
product knowledge sharing.
4.3 The Product Needed for Preventive
Whereas this new prescribe medical
product is not used as curing agent, some
medical doctors think that this product is
needed and important as preventive agent. Due
to the climate changing and some new viruses
issue, the preventive agent that already used by
patient are no longer effective. This is the big
opportunity for the manufacturer to expand
their product distribution and marketing
activity. Moreover, it can increase the
confidence level of the manufacturer for the
new prescribed medical product launched.
4.4 The Product Is Easy to Use
After the medical doctors view the
product, they think these products are easy to
638
use. This is the good news for the
manufacturer as the result of good
manufacturer’s research and development at
their medical product packaging and form. To
concern at the medical doctors needs and
wants toward the product are the main R&D
importance. In the future, the manufacturers
always need to address some product testing to
the medical doctors before launching the
product.
4.5 The product is Effective
The main strength for medical product is
their effectiveness of their indication. This is
why the clinical test is become compulsory for
the manufacturer that intend to produce some
medical product. After reading the clinical test
result or the new prescribed medical product,
some medical doctors think that this product
are effective to their function as preventive
agent.
5. Recommendation
Ensuring the success of a new products is
very hard, more so for a new prescribed
medical product. Our study finds four factors
that highly influenced the usage of new
prescribed medical products from the view
point of medical practitioners as the main
endorser of successful medical product
acceptance by the market. Based on our
findings, we recommend several points for
manufacturers to help them in gaining more
confidence in introducing and launching new
prescribed medical products.
These four factors (“the product need to be
socialized to patients at the same time to the
medical doctors”, “needed for preventive”,
“easy to use” and “effective”) have to obtain
significant scientific data to enhance the
product confidence level.
These four factors are, to some degree,
compulsory for new prescribed medical
products. Facts regarding these four factors
should be written on every promotion material
in order to convince the market, primarily
physicians.
References Best, R. J., (2009), Market – Based
Management, Pearson Education, New Jersey.
Cohen, M.A., Eliashberg, J., Ho, T.H., (1996),
New product development: The performance
and time-to-market tradeoff, Management
Science, , .
Crawford, et al., (2005), New Product
Management, McGraw Hill, North America
Deshpande, Rohit, and Farley, John U.,
(1998), Measuring Market Orientation:
Generalizations and Synthesis, Journal of
Market Focused Management 2.
Jaworski, Bernard J., Kohli, Ajay K., (1993),
Market Orientation: The Construct Research
Propositions, and Managerial Implications,
Journal of Marketing 57.
Kohli, Ajay K., Jaworski, Bernard J., (1990),
Market Orientation: The Construct, Research
Propositions, and Managerial Implications,
Journal of Marketing 54.
Kumar, A., (2001), Marketing Research xxx,
John Wiley & Sons, Inc.
Lukas, Bryan A., Ferrel O.C., (2000), The
Effect of Market Orientation and Product
Innovation, Journal of Academy of Marketing
Science.
Maholtra, N. K., (2004), Marketing research,
Pearson Education International, New Jersey.
Markides, Constrantinos, (1997), Strategic
Innovation, Sloan Management Review 38.
Narver, John C., Slater, Stanley F., (1990), The
Effect of a Market Orientation on Business
Profitability, Journal of Marketing 54.
Shankar, Venkatesh, Carpenter, Gregory S.,
Krishnamurthi, Lakshman, (1998), Late Mover
Advantage: How Innovative Late Entrants
Outsell Pioneers, Journal of Marketing
Research.
Slater, Stanley F., Narver, John C., (1994),
Does Competitive Environment Moderate the
Market Orientation-Performance
Relationship, Journal of Marketing 58.
Styles, John., (2000), Product Innovation in
Early Modern London, Past & Present.
Related Documents