Mobile Industry Group 9th Edition – Special Topic: Mobile Retail OCTOBER 2013 AUSTRALIAN MOBILE PHONE LIFESTYLE INDEX Author: Dr Marisa Maio Mackay Director Complete the Picture Consulting

Welcome message from author
This document is posted to help you gain knowledge. Please leave a comment to let me know what you think about it! Share it to your friends and learn new things together.
Transcript

Mobile Industry Group
9th Edition – Special Topic: Mobile Retail
OCTOBER 2013
AUSTRALIAN MOBILE PHONE LIFESTYLE INDEX
Author:Dr Marisa Maio Mackay Director Complete the Picture Consulting
AIMIA . The Australian Mobile Phone Lifestyle Index . October 2013
Disclaimer
While all care and diligence has been used in producing this report, AIMIA gives no warranty it is error free and will not be liable for any loss or damage suffered as a result of the use, directly or indirectly, of information in this report.

AIMIA . The Australian Mobile Phone Lifestyle Index . October 2013
AIMIA AMPLI Survey
Official Research Partner:
Official Gold Sponsors:
Official Silver Sponsors:
Supporters:

AIMIA . The Australian Mobile Phone Lifestyle Index . October 2013
ABOUT AIMIA AND COMPLETE THE PICTURE CONSULTING
AIMIA
AIMIA is the Digital Industry Association for Australia.
Representing the digital content, services and applications industry in Australia since 1992, AIMIA exists to: • Encourage and support the growth of AIMIA members and the digital industry at large • Act as a medium of education and support for its members and the industry through a number of services • Represent AIMIA members and the digital industry to the broader business community. www.aimia.com.au
Complete the Picture Consulting
Complete the Picture Consulting provides business research and strategy advice to organisations across a range of industries. One of the key services they provide is the design, hosting and analysis of surveys.
Collectively, the directors have more than 40 years experience in providing organisations with results that make a difference to their business.www.completethepicture.com.au
AIMIA . The Australian Mobile Phone Lifestyle Index . October 2013
About the AMPLI Sponsors
Gold Sponsor - Deloitte Digital
Pioneered in Australia, Deloitte Digital brings different perspectives to our clients’ challenges, combining an established footprint in mobile, web, ecommerce, and content management.
Through nine studios across the US, UK, Japan and Australia, we provide clients with a full suite of digital services, covering digital strategy, user experience, creative, and implementation across mobile, web and social media channels.www.deloittedigital.com
Gold Sponsor – Telstra
Telstra is a company of connection.Every day we help millions of Australians connect to the people and things that matter most to them, because we believe the more connected people are the more opportunities they have.That’s why we build technology and content solutions that are simple and easy to use – including Australia’s largest fully integrated IP network and Australia’s largest and fastest national mobile network.www.telstra.com.au
Silver Sponsor – Mobile and App Design Awards
The Mobile & App Awards celebrate those who create work for this burgeoning platform as well as those who commission the work. There are currently Award Programs across three continents with the main trophies being awarded to the Design Champion, Studio, and Start Up of the year.www.mobileawards.com.au
AIMIA . The Australian Mobile Phone Lifestyle Index . October 2013
ACKNOWLEDGEMENTS
The AMPLI project team would like to extend a warm thank you to the following parties for helping in the promotion of the Survey.
Promoting and Linking to the SurveyAppsnackDeloitte DigitalOptusTelstraVirgin MobileAIMIAComplete the Picture Consulting
Banner ad creative:AIMIA
Data Analysis:Dr Marisa Maio Mackay - Director, Complete the Picture ConsultingDr Mark Mackay - Director, Complete the Picture Consulting
The Project Team would also like to thank those individuals who gave their time to review the report.
• Melani Theodorou - Office Administrator • Corinne Franks - General Manager • Kelly Slessor - Director BanterMob
AIMIA . The Australian Mobile Phone Lifestyle Index . October 2013
EXECUTIVE SUMMARY
This report presents the results of the 9th Australian Mobile Phone Lifestyle Index that has been carried out with the sponsorship and support of the Industry.
The overall objective of the annual study is to gain insights into the current and changing profile, behaviour and preferences of Australian mobile phone users over time. It remains the only known national, independent tracking study that makes its comprehensive results freely available to all interested parties.
The core questions have remained predominately the same across the nine years that the project has been carried out. Commencing with the second survey an annual special topic was also included to enable exploration of topical issues or emerging interests. For this edition, the special topic questions related to mobile retail. However, some key questions from prior years’ special topics – including the impact of tablets on mobile phone use - have also been included, because of the ongoing interest in these areas.
WHAT THE SURVEY COVERED
The specific research themes addressed in the study were as follows:
• The socio-demographic and mobile phone profile of Australian mobile phone owners • How Australian mobile phone owners are using their mobile phones and the frequency of use • How Australian mobile phone owners plan to use their phones in the near future • The use of websites compared to the use of applications on the mobile phone • The specific types of services, content and applications being accessed on the mobile phone • The current level of engagement with SMS and MMS messages received from businesses • Tablet ownership among Australian mobile phone owners • How Australian mobile phone owners are using the tablet and the frequency of their use • The use of applications compared to the use of websites on the tablet • The change in mobile phone use as a consequence of tablet ownership.
This year’s special topic - mobile retail - included a review of:
• The proportion of Australians making purchases on their mobile phones • The number and type of purchases being made by Australians on their mobile phones • The change in the number of in-store purchases since Australians started making purchases on their mobile phones • Expected future purchasing behaviour by Australians on their mobile phones • Overall experience of buying things on their mobile phone • The frequency of Australians using their mobile phone to compare prices online before making a purchase decision • The frequency of Australians using their mobile phone to look at product or service reviews before making a purchase decision • The response of Australian mobile phone owners to the overall idea of buying things using their mobile phone.

AIMIA . The Australian Mobile Phone Lifestyle Index . October 2013
Some key and topical findings from the survey will be presented in the remaining sections of the executive summary. Additional detail about the findings, together with the remaining analysis is detailed in the body of the report.
SURVEY DESIGN AND DISTRIBUTIONTo complete the survey the individual had to own a mobile phone and live in Australia. The survey consisted of primarily close ended and multiple-choice questions and took respondents approximately 15 minutes to complete. The survey was initially in the field for 18 days from Friday 23 August to Monday 9 September. The survey was extended for an additional 12 days from Wednesday 11 September to Sunday 22 September in an attempt to increase the number of responses received.
The survey was distributed via:
• Banner ads placed on a range of industry websites including carrier and media sites • Emails that were sent to previous AMPLI respondents who had agreed to participate in future surveys • Emails that were sent to some contacts who had previously indicated a willingness to distribute the survey • Social media.
SURVEY RESPONSE RATEA total of 2,319 respondents completed the 2013 Survey. This was slightly lower than the response rate for the past few years and most likely because some of the companies that have provided distribution of the survey in the past were unable to provide support this year for a range of different reasons.
As in past years, a large number of responses were received from people whose mobile phone carrier was Virgin Mobile. Consequently, the results were weighted to better reflect carrier market share. Additionally, a decision was made to incorporate the results from those respondents who had completed a reasonable amount of the survey, but did not finish the survey. The sample size used for the analysis was therefore reduced to 1,069 responses. This is still a good response rate.
ABOUT THE SURVEY RESPONDENTSThe survey collected data to enable the creation of a socio-demographic profile of the survey respondents.
In general, the socio-demographic profile of survey respondents is broadly in line with the profile of adult Australians released by the Australian Bureau of Statistics (ABS). Given this finding and the sample size, this confirms that the results of the 2013 Survey sample can be generalised to Australian mobile phone owners between 18 and 75 years of age.
The results also show that the socio-demographic profile of the respondents across all the surveys is relatively consistent, which allows for meaningful comparisons across the years.
The responses were then categorised into groupings by tagging the data with geoTribe1 groupings. The geo-demographic segmentation applies to Australians 18 years and over, and is based on a sophisticated spatial modelling process that combines Australian Bureau of Statistic Census demographic data with lifecycle stage and socioeconomic status data from the Household Expenditure Survey.
1 A profiling tool developed by rda research.

AIMIA . The Australian Mobile Phone Lifestyle Index . October 2013
In line with the overall generalisability of the survey results to the Australian adult population, the survey profile by the 15 geoTribes is similar to the Australian profile. It further confirms that the behaviours and views of Australians from a wide range of different stages of life and social status were collected. Such profiling analysis provides companies, other organisations and industry with a new and important understanding of how different segments of Australians are using mobile phones and what this may mean for their mobile strategy.
ABOUT THE MOBILE PHONES, PAYMENT PLANS AND CARRIERS
Smartphone OwnershipFor the last two years respondents have been asked if their mobile phone was a smartphone. Unsurprisingly there has been an increase in the percentage of respondents that owned a smartphone. 88% of respondents owned a smartphone compared to 76% of respondents last year.
Respondents that did not own a smartphone were asked if they planned to purchase a smartphone during the next 12 months. Although the planned purchase does not always result in actual purchase it does indicate intent, interest and overall mindset. Based on the results, 90% of respondents would own a smartphone by February 2014 and 93% would own a smartphone by August 2014, highlighting that smartphone uptake is still growing.
It is important to keep in mind that the !gures relating to smartphone ownership reported in this publication are a re"ection of smartphone ownership among the 18-75 year olds, and the generalisability of the results do not extend to older or younger Australians.
Satisfaction With Carrier ServicesRespondents were asked to indicate if they were satis!ed with a range of di#erent mobile phone service related issues.
Satisfaction with services by carrier clearly shows that variation across the carriers was substantial for many of the services. For example:
• Satisfaction with Virgin was considerably higher for many services including ‘range of plans and packages available’, ‘cost of accessing a data service’ and ‘customer service’ • Satisfaction with Telstra’s network coverage was yet again an obvious standout for the carrier when compared to the other providers • Vodafone again experienced a substantially lower level of overall satisfaction compared to the other carriers.
Data Inclusion In Payment Options Respondents were asked if an allowance for mobile data is included in their monthly bill or pre-paid amount. $e percentage of respondents that stated they had a data allowance included in their payment options has been substantially growing over the last four years. 84% of the respondents now have data included in their payment options compared to 75% last year, 63% in 2011, 47% in 2010 and 31% in 2009.
$e amount of data that is included in payment options has also been steadily increasing over the last four years. Of particular note is the increase in the percentage of respondents with more than 1GB of data (from 17% to 57% over the last four surveys).

AIMIA . The Australian Mobile Phone Lifestyle Index . October 2013
ABOUT HOW THE MOBILE PHONE IS USED
Overall Use Of The Mobile Phone Respondents were asked how often they used their mobile phone for a range of listed purposes.
There has been growth in the use of the mobile phone for all purposes other than voice calls and text messaging. The growth rates for the period 2011 to 2013 were as follows:
• Send and receive emails – 20% • To get information – 21% • For entertainment – 20% • To visit websites, and/or search or browse the internet – 18% • For banking, including transfers and bill payments – 20% • To buy things online – 19%.
Since the 2012 Survey ‘To read or edit documents’ was added to the list of phone uses. The growth from 2012 to 2013 was 15%.
Top 5 Ways Respondents Use Their Mobile PhonesSince 2012 respondents have also been asked to rank the top 5 ways they use their mobile phone from a selected list.
The 2013 results of the weighted rankings are consistent with the results from last year. Voice and SMS were clearly the most highly ranked uses, which is not surprising given they are truly entrenched uses of the mobile phone. These two uses of the phone each accounted for slightly more than 20% of total weighted rankings.
Using the mobile to ‘send and receive emails’, ‘to get information and ‘for entertainment,’ and to a lesser extent “to visit websites, and/or browse or search”, make up the second tier of mobile phone use. These uses accounted for between 7% and 14% of the total weighted rankings.
Use Of Websites Versus ApplicationsAnother continued topical issue in the media and industry has been around the use and popularity of websites versus applications, and the resulting implications for businesses. In response to this interest respondents have been asked whether they use more websites or applications on their mobile phones since the 2012 Survey.
The pattern across both years is similar. However, there has been an increase in the overall proportion of respondents using websites and/or applications on their mobile phone from 77% in 2012 to 87% in 2013.
Expected Use Of The Mobile Phone In The Next 12 MonthsThis question was first asked of respondents in 2012. Although actual and intended use is unlikely to perfectly match, it provides an indication of the interests and intent of respondents for the coming 12 months. The results suggest the following:
• Many respondents plan to increase their current uses of the mobile phone. o Around 25% of the respondents currently using their mobile phone for emailing, getting information, and visiting websites/browsing/searching intend to increase their use of the phone for these purposes in the next 12 months. o Around 20% of the respondents currently using their mobile phone for voice calls, SMS, entertainment and banking intend to increase their use of the phone for these purposes in the next 12 months.

AIMIA . The Australian Mobile Phone Lifestyle Index . October 2013
o Around 16-17% of the respondents currently using their mobile phone for buying things online and reading or editing documents online intend to increase their use of the phone for these purposes in the next 12 months. • Only a very small percentage of respondents (1-5%) plan to decrease their use of the mobile phone for any given purpose. • Only a small percentage of respondents (2-4%) plan to start using the phone for new uses they do not currently use their phones for.
ABOUT THE SPECIFIC SERVICES ACCESSED Respondents were again asked this year about the specific entertainment, information and communications services they access on their mobile phones. Some key findings that related to high-level and medium-level users were as follows2.
• Almost 30% of respondents were high-level users of games. Only a small percentage of respondents were high-level users of the remaining listed entertainment services and content. • Between 28% and 33% of respondents were high or medium-level users of entertainment services like music downloads, music streaming and video downloads. • There was an increase in the overall use of all the listed entertainment services and content. In the last year videos/video downloads and music streaming experienced the greatest rate of growth. The proportion of respondents accessing videos/video downloads increased by 12% to 47%, while the proportion of respondents streaming music almost doubled from 21% to 40%. • Weather and news were the most “popular” information services accessed in terms of frequency of use. Just over 40% of respondents were high-level users of weather (46%) and news (43%) information on their mobile phones, and approximately 30% were medium-level users. • Maps/location and traffic information were equally popular, but used less frequently. 50% of respondents were medium-level users and 24% were high-level users. • Between 34% and 40% of respondents were also high or medium-level users of most of the other information services. The only exceptions were restaurant or café information (48%) and TV Guides (29%). • Email and social networking sites were clearly the most frequently used communication services on the mobile phone. Just over half of the respondents were high-level users of email (58%) and social networking sites and applications (55%). • MMS had a similar overall proportion of combined high and medium-level users as social networking sites and applications. However, the ratio of high to medium is reversed for MMS with most users being medium-level users.
ABOUT THE APPLICATIONS ACCESSED
Respondents were asked if they had ever downloaded and installed an application on their mobile phone. For those respondents who had used applications additional data was collected.
Average Number Of Applications Used Per WeekSince 2012 respondents have been asked to report the average number of applications they used per week. There has been a clear shift from the use of 5 or less applications per week, towards the use of 6 or more applications per week. There was a 10% increase in the percentage of respondents that used 11 or more applications per week.
2 High-level users used the phone for the listed purpose daily (at least 5 times a day or at least once a day). Medium-level users used the phone for the listed purpose at least once a week or at least once a month.

AIMIA . The Australian Mobile Phone Lifestyle Index . October 2013
Types Of Applications Used By RespondentsRespondents were asked what type of applications they have used on their mobile phones in the last 6 months. The most popular types of applications used by respondents were “Maps and navigation” (80%), ‘News and weather’ (72%), ‘Games’ (64%), and ‘Photos, Videos and Movies’ (61%).
Paid Applications Downloaded And Installed On The Mobile PhonesOf those respondents who had downloaded and installed applications on their mobile phones, 62% stated they had paid to do so. This figure has increased gradually over the last few years, as follows:
• Survey 6 (2010) - 52% • Survey 7 (2011) - 60% • Survey 8 (2012) - 59% • Survey 9 (2013) - 62%.
ABOUT ADVERTISING AND MARKETING The special topic two years ago was advertising and marketing on the mobile phone. Some of these key questions were again included this year to provide some ability to track this evolving opportunity in the mobile phone space. The key results follow.
Number Of Businesses From Which Respondents Agreed To Receive MessagesRespondents were asked about the number of businesses from whom they had currently agreed to receive SMS or MMS messages.
There has been a steady increase in the overall proportion of respondents who had agreed to receive SMS or MMS messages from businesses over the last 3 surveys. In 2013 63% of respondents stated they had agreed to receive SMS or MMS messages from businesses, compared to 57% last year and 47% in 2011. Small increases in the percentage of people prepared to receive messages from businesses occurred for the “1-5 businesses” and “6-10 businesses” categories. The findings indicate that mobile phone respondents may be more inclined to agree to receive messages from a small number of businesses with which they already have an established or an important relationship rather than agreeing to receive messages from a large number of businesses.
ABOUT THE IMPACT OF TABLETS ON MOBILE PHONE USEThis was previously a special topic to determine the use of tablets and their impact on mobile phone use. As was the case with mobile advertising and marketing, some of the key questions were again included this year to provide some ability to also monitor this continuing area of interest for industry.
Tablet Ownership Of RespondentsUnsurprisingly, tablet ownership has continued to increase with 56% of the 2013 Survey respondents reporting that they owned a tablet. The rate of growth was considerable given the indication of tablet ownership in past surveys (38% in 2012 and 16% in 2011). We remind readers this figure represents tablet ownership among the 18-75 year olds and not all Australians, as is sometimes the basis for calculating ownership rates.
The rate of growth has not been as rapid as predicted from the ‘planned purchase’ question from the last Survey,

AIMIA . The Australian Mobile Phone Lifestyle Index . October 2013
which suggested that tablet ownership in this year’s survey would be around 70%. This may be a reflection of the impact of the continuing economic uncertainty on the priorities for purchasing among Australians, but also confirms that stated intention does not necessarily translate to action.
Tablet Use Compared To Mobile Phone UseA comparison of mobile phone use compared to tablet use was carried out. A higher percentage of respondents have used the tablet for most of the listed range of purposes “in the last 12 months”. Unsurprisingly, the only exceptions were voice calls and texting.
A closer analysis of frequent mobile phone users and frequent tablet users (at least once a week) revealed a similar overall pattern of use (excluding voice and SMS). However, the percentage of frequent users accessing the listed services was again consistently higher on the tablet, compared to the mobile phone.
Almost all tablet owners (99%) used websites and/or applications compared to 87% of mobile phone users suggesting that there are some differences in how these devices are being used. Of particular interest is that websites are just, if not more popular, than applications among tablet owners.
Perceived Impact of Tablets on Mobile Phone UseFinally, respondents were asked whether as a result of purchasing their tablet their use of their mobile phone stayed the same, increased or decreased across a list of phone functions (e.g., banking, website visits, buying things online). Although tablet ownership has increased since the 2012 Survey the profile of impact on phone use remains quite similar. While there is some impact of tablet purchase affecting mobile phone uses (either increasing or decreasing) the percentage of respondents whose phone use is unaffected (stayed the same) by the purchase of a tablet has increased. This suggests that mobile phones and tablets may eventually become complementary devices for the type of uses listed.
SPECIAL TOPIC - MOBILE RETAIL
Purchases Made On The Mobile PhoneMore than half of the respondents (54%) made a successful purchase on their mobile phone in the last 12 months.
Paying For Purchases Made On The Mobile PhoneUsing a ‘credit card or debit card’ was the most popular method that respondents used to pay for purchases made on the mobile phone (63%), followed by the use of ‘payPal’ (52%) and an ‘Apple iTunes account’ (48%).
Number And Type Of Purchases Made On The Mobile PhoneOf those respondents that had made purchases on their mobile phone, 65% had purchased digital content for their mobile phone (e.g., ringtones, video clips, music, apps, games). This was clearly the most popular type of content purchased for the mobile phone followed by tickets (53%).
Almost a quarter of the respondents who had made purchases on their mobile phone had made more than 5 purchases in the last month. Just under half (45%) had made between 2-5 purchases on their mobile phone in the last month. This suggests that while phone users are using their phones to make purchases the number of transactions is still relatively few.

AIMIA . The Australian Mobile Phone Lifestyle Index . October 2013
Impact Of In-Store Purchases Respondents were asked to specify whether their overall number of in-store purchases had increased, stayed the same, or decreased since they had started making purchases on their mobile phone. Almost 30% of respondents have decreased their in-store purchasing since they started buying on their mobile phones. Over half (56%) of the respondents stated that their in-store purchases had stayed the same, while 11% said their in-store purchases had increased.
Overall Experience Of Making Purchases On The Mobile PhoneThe results clearly suggest that for most respondents the experience of making a purchase on their mobile phone has been positive. Almost 80% said that they were “very satisfied” or “somewhat satisfied” with the experience and only 5% were either dissatisfied or very dissatisfied with the experience.
Expected Future Purchasing BehaviourThe positive news for online retailers is that almost 40% of respondents currently using the mobile phone for purchasing believe that the number of purchases they make on their phone will increase in the next 12 months. Only 5% of respondents said they think their purchases will decrease, with just over half believing their number of purchases will remain the same.
Role Of The Mobile Phone In The Purchase DecisionJust over 60% of respondents reported using the mobile phone to compare prices online (64%) and look at product or service reviews (67%) before making a purchase decision in the last 12 months. It is evident that the mobile phone is not only a platform for making the actual purchase, but is also important for many consumers in aiding their purchase decisions.
We trust that this research will enable industry stakeholders to develop a better understanding of Australian mobile phone users as part of their ongoing quest to meet changing consumer needs.
FOR MORE INFORMATIONFor more information about: • The report • Becoming a sponsor of the 2014 survey • The option of additional analysis of the AMPLI data to meet your specific needs.
Please contact:
Dr Marisa Maio MackayDirector, Complete the Picture ConsultingPhone: +61 430 933 307 Email: [email protected]
Or the AIMIA National Office on (02) 9248 7900

AIMIA . The Australian Mobile Phone Lifestyle Index . October 2013
TABLE OF CONTENTS
EXECUTIVE SUMMARY V
INTRODUCTION 1
RESEARCH THEMES AND DESIGN 2
SPECIAL TOPIC FOR 2013 2
SURVEY RESPONSE RATE 3
INTERPRETING THE RESULTS 4
PRESENTATION OF THE RESULTS 4
SECTION 1: ABOUT THE SURVEY RESPONDENTS 5GENDER OF RESPONDENTS 7
AGE OF RESPONDENTS 8
LOCATION OF RESPONDENTS 10
HOUSING STATUS OF RESPONDENTS 11
EMPLOYMENT OF RESPONDENTS 12
INCOME OF RESPONDENTS 13
PROFILE OF RESPONDENTS BY GEOTRIBE 14
SECTION 2: ABOUT THE MOBILE PHONES, PAYMENT PLANS AND CARRIERS 15SMARTPHONE OWNERSHIP OF RESPONDENTS 15
HANDSET BRAND OF RESPONDENTS 17
MOBILE PHONE CARRIER OF RESPONDENTS 18
SATISFACTION WITH CARRIER SERVICES 19
PAYMENT OF MOBILE PHONE BILLS 22
MONTHLY PHONE SPEND BY RESPONDENTS 23
DATA INCLUSION IN PAYMENT OPTIONS 24
SECTION 3: ABOUT HOW THE MOBILE PHONE IS USED 26OVERALL USE OF THE MOBILE PHONE 26
TOP 5 WAYS RESPONDENTS USE THEIR MOBILE PHONES 28
FREQUENCY OF USE OF THE MOBILE PHONE FOR SPECIFIC PURPOSES 30
USE OF WEBSITES VERSUS APPLICATIONS 32
EXPECTED USE OF THE MOBILE PHONE IN THE NEXT 12 MONTHS 34
MOBILE PHONE USE BY GEOTRIBE 35
High-Level and Medium-Level Users By geoTribe 36
High-Level and Medium Level Users Within Each geoTribe 42
LOOKING INTO THE FUTURE 45

AIMIA . The Australian Mobile Phone Lifestyle Index . October 2013
SECTION 4: ABOUT THE SPECIFIC SERVICES ACCESSED 46ENTERTAINMENT SERVICES AND CONTENT ACCESSED 46
INFORMATION SERVICES ACCESSED ON THE MOBILE PHONE 49
COMMUNICATION SERVICES ACCESSED ON THE MOBILE PHONE 51
TYPE OF SOCIAL NETWORKING SITES ACCESSED 52
SECTION 5: ABOUT THE APPLICATIONS ACCESSED 54NUMBER OF APPLICATIONS DOWNLOADED AND INSTALLED 55
AVERAGE NUMBER OF APPLICATIONS USED PER WEEK 56
TYPES OF APPLICATIONS USED 57
PAID APPLICATIONS DOWNLOADED AND INSTALLED 59
TYPE OF APPLICATIONS RESPONDENTS PAID FOR 59
TYPICAL COST RESPONDENTS PAID FOR AN APPLICATION 61
SECTION 6: ABOUT ADVERTISING AND MARKETING 62NUMBER OF BUSINESSES FROM WHICH RESPONDENTS HAVE AGREED TO RECEIVE MESSAGES 62
TYPE OF BUSINESSES RESPONDENTS OPTED IN TO 64
SECTION 7: IMPACT OF TABLETS ON MOBILE PHONE USE 65TABLET OWNERSHIP OF RESPONDENTS 65
TABLET BRANDS 66
USE OF THE TABLET BY RESPONDENTS 67
MOBILE PHONE USE COMPARED TO TABLET USE 70
PERCEIVED IMPACT OF TABLETS ON MOBILE PHONE USE 72
SECTION 8: SPECIAL TOPIC - MOBILE RETAIL 74PURCHASES MADE ON THE MOBILE PHONE 74
TYPE AND NUMBER OF PURCHASES MADE ON THEIR MOBILE PHONE 75
PURCHASES MADE ON THE MOBILE PHONE FROM AN OVERSEAS BUSINESS 76
IMPACT ON IN-STORE PURCHASES SINCE RESPONDENTS STARTED 77
MAKING PURCHASES ON THEIR MOBILE PHONES 77
THE FUTURE BEHAVIOUR OF RESPONDENTS IN THE USE OF THE MOBILE PHONE FOR PURCHASING 78
OVERALL EXPERIENCE OF MAKING A PURCHASE ON THE MOBILE PHONE 79
ROLE OF THE MOBILE PHONE IN THE PURCHASE DECISION 80
RESPONSE TO THE OVERALL IDEA OF BUYING THINGS ONLINE 81
SECTION 9: LOOKING AT MOBILITY MORE BROADLY 82
FOR MORE INFORMATION 83
1AIMIA . The Australian Mobile Phone Lifestyle Index . October 2013
INTRODUCTION
This report presents the results of the 9th Australian Mobile Phone Lifestyle Index (AMPLI) survey that has been carried out with the sponsorship and support of Industry.
The overall objective of the study is to gain insights into the current and changing profile, behaviour and preferences of Australian mobile phone users over time. It remains the only known national independent tracking study that makes its comprehensive results freely available to all interested parties.
The first study was initiated by the AIMIA Mobile Industry Group in 2005 and was motivated by the lack of available independent information about Australian mobile phone users. Subsequent surveys have been carried out. Apart from carrying out the survey twice in 2007, the survey has been carried out annually since 2005 as shown below:
• Survey 2 was carried out in May 2006 • Survey 3 was carried in March 2007 • Survey 4 was carried out in August 2007 • Survey 5 was carried out in June 2009 • Survey 6 was carried out in June/July 2010 • Survey 7 was carried out in July 2011 • Survey 8 was carried out in July 2012.
We expect to continue to carry out the study annually in order to investigate longitudinal trends relating to mobile phone use in Australia, as well as studying emerging topics of importance.
The survey consists of a series of core questions that have remained predominately unchanged since the inception of the project. Since Survey 2 questions relating to an annual special topic have also been included in the surveys. The special topics were different for each subsequent survey. The project team together with the AIMIA Mobile Industry Group selects the special topic areas each year and endeavours to capture topics that will have wide appeal and interest to all users of the report. A list of the special topics for past surveys follows:
• Survey 2 2006 - The Impact of 3G • Survey 3 2007 - Advertising on the Mobile Phone • Survey 4 2007a - Communities and User Generated Content • Survey 5 2009 - Mobile Commerce • Survey 6 2010 - Mobile Phone Applications • Survey 7 2011 - Mobile Phone Advertising and Marketing • Survey 8 2012 - Impact of Tablets on Mobile Phone Use.
For the 2013 Survey the special topic questions related to mobile retail – the purchase of goods and services on the mobile phone.
The report is organised into the following key sections:
1. Research Themes and Design 2. Survey Response Rate 3. Interpreting the Results

AIMIA . The Australian Mobile Phone Lifestyle Index . October 2013 2
4. Presentation of the Results 5. The Results 6. For More Information
This research has been designed to enable industry stakeholders to develop a better understanding of Australian mobile phone users as part of their ongoing quest to meet changing consumer needs.
RESEARCH THEMES AND DESIGN
RESEARCH THEMES
In the overall context of developing an understanding of Australian mobile phone users in terms of their profile, current behaviour and preferences, the specific research themes addressed in the study are as follows:
• The socio-demographic and mobile phone profile of Australian mobile phone owners • How Australian mobile phone owners are using their mobile phones and the frequency of use • How Australian mobile phone owners plan to use their phones in the near future • The use of websites compared to the use of applications on the mobile phone • The specific types of services, content and applications being accessed on the mobile phone • The current level of engagement with SMS and MMS messages received from businesses • Tablet ownership among Australian mobile phone owners • How Australian mobile phone owners are using tablets and the frequency of their use • The use of applications compared to the use of websites on the tablet • The change in mobile phone use as a consequence of tablet ownership.
SPECIAL TOPIC FOR 2013
The special topic for the 2013 AMPLI was Mobile Retail. Specific areas that were explored included:
• The proportion of Australians making purchases on their mobile phones • The number and type of purchases being made by Australians on their mobile phones • The change in in-store purchases since Australians started making purchases on their mobile phones • Expected future purchasing behaviour by Australians on their mobile phones • Overall experience of buying things on their mobile phone • The frequency of Australians using their mobile phone to compare prices online before making a purchase decision • The frequency of Australians using their mobile phone to look at product or service reviews before making a purchase decision • The response of Australian mobile phone owners to the overall idea of buying things using their mobile phone.
It should also be noted that in line with the overall objective of the Survey, the AMPLI:
• Focuses on all adult Australians that own a mobile phone, not only smartphone users • Includes some user-segmentation (profiling) to help companies determine the mobile phone behaviours of their customers.
AIMIA . The Australian Mobile Phone Lifestyle Index . October 2013 3
SURVEY DESIGN AND DISTRIBUTION
A pilot of the 2013 survey was carried out during August to ensure survey functionality, optimal usability and data integrity. The survey was then activated and in the field for 18 days from Friday 23 August to Monday 9 September. The survey was extended for an additional 12 days from Wednesday 11 September to Sunday 22 September in an attempt to increase the number of responses received.
To be eligible to complete the survey, survey respondents had to own a mobile phone and live in Australia.
The survey consisted of primarily close ended and multiple-choice questions and took respondents approximately 15 minutes to complete. An incentive was offered to encourage potential respondents to participate in the study and also complete the survey. The incentives provided for the 2013 survey were two 16GB Apple iPod Touches and two $250 Myer Gift Vouchers. Those respondents that completed the survey were eligible to enter a draw for the prizes. A random draw was carried out to select the winners.
The survey was distributed by the following mechanisms:
• Banner ads that were placed on a range of industry websites including carrier and media sites (for a full list refer to acknowledgements) • Emails that were sent to previous AMPLI respondents who had opted in to receive research requests • Emails that were sent to some contacts who had previously indicated a willingness to distribute the survey • Promotion of the survey by social media (e.g., Twitter).
SURVEY RESPONSE RATEA total of 2,319 respondents completed the 2013 survey. This was slightly lower than the response rate for the past few years and most likely because some of the companies that have provided distribution of the survey in past years were unable to provide support this year for a range of different reasons.
A large number of responses were received from people whose mobile phone carrier was Virgin. This over-representation has occurred in past years (e.g., 2009 to 2011) and in 2011 the survey data was weighted to better reflect the market share in order to facilitate easier interpretation of the results for all mobile stakeholders.
As a consequence of the over-representation of respondents whose mobile phone carrier was Virgin in this year’s survey, weighting of responses was once again undertaken. The number of responses received from respondents whose carrier was Virgin was reduced to better reflect market share. Additionally, a decision was made to incorporate the results from those respondents who had completed a reasonable amount of the survey, but did not finish the survey.
What this meansThe sample size used for the 2013 analysis was reduced to 1,069. However, it should be noted that this is still a good response rate. The confidence interval for this sample is still small (3).

AIMIA . The Australian Mobile Phone Lifestyle Index . October 2013 4
INTERPRETING THE RESULTSAs you move through the report please remember the following:
• Tables and figures are reported as percentages unless otherwise stated. Due to rounding some totals may range from 99% to 101%.
• Rounding errors may also affect the total percent of collapsed categories. For example combining the frequency categories “at least 5 times a day” and “at least once a day” may not exactly equate to the sum of the rounded percentages for these categories.
• The number of responses for questions may vary, as there were some respondents that did not complete all sections (e.g., demographic questions). However, the confidence intervals are only marginally affected and we can therefore be confident that the results reflect the profile and behaviours of Australian mobile phone users between the ages of 18 and 75.
• Wherever possible and where of value (as considered by the author) comparisons have been made across the surveys. To aid readability, this comparison has usually been shown for the last three or four surveys. Please also remember that in order to capture the changing mobile phone market, there has been variation in the way that some of the information has been collected across the surveys. Consequently, not all questions are comparable across all surveys.
PRESENTATION OF THE RESULTS$e results of the research are presented in nine key sections:
• Section 1: About $e Survey Respondents • Section 2: About the Mobile Phones, Payment Plans & Carriers • Section 3: About How the Mobile Phone is Used • Section 4: About the Speci!c Services Accessed • Section 5: About $e Applications Accessed • Section 6: About Advertising And Marketing • Section 7: About the Impact of Tablets on Mobile Phone Use • Section 8: Special Topic - Mobile Retail • Section 9: A Broader Look At Mobility
AIMIA . The Australian Mobile Phone Lifestyle Index . October 2013 5
SECTION 1: ABOUT THE SURVEY RESPONDENTSThis section of the report provides a socio-demographic profile of the survey respondents, which includes the following:
• Gender • Age • Location • Housing status • Employment status • Income • Profile by geoTribe
The socio-demographic profile of survey respondents is broadly in line with the profile of adult Australians released by the Australian Bureau of Statistics (ABS) and shows that the results of the 2013 Survey sample can be generalised to Australian mobile phone owners between 18 and 75 years of age.
The results of this section also show that the socio-demographic profile of the respondents across all the surveys is relatively consistent, which allows for meaningful comparisons across the years.
However, to aid readability of this section:
• Comparison between the survey results and the ABS data is included for only some of the demographic variables • Comparison across all surveys is included for only some of the demographic variables, and typically included responses from the last three or four surveys.
More About geoTribesA profile of respondents by geoTribe groupings is also presented in this section of the report. geoTribes are a profiling tool developed by rda research, a leading Australian supplier of geo-demographic solutions for companies.
The geo-demographic segmentation applies to Australians 18 years of age and over, and is based on a sophisticated spatial modelling process that combines Australian Bureau of Statistic Census demographic data with lifecycle stage and socioeconomic status data from the Household Expenditure Survey. The 15 geo-tag profiles were introduced to the AMPLI for the first time last year. They have been applied to all of the survey respondents aged 18+ years that have at the least, supplied age, gender and postcode details3. Descriptions of the 15 geoTribes are provided on the following page.
Further analysis of mobile phone behavior by these geoTribes is also presented for some of the mobile phone use results.
Such profiling analysis provides companies and the Industry with a new and important understanding of how different segments of Australians are using mobile phones and what this may mean for their mobile strategy.
3 Most of the alignment to the tribes also drew on additional information supplied by the respondents like suburb and housing type.

AIMIA . The Australian Mobile Phone Lifestyle Index . October 2013 6
geoTribe descriptors
2
geoTribe Summary Description of geoTribe Achievers
Boomers
Crusaders
Debstars
Fortunats
Grey Power
Independents
Preppies
Rockafellas
Sleander Meanz
Struggleville
Suburban Splendour
Survivors
True Blues
Twixters
Ambitious younger & middle aged familiesWhite collar post family pre-retirees
Career-orientated singles & couples
Financially extended younger families
Financially secure retirees & pre-retirees
Better off retireesYoung singles & couplesMature children of affluent parentsAffluent mature familiesPeople living in under- privileged circumstancesStruggling young & middle aged familiesMiddle class mature familiesRetirees living on minimal incomesBlue collar mature families & pre-retirees singles or couplesMature children living at home
geoTribe Summary Description
3
AIMIA . The Australian Mobile Phone Lifestyle Index . October 2013 7
GENDER OF RESPONDENTS
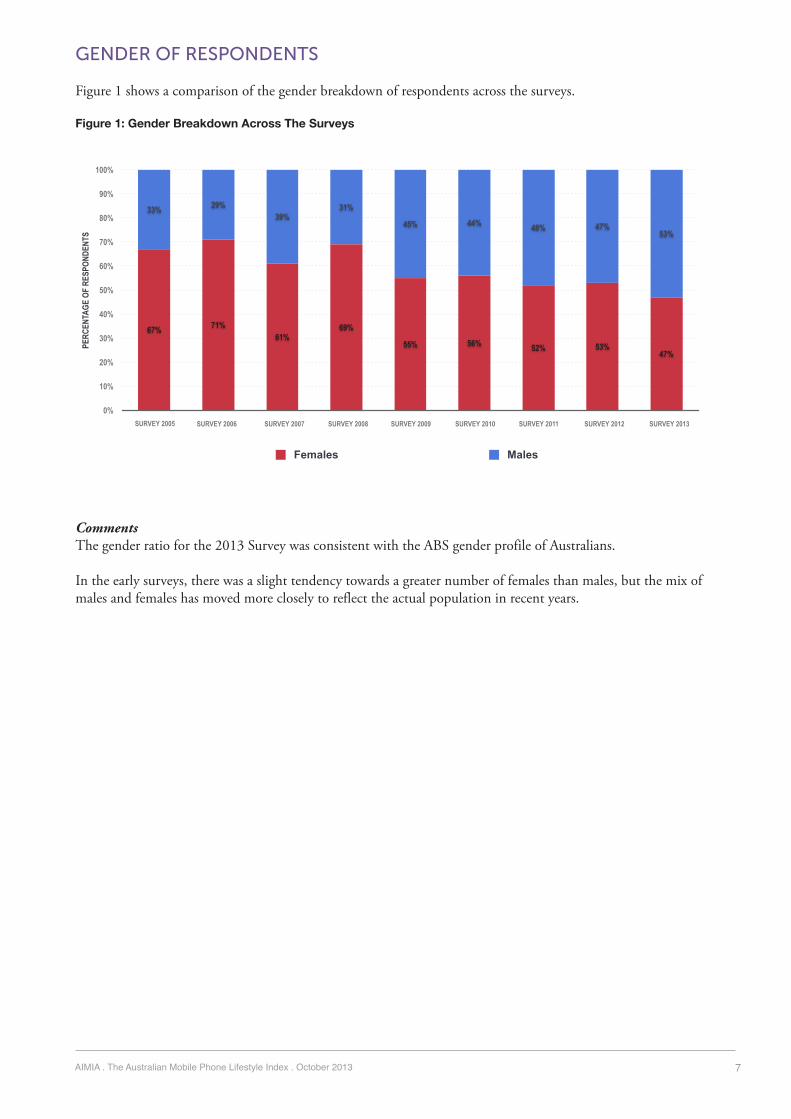
Figure 1 shows a comparison of the gender breakdown of respondents across the surveys.
Figure 1: Gender Breakdown Across The Surveys
CommentsThe gender ratio for the 2013 Survey was consistent with the ABS gender profile of Australians.
In the early surveys, there was a slight tendency towards a greater number of females than males, but the mix of males and females has moved more closely to reflect the actual population in recent years.
Gender of Respondents Across the Surveys
0%
10%
20%
30%
40%
50%
60%
70%
80%
90%
100%
53%47%48%44%45%
31%39%
29%33%
47%53%52%56%55%
69%61%
71%67%
PERC
ENTA
GE O
F RE
SPON
DENT
S
Females Males
SURVEY 2005 SURVEY 2006 SURVEY 2007 SURVEY 2008 SURVEY 2009
6
SURVEY 2012SURVEY 2011SURVEY 2010 SURVEY 2013

AIMIA . The Australian Mobile Phone Lifestyle Index . October 2013 8
AGE OF RESPONDENTS
Figure 2 shows a comparison of the age distribution of 2013 respondents compared to the population data from the Australian Bureau of Statistics (ABS). Figure 3 shows the age profile of respondents across the last five surveys.
Figure 2: Age of 2013 Survey Respondents Compared To The ABS Age Profile Of Australians
Figure 3: Age of Respondents Across The Last Five Surveys
Age of Respondents Compared to Australian Bureau of Statistics Australian Profile
0%
5%
10%
15%
5%
6%
8%
9%
10%10%
11%
10%10%10%10%
2%
6%
8%
9%
10%10%
12%12%
13%
9%9%
PPER
CENT
AGE
OF R
ESPO
NDEN
TS
Survey Australian Population (ABS Census)
20-24 YRS 30-34 YRS25-29 YRS 35-39 YRS 40-44 YRS 50-54 YRS45-49 YRS 60-64 YRS55-59 YRS 70-74 YRS65-69 YRS
7
Age of Respondents Across the Surveys
0
5
10
15
20
12 to 16 17 to 18 19 to 21 22 to 25 26 to 30 31 to 35 36 to 40 41 to 45 46 to 50 51 to 55 56 to 60 61 to 65 >65
PERC
ENT
OF R
ESPO
NDEN
TS
AGE CATEGORIES
Survey 2009 Survey 2010 Survey 2011 Survey 2012 Survey 2013
8

AIMIA . The Australian Mobile Phone Lifestyle Index . October 2013 9
CommentsThe age profile for the 2013 Survey is closely aligned with the ABS age profile of adult Australians up to the age of 75 years, with only a slight over-representation in the 30-39 age groups and a slight under-representation in the 70-74 year age group.4
There has been a gradual shift in the distribution of the age profile over the life of the AMPLI survey. There was a bias towards younger respondents in the first survey (2005). Over time, this bias has slowly disappeared as older Australians purchased and started using the mobile phone. Figure 3 shows that the age profile of the respondents in the last few surveys, in particular, more closely matches that of the Australian population.
While there is some variation in the age profile across the surveys, it is nevertheless still possible to compare responses in relation to different age groups across the surveys.5 This type of analysis is outside the scope of this report, but can be provided on request.
4 The age comparison with the ABS data is usually reported in 5-year age groups e.g. 20-24, 25-29 and it is for this reason that these categories are used in Figure 2 to compare the age profiles of the survey respondents and the ABS data.5 The only exception with respect to comparing survey responses based upon age groups relates to the first survey in 2005 where no responses were collected from people aged greater than 65 years.

AIMIA . The Australian Mobile Phone Lifestyle Index . October 2013 10
LOCATION OF RESPONDENTS
Figure 4 shows the residing state of the respondents compared to the population data from the Australian Bureau of Statistics (ABS). Figure 5 presents the location profile of respondents across all of the surveys.6
Figure 4: Residing State Of The 2013 Survey Respondents Compared To The ABS Age Profile Of Adult Australians
Figure 5: Residing State Of Respondents Across The Surveys
Location of Respondents Compared to Australian Bureau of Statistics Australian Profile
0%
10%
20%
30%
40%
10%
25%
2%
7%
20%
1%
32%
2%
6%
20%
1%
22%
14%
1%
34%
2%
PERC
ENTA
GE O
F RE
SPON
DENT
S
Survey Australian Population (ABS Census)
AUSTRALIAN CAPITAL
TERRITORY
NEW SOUTH WALES
NORTHERN TERRITORY
QUEENSLAND WESTERN AUSTRALIASOUTH AUSTRALIA TASMANIA VICTORIA
9
Location of Respondents Across the Surveys
0%
10%
20%
30%
40%
50%
60%
70%
80%
90%
100% 1%2%2%2%1%2%2%2%2%3%2%2%2%2%2%3%
14%18%
17%19%18%18%19%19%
6%
8%8%8%10%8%7%9%
22%15%
12%9%10%10%8%6%
34%34%35%
35%34%35%
33%33%
20%19%24%27%25%24%28%28%
PERC
ENTA
GE O
F RE
SPON
DENT
S
VIC NSW SA WA QLD ACT TAS NT
SURVEY 2006 SURVEY 2007 SURVEY 2008
10
SURVEY 2010SURVEY 2009 SURVEY 2012SURVEY 2011 SURVEY 2013
6 The residing state of respondents was not collected for Survey 1 (2005).

AIMIA . The Australian Mobile Phone Lifestyle Index . October 2013 11
CommentsAll Australian States and Territories were represented in all surveys with a similar breakdown across the samples. Overall the profiles were broadly consistent with the ABS with around 55-60% of Survey participants living in New South Wales and Victoria. There was, however, an over-representation of SA respondents and under representation from Victoria and Queensland relative to the ABS profile, especially in the 2013 Survey.
HOUSING STATUS OF RESPONDENTS
In the last three surveys (2011, 2012 and 2013) the housing status of respondents has been recorded. $is has allowed better matching of the respondents to the socio-demographic and lifestyle geoTribes, which were introduced in the 2011 report. Figure 6 shows the housing status of Survey 2011, 2012 and 2013 respondents.
Figure 6: Housing Status Of Survey 2011, 2012 And 2013 Respondents
Comments$e housing pro!le of the respondents was similar across the three surveys. All housing options were represented, with an overwhelming majority living in separate housing. $is is consistent with the ABS housing pro!le of adult Australians.
Housing of Respondents Across the Surveys
12
0%
10%
20%
30%
40%
50%
60%
70%
80%
2%
11%
23%
65%
1%
8%
18%
72%
1%
9%
21%
69%
PERC
ENTA
GE O
F RE
SPON
DENT
S
Survey 2011 Survey 2012 Survey 2013
SEPARATE HOUSE FLAT, UNIT OR APARTMENT
SEMI-DETACHED ROW OR TERRACE HOUSE, OR TOWN HOUSE
OTHER

AIMIA . The Australian Mobile Phone Lifestyle Index . October 2013 12
EMPLOYMENT OF RESPONDENTS
The employment status of respondents is shown in Figure 7. This data was also collected for the first time in 2009 (Survey 5) to provide additional insights about the survey respondents.
Figure 7: Employment Status Of Respondents Across The Last Four Surveys
CommentsThe employment profile of respondents across the surveys is consistent and suggests that the surveys captured the use and views of respondents from a cross section of different employment status. However, there is a slight shift in the last few surveys in terms of the proportion of retirees, which has been increasing. This better reflects the broader population and the improved generalisability of the later surveys results across the older age brackets. This is in line with the increasing adoption of mobile phones by older Australians in recent years.
Employment Status of Respondents Across the Surveys
14
0%
10%
20%
30%
40%
50%
60%
1%3%
9%10%13%12%
49%
4%1%
3%
7%8%11%
13%
49%
7%
1%3%
11%9%9%
14%
46%
8%
1%3%
13%
9%6%
15%
47%
7%
PERC
ENTA
GE O
F RE
SPON
DENT
S
Survey 2010 Survey 2011 Survey 2012 Survey 2013
PART TIME EMPLOYEE
FULL TIME EMPLOYEE
SELF-EMPLOYED VOLUNTEERRETIREDFULL TIME DOMESTIC DUTIES
STUDENT UNEMPLOYED

AIMIA . The Australian Mobile Phone Lifestyle Index . October 2013 13
INCOME OF RESPONDENTSFigure 8 shows the breakdown of annual household income of respondents of the last four surveys. Prior to Survey 5, individual income as opposed to household income was collected. The change to household income in 2009 (Survey 5) allowed alignment with data collected through the Australian Bureau of Statistics and is considered a more accurate indicator of social economic status, which may be of interest to some readers.7
Figure 8: Annual Household Income Of Respondents Across The Last 4 Surveys
CommentsThe overall income profiles for the last four surveys are similar. However, the income profile of respondents from more recent surveys, especially the 2013 Survey, has captured a higher proportion of respondents with a higher household income. This may be a reflection of the increased number of older respondents that have completed the survey in the last few years, which has increased the generalisability of the results to the wider population. It is also in line with the over-representation of “Crusaders” – career orientated singles and couples, especially in the 2013 Survey (see Profile of Respondents by geoTribes).
Since 2011 (Surveys 7, 8 and 9), the words “not prepared to say” were added to the “don’t know” category. $is may account for the increase in the “don’t know category” and the subsequent decrease in the middle range categories.
Housing Income of Respondents Across the Surveys
16
0%
10%
20%
30%
40%
17%
7%
13%15%
25%
14%
8%
20%
5%7%
15%
28%
15%
9%
20%
4%6%
14%
27%
17%
10%
14%
4%6%
16%
32%
18%
10%PERC
ENTA
GE O
F RE
SPON
DENT
S
Survey 2010 Survey 2011 Survey 2012 Survey 2013
$101K TO $150K MORE THAN 200K DON’T KNOW/ NOT WILLING TO SAY
$25K TO $50K $51K TO $100KLESS THAN 25K $151K TO $200K
7 The weekly individual income of the respondents collected in earlier surveys clearly shows that the surveys had captured respondents who earned across a range of income categories.

AIMIA . The Australian Mobile Phone Lifestyle Index . October 2013 14
PROFILE OF RESPONDENTS BY GEOTRIBE
Table 1 shows the profile of the Survey 2013 respondents by geoTribe compared to the Profile of the Australian Population.
Table 1: geoTribe Profile Of Respondents Compared To The Profile Of Australian Population
CommentsAll 15 geoTribes were represented in the survey sample. This is not surprising given the socio-demographic profile of the respondents already discussed in this section. It confirms, however, that the behaviours and views of Australians from a wide range of different stages of life and social status have been collected. This is again consistent with previous surveys.
In line with the overall generalisability of the survey results to the Australian adult population, the survey profile by geoTribe is similar to the Australian profile. A notable deviation from the Australian profile is that the Crusaders were considerably over-represented in the survey. The lower socio-economic profiles, while represented, are typically under-represented compared to the Australian population. This is consistent with the 2011 and 2012 Survey sample geoTribe profiles (see previous AMPLI reports) and is not surprising given the make up of the these particular geoTribe segments. Crusaders are the career-orientated singles and couples who probably spend a lot of time online, and hence may be more likely to complete an online survey. Whereas the priority of the Survivors, for example, is “survival”, that is, these individuals have little income (living off government benefits) that is spent on the basics like food and healthcare rather than spending time online.
geoTribe Descriptor Profile of 2013 Survey Respondents
Profile of Australian Population
Achievers
Boomers
Crusaders
Debtstars
Fortunats
Grey Power
Independents
Preppies
Rockafellas
Slender Meanz
Struggleville
Suburban Splendour
Survivors
True Blues
Twixters
Total
Ambitious younger & middle aged families 11% 9%
White collar post family pre-retirees 7% 7%Career-orientated singles & couples 20% 5%
Financially extended younger families 6% 11%
Financially secure retirees & pre-retirees 7% 7%Better off retirees 5% 6%Young singles & couples 5% 6%Mature children of affluent parents 4% 4%Affluent mature families 10% 6%
People living in under- privileged circumstances 3% 6%
Struggling young & middle aged families 3% 6%Middle class mature families 7% 9%
Retirees living on minimal incomes 4% 8%
Blue collar mature families & pre-retirees singles or couples 7% 6%
Mature children living at home 2% 4%
100% 100%

AIMIA . The Australian Mobile Phone Lifestyle Index . October 2013 15
SECTION 2: ABOUT THE MOBILE PHONES, PAYMENT PLANS AND CARRIERS
This section includes the mobile phone profile of the respondents, which includes:
• Smartphone ownership • Handset brand ownership • Mobile phone carriers • Satisfaction with carrier services • Payment methods • Monthly phone spend • Data allowances.
SMARTPHONE OWNERSHIP OF RESPONDENTS
For the last three years respondents have been asked if their mobile phone was a smartphone. A smartphone was defined in the survey as a “mobile telephone with built-in applications and Internet access – more like a handheld computer integrated with a mobile telephone.”
The results are shown in Figure 9.
Figure 9: Smartphone Ownership Of Respondents Across The Last Three SurveysSmartphone Ownership Across the Surveys
20
0%
10%
20%
30%
40%
50%
60%
70%
80%
90%
100%
1%
11%
88%
3%
21%
76%
5%
28%
67%
PERC
ENTA
GE O
F RE
SPON
DENT
S
Survey 2011 Survey 2012 Survey 2013
YES NO DON’T KNOW
AIMIA . The Australian Mobile Phone Lifestyle Index . October 2013 16
CommentsUnsurprisingly, there has been a further increase in the percentage of respondents reporting smartphone ownership. 88% of the respondents owned a smartphone, compared to 76% last year and 67% of respondents in 2011. This is only slightly higher than the forecasted figure from last year’s survey. Based on the 2012 Survey results, it was estimated that 84% of the population represented in the Survey would own a smartphone by mid 2013.
There is some debate about the exact current ownership figure in Australia. However, it is uncontestable to say that ownership has been increasing rapidly over the last few years. It is important to keep in mind that the figure reported in this publication is a reflection of smartphone ownership among the 18-75 year olds, and the generalisability of the result does not extend to older or younger Australians.
The recorded ownership figures will also vary depending on whether it is being measured as a percentage of the overall number of mobile phone subscriptions in Australia (higher than the total number of Australians) or as a percentage of all Australians or just adult Australians.
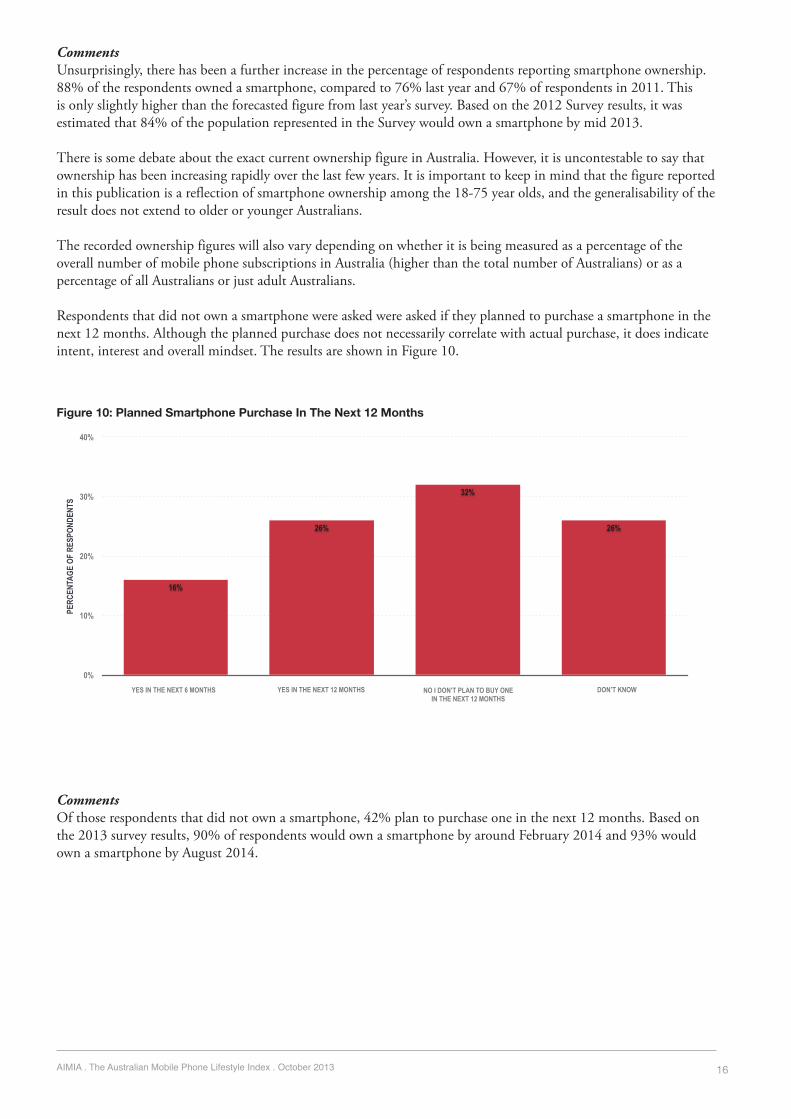
Respondents that did not own a smartphone were asked were asked if they planned to purchase a smartphone in the next 12 months. Although the planned purchase does not necessarily correlate with actual purchase, it does indicate intent, interest and overall mindset. The results are shown in Figure 10.
Figure 10: Planned Smartphone Purchase In The Next 12 Months
CommentsOf those respondents that did not own a smartphone, 42% plan to purchase one in the next 12 months. Based on the 2013 survey results, 90% of respondents would own a smartphone by around February 2014 and 93% would own a smartphone by August 2014.
Planned Smartphone Purchase in the Next 12 Months
0%
10%
20%
30%
40%
26%
32%
26%
16%
PERC
ENTA
GE O
F RE
SPON
DENT
S
YES IN THE NEXT 6 MONTHS YES IN THE NEXT 12 MONTHS NO I DON’T PLAN TO BUY ONEIN THE NEXT 12 MONTHS
DON’T KNOW
21
AIMIA . The Australian Mobile Phone Lifestyle Index . October 2013 17
HANDSET BRAND OF RESPONDENTS
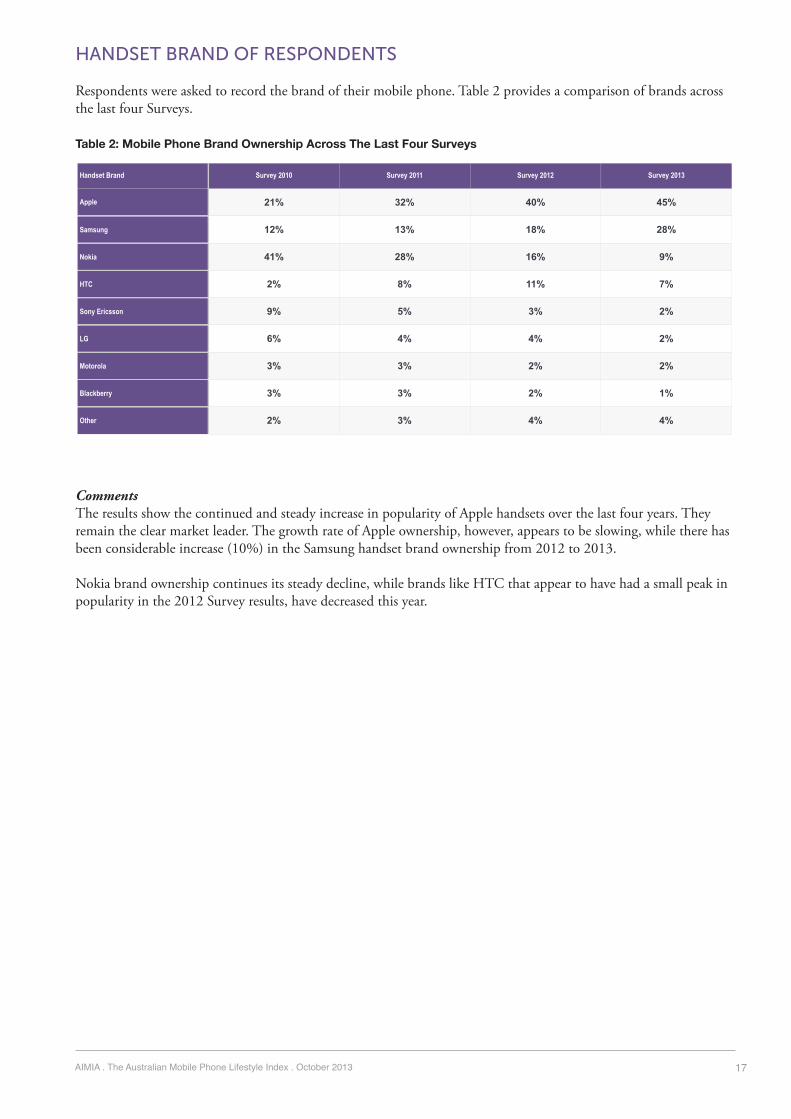
Respondents were asked to record the brand of their mobile phone. Table 2 provides a comparison of brands across the last four Surveys.
Table 2: Mobile Phone Brand Ownership Across The Last Four Surveys
CommentsThe results show the continued and steady increase in popularity of Apple handsets over the last four years. They remain the clear market leader. The growth rate of Apple ownership, however, appears to be slowing, while there has been considerable increase (10%) in the Samsung handset brand ownership from 2012 to 2013.
Nokia brand ownership continues its steady decline, while brands like HTC that appear to have had a small peak in popularity in the 2012 Survey results, have decreased this year.
Handset Brand Survey 2010 Survey 2011 Survey 2012 Survey 2013
Apple
Samsung
Nokia
HTC
Sony Ericsson
LG
Motorola
Blackberry
Other
21% 32% 40% 45%
12% 13% 18% 28%
41% 28% 16% 9%
2% 8% 11% 7%
9% 5% 3% 2%
6% 4% 4% 2%
3% 3% 2% 2%
3% 3% 2% 1%
2% 3% 4% 4%

AIMIA . The Australian Mobile Phone Lifestyle Index . October 2013 18
MOBILE PHONE CARRIER OF RESPONDENTS
As in previous years respondents were asked to record their telecommunications provider. The results for 2013 are presented in Figure 11.
Figure 11: Mobile Carrier Of Respondents
CommentsThe breakdown by mobile phone providers is broadly in line with Australian market share figures. In 2013 the Virgin Mobile respondents were again over-represented in the survey. As per the previous two years the decision was made to weight the Virgin Mobile data in line with the market share to facilitate easy interpretation of the results.
Mobile Phone Carrier of Respondents
0%
10%
20%
30%
40%
50%
10%
6%
16%
25%
44%
PERC
ENTA
GE O
F RE
SPON
DENT
S
TELSTRA OPTUS VODAFONE (3) VIRGIN MOBILE OTHER
24

AIMIA . The Australian Mobile Phone Lifestyle Index . October 2013 19
SATISFACTION WITH CARRIER SERVICES
Respondents were asked to indicate if they were satisfied with a range of different mobile phone service related issues. Figure 12 shows the level of satisfaction among the 2013 respondents, with each of the listed carrier services. This information was collected for the first time in Survey 2009 (Survey 5). Figure 13 shows those respondents that were satisfied8 with the service provided across the last four years.
Service satisfaction by carrier was also explored. The results for the 2013 analysis are shown in Figure 14. For comparative purposes, (while keeping in mind readability), the 2012 results are included separately in Figure 15.
Figure 12: Satisfaction With Services Provided By Carriers
Figure 13: Overall Satisfaction With Services Provided By Carriers Across the Surveys
Customer Satisfaction With Carrier Services
0%
10%
20%
30%
40%
50%
60%
70%
80%
90%
100%10%
3%7%12%
3%3%
23%25%22%
27%
25%36%28%38%
28%33%28%
30%
37%
36%34%
43%
31%21%
18%
24%20%11%
19%
10%
5%12%
16%
5%10%12%10%
6%4%6%10%
2%5%5%6%3%
PERC
ENTA
GE O
F RE
SPON
DENT
S
Very dissatisfied Somewhat dissatisfied Neither satisfied or dissatisfied Somewhat satisfiedVery satisfied Not applicable
OVERALL SATISFACTION
CUSTOMER SERVICE
NETWORK COVERAGE
RANGE OF PLANS &
PACKAGES AVAILABLE
VARIETY OFMOBILE
HANDSETS AVAILABLE
COST OF ACCESSING
A DATA SERVICE
CONTENT AND SERVICES AVAILABLE
VIA YOUR PHONE COMPANIES PORTAL
COST OF VOICE CALLS
25Overall Customer Satisfaction With Carrier Services Across Surveys
0%
10%
20%
30%
40%
50%
60%
70%
80%
90%
100%
51%
58%
50%
57%62%
72%
62%
81%
52%55%
51%
60%65%
71%
63%
78%
58%54%56%
67%69%67%61%
76%70%69%
52%
75%
82%78%78%
90%
PERC
ENTA
GE O
F RE
SPON
DENT
S
Survey 2010 Survey 2011 Survey 2012 Survey 2013
OVERALL SATISFACTION
CUSTOMER SERVICE
NETWORK COVERAGE
RANGE OF PLANS &
PACKAGES AVAILABLE
VARIETY OFMOBILE
HANDSETS AVAILABLE
COST OF ACCESSING
A DATA SERVICE
CONTENT AND SERVICES AVAILABLE
VIA YOUR PHONE COMPANY’S PORTAL
COST OF VOICE CALLS
27
8 Satisfaction was calculated by adding together those respondents that selected either “very satisfied” or “somewhat satisfied.”

AIMIA . The Australian Mobile Phone Lifestyle Index . October 2013 20
Figure 14: Satisfaction With Carrier Services By Individual Carrier
Figure 15: Satisfaction With Carrier Services By Individual Carrier – 2012 results
Comments“Overall satisfaction” with carrier services increased slightly in 2013 compared to the last few years.
The 2013 Survey results were generally consistent with the 2012 survey results. There are, however, some interesting trends to note over the last few years. The percentage of respondents satisfied with:
Overall Customer Satisfaction With Carrier Services By Carrier - 2013 Results
0%
10%
20%
30%
40%
50%
60%
70%
80%
90%
100%
38%
52%
40%
54%52%
36%
47%
62%65%65%
72%71%
82%
72%
78%
88%
57%54%
45%
68%
61%
85%
64%
82%
59%64%62%
71%67%69%71%
85%
PERC
ENTA
GE O
F RE
SPON
DENT
S
Optus Telstra Virgin Vodafone (3)
OVERALL SATISFACTION
CUSTOMER SERVICE
NETWORK COVERAGE
RANGE OF PLANS &
PACKAGES AVAILABLE
VARIETY OFMOBILE
HANDSETS AVAILABLE
COST OF ACCESSING
A DATA SERVICE
CONTENT AND SERVICES AVAILABLE
VIA YOUR PHONE COMPANY’S PORTAL
COST OF VOICE CALLS
28
Overall Customer Satisfaction With Carrier Services By Carrier - 2012 Results
0%
10%
20%
30%
40%
50%
60%
70%
80%
90%
100%
46%
56%52%
63%64%
37%
49%
64%70%72%74%
80%
87%
70%71%
85%
59%
49%49%
66%62%
87%
64%
80%
57%59%61%67%66%66%68%
80%
PERC
ENTA
GE O
F RE
SPON
DENT
S
Optus Telstra Virgin Vodafone (3)
OVERALL SATISFACTION
CUSTOMER SERVICE
NETWORK COVERAGE
RANGE OF PLANS &
PACKAGES AVAILABLE
VARIETY OFMOBILE
HANDSETS AVAILABLE
COST OF ACCESSING
A DATA SERVICE
CONTENT AND SERVICES AVAILABLE
VIA YOUR PHONE COMPANY’S PORTAL
COST OF VOICE CALLS
29

AIMIA . The Australian Mobile Phone Lifestyle Index . October 2013 21
• ‘Network coverage’, ‘cost of voice calls’ and ‘overall satisfaction’, is trending upwards, with small increases being recorded year-on-year since 2011. • ‘Range of plans and packages available,’ variety of mobile handsets available’ and ‘content and services available via their phone company’s portal’ is trending downwards, with small decreases being recorded year-on-year since 2011.
Satisfaction with services by carrier clearly shows that variation across the carriers was again substantial for many of the services. For example:
• Satisfaction with Virgin was higher for many services compared to other carriers. Of particular note was the level of satisfaction with their ‘cost of accessing a data service’ and ‘range of plans and packages available’, compared to the other carriers. • Satisfaction with Telstra’s network coverage was again a standout service for the carrier and also compared to the other providers. • The gap in satisfaction levels has decreased in 2013 for some services between Virgin, compared to Telstra and Optus. • Vodafone again experienced substantially lower levels of satisfaction compared to the other carriers for most of the listed services. These results are most likely a continued outcome of the network issues the carrier has experienced in the recent past.

AIMIA . The Australian Mobile Phone Lifestyle Index . October 2013 22
PAYMENT OF MOBILE PHONE BILLS
Respondents were asked to record how they paid for their phone bill. Figure 16 shows the results for the last four surveys.
Figure 16: Payment of Phone Bill Across The Last Four Surveys
CommentsOverall the results are broadly consistent across the last four years. However, some notable differences include a steady increase in monthly plans since 2011 (Survey 7). This increase has been offset by a decrease in the percentage of respondents on pre-paid payment options and monthly-capped plans.
Payment of Mobile Phone Bills Across Surveys
0%
10%
20%
30%
40%
50%
60%
70%
80%
90%
100%5%5%5%4%
30%34%38%38%
42%38%32%30%
4%4%3%4%
17%17%20%24%
PERC
ENTA
GE O
F RE
SPON
DENT
S
Prepaid Prepaid Capped Plan Monthly Plan Monthly Capped PlanMonthly Bill (no plan) Don't Know/Other
SURVEY 2010 SURVEY 2011 SURVEY 2012
31
SURVEY 2013
AIMIA . The Australian Mobile Phone Lifestyle Index . October 2013 23
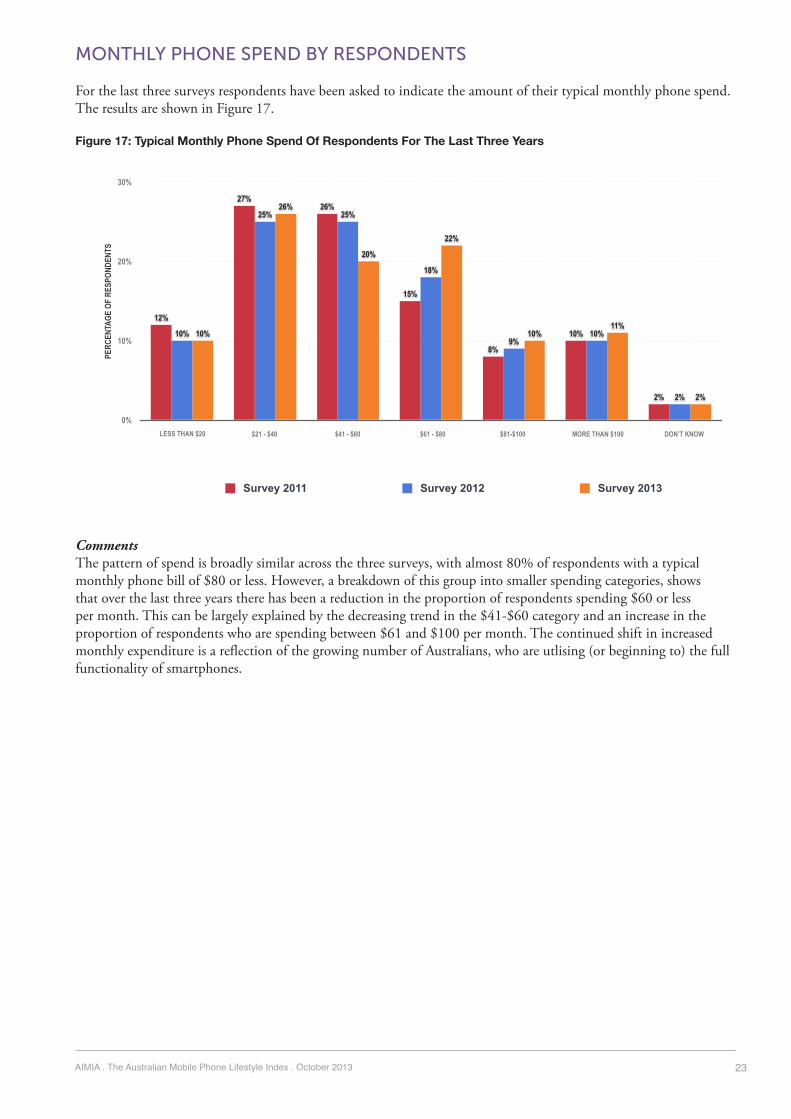
MONTHLY PHONE SPEND BY RESPONDENTS
For the last three surveys respondents have been asked to indicate the amount of their typical monthly phone spend. The results are shown in Figure 17.
Figure 17: Typical Monthly Phone Spend Of Respondents For The Last Three Years
CommentsThe pattern of spend is broadly similar across the three surveys, with almost 80% of respondents with a typical monthly phone bill of $80 or less. However, a breakdown of this group into smaller spending categories, shows that over the last three years there has been a reduction in the proportion of respondents spending $60 or less per month. This can be largely explained by the decreasing trend in the $41-$60 category and an increase in the proportion of respondents who are spending between $61 and $100 per month. The continued shift in increased monthly expenditure is a reflection of the growing number of Australians, who are utlising (or beginning to) the full functionality of smartphones.
Typical Monthly Phone Spend Across the Surveys
0%
10%
20%
30%
2%
11%10%
22%
20%
26%
10%
2%
10%9%
18%
25%25%
10%
2%
10%
8%
15%
26%27%
12%
PERC
ENTA
GE O
F RE
SPON
DENT
S
Survey 2011 Survey 2012 Survey 2013
33
LESS THAN $20 $21 - $40 $41 - $60 $61 - $80 $81-$100 MORE THAN $100 DON’T KNOW

AIMIA . The Australian Mobile Phone Lifestyle Index . October 2013 24
DATA INCLUSION IN PAYMENT OPTIONS
Respondents were asked if an allowance for mobile data is included in their monthly bill or pre-paid amount. Specific questions regarding data allowance have been asked since the 2009 Survey (Survey 5). The decision to include these questions was a direct response to the increasing maturity of the market in terms of the carrier communications around pricing plans and options, and equally as important, the increasing engagement of mobile phone owners with services on their mobile phones.
Their responses are shown in Figure 18.
Figure 18: Inclusion Of Data In Payment Options Across The Surveys
Comments84% of respondents from the 2013 Survey stated that they had a data allowance included in their payment option.
The percentage of respondents that stated they had a data allowance included in their payment options has been increasing quite rapidly over the last four years, with at least 9% growth every year since 2009.
The respondents who had data included in their payment option were then asked how much data was included. The complete responses are shown in Table 3. In Figure 19 some of the usage categories have been grouped together so that the results can be illustrated as a chart and any changes in use more easily interpreted.
Inclusion of Data Allowance in Payment Options Across the Surveys
0%
10%
20%
30%
40%
50%
60%
70%
80%
90%
100%7%10%12%18%22% 9%
15%
25%
36%
47%
84%75%
63%
47%
31%
PERC
ENTA
GE O
F RE
SPON
DENT
S
Yes No Don't Know
SURVEY 2009 SURVEY 2010 SURVEY 2011
35
SURVEY 2012 SURVEY 2013

AIMIA . The Australian Mobile Phone Lifestyle Index . October 2013 25
Table 3: Amount Of Data Included In Monthly Payment Or Prepaid Options Across The Surveys
Figure 19: Amount Of Data Included In Monthly Payment Or Prepaid Options Across The Surveys (collapsed categories)
CommentsThe amount of data that is included in payment options has been steadily increasing over the last five years. Of particular note is the large increase in the 1-3GB category from the 2010 to 2011 Survey (more than doubled from 14% to 32%). This was offset by the substantial decrease in the proportion of respondents with less than 500MB. Since 2011 the amount of growth in the 1GB plus categories has continued, but the year-on-year increases have been considerably smaller (around 6-7%).
The notable increase from 2010 to 2011 in the 1-3GB category was most like a result of the introduction by carriers of more competitive and appealing pricing packages that included increasing amounts of data. Smartphone popularity also started to take hold in the Australian market during 2011.
Amount of Data 2009 Survey 2010 Survey 2011 Survey 2012 Survey 2013 Survey
1-50MB
51-100MB
101-250MB
251-500MB
501-750MB
751MB-1GB
Between 1 and 3GB
Between 3 and 5GB
5GB or More
Don't Know
32% 24% 8% 5% 5%
6% 4% 5% 3% 3%
8% 9% 10% 8% 7%
6% 19% 11% 9% 9%
2% 3% 3% 2% 3%
7% 9% 8% 7% 4%
11% 14% 32% 39% 44%
1% 2% 4% 6% 9%
2% 2% 3% 3% 4%
24% 16% 16% 18% 13%
0%
10%
20%
30%
40%
50%
60%
70%
80%
90%
100%13%
18%16%16%24%
13%9%
7%3%
4%
44%39%
32%
14%
11%
7%9%
11%
12%
9%
9%9%
11%
19%6%
15%16%23%
37%46%
PERC
ENTA
GE O
F RE
SPON
DENT
S
1- 250 MB 251MB-500MB 501MB - 1GB 1-3GB 3GB or More Don’t know
SURVEY 2010SURVEY 2009 SURVEY 2012SURVEY 2011 SURVEY 2013
AIMIA . The Australian Mobile Phone Lifestyle Index . October 2013 26
SECTION 3: ABOUT HOW THE MOBILE PHONE IS USEDThis section provides insight into how mobile phone owners are using their mobile phones, including:
• Overall use of the mobile phone • Top 5 ways respondents use their mobile phones • Frequency of use of the mobile phone for specific purposes • Use of websites compared to the use of applications on the mobile phone • Expected use of the mobile phone in the next 12 months • Mobile phone use by geoTribe • Looking into the future.
OVERALL USE OF THE MOBILE PHONE
Respondents were asked how often they used their mobile phone for a range of listed purposes. Respondents have been asked this series of questions since 2005, although the listed uses have been modified throughout the years to account for changes in the market place. Figure 20 shows the overall proportion of 2013 respondents that used the phone for each specific purpose within the last 12 months.
Figure 21 shows comparisons where possible with previous years. This involved re-analysis of the 2011 data so that the categories were aligned with the categories used in the 2012 and 2013 Surveys. This meant that the multiple categories used in the 2011 Surveys around visiting websites, browsing, searching, banking and purchasing were collapsed into the three categories used since the 2012 Survey:
• “to visit websites and/browse or search the internet” • “for banking including transfers and bill payments” • “to buy things online.”
The changes to the 2012 Survey (and maintained in the 2013 Survey) were made to reflect the change in the market in terms of how people behave, interact and think about their mobile phone interactions. For example, mobile phone users may no longer differentiate between browsing and/or searching on their mobile phone.

AIMIA . The Australian Mobile Phone Lifestyle Index . October 2013 27
Figure 20: Uses Of The Mobile Phone For A Range Of Purposes In The Last 12 Months
Figure 21: Uses Of The Mobile Phone By Respondents In The Last 12 Months Across The Surveys
CommentsThere has been year-on-year growth in the proportion of respondents who used the phone ‘in the last 12 months’, for every listed purpose beyond texting and voice9. The growth rate between 2011 and 2013 were as follows:
• Send and receive emails – 20% • To get information – 21% • For entertainment – 20% • To visit websites, and/or search or browse the internet – 18% • For banking, including transfers and bill payments – 20% • To buy things online – 19%.
Since the 2012 Survey “To read or edit documents” was added to the list of phone uses. The growth from 2012 to 2013 was 15%.
Uses of the Mobile Phone For A Range of Purposes In the Last 12 Months
0%
10%
20%
30%
40%
50%
60%
70%
80%
90%
100%
38%44%
34%
14%18%13%21%
1%2%
62%55%
66%
86%82%87%79%
99%98%
PERC
ENTA
GE O
F RE
SPON
DENT
S
At least once in the last 12 months Not at all in the last 12 months
41
VOICE CALLS SMS TO SEND & RECEIVEEMAILS
TO GET INFORMATION
TO VISIT WEBSITES AND/OR
BROWSE OR SEARCH THE INTERNET
FOR BANKING INCLUDING TRANSFERS
& BILL PAYMENTS
FOR ENTERTAINMENT
TO BUY THINGS ONLINE
TO READ OR EDITDOCUMENTS ONLINE
Uses of the Mobile Phone By Respondents In The Last 12 Months Across the Surveys
0%
10%
20%
30%
40%
50%
60%
70%
80%
90%
100%
62%
55%
66%
86%82%
87%
79%
99%98%
47%42%
52%
76%72%
79%
69%
99%98%
36%
44%
68%62%
66%
59%
98%97%
PERC
ENTA
GE O
F RE
SPON
DENT
S
Survey 2011 Survey 2012 Survey 2013
42
SMS (TEXTING)VOICE CALLS TO SEND AND RECEIVE EMAILS
TO GET INFORMATION
FOR ENTERTAINMENTPURPOSES
TO VISIT WEBSITES AND/OR BROWSEOR SEARCH THE INTERNET
FOR BANKING INCLUDING TRANSFERS & BILL PAYMENTS
TO BUY THINGS ONLINE
TO READ OR EDITDOCUMENTS OR FILES
9 Almost all respondents are already using voice and texting so there is almost no room for growth.
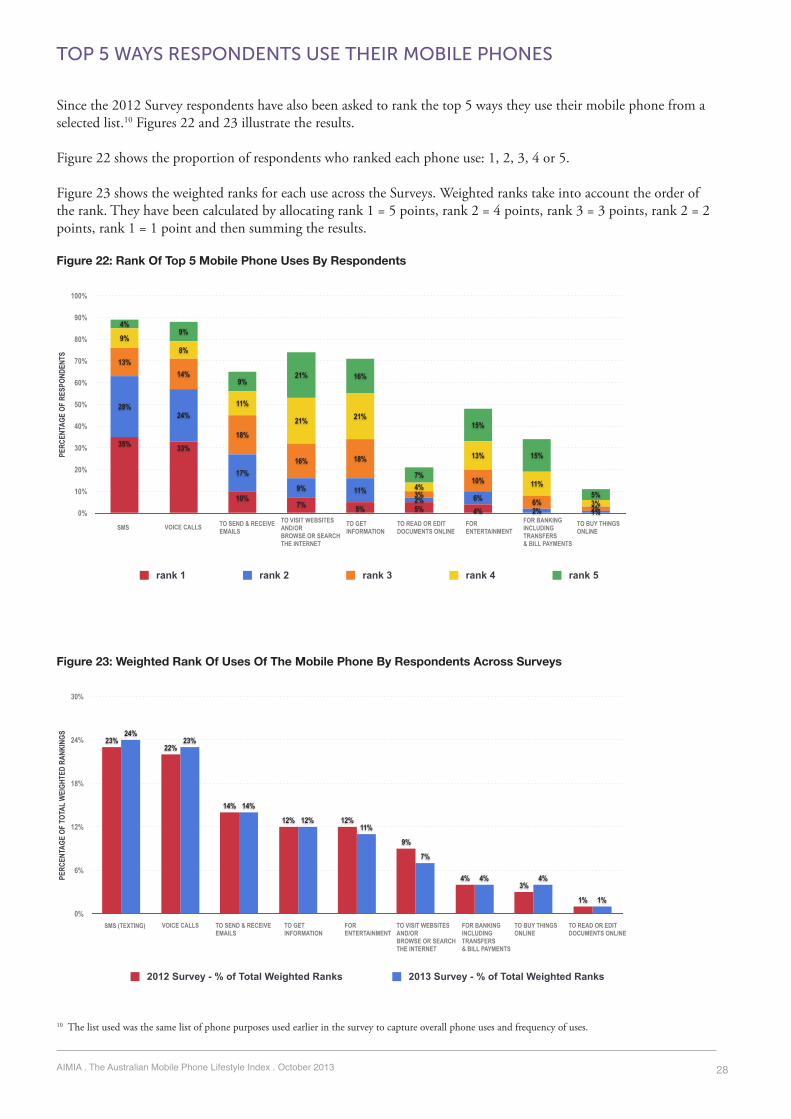
AIMIA . The Australian Mobile Phone Lifestyle Index . October 2013 28
TOP 5 WAYS RESPONDENTS USE THEIR MOBILE PHONES
Since the 2012 Survey respondents have also been asked to rank the top 5 ways they use their mobile phone from a selected list.10 Figures 22 and 23 illustrate the results.
Figure 22 shows the proportion of respondents who ranked each phone use: 1, 2, 3, 4 or 5.
Figure 23 shows the weighted ranks for each use across the Surveys. Weighted ranks take into account the order of the rank. They have been calculated by allocating rank 1 = 5 points, rank 2 = 4 points, rank 3 = 3 points, rank 2 = 2 points, rank 1 = 1 point and then summing the results.
Figure 22: Rank Of Top 5 Mobile Phone Uses By Respondents
Figure 23: Weighted Rank Of Uses Of The Mobile Phone By Respondents Across Surveys
Rank of Top 5 Uses of the Mobile Phone By Respondents
0%
10%
20%
30%
40%
50%
60%
70%
80%
90%
100%
5%
15%
15%
7%
16%21%9%
9%4%
3%
11%
13%
4%
21%21%
11%
8%9%
2%6%
10%
3%
18%16%
18%
14%13%
1%2%6%2%
11%9%
17%
24%28%
4%5%5%7%10%
33%35%
PERC
ENTA
GE O
F RE
SPON
DENT
S
rank 1 rank 2 rank 3 rank 4 rank 5
VOICE CALLSSMS TO SEND & RECEIVEEMAILS
TO GET INFORMATION
TO VISIT WEBSITES AND/OR BROWSE OR SEARCH THE INTERNET
FOR BANKING INCLUDING TRANSFERS & BILL PAYMENTS
43
FOR ENTERTAINMENT
TO BUY THINGS ONLINE
TO READ OR EDITDOCUMENTS ONLINE
Overall Rank of Top 5 Mobile Phone Uses By Respondents Across Surveys
0%
6%
12%
18%
24%
30%
1%
4%4%
7%
11%12%
14%
23%24%
1%
3%4%
9%
12%12%
14%
22%23%
PERC
ENTA
GE O
F TO
TAL
WEI
GHTE
D RA
NKIN
GS
2012 Survey - % of Total Weighted Ranks 2013 Survey - % of Total Weighted Ranks
SMS (TEXTING) VOICE CALLS TO SEND & RECEIVEEMAILS
TO GET INFORMATION
TO VISIT WEBSITES AND/OR BROWSE OR SEARCH THE INTERNET
FOR BANKING INCLUDING TRANSFERS & BILL PAYMENTS
1
FOR ENTERTAINMENT
TO BUY THINGS ONLINE
TO READ OR EDITDOCUMENTS ONLINE
10 The list used was the same list of phone purposes used earlier in the survey to capture overall phone uses and frequency of uses.

AIMIA . The Australian Mobile Phone Lifestyle Index . October 2013 29
Comments Almost 70% of the !rst rankings chosen by respondents were for SMS or Voice calls. Voice and SMS also dominated the second choice of respondents, comprising just over 50% of the second rankings. $e third, fourth and !fth rankings were distributed across a greater number of the mobile phone uses.
$e 2013 results of the weighted rankings are consistent with the results from last year. Voice and SMS are clearly the most highly ranked uses, which is not surprising given they are truly entrenched uses of the mobile phone. $ese two uses of the phone each accounted for slightly more than 20% of total weighted rankings.
Using the mobile to ‘send and receive emails’, ‘to get information and ‘for entertainment,’ and to a lesser extent “to visit websites, and/or browse or search”, make up the second tier of mobile phone use. $ese uses accounted for between 7% and 14% of the total weighted rankings.
Finally, the results of the weighted rankings con!rm that using the mobile phone for ‘banking, including transfers’, ‘buying things’ and ‘reading or editing documents’ are emerging uses of the mobile phone (accounting for approximately 1-4% of the total weighted rankings). $e lower percentage of total weighted rankings accounted for by banking may, however, also be partly explained by the fact that it is an activity that is not often carried out daily and therefore was less likely to be ranked above other uses of the phone by respondents.

AIMIA . The Australian Mobile Phone Lifestyle Index . October 2013 30
FREQUENCY OF USE OF THE MOBILE PHONE FOR SPECIFIC PURPOSES
Respondents were asked to identify how often they use the mobile phone for a specific purpose. A detailed breakdown of the frequency of use for each specific purpose is presented in Table 4.
Figure 24 shows the percentage of respondents that are high-level users of the mobile phone for each of the specific purposes across the last three years. High-level users are defined as those that use the mobile phone for that specific purpose at least once a day.11 Figure 25 shows the percentage of medium-level uses for each of the listed phone purposes. Medium-level users were defined as those that used the mobile phone for the given purpose “at least once a week” plus “at least once a month”.
Table 4: Frequency Of Mobile Phone Uses (As A Percentage Of Respondents)
Figure 24: High-Level Users Of The Mobile Phone Across The Surveys (As A percentage Of Those That Use The Phone For That Given Purpose)
Mobile Phone Use At Least 5 Times A Day At Least Once A Day At Least Once A Week At Least Once A Month At Least Once Every Few Months At Least Once A Year Not At All
Voice Calls
SMS
To send and receive email
To Get Information
For Entertainment Purposes
To Visit Websites and/or Browse or Search the Internet
For Banking Including Transfers & Bill Payments
To Buy Things Online
To Read or Edit Documents Online
26% 45% 23% 3% 1% 0% 2%
45% 38% 12% 2% 2% 0% 1%
38% 24% 8% 5% 2% 1% 21%
39% 30% 10% 4% 3% 1% 13%
26% 28% 16% 6% 4% 1% 18%
36% 30% 12% 5% 2% 1% 14%
5% 18% 29% 9% 3% 2% 34%
3% 4% 14% 18% 12% 5% 45%
7% 12% 19% 12% 10% 3% 38%
0%
10%
20%
30%
40%
50%
60%
70%
80%
90%
30%
13%
34%
76%
67%
79%79%84%
72%
30%
15%
32%
68%
62%
69%72%
80%
72%
12%
27%
65%61%
65%67%
80%
71%
PERC
ENTA
GE O
F RE
SPON
DENT
S
Survey 2011 Survey 2012 Survey 2013
SMS (TEXTING)VOICE CALLS TO SEND AND RECEIVE EMAILS
TO GET INFORMATION
FOR ENTERTAINMENTPURPOSES
TO VISIT WEBSITES AND/OR BROWSEOR SEARCH THE INTERNET
FOR BANKING INCLUDING TRANSFERS & BILL PAYMENTS
TO BUY THINGS ONLINE
TO READ OR EDITDOCUMENTS OR FILES
11 In the last 3 years this means adding together the category “at least 5 times a day” with “at least once a day.”

AIMIA . The Australian Mobile Phone Lifestyle Index . October 2013 31
Figure 25: Medium-Level Users Of The Mobile Phone Across The Surveys (As A Percentage Of Those That Use The Phone For That Given Purpose)
CommentsThere has been steady growth in the percentage of high-level users across many of the listed phone uses of the mobile phone since 2011. In summary, the growth rates between 2011 and 2013 were as follows.
• SMS (texting) – 4% • Send and receive emails – 12% • To get information – 14% • For entertainment – 6% • To visit websites, and/or search or browse the internet - 11% • For banking, including transfers and bill payments – 7%.
The use of the mobile phone ‘to read or edit documents or files’ has only been included in the Survey for the last 2 years and the percentage of high level users for both the 2012 and 2013 Surveys was the same (30%).
The increase in the proportion of high-level users for many of the listed established services like emailing, getting info, entertainment and visiting websites, searching and browsing the Internet, has been offset by a decrease in the percentage of medium-level users. The shift from medium-level use to high-level use is to be expected, as people become increasingly comfortable with using their mobile phones for these purposes.
The only increase in medium-level users was for the use of the mobile phone for ‘buying things online’, which increased from 47% in 2011 to 57% in 2013. This is not surprising, since ‘buying things online’ may be currently perceived as more of a “medium” level activity, carried out at least once a week, but not daily. This may change as ‘buying things online’ becomes more prevalent and Australians gain confidence in using their phones for daily purchases (e.g. groceries) and also as businesses provide greater opportunity to do so.
Also of interest is the frequency of use of the mobile phone for ‘banking, including transfers and bill payments’. Currently, almost 60% of respondents are medium-level users of their mobile phones for banking and this has remained consistent over the last few years. However, there is clearly a year-on-year increase in the proportion of high-level users of ‘banking, including transfers and bill payments’ on the mobile phone, which suggests that there is a group of respondents that are becoming increasingly more comfortable with the use of the mobile phone for day-to-day banking activities like bill payments and transfers.
The role of the mobile phone in the purchase decision was explored in more detail as part of this year’s special topic - ‘Mobile Retail’. The results are detailed later in this report.
Medium Level Users of the Mobile Phone Across the Surveys (as a percentage of those that use the phone for that given purpose)
0%
10%
20%
30%
40%
50%
60%
70%
50%
57%58%
20%
27%
17%16%14%
26%
49%
55%59%
26%
32%
24%22%
18%
26%
47%
59%
27%31%
28%26%
18%
27%
PERC
ENTA
GE O
F RE
SPON
DENT
S
Survey 2011 Survey 2012 Survey 2013
47
SMS (TEXTING)VOICE CALLS TO SEND AND RECEIVE EMAILS
TO GET INFORMATION
FOR ENTERTAINMENTPURPOSES
TO VISIT WEBSITES AND/OR BROWSEOR SEARCH THE INTERNET
FOR BANKING INCLUDING TRANSFERS & BILL PAYMENTS
TO BUY THINGS ONLINE
TO READ OR EDITDOCUMENTS OR FILES

AIMIA . The Australian Mobile Phone Lifestyle Index . October 2013 32
USE OF WEBSITES VERSUS APPLICATIONS
A continued topical issue in the media and industry has been around the use and popularity of websites versus applications, and the resulting implications for businesses (i.e., invest in an application, website or both). In response, since 2012 the AMPLI Survey has asked respondents whether they use more websites or applications on their mobile phones. The responses are captured in Figures 26.
Figure 26: Use Of Websites Versus Applications By Respondents On Their Mobile Phone (As A Percentage Of All Respondents)
CommentsThe pattern across both years is similar. However, there has been an increase in the overall proportion of respondents using websites and/or applications on their mobile phone from 77% in 2012 to 87% in 2013. Also of interest is the following.
• There was a decrease in the percentage of respondents that used ‘only websites on their mobile phones from 8% in 2012 to 4% in 2013. Only 4% of 2012 and 2013 respondents also stated they used ‘only apps’ on their phones. • Approximately the same percentage of respondents stated they used ‘mostly apps and some websites’ (25%) and ‘mostly websites and some apps’ (26%).
Those that used websites on the mobile phone were then asked how they accessed the websites on the mobile phone. The results for the 2013 Survey are shown in Figure 27 and the comparative results with last year are shown in Figure 28.
Use of Websites Versus Applications (Apps) on the Mobile Phone Across the Surveys
0%
10%
20%
30%
40%
13%
4%
26%
29%
25%
4%
23%
8%
20%
24%22%
4%
PERC
ENTA
GE O
F RE
SPON
DENT
S
Survey 2012 Survey 2013
50
APPS ONLY MOSTLY APPS & SOME WEBSITES
ABOUT THE SAME USE OF WEBSITES & APPS
MOSTLY WEBSITES &SOME APPS
WEBSITES ONLY DON’T USE WEBSITES OR APPS

AIMIA . The Australian Mobile Phone Lifestyle Index . October 2013 33
Figure 27: How Websites Are Accessed On The Mobile Phone
Figure 28: How Websites Are Accessed On The Mobile Phones Across Surveys12
Comments‘Clicking on a site found using a search engine’, ‘clicking on the link in a text message’ or ‘typing a site address - URL’ still remain very popular means of accessing websites on the mobile phone. There has, however, been a decrease in the percentage of respondents typing in the site address (URL) from 75% in 2012 to 67% in 2013. This is most likely a reflection of the increased confidence and activity of mobile phone users in searching the web and in clicking on links on their phones. The continued decrease in accessing websites via the carrier’s content menu is further support of this growing confidence.
How Websites Are Accessed on the Mobile Phone
CLICKED ON A SITE I FOUND USING A SEARCH ENGINE
TYPED IN THE SITE ADDRESS (URL)
CLICKED ON THE LINK IN A TEXT MESSAGE
USED A QR CODE
CLICKED ON AN ADVERTISEMENT (E.G., IN AN APPLICATION)
CLICKED ON THE LINK IN MY PHONE COMPANY'S CONTENT MENU ON MY PHONE
TAPPED A NFC (NEAR FIELD COMMUNICATION) TAG
OTHER
DON'T KNOW
0% 10% 20% 30% 40% 50% 60% 70% 80%
1%
5%
3%
13%
13%
17%
46%
67%
70%
PERCENTAGE OF RESPONDENTS
51How Websites Are Accessed on the Mobile Phone Across Surveys
0%
10%
20%
30%
40%
50%
60%
70%
80%
90%
1%5%3%
13%13%17%
46%
67%70%
1%5%
1%
16%16%19%
48%
75%
68%
3%4%
18%14%
9%
37%
73%
52%
PERC
ENTA
GE O
F RE
SPON
DENT
S
Survey 2011 Survey 2012 Survey 2013
52
TYPED IN THE SITE ADDRESS (URL)
CLICKED ON A SITEI FOUND USING A SEARCH ENGINE
CLICKED ON THE LINK IN A TEXT MESSAGE
USED A QR CODE
CLICKED ON AN AD(E.G., IN AN APP)
CLICKED ON THE LINK IN MY PHONE COMPANY'S CONTENT MENU
TAPPED A NFC CODE
OTHER DON’T KNOW
12 In 2011 respondents were also asked how they accessed websites on their mobile phone.

AIMIA . The Australian Mobile Phone Lifestyle Index . October 2013 34
EXPECTED USE OF THE MOBILE PHONE IN THE NEXT 12 MONTHS
Figure 29 provides a picture of how the respondents intend to use their mobile phones in the next 12 months relative to their current use. This question was first asked of respondents in 2012. Although actual and intended use is unlikely to directly correlate it provides an indication of the interests and intent of respondents.
Figure 29: Expected Future Use Of the Mobile Phone In The Next 12 Months
CommentsSome interesting insights follow.
• Many respondents plan to increase their current uses of the mobile phone.
o Approximately 25% of the respondents currently using their mobile phone for emailing, getting information, and visiting websites/browsing/searching intend to increase their use of the phone for these purposes in the next 12 months. o Approximately 20% of the respondents currently using their mobile phone for voice calls, SMS, entertainment, and banking intend to increase their use of the phone for these purposes in the next 12 months. o Approximately 16-17% of the respondents currently using their mobile phone for buying things online and reading or editing documents intend to increase their use of the phone for these purposes in the next 12 months. This suggests a slower increase in their frequency of use compared to some of the other listed uses of the phone. This may be partly explained by the emerging nature of these phone uses, which means that these activities may not currently be carried out daily on their mobile phones. As previously explained this may change as Australians gain confidence in using their phones to make their daily purchases (e.g. groceries) and also as businesses provide and make consumers aware of the mechanisms to do so.
• Only a very small percentage of respondents (1-5%) plan to decrease their use of the mobile phone for any given purpose.
• Only a small percentage of respondents (2-4%) plan to start using the phone for new uses for which they do not currently use their phones. This suggests that the continued expansion of service uptake, regardless of how well entrenched uses are (e.g., email compared to buying online), will occur more slowly in the coming year.
Expected Future Use of the Mobile Phone In the Next 12 Months
0%
10%
20%
30%
40%
50%
60%
70%
80%
90%
100%
21%25%21%
9%13%
8%12%
1%
3%3%
3%
3%2%
3%4%
5%5%
2%
2%3%
1%
2%
2%3%
56%50%53%
60%62%
61%56%
78%75%
16%17%20%26%
19%27%25%
19%21%
PERC
ENTA
GE O
F RE
SPON
DENT
S
Increase in useStay the sameDecrease in useI currently do not use my phone for this purpose, but I plan to start using it for this purpose in the next 12 monthsI currently do not use my phone for this purpose and do not plan to use it this way in the next 12 months
VOICE CALLS SMS (TEXTING) TO SEND & RECEIVE EMAILS
TO GET INFORMATION
FOR ENTERTAINMENTPURPOSES
TO VISIT WEBSITES &/OR BROWSE OR SEARCH THE INTERNET
TO BUY THINGSONLINE
FOR BANKING INCLUDING TRANSFERS & BILL PAYMENT
TO READ OR EDITDOCUMENTS ORFILES
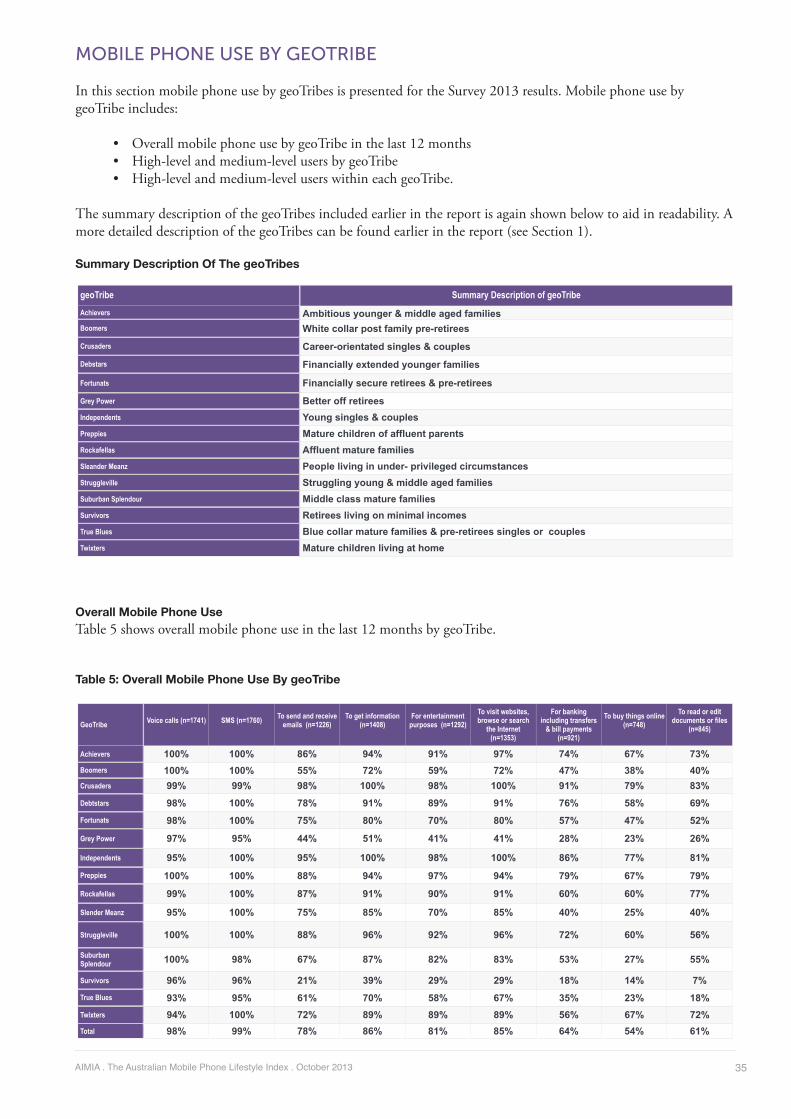
AIMIA . The Australian Mobile Phone Lifestyle Index . October 2013 35
MOBILE PHONE USE BY GEOTRIBE
In this section mobile phone use by geoTribes is presented for the Survey 2013 results. Mobile phone use by geoTribe includes:
• Overall mobile phone use by geoTribe in the last 12 months • High-level and medium-level users by geoTribe • High-level and medium-level users within each geoTribe.
The summary description of the geoTribes included earlier in the report is again shown below to aid in readability. A more detailed description of the geoTribes can be found earlier in the report (see Section 1).
Summary Description Of The geoTribes
Overall Mobile Phone Use Table 5 shows overall mobile phone use in the last 12 months by geoTribe.
Table 5: Overall Mobile Phone Use By geoTribe
geoTribe Summary Description of geoTribe Achievers
Boomers
Crusaders
Debstars
Fortunats
Grey Power
Independents
Preppies
Rockafellas
Sleander Meanz
Struggleville
Suburban Splendour
Survivors
True Blues
Twixters
Ambitious younger & middle aged familiesWhite collar post family pre-retirees
Career-orientated singles & couples
Financially extended younger families
Financially secure retirees & pre-retirees
Better off retireesYoung singles & couplesMature children of affluent parentsAffluent mature familiesPeople living in under- privileged circumstancesStruggling young & middle aged familiesMiddle class mature familiesRetirees living on minimal incomesBlue collar mature families & pre-retirees singles or couplesMature children living at home
GeoTribe Voice calls (n=1741) SMS (n=1760) To send and receive emails (n=1226)
To get information (n=1408)
For entertainment purposes (n=1292)
To visit websites, browse or search
the Internet (n=1353)
For banking including transfers
& bill payments (n=921)
To buy things online (n=748)
To read or edit documents or files
(n=845)
Achievers
Boomers
Crusaders
Debtstars
Fortunats
Grey Power
Independents
Preppies
Rockafellas
Slender Meanz
Struggleville
Suburban Splendour
Survivors
True Blues
Twixters
Total
100% 100% 86% 94% 91% 97% 74% 67% 73%100% 100% 55% 72% 59% 72% 47% 38% 40%99% 99% 98% 100% 98% 100% 91% 79% 83%
98% 100% 78% 91% 89% 91% 76% 58% 69%
98% 100% 75% 80% 70% 80% 57% 47% 52%
97% 95% 44% 51% 41% 41% 28% 23% 26%
95% 100% 95% 100% 98% 100% 86% 77% 81%
100% 100% 88% 94% 97% 94% 79% 67% 79%
99% 100% 87% 91% 90% 91% 60% 60% 77%
95% 100% 75% 85% 70% 85% 40% 25% 40%
100% 100% 88% 96% 92% 96% 72% 60% 56%
100% 98% 67% 87% 82% 83% 53% 27% 55%
96% 96% 21% 39% 29% 29% 18% 14% 7%
93% 95% 61% 70% 58% 67% 35% 23% 18%94% 100% 72% 89% 89% 89% 56% 67% 72%98% 99% 78% 86% 81% 85% 64% 54% 61%

AIMIA . The Australian Mobile Phone Lifestyle Index . October 2013 36
CommentsThe findings show:
• All geoTribes were represented across every listed phone use in the last 12 months. This means that respondents from a cross section of lifestyles and stage of life are using the mobile phone for the listed purposes, although to varying degrees as can be expected.
• For Crusaders the mobile phone is clearly an integral part of their day-to-day lives. Between 98 and 100% of Crusaders have used the mobile phone for most of the listed purposes during the last 12 months. The only exceptions were for the emerging uses of the phone – ‘banking,’ ‘buying things online’ and ‘reading/editing documents online’, which had only slightly lower use among the Crusaders (91%, 79% and 83% respectively).
• The next highest percentage of users was usually the Independents, Preppies or Achievers.
High-Level And Medium-Level Users By geoTribe
$is section shows a breakdown of the high-level and medium-level users of the mobile phone for the speci!c purposes by geoTribe. It addresses the questions of “what is the breakdown of high-level users by geoTribe?” and “what is the breakdown of medium-level users by geoTribe?’
$e !gure for “high-level users” of each purpose was calculated by summing together those that stated they used the mobile phone for the given purpose “at least 5 times a day” and those that used it “at least once a day”. $e !gure for “medium-level users” was calculated by summing together those that stated they used the mobile phone for the given purpose “at least once a week” and those that used it “at least once a month.”
Table 6 shows the high-level users by geoTribe. Table 7 shows the medium-level users by geoTribe. $e breakdown of high-level users for each listed phone purposes are then separately illustrated in !gures 30 to 38.
Please refer to the summary description of the geoTribes for context (earlier in this section).
Table 6: Breakdown Of High-Level Users By geoTribe (For Each Mobile Phone Use)
GeoTribe Voice calls SMS To send and receive emails
To get information For entertainment purposes
To visit websites, browse or search
the Internet
For banking including transfers
& bill payments To buy things online To read or edit
documents or files
Achievers
Boomers
Crusaders
Debtstars
Fortunats
Grey Power
Independents
Preppies
Rockafellas
Slender Meanz
Struggleville
Suburban Splendour
Survivors
True Blues
Twixters
Total
10% 12% 13% 13% 12% 13% 9% 7% 11%5% 5% 3% 5% 2% 3% 4% 5% 3%20% 23% 29% 28% 30% 29% 34% 26% 25%5% 6% 6% 5% 6% 6% 7% 5% 5%8% 7% 8% 7% 6% 7% 6% 11% 9%
4% 3% 2% 2% 1% 1% 1% 0% 1%
6% 6% 6% 7% 7% 7% 11% 5% 9%
3% 4% 5% 5% 6% 6% 4% 9% 5%
11% 11% 14% 11% 11% 11% 7% 5% 14%
2% 2% 2% 2% 2% 2% 0% 0% 1%
3% 3% 3% 3% 3% 3% 7% 12% 3%
9% 8% 5% 6% 8% 6% 5% 4% 8%
3% 2% 0% 1% 1% 1% 1% 0% 1%
7% 6% 4% 3% 2% 3% 1% 4% 2%
2% 2% 2% 2% 3% 3% 4% 7% 2%
100% 100% 100% 100% 100% 100% 100% 100% 100%

AIMIA . The Australian Mobile Phone Lifestyle Index . October 2013 37
Table 7: Breakdown Of Medium-Level Users By geoTribe (For Each Mobile Phone Use)
Figure 30: Who Makes Up the High Level Users Of The Mobile Phone For Voice
ACHIEVERS
BOOMERS
CRUSADERS
DEBTSTARS
FORTUNATS
GREY POWER
INDEPENDENTS
PREPPIES
ROCKAFELLAS
SLENDER MEANZ
STRUGGLEVILLE
SUBURBAN SPLENDOUR
SURVIVORS
TRUE BLUES
TWIXTERS
0% 10% 20% 30%
2%
7%
3%
9%
3%
2%
11%
3%
6%
4%
8%
5%
20%
5%
10%
PERCENTAGE OF RESPONDENTS
GeoTribe Voice calls SMS To send and receive emails
To get information For entertainment purposes
To visit websites, browse or search
the Internet
For banking including transfers
& bill payments To buy things online To read or edit
documents or files
Achievers
Boomers
Crusaders
Debtstars
Fortunats
Grey Power
Independents
Preppies
Rockafellas
Slender Meanz
Struggleville
Suburban Splendour
Survivors
True Blues
Twixters
Total
12% 7% 10% 10% 11% 11% 14% 16% 14%
9% 14% 9% 8% 8% 11% 5% 4% 4%
22% 10% 18% 7% 16% 11% 28% 33% 33%
7% 5% 7% 11% 7% 8% 7% 7% 5%
5% 8% 5% 7% 8% 7% 6% 5% 7%
7% 15% 3% 5% 4% 4% 2% 0% 2%
3% 2% 8% 3% 5% 4% 5% 9% 5%
6% 5% 4% 3% 4% 1% 6% 4% 5%
6% 6% 1% 7% 13% 8% 11% 13% 12%
3% 2% 5% 4% 2% 6% 2% 1% 3%
3% 2% 5% 3% 4% 4% 2% 3% 2%
4% 7% 10% 13% 7% 12% 6% 2% 4%
3% 6% 3% 4% 2% 1% 1% 1% 0%
7% 10% 10% 14% 8% 13% 5% 2% 2%
2% 2% 4% 1% 2% 0% 1% 2% 3%
100% 100% 100% 100% 100% 100% 100% 100% 100%

AIMIA . The Australian Mobile Phone Lifestyle Index . October 2013 38
Figure 31: Who Makes Up the High Level Users Of The Mobile Phone For SMS (Texting)
Figure 32: Who Makes Up The High Level Users Of The Mobile Phone For Sending And Receiving Emails
Who Makes Up the High Level Users of the Mobile Phone For SMS?
ACHIEVERS
BOOMERS
CRUSADERS
DEBTSTARS
FORTUNATS
GREY POWER
INDEPENDENTS
PREPPIES
ROCKAFELLAS
SLENDER MEANZ
STRUGGLEVILLE
SUBURBAN SPLENDOUR
SURVIVORS
TRUE BLUES
TWIXTERS
0% 10% 20% 30%
2%
6%
2%
8%
3%
2%
11%
4%
6%
3%
7%
6%
23%
5%
12%
PERCENTAGE OF RESPONDENTS
59
Who Makes Up the High Level Users of The Mobile Phone For Email?
ACHIEVERS
BOOMERS
CRUSADERS
DEBTSTARS
FORTUNATS
GREY POWER
INDEPENDENTS
PREPPIES
ROCKAFELLAS
SLENDER MEANZ
STRUGGLEVILLE
SUBURBAN SPLENDOUR
SURVIVORS
TRUE BLUES
TWIXTERS
0% 10% 20% 30% 40%
2%
4%
0%
5%
3%
2%
14%
5%
6%
2%
8%
6%
29%
3%
13%
PERCENTAGE OF RESPONDENTS
60

AIMIA . The Australian Mobile Phone Lifestyle Index . October 2013 39
Figure 33: Who Makes Up The High Level Users Of The Mobile Phone For Getting Information
Figure 34: Who Makes Up The High Level Users Of The Mobile Phone For Entertainment
Who Makes Up the High Level Users of the Mobile Phone To “Get Information”?
ACHIEVERS
BOOMERS
CRUSADERS
DEBTSTARS
FORTUNATS
GREY POWER
INDEPENDENTS
PREPPIES
ROCKAFELLAS
SLENDER MEANZ
STRUGGLEVILLE
SUBURBAN SPLENDOUR
SURVIVORS
TRUE BLUES
TWIXTERS
0% 10% 20% 30% 40%
2%
3%
1%
6%
3%
2%
11%
5%
7%
2%
7%
5%
28%
5%
13%
PERCENTAGE OF RESPONDENTS
61
Who Makes Up the High Level Users of the Mobile Phone For Entertainment?
ACHIEVERS
BOOMERS
CRUSADERS
DEBTSTARS
FORTUNATS
GREY POWER
INDEPENDENTS
PREPPIES
ROCKAFELLAS
SLENDER MEANZ
STRUGGLEVILLE
SUBURBAN SPLENDOUR
SURVIVORS
TRUE BLUES
TWIXTERS
0% 10% 20% 30% 40%
3%
2%
1%
8%
3%
2%
11%
6%
7%
1%
6%
6%
30%
2%
12%
PERCENTAGE OF RESPONDENTS
62
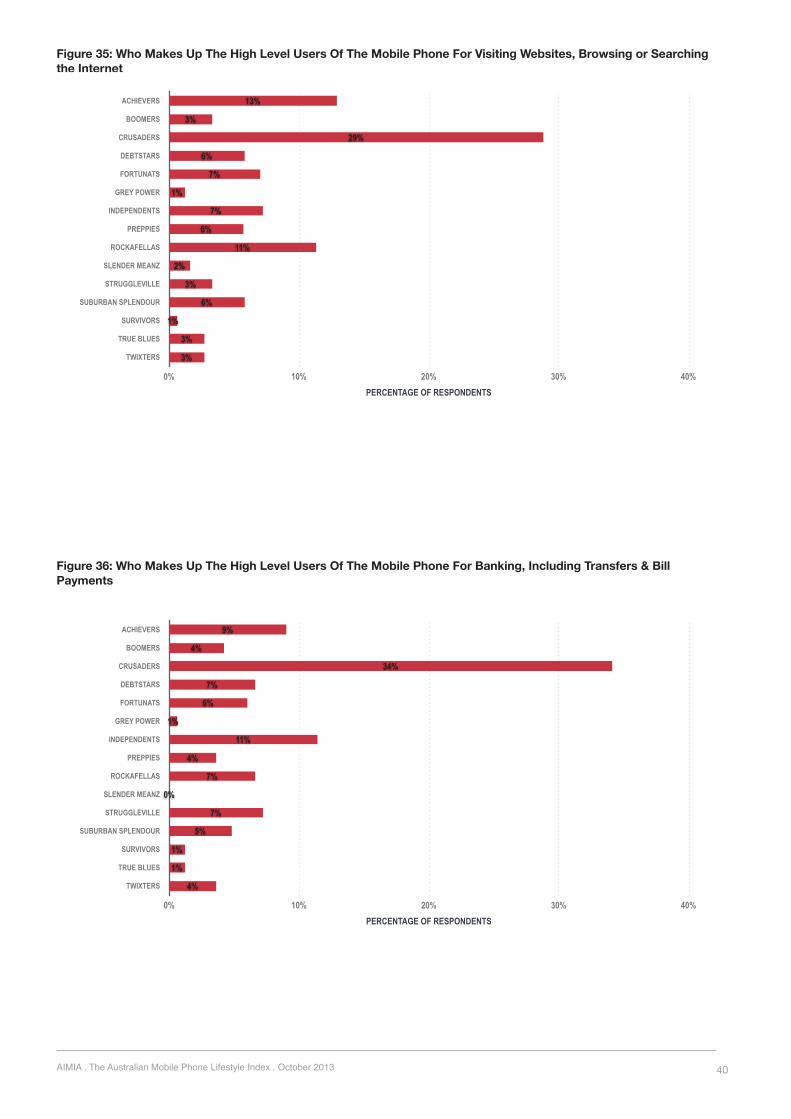
AIMIA . The Australian Mobile Phone Lifestyle Index . October 2013 40
Figure 35: Who Makes Up The High Level Users Of The Mobile Phone For Visiting Websites, Browsing or Searching the Internet
Figure 36: Who Makes Up The High Level Users Of The Mobile Phone For Banking, Including Transfers & Bill Payments
Who Makes Up the High Level Users of the Mobile Phone For Visiting Websites, Browsing the Internet and Search?
ACHIEVERS
BOOMERS
CRUSADERS
DEBTSTARS
FORTUNATS
GREY POWER
INDEPENDENTS
PREPPIES
ROCKAFELLAS
SLENDER MEANZ
STRUGGLEVILLE
SUBURBAN SPLENDOUR
SURVIVORS
TRUE BLUES
TWIXTERS
0% 10% 20% 30% 40%
3%
3%
1%
6%
3%
2%
11%
6%
7%
1%
7%
6%
29%
3%
13%
PERCENTAGE OF RESPONDENTS
63
Who Makes Up the High Level Users of the Mobile Phone For Banking, Including Transfers & Bill Payments
ACHIEVERS
BOOMERS
CRUSADERS
DEBTSTARS
FORTUNATS
GREY POWER
INDEPENDENTS
PREPPIES
ROCKAFELLAS
SLENDER MEANZ
STRUGGLEVILLE
SUBURBAN SPLENDOUR
SURVIVORS
TRUE BLUES
TWIXTERS
0% 10% 20% 30% 40%
4%
1%
1%
5%
7%
0%
7%
4%
11%
1%
6%
7%
34%
4%
9%
PERCENTAGE OF RESPONDENTS
64

AIMIA . The Australian Mobile Phone Lifestyle Index . October 2013 41
Figure 37: Who Makes Up The High Level Users Of The Mobile Phone For Buying Things Online
Figure 38: Who Makes Up the High Level Users Of The Mobile Phone For Reading Or Editing Documents Or Files
Who Makes Up the High Level Users of the Mobile Phone To Buy Things Online?ACHIEVERS
BOOMERS
CRUSADERS
DEBTSTARS
FORTUNATS
GREY POWER
INDEPENDENTS
PREPPIES
ROCKAFELLAS
SLENDER MEANZ
STRUGGLEVILLE
SUBURBAN SPLENDOUR
SURVIVORS
TRUE BLUES
TWIXTERS
0% 10% 20% 30% 40%
7%
4%
0%
4%
12%
0%
5%
9%
5%
0%
11%
5%
26%
5%
7%
PERCENTAGE OF RESPONDENTS
65
Who Makes Up the High Level Users of the Mobile Phone To Read or Edit Documents Online?ACHIEVERS
BOOMERS
CRUSADERS
DEBTSTARS
FORTUNATS
GREY POWER
INDEPENDENTS
PREPPIES
ROCKAFELLAS
SLENDER MEANZ
STRUGGLEVILLE
SUBURBAN SPLENDOUR
SURVIVORS
TRUE BLUES
TWIXTERS
0% 10% 20% 30% 40%
2%
2%
1%
8%
3%
1%
14%
5%
9%
1%
9%
5%
25%
3%
11%
PERCENTAGE OF RESPONDENTS
66
AIMIA . The Australian Mobile Phone Lifestyle Index . October 2013 42
CommentsHigh-level Users By Geo-TribeWhile there was some minor variation in the percentage of high users for each tribe across the various typical phone uses, the profile shape remains reasonably consistent. For example, the largest high-level users of phone, SMS, and email were consistently the Crusaders (stand out), with the Achievers and Rockafellas forming the members of the second highest users.
Grey Power, Slender Meanz and Struggeville represented three tribes that typically had a low volume of high users. This is not surprising, as these groups comprise individuals who have less disposable income. However, the use of the phone by the Struggeville geoTribes differed markedly from the Slender Meanz and Grey Power tribes in relation to two specific phone uses: buying things on line and banking or making payments online. In both of these cases, the Struggleville geoTribe increased its share of high volume users while the other two tribes use declined. One possible explanation for this outcome is that the Struggleville geoTribe does not have access to a computer to undertake online purchasing, banking or bill payment, while the Slender Meanz and Grey Power geoTribes members do.
Medium-level Users By Geo-TribeThe pattern of medium level use was found to vary considerably across the geoTribes for each type of phone use. The only consistent performer in the medium volume phone use stakes is “the Crusaders”. The Crusader geoTribe had the greatest proportion of medium level users for most of the uses.
High-Level And Medium Level Users Within Each geoTribeUnderstanding how many high-level and medium-level users are within each geoTribe may also be of interest to industry stakeholders for the purpose of understanding their current customer constituency so that appropriate education and action strategies can be devised to either aid current customers make the best use of their phones and/or attract di#erent types of customers to services o#ered on the mobile phone. For this reason this section has been included, although only in tabular format.
$is section shows the percentage of high-level users of the mobile phone for the speci!c purposes within each geoTribe. It addresses the question of “how many high-level and medium-level users are within each geoTribe for each phone use?” $e !gure for “high-level users” of each purpose was again calculated by summing together those that stated they used the mobile phone for the given purpose “at least 5 times a day” and those that used it “at least once a day”. $e !gure for “medium-level users” was again calculated by summing together those that stated they used the mobile phone for the given purpose “at least once a week” and those that used it “at least once a month.”
Table 8 shows the percentage of high-level users with each geoTribe. Table 9 shows the percentage of medium-level users within each geoTribe. Once again, please refer to the summary description of the geoTribes for context (earlier in this section).

AIMIA . The Australian Mobile Phone Lifestyle Index . October 2013 43
Table 8: Proportion Of High-Level Users Within Each geoTribe
Table 9: Proportion Of Medium-Level Users Within Each geoTribe
Comments
High-Level Users Within Each TribeSMS (texting) was found to have a greater percentage of high-level users than voice calls for all geoTribes with the exception of the Grey Power and Survivor geoTribes.
Grey Power and Rockafellas were the only two geoTribes where the proportion of high-level users for email was greater than the proportion of high-level users of SMS.
GeoTribe Voice calls SMS To send and receive emails
To get information For entertainment purposes
To visit websites, browse or search
the Internet
For banking including transfers
& bill payments To buy things online To read or edit
documents or files
Achievers
Boomers
Crusaders
Debtstars
Fortunats
Grey Power
Independents
Preppies
Rockafellas
Slender Meanz
Struggleville
Suburban Splendour
Survivors
True Blues
Twixters
Unclassified
Total
69% 90% 84% 85% 69% 80% 23% 7% 27%59% 59% 45% 68% 32% 45% 28% 15% 24%69% 93% 87% 95% 81% 90% 38% 12% 27%68% 84% 77% 66% 70% 73% 32% 12% 26%81% 82% 82% 77% 62% 75% 29% 21% 45%
58% 49% 59% 50% 13% 38% 9% 0% 20%
85% 93% 76% 86% 71% 86% 51% 9% 37%
58% 82% 79% 90% 81% 94% 23% 23% 31%
83% 91% 97% 86% 66% 82% 23% 6% 35%
63% 80% 53% 71% 71% 47% 0% 0% 13%
76% 88% 73% 75% 61% 71% 67% 47% 29%
85% 85% 63% 62% 69% 60% 25% 13% 36%
67% 59% 33% 27% 25% 38% 40% 0% 50%
74% 76% 49% 45% 30% 37% 10% 15% 30%
71% 89% 62% 81% 75% 88% 60% 33% 23%
74% 87% 84% 83% 69% 81% 42% 11% 30%
72% 84% 79% 79% 67% 76% 34% 13% 30%
GeoTribe Voice calls SMS To send and receive emails
To get information For entertainment purposes
To visit websites, browse or search
the Internet
For banking including transfers
& bill payments To buy things online To read or edit
documents or files
Achievers
Boomers
Crusaders
Debtstars
Fortunats
Grey Power
Independents
Preppies
Rockafellas
Slender Meanz
Struggleville
Suburban Splendour
Survivors
True Blues
Twixters
Total
29% 9% 15% 15% 23% 18% 69% 66% 52%36% 32% 35% 26% 42% 42% 60% 50% 43%29% 7% 12% 6% 17% 9% 59% 63% 58%32% 13% 23% 32% 30% 27% 62% 62% 42%17% 17% 11% 17% 33% 21% 56% 43% 55%
40% 51% 18% 30% 44% 38% 46% 11% 40%
15% 7% 22% 9% 21% 12% 38% 64% 34%
39% 18% 14% 10% 19% 3% 69% 46% 42%
17% 9% 2% 13% 33% 16% 75% 66% 48%
37% 10% 40% 29% 21% 53% 88% 40% 75%
24% 12% 23% 17% 30% 25% 28% 40% 36%
15% 15% 28% 31% 25% 34% 56% 25% 30%
26% 26% 50% 46% 50% 25% 40% 50% 0%
26% 22% 31% 43% 39% 50% 75% 31% 50%
29% 11% 31% 6% 19% 0% 40% 42% 46%
26% 15% 18% 18% 26% 21% 60% 56% 49%
AIMIA . The Australian Mobile Phone Lifestyle Index . October 2013 44
$e proportion of high-level users that use the phone to get information, entertainment or browsing the web was consistently lower for Survivors and True Blue geoTribes. $is represented a markedly di#erent use pro!le compared to other geoTribes.
Preppies, Struggleville and Twixters all had relatively high proportions of members that bought things online given their relatively lower proportion of high phone use compared to other geoTribes.
In general banking, buying things online and reading/editing documents had a much lower proportion of high-level users within the geoTribes than the other activities.
Medium-Level Users Within Each Tribe$e pro!le is quite di#erent to that of high-level users within tribes. While there was some variation across the tribes, the proportion of medium users was overall low for the following functions:
• Voice calls • SMS • Emails • To get information • For entertainment, and • Browsing the Internet.
$e proportion of medium users is much greater for the following functions:
• Banking • Buying things on line, and • Reading or editing documents.
$e Slender Meanz and True Blue geoTribes stood out as having the highest proportion of medium-level users of browsing the Internet and banking.
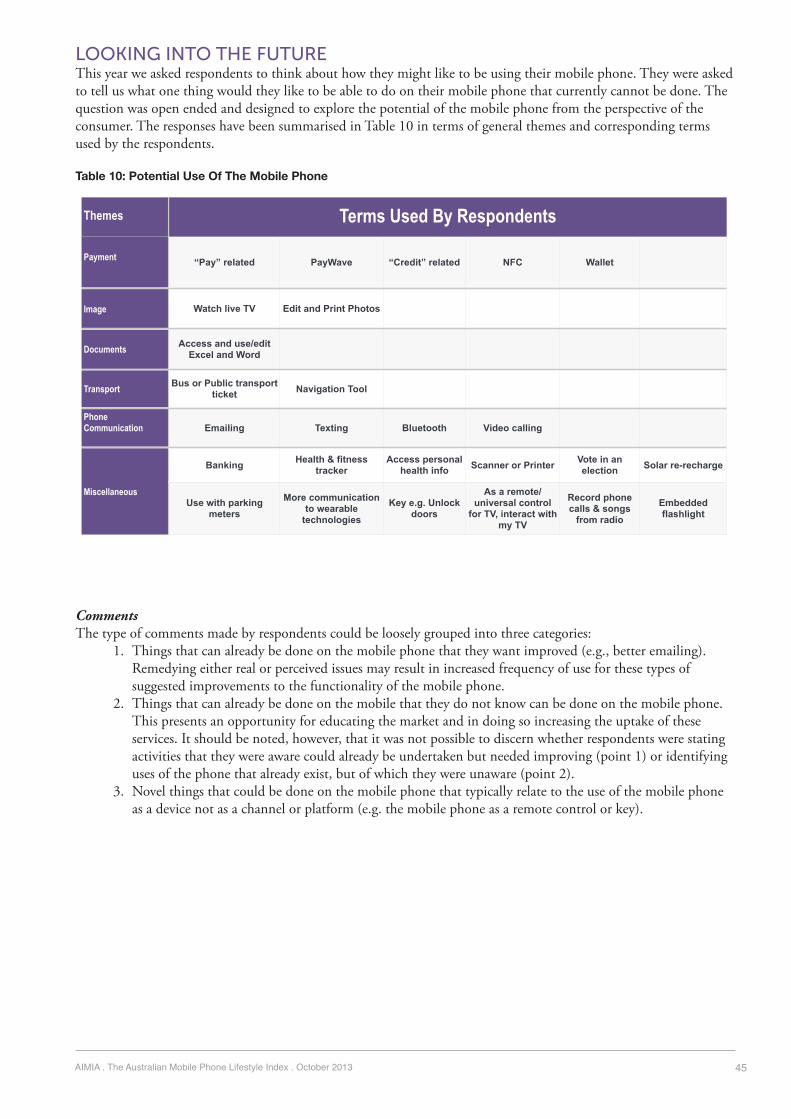
AIMIA . The Australian Mobile Phone Lifestyle Index . October 2013 45
LOOKING INTO THE FUTUREThis year we asked respondents to think about how they might like to be using their mobile phone. They were asked to tell us what one thing would they like to be able to do on their mobile phone that currently cannot be done. The question was open ended and designed to explore the potential of the mobile phone from the perspective of the consumer. The responses have been summarised in Table 10 in terms of general themes and corresponding terms used by the respondents.
Table 10: Potential Use Of The Mobile Phone
CommentsThe type of comments made by respondents could be loosely grouped into three categories: 1. Things that can already be done on the mobile phone that they want improved (e.g., better emailing). Remedying either real or perceived issues may result in increased frequency of use for these types of suggested improvements to the functionality of the mobile phone. 2. Things that can already be done on the mobile that they do not know can be done on the mobile phone. This presents an opportunity for educating the market and in doing so increasing the uptake of these services. It should be noted, however, that it was not possible to discern whether respondents were stating activities that they were aware could already be undertaken but needed improving (point 1) or identifying uses of the phone that already exist, but of which they were unaware (point 2). 3. Novel things that could be done on the mobile phone that typically relate to the use of the mobile phone as a device not as a channel or platform (e.g. the mobile phone as a remote control or key).
Themes Terms Used By RespondentsTerms Used By RespondentsTerms Used By RespondentsTerms Used By Respondents
Payment
Image
Documents
Transport
Phone Communication
Miscellaneous
“Pay” related PayWave “Credit” related NFC Wallet
Watch live TV Edit and Print Photos
Access and use/edit Excel and Word
Bus or Public transport ticket Navigation Tool
Emailing Texting Bluetooth Video calling
Banking Health & fitness tracker
Access personal health info Scanner or Printer Vote in an
election Solar re-recharge
Use with parking meters
More communication to wearable
technologies
Key e.g. Unlock doors
As a remote/universal control
for TV, interact with my TV
Record phone calls & songs
from radio
Embedded flashlight

AIMIA . The Australian Mobile Phone Lifestyle Index . October 2013 46
SECTION 4: ABOUT THE SPECIFIC SERVICES ACCESSED
This section provides insights about the services respondents accessed on their mobile phones. This includes details about the following:
• Entertainment services and content accessed on the mobile phone • Information services accessed on the mobile phone • Communication services accessed on the mobile phone.
In 2009 (Survey 5) this section was re-designed to capture the changes in the way that consumers were beginning to interact with their mobile phone services. The changed template has been used in subsequent surveys, including the 2013 Survey, with only minor variations.
ENTERTAINMENT SERVICES AND CONTENT ACCESSED
Table 11 shows the frequency of use of a number of listed entertainment services and content accessed on the mobile phone. Figure 39 then illustrates the respondents based on four usage groups, namely:
• High-level frequency (used at least once a day or used at least 5 times a day) • Medium-level frequency (used at least once a week or used at least once a month) • Low-level frequency (used at least once every few months, or used at least once a year) • Not used in the last 12 months.

AIMIA . The Australian Mobile Phone Lifestyle Index . October 2013 47
Table 11: Frequency Of Use Of Entertainment Services And Content In The Last 12 Months
Figure 39: Frequency Of Use Of Entertainment Services And Content In Last 12 Months
CommentsOf particular interest is that:
• Almost 30% of respondents were high-level users of Games. Only small percentages of respondents were high-level users of the remaining listed entertainment services and content. • Between 28% and 33% of respondents were high or medium-level users of entertainment services like music downloads, music streaming and video downloads.
Frequency of Use of Entertainment Services or Mobile Content on the Mobile Phone (As a Percentage of Respondents)
74
Entertainment Services and Content At Least 5 Times A Day At Least Once A Day At Least Once A Week At Least Once A Month At Least Once Every Few
Months At Least Once A Year Not At All
Games
Music Downloads
Music streaming (e.g., Spotify, MOG)
FM radio
Video downloads
Mobile TV
8% 19% 16% 10% 9% 5% 33%
2% 4% 11% 16% 11% 6% 50%
4% 6% 9% 8% 8% 4% 60%
2% 5% 9% 8% 9% 5% 62%
2% 7% 14% 8% 11% 5% 53%
1% 4% 6% 7% 4% 4% 74%
Frequency of Use of Entertainment Services or Mobile Content On the Mobile Phone
0%
10%
20%
30%
40%
50%
60%
70%
80%
90%
100%
74%
53%62%60%
50%
33%
8%
16%
14%12%
17%
14%
13%
22%17%
18%27%
26%
5%9%7%10%6%
27%
PERC
ENTA
GE O
F RE
SPON
DENT
S
High-Level Frequency (use at least once a day, or at least 5 times a day)Medium-Level Frequency (use at least once a week, or at least once a month)Low-Level (use at least once every few months, or at least once a year)Not Used In the Last 12 Months
GAMES MOBILE TVMUSIC STREAMING FM RADIOMUSIC DOWNLOADS VIDEO DOWNLOADS
75

AIMIA . The Australian Mobile Phone Lifestyle Index . October 2013 48
Use of Entertainment Services and Content Compared to Previous Years
Figure 40 shows the overall use of entertainment services and content in the last 12 months compared to the previous 3 surveys.
$e following, however, should be noted.
• In the 2012 (Survey 8) some changes were made to the list of included services and content to re"ect changes in the market. For example, FM radio and music streaming were included for the !rst time. • In 2013 the decision was made to only focus on these newer types of services and content as opposed to the more traditional entertainment services and content like ringtones and wallpapers. Respondents that are still using these more traditional entertainment services were captured in the question that asked respondents if they are using other content and services not listed in the survey.
$is means direct comparison with past surveys across all services and content was not possible.
Figure 40: Overall Use Of Entertainment Services In The Last 12 months Across The Surveys
Comments$ere was an increase in the use of all the listed entertainment services and content. In the last year videos/video downloads and music streaming experienced the greatest rate of growth. $e proportion of respondents accessing videos/video downloads increased by 12% to 47%, while the proportion of respondents streaming music almost doubled from 21% to 40%.
Overall Use of Entertainment Services or Mobile Content On the Mobile Phone Across Surveys In the Last 12 Months
0%
10%
20%
30%
40%
50%
60%
70%
80%
40%38%
26%
47%50%
67%
21%
35%
21%
34%
46%
64%
20%
30%
39%
62%
12%
19%
26%
48%
PERC
ENTA
GE O
F RE
SPON
DENT
S
Survey 2010 Survey 2011 Survey 2012 Survey 2013
GAMES MUSIC DOWNLOADS VIDEOS/VIDEO DOWNLOADS
76
MOBILE TV FM RADIO MUSIC STREAMING

AIMIA . The Australian Mobile Phone Lifestyle Index . October 2013 49
INFORMATION SERVICES ACCESSED ON THE MOBILE PHONE
Table 12 shows the frequency of use of a number of listed information services accessed on the mobile phone. Figure 41 then visually illustrates the respondents based on the same four usage groups created to illustrate the use of entertainment content and services, namely:
• High-level frequency (used at least once a day or used at least 5 times a day) • Medium-level frequency (used at least once a week or used at least once a month) • Low-level frequency (used at least once every few months, or used at least once a year) • Not used in the last 12 months.
Table 12: Frequency Of Use Of Information Services In The Last 12 Months
Figure 41: Frequency Of Use Of Information Services In The Last 12 Months
Information Services At Least 5 Times A Day At Least Once A Day At Least Once A Week At Least Once A Month At Least Once Every Few Months At Least Once A Year Not At All
News
Weather
Sports
Entertainment or celebrity news
Maps/location/traffic information
Movie information
Event listings
Restaurant or café information
TV guides
Financial information
Health & Wellbeing Information
9% 34% 18% 8% 4% 3% 23%
5% 41% 24% 8% 4% 2% 16%
3% 13% 15% 10% 6% 4% 49%
2% 10% 13% 12% 9% 6% 50%
4% 20% 35% 16% 6% 2% 18%
1% 5% 12% 22% 17% 7% 36%
1% 5% 11% 21% 16% 6% 40%
1% 5% 19% 23% 13% 6% 33%
1% 5% 11% 12% 9% 6% 56%
2% 8% 14% 9% 8% 6% 52%
1% 5% 13% 14% 12% 7% 47%
0%
10%
20%
30%
40%
50%
60%
70%
80%
90%
100%
56%
33%40%36%
47%52%50%49%
18%23%16%
15%
19%
22%24%
19%14%15%10%
8%7%
6%
23%
42%32%34%27%24%24%
25%
50%
27%32%
6%6%6%6%7%10%11%16%24%
43%46%
PERC
ENTA
GE O
F RE
SPON
DENT
S
High-Level Fequency (use at least once a day, or at least 5 times a day)Medium-Level Frequency (use at least once a week, or at least once a month)Low-Level Frequency (use at least once every few months, or at least once a year)Not Used in the Last 12 Months
WEATHER NEWS MAPS/LOCATION/TRAFFIC INFORMATION
SPORTS ENTERTAINMENTOR CELEBRITYNEWS
FINANCIALINFORMATION
78
MOVIE INFORMATION
EVENT LISTINGS
RESTAURANT OR CAFE INFORMATION
TV GUIDESHEALTH & WELLBEINGINFORMATION

AIMIA . The Australian Mobile Phone Lifestyle Index . October 2013 50
CommentsSome key insights from the results are as follows.
• Weather and news were the most “popular” information services accessed in terms of frequency of use. Just over 40% of respondents were high-level users of weather (46%) and news (43%) information on their mobile phones, and approximately 30% were medium-level users. • Maps/location and traffic information were equally popular, but used less frequently. 50% of respondents were medium-level users and 24% were high-level users. • Between 34% and 41% of respondents were also high or medium-level users of most of the other information services. The only exceptions were restaurant or café information (48%) and TV Guides (29%).
Use of Information Services Compared to Previous Years
Figure 42 shows the overall use of information services in the last 12 months, compared to the previous three surveys.
Figure 42: Overall Use Of Information Services In The Last 12 months Across The Surveys
CommentsThere has been steady year on year increases in the use of all the listed information services since the 2010 Survey (Survey 6). The greatest growth in the last 12 months occurred in the proportion of respondents that accessed ‘event listings’ (48%-67%) and ‘restaurant or café information’ (16%).
In 2013 at least half of the respondents used almost every information service in the last 12 months. The only exceptions were ‘financial information’ (48%) and ‘TV Guides’ (44%).
Overall Use of Information Services or Content On the Mobile Phone In the Last 12 Months Across Surveys
0%
10%
20%
30%
40%
50%
60%
70%
80%
90%
44%48%50%51%
64%67%67%
77%82%84%
36%38%
45%47%
53%48%
51%
67%70%
75%
29%30%34%36%
42%
35%39%
55%55%59%
21%22%26%
31%30%25%27%
42%41%45%
PERC
ENTA
GE O
F RE
SPON
DENT
S
Survey 2010 Survey 2011 Survey 2012 Survey 2013
RESTAURANT OR CAFE INFO
EVENT LISTINGS FINANCIAL
INFOENTERTAINMENT/CELEBRITY NEWS
79
SPORTSMAPS/LOCATION/TRAFFIC INFO
WEATHER NEWS MOVIE INFO TV GUIDES

AIMIA . The Australian Mobile Phone Lifestyle Index . October 2013 51
COMMUNICATION SERVICES ACCESSED ON THE MOBILE PHONE
Table 13 shows the frequency of use of a number of listed information services. Figure 43 shows the respondents based on the same four usage groups created to illustrate the use of entertainment and information services, namely:
• High-level frequency (used at least once a day or used at least 5 times a day)• Medium-level frequency (used at least once a week or used at least once a month)• Low-level frequency (used at least once every few months, or used at least once a year)• Not used in the last 12 months.
Table 13: Frequency Of Use Of Communication Services In The Last 12 Months
Figure 43: Frequency Of Use Of Communication Services In The Last 12 Months
Communication Services At Least 5 Times A Day At Least Once A Day At Least Once A Week At Least Once Every Few Months
At Least Once Every Few Months At Least Once A Year Not At All
Social networking sites or applications (e.g., Facebook, MySpace, Twitter, etc.)
Instant messenger (IM)
MMS (multimedia messaging service)
Chat rooms
Video calling
31% 27% 11% 4% 3% 2% 22%
30% 25% 7% 5% 3% 1% 29%
9% 11% 10% 5% 4% 4% 57%
5% 12% 26% 18% 10% 4% 24%
2% 3% 3% 3% 3% 3% 83%
1% 3% 7% 11% 10% 7% 61%
In The Last 12 Months
0%
10%
20%
30%
40%
50%
60%
70%
80%
90%
100%
61%
83%
24%
57%
29%22%
16%
6%
14%
8%
4%
5%
19%6%
44%
15%
12%15%
4%5%
18%20%
55%58%PERC
ENTA
GE O
F RE
SPON
DENT
S
High-Level Fequency (use at least once a day, or at least 5 times a day)Medium-Level Frequency (use at least once a week, or at least once a month)Low-Level Frequency (use at least once every few months, or at least once a year)Not Used in the Last 12 Months
EMAIL SOCIAL NETWORKING
SITES OR APPLICATIONS
MMS (MULTIMEDIA MESSAGING SERVICE)
CHAT ROOMS VIDEO CALLINGINSTANT MESSENGER (IM)

AIMIA . The Australian Mobile Phone Lifestyle Index . October 2013 52
CommentsSome points to note:
• Email and social networking sites are clearly the most frequently used communication services on the mobile phone. o Just over half of the respondents were high-level users of email (58%) and social networking sites and applications (55%). • MMS had a similar overall proportion of combined high and medium-level users as social networking sites and applications. However, the ratio of high to medium is reversed for MMS with most users being medium-level users.
Type Of Social Networking Sites Accessed
Since the 2012 Survey respondents have been asked about the type of social networking sites they access on their mobile phones. The results are captured in Figure 44.
Figure 44: Use Of Social Networking Sites On The Mobile Phone Across Surveys
CommentsThe overall pattern of social networking sites or applications used on the mobile phone was similar across the two surveys. Facebook was again found to be the most popular social networking site or application this year (66%), with Twitter (33%) and LinkedIn (32%) being a distant second and third.
However, there has been growth in the percentage of respondents using these key social networking sites and applications. The greatest increase was in the percentage of respondents using LinkedIn, which increased from 20% to 32%, making it almost as popular as Twitter on the mobile phone (33%).
Use of Communication Services Compared to Previous Years
Figure 45 shows the overall use of communication services in the last 12 months, compared to the previous three surveys.
Use of Social Networking Sites on the Mobile Phone Across the Surveys
82
0%
10%
20%
30%
40%
50%
60%
70%
80%
28%
11%
2%6%
32%33%
66%
38%
5%2%
6%
20%
26%
59%
PERC
ENTA
GE O
F RE
SPON
DENT
S
Survey 2012 Survey 2013
DON’T KNOWFACEBOOK TWITTER LINKEDIN FOURSQUARE PATHPATH OTHER

AIMIA . The Australian Mobile Phone Lifestyle Index . October 2013 53
Figure 45: Overall Use Of Communication Services In The Last 12 months Across The Surveys
CommentsAs was the case with information and entertainment services and content, there has been a year-on-year increase in the use of all the listed communication services since the 2010 Survey (Survey 6). In the last 12 months, from the 2012 to 2013 Survey most of the listed communication services have experienced growth between 8 and 11%. The only exception to this trend was chat rooms, which only increased by 3% since last year.
At the end of this section of the survey respondents were asked if they had visited or used any information, entertainment or communication type services on their mobile phones that had not been included in the previous few questions. Of all the respondents, 13% answered that they had used other services. Some of the more common and relevant responses included: blogs, forums, Pinterest, Instagram, Skype, and Viber.
Use of Communication Services On the Mobile Phone In The Last 12 Months Across Surveys
0%
10%
20%
30%
40%
50%
60%
70%
80%
90%
17%
39%43%
71%76%78%
14%
29%32%
61%
68%68%
12%
20%
26%
53%
63%
55%
9%14%
21%
39%
59%
42%
PERC
ENTA
GE O
F RE
SPON
DENT
S
Survey 2010 Survey 2011 Survey 2012 Survey 2013
EMAIL SOCIAL NETWORKING SITES OR APPLICATIONS
83
MMS (MULTIMEDIA MESSAGING SERVICE)
CHAT ROOMSVIDEO CALLINGINSTANT MESSENGER (IM)
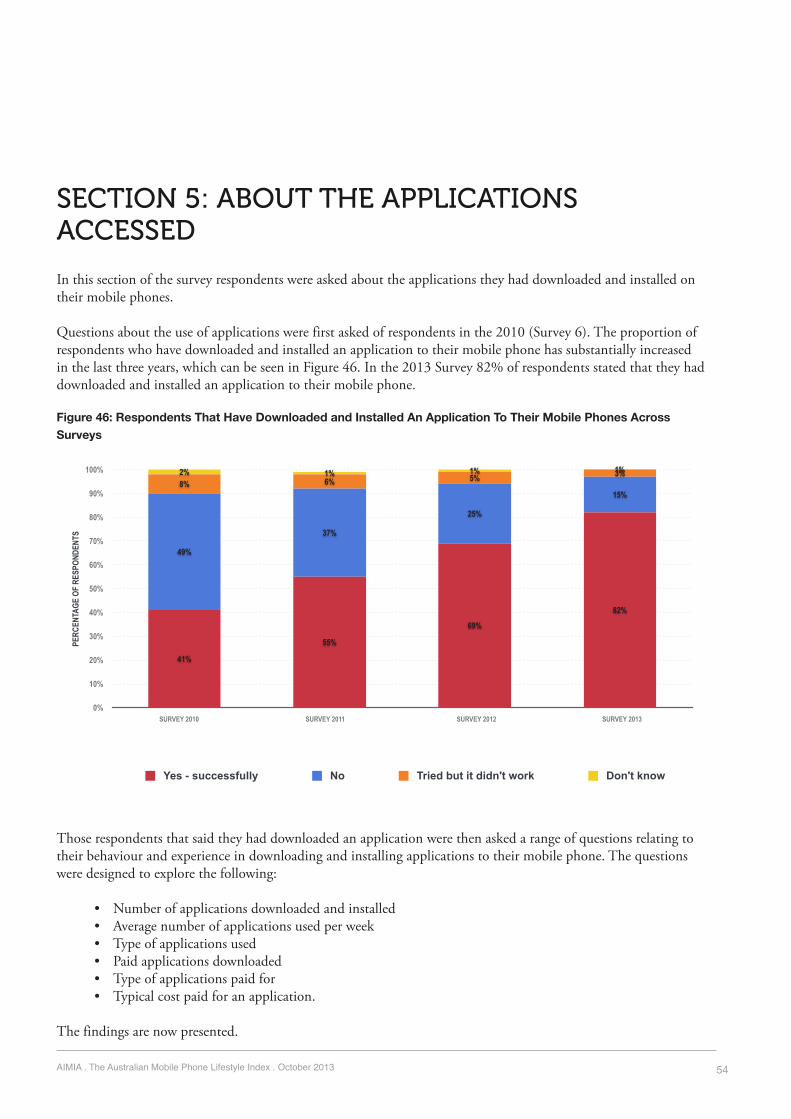
AIMIA . The Australian Mobile Phone Lifestyle Index . October 2013 54
SECTION 5: ABOUT THE APPLICATIONS ACCESSED
In this section of the survey respondents were asked about the applications they had downloaded and installed on their mobile phones.
Questions about the use of applications were first asked of respondents in the 2010 (Survey 6). The proportion of respondents who have downloaded and installed an application to their mobile phone has substantially increased in the last three years, which can be seen in Figure 46. In the 2013 Survey 82% of respondents stated that they had downloaded and installed an application to their mobile phone.
Figure 46: Respondents That Have Downloaded and Installed An Application To Their Mobile Phones Across Surveys
Those respondents that said they had downloaded an application were then asked a range of questions relating to their behaviour and experience in downloading and installing applications to their mobile phone. The questions were designed to explore the following:
• Number of applications downloaded and installed • Average number of applications used per week • Type of applications used • Paid applications downloaded • Type of applications paid for • Typical cost paid for an application.
The findings are now presented.
Respondents That Have Downloaded and Installed an Application to their Mobile PhonesAcross Surveys
0%
10%
20%
30%
40%
50%
60%
70%
80%
90%
100% 1%1%1%2% 3%5%6%8%15%
25%
37%
49%
82%
69%
55%
41%
PERC
ENTA
GE O
F RE
SPON
DENT
S
Yes - successfully No Tried but it didn't work Don't know
88
SURVEY 2010 SURVEY 2011 SURVEY 2012 SURVEY 2013

AIMIA . The Australian Mobile Phone Lifestyle Index . October 2013 55
NUMBER OF APPLICATIONS DOWNLOADED AND INSTALLED
Respondents that had downloaded and installed an application were asked how many applications they had downloaded and installed in the last 6 months. The results across the surveys are shown in Figure 47.
Figure 47: Number Of Applications Respondents Downloaded And Installed On Their Mobile Phone In The Last 6 Months Across Surveys
CommentsThe results are fairly consistent across the last 4 years, except for a gradual and incremental shift away from 5 or less downloads towards the download of between 6 and 30 applications.
Number of Applications That Respondents Have Downloaded and Installed to their Mobile PhonesAcross Surveys
0%
10%
20%
30%
40%
1%
8%7%
12%
22%23%23%
5%
2%
11%
6%
11%
20%
23%23%
3%
11%
8%10%
18%19%
25%
8% 9%7%
10%
14%16%
28%
15%
PERC
ENTA
GE O
F RE
SPON
DENT
S
Survey 2010 Survey 2011 Survey 2012 Survey 2013
90
1 ONLY 2-5 APPS 6-10 APPS 11-20 APPS 21-30 APPS 31-50 APPS MORE THAN 50 APPS HAVE NOT DOWNLOADED ANY APPS IN THE LAST 6 MONTHS

AIMIA . The Australian Mobile Phone Lifestyle Index . October 2013 56
AVERAGE NUMBER OF APPLICATIONS USED PER WEEK
Since 2012 respondents have been asked to report the average number of applications they used per week. Their responses are captured in Figure 48.
Figure 48: Average Number Of Applications Respondents Used Per Week
CommentsThere has also been a clear shift from the use of 5 or less applications per week, towards the use of 6 or more applications per week. There was a 10% increase in the percentage of respondents that use 11 or more applications per week.
Number of Applications Used on Average Per Week Across the Surveys
92
0%
10%
20%
30%
40%
50%
60%
1%
6%
15%
29%
44%
5%3%3%
8%
25%
51%
9%
PERC
ENTA
GE O
F RE
SPON
DENT
S
Survey 2012 Survey 2013
1 APP ONLY 2-5 APPS 6-10 APPS 11-20 APPS MORE THAN 20 APPS
I DON’T USE APPLICATIONSEACH WEEK

AIMIA . The Australian Mobile Phone Lifestyle Index . October 2013 57
TYPES OF APPLICATIONS USED
Respondents were asked what type of applications they have used on their mobile phones during the last 6 months. The responses for 2013 are shown in Figure 49. Comparisons with the 2011 and 2012 Surveys are captured in Figures 50 and 5113.
Figure 49: Type Of Applications Used By Respondents On Their Mobile Phone In The Last 6 Months
Figure 50: Type of Applications Used By Respondents On their Mobile Phone In The Last 6 Months
Type of Applications Used in the Last 6 Months
MAPS & NAVIGATION
NEWS AND WEATHER
GAMES
PHOTOS VIDEOS & MOVIES
IM AND SOCIAL NETWORKING
MUSIC
SEARCH (E.G. YELLOW PAGES GOOGLE BING)
SHOPPING
EATING OUT
TRAVEL
MANAGING MONEY
HEALTH AND WELLBEING
BOOKS
TIME MANAGEMENT
BUSINESS
EDUCATION
OTHER
0% 10% 20% 30% 40% 50% 60% 70% 80% 90%
8%17%
20%24%
27%28%
32%32%33%34%
45%48%
52%61%
64%72%
80%
PERCENTAGE OF RESPONDENTS
93
Types of Applications Used By Respondents On Their Mobile Phones Across Surveys
0%
10%
20%
30%
40%
50%
60%
70%
80%
90%
33%34%
45%48%
52%
61%64%
72%
80%
31%35%
53%50%
27%
56%
74%73%74%
28%30%26%
46%
39%
79%
57%55%
PERC
ENTA
GE O
F RE
SPON
DENT
S
Survey 2011 Survey 2012 Survey 2013
94
GAMESMAPS& NAVIGATION
NEWS & WEATHER
PHOTOS, VIDEOS AND MOVIES
SEARCH SHOPPINGMUSIC EATING OUTINSTANT MESSENGER AND SOCIAL NETWORKING
13 For ease of readability and comparison across the surveys the list of applications has been split over 2 figures.
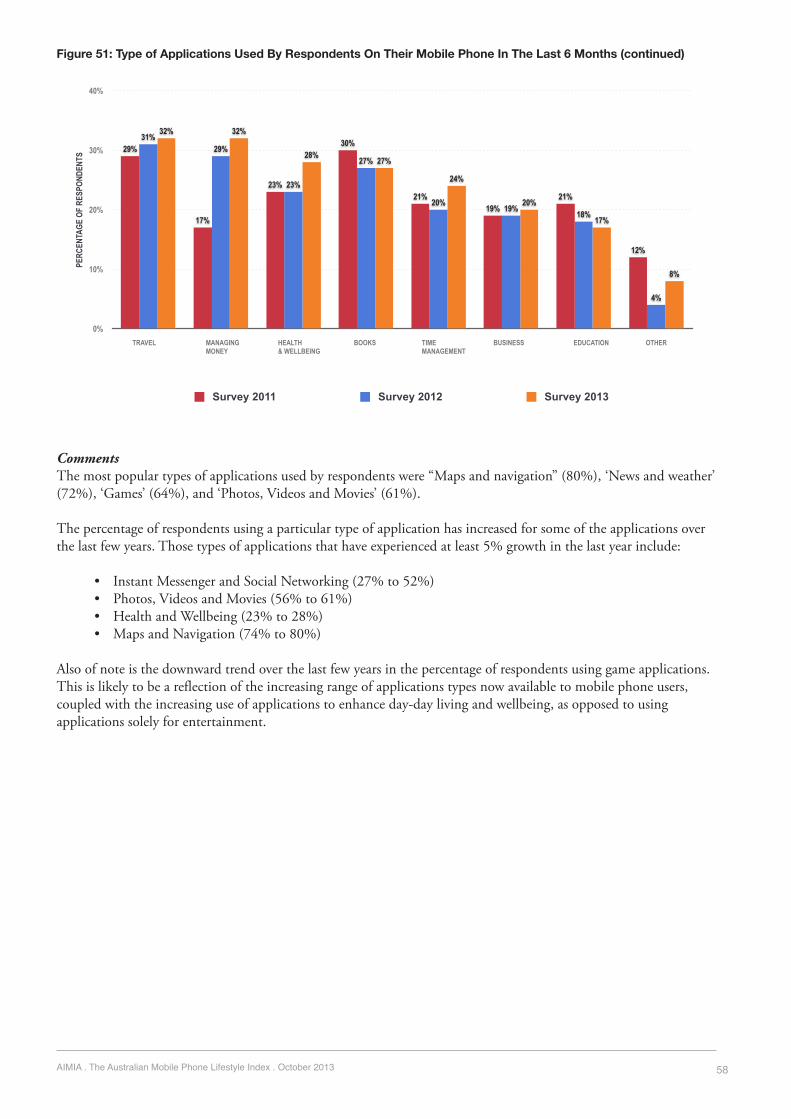
AIMIA . The Australian Mobile Phone Lifestyle Index . October 2013 58
Figure 51: Type of Applications Used By Respondents On Their Mobile Phone In The Last 6 Months (continued)
CommentsThe most popular types of applications used by respondents were “Maps and navigation” (80%), ‘News and weather’ (72%), ‘Games’ (64%), and ‘Photos, Videos and Movies’ (61%).
The percentage of respondents using a particular type of application has increased for some of the applications over the last few years. Those types of applications that have experienced at least 5% growth in the last year include:
• Instant Messenger and Social Networking (27% to 52%) • Photos, Videos and Movies (56% to 61%) • Health and Wellbeing (23% to 28%) • Maps and Navigation (74% to 80%)
Also of note is the downward trend over the last few years in the percentage of respondents using game applications. This is likely to be a reflection of the increasing range of applications types now available to mobile phone users, coupled with the increasing use of applications to enhance day-day living and wellbeing, as opposed to using applications solely for entertainment.
Types of Applications Used By Respondents On Their Mobile Phones Across Surveys (continued)
0%
10%
20%
30%
40%
8%
17%
20%
24%
27%28%
32%32%
4%
18%19%20%
27%
23%
29%31%
12%
21%19%
21%
30%
23%
17%
29%
PERC
ENTA
GE O
F RE
SPON
DENT
S
Survey 2011 Survey 2012 Survey 2013
95
MANAGING MONEY
EDUCATIONBOOKS BUSINESSTIME MANAGEMENT
OTHERHEALTH & WELLBEING
TRAVEL

AIMIA . The Australian Mobile Phone Lifestyle Index . October 2013 59
PAID APPLICATIONS DOWNLOADED AND INSTALLED
Of those respondents who had downloaded and installed applications on their mobile phones, 62% stated they had paid to do so. This figure has increased gradually over the last few years, as follows.
• Survey 6 (2010) - 52% • Survey 7 (2011) - 60% • Survey 8 (2012) - 59% • Survey 9 (2013) - 62%.
Those respondents who had paid to download and install an application were then asked what type of applications they had paid for and the typical cost paid for applications.
TYPE OF APPLICATIONS RESPONDENTS PAID FOR
Figure 52 shows the responses for 2013 only. Figures 53 and 54 illustrate the percentage of respondents who had paid for each of the listed types of applications for 2013 compared to the 2011 and 2012 Surveys.14
Figure 52: Types Of Applications Paid For By Respondents In The Last 6 Months (As A Percentage Of All respondents Who Have Downloaded And Installed Applications On Their Mobile Phones)Type of Applications Paid For in the Last 6 Months
NONE
GAMES
MUSIC
BOOKS
PHOTOS VIDEOS & MOVIES
NEWS & WEATHER
MAPS & NAVIGATION
HEALTH & WELLBEING
TRAVEL
EDUCATION
BUSINESS
TIME MANAGEMENT
INSTANT MESSENGER & SOCIAL NETWORKING
MANAGING MONEY
EATING OUT
SHOPPING
SEARCH (E.G. YELLOW PAGES)
OTHER
0% 10% 20% 30% 40% 50%
7%1%
2%2%
4%5%
6%7%7%7%7%
9%11%11%
13%18%
33%38%
PERCENTAGE OF RESPONDENTS
98
14 For ease of readability and comparison across the surveys the list of applications has been split over two figures.

AIMIA . The Australian Mobile Phone Lifestyle Index . October 2013 60
Figure 53: Types Of Applications Paid For By Respondents In The Last 6 Months Across Surveys (As A Percentage Of Respondents Who Have Paid For Applications)
Figure 54: Types of Applications Paid For By Respondents In The Last 6 Months Across Surveys (continued)
Comments‘Games’ remains the most commonly paid for type of application. As in previous years, this is not surprising as games tend to be more transient in terms of use, compared to other types of applications (e.g., a person using social network applications is likely to continue to use a single or limited number of applications, while a person using a game may change the type of game played frequently). However, the percentage of respondents paying for ‘games’ has decreased since 2012, while the proportion of respondents paying for some of the other potentially transient type applications has increased (e.g. ‘books’ and ‘photos, videos and movies’).
Types of Applications Paid For By Respondents Across Surveys (as a percentage of those respondents that paid for an app)
0%
10%
20%
30%
40%
50%
60%
70%
80%
11%11%12%15%17%18%
22%
54%
23%
5%6%
15%
8%7%
17%
70%
11%
4%4%
10%8%6%
12%
47%
PERC
ENTA
GE O
F RE
SPON
DENT
S
Survey 2011 Survey 2012 Survey 2013
99
GAMES BUSINESSBOOKS NEWS & WEATHER
PHOTOS, VIDEOS & MOVIES
MAPS & NAVIGATION
EDUCATIONHEALTH & WELLBEING
Types of Applications Paid For By Respondents Across Surveys (continued)
0%
5%
10%
15%
20%
25%
30%
11%
1%
3%4%
6%
8%9%
11%10%
8%
4%3%
12%11%
14%
22%
6%
3%4%
1%
7%
5%6%
10%
PERC
ENTA
GE O
F RE
SPON
DENT
S
Survey 2011 Survey 2012 Survey 2013
100
TRAVEL SEARCH E.G. YELLOW PAGES, GOOGLE, BING)
INSTANT MESSENGER & SOCIAL NETWORKING
MANAGING MONEY EATING OUTTIME MANAGEMENT
OTHERSHOPPING

AIMIA . The Australian Mobile Phone Lifestyle Index . October 2013 61
It should be also noted that a decline in the percentage of people paying to download an application does not necessarily indicate a decline in the population of download and use of that type of application. Rather, the popularity of the application may have increased (e.g., managing money), but the growth may have occurred at the expense of paid applications (i.e., it has occurred through the use of free apps).
TYPICAL COST RESPONDENTS PAID FOR AN APPLICATION
Since 2010 respondents have been asked to state the typical cost paid for applications (to the nearest whole dollar). Figure 55 shows the typical cost paid for an application across the surveys.
Figure 55: Typical Cost Respondents Paid For An Application Across Surveys
Comments$e results of the 2013 Survey shows a substantial increase in the percentage of respondents spending between $2 and $6. In 2013 67% of respondents stated that the typical cost spent on an application was between $2 and $6, compared to 49% in 2012. $is increase has been o#set by the decrease in the percentage of those spending less than $2 and more than $10. $is may be explained by the increased range of applications now available in the middle range end of the cost spectrum.
Typical Cost of an Application Paid by Respondents Across Surveys
0%
10%
20%
30%
40%
4%
9%
32%
35%
17%
5%
13%
7%
20%
29%28%
2%
18%
7%
24%
27%
22%
1%
5%
11%
30%
26%26%
2%
PERC
ENTA
GE O
F RE
SPON
DENT
S
Survey 2010 Survey 2011 Survey 2012 Survey 2013
103
LESS THAN $1 $1.00 TO $1.99 $2.00 TO $2.99 $3.00 TO $5.99 $6.00 TO $10.00 MORE THAN $10

AIMIA . The Australian Mobile Phone Lifestyle Index . October 2013 62
SECTION 6: ABOUT ADVERTISING AND MARKETING The special topic two years ago was advertising and marketing on the mobile phone. Some of these key questions were again included this year to provide some ability to track this evolving opportunity in the mobile phone space. The questions that were addressed this year are as follows.
• The number of businesses respondents agreed to receive messages from • The type of businesses respondents agreed to receive messages from.
The results follow.
NUMBER OF BUSINESSES FROM WHICH RESPONDENTS HAVE AGREED TO RECEIVE MESSAGES
Respondents were asked about the number of businesses from whom they had currently agreed to receive SMS or MMS messages. Figure 56 shows the overall proportion of respondents that had agreed to receive SMS or MMS messages from businesses in 2013, and the results from the last two surveys. Figure 57 shows the breakdown of the number of businesses from whom respondents agreed to receive SMS or MMS messages over the last three surveys.
Figure 58 shows the type of businesses respondents opted in to receive messages from over the last three surveys.
Figure 56: Overall Percentage Of Respondents That Had Agreed To Receive SMS Or MMS Messages On Their Mobile Phones From Businesses Across Surveys
Respondents Who Have Opted in to Receive SMS or MMS Messages from Businesses on their Mobile Phones
0%
10%
20%
30%
40%
50%
60%
70%
63%
57%
47%
PERC
ENTA
GE O
F RE
SPON
DENT
S
SURVEY 2011
106
SURVEY 2012 SURVEY 2013
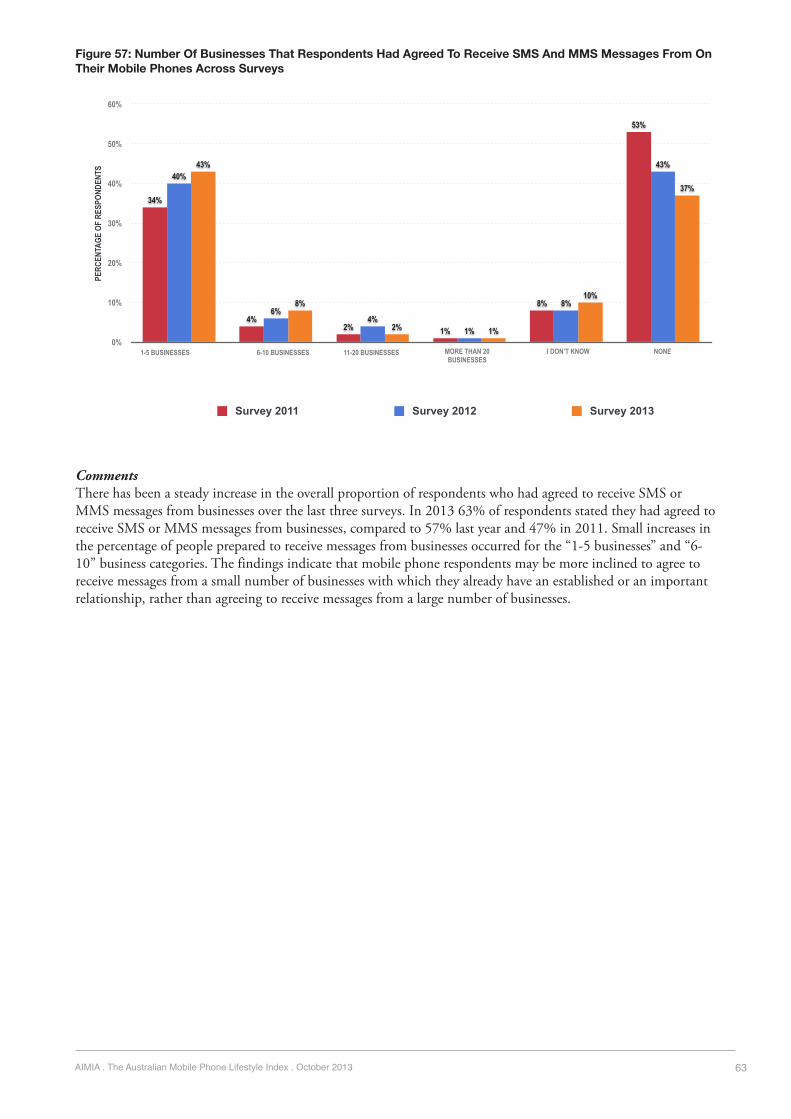
AIMIA . The Australian Mobile Phone Lifestyle Index . October 2013 63
Figure 57: Number Of Businesses That Respondents Had Agreed To Receive SMS And MMS Messages From On Their Mobile Phones Across Surveys
Comments There has been a steady increase in the overall proportion of respondents who had agreed to receive SMS or MMS messages from businesses over the last three surveys. In 2013 63% of respondents stated they had agreed to receive SMS or MMS messages from businesses, compared to 57% last year and 47% in 2011. Small increases in the percentage of people prepared to receive messages from businesses occurred for the “1-5 businesses” and “6-10” business categories. The findings indicate that mobile phone respondents may be more inclined to agree to receive messages from a small number of businesses with which they already have an established or an important relationship, rather than agreeing to receive messages from a large number of businesses.
Number of Businesses Respondents Opted in To Receive SMS or MMS Messages from on their Mobile Phones Across Surveys
0%
10%
20%
30%
40%
50%
60%
37%
10%
1%2%
8%
43% 43%
8%
1%4%
6%
40%
53%
8%
1%2%4%
34%
PERC
ENTA
GE O
F RE
SPON
DENT
S
Survey 2011 Survey 2012 Survey 2013
107
1-5 BUSINESSES 6-10 BUSINESSES 11-20 BUSINESSES MORE THAN 20 BUSINESSES
I DON’T KNOW NONE
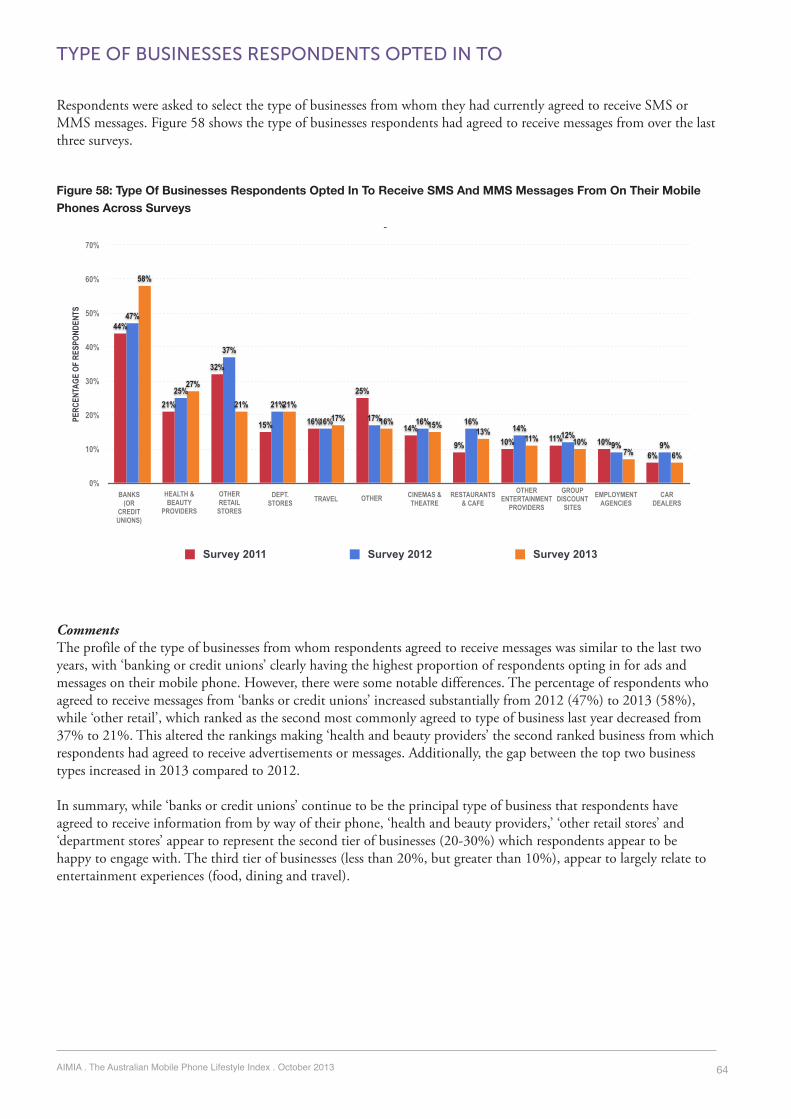
AIMIA . The Australian Mobile Phone Lifestyle Index . October 2013 64
TYPE OF BUSINESSES RESPONDENTS OPTED IN TO
Respondents were asked to select the type of businesses from whom they had currently agreed to receive SMS or MMS messages. Figure 58 shows the type of businesses respondents had agreed to receive messages from over the last three surveys.
Figure 58: Type Of Businesses Respondents Opted In To Receive SMS And MMS Messages From On Their Mobile Phones Across Surveys
Comments The profile of the type of businesses from whom respondents agreed to receive messages was similar to the last two years, with ‘banking or credit unions’ clearly having the highest proportion of respondents opting in for ads and messages on their mobile phone. However, there were some notable differences. The percentage of respondents who agreed to receive messages from ‘banks or credit unions’ increased substantially from 2012 (47%) to 2013 (58%), while ‘other retail’, which ranked as the second most commonly agreed to type of business last year decreased from 37% to 21%. This altered the rankings making ‘health and beauty providers’ the second ranked business from which respondents had agreed to receive advertisements or messages. Additionally, the gap between the top two business types increased in 2013 compared to 2012.
In summary, while ‘banks or credit unions’ continue to be the principal type of business that respondents have agreed to receive information from by way of their phone, ‘health and beauty providers,’ ‘other retail stores’ and ‘department stores’ appear to represent the second tier of businesses (20-30%) which respondents appear to be happy to engage with. The third tier of businesses (less than 20%, but greater than 10%), appear to largely relate to entertainment experiences (food, dining and travel).
Type of Businesses Respondents Opted in To Receive SMS or MMS Messages from on their Mobile Phones Across Surveys
0%
10%
20%
30%
40%
50%
60%
70%
6%7%10%11%
13%15%16%17%
21%21%
27%
58%
9%9%12%
14%16%16%17%16%
21%
37%
25%
47%
6%10%11%10%9%
14%
25%
16%15%
32%
21%
44%
PERC
ENTA
GE O
F RE
SPON
DENT
S
Survey 2011 Survey 2012 Survey 2013
108
BANKS (OR
CREDIT UNIONS)
HEALTH &BEAUTY
PROVIDERS
OTHER RETAIL
STORES
DEPT. STORES TRAVEL OTHER CINEMAS &
THEATRERESTAURANTS
& CAFEOTHER
ENTERTAINMENTPROVIDERS
GROUPDISCOUNT
SITESEMPLOYMENT
AGENCIESCAR
DEALERS

AIMIA . The Australian Mobile Phone Lifestyle Index . October 2013 65
SECTION 7: IMPACT OF TABLETS ON MOBILE PHONE USEThe special topic in the 2012 Survey related to the use of tablets and their impact on mobile phone use. As was the case with mobile advertising and marketing, some of the key questions were again included this year to provide some ability to also monitor this continuing area of interest for industry.
The findings include information regarding:
• Tablet ownership • Specific uses of the tablet (including frequency of use) • Mobile phone use compared to tablet use • Impact of tablet on mobile phone use.
TABLET OWNERSHIP OF RESPONDENTS
Figure 59 shows current ‘tablet ownership and planned purchase within the next 12 months’ for the 2013 Survey compared to the results for the previous two Surveys. As was the case with the planned purchase of a smartphone, the planned purchase of a tablet may not correlate exactly with actual future purchase figures, but it does provide an indication of intent and interest in purchasing these devices.
Figure 59: Tablet Ownership Of Respondents Across Surveys
Tablet Ownership of Respondents Across the Surveys
0%
10%
20%
30%
40%
50%
60%
70%
2%
23%
12%
7%
56%
3%
27%
21%
12%
38%
2%
49%
22%
11%
16%PERC
ENTA
GE O
F RE
SPON
DENT
S
Survey 2011 Survey 2012 Survey 2013
110
YES NO BUT I PLAN TO BUY ONE IN THE NEXT 6 MONTHS
NO BUT I PLAN TO BUY ONE IN THE NEXT 12 MONTHS
NO I DON’T NEED ONE
DON’T KNOW
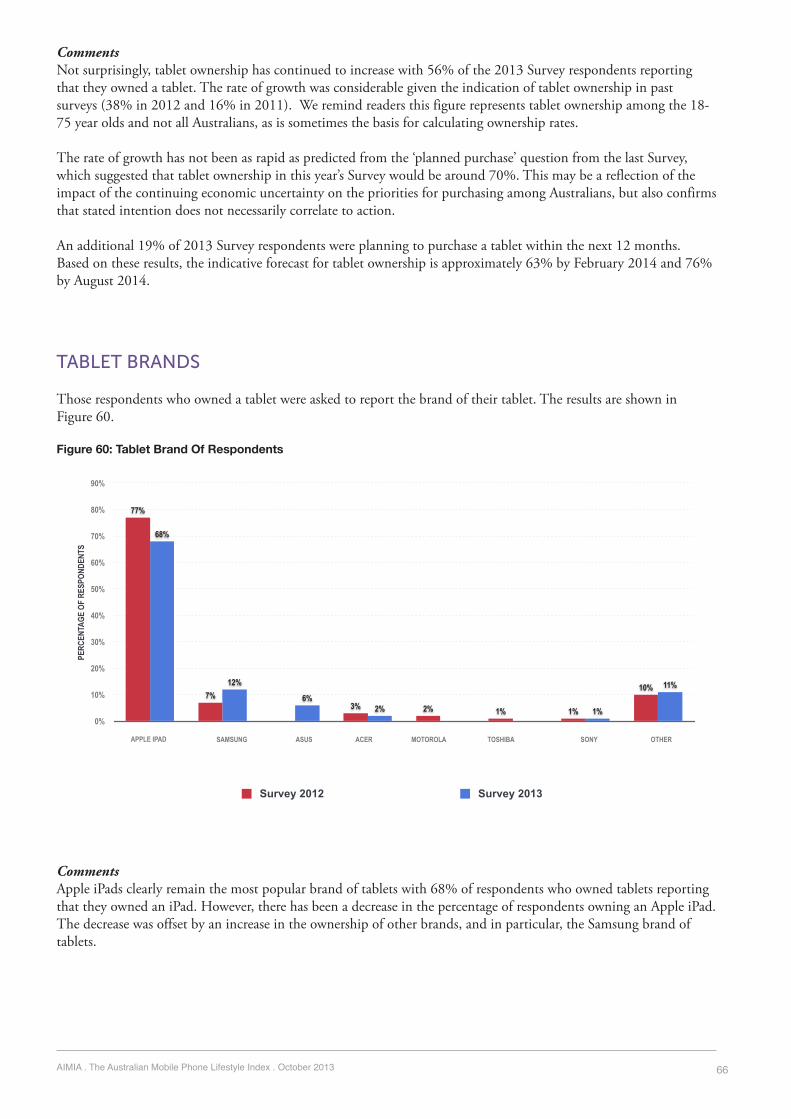
AIMIA . The Australian Mobile Phone Lifestyle Index . October 2013 66
CommentsNot surprisingly, tablet ownership has continued to increase with 56% of the 2013 Survey respondents reporting that they owned a tablet. The rate of growth was considerable given the indication of tablet ownership in past surveys (38% in 2012 and 16% in 2011). We remind readers this figure represents tablet ownership among the 18-75 year olds and not all Australians, as is sometimes the basis for calculating ownership rates.
The rate of growth has not been as rapid as predicted from the ‘planned purchase’ question from the last Survey, which suggested that tablet ownership in this year’s Survey would be around 70%. This may be a reflection of the impact of the continuing economic uncertainty on the priorities for purchasing among Australians, but also confirms that stated intention does not necessarily correlate to action.
An additional 19% of 2013 Survey respondents were planning to purchase a tablet within the next 12 months. Based on these results, the indicative forecast for tablet ownership is approximately 63% by February 2014 and 76% by August 2014.
TABLET BRANDS
Those respondents who owned a tablet were asked to report the brand of their tablet. The results are shown in Figure 60.
Figure 60: Tablet Brand Of Respondents
CommentsApple iPads clearly remain the most popular brand of tablets with 68% of respondents who owned tablets reporting that they owned an iPad. However, there has been a decrease in the percentage of respondents owning an Apple iPad. The decrease was offset by an increase in the ownership of other brands, and in particular, the Samsung brand of tablets.
Tablet Brand of Respondents Across the Surveys
0%
10%
20%
30%
40%
50%
60%
70%
80%
90%
11%
1%2%6%
12%
68%
10%
1%1%2%3%7%
77%
PERC
ENTA
GE O
F RE
SPON
DENT
S
Survey 2012 Survey 2013
111
APPLE IPAD SAMSUNG ASUS ACER MOTOROLA TOSHIBA SONY OTHER
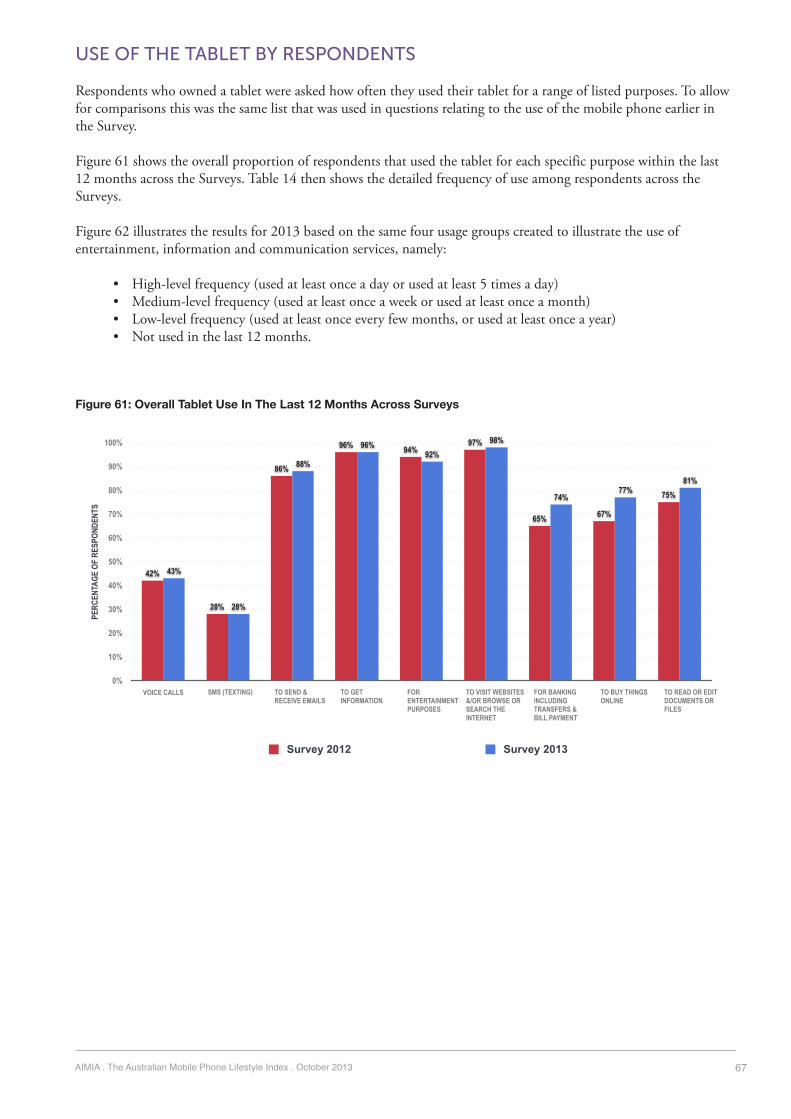
AIMIA . The Australian Mobile Phone Lifestyle Index . October 2013 67
USE OF THE TABLET BY RESPONDENTS
Respondents who owned a tablet were asked how often they used their tablet for a range of listed purposes. To allow for comparisons this was the same list that was used in questions relating to the use of the mobile phone earlier in the Survey.
Figure 61 shows the overall proportion of respondents that used the tablet for each specific purpose within the last 12 months across the Surveys. Table 14 then shows the detailed frequency of use among respondents across the Surveys.
Figure 62 illustrates the results for 2013 based on the same four usage groups created to illustrate the use of entertainment, information and communication services, namely:
• High-level frequency (used at least once a day or used at least 5 times a day) • Medium-level frequency (used at least once a week or used at least once a month) • Low-level frequency (used at least once every few months, or used at least once a year) • Not used in the last 12 months.
Figure 61: Overall Tablet Use In The Last 12 Months Across SurveysOverall Tablet Use By Respondents In the Last 12 Months Across Surveys
0%
10%
20%
30%
40%
50%
60%
70%
80%
90%
100%
81%77%
74%
98%92%
96%
88%
28%
43%
75%
67%65%
97%94%96%
86%
28%
42%
PERC
ENTA
GE O
F RE
SPON
DENT
S
Survey 2012 Survey 2013
VOICE CALLS SMS (TEXTING) TO SEND & RECEIVE EMAILS
TO GET INFORMATION
FOR ENTERTAINMENTPURPOSES
TO VISIT WEBSITES &/OR BROWSE OR SEARCH THE INTERNET
TO BUY THINGSONLINE
FOR BANKING INCLUDING TRANSFERS & BILL PAYMENT
114
TO READ OR EDITDOCUMENTS ORFILES

AIMIA . The Australian Mobile Phone Lifestyle Index . October 2013 68
Table 14: Frequency Of Uses By Tablet Owners In The Last 12 Months Across Surveys
Figure 62: Frequency Of Use of Specific Services On The Tablet For 2013
CommentsThe overall pattern of use was similar across both Surveys. However, there were some notable changes from the 2012 Survey to the 2013 Survey, namely the increase in the percentages of respondents using the ‘newer’ or emerging types of mobile phone use in the last 12 months. The use of the tablet:
Tablet Use At Least 5 Times A DayAt Least 5 Times A Day At Least Once A DayAt Least Once A Day At Least Once A Week
At Least Once A Week At Least Once A MonthAt Least Once A Month At Least Once Every Few
MonthsAt Least Once Every Few
Months At Least Once a YearAt Least Once a Year Not at allNot at all
2012 2013 2012 2013 2012 2013 2012 2013 2012 2013 2012 2013 2012 2013
Voice Calls
SMS
To send and receive email
To Get Information
For Entertainment Purposes
To Visit Websites and/or Browse or Search the Internet
For Banking Including Transfers & Bill Payments
To Buy Things Online
To Read or Edit Documents Online
2% 1% 5% 4% 9% 10% 12% 12% 8% 10% 6% 6% 58% 57%
3% 2% 5% 6% 9% 6% 5% 7% 5% 4% 2% 4% 72% 72%
26% 22% 30% 31% 9% 21% 6% 9% 4% 5% 1% 1% 14% 12%
28% 27% 42% 38% 9% 22% 5% 6% 2% 3% 0% 0% 4% 4%
25% 21% 40% 40% 9% 21% 6% 6% 2% 2% 1% 2% 6% 8%
33% 30% 42% 40% 9% 20% 4% 5% 1% 2% 1% 0% 3% 2%
7% 5% 15% 14% 9% 30% 12% 14% 4% 7% 1% 3% 35% 26%
7% 5% 11% 11% 9% 16% 20% 25% 10% 14% 4% 5% 33% 23%
12% 10% 21% 20% 9% 27% 12% 14% 6% 6% 1% 4% 25% 19%
0%
10%
20%
30%
40%
50%
60%
70%
80%
90%
100%
19%23%26%
2%8%4%
12%
72%
57%10%
19%10%
2%
4%3%
6%
8%
16%
41%
41%44%
25%
27%28%
30%
13%22% 30%
17%19%
71%61%65%
53%
8%5%
PERC
ENTA
GE O
F RE
SPON
DENT
S
High-level frequency (at least once a day and at least 5 times a day) Medium-level frequency (at least once a week plus at least once a month) Low-level frequency (at leaset once a month plus at least once every few months)Not at all in the last 12 months
VOICE CALLS SMS (TEXTING) TO SEND & RECEIVE EMAILS
TO GET INFORMATION
FOR ENTERTAINMENTPURPOSES
TO VISIT WEBSITES &/OR BROWSE OR SEARCH THE INTERNET
TO BUY THINGSONLINE
FOR BANKING INCLUDING TRANSFERS & BILL PAYMENT
TO READ OR EDITDOCUMENTS ORFILES

AIMIA . The Australian Mobile Phone Lifestyle Index . October 2013 69
• ‘For banking including transfers & bill payment’ increased from 65% to 74% • ‘To buy things online’ increased from 67% to 77% • ‘To read or edit documents or files’ increased from 75% to 81%. Table 14 shows little change in the pattern of high-level use (at least 5 times a day plus at least once a day) between 2012 and 2013 across all uses of the tablet. However, with the exception of SMS use, the percentage of high-level users declined slightly (2-5%) across all types of use. There was between 12-23% increase in medium-level users (at least once week plus at least monthly, but not daily) of tablets for all uses except voice and SMS between 2012 and 2013. The greatest increase in medium level use related to banking (23% increase). There was little change in the pattern of low-level users (at least once every few months plus at least once a year) between 2012 and 2013 across all uses of the tablet. The most notable change in the percentage of low-level users was for banking (5% increase) and buying online (5% increase). The proportion of respondents reporting that they did not use the tablet for a particular use generally remained unchanged or declined. The only exception related to the use of the tablet for entertainment purposes, which showed a minor increase in the proportion of respondents indicating that they did not use the tablet for this purpose. The proportion of respondents who did not use the tablet for banking and buying things online declined by approximately 10%, indicating meaningful growth in the use of the tablet for these purposes.

AIMIA . The Australian Mobile Phone Lifestyle Index . October 2013 70
MOBILE PHONE USE COMPARED TO TABLET USE
A comparison of mobile phone use compared to tablet use was carried out. Figures 63 shows the overall mobile phone and tablet use by respondents in the last 12 months. Figure 64 provides a comparison of frequent mobile phone use and frequent tablet use. In this instance, frequent is defined as those that used the phone for that given purpose at least weekly. At least weekly was calculated by summing together the percentages of respondents that used the mobile phone for the given purpose at least five times a day, at least once a day and at least once a week.
Figure 65 shows the use of applications versus websites among tablet owners compared to mobile phone owners.
Figure 63: Overall Mobile Phone Use Compared To Tablet Use In The Last 12 Months
Figure 64: Frequent Mobile Phone Use Compared To Frequent Tablet Use (Frequent is defined as those that used the phone for that given purpose at least weekly)
Overall Mobile Phone Use Compared to Tablet Use in the Last 12 Months - 2013
0%
10%
20%
30%
40%
50%
60%
70%
80%
90%
100%
81%77%
74%
98%92%
96%
88%
28%
43%
62%
55%
66%
86%82%
87%
79%
99%98%
PERC
ENTA
GE O
F RE
SPON
DENE
TS
Mobile Phone - Some use in the last 12 monthsTablet - Some use in the last 12 months
VOICE CALLS TO SEND AND RECEIVE EMAILS
SMS (TEXTING) FOR ENTERTAINMENT PURPOSES
TO GETINFORMATION
TO VISIT WEBSITES &/OR BROWSE OR SEARCH THE INTERNET
FOR BANKING INCLUDING TRANSFERS & BILL PAYMENTS
TO READ OR EDIT DOCUMENTS OR FILES
TO BUY THINGSONLINE
118Frequent Mobile Phone Users Compared to Frequent Tablet User (Frequent is defined as those that used the feature/function at least weekly)
0%
10%
20%
30%
40%
50%
60%
70%
80%
90%
100%
57%
33%
49%
91%
83%87%
73%
14%15%
38%
21%
51%
77%71%
80%
70%
95%94%
PERC
ENTA
GE O
F RE
SPON
DENT
S
Mobile Phone Tablet
VOICE CALLS TO SEND AND RECEIVE EMAILS
SMS (TEXTING) FOR ENTERTAINMENT PURPOSES
TO GETINFORMATION
TO VISIT WEBSITES &/OR BROWSE OR SEARCH THE INTERNET
FOR BANKING INCLUDING TRANSFERS & BILL PAYMENTS
TO READ OR EDIT DOCUMENTS OR FILES
TO BUY THINGSONLINE
119

AIMIA . The Australian Mobile Phone Lifestyle Index . October 2013 71
Figure 65: Use Of Websites Versus Applications On Mobile Phones Compared To Tablets
CommentsA higher percentage of respondents have used the tablet for most of the listed range of purposes “in the last 12 months”. Not surprisingly, the only exceptions were voice calls and texting.
A closer analysis of frequent mobile phone users and frequent tablet users (at least once a week) revealed a similar overall pattern of at use (excluding voice and SMS). However, the percentage of frequent users accessing the listed services was again consistently higher on the tablet, compared to the mobile phone.
Almost all tablet owners (99%) are using websites and/or applications compared to 87% of mobile phone users suggesting that there are some differences in how these devices are used. Of particular interest is that websites are just, if not more popular, than applications among tablet owners. Only:
• 1% use applications only on tablets, compared to 4% on mobile phones • 15% use ‘mostly applications and some websites’ on tablets, compared to 25% on mobile phones.
Use of Applications Versus Websites on the Mobile Phone Compared to the Tablet
0%
10%
20%
30%
40%
50%
1%
5%
40%38%
15%
1%
13%
4%
26%29%
25%
4%
PERC
ENTA
GE O
F RE
SPON
DENT
S
Mobile Phones Tablet
APPLICATIONS ONLY
MOSTLY APPLICATIONS & SOME WEBSITES
ABOUT THE SAME USE OF APPLICATIONS & WEBSITES
MOSTLY WEBSITES & SOME APPLICATIONS
DON’T USE WEBSITES OR APPLICATIONS
WEBSITES ONLY
120

AIMIA . The Australian Mobile Phone Lifestyle Index . October 2013 72
PERCEIVED IMPACT OF TABLETS ON MOBILE PHONE USE
Finally, respondents were asked whether as a result of purchasing their tablet their use of their mobile phone stayed the same, increased or decreased across a list of phone functions. Figure 66 illustrates the results for 2013, while Figure 67 shows the results from the 2012 Survey.
Figure 66: Perceived Impact Of Tablets On Mobile Phone Use – 2013 results
Figure 67: Perceived Impact Of Tablets On Mobile Phone Use – 2012 Results
Impact of Purchasing A Tablet on Mobile Phone Uses - 2013
0%
10%
20%
30%
40%
50%
60%
70%
80%
90%
100%
29%21%
15%
32%32%30%22%
4%2%
43%47%55%
48%48%51%59%
89%90%
4%6%4%
8%6%7%5%
2%1%
2%2%2%
1%1%1%1%
2%2%22%24%24%
11%13%10%12%4%4%
PERC
ENTA
GE O
F RE
SPON
DENT
S
I do not use my phone for this purposeMy mobile phone use has changed but not as a result of buying a tabletMy mobile phone use increased because of buying a tabletMy mobile phone use stayed the same because of buying a tabletMy mobile phone use decreased because of buying a tablet
VOICE CALLS SMS (TEXTING) TO SEND & RECEIVE EMAILS
TO GET INFORMATION
FOR ENTERTAINMENTPURPOSES
TO VISIT WEBSITES &/OR BROWSE OR SEARCH THE INTERNET
TO BUY THINGSONLINE
FOR BANKING INCLUDING TRANSFERS & BILL PAYMENT
TO READ OR EDITDOCUMENTS ORFILES
Impact of Purchasing A Tablet on Mobile Phone Uses - 2012
0%
10%
20%
30%
40%
50%
60%
70%
80%
90%
100%
23%17%17%
34%33%32%24%
4%3%
41%50%45%
41%42%44%53%86%87%
8%5%7%
13%12%13%9%
3%3%
1%2%2%
2%1%2%2%
3%2%
26%26%30%
10%12%10%13%4%5%
PERC
ENTA
GE O
F RE
SPON
DENT
S
I do not use my phone for this purposeMy mobile phone use has changed but not as a result of buying a tabletMy mobile phone use increased because of buying a tabletMy mobile phone use stayed the same because of buying a tabletMy mobile phone use decreased because of buying a tablet
VOICE CALLS SMS (TEXTING) TO SEND & RECEIVE EMAILS
TO GET INFORMATION
FOR ENTERTAINMENTPURPOSES
TO VISIT WEBSITES &/OR BROWSE OR SEARCH THE INTERNET
TO BUY THINGSONLINE
FOR BANKING INCLUDING TRANSFERS & BILL PAYMENT
TO READ OR EDITDOCUMENTS ORFILES

AIMIA . The Australian Mobile Phone Lifestyle Index . October 2013 73
CommentsThe impact of the introduction of the tablet on different aspects of mobile phone use was first considered in the 2012 survey. Respondents were asked the same questions again in the 2013 Survey to determine whether tablet ownership has continued to impact on mobile phone use and whether the impact has changed given that it was expected there would be an increase in tablet ownership since 2012.
Although tablet ownership has increased from 38 per cent of respondents in 2012 to 56 per cent of respondents in 2013, figures 66 and 67 shows that the profile of impact on phone use remains quite similar. While there is some impact of tablet purchase affecting mobile phone use (either increasing or decreasing) the percentage of respondents whose phone use is unaffected (stayed the same) by the purchase of a tablet has increased. This suggests that mobile phones and tablets may eventually become complementary devices for the type of uses listed.

AIMIA . The Australian Mobile Phone Lifestyle Index . October 2013 74
SECTION 8: SPECIAL TOPIC ! MOBILE RETAIL
In this section of the report the findings relating to this year’s special topic questions regarding mobile retail are presented. These findings include the following:
• Purchases made on the mobile phone by respondents • Number and type of purchases made on their mobile phones • Purchases made on the mobile phone from an overseas business • Change in the number of in-store purchases since respondents started making purchases on their mobile phones • Expected future purchasing behaviour by respondents on their mobile phones • Overall experience of making a purchase on their mobile phone • Role of the mobile phone in the purchase decision • Response to the overall idea of buying things using their mobile phone.
PURCHASES MADE ON THE MOBILE PHONE
More than half of the respondents (54%) made a successful purchase on their mobile in the last 12 months. The methods these respondents used to make these purchases are summarised in Figure 68.
Figure 68: How Respondents Pay For Purchases Made On Their Mobile Phone (as a percentage of those who bought things using their phone)
CommentsUsing a ‘credit card or debit card’ was the most popular method that respondents used to pay for purchases made on the mobile phone (63%), followed by the use of ‘payPal’ (52%) and an ‘Apple iTunes account’ (48%).
How Respondents Pay For Purchases Made On Their Mobile Phone (As a percentage of those that buy things on their phone)
0%
9%
18%
26%
35%
44%
53%
61%
70%
6%
63%
48%52%
10%
PERC
ENTA
GE O
F RE
SPON
DENT
S
THEY HAVE APPEARED ON MY MOBILE PHONE BILL
126
USING PAYPAL ON MY MOBILE PHONE
USING MY APPLE ITUNES ACCOUNT
USING A CREDIT CARD OR DEBIT CARD
OTHER METHOD OF PAYMENT

AIMIA . The Australian Mobile Phone Lifestyle Index . October 2013 75
TYPE AND NUMBER OF PURCHASES MADE ON THEIR MOBILE PHONE
Respondents were asked to select the type of purchases they had made on their mobile phone. The responses are shown in Figure 69. Respondents were then asked to indicate the number of purchases they had made in the last month. These results are shown in Figure 70.
Figure 69: Type Of Purchases Made On The Mobile Phone
Figure 70: Number Of Purchases Made On The Mobile Phone In The Last Month
CommentsOf those respondents that had made purchases on their mobile phone, 65% had purchased Digital content for their mobile phone (e.g. ringtones, video clips, music, apps, games). This was clearly the most popular type of content purchased for the mobile phone, followed by tickets (53%). The purchase of books’ (34%) and ‘clothes, shoes and jewellery’ (32%) ranked a distant third and fourth in the type of content purchased by respondents on their phones.
Almost a quarter of the respondents who had made purchases on their mobile phone, had made more than 5 purchases in the last month. Just under half (45%) had made between 2-5 purchases on their mobile phone in the last month. This suggests that while phone users are using their phones to make purchases the number of transactions is still relatively few.
Type of Purchases Respondents Have Made On Their Mobile Phone
DIGITAL CONTENT FOR MY MOBILE PHONE
TICKETS (E.G. MOVIE, PLANE TICKETS )
BOOKS
CLOTHES SHOES AND JEWELLERY
CONSUMER ELECTRONICS (E.G.DVD PLAYER)
SERVICES (E.G. INSURANCE GARDENING)
DVDS
TOYS
GROCERIES
OTHER
0% 10% 20% 30% 40% 50% 60%
9%
6%
9%
10%
12%
19%
32%
34%
53%
65%
PERCENTAGE OF RESPONDENTS
127
Number of Purchases Respondents Have Made On Their Mobile Phone In The Last Month
0%
6%
13%
19%
25%
31%
38%
44%
50%
12%
3%2%4%
15%
45%
19%
PERC
ENTA
GE O
F RE
SPON
DENT
S
1 PURCHASE ONLY
128
2 TO 5 PURCHASES 11-15 PURCHASES6 TO 10 PURCHASES GREATER THAN 20 PURCHASES16 TO 20 PURCHASES NONE

AIMIA . The Australian Mobile Phone Lifestyle Index . October 2013 76
PURCHASES MADE ON THE MOBILE PHONE FROM AN OVERSEAS BUSINESS
Respondents were asked to specify the percentage of purchases (using a slide scale with 5% increments) they had made in the last 6 months that were from an overseas business. Their responses are shown in Figure 71.
Figure 71: Percent Of Purchases Made On The Mobile Phone From An Overseas Business In The Last 6 Months
CommentsThe majority of respondents claimed that the purchases they made on the mobile phone in the last 6 months were mainly from Australian businesses. Of particular interest is that 44% of respondents stated that they did not make any purchases from an overseas business in the last 6 months.
The Pareto principle, more commonly referred to as the 80:20 rule can also be applied to the results. Of those respondents who made purchases on their mobile phone, 80% made 50% or less purchases from an overseas business, while 20% claimed they had made 55 or more of their purchases from an overseas business. So from the perspective of overseas businesses, they can expect that 20% of Australians that purchase on the mobile phone, to buy the majority of their online purchases from overseas businesses. Conversely, domestic businesses can expect that 80% of Australians making online purchases via their mobile phones will make the majority of their purchases from domestic businesses.
Percent of Purchases Made By Respondents In The Last 6 Months That Are From An Overseas Business
0%
6%
13%
19%
25%
31%
38%
44%
50%
10%10%16%
20%
44%
PERC
ENTA
GE O
F RE
SPON
DENT
S
0 PERCENT - NO PURCHASES WERE MADE FROM AN OVERSEAS BUSINESS
129
30 TO 50 PERCENT5 TO 25 PERCENT 80 TO 100 PERCENT55 TO 75 PERCENT
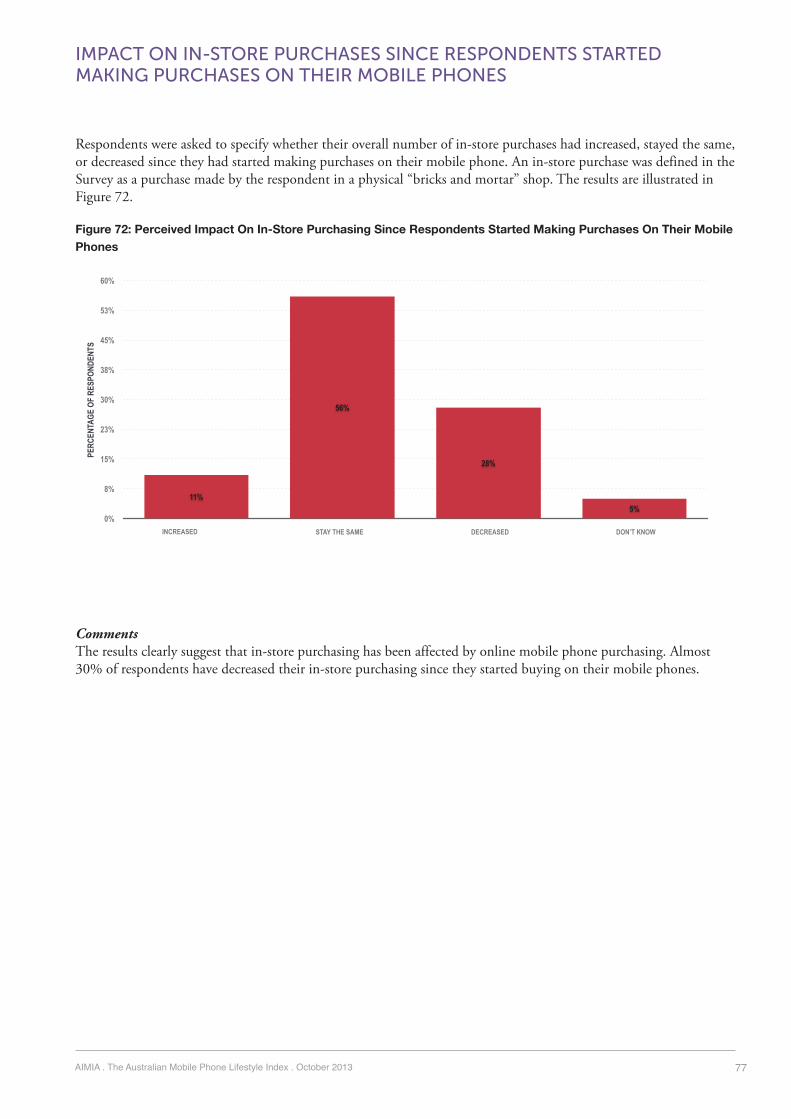
AIMIA . The Australian Mobile Phone Lifestyle Index . October 2013 77
IMPACT ON IN-STORE PURCHASES SINCE RESPONDENTS STARTEDMAKING PURCHASES ON THEIR MOBILE PHONES
Respondents were asked to specify whether their overall number of in-store purchases had increased, stayed the same, or decreased since they had started making purchases on their mobile phone. An in-store purchase was defined in the Survey as a purchase made by the respondent in a physical “bricks and mortar” shop. The results are illustrated in Figure 72.
Figure 72: Perceived Impact On In-Store Purchasing Since Respondents Started Making Purchases On Their Mobile Phones
CommentsThe results clearly suggest that in-store purchasing has been affected by online mobile phone purchasing. Almost 30% of respondents have decreased their in-store purchasing since they started buying on their mobile phones.
Perceived Impact on In-Store Purchasing Since Respondents Started Making Purchases On Their Mobile Phones
0%
8%
15%
23%
30%
38%
45%
53%
60%
5%
28%
56%
11%
PERC
ENTA
GE O
F RE
SPON
DENT
S
INCREASED
130
DECREASEDSTAY THE SAME DON’T KNOW

AIMIA . The Australian Mobile Phone Lifestyle Index . October 2013 78
THE FUTURE BEHAVIOUR OF RESPONDENTS IN THE USE OF THE MOBILE PHONE FOR PURCHASING
Respondents were asked to specify whether they thought the number of purchases they made on the mobile phone would increase, stay the same or decrease. The results are shown in Figure 73.
Figure 73: Profile Of Likely Purchase Behaviour Occurring On The Mobile Phone In The Next 6 Months
CommentsThe positive news for online retailers is that almost 40% of respondents currently using the mobile phone for purchasing believe that the number of purchases they make on their phone will increase in the next 6 months. Only 5% of respondents said they think their purchases will decrease, with just over half believing their number of purchases will remain the same.
In The Next 6 Months Respondents Believe The Number of Purchases Made On Their Mobile Phones Will...
0%
8%
15%
23%
30%
38%
45%
53%
60%
4%5%
54%
38%
PERC
ENTA
GE O
F RE
SPON
DENT
S
INCREASE
131
DECREASESTAY THE SAME DON’T KNOW

AIMIA . The Australian Mobile Phone Lifestyle Index . October 2013 79
OVERALL EXPERIENCE OF MAKING A PURCHASE ON THE MOBILE PHONE
Respondents who had made a successful purchase on the mobile phone were also asked to describe their overall experience of making purchases on their mobile phone. The results are illustrated in Figure 74.
Figure 74: Overall Experience Of Making Purchases On The Mobile Phone
CommentsThe results clearly suggest that for most respondents the experience of making a purchase on their mobile phone has been positive. Almost 80% said that they were “very satisfied” or “somewhat satisfied” with the experience and only 5% were either somewhat dissatisfied or very dissatisfied with the experience.
Overall Experience of Making Purchases On The Mobile Phone
0%
6%
13%
19%
25%
31%
38%
44%
50%
1%4%
17%
49%
30%
PERC
ENTA
GE O
F RE
SPON
DENT
S
VERY SATISFIED
132
NEITHER SATISFIED OR DISSATISFIEDSOMEWHAT SATISFIED SOMEWHAT DISSATISFIED VERY DISSATISFIED

AIMIA . The Australian Mobile Phone Lifestyle Index . October 2013 80
ROLE OF THE MOBILE PHONE IN THE PURCHASE DECISION
Apart from making purchases on the mobile phone, the mobile phone is also believed to play a role in the decision to make a purchase. The purchase may then end up being made on the phone or in-store. Two behaviours relating to the role of the mobile in the purchase decision were explored in this survey, namely the use of the mobile phone: • To compare prices online before making a purchase • To look at product or service reviews before making a purchase decision.
All respondents were asked these questions, regardless of whether or not they had made a successful purchase on their mobile phone. The results are shown in Figure 75.
Figure 75: Role Of The Mobile Phone In The Purchase Decision
CommentsThe overall pattern of use and frequency of use for both behaviours related to the use of the mobile phone in the purchase decision are very similar. Just over 60% of respondents used the mobile phone to compare prices online (64%) and look at product or service reviews (67%) before making a purchase decision in the last 12 months.
Also of interest is that around 30% of respondents frequently used the mobile phone to compare prices and look at product or services reviews before making a decision. Frequently in this instance was defined as at least 5 times a day plus at least once a day plus at least once a week.
Thus, it is evident that the mobile phone is not only a platform for making the actual purchase, but is also important for many consumers in aiding their purchase decisions.
The Use of the Mobile Phone in the Purchase Decision
0%
10%
20%
30%
40%
50%
33%
5%
9%
20%22%
10%
1%
36%
5%
9%
20%20%
8%
2%
PERC
ENTA
GE O
F RE
SPON
DENT
S
To Compare Prices Online Before Making A Purchase DecisionTo Look At Product Or Service Reviews Before Making A Purchase Decision
133
AT LEAST ONCE A DAY
AT LEAST 5 TIMES A DAY
AT LEAST ONCE A WEEK
AT LEAST ONCE A MONTH
AT LEAST ONCE EVERY FEW MONTHS
AT LEAST ONCE A YEAR
NOT AT ALL IN THE LAST 12 MONTHS

AIMIA . The Australian Mobile Phone Lifestyle Index . October 2013 81
RESPONSE TO THE OVERALL IDEA OF BUYING THINGS ONLINE
All respondents were asked, regardless of whether or not they had made a successful purchase on their mobile phone what they thought of the overall idea of buying things online on their mobile phone. The results are shown in Figure 76.
Figure 76: Response To The Overall Idea Of Buying Things Online
CommentsAbout half of the respondents (49%) ‘really like’ or ‘like’ the idea of buying things online using their mobile phone, while a further 25% are neutral, neither liking or disliking the idea. The most challenging group for industry will most likely to be the 26% of respondents who are against the idea (really dislike or dislike it). The effort required to educate and change a mindset can often be timely and costly. On the positive side, however, those that are making purchases on their mobile phones are satisfied with the experience, which suggests that the available payment models are meeting the requirements of consumers and that once a consumer does make the decision to purchase on their phone they may actually change their mind.
Response To Overall Idea of Buying Things Online On Your Mobile Phone
0%
10%
20%
30%
40%
13%13%
25%
30%
19%
PERC
ENTA
GE O
F RE
SPON
DENT
S
REALLY LIKE IT LIKE IT NEITHER LIKE THE IDEA OR DISLIKE IT
134
DON’T LIKE IT REALLY DON’T LIKE IT

AIMIA . The Australian Mobile Phone Lifestyle Index . October 2013 82
SECTION 9: LOOKING AT MOBILITY MORE BROADLY
In this year’s survey a question was asked that explored the notion of mobility more broadly. Respondents were asked if they currently owned or planned to purchase a wearable technology device. Some examples were provided in the survey to provide context, such as a Nike Fuel Band, Smart Watch and Google Glasses, which have attracted considerable media attention and coverage in the last year.
The results of this question are shown in Figure 77.
Figure 77: Ownership Or Planned Purchase Of A Wearable Technology In The Next 12 Months
CommentsThe results clearly suggest that wearable technologies are still very much an emerging and unknown reality for most respondents. Only 5% of respondents stated they owned a wearable technology device. However, 17% stated that they planned to purchase such a device in the next 12 months – 5% in the next 6 months and 12% in the next 12 months. Based on these figures the ownership of wearable technology device will be around 10% in February 2014 and 22% in September 2014.
How these mobile devices interact and affect the use of mobile phones in the future will be an area of potential interest for all businesses that rely upon using the mobile phone to interact with their customers or clients.
Ownership or Planned Purchase of A Wearable Technology in the Next 12 Months
0%
9%
18%
26%
35%
44%
53%
61%
70%
12%
65%
12%5%5%
PERC
ENTA
GE O
F RE
SPON
DENT
S
YES, I CURRENTLY OWN A WEARABLE TECHNOLOGY DEVICE
136
NO, BUT I PLAN TO BUY ONE IN THE NEXT 6 MONTHS DON’T KNOWNO, BUT I PLAN TO BUY ONE
IN THE NEXT 12 MONTHS NO, I DON’T NEED ONE

AIMIA . The Australian Mobile Phone Lifestyle Index . October 2013 83
FOR MORE INFORMATION
For more information about:
• The report • Becoming a sponsor of the 2014 survey • The option of additional analysis of the AMPLI data to meet your specific needs.
Please contact:
Dr Marisa Maio MackayDirector, Complete the Picture ConsultingPhone: +61 430 933 307 Email: [email protected]
Or the
AIMIA National Office on (02) 9248 7900
AIMIA AMPLI SURVEY
OFFICIAL RESEARCH PARTNER:
Related Documents