GEOLOGICAL SURVEY OF ALABAMA Berry H. (Nick) Tew, Jr. State Geologist GEOLOGIC AND WATER INVESTIGATIONS PROGRAMS Compilation, Assessment, and Characterization of Available Mercury Data from Natural Materials in Baldwin, Clarke, Mobile, Monroe, and Washington Counties, Alabama OPEN-FILE REPORT 0702 By Sandy M. Ebersole, Robert E. Meintzer, and Shinisha L. Perry Tuscaloosa, Alabama June 2007 Submitted in partial fulfillment of U.S. Environmental Protection Agency, Gulf of Mexico Program, Agreement No. MX974830-03-0.

Welcome message from author
This document is posted to help you gain knowledge. Please leave a comment to let me know what you think about it! Share it to your friends and learn new things together.
Transcript

GEOLOGICAL SURVEY OF ALABAMA
Berry H. (Nick) Tew, Jr. State Geologist
GEOLOGIC AND WATER INVESTIGATIONS PROGRAMS
Compilation, Assessment, and Characterization of Available Mercury Data from Natural Materials in Baldwin, Clarke, Mobile, Monroe, and
Washington Counties, Alabama
OPEN-FILE REPORT 0702
By Sandy M. Ebersole, Robert E. Meintzer, and Shinisha L. Perry
Tuscaloosa, Alabama June 2007
Submitted in partial fulfillment of U.S. Environmental Protection Agency, Gulf of Mexico Program, Agreement No. MX974830-03-0.

CONTENTS Page
Introduction ............................................................................................................................ 1
Acknowledgments.................................................................................................................. 3
Project definition .................................................................................................................... 3
Study area.............................................................................................................................. 4
Methodology and results........................................................................................................ 10
Data used in this study............................................................................................... 10
Statistical and spatial analyses .................................................................................. 16
Surface-water data analyses...................................................................................... 16
Sediment-data analyses............................................................................................. 22
Soil-data analyses...................................................................................................... 24
Fish-data analyses ..................................................................................................... 26
Atmospheric deposition.............................................................................................. 29
High contamination level points from all materials ..................................................... 33
Discussion and future research ............................................................................................. 35
Water.......................................................................................................................... 35
Sediment .................................................................................................................... 35
Soil ............................................................................................................................. 36
Atmospheric deposition.............................................................................................. 36
Fish ............................................................................................................................ 36
Mussels ...................................................................................................................... 37
Methylmercury............................................................................................................ 37
Conclusions ........................................................................................................................... 37
References cited .................................................................................................................... 38
FIGURES
Figure 1. The study area, including Baldwin, Clarke, Mobile, Monroe, and Washington Counties,
Alabama................................................................................................................................. 2
Figure 2. Mercury contamination of aquatic ecosystems...................................................... . 4
Figure 3. Sites on the 2005 superfund list, EPA Toxic Release Inventory facilities with reported
mercury releases in 2004, streams on the 2004 ADEM 303(d) list due to elevated mercury
levels, and streams on the 2005 - 2006 fish advisory list due to elevated mercury levels in fish 6
i

Figure 4. Point locations of all freshwater and saltwater data collected for this project ......... 17
Figure 5. Categorization of freshwater and saltwater data by EPA water-quality criteria for years
1970 - 2006............................................................................................................................ 18
Figure 6. Categorization of freshwater data by EPA water-quality criteria for years 1995 -
2006…. .................................................................................................................................. 19
Figure 7. Categorization of freshwater and saltwater data by ADEM 2004 water-quality criteria
as listed in regulation 305(b) for years 1970 - 2006…. .......................................................... 20
Figure 8. Categorization of freshwater data by ADEM 2004 water-quality criteria as listed in
regulation 305(b) for years 1995 - 2006................................................................................. 21
Figure 9. Sediment data categorized by biological effects levels for all years....................... 23
Figure10. Soil data categorized by EPA ecological-screening values ................................... 25
Figure 11. Fish data (whole body only) categorized by biological effects levels.................... 27
Figure 12. Fish data (fillet only) for all years, categorized by EPA’s risk-based consumption
limits for noncarcinogenic human health endpoints ............................................................... 28
Figure 13. Location of the two MDN monitoring sites within the study area .......................... 30
Figure 14. 2005 Mercury deposition from rainfall................................................................... 31
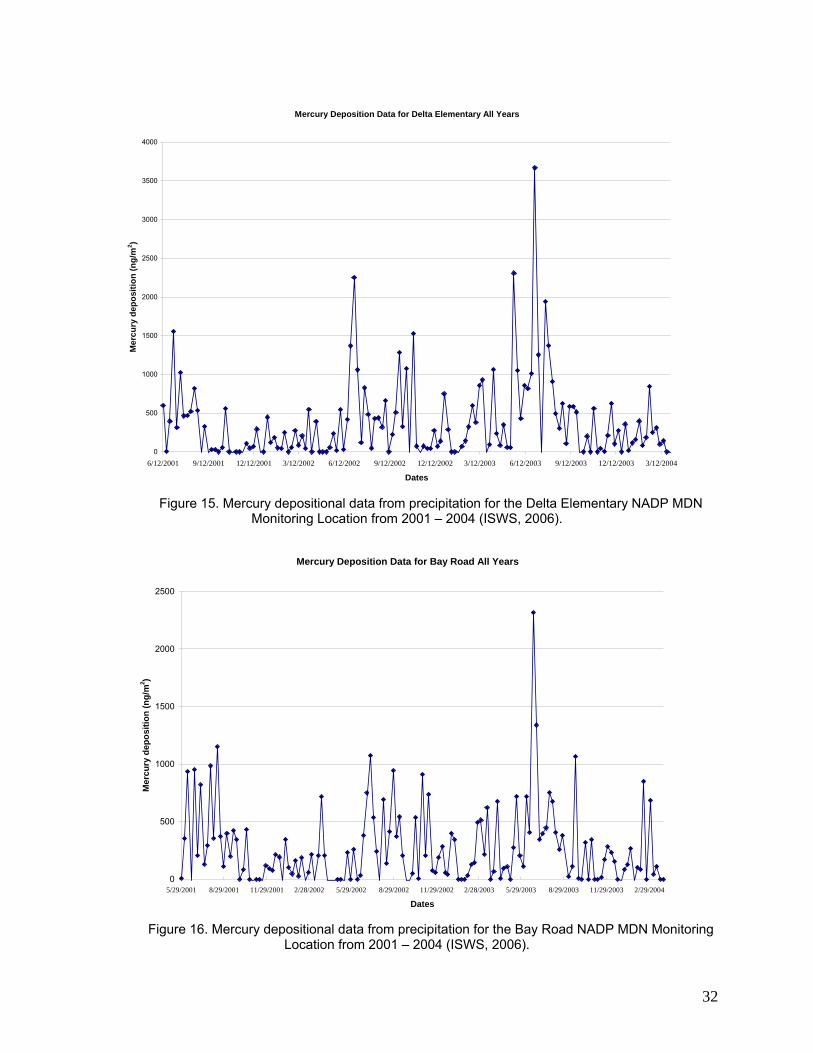
Figure 15. Mercury depositional data from precipitation for the Delta Elementary NADP MDN
Monitoring Location from 2001 - 2004 ................................................................................... 32
Figure 16. Mercury depositional data from precipitation for the Bay Road NADP MDN Monitoring
Location from 2001 - 2004 ..................................................................................................... 32
Figure 17. Location of high-contamination areas from combined results .............................. 34
TABLES
Table 1. Streams and rivers on the 2005 - 2006 fish consumption advisory list due to elevated
mercury levels........................................................................................................................ 7
Table 2. Streams and water bodies on the ADEM 2004 303(d) streams list due to mercury
contamination......................................................................................................................... 8
Table 3. Facilities reporting releases of mercury in pounds to the EPA’s Toxic Release Inventory
Program in 2004 .................................................................................................................... 9
ii

Table 4. Studies grouped by material type ............................................................................ 15
Table 5. Percentile data distribution among water-quality criteria threshold levels for mercury
(percentages based on data for all years, 1970 - 2006) ….................................................... 22
Table 6. Percentile data distribution among water-quality criteria threshold levels for mercury
(percentages based on data for all years, 1995 - 2006) ........................................................ 22
Table 7. Freshwater and saltwater statistics for mercury by threshold level.......................... 24
Table 8. Percentages of the total fish data used in this study, categorized by noncancer health
endpoints ............................................................................................................................... 29
iii

INTRODUCTION
The occurrence of mercury-contaminated fish in the five-county study area has
been reported in print and broadcast media, which has resulted in numerous inquiries to
various local, state, and federal agencies involved in public health and environmental
protection, and a public discussion (The Mercury Forum held in May 2005 in Mobile).The
purpose of this study is to compile, characterize, and spatially assess mercury data
collected from natural materials (soil, sediment, surface water, fish, and atmospheric
deposition) as part of various studies and projects from multiple entities. The study
provides a source of information on environmental mercury occurrence for local, state,
and federal agencies and entities — particularly those involved in environmental
assessment and management — various non-governmental organizations, and others
interested in coastal issues in Alabama.
This project was conducted by personnel in the Geochemical Laboratory (Water
Investigations Program) and the Geologic Investigations Program at the Geological
Survey of Alabama (GSA) to assess mercury occurrence within Baldwin, Clarke, Mobile,
Monroe, and Washington Counties, Alabama (fig. 1). The study was based on data from
ongoing studies as well as from past studies that were available from the literature.
Through statistical and spatial analyses of the collected data (samples from 30 different
studies), this research explores the overall mercury distribution in the five-county study
area and the Mobile River drainage basin. In addition to the aforementioned data, a
background review and a map showing superfund sites, U.S. Environmental Protection
Agency (EPA) Toxic Release Inventory (TRI) facilities releasing mercury, and
mercury-contaminated water bodies within the study area are included in this report.
Concluding the descriptions of the methodology and results section, recommendations
are given for future studies.
1

Figure 1. The study area, including Baldwin, Clarke, Mobile, Monroe, and Washington Counties,
Alabama.
2

This project was not designed to identify point sources of mercury from the data
collected. Significant limitations to interpretation of the results of the analyses in this project
include small sample size relative to study area, low sample density across the five counties,
and clustered spatial distribution. These shortcomings should be noted prior to using any of the
maps in this report for identifying contaminated regions or ruling out areas that may or may not
be contaminated. This project provides only a spatial assessment of mercury levels in data
collected for multiple years and may not reflect current mercury levels and distribution.
ACKNOWLEDGMENTS
Review of project deliverables was principally performed by Michel L. Gielazyn (National
Oceanic and Atmospheric Administration coastal resources coordinator), Fred Kopfler (retired
EPA Gulf of Mexico Program senior environmental scientist), Pete Tuttle (U.S. Fish and Wildlife
Service resource contaminant specialist), and Alabama Department of Environmental
Management staff.
PROJECT DEFINITION
Each year the Agency for Toxic Substances and Disease Registry (ATSDR) produces a
list of toxic substances ranked by a combination of three attributes: frequency, toxicity, and
potential for human exposure. The 2005 Comprehensive Environmental Response,
Compensation, and Liability Act (CERCLA) Priority List of Hazardous Substances ranked
mercury third behind lead and arsenic (ATSDR, 2005). Moreover, over the past several years, a
number of articles have appeared in the media expressing concern over mercury in coastal
Alabama.
There are three sources of mercury in the environment: the natural release of mercury
from geologic material, anthropogenic releases, and re-emission to the atmosphere from
mercury deposited on the earth’s surface in the past. As mercury moves through its
biogeochemical cycles (fig. 2), it may come in contact with or be absorbed by plants and
ingested by animals. In its elemental or inorganic forms, mercury is poorly absorbed by higher
animals. However, inorganic forms of mercury may be transformed by bacteria and other
chemical processes to methylated forms that are easily and readily absorbed by all life forms,
including humans. Over time, the methylmercury can accumulate in organisms from both biotic
and abiotic sources (bioaccumulation) and the concentrations become more elevated in
organisms of higher trophic levels (biomagnification) (Arctic Monitoring Assessment
3

Programme, 1998). Mercury can be lethal or sublethal to exposed organisms depending on the
concentration or dose. In animals from fish to mammals, death can result from levels as low as
100 to 500 parts per billion (ppb) body weight per day. Current reference level for sublethal
effects is 100 ppb body weight per day (Moore, 2000). Mercury is a known neurotoxin in
humans, and effects include decreased motor skills, tremors, the inability to walk, convulsions,
and death (Center for Disease Control, 2005).
Figure 2. Mercury contamination of aquatic ecosystems (USGS, 1995a).
STUDY AREA
The study area for this project includes the Mobile-Tensaw River Delta, Mobile Bay, and
adjacent areas in Baldwin, Clarke, Mobile, Monroe, and Washington Counties, Alabama (fig. 1).
The Mobile-Tensaw River Delta is part of the Mobile Bay Estuary System, a coastal transition
zone between the Mobile Bay watershed and the Gulf of Mexico. Terminal portions of the
Mobile and Tensaw Rivers are in the Mobile Delta, and the rivers branch into a series of
distributary channels, emergent delta lobes, levees, and interdistributary bays (Hummell and
Parker, 1995). Mobile Bay is a submerged alluvial valley located at the terminus of the Mobile-
Tensaw River Delta system. The Mobile Bay watershed is the nation’s sixth largest river system
in total drainage area and first in ratio of discharge to area (Isphording and others, 1985). The
area is a dynamic, complex system temporally affected by tidal influx, salinity variations, and
4

freshwater inflow and discharge. The study area is home to diverse aquatic ecosystems such as
freshwater tributaries to Mobile Bay, which contains 131 species of fishes, 30 of which are
marine (Mettee and others, 1996).
The study area includes state parks, national wildlife refuges, wetlands, a national
estuarine research reserve, and abundant fishery and wildlife resources. Boating, fishing,
hunting, hiking, camping, and other forms of outdoor recreation are popular in the area. A study
performed for the Mobile Bay National Estuary Program (MBNEP) concluded that the MBNEP
area is associated with about $3 billion of economic expenditures each year for seafood,
saltwater sport fishing, and other industries (Chang and Canode, 1999). Natural resources
found in and produced from the area include timber, oysters, shrimp, sand, gravel, shell
deposits, and oil and natural gas. Natural gas processing is a major industry in southern Mobile
County. The manufacture of chemicals is also a significant industry, particularly along the
western side of the Mobile-Tensaw River Delta and Mobile Bay.
The environmental health of ecosystems within the study area is impacted by urban and
industrial activities (fig. 3). There are a number of threatened or endangered species in the
study area, including the gulf sturgeon, wood stork, bald eagle, Alabama red-bellied turtle, and
inflated heelsplitter and heavy pigtoe mussels. There are six sites within the study area that are
on the EPA’s National Priorities List (NPL) (sites with known releases or threatened releases of
hazardous substances, pollutants, or contaminants), also referred to as superfund sites (fig. 3).
Those NPL sites include a ground-water contamination site at Perdido; Redwing Carriers,
Incorporated, at Saraland; Stauffer Company at LeMoyne; Stauffer Company at Cold Creek;
Olin Corporation at McIntosh; and Ciba-Geigy Corporation at McIntosh (EPA, 2006a). Twenty-
four stream and river segments in the five-county region are listed by the Alabama Department
of Public Health (ADPH) as having fish consumption advisories due to elevated mercury levels
in fish (table 1) (ADPH, 2006). In addition to these streams with fish advisories, 51 other stream
and river segments are listed on the Alabama Department of Environmental Management
(ADEM) 2004 303(d) list (water bodies that currently do not meet water-quality standards)
(ADEM, 2006) . Of those 51, 24 are listed as having mercury contamination as the primary or
secondary cause for that water body segment to be placed on the 303 (d) list (table 2) (ADEM,
2006). There were eight facilities reporting releases of mercury or mercury compounds to the
EPA’s Toxic Release Inventory (TRI) Program (table 3) in 2004 (EPA, 2006b).
5

Figure 3. Sites on the 2005 superfund list (EPA, 2006a), EPA Toxic Release Inventory (TRI) facilities with reported mercury releases in 2004 (EPA, 2006b), streams on the 2004 ADEM 303(d) list due to elevated mercury levels (ADEM, 2006), and streams on the 2005-2006 fish advisory list due to elevated mercury
levels in fish (ADPH, 2006).
6
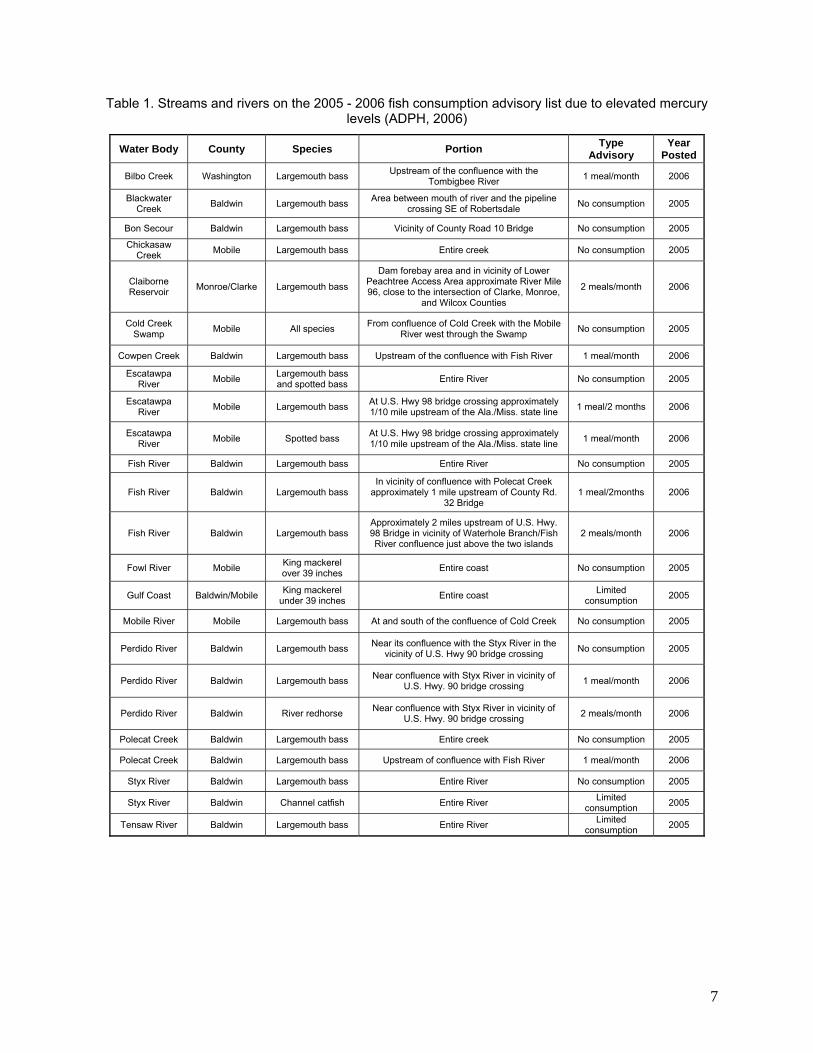
Table 1. Streams and rivers on the 2005 - 2006 fish consumption advisory list due to elevated mercury levels (ADPH, 2006)
Water Body County Species Portion Type Advisory
Year Posted
Bilbo Creek Washington Largemouth bass Upstream of the confluence with the Tombigbee River 1 meal/month 2006
Blackwater Creek Baldwin Largemouth bass Area between mouth of river and the pipeline
crossing SE of Robertsdale No consumption 2005
Bon Secour Baldwin Largemouth bass Vicinity of County Road 10 Bridge No consumption 2005
Chickasaw Creek Mobile Largemouth bass Entire creek No consumption 2005
Claiborne Reservoir Monroe/Clarke Largemouth bass
Dam forebay area and in vicinity of Lower Peachtree Access Area approximate River Mile 96, close to the intersection of Clarke, Monroe,
and Wilcox Counties
2 meals/month 2006
Cold Creek Swamp Mobile All species From confluence of Cold Creek with the Mobile
River west through the Swamp No consumption 2005
Cowpen Creek Baldwin Largemouth bass Upstream of the confluence with Fish River 1 meal/month 2006
Escatawpa River Mobile Largemouth bass
and spotted bass Entire River No consumption 2005
Escatawpa River Mobile Largemouth bass At U.S. Hwy 98 bridge crossing approximately
1/10 mile upstream of the Ala./Miss. state line 1 meal/2 months 2006
Escatawpa River Mobile Spotted bass At U.S. Hwy 98 bridge crossing approximately
1/10 mile upstream of the Ala./Miss. state line 1 meal/month 2006
Fish River Baldwin Largemouth bass Entire River No consumption 2005
Fish River Baldwin Largemouth bass In vicinity of confluence with Polecat Creek
approximately 1 mile upstream of County Rd. 32 Bridge
1 meal/2months 2006
Fish River Baldwin Largemouth bass Approximately 2 miles upstream of U.S. Hwy. 98 Bridge in vicinity of Waterhole Branch/Fish River confluence just above the two islands
2 meals/month 2006
Fowl River Mobile King mackerel over 39 inches Entire coast No consumption 2005
Gulf Coast Baldwin/Mobile King mackerel under 39 inches Entire coast Limited
consumption 2005
Mobile River Mobile Largemouth bass At and south of the confluence of Cold Creek No consumption 2005
Perdido River Baldwin Largemouth bass Near its confluence with the Styx River in the vicinity of U.S. Hwy 90 bridge crossing No consumption 2005
Perdido River Baldwin Largemouth bass Near confluence with Styx River in vicinity of U.S. Hwy. 90 bridge crossing 1 meal/month 2006
Perdido River Baldwin River redhorse Near confluence with Styx River in vicinity of U.S. Hwy. 90 bridge crossing 2 meals/month 2006
Polecat Creek Baldwin Largemouth bass Entire creek No consumption 2005
Polecat Creek Baldwin Largemouth bass Upstream of confluence with Fish River 1 meal/month 2006
Styx River Baldwin Largemouth bass Entire River No consumption 2005
Styx River Baldwin Channel catfish Entire River Limited consumption 2005
Tensaw River Baldwin Largemouth bass Entire River Limited consumption 2005
7

Table 2. Streams and water bodies on the ADEM 2004 303(d) streams list due to mercury contamination (ADEM, 2006)
Assessment Unit ID Waterbody Name River Basin County Uses Sources Downstream / Upstream Locations
AL03170008-0402-700 Collins Creek Escatawpa Mobile Fish & wildlife Unknown Big Creek / Its source
AL03170008-0402-400 Boggy Branch Escatawpa Mobile Fish & wildlife Natural Big Creek Lake / Its source
AL03160205-0310-101 Bon Secour River Mobile Baldwin Swimming, fish & wildlife Atmospheric deposition Bon Secour Bay / 1 mile upstream from first bridge above its mouth
AL03160203-1103-102 Tombigbee River Lower Tombigbee
Clarke/ Washington Fish & wildlife In-place contaminants Upper end of Bilbo Island / Olin Basin
AL03160204-0505-100 Mobile River Mobile Mobile Limited warmwater fishery Unknown source Mobile Bay / Spanish River
AL03160205-0310-102 Bon Secour River Mobile Baldwin Swimming, fish & wildlife Atmospheric deposition 1 mile upstream from first bridge above its mouth / Its source
AL03140106-0603-101 Blackwater River Perdido-Escambia Baldwin Fish & wildlife Unknown source Perdido River / Narrow Gap Creek
AL03140106-0703-100 Perdido River Perdido-Escambia Baldwin Fish & wildlife Atmospheric deposition Perdido Bay / Jacks Branch
AL03160204-0503-102 Bay Minette Creek Mobile Baldwin Fish & wildlife Unknown source Bay Minette / Its source
AL03160204-0505-201 Tensaw River Mobile Baldwin Fish & wildlife Unknown source Mobile Bay / Junction of Tensaw and Apalachee Rivers
AL03160204-0505-202 Tensaw River Mobile Baldwin Outstanding Alabama water swimming, fish & wildlife Unknown source
Junction of Tensaw and Apalachee Rivers / Junction of Briar Lake
AL03160204-0105-302 Tensaw River Mobile Baldwin Outstanding Alabama water Fish & wildlife Unknown source
Junction of Briar Lake / Junction of Tensaw Lake
AL03160205-0306-200 Polecat Creek Mobile Baldwin Swimming, fish & wildlife Atmospheric deposition Fish River / Its source
AL03160204-0105-303 Tensaw River Mobile Baldwin/Mobile Fish & wildlife Unknown source Junction of Tensaw Lake / Mobile River
AL03160204-0303-102 Mobile River Mobile Baldwin/Mobile Fish & wildlife Unknown source Spanish River / Cold Creek 2013
AL03140106-0502-100 Styx River Perdido-Escambia
Escambia/ Baldwin Fish & wildlife Unknown source Hollinger Creek / Its source
AL03160204-0106-101 Cold Creek Mobile Mobile Fish & wildlife
Contaminated sediments Flow regulation/ modification
Mobile River / Dam 1 1/2 miles west of U.S. Hwy. 43
AL03160204-0404-101 Chickasaw Creek Mobile Mobile Limited warmwater fishery Unknown source Mobile River / US Hwy. 43
AL03160204-0404-102 Chickasaw Creek Mobile Mobile Fish & Wildlife Unknown source U.S. Hwy. 43 / Mobile College
AL03160204-0402-100 Chickasaw Creek Mobile Mobile Swimming, fish & wildlife Unknown source Mobile College / Its source
AL03160205-0206-100 Fowl River Mobile Mobile Swimming, fish & wildlife Unknown source Mobile Bay / Its source
AL-Gulf of Mexico Gulf of Mexico Mobile Mobile Shellfish harvesting, Swimming, fish & wildlife Unknown source Mississippi / Florida
AL03160204-0201-200 Middle River Mobile Mobile/Baldwin Fish & wildlife Unknown source Tensaw River(RM 20.6) / Tensaw River (River Mile 37.7)
AL03160205-0307-102 Fish River Mobile Baldwin Swimming, fish & wildlife Unknown source, Pasture grazing Weeks Bay / Its source
AL03170008-0302-100 Escatawpa River Escatawpa Mobile Swimming, fish & wildlife Unknown source AL-MS state line / Its source
AL03160203-1103-800 Olin Basin Lower Tombigbee Washington Fish & wildlife Contaminated sediments All of Olin Basin
8

Table 3. Facilities reporting releases of mercury in pounds to the EPA’s Toxic Release Inventory (TRI) Program in 2004 (EPA, 2006b)
On-site disposal to
Class I Underground
injection Wells, RCRA
Subtitle C Landfills, and
other landfills
Other on-site disposal or other releases
Off-site disposal to
Class I Underground
Injection Wells, RCRA
Subtitle C landfills, and other landfills
Other off-site disposal or other releases
Facility Name County Other on-site landfills
Point source air emissions
Surface water
discharges Other surface
impoundments Other
landfills Solidification/ Stabilization (metals only)
RCRA Subtitle C Surface
Impoundments
Other land
disposal Unknown
Total on- and off-site disposal or other releases
Barry Steam Plant, U.S. Hwy. 43,
Bucks Mobile 0 666 . 57 0 0 0 0 0 723
Bredero Shaw LLC, 8106
Dauphin Island Pkwy., Theodore
Mobile 0 0 . 0 0 0 0 0 1,780 1,780
Holcim (U.S.) Inc Theodore AL Plant, 3051
Hamilton Blvd, Theodore
Mobile 0 27 0 0 0 0 0 0 0 27
IPSCO Steel (Alabama) Inc.,
12400 Hwy. 43 N, Axis
Mobile 0 105 . 0 1 236 0 0 0 342
Mobile Energy Services LLC, 50 Bay Bridge Rd.,
Mobile
Mobile 0 21 . 0 0 0 187 0 0 208
Shell Chemical LP Mobile Site, 400 Industrial Pkwy., Ext., Saraland
Mobile 0 0 0 0 0 0 0 1 0 1
Alabama River Pulp Co Inc., 2373 Lena Landegger Hwy., Perdue Hill
Monroe 4 1 1 0 0 0 0 0 0 6
Charles R. Lowman Power
Plant, Carson Rd., Leroy
Wash- ington 6 192 3 11 0 0 0 0 0 212
9

METHODOLOGY AND RESULTS
DATA USED IN THIS STUDY Datasets used in this study included digital and hardcopy data from 30 studies. Some
studies provided mercury data for more than one type of material (water, fish, sediment, or soil)
and are listed in Table 4, grouped by material. Data used in this project were collected from the
following studies described below. Some studies are grouped under larger programs to which
they belong, and all are listed in alphabetic order by agency. Agency abbreviations are as
follows:
ADEM — Alabama Department of Environmental Management
EPA — U.S. Environmental Protection Agency
GSA — Geological Survey of Alabama
ISWS — Illinois State Water Survey
NOAA — National Oceanographic and Atmospheric Administration
USGS — U.S. Geological Survey
ADEM, Coastal Program Sediment Chemistry Baseline Study — The objective of this study
was to verify the concept of using aluminum as a “normalizing factor” for interpreting metals
data in coastal sediments. Aluminum was used as a geochemical normalizer, allowing for
identification of sediments with higher than base level concentrations of metals (Halcomb,
1991).
ADEM, Fish Tissue Monitoring Program — This program was started in 1991 as a
cooperative project with the Alabama Department of Public Health, the Alabama Department of
Conservation and Natural Resources, and the Tennessee Valley Authority. The main objective
of the program was to monitor fish tissue throughout the state for contaminants that pose a risk
to human health (ADEM, 2004).
ADEM, A Study of the Bay Minette Creek Subwatershed — A study was performed to
assess water quality of streams within the Bay Minette Creek subwatershed. The study also
identified streams impaired by pollution and provided information and suggestions for pollution
control strategies and management practices (Woods, 2004).
10

ADEM, A Survey of the Bayou Sara Watershed — This survey was performed to assess
water quality of streams within the Bayou Sara watershed. The survey also identified streams
impaired by pollution and provided information and suggestions for pollution control strategies
and management practices (Woods, 2003).
ADEM, A Survey of the Bon Secour River Watershed — This survey was conducted to
examine impacts of construction, development, and point-source pollution on habitat and
biological resources (ADEM, 1996a).
ADEM, A Survey of the Chickasaw Creek Watershed — The Chickasaw Creek watershed
study is an overview of land-use practices and an examination of effects of development on
aquatic resources of the basin (ADEM, 1997).
ADEM, An Impervious Surface Study Over Three Regimes: Three Mile Creek, Fly Creek, and Bay Minette — A study was conducted to assess water quality within the subwatersheds of
Three Mile Creek, Bay Minette Creek, and Fly Creek. It compared the water quality to data
across impervious surface regimes representing high, moderate, and low levels of development
(Woods, 2004).
ADEM, National Coastal Assessment (NCA) — The NCA is a strategic partnership between
EPA and the coastal states and other federal agencies. Each state uses a compatible
probabilistic design and a common set of environmental indicators to survey its coastal
resources and assess their condition. These estimates can then be aggregated to assess
conditions at the EPA regional, biogeographical, and national levels (EPA, 2007).
ADEM, A Survey of the Dog River Watershed Second Year’s Findings — The focus of this
survey was directed at the western and southern parts of the watershed experiencing the most
active growth and development. Sediment samples from Dog River were collected and analyzed
to determine concentrations of metals (ADEM, 1996b).
ADEM, A Survey of the Little Lagoon Watershed — The Little Lagoon Study was a
characterization of the watershed and included a water- and sediment-quality survey. Periodic
sampling of sites identified areas of impaired water quality and allowed water and sediment
quality analysis of the lagoon as a whole (ADEM, 2000).
11

ADEM, A Survey of the Water Quality and Sediment Chemistry of Selected Sites in Mobile Delta System — This survey was conducted on the estuaries of coastal Alabama to determine
the effects of anthropogenically induced environmental stress. Since point sources are typically
studied, this study examined nonpoint sources and the impact that they have on water quality
(ADEM, 1993).
ADEM, A Survey of Water Quality and Sediment Chemistry of Shipyards in Coastal Alabama — This report details the findings of a survey of water quality and sediment chemistry
in shipyards of coastal Alabama. Surface water and sediment samples were collected from 5
streams and 10 shipyards in Mobile and Baldwin Counties (Halcomb, 1992).
EPA, Environmental Monitoring and Assessment Program — The EPA’s Environmental
Monitoring and Assessment Program (EMAP) is a national research program to develop the
tools necessary to monitor and assess the status and trends of national ecological resources.
EMAP was designed to periodically estimate the status and trends of the nation's ecological
resources on a regional basis (EPA, 2005). EPA, Gulf of Mexico Program — This program is a partnership between EPA and the gulf
states to collect environmental data and find and apply solutions that work with economic
development. Contaminants, including mercury, were determined for a number of natural
materials (biota, water, sediment, soil, and others) (EPA, 2006e).
EPA, Mobile River Study (MRS) — This study assesses the contamination of the Mobile River
by hazardous substances, pollutants, and contaminants associated with and potentially
emanating from some or all of the National Priorities List (NPL) sites and entering the river
(EPA, 1994).
EPA, National Sediment Inventory — This inventory includes datasets collected from the
BASINS compilation including data taken from the EPA National Sediment Inventory (NSI)
Version 1.2. NSI datasets contain information about accumulation and distribution of heavy
metal and organic compound contaminants in aquatic systems (EPA, 1998).
12

EPA, National Survey of Mercury Concentrations in Fish — This survey includes data
collected in a nationwide cooperative effort. Data compilation includes results from state
monitoring efforts during 1990-1995 and includes mercury levels in fish tissue (EPA, 1999).
GSA, Mobile-Tensaw River Delta Water Quality Survey — This is an ongoing survey in which
water and sediment samples have been collected from seven sites in the Mobile-Tensaw River
Delta area to determine concentrations of selected inorganic and organic constituents. The
survey is limited to the collection of samples during low and high river discharge levels.
GSA, Sand Resources Mercury Data — This project included collected data from Mobile and
Baldwin Counties and the Gulf of Mexico. The Sand Resources project is a cooperative study
between the U.S. Department of the Interior Minerals Management Service and the Geological
Survey of Alabama. Its purpose is the study of coastal erosion, the evaluation of nonfuel mineral
resources, and the identification of sand resources on the Gulf of Mexico's inner continental
shelf suitable for beach nourishment programs. Determinations for mercury in sample aliquots
were performed as part of additional geochemical evaluation of the sediments subsequent to
completion of the sand resources study (Kopaska-Merkel and Rindsberg, 2005; Rindsberg and
Kopaska-Merkel, 2006).
ISWS, Mercury Deposition Network — The Mercury Deposition Network (MDN) is an
extended network of the National Atmospheric Deposition Program at the Illinois State Water
Survey (ISWS). The MDN collects data nationwide to develop a national database of weekly
concentrations of total mercury in precipitation to examine spatio-temporal long-term trends
(ISWS, 2006).
NOAA’s National Status and Trends Program (NS&T) — This program is divided into three
programs: the Mussel Watch (MW), Benthic Surveillance, and Bioeffects Assessment Projects.
In addition to specimen banking and historical trends within the studies of coastal monitoring,
the on-going Mussel Watch project is a distribution and temporal trend assessment of toxic
pollutants and heavy metals within coastal waters and related estuaries. The MW project
analyzes chemical and biological contaminant trends in sediment and bivalve tissue collected at
over 280 coastal sites from 1986 to present (Center for Coastal Monitoring and Assessment,
2005).
13

USGS, National Geochemical Survey (NGS) — The dataset from this survey provides stream
sediment and soil geochemical and physical analytical results and many other supporting
attributes (USGS, 2005).
USGS, National Water Information System (NWIS) — The NWIS Web Interface serves as
public portal to historical water-quality analyses in the USGS district databases through
September 2005. At sites where this information is transmitted automatically, data are available
from the real-time data system. Once readings for a complete day are received from a site, daily
summary data are generated and made available online through the NWISWeb (USGS, 2005).
USGS, National Contaminant Biomonitoring Program (NCBP) — Contaminant
concentrations in freshwater fish and birds were periodically measured. Fish were selected for
monitoring aquatic ecosystems because of their tendency to accumulate pesticides and other
contaminants. The USFWS maintained this National Contaminant Biomonitoring Program into
the 1980's, with the objective of continuing the documentation of temporal and geographic
trends in contaminant concentrations (USGS, 1995b).
14

Table 4. Studies grouped by material type
Material Source Name of the study from which data were collected Data years ADEM A Study of the Bay Minette Creek Subwatershed 03-04 2003-2004 ADEM A Survey of the Bayou Sara Watershed 2001-2002 ADEM A Survey of the Bon Secour River Watershed 1996 ADEM Coastal Program Sediment Chemistry Baseline Study 1991 ADEM A Survey of the Chickasaw Creek Watershed 1997 ADEM A Survey of the Dog River Watershed Second Wear’s Findings 1991-1995 ADEM An Impervious Surface Study over Three Regimes: Three Mile Creek, Fly Creek, and Bay Minette Creek Subwatersheds 2003 ADEM A Survey of the Little Lagoon Watershed 1990 ADEM A Survey of the Water Quality and Sediment Chemistry of Selected Sites in Mobile Delta System 1992 ADEM National Coastal Assessment (NCA) 2000-2004 2000-2004 ADEM A Survey of the Water Quality and Sediment Chemistry of Shipyards in Coastal Alabama 1992 EPA Environmental Monitoring and Assessment Program (EMAP) 1991-1994 EPA Mobile River Study (MRS) 1993-1994 EPA National Sediment Inventory (NSI) 1980-1993 GSA Sand Resources Mercury Data for Baldwin County 1992 GSA Sand Resources Mercury Data for Gulf of Mexico 1994-1995 GSA Sand Resources Mercury Data for Mobile County 1990-1995
NOAA National Status and Trends Benthic Surveillance (NSTBS) 1984-1986 NOAA National Status and Trends Mussel Watch (NSTMW) 1996-1997 USGS National Geochemical Survey (NGS) 1997-1998
Sediment
USGS National Water Information Systems (NWIS) 1970-2005 Soil USGS National Geochemical Survey (NGS) 1997-1998
ADEM ADEM Fish Tissue Monitoring Program 1990-2003 ADEM National Coastal Assessment (NCA) 2000-2004 2000-2004 EPA Environmental Monitoring and Assessment Program (EMAP) 1991-1994 EPA Gulf of Mexico Programs 2003 EPA Mobile River Study (MRS) 1994 EPA National Survey of Mercury Concentrations in Fish 1990-1995
Fish
USGS National Contaminant Biomonitoring Program (NCBP) 1969-1986 ADEM Survey of the Water Quality and Sediment Chemistry of Shipyards in Coastal Alabama 1991 EPA STOrage and RETrieval Legacy Data Center Data (STORET) . 1973-1991
Surface water
GSA Mobile-Tensaw River Water Quality Survey . 2006 Atmospheric deposition ISWS National Atmospheric Deposition Program (NADP), Mercury Depositional Network (MDN) 2001-2004
15

STATISTICAL AND SPATIAL ANALYSES
Data were analyzed both statistically (general descriptive statistics) and spatially to
determine if they could be used in this project. Data that had mercury measurements recorded
as negatives or 9999 were judged in error and deleted from the final datasets prior to statistical
and spatial assessments. Remaining data points were imported into an ArcGIS project and
plotted using their given geographic coordinates. The points were visually assessed for spatial
distribution.
SURFACE-WATER DATA ANALYSES Total water samples used in this study included 1,414 samples (fig. 4) from five studies
performed by ADEM, EPA, GSA, and USGS. Many of these samples represented multiple
samples over time at single sites. During the analysis of these data, mercury samples recorded
as 9999.99 mg/g were discovered in the EPA STORET database for 1990 and 1991. Because
no information was available specifying the meaning of these entries, they were deleted from
the water database. An additional 12 methylmercury samples were also included in this study,
but they were partitioned from the total water data for separate analysis. Owing to the low
sample size and the clustered spatial distribution (fig. 4), statistical and spatial analyses were
not performed on the methylmercury data.
The 1,414 samples of water data were divided into freshwater (1,333 samples) and
saltwater (81 samples) subsets. Saltwater samples were defined using a combination of
methods: salinity as based on the USGS’s parameters for saline water (USGS, 2006);
geographic coordinates within known saltwater areas; nearest neighbor points with saltwater
salinity or saltwater geographic location. Freshwater samples numbered 1,333, with mercury
levels ranging from 0.00 (below detection limit (BDL)) to 2,690 ppb. The saltwater subset
contained 81 samples ranging in mercury levels from BDL to 2,200 ppb. Data points for this
subset were restricted to the Gulf, Mobile Bay, and some saltwater inlets of the Mobile Bay such
as Weeks Bay and the lower delta region (fig. 4).
Both the saltwater and the freshwater data were plotted in GIS. Because EPA and
ADEM water-quality criteria differ for both chronic (adverse effects after continuous or multiple
exposures) and acute (adverse effects following one exposure) levels, maps were produced
using both EPA (figs. 5 and 6) and ADEM (figs. 7 and 8) water-quality criteria for aquatic life.
The EPA’s national water-quality criteria for chronic and acute mercury levels (EPA, 2006c) and
ADEM’s water-quality criteria for chronic and acute mercury levels (ADEM, 2007) are listed in
tables 5 and 6.
16

Figure 4. Point locations of all surface freshwater and saltwater data collected for this project.
17

Figure 5. Categorization of freshwater and saltwater data by EPA water-quality criteria (EPA, 2006c)
for years 1970 - 2006.
18

Figure 6. Categorization of freshwater data by EPA water-quality criteria (EPA, 2006c)
for years 1995 - 2006.
19

Figure 7. Categorization of freshwater and saltwater data by ADEM 2004 water-quality criteria as listed in
regulation 305(b) (ADEM, 2004) for years 1970 - 2006.
20

Figure 8. Categorization of freshwater data by ADEM 2004 water-quality criteria as listed in regulation
305(b) (ADEM, 2004) for years 1995 - 2006.
21

Table 5. Percentile data distribution among water-quality criteria threshold levels for mercury (percentages based on data for all years, 1970 - 2006)
Water quality criteria in ppb Agency Water type
Total number
of samples Acute Chronic
% Data above acute
% Data between
acute and chronic
% Data below
chronic
Fresh water 1333 1.4 0.77 19.9 24.8 56.1 EPA Saltwater 81 1.8 0.94 2.5 83.9 13.6 Fresh water 1333 2.4 0.012 15.9 77.3 6.8 ADEM Saltwater 81 2.1 0.025 2.5 83.9 13.6
Table 6. Percentile data distribution among water-quality criteria threshold levels for mercury
(percentages based on data for all years, 1995 - 2006) Water quality criteria in ppb Agency Water type
Total number
of samples Acute Chronic
% Data above acute
% Data between
acute and chronic
% Data below chronic
Fresh water 132 1.4 0.77 10.3 1.9 87.8 EPA Saltwater 0 1.8 0.94 No saltwater data for 1995-2005 Fresh water 132 2.4 0.012 8.3 73.1 18.6 ADEM Saltwater 0 2.1 0.025 No saltwater data for 1995-2005
SEDIMENT-DATA ANALYSES Analyses from 576 sediment samples were included in this project, representing 21
studies performed by ADEM, EPA, GSA, NOAA, and USGS. Mercury measurements in these
samples ranged from BDL to 32,000 ppb, and the data were well distributed across the study
region. The sediment data were plotted in GIS and categorized (fig. 9; table7) by freshwater
sediment and saltwater sediment threshold levels listed in NOAA’s Screening Quick Reference
table for Inorganics in Solids (SQuiRTs) sediment tables (NOAA, 2007). The effects levels in the
SQuiRTs table were based on toxicity levels for aquatic invertebrates as published by
MacDonald and others (2003), Long and others (1995), and Long and Morgan (1991).
Freshwater sediment value categories were based on Threshold Effects Level (TEL) and
Probable Effects Level (PEL). The TEL represents a toxicity level below which adverse effects
occur infrequently and PEL represents a chemical concentration above which adverse biological
effects are expected to occur frequently (MacDonald and others, 2003). Saltwater sediment
data were categorized by Effects Range Low (ERL) and Effects Range Median (ERM). Values
below ERL represent a category in which adverse effects are estimated to rarely occur (Long
and others, 1995). Values between ERL and ERM represent contaminant levels for which
possible effects would occasionally occur and values above ERM represent a range in which
effects would occur frequently (Long and others, 1995). Sediment data were plotted for all
years, and no additional maps were created with respect to year collected due to poor record of
22

sampling dates (60% of the freshwater sediment data and 42% of the saltwater sediment data
had no sampling year recorded in the datasets obtained for this study).
Figure 9. Sediment data categorized by biological effects levels for all years.
23

Table 7. Freshwater and saltwater sediment statistics for mercury by threshold level
Freshwater Levels
Threshold effects level (TEL) = 174 ppb
Probable effects level (PEL) = 486 ppb
% Data above PEL % Data between PEL and TEL % Data below TEL 19.0 21.3 59.7
Saltwater Levels
Effects Range Low (ERL) = 150 ppb Effects Range Median (ERM) = 710 ppb
% Data above ERM % Data between ERL and TEL % Data below ERL 11.5 32.3 56.2
SOIL-DATA ANALYSES Soil data included analyses from 74 soil samples (fig. 10). All soil data were from the
National Geochemical Survey (USGS, 2006) and represent dried soil samples collected from
soil horizon A. Soil data were plotted in GIS and categorized using Ecological Screening Values
(ESV) of 100 ppb as reported in Supplemental Guidance to RAGS: Region 4 Bulletins,
Ecological Risk Assessment (EPA, 2001). The 100 ppb ESV represents a mercury
contamination level associated with only a low probability of effects to organisms having direct
soil exposure such as earthworms (EPA, 2001). The level is based on conservative endpoints
and sensitive effects data and represents only preliminary screening to aid in deciding if further
testing should be performed (EPA, 2001). Of the 74 soil samples, only 4 had mercury levels
above the ESV.
24

Figure 10. Soil data categorized by EPA ecological-screening values (EPA, 2001).
25

FISH-DATA ANALYSES Data from 910 fish samples were included in the fish database for this project
representing 9 studies performed by ADEM, EPA, NOAA, and USGS measuring mercury levels
in fish. Mercury values in the dataset were not specified as total mercury or methylmercury;
however, studies have shown that 99 percent of total mercury in fish is methylmercury in form
(Grieb and others 1990). Data were recorded as negative numbers or blanks in their original
studies were judged as errors and not included in the final fish database. Fish data were
combined into a larger database, and taxonomic and trophic data for each species were
determined for comparison of mercury levels across trophic and taxonomic groups. Three fish
families comprise 79.8 percent of the total fish samples with sunfishes (Centrarchidae) equaling
42.6 percent of the total fish data. Of the sunfish, largemouth bass (Micropterus salmoides)
totaled 302 samples (33.2 percent of the total fish data). Piscivorous fish constituted 53.1
percent of the total data, and omnivores comprised 33.0 percent of the total fish data. For all
fish, the mean mercury level measured 435 ppb with a median of 186 ppb. For piscivores, the
mean mercury level measured 696 ppb with a median of 450 ppb (this significantly higher mean
and median may be attributed to the higher biomagnification factor of predators previously
discussed). Omnivores averaged 164 ppb with a median of 90 ppb.
The fish data were divided into whole-body fish (for biological effects analysis) and fillet
fish (for human health effects analysis). The whole-body fish dataset was plotted in ArcGIS and
categorized based on the tissue-based threshold effects levels (t-TEL) in fish (fig. 11), with the
biological effects level (200 ppb) representing sublethal endpoints (growth, reproduction,
development, and behavior) as reported by Beckvar and others (2005). Of the whole-body fish
data (disregarding year sampled), 18.2 percent of the data exceeded the t-TEL. The fillet fish
data were also plotted in GIS and categorized by the human-health based consumption limits
(fig. 12) from the EPA’s Guidance for Assessing Chemical Contaminant Data for Use in Fish
Advisories (EPA, 2006d) (table 8), on which effects levels of methylmercury are
noncarcinogenic health endpoints, with chronic systems effects.
26

Figure 11. Fish data (whole body only) categorized by biological effects levels
(from Beckvar and others, 2005).
27

Figure 12. Fish data (fillet only) for all years, categorized by EPA’s risk-based consumption limits for
noncarcinogenic human-health endpoints (EPA, 2006d).
28
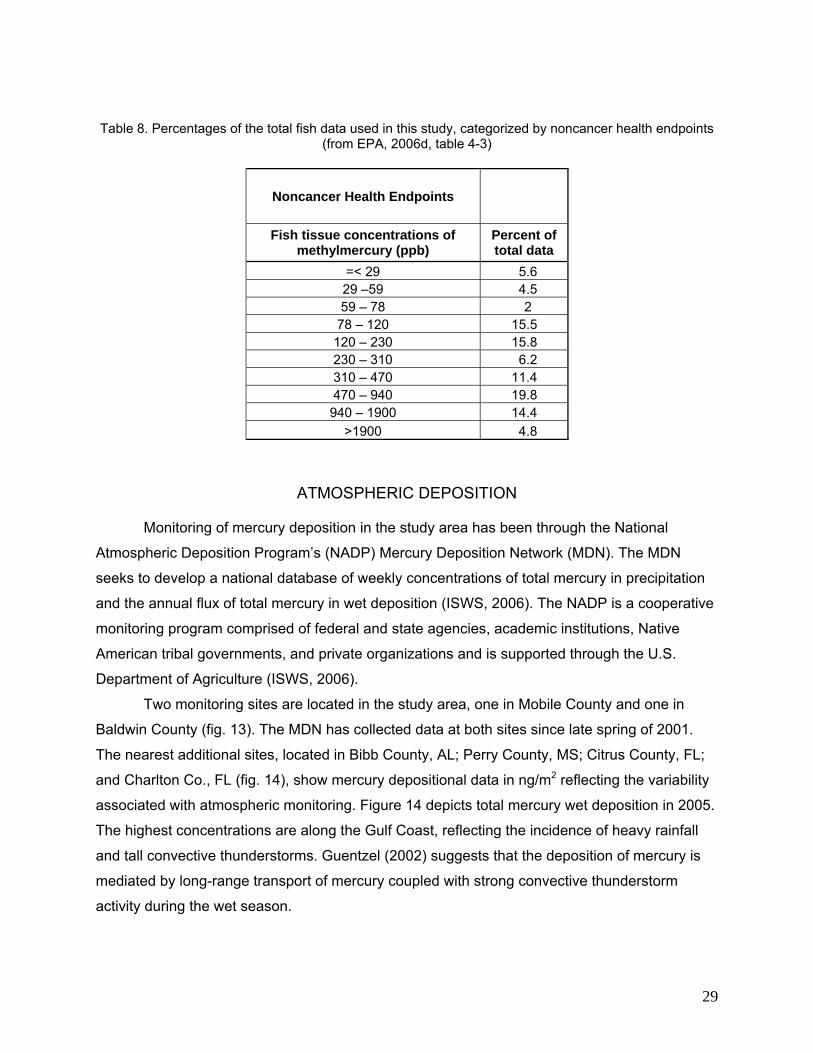
Table 8. Percentages of the total fish data used in this study, categorized by noncancer health endpoints
(from EPA, 2006d, table 4-3)
Noncancer Health Endpoints
Fish tissue concentrations of methylmercury (ppb)
Percent of total data
=< 29 5.6 29 –59 4.5 59 – 78 2
78 – 120 15.5 120 – 230 15.8 230 – 310 6.2 310 – 470 11.4 470 – 940 19.8 940 – 1900 14.4
>1900 4.8
ATMOSPHERIC DEPOSITION
Monitoring of mercury deposition in the study area has been through the National
Atmospheric Deposition Program’s (NADP) Mercury Deposition Network (MDN). The MDN
seeks to develop a national database of weekly concentrations of total mercury in precipitation
and the annual flux of total mercury in wet deposition (ISWS, 2006). The NADP is a cooperative
monitoring program comprised of federal and state agencies, academic institutions, Native
American tribal governments, and private organizations and is supported through the U.S.
Department of Agriculture (ISWS, 2006).
Two monitoring sites are located in the study area, one in Mobile County and one in
Baldwin County (fig. 13). The MDN has collected data at both sites since late spring of 2001.
The nearest additional sites, located in Bibb County, AL; Perry County, MS; Citrus County, FL;
and Charlton Co., FL (fig. 14), show mercury depositional data in ng/m2 reflecting the variability
associated with atmospheric monitoring. Figure 14 depicts total mercury wet deposition in 2005.
The highest concentrations are along the Gulf Coast, reflecting the incidence of heavy rainfall
and tall convective thunderstorms. Guentzel (2002) suggests that the deposition of mercury is
mediated by long-range transport of mercury coupled with strong convective thunderstorm
activity during the wet season.
29

Figure 13. Location of the two MDN monitoring sites within the study area (ISWS, 2006).
30
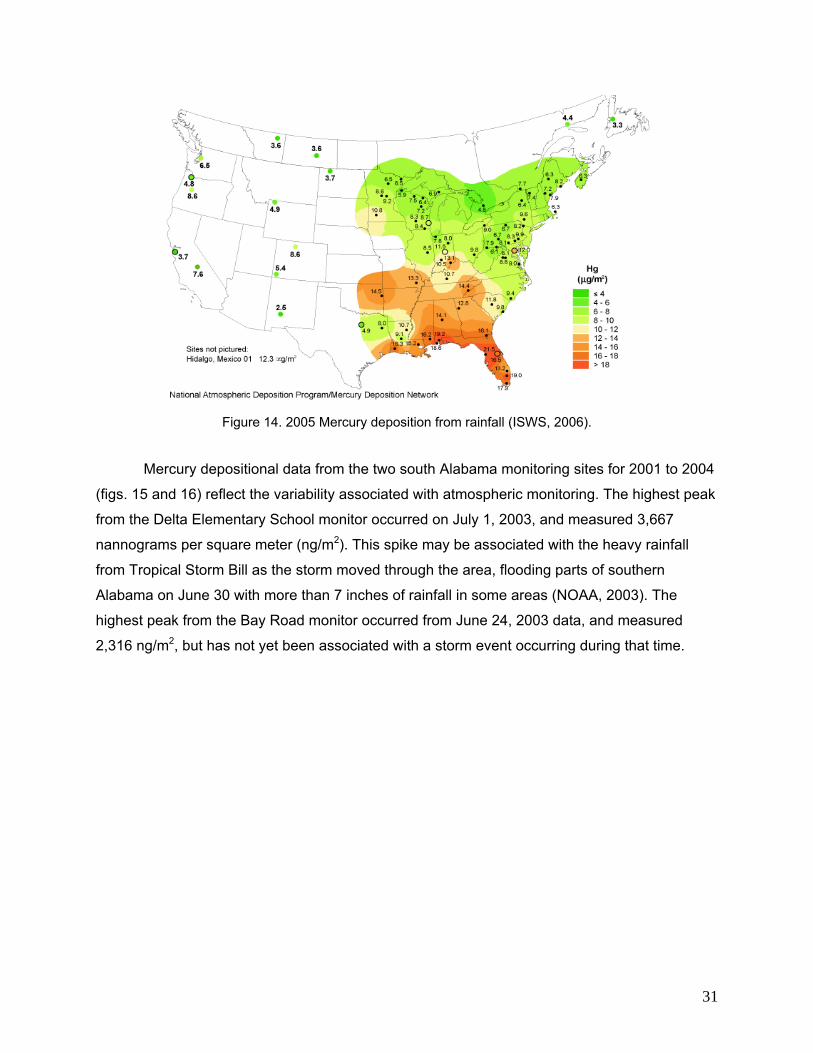
Figure 14. 2005 Mercury deposition from rainfall (ISWS, 2006).
Mercury depositional data from the two south Alabama monitoring sites for 2001 to 2004
(figs. 15 and 16) reflect the variability associated with atmospheric monitoring. The highest peak
from the Delta Elementary School monitor occurred on July 1, 2003, and measured 3,667
nannograms per square meter (ng/m2). This spike may be associated with the heavy rainfall
from Tropical Storm Bill as the storm moved through the area, flooding parts of southern
Alabama on June 30 with more than 7 inches of rainfall in some areas (NOAA, 2003). The
highest peak from the Bay Road monitor occurred from June 24, 2003 data, and measured
2,316 ng/m2, but has not yet been associated with a storm event occurring during that time.
31
Mercury Deposition Data for Delta Elementary All Years
0
500
1000
1500
2000
2500
3000
3500
4000
6/12/2001 9/12/2001 12/12/2001 3/12/2002 6/12/2002 9/12/2002 12/12/2002 3/12/2003 6/12/2003 9/12/2003 12/12/2003 3/12/2004
Dates
Mer
cury
dep
ositi
on (n
g/m
2 )
Figure 15. Mercury depositional data from precipitation for the Delta Elementary NADP MDN Monitoring Location from 2001 – 2004 (ISWS, 2006).
Mercury Deposition Data for Bay Road All Years
0
500
1000
1500
2000
2500
5/29/2001 8/29/2001 11/29/2001 2/28/2002 5/29/2002 8/29/2002 11/29/2002 2/28/2003 5/29/2003 8/29/2003 11/29/2003 2/29/2004
Dates
Mer
cury
dep
ositi
on (n
g/m
2 )
Figure 16. Mercury depositional data from precipitation for the Bay Road NADP MDN Monitoring Location from 2001 – 2004 (ISWS, 2006).
32

HIGH CONTAMINATION LEVEL POINTS FROM ALL MATERIALS
To examine mercury concentrations of all materials together across the study area,
points within the highest contamination threshold levels of each material (water, sediment, fish,
and soil) for all years were plotted together on one map (fig. 17). Because no threshold levels
were used for the atmospheric deposition data, these data (representing only two geographic
points) were not included in Figure 17. Highest contamination threshold levels used for water,
sediment, fish, and soil include the following:
• Water — ADEM’s water-quality criteria acute mercury levels (ADEM, 2007) of equal to or
greater than (≥) 2.4 ppb for freshwater and ≥2.1 ppb for saltwater.
• Sediment — MacDonald and others’ (2003) Probable Effects Level of ≥486 ppb for
freshwater sediments and Long and others’ (1995) Effects Range Median of ≥710 ppb for
saltwater sediments.
• Fish — Beckvar and others’ (2005) tissue-based biological effects level of ≥200 ppb for
whole-body fish and EPA’s human-health based consumption limit of ≥1900 ppb (EPA,
2006d) for fillet fish.
• Soil — EPA’s Ecological Screening Value of ≥100 ppb (EPA, 2001).
33

Figure 17. Location of high-contamination areas from combined results.
34

DISCUSSION AND FUTURE RESEARCH While the main objective of this project was not to identify point sources, the project did
provide a view of the spatial distribution of mercury levels in data collected across the study
area. These results can be used as a tool for identifying areas within the five counties that may
need further investigation where the data indicate high mercury levels with respect to effects
levels. Using multiple datasets from numerous studies independent from one another, as
performed in this project, allows a broader understanding, both spatially and temporally.
However, the data collected for this project represent a small portion of the data needed for in-
depth study of mercury contamination and point sources within the study area. The following
paragraphs suggest additional studies that would further refine our understanding of mercury
concentration and sampling distribution in the study area.
WATER In addition to the surface-water data described in this report, more current freshwater
and saltwater data are needed for a detailed investigation of water-column mercury. Out of the
data collected in this study, there were only 129 freshwater samples between 1995 and 2005,
and no saltwater samples available for that time period. The 129 freshwater samples were
collected in only two of the five counties. Moreover, spatial distribution and varying hydrologic
conditions of the sampled data should be considered.
Project personnel collected and analyzed surface-water data, but did not investigate
ground water. Since most wells are not required to test for contaminants on a regular basis,
testing well water samples would provide additional information not examined in this study. Data
from municipal wastewater and drinking water plants could also provide additional temporal
information. Municipal drinking-water plants have to meet water-quality and drinking-water
standards and frequently test for mercury, making these sources good indicators of the water
quality for this area.
SEDIMENT Of the freshwater sediment data, the largest cluster of highest contamination category
samples is located on the Mobile River in southern Washington County and northern Mobile
County. Since these samples represent recent data (all samples were collected since 1992),
further data collection and sampling could reveal important information on the point source(s) of
the contamination in this stretch of the river. Another aspect of further research in the Mobile
River and Delta area relates to the many oxbows around the river that trap and hold sediment
and water. These areas have fine-grained sediments, low dissolved oxygen, decreased pH, and
35
increased nutrient concentration — all attributes that can enhance the methylation of mercury
(Horowitz, 1991; Brigham and others, 2003). Sampling from these oxbows could lead to
identification of areas of high mercury concentration.
SOIL The soil data reflected in this project are distributed across only two of the five counties
in the study area. Further determination of mercury in soil from the remaining counties should
be performed for a meaningful assessment. Additional sampling would provide a better
representative sample of the larger area. Moreover, additional sampling needs to be done in the
vicinity of those sites from which the soil mercury concentration is greater than the ESV to verify
and define the indicated levels.
ATMOSPHERIC DEPOSITION Precipitation data would also be useful in examining mercury contamination of soil or
water as a result of global and local atmospheric transport of mercury. As only two MDN
monitoring stations are in the five-county study area (fig. 14) and other sites along the coast and
inland are distant, additional sites in the study region could provide more data that could be
paired with meteorological information to study correlation between storm events and mercury
deposition in a geographic context. Better coupling of depositional geochemistry with real-time
attributes of precipitation events, such as cloud height and condensation layer, would help in
evaluating local and global transport.
FISH The fish dataset represented the second largest dataset in this study and contained
many attributes that would allow further analyses and correlations. Owing to time and financial
constraints, more in-depth analyses of the fish data for this study was not performed beyond
what has been described previously. Future research on mercury in fish should include a
thorough search for more recent fish data as well as older data. Historical records should be
collected for streams that have been included in ADEM’s 303(d) list owing to mercury
contamination and streams for which there have been fish advisories due to mercury levels. By
examining multitemporal fish data, mercury contamination trends through time can be better
evaluated, and streams with persistent problems can be identified.
36
MUSSELS Only 21 measurements of mercury levels in tissue from benthic organisms were
obtained. These data were taken from the NOAA NSTMW project. Owing to the small sample
size, no analyses were performed on the mussel data in this project. However, because these
data represent tissue from organisms that filter particulates from the water in their environments,
additional mussel data collection and testing would provide important information on mercury
levels in the water and the sediment over the life span of the organisms sampled.
METHYLMERCURY Additional data collection and analysis is recommended to further investigate
methylmercury and bioaccumulation of mercury. One previous study that should be included, is
a study by Warner and others (2005) that examined mercury accumulation in relation to different
environmental compartments in the Mobile River Basin. For that study, mercury concentrations
were obtained for sediment, water, and largemouth bass and included some methylmercury
measurements. For our study, only 12 methylmercury water samples were obtained and all
were from the USGS NWIS. Additional methylmercury data exist and should be analyzed. For a
thorough investigation, new sampling should also be performed.
CONCLUSIONS This project provides a general statistical and spatial overview of available mercury data
for the five-county study area surrounding Mobile Bay, Alabama. Identification of point sources
of mercury contamination in the study area and understanding the effects and significance of
contamination within the ecosystems of the Mobile Bay and delta area are critical concerns, and
further collection and analysis of additional data are strongly recommended. The results show
that mercury concentrations exceed both human and wildlife effects threshold levels in multiple
areas of south Alabama and warrants further investigation and analysis for the welfare and
protection of this unique and important area.
37

REFERENCES CITED Alabama Department of Environmental Management, 1993, A survey of the water quality and sediment chemistry of selected sites in Mobile Delta system: Montgomery, Alabama, Technical Report, 41 p. Alabama Department of Environmental Management, 1996a, A survey of the Bon Secour River watershed: Montgomery, Alabama, Technical Report, 59 p. Alabama Department of Environmental Management, 1996b, A survey of the Dog River watershed, second year’s findings: Montgomery, Alabama, Technical Report, 51 p. Alabama Department of Environmental Management, 1997, A survey of Chickasaw Creek watershed: Montgomery, Alabama, Technical Report, 95 p. Alabama Department of Environmental Management, 2000, A survey of the Little Lagoon watershed: Mobile, Alabama, Technical Report, 57 p. Alabama Department of Environmental Management, 2004, 2004 integrated water quality monitoring and assessment report: 305(b) Report, on the World Wide Web at URL http://www.adem.state.al.us/WaterDivision/WQuality/305b/2004Report/2004.htm. Alabama Department of Environmental Management, 2006, 303 (d) List, on the World Wide Web at URL http://www.adem.state.al.us/WaterDivision/WQuality/303d/WQ303d.htm. Alabama Department of Environmental Management, 2007, Chapter 335-6-10, Water quality criteria, on the World Wide Web at URL http://www.epa.gov/waterscience/wqs/al/al_4_wqs.pdf. Alabama Department of Public Health, 2006, Alabama waterways: Fish advisories, on the World Wide Web at URL http://www.adph.org/RISK/Default.asp?TemplateID=1349. Arctic Monitoring and Assessment Programme, 1998, Assessment report: Arctic pollution issues. Oslo, Norway: Arctic Monitoring and Assessment Programme. Agency for Toxic Substances and Disease Registry, 2005, 2005 CERCLA priority list of hazardous substances, on the World Wide Web at URL http://www.atsdr.cdc.gov/cercla/05list.html. Beckvar, N., Dillon, T. M., and Read, L. B., 2005, Approaches for linking whole-body fish tissue residues of mercury or DDT to biological effects thresholds: Environmental Toxicology and Chemistry, v. 24, no. 8, p. 2094-2105. Brigham, M. E., Krabbenhoft, D. P., and Hamilton, P. A., 2003, Mercury in stream ecosystems – new studies initiated by the U.S. Geological Survey: USGS Fact Sheet 016-03, on the World Wide Web at URL http://pubs.usgs.gov/fs/fs-016-03/. Center for Coastal Monitoring and Assessment Program, 2005, National Status and Trends Program: National Oceanic and Atmospheric Administration, on the World Wide Web at URL http://ccma.nos.noaa.gov/stressors/pollution/nsandt/.
38

Center for Disease Control, 2005, CDC’s third national report on human exposure to environmental chemicals: NCEH Pub 05-0664, 4 p. Chang, Semoon, and Canode, Shelia, 1999, Toward valuation of the Mobile Bay: A study: University of South Alabama, Mitchell College of Business, Center for Business and Economic Research, CBER Research Report 44, 130 p. Dennis, Ian, Clair, T. A., Driscoll, C. T., Kamman, Neil, Chalmers, Ann, Shanley, Jamie, Norton, S. A., and Kahl, Steve., 2003, Distribution patterns of mercury in lakes and rivers of northeastern North America: Ecotoxicology, v. 14, p. 113-123. Grieb, T. M., Driscoll, C. T., Gloss, S. P., Schofield, C. L., Bowie, G. L., 1990, Factors affecting mercury accumulation in fish in the Upper Michigan Peninsula: Environmental Toxicology and Chemistry, v. 9, no. 7, p. 919-930. Guentzel, J., 2002, Atmospheric deposition of mercury (abs.), Mobile, AL, The Mercury Forum, Mississippi-Alabama Sea Grant Consortium, variously paginated. Halcomb, Gary, 1991, A sediment chemistry baseline study of coastal Alabama: Mobile, Alabama, Alabama Department of Environmental Management Technical Report, 74 p. Halcomb, Gary, 1992, A survey of the water quality and sediment chemistry of shipyards in coastal Alabama: Montgomery, Alabama, Alabama Department of Environmental Management Technical Report, 62 p. Horowitz, A. J., 1991, A primer on sediment-trace element chemistry (2nd ed.): Chelsea, Michigan, Lewis Publishers, 136 p. Hummell, R. L., and Parker, S. J., 1995, Holocene geologic history of Mobile Bay, Alabama: Alabama Geological Survey Circular 186, 97 p. Isphording, W. C., Stringfellow, J. A., and Flowers, G. C., 1985, Sedimentary and geochemical systems in transitional marine sediments in the northeastern Gulf of Mexico: Gulf Coast Association of Geological Societies Transactions, v. 35, p. 397-408. Illinois State Water Survey, 2006, National atmospheric deposition program, on the World Wide Web at URL http://nadp.sws.uiuc.edu/. Kopaska-Merkel, D. C. and Rindsberg, A. K., 2005, Sand-quality characteristics of Alabama beach sediment, environmental conditions, and comparison to offshore sand resources: Alabama Geological Survey Open-File Report 0508 (on CD-ROM), Annual Report 1 under U.S. Minerals Management Service Cooperative Agreement 1435-01-04-CA-34423.
Long, E. R., and Morgan, L. G., 1991, The potential for biological effects of sediment-sorbed contaminants tested in the National Status and Trends Program: Seattle, Washington, National Oceanic and Atmospheric Administration, NOAA Technical Memoradum NOS OMA 52, 231 p. Long, E. R., MacDonald, D. D., Smith, S. L., Calder, F. D., 1995, Incidence of adverse biological effects within ranges of chemical concentrations in marine and estuarine sediments: Environmental Management, v. 19, no. 1, p. 81-97.
39

MacDonald, D. D., Ingersoll, C. G., Smorong, D. E., Lindskoog, R. A., Sloane, G., and Biernacki, T., 2003, Development and evaluation of numerical sediment quality assessment guidelines for Florida inland waters: Florida Department of Environmental Protection Open-File report, 111 p. Mettee, M. F., O’Neil, P. E., and Pierson, J. M., 1996, Fishes of Alabama and the Mobile Basin: Birmingham, Alabama, Oxmoor House, 820 p. Mobile Press Register, 2005, Press-Register, http://www.mobileregister.com/archive.htm.
Moore, C. J., 2000, A review of mercury in the environment (its occurrence in marine fish): South Carolina Marine Resources Division Technical Report 86, 22 p. National Oceanic and Atmospheric Administration, 2003,Tropical Storm Bill - June 27-July 3, 2003, on the World Wide Web at URL http://www.hpc.ncep.noaa.gov/tropical/rain/bill2003.html. National Oceanic and Atmospheric Administration, 2007, Screening quick Reference Tables (SquiRT), on the World Wide Web at URL http://response.restoration.noaa.gov/type_subtopic_entry.php?RECORD_KEY%28entry_subtopic_type%29=entry_id,subtopic_id,type_id&entry_id(entry_subtopic_type)=90&subtopic_id(entry_subtopic_type)=5&type_id(entry_subtopic_type)=2. Rindsberg, A. K., and Kopaska-Merkel, D. C., 2006, Sand-quality characteristics of Alabama beach sediment, environmental conditions, and comparison to offshore sand resources: Alabama Geological Survey Open-File Report 0607 (on CD-ROM). U.S. Environmental Protection Agency, 1994, Mobile River study 1993-1994: EPA Region 4 Electronic Reading Room, on the World Wide Web at URL http://www.epa.gov/Region4//foiapgs/readingroom/. U.S. Environmental Protection Agency, 1998, National Sediment Inventory (NSI) Version 1.2 for the conterminous U.S, on the World Wide Web at URL http://www.epa.gov/waterscience/BASINS/metadata/nsi.htm. U.S. Environmental Protection Agency, 1999, The National survey of mercury concentrations in fish database summary 1990-1995, Washington, D.C., 210 p. U.S. Environmental Protection Agency, 2001, Supplemental guidance to RAGS: Atlanta, EPA Region 4 Bulletins, Ecological Risk Assessment, on the World Wide Web at URL http://www.epa.gov/region4/waste/ots/ecolbul.htm. U.S. Environmental Protection Agency, 2005, Environmental monitoring and assessment program: EPA, on the World Wide Web at URL http://www.epa.gov/emap/. U.S. Environmental Protection Agency, 2006a, National Priorities List (NPL), on the World Wide Web at URL http://www.epa.gov/superfund/sites/npl/index.htm. U.S. Environmental Protection Agency, 2006b, Toxic Release Inventory (TRI) program, on the World Wide Web at URL http://www.epa.gov/tri/.
40
U.S. Environmental Protection Agency, 2006c, Current national recommended water quality criteria, on the World Wide Web at URL http://www.epa.gov/waterscience/criteria/wqcriteria.html. U.S. Environmental Protection Agency, 2006d, Guidance for assessing chemical contaminant data for use in fish advisories, on the World Wide Web at URL http://www.epa.gov/waterscience/fishadvice/volume2/. U.S. Environmental Protection Agency, 2006e, Gulf of Mexico program, on the World Wide Web at URL http://www.epa.gov/gmpo/. U.S. Environmental Protection Agency, 2006f, Better Assessment Science Integrating point and Nonpoint Sources (BASINS) , on the World Wide Web at URL http://www.epa.gov/waterscience/basins/. U.S. Environmental Protection Agency, 2007, National coastal assessment, on the World Wide Web at URL http://www.epa.gov/emap/nca/ . U. S. Geological Survey, 1995a, Mercury contamination of aquatic ecosystems: U. S. Geological Survey Fact Sheet FS-216-95, on the World Wide Web at URL http://wi.water.usgs.gov/pubs/FS-216-95/mercury.pg3.pdf. U. S. Geological Survey, 1995b, National contaminant biomonitoring program, on the World Wide Web at URL http://www.cerc.usgs.gov/data/ncbp/fish.htm U. S. Geological Survey, 2005, National water information system, on the World Wide Web at URL http://waterdata.usgs.gov/nwis. U. S. Geological Survey, 2006, Saline water, on the World Wide Web at URL http://ga.water.usgs.gov/edu/saline.html . U. S. Geological Survey, 2006, National geochemical survey database, on the World Wide Web at URL http://tin.er.usgs.gov/geochem/. Warner, K. A., Bonzongo, J. C., Roden, E. E., Ward, G. M., and others, 2005, Effect of watershed parameters on mercury distribution in different environmental compartments in the Mobile Alabama River Basin, USA: Science of the Total Environment, v. 347, p. 187-207. Woods, Philip, 2003, A survey of the Bayou Sara watershed, Mobile, Alabama: Alabama Department of Environmental Management Technical Report, 202 p. Woods, Philip, 2004, An impervious surface study over three regimes: Three Mile Creek, Fly Creek, and Bay Minette Creek subwatersheds: Alabama Department of Environmental Management Technical Report, 107 p.
41

GEOLOGICAL SURVEY OF ALABAMA P.O. Box 869999
420 Hackberry Lane Tuscaloosa, Alabama 35486-6999
205/349-2852
Berry H. (Nick) Tew, Jr., State Geologist
A list of the printed publications by the Geological Survey of Alabama can be obtained from the Publications Sales Office (205/247-3636) or through our
web site at http://www.gsa.state.al.us/.
E-mail: [email protected]
The Geological Survey of Alabama (GSA) makes every effort to collect, provide, and maintain accurate and complete information. However, data acquisition and research are ongoing activities of GSA, and interpretations may be revised as new data are acquired. Therefore, all information made available to the public by GSA should be viewed in that context. Neither the GSA nor any employee thereof makes any warranty, expressed or implied, or assumes any legal responsibility for the accuracy, completeness, or usefulness of any information, apparatus, product, or process disclosed in this report. Conclusions drawn or actions taken on the basis of these data and information are the sole responsibility of the user.
As a recipient of Federal financial assistance from the U.S. Department of the Interior, the GSA prohibits discrimination on the basis of race, color, national origin, age, or disability in its programs or activities. Discrimination on the basis of sex is prohibited in federally assisted GSA education programs. If anyone believes that he or she has been discriminated against in any of the GSA’s programs or activities, including its employment practices, the individual may contact the U.S. Geological Survey, U.S. Department of the Interior, Washington, D.C. 20240.
AN EQUAL OPPORTUNITY EMPLOYER
Serving Alabama since 1848
Related Documents