MLPA Conference, Orlando June, 2016

Welcome message from author
This document is posted to help you gain knowledge. Please leave a comment to let me know what you think about it! Share it to your friends and learn new things together.
Transcript
MLPA Conference, Orlando
June, 2016
2
Notice to Recipients
This presentation is not a prospectus and is not an offer to sell, nor a solicitation of an offer to buy, securities.
Except for the historical information contained herein, the matters discussed in this presentation include
forward-looking statements that involve risks and uncertainties. These risks and uncertainties include, among
other things, market conditions and other factors that are described in KNOT Offshore Partners LP’s (“KNOP”)
filings with the U.S Securities and Exchange Commission (“SEC”), which are available on the SEC’s website at
http://www.sec.gov.
Nevertheless, new factors emerge from time to time, and it is not possible for KNOP to predict all of these
factors. Further, KNOP cannot assess the impact of each such factor on its business or the extent to which any
factor, or combination of factors, may cause actual results to be materially different from those contained in any
forward-looking statement. KNOP expressly disclaims any intention or obligation to revise or publicly update
any forward-looking statements whether as a result of new information, future events or otherwise. The forward-
looking statements contained herein are expressly qualified by this cautionary notice to recipients.
3
Company overview
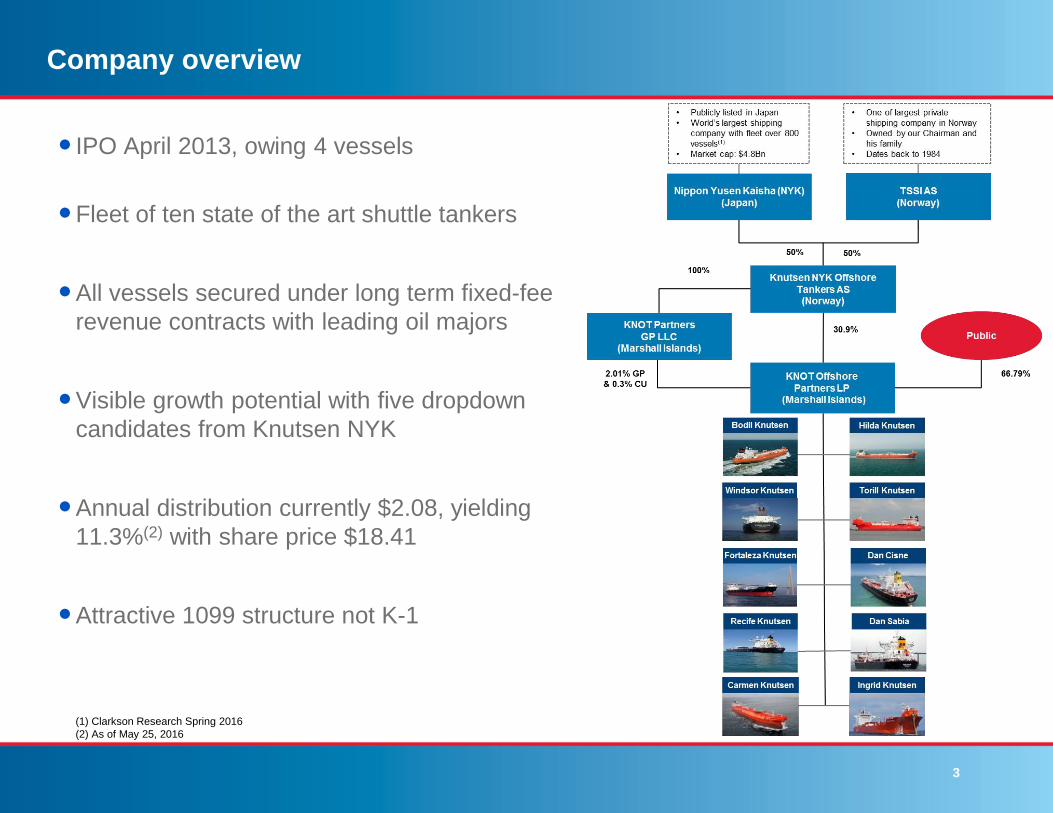
IPO April 2013, owing 4 vessels
Fleet of ten state of the art shuttle tankers
All vessels secured under long term fixed-fee
revenue contracts with leading oil majors
Visible growth potential with five dropdown
candidates from Knutsen NYK
Annual distribution currently $2.08, yielding
11.3%(2) with share price $18.41
Attractive 1099 structure not K-1
(1) Clarkson Research Spring 2016
(2) As of May 25, 2016
4
Business Strategy
Pursue strategic &
accretive acquisitions of
shuttle tankers on long-
term, fixed- rate charters
Expand global operations
in high-growth regions
Manage fleet and deepen
customer relationships to
provide a stable cash flow
base
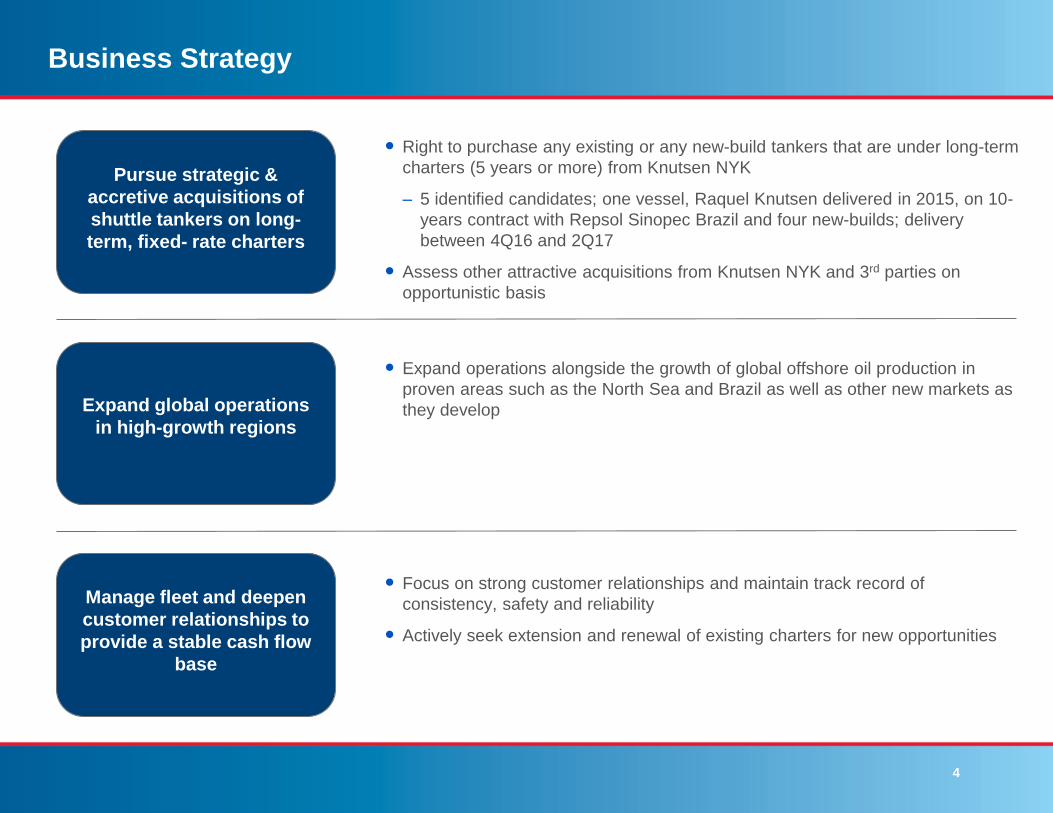
Right to purchase any existing or any new-build tankers that are under long-term
charters (5 years or more) from Knutsen NYK
– 5 identified candidates; one vessel, Raquel Knutsen delivered in 2015, on 10-
years contract with Repsol Sinopec Brazil and four new-builds; delivery
between 4Q16 and 2Q17
Assess other attractive acquisitions from Knutsen NYK and 3rd parties on
opportunistic basis
Expand operations alongside the growth of global offshore oil production in
proven areas such as the North Sea and Brazil as well as other new markets as
they develop
Focus on strong customer relationships and maintain track record of
consistency, safety and reliability
Actively seek extension and renewal of existing charters for new opportunities
5
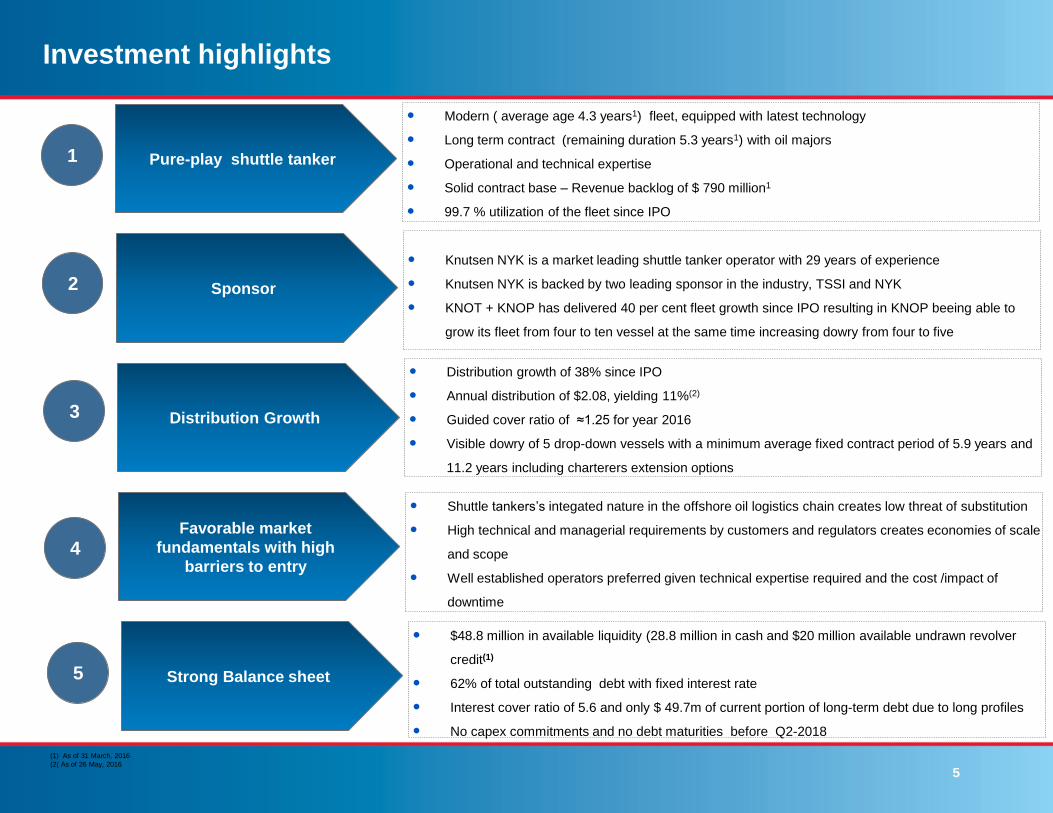
Investment highlights
Pure-play shuttle tanker
Modern ( average age 4.3 years1) fleet, equipped with latest technology
Long term contract (remaining duration 5.3 years1) with oil majors
Operational and technical expertise
Solid contract base – Revenue backlog of $ 790 million1
99.7 % utilization of the fleet since IPO
1
Sponsor
Knutsen NYK is a market leading shuttle tanker operator with 29 years of experience
Knutsen NYK is backed by two leading sponsor in the industry, TSSI and NYK
KNOT + KNOP has delivered 40 per cent fleet growth since IPO resulting in KNOP beeing able to
grow its fleet from four to ten vessel at the same time increasing dowry from four to five
2
Distribution Growth
Distribution growth of 38% since IPO
Annual distribution of $2.08, yielding 11%(2)
Guided cover ratio of ≈1.25 for year 2016
Visible dowry of 5 drop-down vessels with a minimum average fixed contract period of 5.9 years and
11.2 years including charterers extension options
3
Favorable market
fundamentals with high
barriers to entry
Shuttle tankers’s integated nature in the offshore oil logistics chain creates low threat of substitution
High technical and managerial requirements by customers and regulators creates economies of scale
and scope
Well established operators preferred given technical expertise required and the cost /impact of
downtime
4
Strong Balance sheet
$48.8 million in available liquidity (28.8 million in cash and $20 million available undrawn revolver
credit(1)
62% of total outstanding debt with fixed interest rate
Interest cover ratio of 5.6 and only $ 49.7m of current portion of long-term debt due to long profiles
No capex commitments and no debt maturities before Q2-2018
5
(1) As of 31 March, 2016
(2( As of 26 May, 2016
6
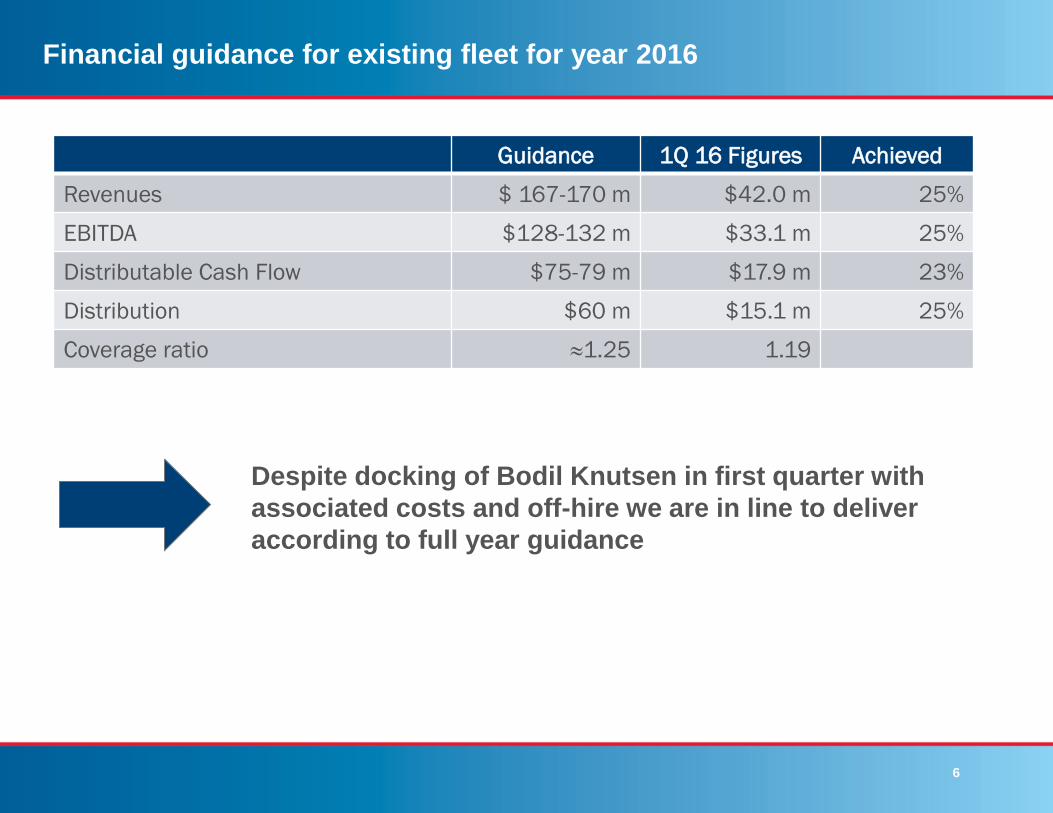
Financial guidance for existing fleet for year 2016
Guidance 1Q 16 Figures Achieved
Revenues $ 167-170 m $42.0 m 25%
EBITDA $128-132 m $33.1 m 25%
Distributable Cash Flow $75-79 m $17.9 m 23%
Distribution $60 m $15.1 m 25%
Coverage ratio ≈1.25 1.19
Despite docking of Bodil Knutsen in first quarter with
associated costs and off-hire we are in line to deliver
according to full year guidance
7
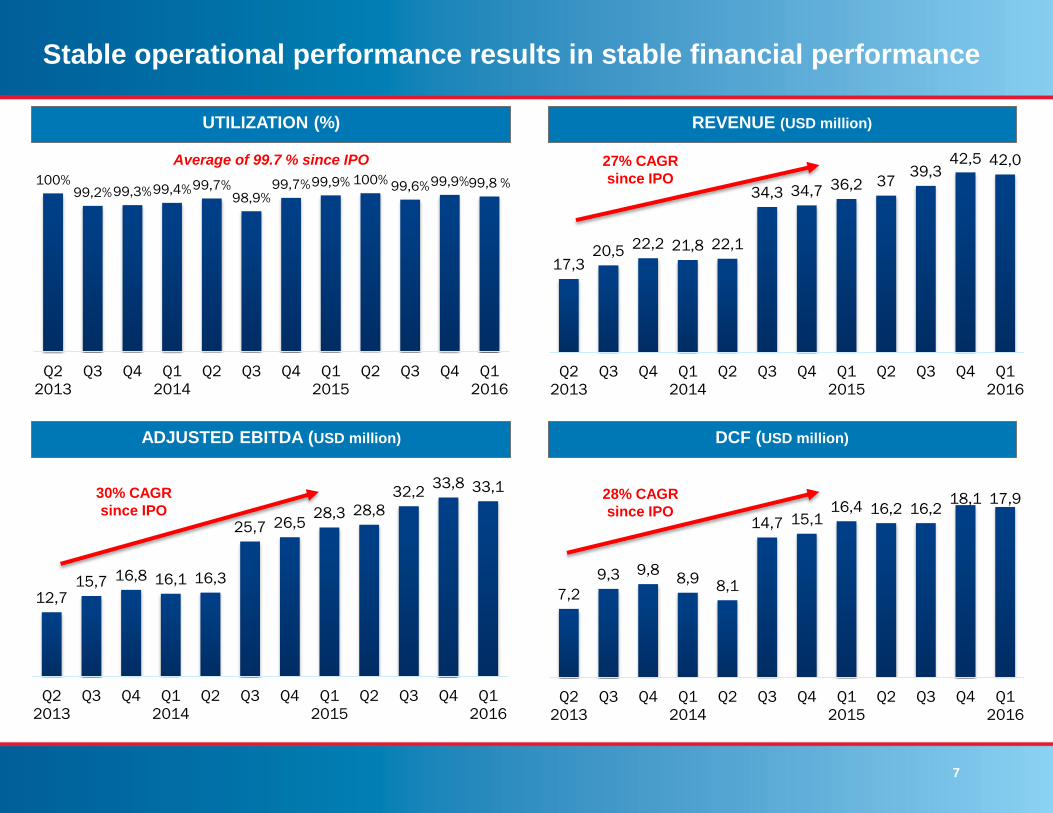
Stable operational performance results in stable financial performance
17,320,5
22,2 21,8 22,1
34,3 34,7 36,2 3739,3
42,5 42,0
Q2
2013
Q3 Q4 Q1
2014
Q2 Q3 Q4 Q1
2015
Q2 Q3 Q4 Q1
2016
REVENUE (USD million)
ADJUSTED EBITDA (USD million)
100%99,2%99,3%99,4%99,7%
98,9%99,7%99,9% 100%
99,6%99,9%99,8 %
Q2
2013
Q3 Q4 Q1
2014
Q2 Q3 Q4 Q1
2015
Q2 Q3 Q4 Q1
2016
UTILIZATION (%)
7,2
9,3 9,88,9
8,1
14,7 15,116,4 16,2 16,2
18,1 17,9
Q2
2013
Q3 Q4 Q1
2014
Q2 Q3 Q4 Q1
2015
Q2 Q3 Q4 Q1
2016
12,715,7 16,8 16,1 16,3
25,7 26,528,3 28,8
32,233,8 33,1
Q2
2013
Q3 Q4 Q1
2014
Q2 Q3 Q4 Q1
2015
Q2 Q3 Q4 Q1
2016
DCF (USD million)
Average of 99.7 % since IPO 27% CAGR
since IPO
28% CAGR
since IPO
30% CAGR
since IPO
8
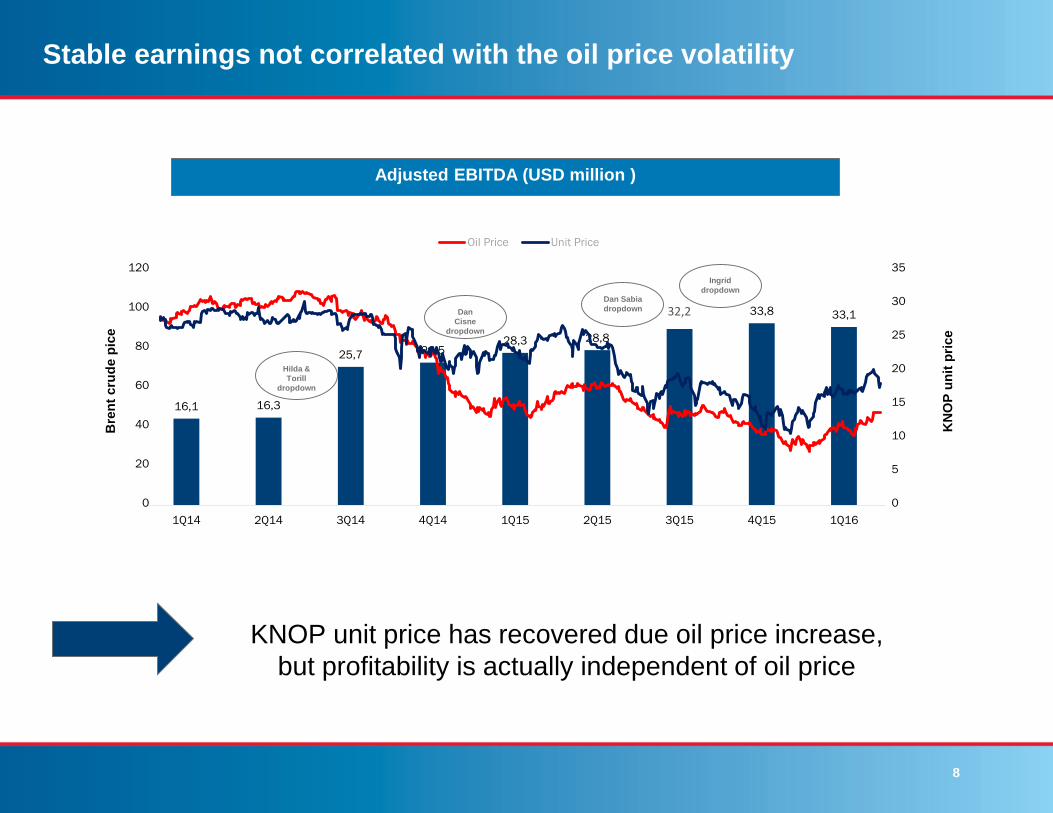
16,1 16,3
25,7 26,528,3 28,8
33,8 33,8 33,1
1Q14 2Q14 3Q14 4Q14 1Q15 2Q15 3Q15 4Q15 1Q16
Stable earnings not correlated with the oil price volatility
0
5
10
15
20
25
30
35
0
20
40
60
80
100
120
Oil Price Unit Price
Adjusted EBITDA (USD million )
Bre
nt
cru
de p
ice
KN
OP
un
it p
rice
KNOP unit price has recovered due oil price increase,
but profitability is actually independent of oil price
Hilda &
Torill
dropdown
Dan
Cisne
dropdown
32,2Dan Sabia
dropdown
Ingrid
dropdown
9
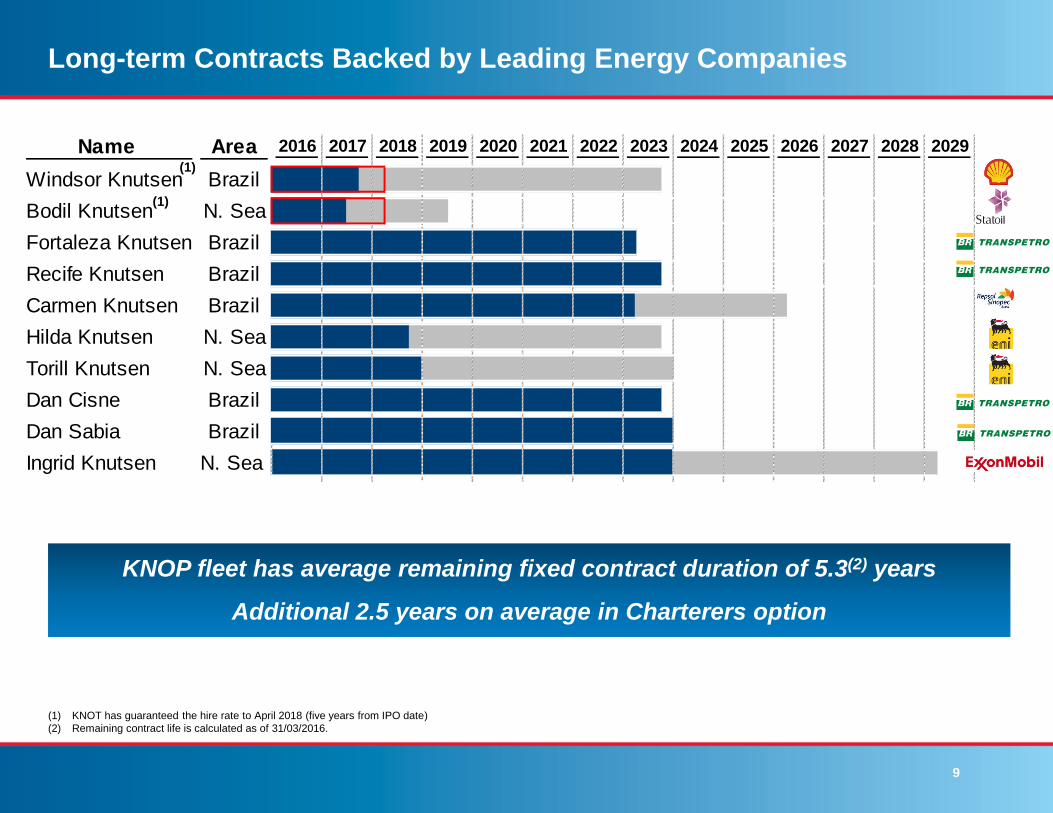
Name Area 2016 2017 2018 2019 2020 2021 2022 2023 2024 2025 2026 2027 2028 2029 2030
Windsor Knutsen Brazil
Bodil Knutsen N. Sea
Fortaleza Knutsen Brazil
Recife Knutsen Brazil
Carmen Knutsen Brazil
Hilda Knutsen N. Sea
Torill Knutsen N. Sea
Dan Cisne Brazil
Dan Sabia Brazil
Ingrid Knutsen N. Sea
Long-term Contracts Backed by Leading Energy Companies
KNOP fleet has average remaining fixed contract duration of 5.3(2) years
Additional 2.5 years on average in Charterers option
(1) KNOT has guaranteed the hire rate to April 2018 (five years from IPO date)
(2) Remaining contract life is calculated as of 31/03/2016.
(1)
(1)
10
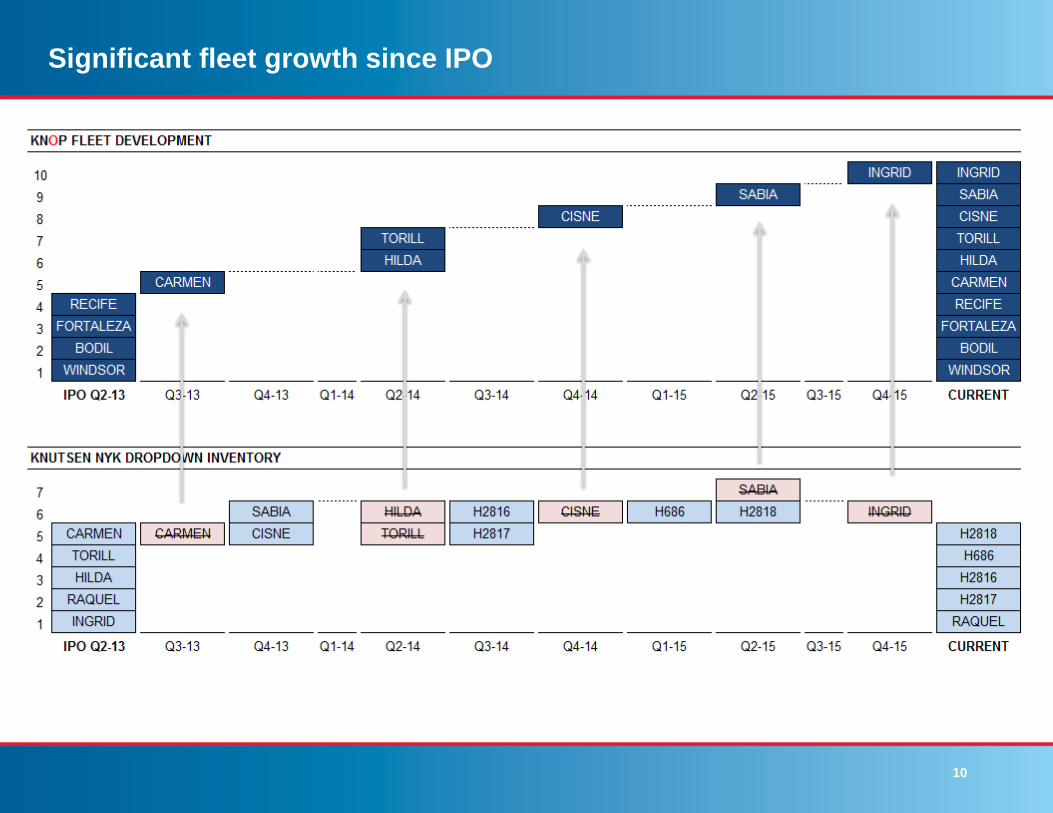
Significant fleet growth since IPO
11
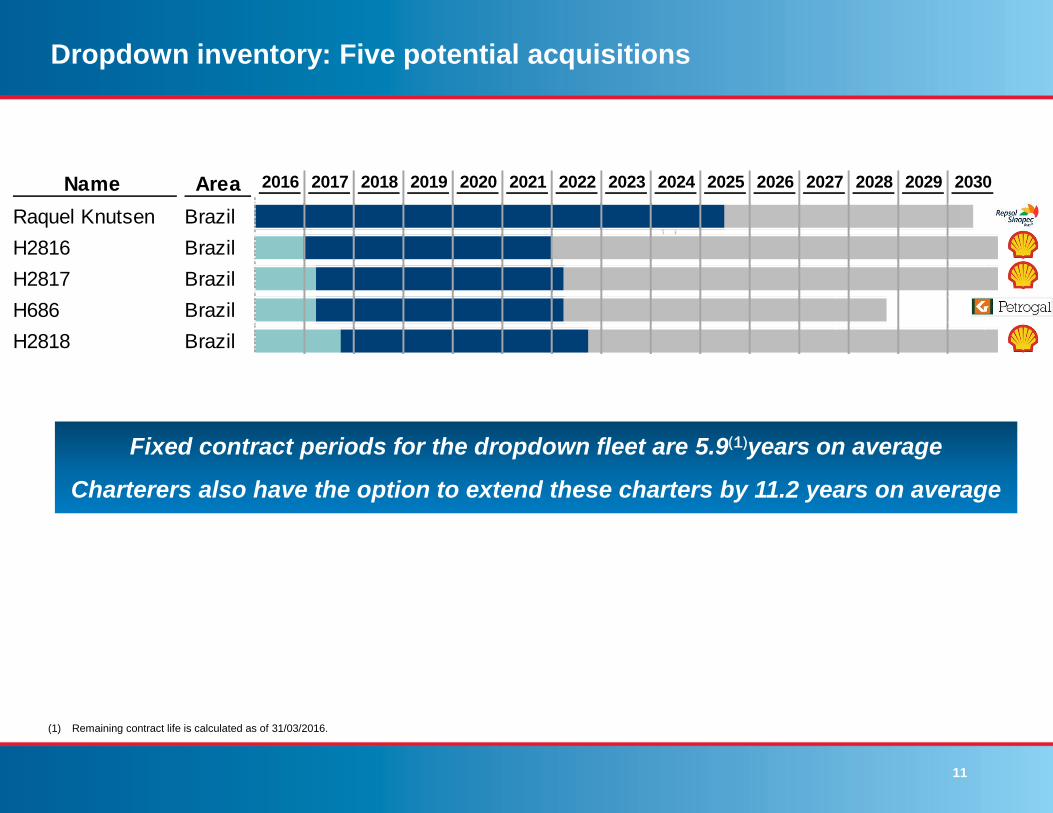
Dropdown inventory: Five potential acquisitions
Fixed contract periods for the dropdown fleet are 5.9(1)years on average
Charterers also have the option to extend these charters by 11.2 years on average
(1) Remaining contract life is calculated as of 31/03/2016.
Name Area 2016 2017 2018 2019 2020 2021 2022 2023 2024 2025 2026 2027 2028 2029 2030
Raquel Knutsen Brazil
H2816 Brazil
H2817 Brazil
H686 Brazil
H2818 Brazil
12
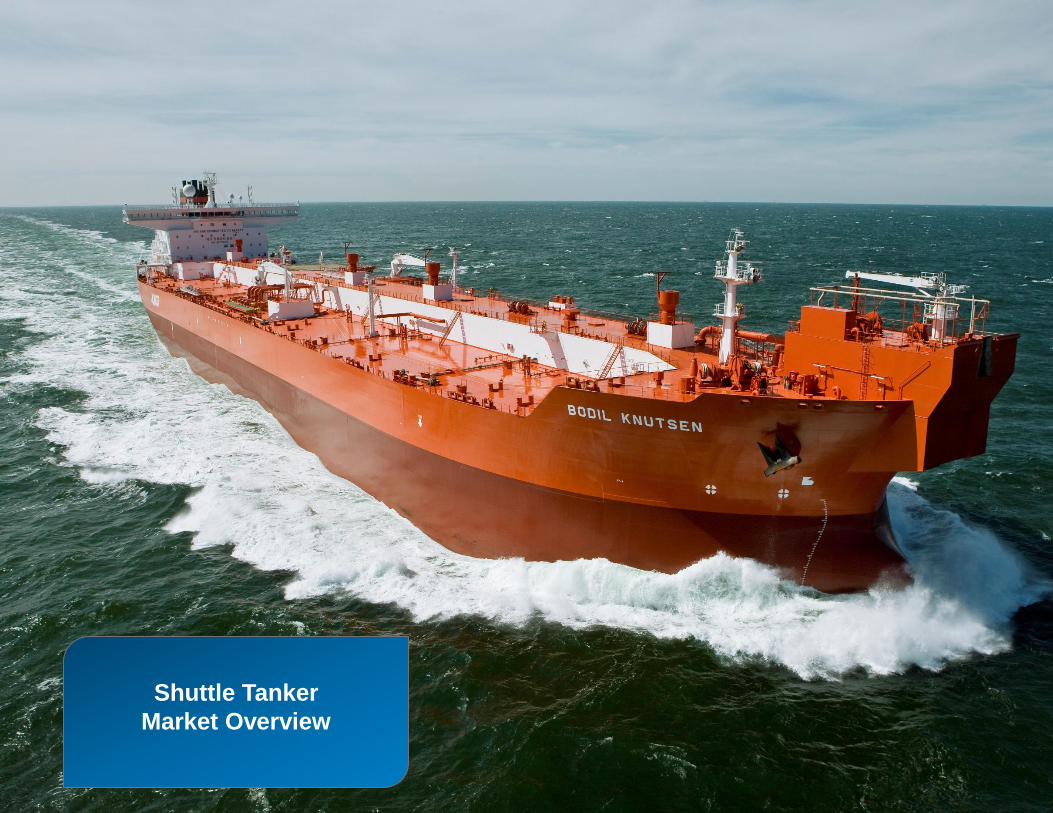
Shuttle Tanker Market Overview
Shuttle Tanker
Market Overview
13
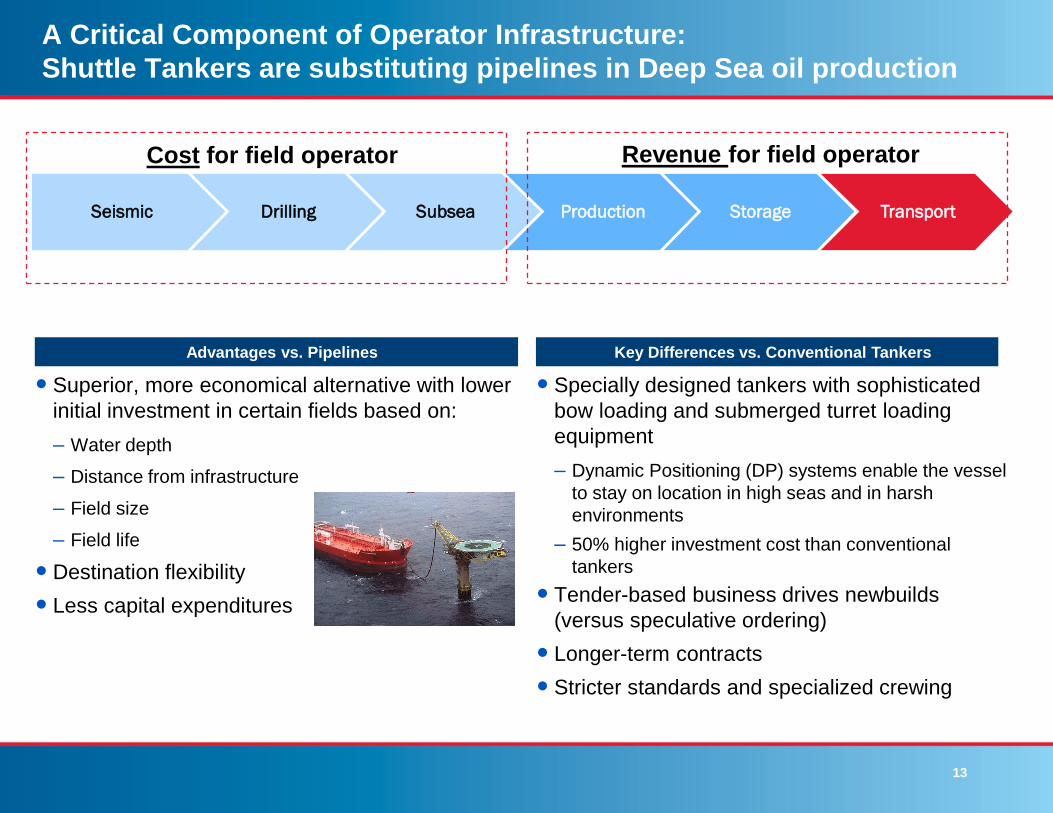
A Critical Component of Operator Infrastructure:
Shuttle Tankers are substituting pipelines in Deep Sea oil production
Superior, more economical alternative with lower
initial investment in certain fields based on:
– Water depth
– Distance from infrastructure
– Field size
– Field life
Destination flexibility
Less capital expenditures
Specially designed tankers with sophisticated
bow loading and submerged turret loading
equipment
– Dynamic Positioning (DP) systems enable the vessel
to stay on location in high seas and in harsh
environments
– 50% higher investment cost than conventional
tankers
Tender-based business drives newbuilds
(versus speculative ordering)
Longer-term contracts
Stricter standards and specialized crewing
Advantages vs. Pipelines Key Differences vs. Conventional Tankers
Seismic Drilling Subsea Production Storage Transport
Cost for field operator Revenue for field operator
14
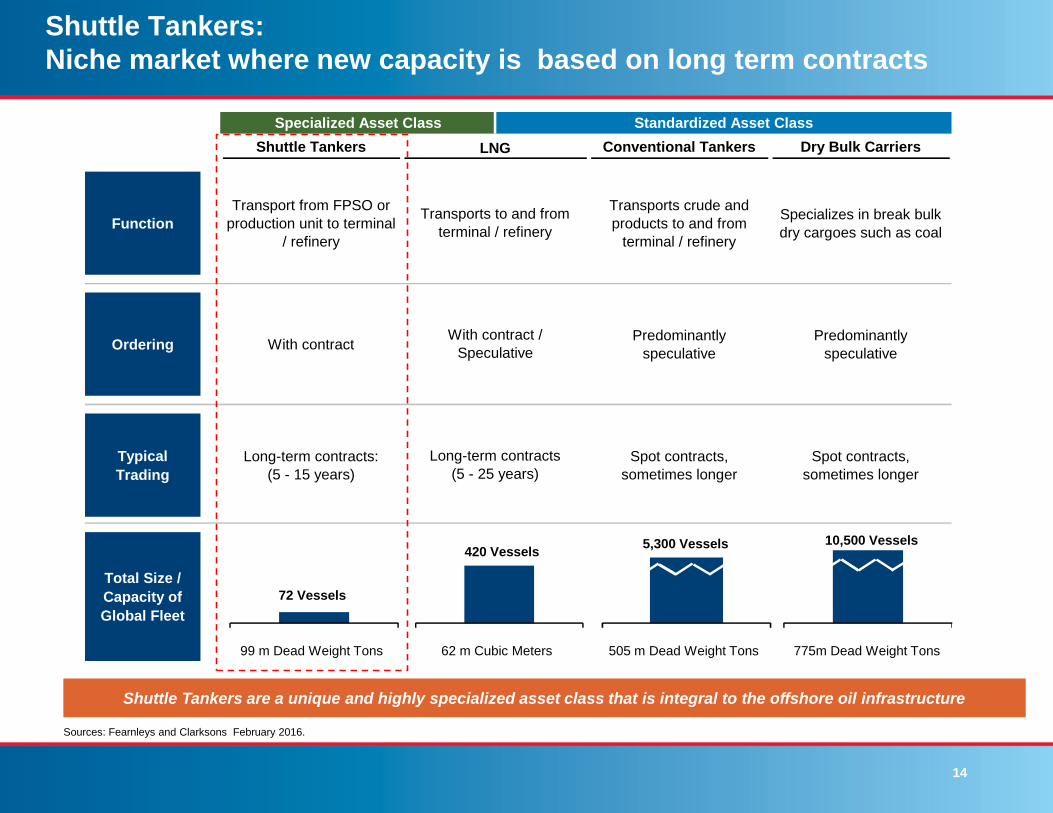
Specialized Asset Class Standardized Asset Class
Shuttle Tankers Conventional Tankers Dry Bulk Carriers
Function
Transport from FPSO or
production unit to terminal
/ refinery
Transports crude and
products to and from
terminal / refinery
Specializes in break bulk
dry cargoes such as coal
Ordering With contractPredominantly
speculative
Predominantly
speculative
Typical
Trading
Long-term contracts:
(5 - 15 years)
Spot contracts,
sometimes longer
Spot contracts,
sometimes longer
Total Size /
Capacity of
Global Fleet
9mm Dead Weight Tons 440mm Dead Weight Tons 670mm Dead Weight Tons
LNG
Transports to and from
terminal / refinery
With contract /
Speculative
Long-term contracts
(5 - 25 years)
53mm Cubic Meters
Shuttle Tankers:
Niche market where new capacity is based on long term contracts
Sources: Fearnleys and Clarksons February 2016.
Shuttle Tankers are a unique and highly specialized asset class that is integral to the offshore oil infrastructure
72 Vessels
420 Vessels5,300 Vessels 10,500 Vessels
62 m Cubic Meters 505 m Dead Weight Tons 775m Dead Weight Tons99 m Dead Weight Tons
15
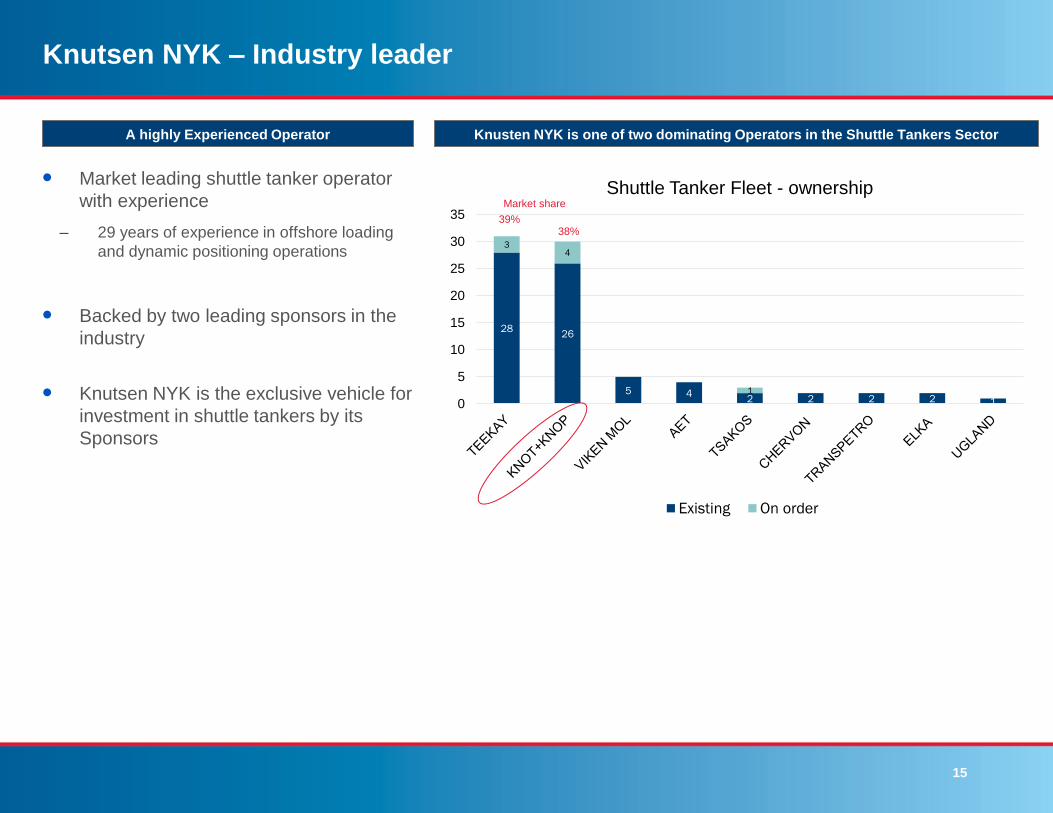
Knutsen NYK – Industry leader
2826
5 42 2 2 2 1
34
1
0
5
10
15
20
25
30
35
Shuttle Tanker Fleet - ownership
Existing On order
Market leading shuttle tanker operator
with experience
– 29 years of experience in offshore loading
and dynamic positioning operations
Backed by two leading sponsors in the
industry
Knutsen NYK is the exclusive vehicle for
investment in shuttle tankers by its
Sponsors
A highly Experienced Operator Knusten NYK is one of two dominating Operators in the Shuttle Tankers Sector
39%38%
Market share
16
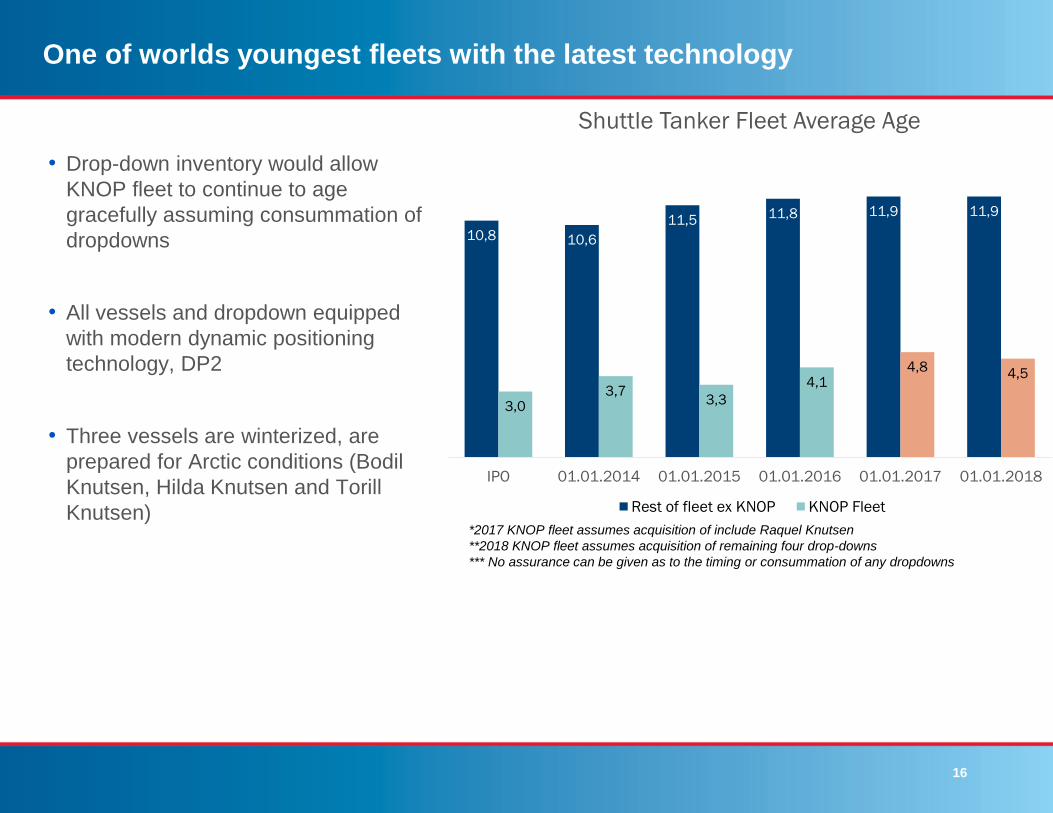
One of worlds youngest fleets with the latest technology
• Drop-down inventory would allow
KNOP fleet to continue to age
gracefully assuming consummation of
dropdowns
• All vessels and dropdown equipped
with modern dynamic positioning
technology, DP2
• Three vessels are winterized, are
prepared for Arctic conditions (Bodil
Knutsen, Hilda Knutsen and Torill
Knutsen)*2017 KNOP fleet assumes acquisition of include Raquel Knutsen
**2018 KNOP fleet assumes acquisition of remaining four drop-downs
*** No assurance can be given as to the timing or consummation of any dropdowns
10,8 10,6
11,511,8 11,9 11,9
3,03,7
3,3
4,14,8
4,5
IPO 01.01.2014 01.01.2015 01.01.2016 01.01.2017 01.01.2018
Shuttle Tanker Fleet Average Age
Rest of fleet ex KNOP KNOP Fleet
17
Oil production from shuttle tanker operated fields
91
0
82
8
75
4
68
6
62
4
56
8
19
2
47
0
64
0
73
0
89
0
0
200
400
600
800
1000
1200
1400
1600
2015 2016 2017 2018 2019 2020
North Sea – output from Shuttle Tanker operated fields
Existing field New fields
21
40
19
69
18
11
16
66
15
33
14
10
58
0
14
30
17
30
25
30
0
500
1000
1500
2000
2500
3000
3500
4000
4500
2015 2016 2017 2018 2019 2020
Brazil – output from Shuttle Tanker operated fields
Existing fields New fields
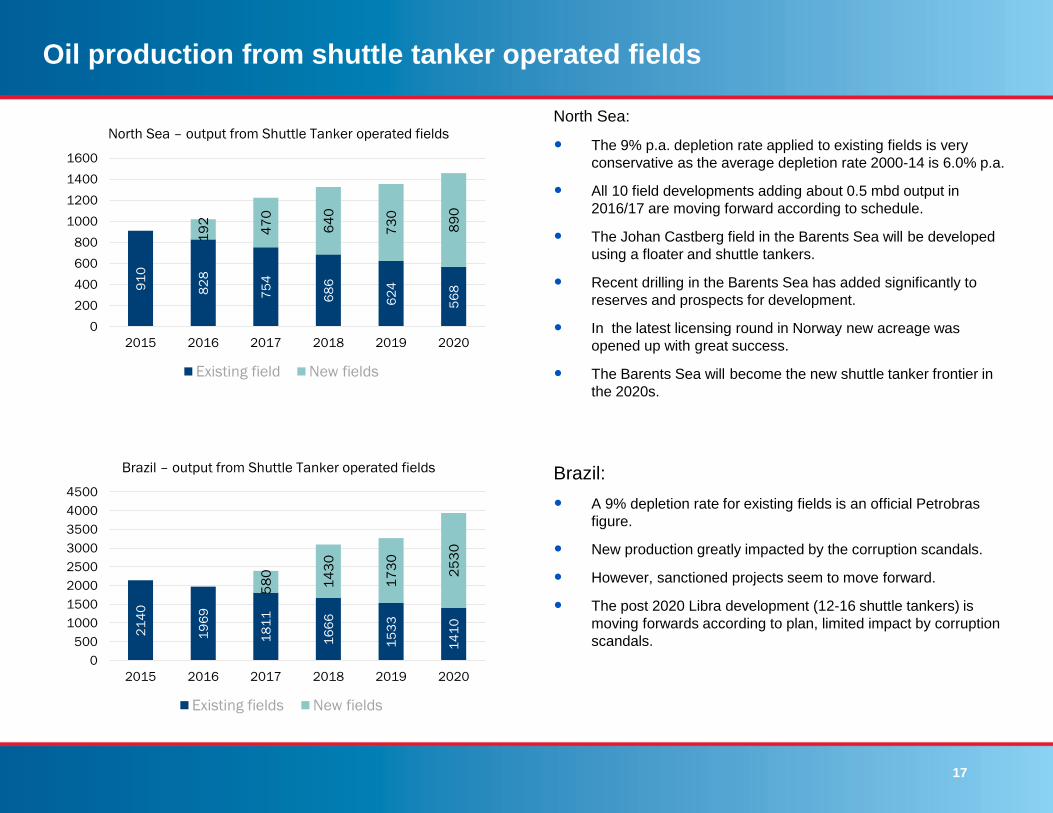
North Sea:
The 9% p.a. depletion rate applied to existing fields is very
conservative as the average depletion rate 2000-14 is 6.0% p.a.
All 10 field developments adding about 0.5 mbd output in
2016/17 are moving forward according to schedule.
The Johan Castberg field in the Barents Sea will be developed
using a floater and shuttle tankers.
Recent drilling in the Barents Sea has added significantly to
reserves and prospects for development.
In the latest licensing round in Norway new acreage was
opened up with great success.
The Barents Sea will become the new shuttle tanker frontier in
the 2020s.
Brazil:
A 9% depletion rate for existing fields is an official Petrobras
figure.
New production greatly impacted by the corruption scandals.
However, sanctioned projects seem to move forward.
The post 2020 Libra development (12-16 shuttle tankers) is
moving forwards according to plan, limited impact by corruption
scandals.
18
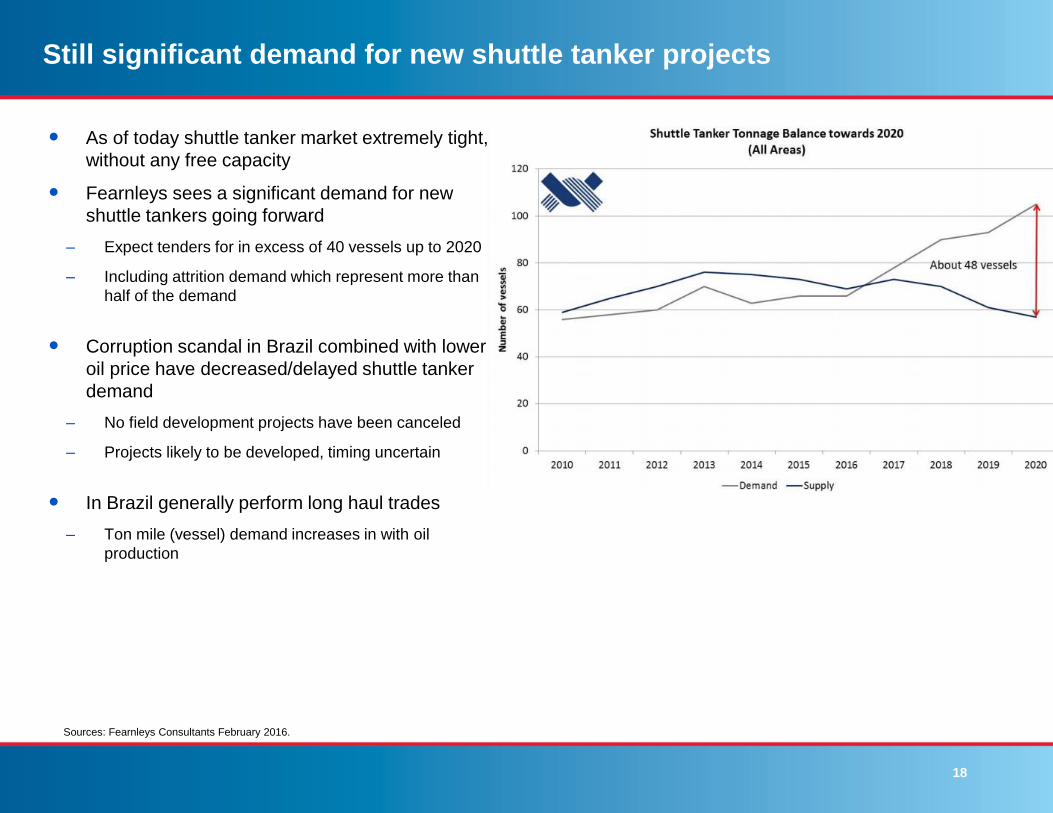
Still significant demand for new shuttle tanker projects
As of today shuttle tanker market extremely tight,
without any free capacity
Fearnleys sees a significant demand for new
shuttle tankers going forward
– Expect tenders for in excess of 40 vessels up to 2020
– Including attrition demand which represent more than
half of the demand
Corruption scandal in Brazil combined with lower
oil price have decreased/delayed shuttle tanker
demand
– No field development projects have been canceled
– Projects likely to be developed, timing uncertain
In Brazil generally perform long haul trades
– Ton mile (vessel) demand increases in with oil
production
Sources: Fearnleys Consultants February 2016.
19
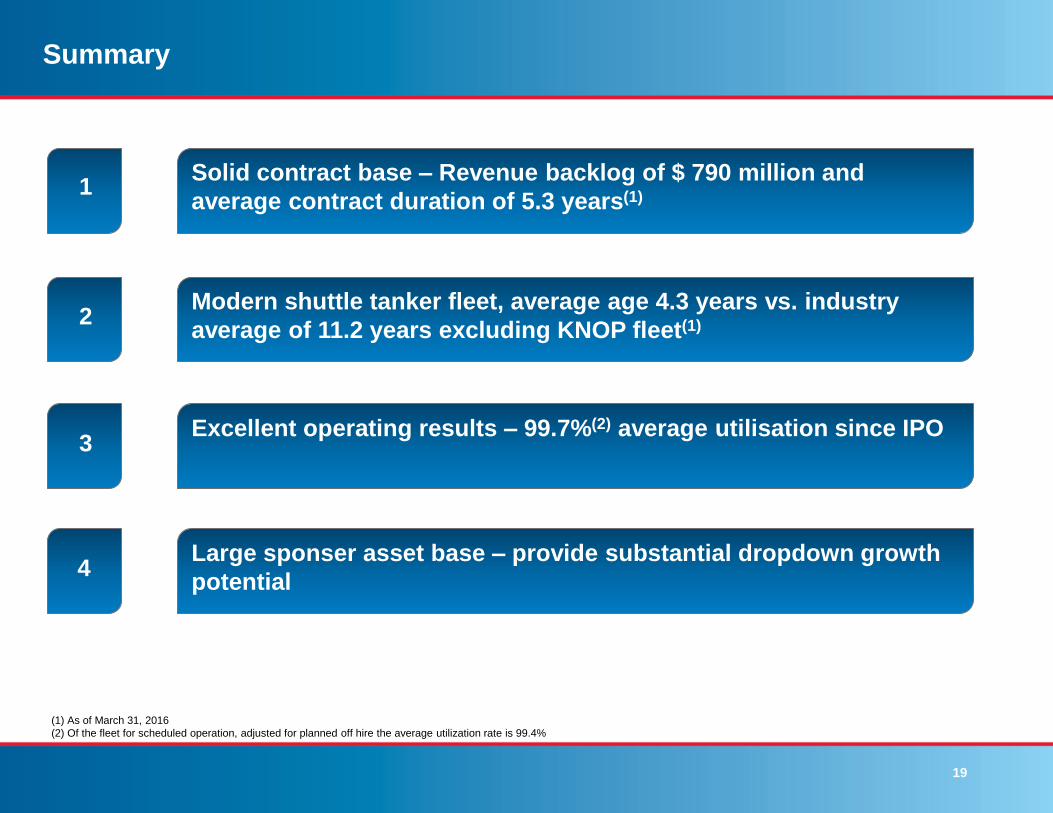
Summary
Solid contract base – Revenue backlog of $ 790 million and
average contract duration of 5.3 years(1)
1
Modern shuttle tanker fleet, average age 4.3 years vs. industry
average of 11.2 years excluding KNOP fleet(1)
Excellent operating results – 99.7%(2) average utilisation since IPO
Large sponser asset base – provide substantial dropdown growth
potential
1
2
3
4
(1) As of March 31, 2016
(2) Of the fleet for scheduled operation, adjusted for planned off hire the average utilization rate is 99.4%

Appendix
APPENDIX
21
Non-GAAP Financial Measures
Adjusted EBITDA
Adjusted EBITDA refers to earnings before interest, other financial items, taxes, non-controlling interest, depreciation and
amortization. Adjusted EBITDA is a non-GAAP financial measure used by investors to measure our performance.
The Partnership believes that Adjusted EBITDA assists its management and investors by increasing the comparability of its
performance from period to period and against the performance of other companies in its industry that provide Adjusted EBITDA
information. This increased comparability is achieved by excluding the potentially disparate effects between periods or companies
of interest, other financial items, taxes and depreciation and amortization, which items are affected by various and possibly
changing financing methods, capital structure and historical cost basis and which items may significantly affect net income
between periods. The Partnership believes that including Adjusted EBITDA as a financial measure benefits investors in
(a) selecting between investing in the Partnership and other investment alternatives and (b) monitoring the Partnership’s ongoing
financial and operational strength in assessing whether to continue to hold common units. Adjusted EBITDA is a non-GAAP
financial measure and should not be considered as an alternative to net income or any other indicator of Partnership performance
calculated in accordance with GAAP.
Distributable Cash Flow
Distributable cash flow represents net income adjusted for depreciation and amortization, unrealized gains and losses from
derivatives, unrealized foreign exchange gains and losses, other non-cash items and estimated maintenance and replacement
capital expenditures. Estimated maintenance and replacement capital expenditures, including estimated expenditures for
drydocking, represent capital expenditures required to maintain over the long-term the operating capacity of, or the revenue
generated by our capital assets. Distributable cash flow is a quantitative standard used by investors in publicly-traded partnerships
to assist in evaluating a partnership’s ability to make quarterly cash distributions. Distributable cash flow is a non-GAAP financial
measure and should not be considered as an alternative to net income or any other indicator of KNOT Offshore Partners’
performance calculated in accordance with GAAP.
22
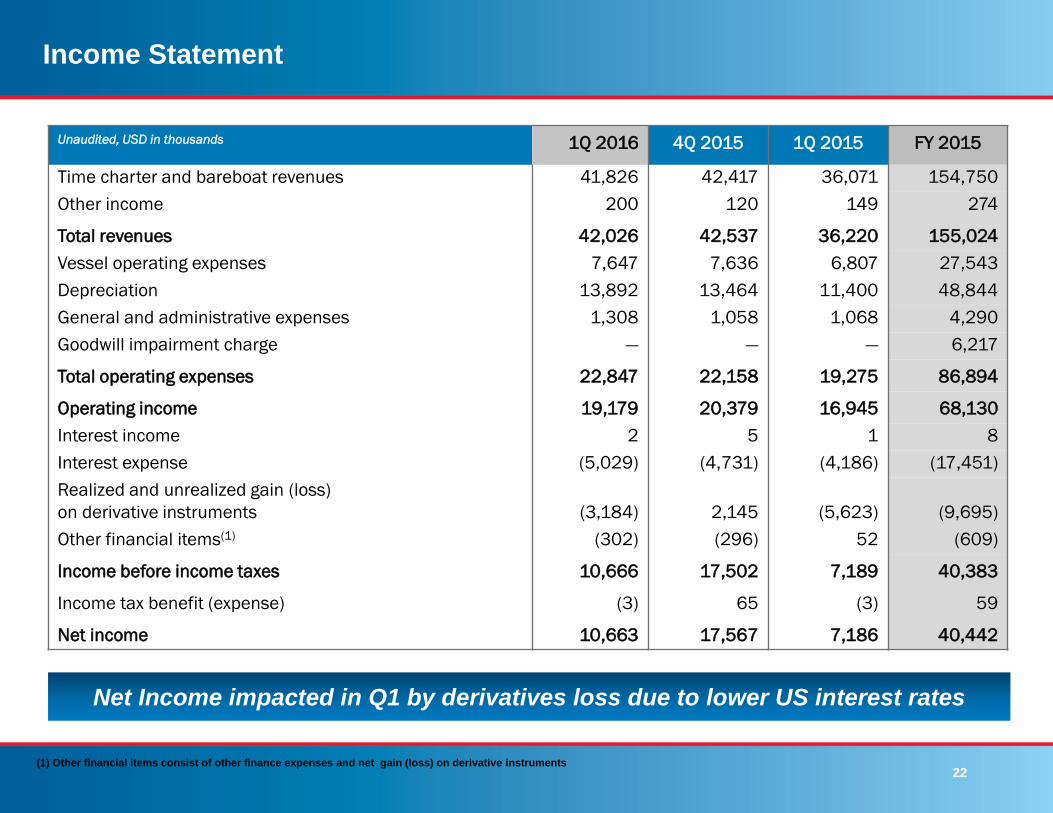
Income Statement
Unaudited, USD in thousands 1Q 2016 4Q 2015 1Q 2015 FY 2015
Time charter and bareboat revenues 41,826 42,417 36,071 154,750
Other income 200 120 149 274
Total revenues 42,026 42,537 36,220 155,024
Vessel operating expenses 7,647 7,636 6,807 27,543
Depreciation 13,892 13,464 11,400 48,844
General and administrative expenses 1,308 1,058 1,068 4,290
Goodwill impairment charge — — — 6,217
Total operating expenses 22,847 22,158 19,275 86,894
Operating income 19,179 20,379 16,945 68,130
Interest income 2 5 1 8
Interest expense (5,029) (4,731) (4,186) (17,451)
Realized and unrealized gain (loss)
on derivative instruments (3,184) 2,145 (5,623) (9,695)
Other financial items(1) (302) (296) 52 (609)
Income before income taxes 10,666 17,502 7,189 40,383
Income tax benefit (expense) (3) 65 (3) 59
Net income 10,663 17,567 7,186 40,442
(1) Other financial items consist of other finance expenses and net gain (loss) on derivative instruments
Net Income impacted in Q1 by derivatives loss due to lower US interest rates
23
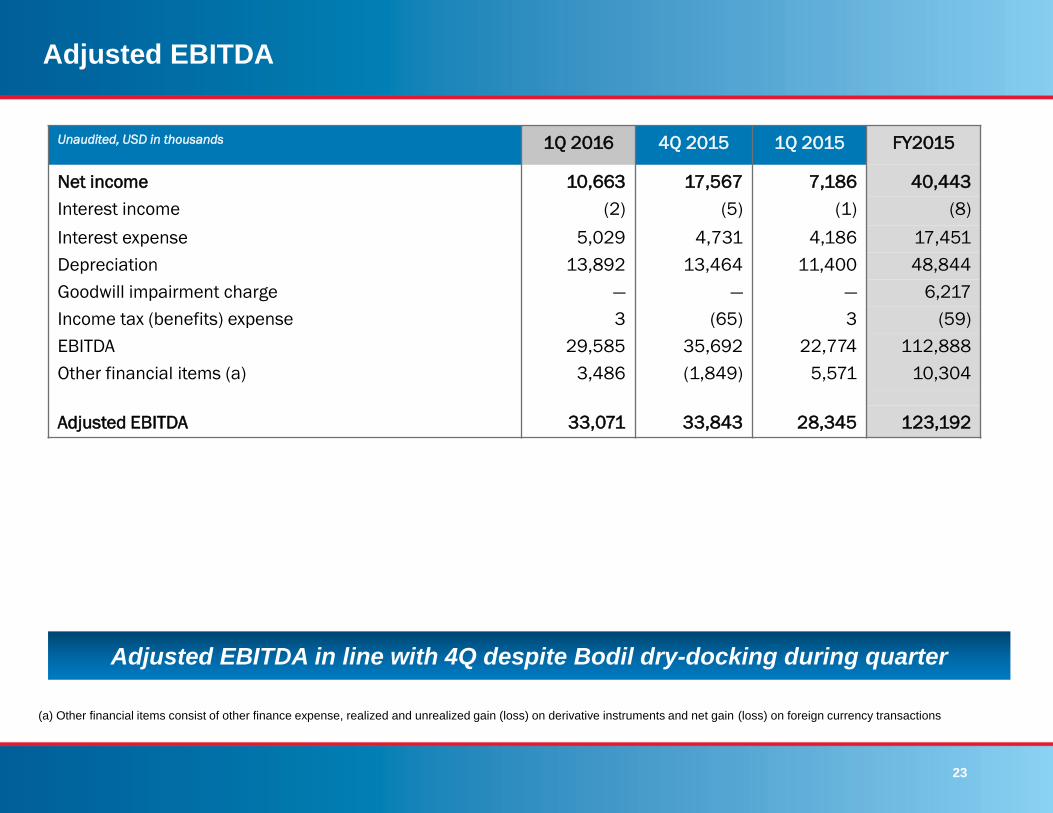
Adjusted EBITDA
Unaudited, USD in thousands 1Q 2016 4Q 2015 1Q 2015 FY2015
Net income 10,663 17,567 7,186 40,443
Interest income (2) (5) (1) (8)
Interest expense 5,029 4,731 4,186 17,451
Depreciation 13,892 13,464 11,400 48,844
Goodwill impairment charge — — — 6,217
Income tax (benefits) expense 3 (65) 3 (59)
EBITDA 29,585 35,692 22,774 112,888
Other financial items (a) 3,486 (1,849) 5,571 10,304
Adjusted EBITDA 33,071 33,843 28,345 123,192
(a) Other financial items consist of other finance expense, realized and unrealized gain (loss) on derivative instruments and net gain (loss) on foreign currency transactions
Adjusted EBITDA in line with 4Q despite Bodil dry-docking during quarter
24
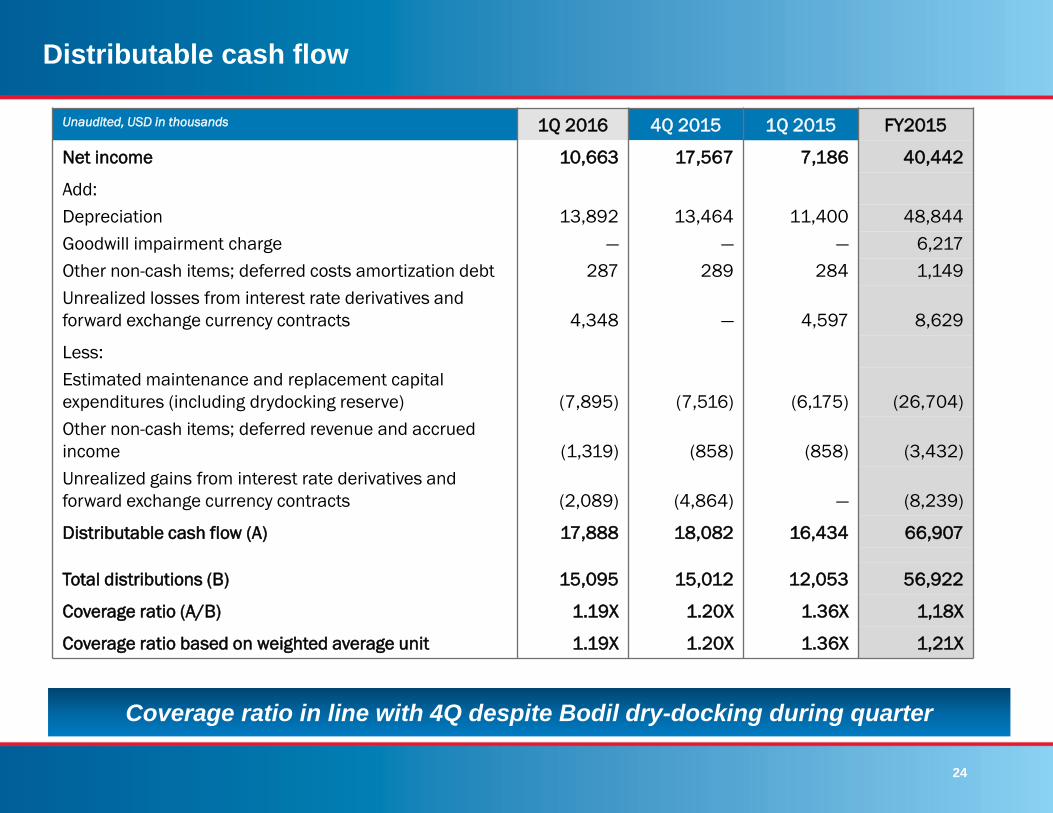
Distributable cash flow
Unaudited, USD in thousands 1Q 2016 4Q 2015 1Q 2015 FY2015
Net income 10,663 17,567 7,186 40,442
Add:
Depreciation 13,892 13,464 11,400 48,844
Goodwill impairment charge — — — 6,217
Other non-cash items; deferred costs amortization debt 287 289 284 1,149
Unrealized losses from interest rate derivatives and
forward exchange currency contracts 4,348 — 4,597 8,629
Less:
Estimated maintenance and replacement capital
expenditures (including drydocking reserve) (7,895) (7,516) (6,175) (26,704)
Other non-cash items; deferred revenue and accrued
income (1,319) (858) (858) (3,432)
Unrealized gains from interest rate derivatives and
forward exchange currency contracts (2,089) (4,864) — (8,239)
Distributable cash flow (A) 17,888 18,082 16,434 66,907
Total distributions (B) 15,095 15,012 12,053 56,922
Coverage ratio (A/B) 1.19X 1.20X 1.36X 1,18X
Coverage ratio based on weighted average unit 1.19X 1.20X 1.36X 1,21X
Coverage ratio in line with 4Q despite Bodil dry-docking during quarter
25
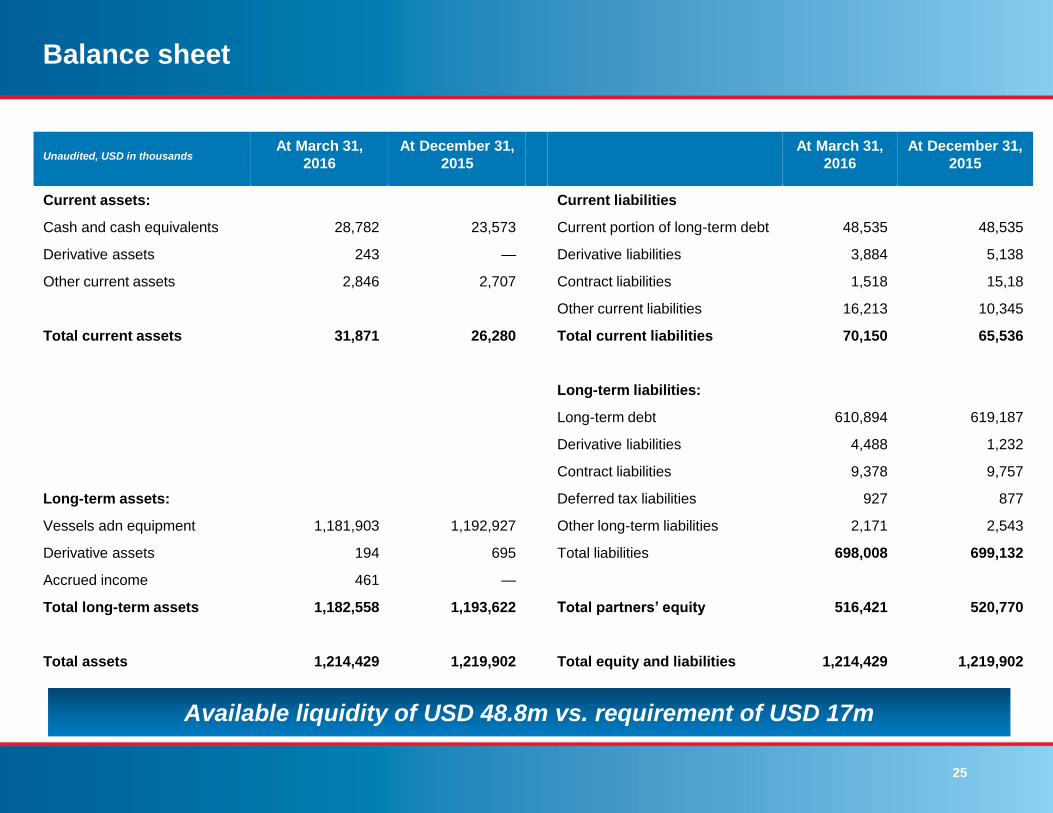
Balance sheet
Unaudited, USD in thousands At March 31,
2016
At December 31,
2015
At March 31,
2016
At December 31,
2015
Current assets: Current liabilities
Cash and cash equivalents 28,782 23,573 Current portion of long-term debt 48,535 48,535
Derivative assets 243 — Derivative liabilities 3,884 5,138
Other current assets 2,846 2,707 Contract liabilities 1,518 15,18
Other current liabilities 16,213 10,345
Total current assets 31,871 26,280 Total current liabilities 70,150 65,536
Long-term liabilities:
Long-term debt 610,894 619,187
Derivative liabilities 4,488 1,232
Contract liabilities 9,378 9,757
Long-term assets: Deferred tax liabilities 927 877
Vessels adn equipment 1,181,903 1,192,927 Other long-term liabilities 2,171 2,543
Derivative assets 194 695 Total liabilities 698,008 699,132
Accrued income 461 —
Total long-term assets 1,182,558 1,193,622 Total partners’ equity 516,421 520,770
Total assets 1,214,429 1,219,902 Total equity and liabilities 1,214,429 1,219,902
Available liquidity of USD 48.8m vs. requirement of USD 17m
Related Documents


![Obesity for medical students.ppt [Read-Only] · Obesity rates could double in n 30 30 years n n n n n n l l l l l l t o o u u u u n l o 50 40 30 20 10 0 % o f p o p u l a t i o n](https://static.cupdf.com/doc/110x72/5f69c2065ed9c21bae08d305/obesity-for-medical-read-only-obesity-rates-could-double-in-n-30-30-years-n-n.jpg)