- O' . . . , f ' I O . I h = t | | 00000140 . ,. . / m* k, i 8003240 . . - - _ - _ . _ - . _- _ . . _ . . _ _ _ _ _ _ - . - .

Welcome message from author
This document is posted to help you gain knowledge. Please leave a comment to let me know what you think about it! Share it to your friends and learn new things together.
Transcript

- O'.
. . ,
f
'
I
O.
I h=
t
|
|
00000140.
,. ./ m* k,
i
8003240
. . - - _ - _ . _ - . _- _ . . _ . . _ _ _ _ _ _ - . - .

TABLE OF CONTERS
Section Page
3 RFAC'IOR 3-1
31 DESIGN BASES 3-1
3 1.1 PERFORMANCE OBJECTIVES 3-1
3 1.2 LIMITS 3-1
3 1.2.1 Nuclear Limits 3-1
3 1.2.2 Reactivity Control Limits 3-2
3 1.2 3 Themal and Hydraulie Limits 3-2
3 1.2.4 Mechanical Limits 3-3
32 REACTOR DESIGN 3-6
3 2.1 GENERAL SUMMARY 3-6
3 2.2 NUCLEAR DESIGN AND EVALUATION 3-7
3 2.2.1 Nuclear Characteristics of the Design 3-7
3 2.2.2 Nuclear Evaluation 3-20
323 THERMAL AND HYDRAULIC DESIGN AND EVALUATION 3-32
3 2..'.1 Themal and Hydraulic Characteristics 3-32
3232 Thermal and Hydraulic Evaluation 3-41
3 2.4 MEtJANICAL DESIGN IAYOUT 3-68
3 2.4.1 Internal Layout 3-68
3 2.4.2 Fuel Assemblies 3-73
3 2.4 3 Control Rod Drive System 3-86
33 TESTS AND INSPECTIONS 3-95
331 NUCLEAR TESTS AND INSPECTION 3-95
3 3 1.1 Critical Experiments 3-95 ,
3 3 1.2 zero Power, Approach to Power, and Power Testing 3-95n
U332 THERMAL AND HYDRAULIC TESTS AND INSPECTION 3-95
00000iO3-1
.
.
' CONTENTS (Cont'd)
Section g
3 3 2.1 Reactor Vessel Flow Distribution andPressure Drop Test 3-95
3 3 2.2 ruel Assembly Heat Transfer and FluidFlow Tests 3-96
3323 Preoperational Testing and PostoperationalTesting 3-98
333 FUEL ASSEMBLY, CONTROL ROD ASSEMBLY,AND CONTROL ROD DRIVE MECHANICAL TESTSAND INSPECTION 3-98
3331 Prototype Testing 3-98
3 3 3,2 Model Testing 3-98
[3333 Component and/or Material Testing 3-99
3 3 3.4 Control Rod Drive Tests and Inspection 3-100
Ot 334 INTERNAIS TESTS AND INSPECTIONS 3-103
34 REFERENCES 3 104
|
00000142rV
!r
3-111
. _ . _ - . _ . , _ _ - , - - . . _ . . . _ _ _ _ . - . . _ _ , _ . _ . - . - . . - _ . _ _ , _ . . _ _ _ _ . . . _ , _ _ - . . . . -
e
.
'(j LIST OF TABLES'
Table No. Title h-
3-1 Core Design, Thermal, and Hydraulic Data 3-6
3-2 Nuclear Design Data 3-8
3-3 Excess Reactivity Conditions 3-9
3-k First Cycle Reactivity Control Distribution 3-9
3-5 Shutdown Reactivity Analysic 3-13
3-6 Soluble Boron' Levels and Worth 3-lh
3-7 Exterior Neutron Levels and Spectra 3-17
3-8 Calculated and Experimental Rod and Rod AssemblyComparison 3-22
3-9 Reference Core Parameters 3-28-
3-10 First Mode Thr.shold Dimensione and Flatness 3-28
3-11 Threshold Ratio and Power Flatness' 3-29
-3 12 Coefficients of variation 3-35~
3-13 DNB Fesults - Maximum Design Condition 3-57
3-lh DNB Results - Most Drobable Condition 3- W
1 3-15 Heat Transfer Test Data 3-
3-16 Comparison of Heat Transfer Test Data 3-50
3-17 Hot Channel Coolant Conditions 3-51
3-18 DNB Ratios in the Fuel Assembly Channels 3-6h
3-19 Clad Circumferential Stresses 3-78~
5
3-20 LRD Fuel Swelling Irradiation Program 3-84
* 3-21 Control Rod Drive Design Data 3-88
3-22 Control Rod Assembly Design Data 3-93,
_3-23 Axial Pot;r Shaping Rod Assembly Data 3-9h |7'
: O 00000i43
'? iii (Revised 7-15-69)
_ _ _ _ . _ _ _ _. .
LIST OF FIGURES
(At rear of Section);
Figure No. Title
3-1 Baron concentration versus core Life
3-2 Axial Peak to Average Power versus Xenon Override Rod Insertion
.3-3 Axial Power Profile, Xenon Override Rods 55 Per Cent Inserted
3-4 Moderat.or Temperature ccefficient versus Boron concentration
3-5 Modeator Temperature coefficient versus mderator Tsap=mtureand Various Boron Levels
3-6 Per Cent Initial Power versus Time Following Trip
3-7 Effect of Fuel Temperature (Doppler) on Xenon Oscillations -Beginning of Life
3-8 Effect of Fuel Temperature (Doppler) on Xenon Oscillations -Near End of Life
.
3-9 control of Axial Oscillation with Partial Rods
3-10 Population Included in the Statistical Statement Versus IRB Ratio
'
3-11 Power Shape Reflecting Increased Axial Power Peak for 144-Inch Core
3-12 Distribution of Fuel Rod Pading4
3-13 Possible Fuel Rod DNB's for M uimum Design Conditions -36,816-Rod core
3-14 Possible Fuel Rod IRB's for Most Probable Conditions -36,816-Rod core
3-15 Distribution of Population Protected, P, and 1-P versus NumberRods for m st Probable Conditions
00000I4;43-16 DNB Ratios (BAW-168) versus Reactor Power
3-17 Maximum Hot channel Exit Quality versus Reactor Overpower; ,r
3-18 Thermal conductivity of vo2
3-19 Fuel Center Temperature at the Hot Spot versus Linear Pcnter (..
Q 3-20 Number of Data Points versus 4 /kE C
13-21 Hot Channel Factor versus Per Cent Population Protected
3-iv. . . . . . _ . _ . _ . _ . _ . _ . _ _ . _ _ . . . _ . . . . . . _ _ _ . . _ _ _ _ . . _ . . _ . . _ _ _ _ . _ _ _ . _ . - _ .
'
. FIGURES '(Cont'd)
Figure No. Title
3-22 Burnout Factor versus Population for Various Confidence Levels
3-23 Fods in Jeopardy versus Power
3-24 Ratio of Experimental to Calculated Burnout Heat Flux
3-25 Ratio of Experimental to Calculated Burnout Heat Flux
3-26 Ratio of Experimental to Calculated Burnout Heat Flux
3-27 Ratio of Experimental to Calculated Burnout Heat Flux
3-28 Ratio of Experimental to Calculated Burnout Heat Flux
3-29 Ratio of Experimental to Calculated Burnout Heat Flux
3-30 Ratio of Experimental to Calculated Bumout Heat Flux;
3-31 'atio of Experimental to Calculated Burnout Heat Flux
O 3-32 natie of 8xPer1 e=ta1 to C 1ce1 ted Ber===* Heat r1==\
| 3-33 Ratio of Experimental to Calculated Bumout Heat Flux
3-34 Ratio of Experimental to Calculated Burnout Heat Flux
3-35 Ratio of Experimental to Calculated Burnout Heat Flux
3-36 Ratio of Experimental to Calculated Burnout Heat Flux
|
3-37 Ratio of Experimental to Calculated Burnout Heat Flux
i'
3-38 Ratio of Experimental to Calculated Burnout Heat Flux
3-39 Ratio of Experimental to Calculated Burnout Heat Flux
3-40 Maximum Hot Channel Exit Quality versus Reactor Power
3-41 Hottest DesiFn and Nominal Channel Exit Quality versus ReactorPower (without Engineering Hot Channel Factors)
3-42 Flow Regime Map for Unit Cell Channel at 2,120 psig
3-43 Flow Regime Map for Unit Cell Channel
001453-44 Flow Regime Map for Corner Channe
3-45 Flow Regime Map for Wall Channel
3-v- . . _ . --. - , _ - . _ - .._.- ... . - ..... . - . . .-.- . . . - - - . - .
FIGURES (Cont'd)
k '
Figure No. Title
3 h6 Hot Channel DNB Ratio Comparison
3-h7- Reactor Coolant Flow versus Power
3 h8 Thermal Conductivity of 95 Per Cent Dense Sintered UO Pellets2
3-h9 Fuel Center Temperature for Beginning-of-Life Conditions
3-50 Fuel Center Temperature for End-of-Life Conditions
'
3-51 Per Cent Fission Gas Released as a Function of the AverageTemperature of the UO Fuel2
I~ 3-52 Axial Local to Average Burnup and Instantaneous Power Comparisons
3-53 Fission Gas Release for 150 and 1.70 Max / Avg Axial Power Shapes
3-5h Gas Pressure inside the Fuel Clad for Various Axial Burnup andPower Shapes
3-55 Nominal Fuel Rod Power Peaks and Cell Exit Enthalpy Rise Patios
- 3-56 Maximum Fuel Rod Power Peaks and Cell Exit Enthalpy Fise Ratios
'- 3-57 Calculated and Design Limit Local Heat Flux versus Enthalpy inthe Hot Corner Cell at the Nominal Condition
3-58 Calculated and Design Licit Local Heat Flux versus Enthalpy inthe Hot Corner Cell at the Postulated Worst Condition
3-59 Reactor Vessel and Internals - General Arrangement
3-60 Reactor Vessel and Internals - Cross Section
3-61 Core Flooding Arrangement
3-61a Internals Vent valve 1
3-62 . Fuel Assembly
3-63 Orifice Rod Assembly
3-6h Control Rod Drive - General Arrangement
3-65 Control Rod Drive - Vertical Section
3-66 Control Rod Drive System and Trip Block Diagram,
g' 3-f f"*****) 00000146 7,
3-68. :(Deleted)
.3-69 ' control Rod Assenbly
73-70 Axial Power Shaping Rod Assembly .3-vi (Revised 7-15-69)
. - - - _ _ - _ - _ _ - . . _ _ _ - _ _ - _ - _ - - _ - - _ - _ _ _ _ _ _ _ _ _ _ _ _ _ _ - - - - _ - - _ _ _ _ - _ - - -
Dd 3 REACTOR'
,
31 DESIGN BASES
The reactor is designed to meet the performance objectives specified in31.1 without exceeding the limits of design and operation specified in
3 1.2.
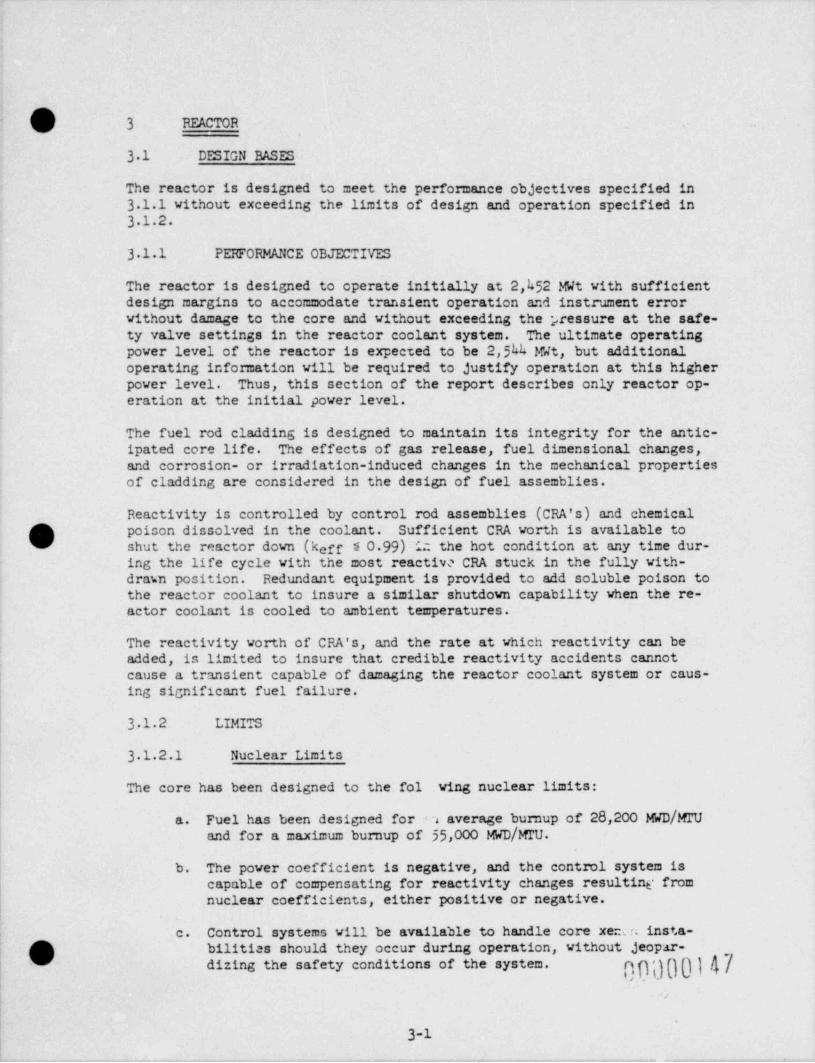
3 1.1 PERFORMANCE OBJECTIVES
The reactor is designed to operate initially at 2,452 MWt with sufficientdesign margins to accommodate transient operation and instrument errorwithout damage to the core and without exceeding the pressure at the safe-ty valve settings in the reactor coolant system. The ultimate operatingpower level of the reactor is expected to be 2,5kk MWt, but additionaloperating information vill be required to justify operation at this higherpower level. Thus, this section of the report describes only reactor op-eration at the initial power level.
The fuel rod cladding is designed to maintain its integrity for the antic-ipated core life. The effects of gas release, fuel dimensional changes,and corrosion- or irradiation-induced changes in the mechanical propertiesof cladding are considered in the design of fuel assemblies.
Reactivity is controlled by control rod assemblies (CRA's) and chemical~N
(kpoison dissolved in the coolant. Sufficient CRA vorth is available toshut the reactor down (kerr 5 0 99) in the hot condition at any time dur-ing the life cycle with the most reactiv0 CRA stuck in the fully with-drawn position. Redundant equipment is provided to add soluble poison tothe reactor coolant to insure a similar shutdown capability when the re-actor coolant is cooled to ambient temperatures.
The reactivity worth of CRA's, and the rate at which reactivity can beadded, is limited to insure that credible reactivity accidents cannot
I cause a transient capable of damaging the reactor coolant system or caus-ing significant fuel failure.
3 1.2 LIMITS
3 1.2.1 Nuclear Limits
The core has been designed to the fol ; wing nuclear limits:I
Fuel has been designed for sa average burnup of 28,200 MWD /MTU'
a.and for a maximum burnup of 35,000 MWD /MTU.
b. The power coefficient is negative, and the control system iscapable of compensating for reactivity changes resulting from
| nuclear coefficients, either positive or negative.:'
c. Control systems will be available to handle core xencn insta-{ l''') bilities should they occur during operation, without jeopAr-
b' ' dizing the safety conditions of the system. 000147'/
|
3-1. .- . . - . . _- .- - -. .. - ,
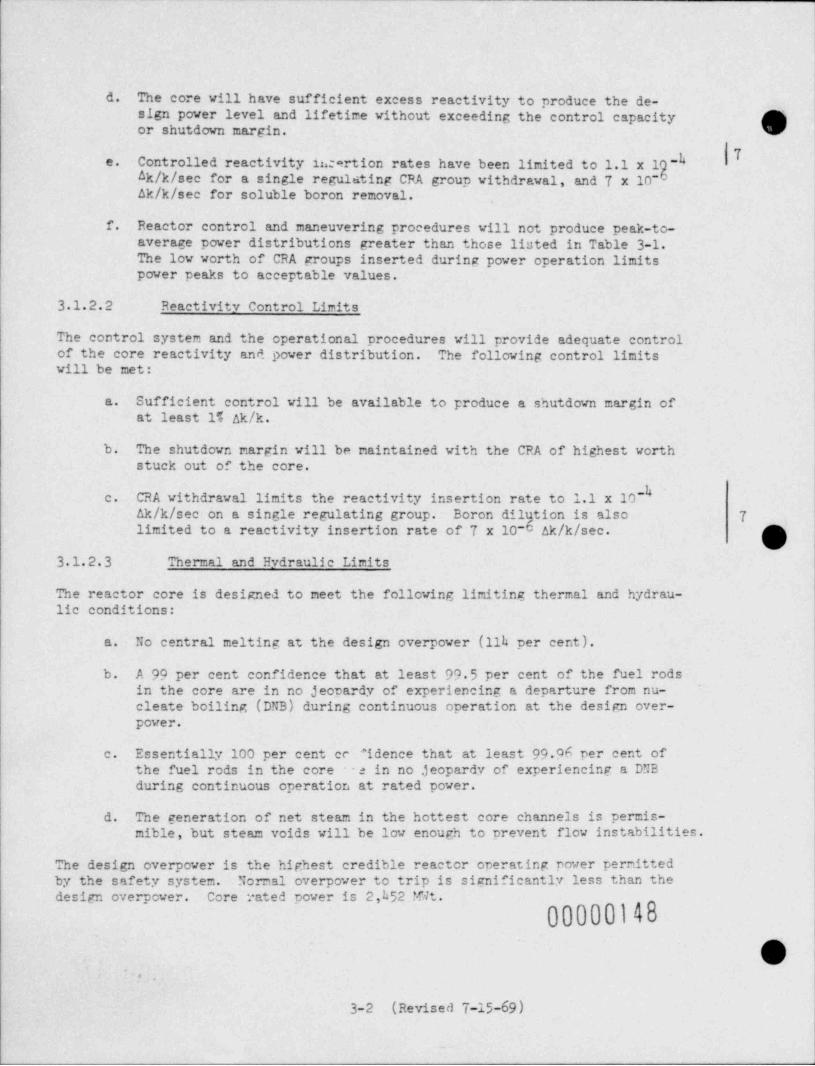
d. The core vill have sufficient excess reactivity to produce the de-sign power level and lifetime without exceeding the control capacity gor shutdown margin.
IControlled reactivity irertion rates have been limited to 1.1 x lg"ke.Ak/k/see for a single regulating CRA group withdrawal, and 7 x 10-Ak/k/see for soluble boron removal.
f. Reactor control and maneuvering procedures vill not produce peak-to-average power distributions greater than those listed in Table 3-1.The lov vorth of CBA groups inserted during power operation limitspower peaks to acceptable values.
3.1.2.2 Reactivity Control Limits
The control system and the operational procedures vill provide adequate controlof the core reactivity and power distribution. The following control limitsvill be met:
a. Sufficient control vill be available to produce a shutdown margin ofat least IT Ak/k.
b. The shutdown nargin vill be naintained with the CRA of highest worthstuck out of the core.
c. CRA withdrawal limits the reactivity insertion rate to 1.1 x 10Ak/k/see on a single regulating group. Boron dil 7limited to a reactivity insertion rate of 7 x 10 gtion is alsoAk/k/sec.
3.1.2.3 Thermal and Hydraulie Limits
The reactor core is designed to meet the following limiting thermal and hydrau-lie conditions:
a. No central melting at the design overpower (llh per cent).
b. A 99 per cent confidence that at least 99.5 per cent of the fuel rodsin the core are in no jeorardy of experiencing a departure from nu-cleate boiling (DNB) during continuous operation at the design over-power.
Essentially 100 per cent er.*idence that at least 99.96 per cent ofc.
the fuel rods in the core in no jeopardy of experiencing a D?!Bduring continuous operation at rated power.
d. The generation of net steam in the hottest core channels is permis-mible, but steam voids vill be lov enough to prevent flow instabilities.
The design overpower is the highest credible reactor operating power pernittedby the safety system. Normal overpower to trip is significantiv less than thed: sign overpower. Core rated power is 2,h52 trit.
00000148
O.
.
3-2 (Revised 7-15-69)
..
- ._
4
3'l.2.k Mechanical Limits-.
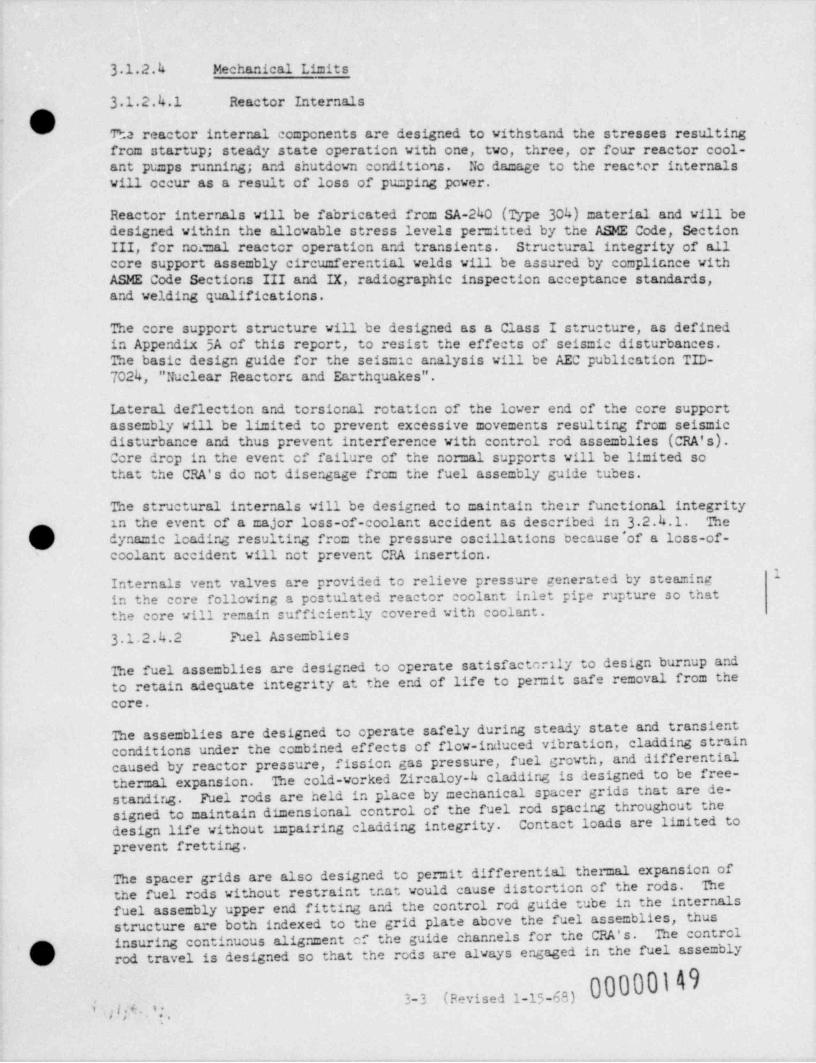
3 1.2.4.1 Reactor Internals0e ' '
' Tha reactor internal components are designed to withstand tihe stresses resultingfrom startup; steady state operation with one, two, three, or four reactor cool-ant pumps running; and shutdown conditions. No damage to the reactor internals.will_ occur as a result of loss of pumping power.
Reactor internals will be fabricated from SA-240 (Type 304) material and will bedesigned within the allowable stress levels permitted by the ASME Code, SectionIII, for nomal reactor operation and transients. Structural integrity of all'
core support assembly circumferential~ velds will be assured by compliance withASME Code Sections-III and IX, radiographic inspection acceptance standards,;
and welding qualifications.
.
The core support structure will be designed as a Class I structure, as definedin Appendix 5A of this report, to resist the effects of seismic disturbances.The basic design guide for the seismic analysis will be AEC publication TID-7024,1" Nuclear Reactorc and Earthquakes".
j Lateral deflection and torsional rotation of the lower end of the core supportassembly will be limited to prevent excessive movements resulting from seismicdisturbance and thus prevent interference with control rod assemblies (CRA's).Core drop in the event of failure of the normal supports will be limited sothat the CRA's do not disengage from the fuel assembly guide tubes.
| The structural internals will be designed to maintain their functional integrityin the event of a major loss-of-coolant accident as described in 3 2.k.1. The
4' dynamic loading resulting from the pressure oscillations because'of a loss-of-
: coolant accident will not prevent CRA insertion.'
4 1Internals vent valves are provided to relieve pressure generated by steamingin the core following a postulated reactor coolant inlet pipe rupture so thatthe core will remain sufficiently covered with coolant.
3 1.2.4.2 Fuel Assemblies;
: The fuel assemblies are designed to operate satisfactorily to design burnup and''
to retain adequate integrity at the end of life to per=it safe removal from theCore.
The assemblies are designed to operate safely during steady state and transient!
conditions' under the combined effects of flow-induced vibration, cladding straincaused by reactor pressure, fission gas pressure, fuel growth, and differentialthermal expansion. The cold-worked Zircaloy-4 cladding is designed to be free-standing. Fuel rods are held in place by mechanical spacer grids that are de-signed to maintain dimensional control of the fuel rod spacing throughout thedesign life without impairing cladding integrity. Contact loads are limited toprevent fretting.
5
The spacer grids are also designed to permit differential thermal expansion ofthe fuel rods without restraint tnat would cause distortion of the rods. Thefuel assembly upper end fitting and the ~ control rod guide tube in the internalsstructure are both indexed to the grid plate above the fuel assemblies, thus
The control. insuring continuous alignment of the guide channels for the CRA's.:
rodLtravel is designed so that the rods are always engaged in the fuel assemblya; y
00000149-
3-3 (Revised 1-15-68)i' g. +ug .. .
.;
. - . - . . , - - . . . - - . - - - , . .. . . - - . - . . - - , , - - , , - - , ..---,,,,-,--,,.,.-c. ., . . . , . - . , - - , , ,, ,
guide tubes, thus insuring that CRA's can always be inserted. The assemblystructure is also designed to withstand handling loads, shipping loads, and
,g ;earthquake loads.
Stress and strain for all anticipated normal and abnomal operating conditionswill be limited as follows:
a. Stresses that are not relieved by small deformations of the materialvill be prevented from leading to failure by not pemitting thesestresses to exceed the yield strength of the material nor to exceedlevels that would use in excess of 75 per cent of the stress rupturelife of the material. An example of this type of stress is the cir-cumferential membrane stress in the clad due to internal or externalpressure.
b. Stresses that are relieved by en11 defomations of the material, andthe single occurrence of which will not make a significant contribu-tion to the possibility of a failure, will be pemitted to exceed theyield strength of the material. Where such stresses exceed the mate-rial yield strength, strain limits vill be set, based on low-cyclefatigue techniques, using no more than 90 per cent of the materialfatigue life. Evaluations of cyclic loadings vill be based on con-servative estimates of the number of cycles to be experienced. Anexsmple of this "*pe of stress is the themal stress resulting fromthe thermal grad 4 ' across the clad thickness.
c. Combinations of these two types of stresses, in addition to the in-dividual treatment outlined above, vill be evaluated on the low-cyclefatigue basis of Item b. Also, clad plastic strain due to diameter gincreases resulting from themal ratcheting and/or creep, includingthe effects of internal gas pressure and fuel swelling, vill be lim-ited to about 1 per cent.
d. Minimum clad collapse pressure margins will be required as follows:
(1) 10 per cent margin over system design pressure, on short timecollapse, at end void.
(2) End void must not collapse (cust be either freestanding or haveadequate support) on a long time basis.
(3) 10 per cent margin over system operating pressure, on shorttime collapse, at hot spot average te=perature through the clad
! vall.
(4) Clad must be freestanding at design pressure on a short timebasis at =725 F hot spot average temperature through the cladvall.
i
!
000001500
3h
. _
_ - * -__
es 3 1.2.h.3 control Rod Assembly (CRA)- 'C ,
;, .
- The control rod clad is designed to the some criteria as the fuel clad, as ap-plicable. Adequate clearance vill be provided between the control rods and theguide tubes, which position them vithin the fuel assembly, so that control rodoverheating vill be avoided and unacceptable mechanical interference betweenthe control rod and the guide tube vill not occur under any operating condition,including earthquake.
Overstressing of the CRA c.omponents during a trip will be prevented by minimizingthe shock loads by snubbing and by providing adequate strengt1.
3.1.2.h.h control Bod Drive
Deleted sentence. 7
The control rod drives provide control rod assembly (CRA) insertion and with-drawal rates. consistent with the required reactivity changes for reactor op-erational load changes. This rate is. based on the vorths of the various rod
groups, which have been established to limit power-peaking flux patterns todesign values. The maximum reactivity addition rate is specified to limit themagnitude of a possible nuclear excursion resulting from a control system oroperator malfunction. The normal insertion and withdrawal velocity has beenestablished as 30 in./ min. 7
The control rod drives provide a " trip" of the CRA's which results in a rapid
. .
shutdown of the reactor for conditions that cannot be handled by the reacter
v control system. The trip is based on the results of various reactor emergencyanalyses, including instrument and control delay times and the amount of reac-tivity that must be inserted before deceleration of the CRA occurs. The maxi-mum travel time for a 2/3 insertion on a trip command of a CRA has been estab- 1lished as 1.h sec.
The control rod drives can be coupled and uncoupled to their respective CRA's,
without any withdrawal movement of the CRA's.
All pressure-containing components are designed to meet the requirements of the7
j ASME Code, Section III, Nuclear Vessels , for Class A vessels.
| Materials selected for the control rod drive are capable of operating within| the specified reactor environment for the life of the mechanism without any
| deleterious effects. Adequate clearance vill be provided between the stationary
| and moving parts of the control rod drives so that the CRA trip time to full in-
|- sertion vill not be adversely affected, by mechanical interference under all op-
|erating conditions and seismic distrubances.
Structural integrity and adherence to a' lovable stress limits of the control-rod drive and related parts during a trip will be achieved by establishing alimit on impact loads through snubbing.
00000151e . ..n
- gg -
3-5 (Revised 7-15-69). . - - -
. ..
32 REACTOR DESIGN
3 2.1 GENERAL SUMMARY
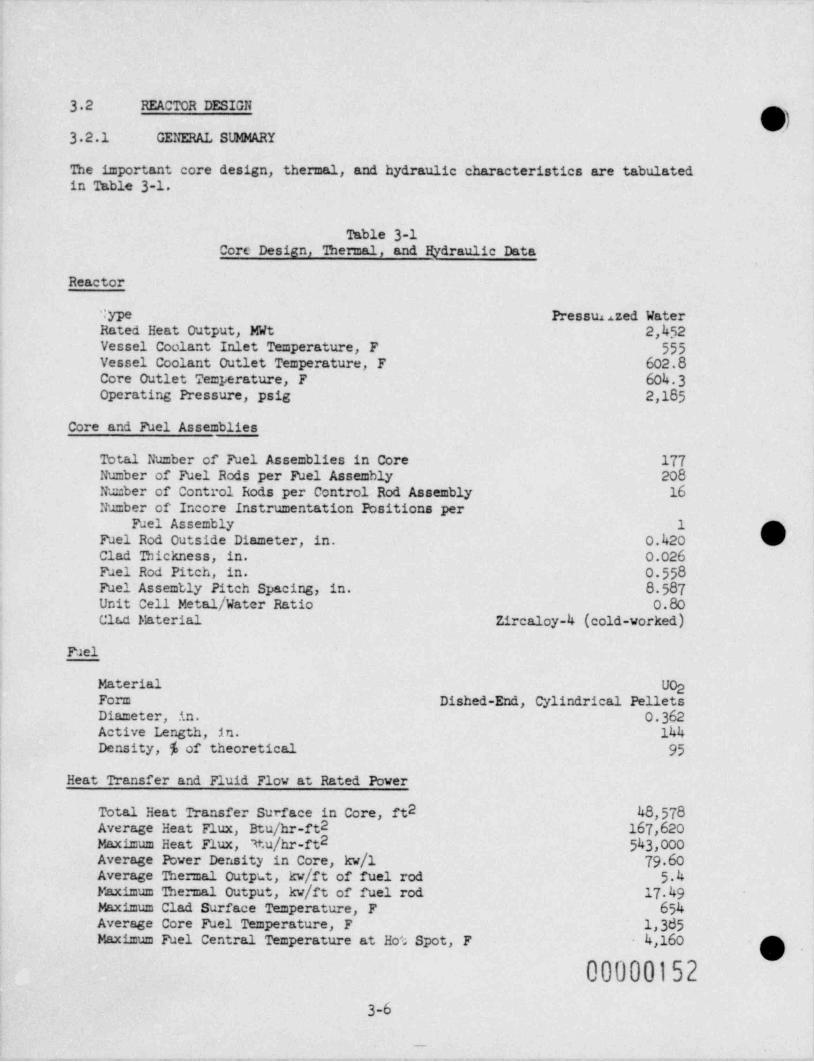
The important core design, thermal, and hydraulic characteristics are tabulated
in Table 3-1.
Table 3-1Core Design, 'Ihermal, and Hydraulie Data
.
Reactor
1ype Pressuu zed WaterRated Heat Output, MWt 2,452Vessel Coolant Inlet Temperature, F 555Vessel Coolant Outlet Temperature, F 602.8Core Outlet Temperature, F 604 3Operating Pressure, psig 2,185
Core and Fuel Assemblies
Total Nu=ber of Fuel Assemblies in Core 177Number of Fuel Rods per Fuel Assembly 208Number of Control Rods per Control Rod Assembly 16Nu=ber of Incore Instrumentation Pcsitions per
Pael Assembly 1Fuel Rod Outside Diameter, in. 0.420Clad Thickness, in. 0.026Pael Rod Pitch, in. 0 558Fuel Assembly Pitch Spacing, in. 8.587Unit Cell Metal / Water Ratio 0.80Clui Material Zircaloy-4 (cold-worked)
Fuel
Material UOgForm Dished-End, Cylindrical PelletsDiameter, in. O.362,
| Active Length, in. 144Density, % of theoretical 95
i
| Heat Transfer and Fluid Flov at Rated Power|
Total Heat Transfer Surface in Core, ft2 48,578Average Heat Flux, Btu /hr-ft2 167,620Maximum Heat Flux, v.u/hr-ft2 543,000Average Power Density in Core, kv/l 79.60Average Themal Output, kv/ft of fuel rod 5.4
| Maximum Thermal Output, kv/ft of fuel rod 17 49Maximum Clad Surface Temperature, F 654Aversge Core Fuel Temperature, F 1,385Maxi =um Fuel Central Temperature at Hot Spot, F 4,160
000001523-6
_
yyeg- e sw * a 9 gw .-e
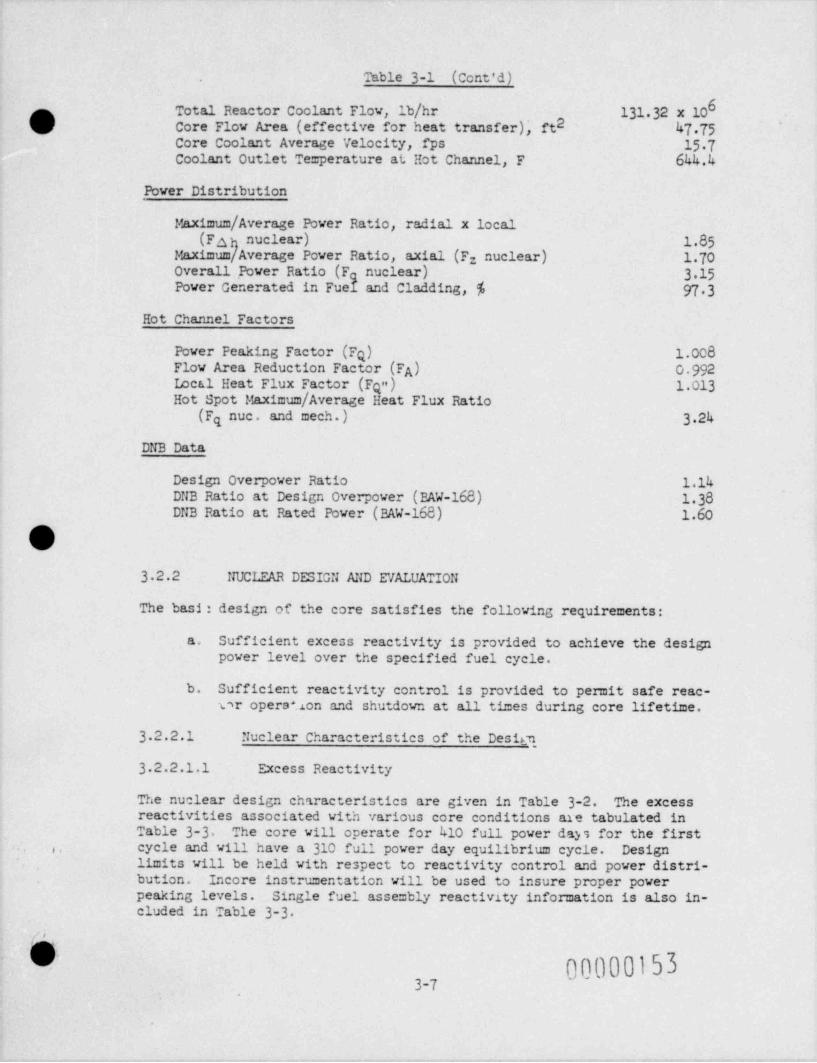
Table 3-1 (Cent'd).
6fm Total Reactor Coolant Flov, lb/hr 131 32 x 10d Core Flow Area (effective for heat transfer), ft2 '47 75'
Core Coolant Average Velocity, fps 13 7Coolant Outlet Te.perature at Hot Channel, F 644.4
Power Distribution
Maximum /AveragePowerRatio,radialxlocal(Fa nuclear) 1.85
Maximum Average Power Ratio, axial (F: nuclear) 1 70Overall,PowerRatio(Fq nuclear) 3 15Power Generated in Fuel and Cladding, % 97 3
Hot Channel Factors
Power Peaking Factor (Fq) 1.008Flow Area Reduction Factor (F ) 0 992Iccal Heat Flux Factor (Fqa) A 1.013Hot Spot Maximum / Average Heat Flux Ratio
(Fq nue. and mech.) -3 24
DNB Data
Design Overpower Ratio 1.14DNB Ratio at Design Overpower (BAW-168) 1 38DNB Ratio at Rated Power (BAW-168) 1.60
/%U
3 2.2 NUCLEAR DESIGN AND EVALUATION
The basi : design of the core satisfies the following requirements:
Sufficient excess reactivity is provided to achieve the designa.power level over the specified fuel cycle.
b. Sufficient reactivity control is provided to pemit safe reac-o r opera *, ion and shutdown at all times during core lifetime.
3 2.2.1 Nuclear Characteristics of the DesiEu,
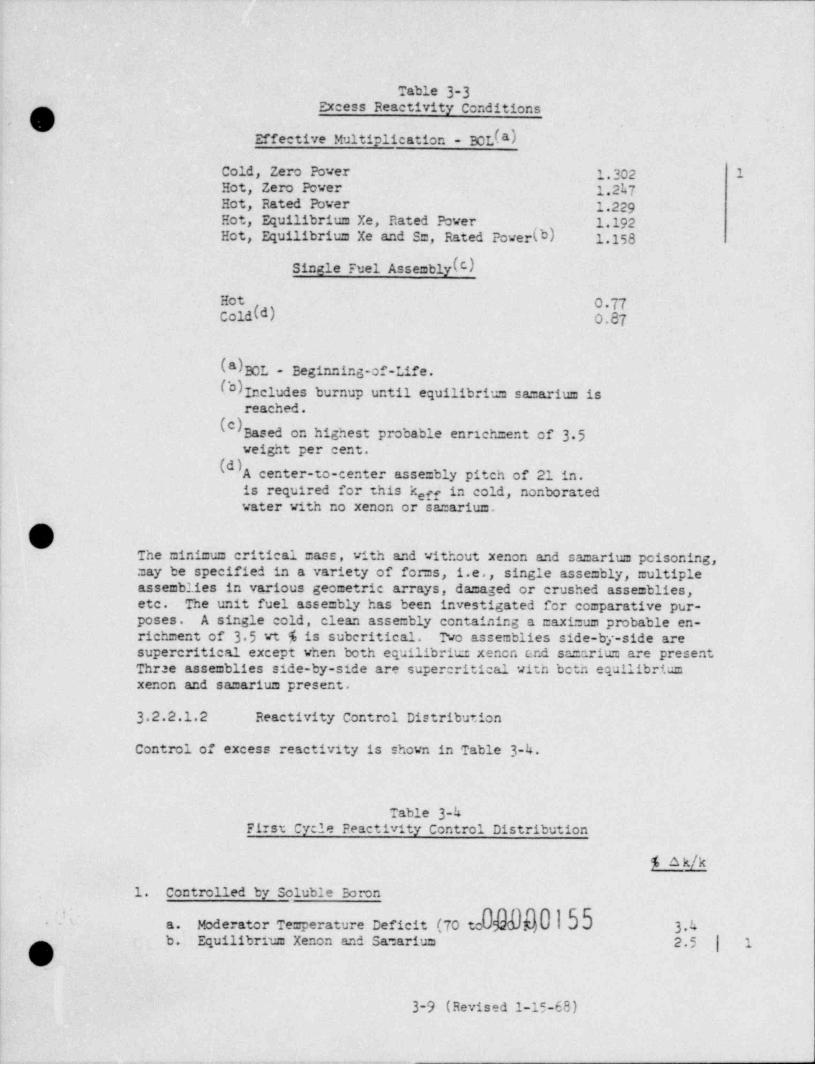
3 2.2.1.1 Excess Reactivity
The nuclear design characteristics are given in Table 3-2. The excessreactivities associated with various core conditions are tabulated inTable 3-3 The core vill operate for 410 full power days for the firstcycle and. vill have a 310 full power day equilibrium cycle. Design, e,
limits vill be held with respect to reactivity control and power distri-,
bution. Incore instrumentation will be used to insure proper power.
peaking levels. Single fuel asse=bly reactivity information is also in-cluded in Table 3-3
NV 00000153
'
37
.
- - , , , - , , , ~ - . . , , , - -- , . - . , -
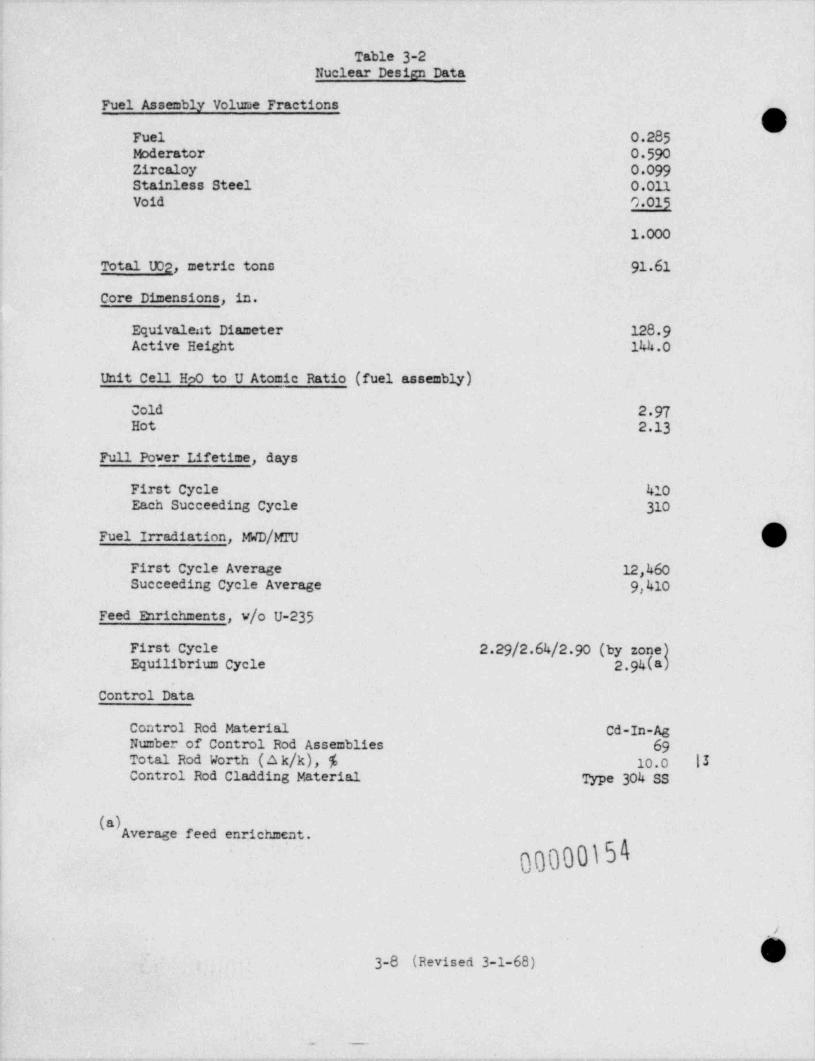
T.blo 3-2Nuclear Design Data
Fuel Assembly Volume Fractions
'OFuel 0.285 l
Moderator 0 590Zircaloy 0.099Stainless Steel 0.011Void 0.015
1.000
Total UO2, metric tons 91.61
Core Dimensions, in..
. Equivalent Diameter 128 9Active Height 14k.0
Unit Cell H W to U Atomic Ratio (fuel assembly)
cold 2 97Hot 2.13
Full Power Lifetime, days
First Cycle 410Each Succeeding Cycle 310
Fuel Irradiation, MWD /MrU
First Cycle Average 12,460Succeeding Cycle Average 9,410
Feed Enrichments, v/o U-235
First Cycle 2.29/2.64/290(byzone)Equilibrium Cycle 2 94(a)
t
Control Data
Control Rod Material Cd-In-AgNumber of Control Rod Assemblies 69Total Rod Worth (A k/k), % 10.0 |3Control Rod Cladding Material Type 304 SS
(a) Average feed enrichment.
00000154,
1
[ 3-8 (Revised 3-1-68)
_ _
e
.
Table 3-3,- Excess Reactivity Conditions
'
Effective Multiplication - BOL(8)
Cold, Zero Power 1.302 1Hot, Zero Power 1.2L7 -Hot, Rated Power' 1.229Hot, Equilibrium Xe, Rated Power 1.192Hot, Equilibrium Xe and S=, Rated Power (b) 1,153
Single Fuel Assembly (C)
Hot (d) 0 77Cold o,37
(a)BOL - Beginnin6-of-Life.IO) Includes burnup until equilibrium sa=arium is
reached.
( } Based on highest probable enrich =ent of 3 5veight per cent.
(d)A center-to-center assembly pitch of 21 in.is required for this keff in cold, nonboratedwater with no xenon or sa=arium.
-At u
The minimu= critical = ass, with and without xenon and sa=arium poisoning,may be specified in a variety of for=s, i.e., single assembly, multiple
i assemblies in various geometric arrays, damaged or crushed assemblies,! etc. The unit fuel assembly has been investigated for comparative pur-
poses. A single cold, clean asse=bly containing a caxi=um probable en-rich =ent of 3 5 vt % is suberitical. Two assemblies side-by-side aresupercritical except when both equilibrium xenon cnd sc=nrium are presentThrae assemblies side-by-side are supercritical with both equilibriu=,
| xenon and samarium present.!
| 3 2.2.1.2 Reactivity Control Dietribution
Control of excess reactivity is shown in Table 3-4.
| Table 3-hFirst Cycle Reactivity Control Distribution
% Ak/k
-1. Controlled by Soluble Boren
'
Moderator Temperature Deficit (70 to 4040155 3.ua.-
b., _Equilibritm Xenon and Sa-arium 2.5 | 1
3-9 (Revised 1-15-68)
. . _ . _ .
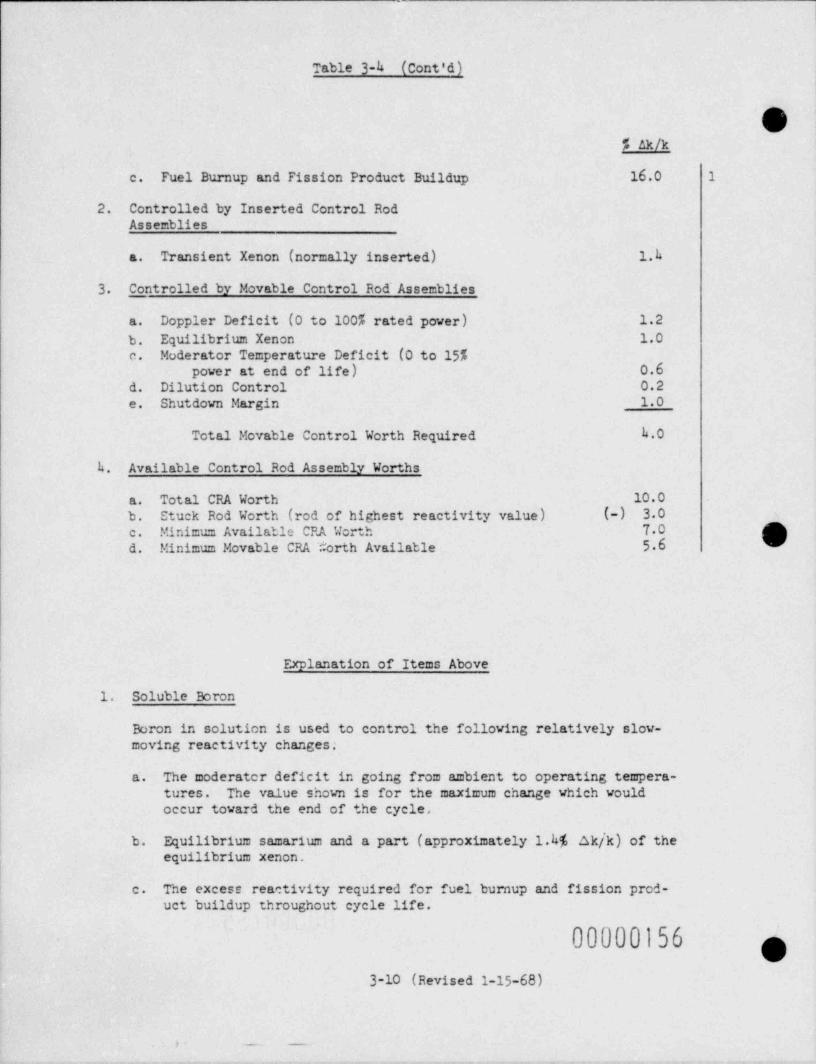
Table 3-4 (Cont'd)
O5 Ak/k
c. Fuel Burnup and Fission Product Buildup 16.0 1
2. Controlled by Inserted Control RodAssemblies
Transient Xenon (normally inserted) 1.ha.
3. Controlled by Movable Control Rod' Assemblies
Doppler Deficit (0 to 100% rated power) 1.2a.b. Equilibrium Xenon 1.0c. Moderator Temperature Deficit (0 to 15%
power at end of life) 0.6d. Dilution Control 0.2e. Shutdown Margin 1.0
Total Movable Control Worth Required h.0
h. Available Control Rod Assembly Worths
a. Total CRA Worth 10.0b. Stuck Rod Worth (rod of highest reactivity value) (-) 3.0
gc. Minimum Available CRA Worth 70d. Minimum Movable CRA Worth Available 5.6
Explanation of Items Above
( l. Soluble Boron
Boron in solution is used to control the following relatively slov-moving reactivity changes;
a. The moderater deficit in going from ambient to operating tempera-
| tures. The value shown is for the maximum change which wouldi occur toward the end of the cycle,
b. Equilibrium sa=arium and a part (approximately 1.h% Ak/k) of theequilibrium xenon.,
|
| c. The excess reactivity required for fuel burnup and fission prod-uct buildup throughout cycle life.
00000156 g3-10 (Revised 1-15-68)
)- _. _
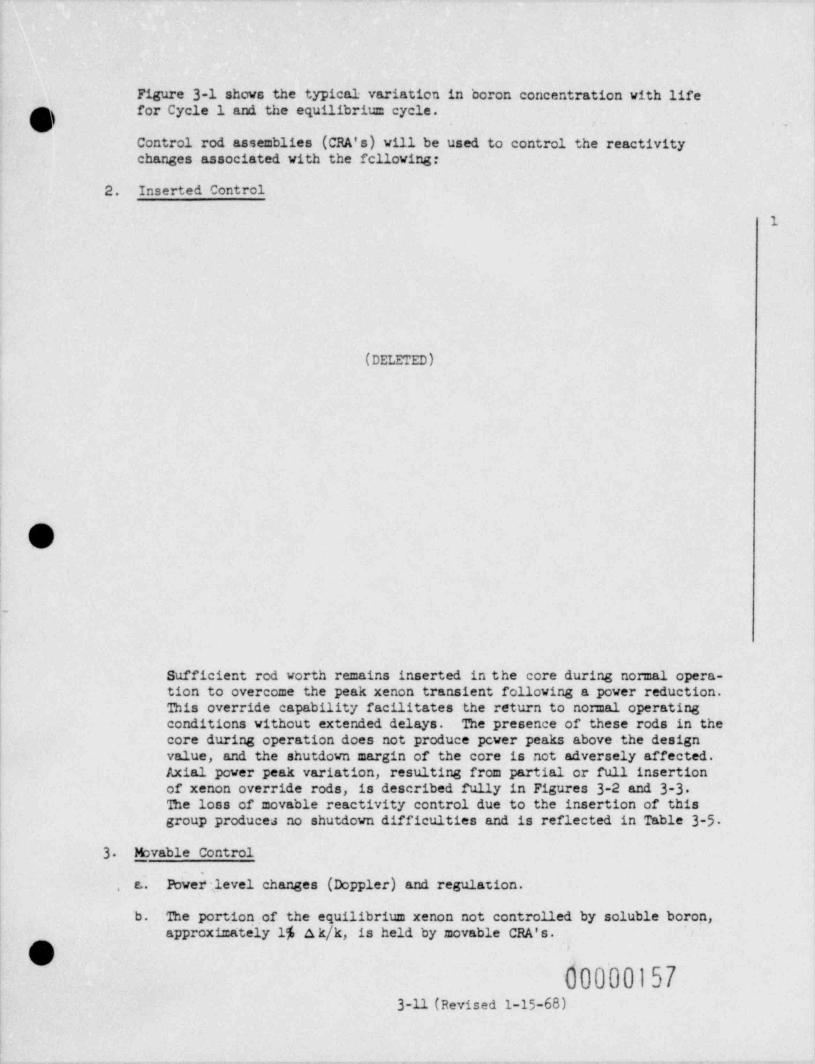
Figure 3-1 shows the typical variation in baron concentration with lifefor Cycle 1 and the equilibrium cycle.
CqControl rod assemblies (CRA's) vill be used to control the reactivitychanges associated with the fellowing:
2. Inserted Control
1
.
(DELETED)
O.
||
|_
Sufficient rod worth remains inserted in the core during normal opera-tion to overcome the peak xenon transient following a power reduction.This override capability facilitates the return to nomal operatingconditions without extended delays. The presence of these rods in thecore during operation does not produce pcVer peaks above the designvalue, and the shutdown margin of the core is not adversely affected.Axial power peak variation, resulting from partial or full insertionof xenon override rods, is described fully in Figures 3-2 and 3-3The loss of movable reactivity control due to the insertion of this
,
group producea no shutdown difficulties and is reflected in Table 3-51
3 _ Movable Control
Powe$*.,levelchanges(Doppler)andregulation.I ; e. .
b. The portion;of the equilibrium xenon not controlled by soluble boron,I approximately'1% A k/k, is held by movable CRA's.
O '
d00'00157; 3-11 (Revised 1-15-68)|
. _ _ ~ , . . . - __ . _ _ , , . . - m. _ _ . . . . , _ , . _ _ , . , _ - . _ , . _ ,.. _. - - _
c. Betvxn z:ro and 15 per cent of full power, reactivity compensation byCRA's may be required as a result of the linear increase of reactorcoolant temperature from 520 F to the normal operating value.
Od. Additional reactivity is held by a group of partially inserted CRA's(25 per cent insertion maximum) to allev periodic rather than contin-uous soluble boron dilution. The CRA's are inserted to the 25 per centlimit as the boron is diluted. Autcmatic withdrawal of these CRA'sduring operation is allowed to the 5 per cent insertien limit wherethe dilution procedure is again initiated and this group of CRA's isreinserted.
A shutdown margin of 1% Ak/k to the hot critical condition is alsoe.
required as part of the reactivity controlled by CRA's.
4. Rod Worth
A total of 4.0% Ak/k(a) is required in movable control. Analysis of the 169 CRA's under the reference fuel arrangement predicts a total CRA vorthof at least 10.07. Ak/k. 'Ihe stuch-out CRA vorth was also evaluated at avalue no larger than 3.0% A k/k(b). ' Ibis evaluation included selectionof the highest worth CRA under th9 irst CRA-out condition. The minimumavailable CRA vorth of 5 6% Ak/k(a(/ is sufficient to meet movable controlrequirements.
3 2.2.1 3 Reactivity Shutdown Analysis
The ability to shut down the core under both hot and cold conditions is illus-
trated in Table 3-5 In this tabulation ' oth the first and equilibrium cyclesare evaluated at the beginning-of-life (BOL) and the end-of-life (EOL) for shut- hdown capability.
.. -.
(a)Does not include transient control. See Table 3-h.
00000158 .
First cycle. See Table 3-u.
'O3-12 (Revised 1-15-68)
_
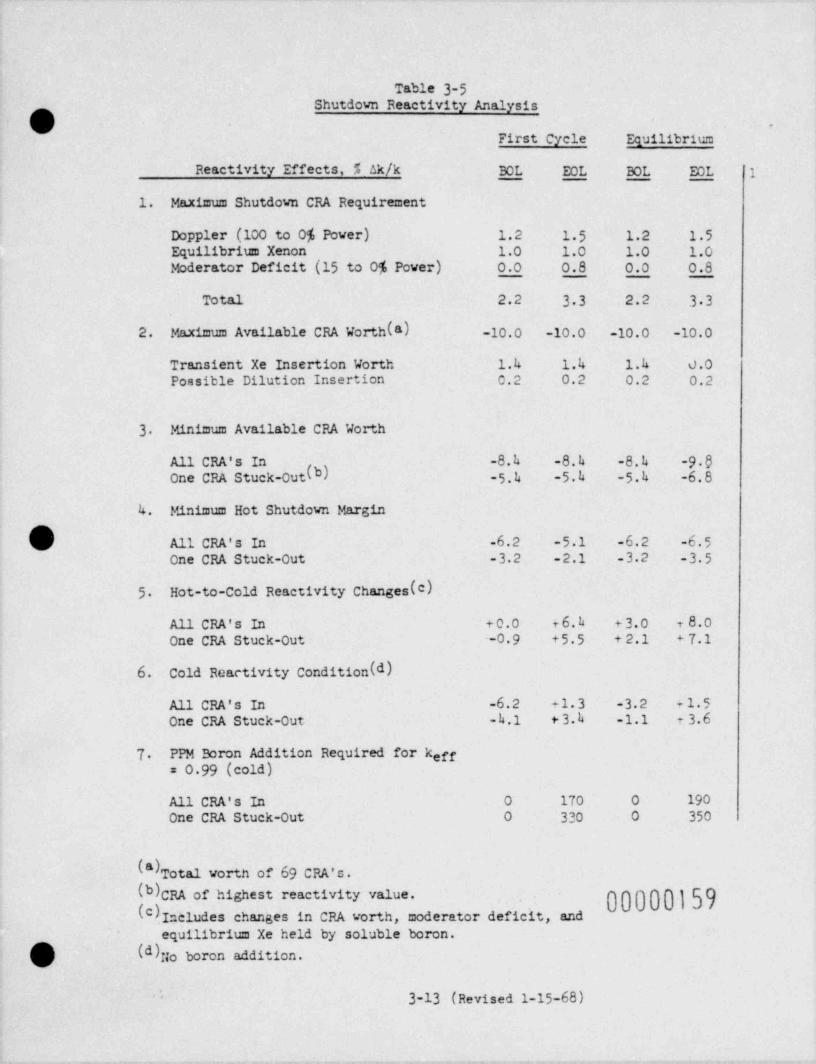
Table 3-5Shutdown Reactivity Analysis
O -
First Cycle Equilibrium
Reactivity Effects, % Ak/k BOL EOL BOL ' EOL 1
1. Maximum Shutdown CRA Requirement
Doppler (100 to 0% Power) 1.2 15 1.2 1.5 .
Equilibrium Xenon 1.0 1.0 1.0 1.0Moderator Deficit (15 to 0% Power) 0.0 0.8 0.0 0.8
Total 2.2 33 2.2 33
2. Maximum Available CRA Worth (a) _10,o 10,o _to,o 10,o,
Transient Xe Insertion Worth 1.4 1.4 1.4 0.0Possible Dilution Insertion 0.2 0.2 0.2 0.2
3 Minimum Available CRA Worth
All CRA's In -8.h -8.h -8.h -9.SOneCRAStuck-Out(b) -5.h -5.h -5.h -6.8
4. Minimum Hot Shutdown Margin
All CRA's In. -6.2 -5.1 -6.2 -6.5One CRA Stuck-Out - 3. 2 -2.1 -3.2 -3.5
5 Hot-to-Cold Reactivity Changes (c)
All CRA's In +0.0 r 6. h + 3. 0 t 8.0One CRA Stuck-Out -0.9 +5.5 + 2.1 + 7.1 -
6. Cold Reactivity Condition (d)
All CRA's In -6.2 + 1. 3 -3.2 + 1. 5One CRA Stuck-out -h.1 + 3. h -1.1 t 3.6
4
7 PPM Boron Addition Required for keff= 0 99 (cold)
All CRA's In 0 170 0 190One CRA Stuck-Out 0 330 0 350
(*) Total worth of 69 CRA's.(b)CRA of highest reactivity value. .j } g( ) Includes changes in CRA worth, moderator deficit, and
~
' equilibrium Xe held by soluble boron.
.(d)No boron addition.
'
3-13 (Revised 1-15-68)'
. - . - - . . . - , - - - - . - . . . - - . . , . . - . . . - .. . -.- - . .. . - . .
. . ._ .. _ _ . - . . ..
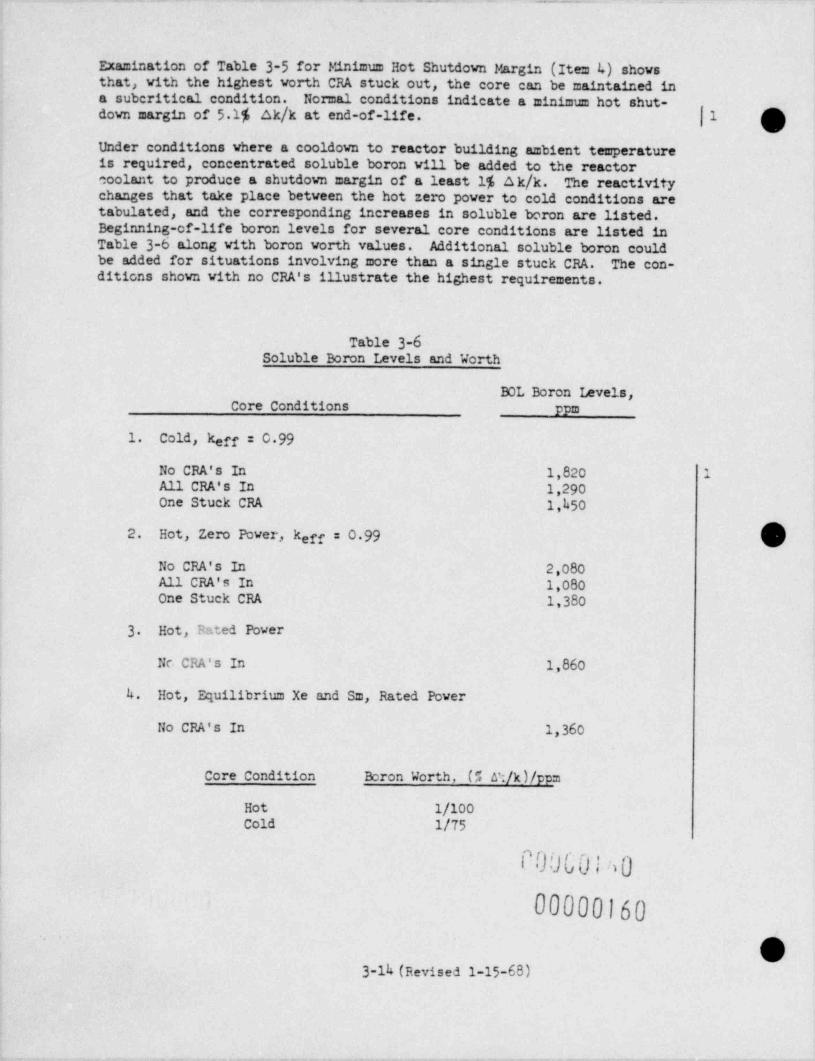
Exa=in; tion of T;bl9 3-5 for Minimum Hot Shutdown Margin (Item k) showsthat, with the highest worth CRA stuck out, the core can be maintained ina suberitical condition. Normal conditions indicate a minimum hot shut-down margin of 51% ak/k at end-of-life. |1 gUnder conditions where a cooldown to reactor building ambient temperatureis required, concentrated soluble boron vill be added to the reactorcoolant to produce a shutdown margin of a least 1% A k/k. The reactivitychanges that take place between the hot zero power to cold conditions aretabulated, and the corresponding increases in soluble boron are listed.Beginning-of-life boron levels for several core conditions are listed inTable 3-6 along with boron vorth values. Additional soluble boron couldbe added for situations involving more than a single stuck CRA. The con-ditions shown with no CRA's illustrate the highest requirements.
Table 3-6Soluble Boron Levels and Worth
BOL Boron Levels,Core Conditions ppm
1. Cold, kerr = 0 99
No CRA's In 1,820 1All CRA's In 1,290One Stuck CRA 1,h50
2. Hot, Zero Power, k rr = 0 99 he
No CRA's In 2,080All CRA's In 1,080One Stuck CRA 1,380
3 Hot, Rated Power
Nc CRA's In 1,860
4. Hot, Equilibrium Xe and Sm, Rated Power
| No CRA's In 1,360!
Core Condition Boron Worth. (% N-/k)/ ppm|| Hot 1/100
Cold 1/75
P0000!60
00000160
03-14 (Revised 1-15-68)
__ __ _ __
O 3 2.2.1.4 Reactivity Coefficients
Reactivity coefficients form the basis for analog studies. involving normal andabnormal reactor operating conditions. These coefficients have been investi-gated as part of the analysis of this core and are described below as to func-tion and overall range of values.
a. Doppler Coefficient
The Doppler coefficient reflects the change in reactivity as a func-tion of fuel temperature. A rise in fuel temperature results in anincrease in the effective absorption cross section of the fuel (theDoppler broadening of the resonance peaks) and a corresponding re-duction in neutron production. The range for the Doppler coefficientunder operating conditions is expected to be -1.1 x 10⁻⁵ to -1 7 x10⁻⁵ A k/k/F.
b. Moderator Void Coefficient
B e moderator void coefficient relates the change in neutron multi-plication to the presence of voids in the moderator. Cores controlledby appreciable amounts of soluble boron may exhibit a small positivecoefficient for very = mall void levels (several per cent void), whilehighervoidlevelsproduceincreasinglynegativecoeffgeients. Theexpected range for the void coefficient is +1.0 x 10- to -3 0 x 10-3A k/k/% void.
lc. Moderator Pressure Coefficient;
The moderator pressure coefficient relates the change in moderatordensity, resulting from a reactor coolant pressure change, to thecorresponding effect on neutron production. Bis coefficient isopposite in sign and considerably smaller when compared to the mod-erator temperature coefficient. A typical range of pressure coeffi-cients over a life cycle would be -1 x 10⁻⁶ to +3 x 10⁻⁶ Ak/k/ psi.
d. Moderator Temperature Coefficient
The moderator temperature coefficient relates a change in neutronmultiplication to the change in reactor coolant temperature. Reac-tors using soluble boron as a reactivity control have fewer negativemoderator temperature coefficients than do cores controlled solelyby movable or fixed CRA's. The major temperature effect on the cool-ant is a change in. density. An increasing coolant temperature pro-duces a decrease in water density and an equal percentage reductionin boron concentration. The concentration change results in a posi-tive reactivity component by reducing the absorption in the coolant.
| The magnitude of this component is proportional to the total reac-'
tivity held by soluble boron.
, The moderator temperature coefficient has been parameterized for the4 reference core in terms of boron concentration and reactor, coolant
temperature. The results of the study are shown in Figures'3-4 and.u.;
i 00000161 h"3-15,,
_
3-5 Figure 3-4 shows the coefficient variation for ambient and op- $erating temperatares as a function of soluble boron conepntration.De operating value ranges from approxim +1.0 x 10⁻⁴ at the be-ginningofthefirstcycleto-30x10gtely/k/FattheendoftheAkequilibrium cycle. Figure 3-5 shows the moderator temperature coef-ficient as a function of temperature for various poison concentra-tions for the first cycle. The coefficients of the equilibrium cyclevin be more negative than those of the first cycle since the boronconcentration levels are considerably lover.
S e positive temperature coefficient during the initial portion ofeach cycle viu not constitute an operational problem. Se Dopplerdeficit represents a much larger reactivity effect in the negativedirection and, together with the CRA system response, vill provideadequate control. -
e. pH Coefficient
Currently, there is no definite correlation to predict pH reactivityeffects between various operating reactors, pH effects versus reactoroperating time at power, and changes in effects with various clad,temperature, and water chemistry. Yankee (Rowe, Mass.), Saxton, andCon Edison Indian point Station No. 1 have experienced reactivitychanges at the time of pH changes, but there is no clear-cut evidencethat pH is the direct influencing variable without considering otheritas such as clad materials, fuel assembly crud deposition, systemaverage temperature, and prior system vater chemistry.
Saxton experiments have indicated a pH reactivity effect of 0.16 percent reactivity per pH unit change with and without local boiling inthe core. Operating reactor data and the results of applying Saxtonobservations to the reference reactor are as follows:
(1) The proposed system pH will vary from a cold measured value ofapproximately 5 5 to a hot calculated value of 7 8 with 1,400ppm boron and 3 ppu KOH in solution at the beginning of life.
,
| Lifetime bleed dilution to 20 ppm boron vill reduce pH by ap-proximately 0.8 pH units to a hot calculated pH value of 7 0.
! (2) Considering the maximum system makeup rate of 70 gym, the cor-responding changes in pH are 0.071 pH units per hour for borondilution and 0.231 pH units per hour for KOH dilution. Apply-
| ing pH vorth values of 0.16% Ak/k per,pH unit, as observed at! Saxton, insertion rates are 316 x 10-o% Ak/k see and 1.03 x
10-5% Ak/k sec, respectively. Rese insertion rates correspondto1.03percentpower/hourand34percentpover/ hour,re-,
| spectively, which are easily compensated by the operator or the
| automatic control system.
, .
O-
00000162-
3-16_ .__
g-4,-
(/ 3.2.2.1 5 Reactivity . Insertion Pates -
Figure 7-7 displays the integrated rod worth of three overlapping rodbanks as a function of distance withdrawn. The indicated groups are thoseused in the core during power operation. Using approximately 1.21 Ak/k CRAgroups and a 30 in./ min drive speed in conjunction with the reactivity |7response given in Figure 7-7 yields a naximum reactivity insertion rate of1.1 x 10~ (Ak/k)/sec. '''he maximun reactivity insertion rate for soluble |7boron removal is 7 x 10⁻⁶ (Ak/k)/second.
3.2.2.1.6 Neutron Flux Distribution and Spectrum
Figure 3-6 displays the beginning-of-life power decay curve,s for the twoleast effective CFA verths as outlined in Table 3-5, Item No. 3. Thepower decay is initiated by the trip release of the CPA's with_ e 300 msecdelay from initiation to start of CRA motion. The time required for 2/3rod insertion is 1.4 sec.
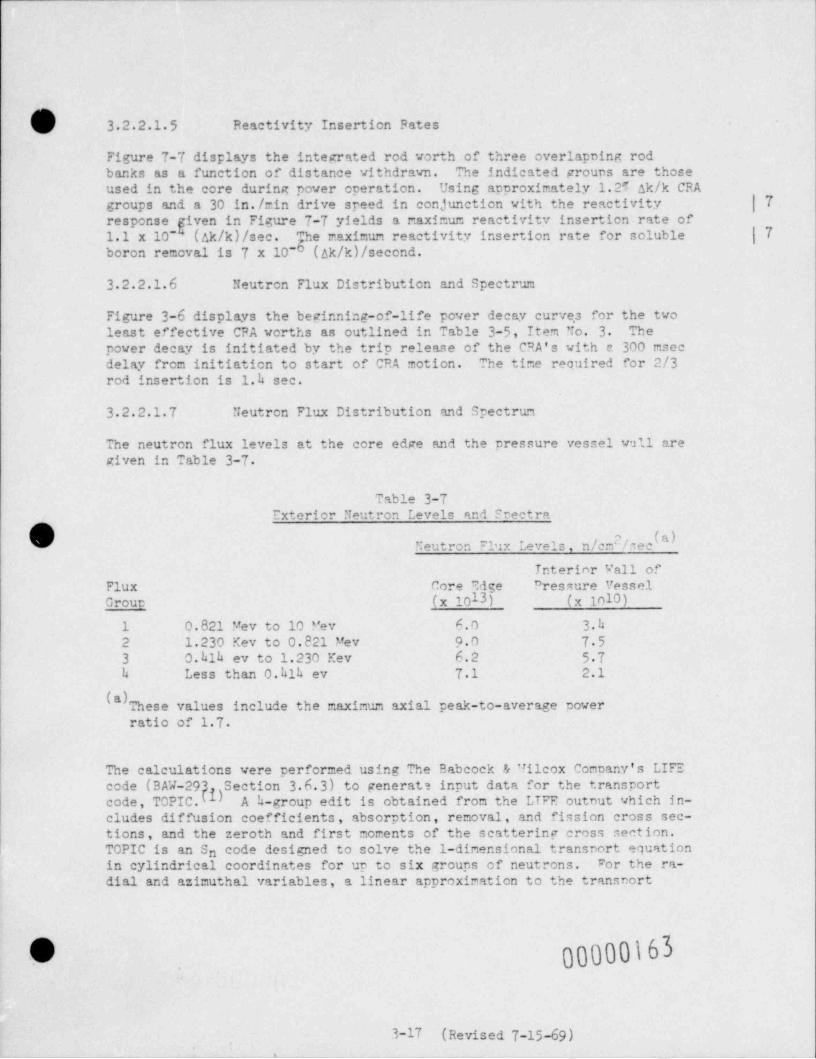
3.2.2.1 7 Neutron Flux Distribution and Spectrum
The neutron flux levels at the core edge and the pressure vessel vall aregiven in Table 3-7
Table 3-7Exterior Neutron Levels and Srectra
Neutron Flux Levels n/cm /nec("2
Interior Vall ofFlux Core Edge Pressure VesselGroun (x 1013) (x inlo)
1 0.821 Mev to 10 "ev 6.0 3.h2 1.230 Kev to 0.821 Mev 90 753 0.hlh ev to 1.230 Kev 6.2 57h Less than 0.hlh ev 71 2.1
(a)These values include the maxinum axial peak-to-average powerratio of 1.7
- The calculations were performed using The Babcock & t!ilcox Connany's LIFEcode (BAW-29 Section 3.6.3) to generat input data for the transportcode, TOPIC. b A h-group edit is obtained from the LTFE outnut which in-cludes diffusion coefficients, absorption, removal, and fission cross sec-tions, and the zeroth and first moments of the scattering cross section.TOPIC is an Sn code designed to solve the 1-dinensional transnort equationin cylindrical coordinates for up to six groups of neutrons. For_the ra-,
dial and azimuthal variables, a linear approximation to the transport
U 00000163. im
.
,
3-17 (Revised 7-15-69). _ _ _ _ _ _ _ _ _ _ _ _ _ _ _ _ _ _ _ _ _ _ _ _ _ _ _ _ _ _ '_____ _ . __1 _____ _ _ _ _ _ _ _ _ . _ . _ _ _ _ _ _ _ _ _ _ _ _ _ _ _ . _ _ _ _
equation is used; for the polar angle, Gauss quadrature is used. Scatter-ing functions are represented by a Legendre series. The azimuthal anglecan be partitioned into 4 to 10 intervals on the half-space between 0 andr. The number of mesh points in the radial direction is restricted bythe number of these intervals. For the core exterior flux calculations,four intervals on the azimuthal were.used. This allows the maximum num-ber of mesh points (240) in the "r" direction to describe the shield com-plex. An option is available to use either equal intervals on the azi-r.:uthal angle or equal intervals on the cosine of the angle- Equal inter-vals on the cosine were chosen since this provides more detail in theforward direction of the flux (toward the vessel). Five Gauss quadraturepoints were used on the cosine of the polar angle in the half-space be 'tween 0 and r.
Results from the above method of calculation have been co= pared with ther-mal flux measyrgments through an array of iron and water slabs in the LIDOpool reactor.(21 Although this is not a direct comparison with fast neu-tron measurements, it does provide a degree of confidence in the methodsince the magnitude of the ther=al flux in shield regions is governed byfast neutron penetration.
Results of the comparison showed that fluxes predicted by the LIFE-TOPICcalculation vere lover, in general, by about a factor of 2. Results ofthe fast flux calculations are, consequently, increased by a facter of 2to predict the nyt in the reactor vessel.
The following conservatisms were also incorporated in the calculations:Oa. Neutron fluxes outside the core are based on a maximum power
density of 41 vatts/cc at the outer edge of the core ratherthan an estimated average of 28 vatts/cc over life, resultingin a safety margin of about 45 per cent.
b. A maximum axial power peaking factor of 1.'T vas used. This isabout 30 per cent greater than the 1 3 expected over life.
Uncertainties in the calculations include the following:
1. The use of only four nertron groups to describe the neutronenergy spectrum.
2. Use of the LIFE code to generate the 4-group cross sections.In the LIFE program, the 4-group data in all regions are com-puted from a fission spectrum rather than a leakage spectrum.
3 Having only four intervals, i.e., n = 4 in the S calculation,nto describe the angular segmentation of the flux.
It is expected that the combination of 1 and 2 above vill conservativelypredict a high fast neutron flux at the vessel vall because it underesti-mates the effectivenese of the ther=al shield in reducing the fast fluxIn penetration through water, the' average energy of the neutrons in thegroup above 1-Mev increases above that of a fission spectrum, i.e., thespectrum in this group hardens. For neutrons above 1 Mev, the nonelastic
i'
000001M3-18
- -
O cross section of iron increases rapidly with energy. Therefore, the assump-tion of a fission spectrum to compute cross sections in the thermal shield,and the use of a fev-group model to cover the neutron energy spectrum, wouldunderestimate the neutron energy loss in the thermal shield and the subsequent
attenuation by the ya}er between the vessel and thermal shield. The resultsfrom 34-group P3) Cit 3/ calculations show that reduction of the flux above 1Mev by the themal shield is about a factor of 4 geater than that computedfrom the 4-group calculations.
The effect of 3 above is expected to underestimate the flux at the vessel vall.In calculations at ORNL using the Sn technique, a comparison between an 84 andan S12 calculation was made in penetration through hydrogen. The results fora variety of energies over a penetration range of 140 cm showed the S4 calcu-lation to be lower than the S 2 by about a factor of 2 at maximum. Good1agreement was obtained between the S12 and moments method calculations.
The above uncertainties indicate that the calculation technique should over-estimate the fast flux at the reactor vessel vall. However, the comparisonwith themal flux ita indicates a possible underestimate. Uhtil a bettercomparison with data can be made, we have assumed that the underestimate iscorrect and accordingly have increased the flux calculations by a factor of 2to predict the nyt in the reactor vessel.
The reactor utilizes a larger water gap and thinner thermal shield between thecore and the reactor vessel vall when compared to currently licensed plants.
3O The effect of this steel-water configuration on (a) the neutron irradiation,and (b) the themal stresses in the reactor vessel vall, were evaluated asfollows:
a. Neutron Irradiation
Calculations were performed in connection with the reactor vesseldesign to detemine the relative effects of varying the baffle and
thermal shield thicknesses on tne neutron flux (> 1 Mev) at the ves-the P3101 code (3) calculations were perfomed with the P1 option ofsel vall. TheJe
using 34 fast neutron groups. The results showedthat tne neutron flux level at the vessel vall is dependent, for themost part, on the total metal and water thickness between the careand the vessel. However, there was some variation in fluxes devend-ing upon the particular configuration of steel-water lamination .Also, the gain in neutron attenuation by replacing water with steeldiminishes somewhat vi-h increasing steel thickness.
In general however, the results showed that for total steel thick-nesses in the range of 3 to 6 in., 1 in. of steel in place of 1 in.of water would reduce the neutron flux above 1 Mev by about 30 percent. In pure water the calculations showed that the neutron fluxvould be reduced, on the average, by a factor of 6 in 6 in. of water.
Based on the above analysis a comparison has been made of the neutron
p attenuation in this reactor vessel with those in San Onofre, Turkeyb Point 3 and 4, Indian Point 2, and Ginna. The total distance be-
tween this core and the reactor vessel is 21 in. This provides from
1 5 to as much as 5 75 in. more distance between the core and the
000001653-19.
_.
-
.- -- - ,.---, - ,,,_,..,,...., - . - -, . . . - . -...--.----.---e , - - . - - . . - . . , _ - - - - - . , - - . ,
.
vessel than in the other reactors. For neutrons above 1 Mev it wasfound that this additional distance would provide additional attenu-ation ranging from a factor of 1.1 to 5 times greater than that inthe other WR's considered,
b. Themal Stresses
The gamma heating in the reactor vessel is produced by primary gam-mas from the core and by secondary gammas originating in the coreliner, barrel, themal shield, and the vessel itself. In this reac-tor design the major portion of the heat is generated by Samma raysfrom the core and by secondary gamma rays from the core liner andbarrel.
Since the gammas from each of these sources must penetrate the ther-mal shield to reach the vessel, the vessel heating rate is dependenton the themal shield thickness.
For designs which employ thicker themal shields, or in which inter-nals are to be exposed to higher neutron fluxes, gam =a rays originat-in6 in the themal chield or in the vessel itself may govern the ves-sel heating rates. Since gamma rays from these sources would haveto penetrate only portions or none of the themal shield to reachthe vessel, the vessel heating in such cases vould be less dependenton thermal shield thickness than in this reactor design.
A comparison was made between the gamma attenuation provided by thewater and metal in this reactor vessel and that in other PWR's by as-suming that, in each design, the vesse' heating was dependent on thegam =a ray attenuation provided by the tnemal shield. This approachwould be conservative since, as noted above for some designs, gammasources other than those attenuated by the thermal shield may con-tribute appreciably to the vessel heatin6 The results of the com-parison showed that the difference in gamma attenuation between thisreactor and other PWR's ranged fmm negligible difference to a factorof 5 3 less for this reactor design.
The maximum steady-state stress resulting from gamma heating in thevessel has been calculated to be 3,190 psi (tension). This is a rel-,
| atively low value, and no problems are anticipated from themal'
stresses in the reactor vessel vall.
3 2.2.2 Nuclear Evaluation|'
Analytical models and the application of these models are discussed in this
| s2ction. Core instabilities associated with xenon oscillation are also mem-i tiened, with threshold data evaluated under reference conditions.
3 2.2.2.1 Analytical Models
R; actor' design calculations are made with a large number of co=puter codes.The choice of which code set or sets to use depends on which phase of the de-sign is being analyzed. A list'of codes used in core analysis with a brief $discussion follows in 3 2.2.2.2.
3-2o 00000l66_
. - . . .
4,
O -
a. Reactivity Calculations
Calculation of the reactivity of a pressurized water reactor core isperformed in one, two, or three dimensions. The geometric choice de-pends on the type of calculations to be made. In a clean type ofcalculation where there are no. strong localized absorbers of a typea
differing from the rest of the lattice, 1-dimensional analysis issatisfactory. This type of problem is handled quite well by the BisW1-dimensional depletion package code LIFE. LIFE is a composite ofMUFT (Ref. 4), KATE (Ref. 5), RIP, WANDA (Ref. 6), and a depletionroutint. Nomally the MUFT portion is used with 34 energy groups,an exact treatment of hydrogen, the Greuling-Goertzel approximationfor elements of mass less than 10, and Femi age for all heavier ele-ments. The KATE portion nomally uses a Wigner-Wilkins spectrum.In WANDA, 4 ene:gy groups are utilized. Disadvantage factors for in-4
put to the themal group are calculated with the THERMOS (Ref. 7)code. This code set has-been shown to give reliable results for a
.
reactivity calculation of this type. Recen' check calculations on' critical experiments have a standard deviatic.a of less than 0 5%
Ak/k. -
A 1-dimensional analysis of a geometric arrangement, where there arelocalized strong absorbers such as CRA's, requires a preliminary 2-dimensional analysis. The required properties of.the 1-dimensionalsystem are then matched to the 2-dimensional analysis. In this man-
yO ner, it is possible to analyze the simpler 1-dimensional system in adepletion survey problem with only a small loss in accuracy.
.
The 1-dimensional calculations are used as preliminary guides for'
the more detailed 2-dimensional analysis that follows. Values of re-activity coefficients, fuel cycle enrichments, lifetimes, and solu-ble poison concentrations can be found to improve the initial condi-tions specified for 2-dimensional analysis.
Two-dimensional reactivity calculations are done with either the PDQ(Ref. 8) or TURBO (Ref. 9) diffusion and/or depletion codes. Thesecodes have mesh limitations on the size of i cosfiguration which canbe shown explicitely and are often stud $ d "'.th 'tuarter core symmetry.
. Symmetry is desirable in the design. Wrf ci '.os in generality occurs.I The geometric description includes e*A 4 assembly and as much de-
tail as is possible, i.e., usually ech Mc in the fuel assembly.,
! Analysis of this type pemits detailed power digt;. 'bution studies aswell as reactivity analysis. The power distributice in a large PWRcore which has zone loading cannot be predicted reliatly with 1-,
dimensional calculations. This is particularly true when local powerpeaking as a function of power history is of interest. It is.neces-sary to study this type of problem with at least a 2-dimensWalcode, and in some cases 3-dimensional calculations are necessary.
.
. Use of the 2-dimensional programs requires the generation of gi 7
- p(/. .constants as a function of material composition, power histo vI I
~
,
geometry. For regions where diffusion theory is valid, MUFT ands_
KATE with THERMOS disadvantage factors are used to generate epither-,
: mal and thermal coefficients.- This would apply at a distance of a
00000167 ''M 00103_,1
. - _ - - _ - - - _ - . - . - . _ - - - .
_. _
few mean paths from boundaries or discontinuities in the fuel rod.
lattice. Discontinuities refer to fuel assembly can, water channels,instrumentation ports, and CRA guide tubes. The interfaces betweenregions of different enrichment are considered to be boundaries as
well as the outer limit of the core.
To generate coefficients for regions where diffusion theory is inap-propriate several methods are utilized. The arrangement of struc-tural material, water ch mnels, and adjacent fuel rod rows can berepresented well in slab geometry. This problem is ana4 zed byP3)G (Ref. 3) which is effective in slab geometry. The coefficients
( so generated are utilized in the epithermal energy range. Coeffi-cients for the thermal energy range are generated by a slab THERMOSi
calculation. The regions adjacent to an interface of material ofdifferent enrichment are also well represented with the P3no code.
The arrange.snt of instrumentation ports and control rod guide tubeslends itself to cylindrical geometry. DTF-IV (Ref. 10) is quite ef-fective in the analysis of this arrangement. Input to DTF-IV isfrom GAM (Ref.11) and THERMOS or KATE. Iteration is required be-tween the codes. The flux shape is calculated by DTF-IV and crosssections by the others. The outer boundary of the core where thereis a transition from fuel to reflector and baffle is also representedby the DTF-IV code. The 3-dimensional analysis is accomplished byextending the techniques of 2-dimensional representation.
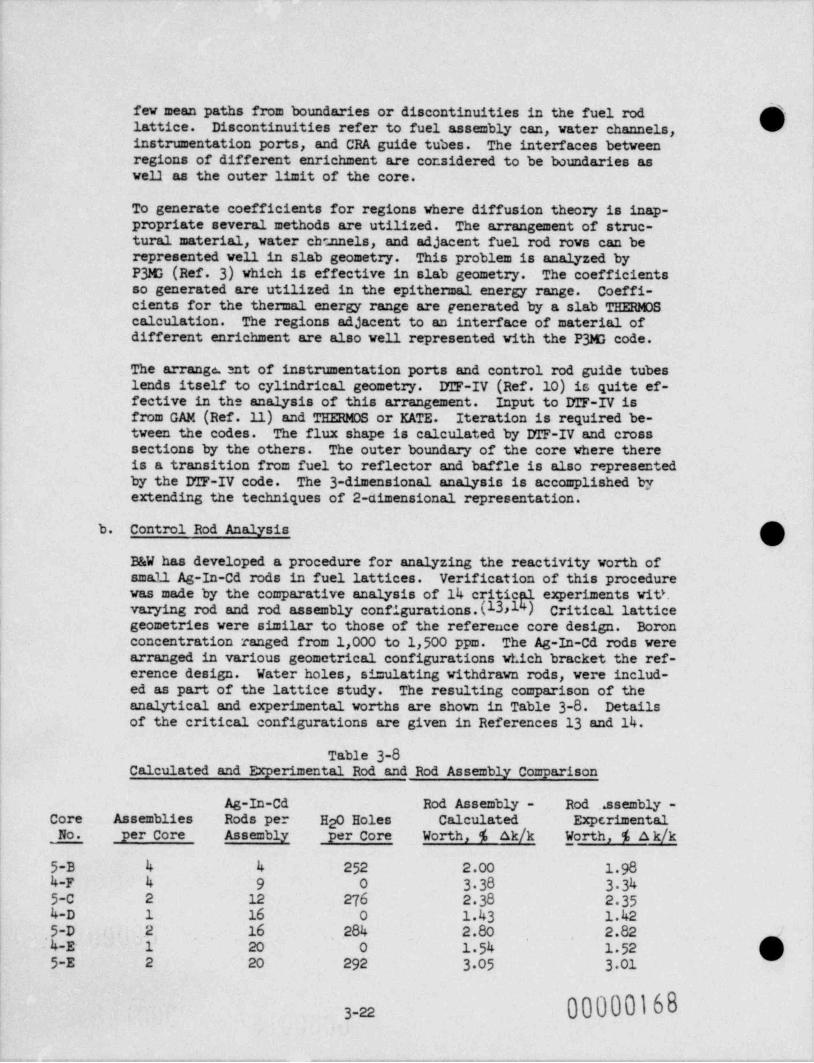
b. Control Rod Analysis gB&W has developed a procedure for analyzing the reactivity worth ofsmall Ag-In-Cd rods in fuel lattices. Verification of this pzocedurewas made by the comparative analysis of 14 critical experiments vit*.varying rod and rod assembly configurations.(13,l'+) Critical latticegeometries were similar to those of the reference core design. Boronconcentration ranged from 1,000 to 1,500 ppm. The Ag-In-Cd rods werearranged in various geometrical configurations vLich bracket the ref-erence design. Water holes, simulating withdrawn rods, were includ-ed as part of the lattice study. The resulting comparison of theanalytical and experimental worths are shown in Table 3-8. Detailsof the critical configurations are given in References 13 and 14.
Table 3-8Calculated and Experimental Rod and Rod Assembly Comparison
Ag-In-Cd Rod Assembly - Rod .ssembly -Core Assemblies Rods per H O Holes Calculated Experimental2No. per Core Assembly per Core Worth, $ Ak/k Worth, % A k/k
5-B 4 4 252 2.00 1 984-F 4 9 0 3 38 3 345-C 2 12 276 2 38 2 354-D 1 16 0 1.43 1.425-D 2 16 284 2.80 2.82
,
14-E l' 20 0 1 54' l.525-E 2 20 292 3 05 3 01
000001683-22.
.-- - - ~ . . - - , - - , - . -y ~ u . - - . - --.-r~-- . . - - . - , - - - -- - - - . . ~ - , -- - --
OThe mean error in calculating these-configurations is shown to beless than 1 per cent. Comparison of the power shape associated withthe 16-rod reference assemblies showed good similarity. Point-to-average power had a maximum variation of less than 2 per cent withexperimental data.
The analytical method used for this analysis is based on straight dif-fusion theory. Thermal coefficients for a control rod are obtained ;
from THERMOS by flux-weighting. Epithermal coefficients for theupper energy groups are generated by the B&W LIFE program. The re-sulting coefficients are used in the 2-dimensional code PDQ to obtainthe required eigenvalues.
GAKER and LIBPM are used to prepare data for THERMOS. GAKER gener-ates scattering cross sections for hydrogen by the Nelkin technique.LIBPM uses the Brown and St. John free gas model for generating theremaining scattering crocs sections.
THERMOS is used in two steps. First, the critical fuel cell is ana-lyzed to obtain a velocity-weighted disadvantage factor. This isused in the homogenization of fuel cells and gives a first order cor-rection for spatial and spectral variation. The ratio of flux in themoderator to flux in the fuel was analyzed to within 2 per cent ofexperimental values using the velocity-weighting technique. The sec-
p ond step is to use THERMOS in a calculation where the Ag-In-Cd rod isV surrounded by fuel. This is used to generate the flux-weighted con-
trol rod cell coefficients as a function of boron concentration. Asa check on the validity of the THERMDS approach, extrapolation dis-tances were compared to those given by the Spinks method.(15) Theagreement was within 2.2 per cent for a set of cases wherein the num-ber densities of A6-In-Cd were varied in a range up to 250 per cent.All other coefficients are generated by LIFE in much the same manneras with THERMOS. The data are used in a 2-dimensional PDQ layoutwhere each fuel rod cell is shown separately.
c. Determination of Reactivity Coefficients
This type of calculation is different from the reactivity analysisonly in application, i.e., a series of reactivity calculations beingrequired. Coefficients are determined for moderator temperature,voiding, and pressure, and for fuel temperature. These are calcu-lated from small perturbations in the required parameter over therange of possible values of the parameter.
The moderator temperature coefficient is detennined as a function ofsoluble poison concentration and moderator temperature, and fuel tem-perature or Doppler coefficient as a' function of fuel temperature.The coefficient for voiding is calculated by varying the moderatorconcentration or per cent void.
3 2.2.2.2 Codes for Reactor Calculations
This section contains a brief description of codes mentioned in t@he gring
~
0@sections. '
'
g.
3-23.
- . - - - . - - - .- - . - . . .- - _ - . - - - . . . -
THERMOS (Ref. 7) This code solves the integral form of the BoltzmannTranspor Equation for the neutron spectrum as a function of po-sition. A diaBonalized connection to the isotropic transfermatrix has been incorporated allowing a degree of anisotropicscattering.
MTT (Ref. 4) - This program solves the P1 or By multigroup equation forthe first two Legendre coefficients of the directional neutronflux, and for the isotropic and anisotropic components of theslowing down densities due to a cosine-shaped neutron source.Coefficients are generated with MUFT for the epithermal energy
I range.
KATE (Ref. 5) - The code solves the Wigner-Wilkins differential equationfor a homogeneous medium moderated by chemically unbound hydro-gen atoms in thermal equilibrium. Coefficients for the thennalenergy range are generated by KATE.
RIP - This program averages cross sections over an' arbitrary group struc-ture, calculates resonance integrals for a set of resolved peaks,and computes L-factors for input to MTT, Pilc , and P3M?r.
WANDA (Ref. 6) - This code provides numerical solutions of the 1-dimen-sional fev-group neutron diffusion equations.
LIFE - This is a 1-dimensional depletion package code which is a combina-
gtion of MUFT, KATE, RIP, and WANDA. The combination mechanizesthe procedures for using the codes separately.
GAM (Ref.11) - This code is a multigroup coefficient generation programthat solves the F1 equations and includes anisotropic scattering.Inelastic scattering and reconance parameters are also treatedby GAM.
P310 (Ref. 3) - The code solves the multienergy transport equation invarious geometries. The code is primarily used for epithermalcoefficient generations.
DIF (Ref.10) - This code solves the multigroup,1-dimensional Boltmanntransport equation by the method of discrete onlinates. DIF al-lows multigroup anisotropic scattering as well as up and downscattering.
i PDQ (Ref. 8) - This program solves the 2-dimensional neutron diffusion-depletion problem with up to five groups. It nas a flexible rep-resentation of time-dependent cross sections by means of fit op-tions.
TURBO (Ref. 9) - This code is similar in application to the PDQ depletionprogram. It, however, lacks the great flexibility of the PDQfit options.
CANDLE (Ref. 9) - This code is similar to TURBO, but solves the diffusion gequations in one dimension.
000001703-24
_ _ _ _ - - - .-.
. _ __ _ . _ . .
i
i
< , , .|
1
O- '
TNT (Ref. 9) - This code is similar in application to TURBO, but is a 3-.
. dimensional code extended from DRACO.l
3 2.2.2 3 xenon stability Analysis |
,
Initial studies of the reference core, where realistic fuel temperatures aregenerated by thermal-nuclear iteration, indicate no instability at any time
These results are encoura6 ng, but until more detailedduring the life cycle. 1analyses are completed, it will be assum M that axial xenon oscillations arepossible. _ Azimuthal oscillations are un11ely, and radial oscillations willnot occur.
Since the size, flux level, and power coefficient of current PWR designs areconducive to xenon oscillations, an extensive investigation must be completedbefore the stability of a core can be ascertained. An adequate solution canbe found by first using analytical techniques in the manner of Randall and St.John to predict problematic areas, and then by analyzing these with diffusiontheory programs that are coupled with heat transfer equations.
The results of the stability analysis of the reference core are presented be-low, followed by the methods section containing the details of the thresholdand diffusion theory calculations employed. The closing section outlines anoverall approach to the solution of the stability problem in regard to addi-tional detailed calculative programs as well as a method for the correction ofunbalanced power distributions.
O- a. Summary of Results
(1) Threshold Analysis
In the threshold analysis axial, azimuthal, and radial oscilla-
tions were investigated for beginnin6 7)of-life, flattened, andslightly dished power distributions.(1 The results are asfollows:
(a) For a fixed dimension, the tendency toward spatial xenonoscillation is increased as the flux increases.
(b) For a fixed flux, the tendency toward spatial oscillationis increased as the dimension of the core increases.
(c) The large size of current PWR designs permits an adequatexenon description using 1-group theory.
(d) Flattened power distributions are more unstable than nor-mal beginning-of-life distributions. Dished power distri-butions are even worse.
(e) In a modal analysis of the reference core, modal couplingcan be ignored. In addition, the core is not large enoughto permit second-harmonic instability.,
t
0000017I
'
~g. 3-25.
u__
. .- _ . . _ . _-
.
.
. . .
(f) A large, negative power coefficient tends to dampen oscil- glations. If this coefficient is sufficiently large, os-cillations cannot occur regartiless of core size or fluxlevel. Current PWR designs have a substantial negativepower coefficient.
(g) The critical diameter for azimuthal oscillations is largerthan the critical height for axial oscillations.
'(h) The reference core design is not large enough to exciteradial oscillations.
(1) Examination of the diameter, height, and power coefficientfor this reference design indicates that oscillationsshould not occur at the beginning of life with unflattenedpower distributions. However, there exists a finite prob-ability of oscillations at some later time, since core de-pletion tends to flatten the power distribution.
(j) The period of oscillation (25 to 30 hours) is long enoughto pemit easy control of the oscillations.
(k) The modal analysis of this core toward the end of the ini-tial cycle (with about 80 per cent flatness) showed thataxial oscillations are possible, azimuthal oscillationsare unlikely, and radial oscillations vill not occur.
O(2) Depletion Analysis
Diffusion-depletion calculations coupled with heat transferequations were employed to investigate further the axial sta-bility of the core since the ulalytical study indicated thatthis was the most probable mode of oscillation. The resultsfollow:
(a) Axial instability did not occur at any time during the ini-| tial cycle. An average fuel temperature of 1,400 F was'
maintained during the cycle.;
(b) The threshold for axial instability near the end of theinitial cycle was found to coincide with a core averagefuel temperature of 900 F.
Diffusion theory was also used to examine the problem of con-trolling the system with rods if the stabilizing power Dopplerwas not present. The following was concluded:
(a) Partial control rods are quite adequate in controllingaxial oscillations. These rods have 3-ft-long poison sec-tions which are moved up and down about the midplane ofthe core to offset oscillatory power shifts.
O00000172
3-26
- -. . .. - --. . -. . _.-
.__ _.
!
,
O(b) - Detailed power profiles will be available to the reactor
,
operator as output from the instrumentation. The large |period of the oscillation will allow partial rod movement ;
such that axial power peaks are held well within allowabic |
limits.
.b. Methods
(1) Threshold Analysis.
The method used in the threshold analysis is an extension of .
the 1-group treatment including power coefficient introduced byRandall and St. John. One- and 2-group treatments have beencompared, and the conclusion drawn is that a 1-group model issatisfactory for large cores. For all three geometries, datawere generated as a function of:
(a) Core size.
(b) Flux level.(c) Degree of flatness in the power distribution.
1
(d) Power coefficient.
(e) Reactivity held by saturation xenon.
In addition, slightly dished power distributions were investi-gated to show that any dishing resulting from high depletion isnot sufficient to require correction to data based on replacingthe dished segment with a flat power distribution.
The effect of modal coupling has been examined and shown to beof no consequence for cores similar to the reference reactor,
design. Values of the critical dimension varied no more than1 to 2.8 per cent for the same core with and without modal cou-pling. The lower value was computed with a zero power coeffi-cient and was not conservative without modal coupling. Thehigher value wac computed with the reference power coefficientand was conservative without modal coupling.
:' Table 3-9 summarizes those parameters for the reference core
which affect the xenon stability threshold. The parameters werecalculated at two substantially different times in core life.Reference physical dimensions are also shown for comparison pur-poses in.the following discussion.
Table 3-10 shows the threshold dimensions for first mode in-stability as a function of flux flattening. The percenta6e offlattening is defined mJ 100 per cent times the. ratio of theflattened power distribu11on to the total physical dimensionunder consideration. Tta parameters of Table 3-9 at two fullpower days were used sir.ce they are virtually the same as thoseat 150 days but are more conservative. Axial depletion studies
000001733-n
_ - _ _ _ - - - - _ - - . - - - _ - - - - . - . - ..
- _ . - . - - ~ . - . --
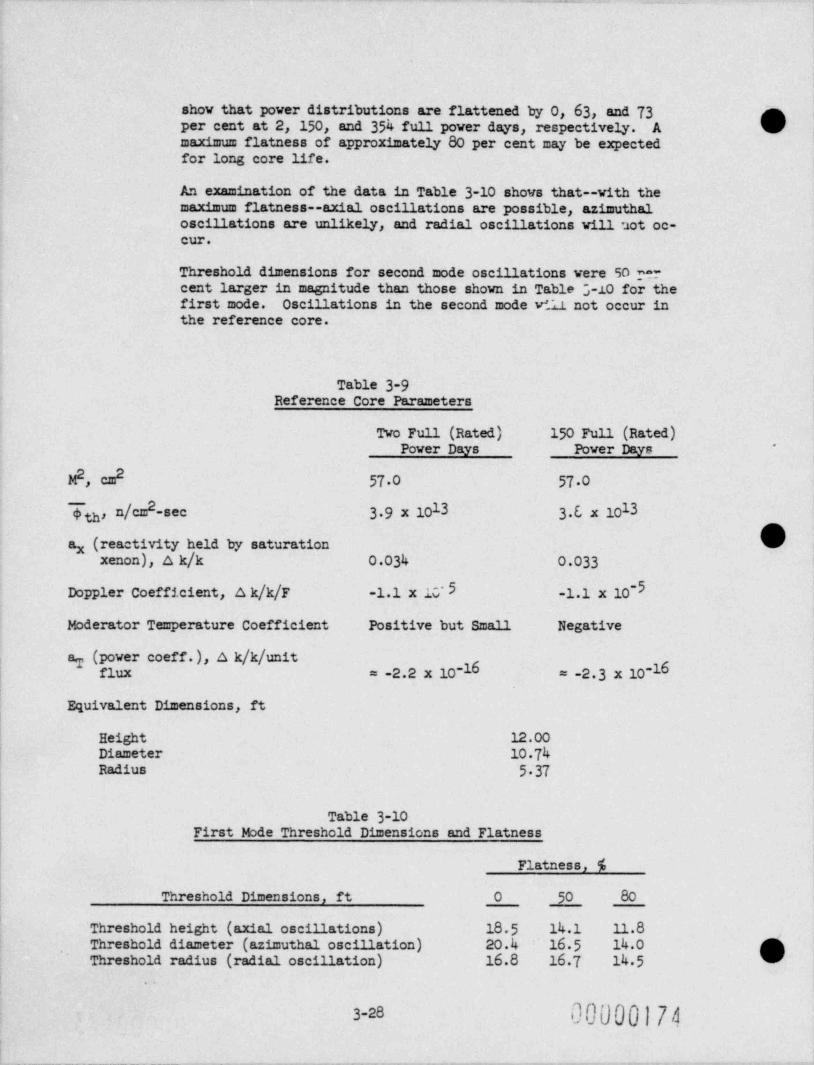
show that power distributions are flattened by 0, 63,'and 73 m-per cent at 2, 150, and 354 full power days, respectively. A Wmaximum flatness of approximately 80 per cent may be expectedfor long core life.
An examination of the data in Table 3-10 shows that--with themaximum flatness--axial oscillations are possible, azimuthaloscinations are unlikely, and radial oscillations viu not oc-Cur.
Threshold dimensions for second mode oscinations were 50 percent larger in magnitude than those shown in Table 3-10 for thefirst mode. Oscillations in the second mode vill not occur inthe reference core.
Table 3-9Reference Core Parameters
Two Full (Rated) 150 Full (Rated)Power Days Power Days ~
2 2M , cm 57 0 57 02 1Tth,n/cm-sec 3 9 x 10 3 3 E x 1013
x (reactivity held by saturationaxenon),ak/k O.034 0.033
DopplerCoefficient,ak/k/F -1.1 x iG'3 -1.1 x 10⁻⁵
Moderator Temperature Coefficient Positive but Small Negative
T(powercoeff.),Ak/k/ unitai
flux = -2.2 x 10-1 = -2 3 x 10⁻¹,
,
Equivalent Dimensions, ft!| Height 12.00| Diameter 10 74
Radius 5 37
Table 3-10First Mode Threshold Dimensions and Flatness
Flatness, %
Threshold Dimensions, ft 0 50 80!'
Thresholdheight(axialoscillations) 18 5 14.1 11.8,
Threshold diameter (azimuthal oscillation) 20.4 16 5 14.0 gThreshold radius (radial oscillation) 16.8 16 7 14 5
.
3-28 00000174:t
.- - . - - _ _ _ _ _ . .. . .. . . . -- . _.
.-.
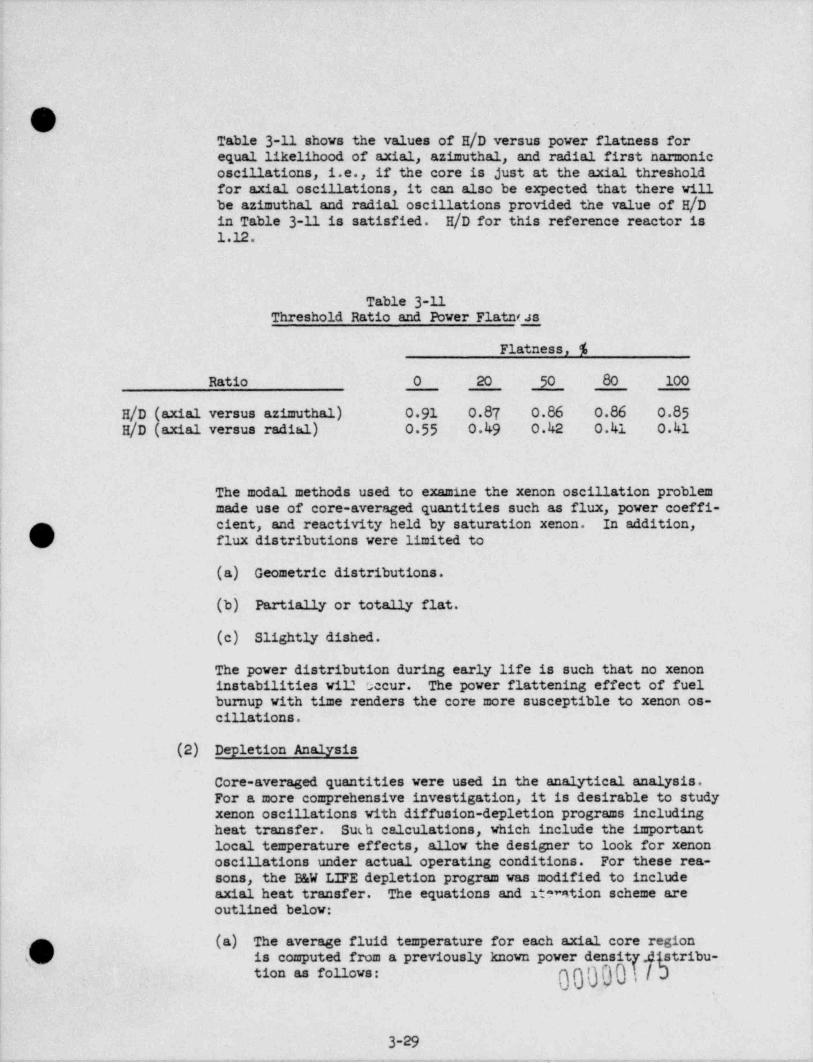
OTable 3-11showsthevaluesofH/Dversuspowerflatnessfor-equal likelihood of axial, azimuthal, and radial first narmonicoscillations, i.e., if the core is just at the axial thresholdfor axial oscillations, it can-also be expected that there willbeazimuthalandradialoscillationsprovidedthevalueofH/Din Table 3-11'is satisfied. H/Dforthisreferencereactoris1.12.
' Table 3-11Threshold Ratio and Power Flatng
Flatness, %
Ratio O 20 50 80 100
H/D(axialversusazimuthal) 0 91 .o.87 o.86 o.86 0.85H/D(axialversusradial) 0 55 0.49 _O.42 0.41 0.41
The modal methods used to examine the xenon oscillation problemmade use of core-avera6ed quantities such as flux, power coeffi-
| cient, and reactivity held by saturation xenon. In addition,L - flux distributions were limited to:
| (a) Geometric distributions.
(b) Partially or totally flat.
(c) Slightly dished.
The power distribution during early life is such that no xenon,
| instabilities wil2 occur. The power flattening effect of fuelburnup with' time renders the core more susceptible to xenon os-cillations.
(2) Depletion Analysis.
Core-averaged quantities were used in the analytical analysis.For a more comprehensive investigation, it is desirable to studyxenon oscillations with diffusion-depletion programs including
.
heat transfer. Such calculations, which include the important|local temperature effects, allow the designer to look for xenonoscillations under actual operating conditions. For these rea-sons, the B8M LIFE depletion program was modified to includeaxial heat transfer. The equations and it m tion scheme areoutlined below:
.fN (a) The average fluid temperature for each axial core regionk is computed from a previously known power density.d(stribu-
}/Jtion as follows: i
.
3 29._ - - . - . . . - - . - . . - . . . - . . . - - . . . . - . - - - . - _ . - - . - - - . - - -
- -_. _ . _ .. -- . - - - - - -
_
'
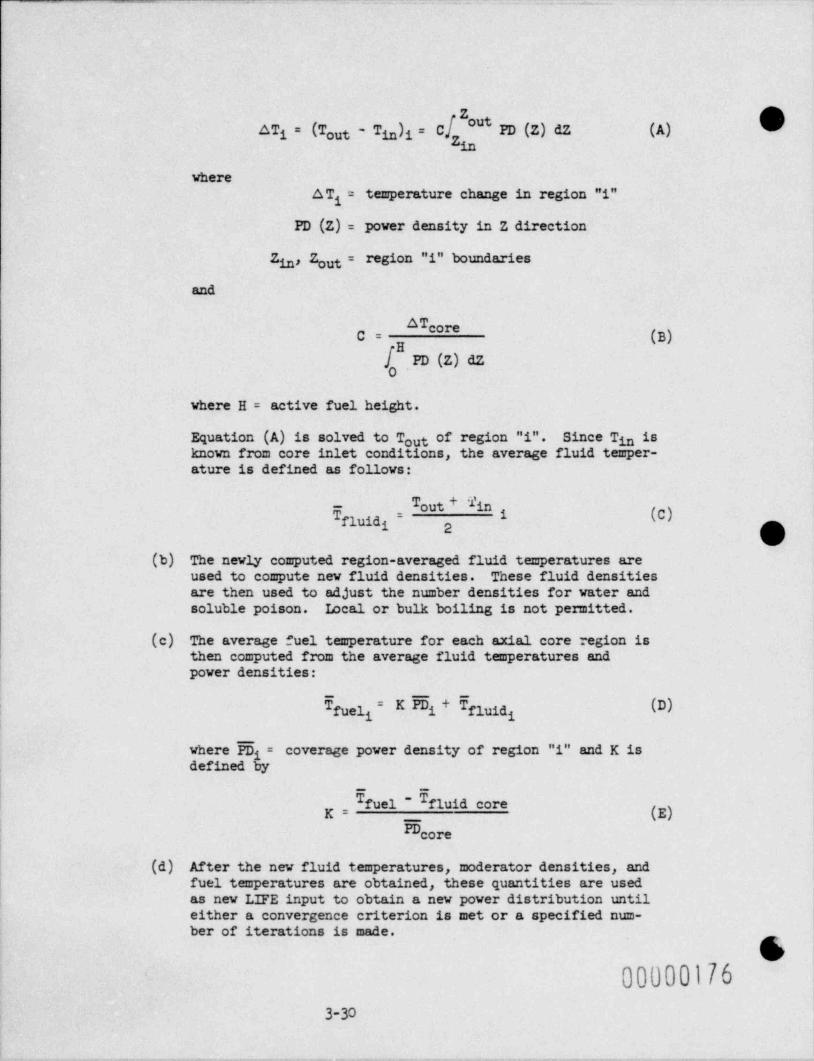
in)1=C[Z"
ATi = (Tout - T PD(Z)dZ (A)in
whereATg = temperature change in region "1"
PD (Z) = power density in Z direction
Zin, Zout = region "i" boundaries
and
#*C= (B)
J PD (Z) dZ
where H = active fuel height.
Equation (A) is solved to Tout of region "1". Since Tin 18known from core inlet conditions, the average fluid temper-ature is defined as follows:
- Tout + TinT *
fluidi 2 g(b) The newly computed region-averaged fluid temperatures are
used to compute new fluid densities. These fluid densitiesare then used to adjust the number densities for water andsoluble poison. Local or bulk boiling is not permitted.
|
(c) The average fuel temperature for each axial core region isthen computed from the average fluid temperatures and
,
power densities:
fuel * K i+ fluid Ni i
where FDi= coversge power density of region "i" and K isdefined by
-fuel - T-T fluid core,
!PDcore
| |
| (d) After the new fluid temperatures, moderator densities, and i
fuel temperatures are obtained, these quantities are usedas new LIFE input to obtain a new power distribution untileither a convergence criterion is met or a specified num-ber of iterations is made.
600000176-
3-30
_ _ __ . . - . .- - __ . _ _ _ -.
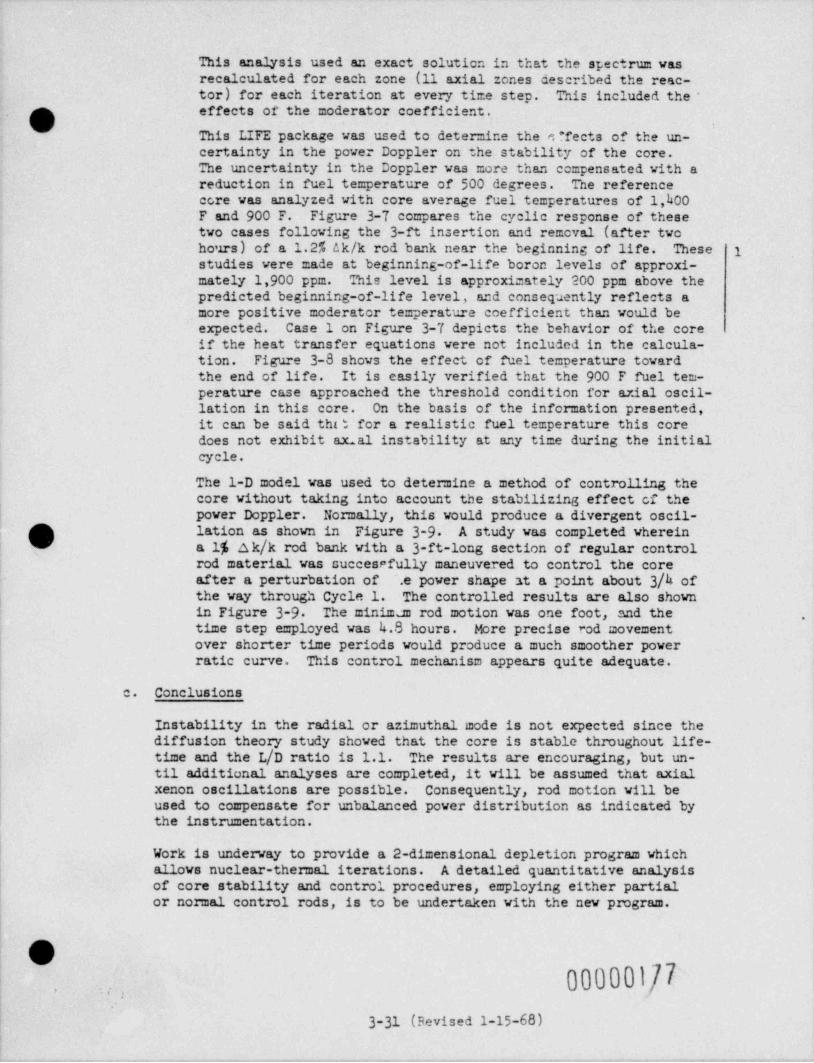
This analysis ussd an sxact solution in that the cpectrum wasrecalculated for each zone (11 axial zones described the reac-tor) for each iteration at every time step. This included the
A effects of the moderator coefficient.
V This LIFE package was used to determine the 6 ?fects of the un-certainty in the power Doppler on the stability of the core.The uncertainty in the Doppler was more than compensated with a- reduction in fuel temperature of 500 degrees. The referencecore was analyzed with core average fuel temperatures of 1,h00F and 900 F. Figure 3-7 compares the cyclic response of thesetwo cases following the 3-ft insertion and removal (after twohours) of a 1.2% ak/k rod bank near the beginning of life. These istudies were made at beginning-of-life boron levels of approxi-mately 1,900 ppm. This level is approximately 200 ppm above thepredicted beginning-of-life level, and consequently reflects amore positive moderator temperature coefficient than would beexpected. Case 1 on Figure 3-7 depicts the behavior of the coreif the. heat transfer equations were not included in the calcula-tion. Figure 3-8 shows the effect of fuel temperature towardthe end of life. It is easily verified that the 900 F fuel tem-perature case approached the threshold condition for axial oscil-lation in this core. On the basis of the information presented,it can be said thtt for a realistic fuel temperature this coredoes not exhibit ax.al instability at any time during the initialcycle.
The 1-D model was used to determine a method of controlling thecore without taking into account the stabilizing effect of the
,
| power Doppler. Normally, this would produce a divergent oscil-p lation as shown in Figure 3-9 A study was completed wherein|
! V a 1% ok/k rod bank with a 3-ft-long section of regular controlrod material was cuccesPfully maneuvered to control the coreafter'a perturbation of .epowershapeatapointabout3/hofthe way through Cycle 1. The controlled results are also shownin Figure 3-9 The miniman rod motion was one foot, and the'
.
time step employed was 4.8 hours. More precise rod movementover shorter time periods would produce a much smoother powerratic curve. This control mechanism appears quite adequate,
c. Conclusions
Instability in the radial or azimuthal mode is not expected since thediffusion theory study showed that the core is stable throughout life-
time and the L/D ratio is 1.1. The results are encouraging, but un-til additional analyses are completed, it will be assumed that axialxenon oscillations are possible. Consequently, rod cotion vill beused to compensate for unbalanced power distribution as indicated bythe instrumentation.
Work is underway to provide a 2-dimensional depletion program whichallows nuclear-themal iterations. A detailed quantitative analysisof core stability and control procedures, employing either partialor nomal control rods, is to be undertaken with the new program.
AU
000001/7. .,
i- 3-31 (Revised 1-15-68)
. -- . .-.. - . . . . . _ . . . -, - - . . - . .-
.
323 THERMAL AND HYDRAULIC DESIGN AND EVALIATION
3231 Thermal and Hydraulic Characteristics g3 2 3 1.1 Fuel Assembly Heat Transfer Design
e. . Design Criteria
The criterion for heat transfer design is to be safely below Depar-ture from Nucleate Boiling (DNB) at the design overpower (114 percent of rated power). A detailed description of the analysis isgiven in 3 2 3 2.2, statistical Core Design Technique.
The input infomation for the statistical core design technique andfor the evaluation of individual hot channels consists of the follow-ing:
(1) Heat transfer critical heat flux equations and data correlations.
(2) Nuclear power factors.
(3) Engineering hot channel factors.
(4) Core flow distribution hot channel factors.
(5) Maximum reactor overpower.
These inputs have been derived from test data, physical measurements,gand calculations as outlined below,
b. Heat Transfer Equation and Data Correlation
The heat transfer relationsh o used to) predict limiting heat transferconditions is presented in BAW-168.(10 The equation is as follows:
q" = (1.83 - o.000415 P) x 90,000
o.3987 e o.001036 A T ,c - 1.027 x 10⁻⁶ (A Tm )29.2%
where q" = critical heat flux as predicted by thebestfitform, Btu /hr-ft2
P = core operating pressure, psia
2G = channel mass velocity, lb/hr-ft
| S = channel equivalent diameter, ft
L = length up the channel to the point ofinterest, i't
AT,,e = inlet subcooling (Tsat - Tinlet) bTsat = coolant saturation temperature corre-
sponding to P, F
00000178"
3 32
- . _ . -. . . . . .. _. .
_
, . . _ , _ _ _ _ - _ _ _-
~
This equation was' derived from experimental heat transfer data. Ananalysis of heat transfer data for this and other relationships isdescribed in detail in 3 2 3 2 3, correlation of Heat Transfer Data.
Individual channels are analyzed ',,o detemine a IIIB. ratio, i.e., theratio of the heat flux at which a IRB is predicted to occur to theheat flux in the channel being investigated. . This DEIB ratio is re-lated-to the data correlation as in Figure 3-10. A confidence and.population value is associated with every DNB ratio as described inthe Statistical-core Design Technique. The plot of IRB versus P-
shown is for a confidence of.99 per cent.
The DNB and population relationships shown are also the values ~asso-ciated with the single hot channel analysis for the hottest unit cellwhere. a 138 DtlB ratio corresponds to a 99 per cent confidence that -at least 94 5 per cent of the population of all suca hot channelsare in no jeopardy of experiencing a IItB. This statement is a cor-ollary to the total core statistical statement given in 3 1.2 3,Themal'and Hydraulic Limits. The criterion for evaluating thethemal design margin for individual channels or the total core isthe confidence-population relationship. The DtiB ratios required tomeet the basic criteria or limits are a function of the experimental-data and heat transfer correlation used, and vary with the quantityand quality of data.
c. Nuclear Power Factors
The heated surfaces in every flow channel in the core are examinedfor heat flux limits. The heat' input to the fuel rods comprising acoolant channel is determined from a nuclear analysis of the coreand fuel assemblies. The results of this analysis are as follows:
(1) The nominal nuclear peaking factors for the worst time in corelife are
FA h = 1 79
Fz = 170
Fq = 3 04
(2) The design nuclear peaking factors for the worst time in corelife are
Fa h = 1.85
Fz = 1 70
Fq = 3 15-
00000179.
8
i. 3-33|
___. . _ . _~ _ . . . _ . , - - - , . _ _ , . . _ , _ . , , - . . . . _ . . _ . . . _ . . . _ , _ . . . . _ , _ . . . . . _ _ _ - , _ _ _ . - . . - . . . - -
- _ - _ . _ .
_
|
l
FA h = max /av; total power ratio (radial xlocal. nuclear)
Fz = max / avg axial power ratio (nuclear)
Fq = FAh x Fz (nuclear total)
The nominal values are the maximum calculated values. The designvalues are obtained by increasing the maximum calculated total powerratio, Fah, from 179 to 1.85 to obtain a more conservative design.
The axial nuclear factor, Fz, is illustrated in Figure 3-11. Thedistribution of power expressed as P/P is shown for two conditionsof reactor operation. The first condition is an inlet peak with amax /avgvalueof170resultingfrompartialinsertionofaCRAgroup for transient control following a power level change. Thiscondition results in the maximum local heat flux and maximum linearheat rate. The second power shape is a symmetrical cosine which isindicative of the power distribution with xenon override rods with-drawn. The flux peak max / avg value is 150 in the center of the ac-tive core. Both of these flux shapes have been evaluated for ther-mal DNB limitations. The limiting condition is the 1 5 cosine powerdistribution. The inlet peak shape has a larger maximum value.However, the position of the 1 5 cosine peak farther up the channelresults in a less favorable flux to enthalpy relationship. Thic efeet has been demonstrated in DNB tests of nonunifom flux shapes. 9) hThe 15 cosine axial shape has been used to determine individualchannel DNB limits and make the associated statistical analysis.
The nuclear factor for total radial x local rod power, Fa h, is cal-culated for each rod in the core. A distribution curve of the frac-tion of the core fuel rods operating above various peaking factorsis shown in Figure 3-12. Line B shows the distribution of the maxi-mum calculated values of FAh for nominal conditions with a maximumvalue of 1 79 The distribution of peaking factors for the design
, condition is obtained by increasing the maximum calculated value for
( all rods in the core by the ratio of 1.85/179 or 1.033 to pmvide| conservative results. Determination of the peaking distribution for| the design condition in this mr ier has the effect of increasing re-
actor power by about 3 per cen . This assumption is conservativesince the distribution with a maximum peak F A h of 1.85 vill followa line similar to Line C where the average power of all rods in thecore is represented by an F Ah of 1.0. The actual shape oi the dis-tribution curve is dependent upon statistical peaking relationships,CRA positions, moderator conditions, and operating history. Theshape of the distribution curve vill be more accurately describedduring the detailed core design.
00000180'
O-'
|~
,
l 3-34
___ _. - . . _ . . . . _ _ _ _ .- _ _ _ __._ _ _,
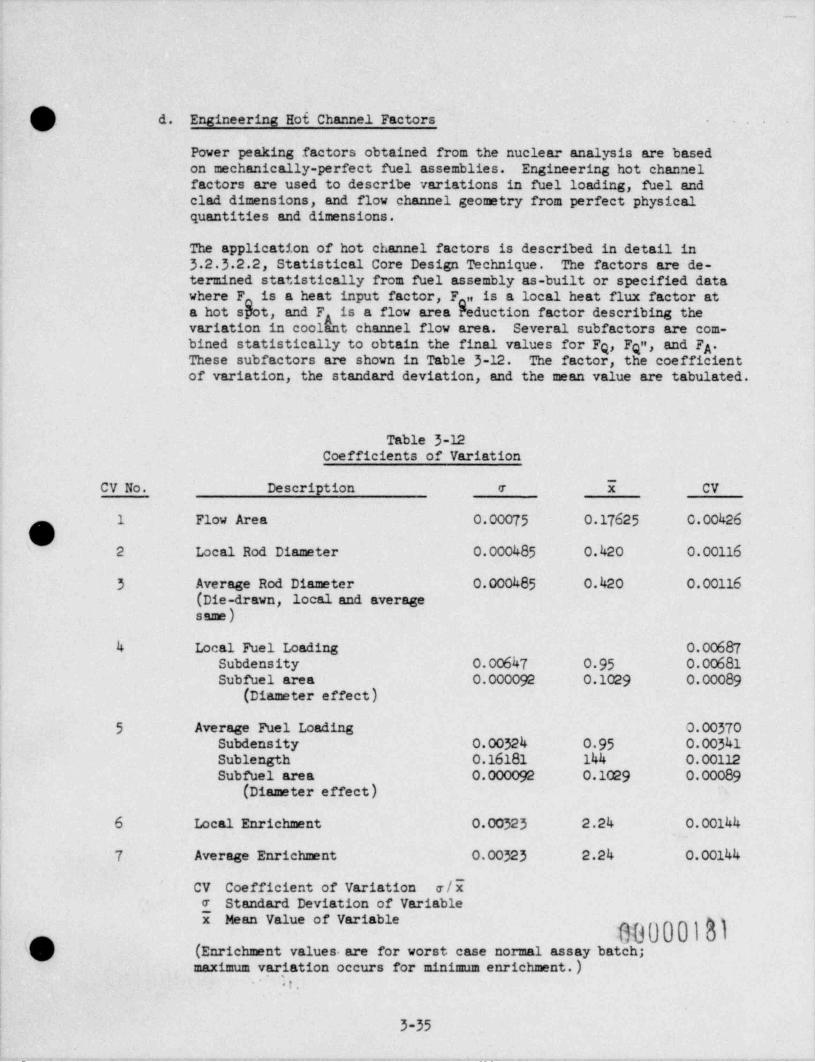
-.
. d. Engineering Hof, Channel Factors
Power peaking factors obtained from the nuclear analysis are basedon mechanically-perfect fuel assemblies. Engineering hot channelfactors are used to describe variations in fuel loading, fuel andclad dimensions, and flow channel geometry from perfect physicalquantities and dimensions.
The application of hot channel factors is described in detail in.3 2 3 2.2, Statistical Core Design Technique. The factors are de-termined statistically from fuel assembly as-built or specified datawhere F is a heat input factor, F n is a local heat flux factor ataa hot s t, and F is a flow area reduction factor describing thevariationincoolbtchannelflowarea. Several subfactors are com-bined statistically to obtain the final values for Fq, Fqa, and F *A,
These subfactors are shown in Table 3-12. The factor, the coefficientof variation, the standard deviation, and the mean value are tabulated.
Table 3-12Coefficients of Variation
CV No. Description e i CV
1 Flow Area 0.00075 0.17625 0.00426
O's 2 Local Rod Diameter 0.000485 0.420 0.00116
3 Average Rod Diameter 0.000485 0.420 0.00116(Die-drawn, local and averagessme)
4 Local Fuel Loading- 0.00687
Subdensity 0.00647 0 95 0.00681Subfuel area 0.000092 0.1029 0.00089
(Diameter effect)
5 Average Fuel Loading 0.00370Subdensity 0.00324 0 95 0.00341
; Sublength 0.16181 144 0.00112| Subfuel area 0.000092 0.1029 0.00089l (Diameter effect) -
'
6 Local Enrichment 0.00323 2.24 0.00144
7. Average Enrichment 0.00323 2.24 0.00144
CV Coefficient of Variation e/E'
e Standard Deviation of Variablei Mean Value of Variable
. 000001M.
(Enrichment values. are for worst case normal assay batch;j maximum variation occurs for minimum enrichment. )
I,(*
t
i
|
!, 3-35i.i
_ . . _ . _ , - _ _ _ . . _ , . _ _ _ _ _ _ _ _ _ . _ ..__. _. _ _. _ . _ , _ . _ . . . _ _ _ , _ . . _ _ _ . . _ . _ _ _ _
. _ _ _ . -___
|1
4
e. Core Flow Distribution Hot Channel Factors gThe physical arrangement of the reactor vessel internals and nozzles
results in a nonuniform distribution of coolant flow to the variousfuel assemblies. Reactor internal structures above and below theactive core are designed to minimize unfavorable flow distribution.A 1/6 scale model test of the reactor and intemals is being per-formed to demonstrate the adequacy of the internal arrangements. Thefinal variations in flow will be determined when the tests are com-pleted. Interim fsetors for flow distribution e.ffects have been cal-
| culated from test data on reactor vessel models for previous pres-surized water reactor designs.
A flow distribution factor is determined for each fuel assembly loca-i
| tion in the core. The factor is expressed as the ratio of fuel as-
| sembly flow to average fuel assembly flow. The finite values of the| ratio may be greater or less than 1.0 depending upon the position of! the assembly being evaluated. The flow in the central fuel assemblies
| 13 in general larger than the flow in the outermost assemblies due to
| the inherent flow characteristics of the reactor vessel.
|
| The flow distribution factor is related to a particular fuel assemblyi location and the quantity of heat being produced in the assembly. A
flow-to-power comparison is made for all of the fuel assemblies. Theworst condition in the hottest fuel assembly is determined by applyingmodel test isothermal flow distribution data and heat input effects .
,
| at power as outlined in 3 2 3 2.ki. Two assumptions for flow distri- g| bution have been made in the thermal analysis of the core as follows:
(1) For the maximum design condition and for the analysis of the hot-test channe!, all fuel assemblies receive minimum flow for theworst condition, regardless of assembly power or location.
(2) For the most probable design conditions predicted flow factorshave been assigned for each fuel assembly consistent with loca-tion and power. The flow factor assumed for the maximum designcondition is conservative. Application of vessel flow test data
~ and individual assembly flow factors in the detailed core designwill result in improved statistical statements for the maximumdesign condition.
f. Maximum Reactor Design Overpower
Core performance is assessed at the maximum design overpower. Theselection of the design overpower is based on an analysis of the re-actor protertive system as described in Section 7 The reactor trip
point is 107 5 per cent rated power, and the maximum overpower, whichis 114 per cent, will not be exceeded under any conditions.
g. Maximum Design Conditions Analysis Summary
The Statistical Core Design Technique described in 3 2 3 2.2 was used .
to' analyze the reactor at the maximus design conditions describedpreviously. The total number of fuel rods in the core that have a
000001823-36
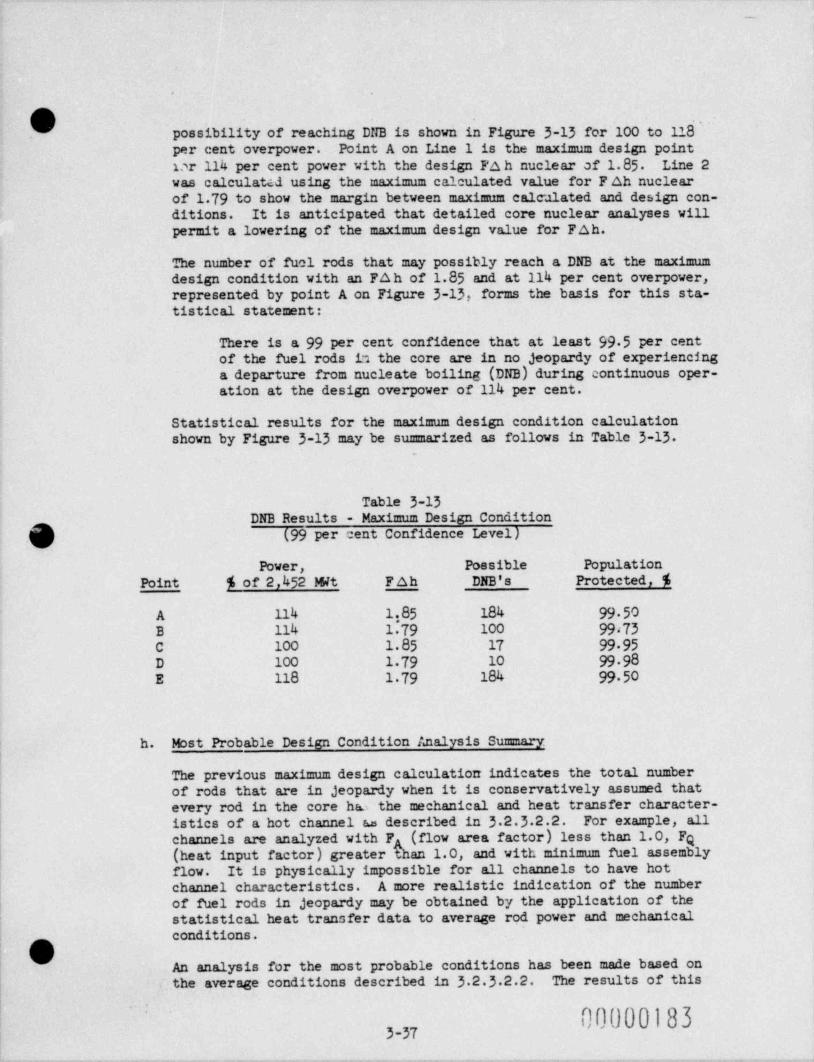
-
.
possibility of reaching DNB is shown in Figure 3-13 for 100 to 118''~
per cent overpower. Point A on Line 1 is the maximum design pointDr 114 per cent power with the design FA h nuclear of 1.85 Line 2was calculated using the maximum calculated value for F Ah nuclearof 179 to show the margin between maximum calculated and design con-ditions. It is anticipated that detailed core nuclear analyses willpermit a lowering of the maximum design value for F Ah.
The number o'f fuel rods that may possibly reach a DNB at the maximumdesign condition with an FAh of 1.85 and at 114 per cent overpower,represented by point A on Figure 3-13, forms the basis for this sta-tistical statement:
There is a 99 per cent confidence that at least 99 5 per centof the fuel rods 12 the core are in no jeopardy of experiencinga departure from nucleate boiling (DNB) during continuous oper-ation at the design overpower of 114 per cent.
Statistical results for the maximum design condition calculationshown by Figure 3-13 may be sumarized as follows in Table 3-13
Table 3-13DNB Results - Maximum Design Condition
(99 per cent Confidence Level)
Power, Poesible Population
Point $ of 2,452 Wt Fah DNB's Protected, %
A 114 1.85 184 99 50B 114 1 79 100 99,73C 100 1.85 17 99 95D 100 1 79 10 99 98E 118 1 79 184 99 50
h. Most Probable Design Condition 1.nalysis Sumary
The previous maximum design calculation indicates the total numberof rods that are in jeopardy when it is conservatively assumed thatevery rod in the core hao the mechanical and heat transfer character-istics of a hot channel as described in 3 2 3 2.2. For example, all
channels are analyzed with FA (flow area factor) less than 1.0, Fq(heat input factor) greater than 1.0, and with minimum fuel assemblyflow. It is physically impossible for all channels to have hotchannel characteristics. A more realistic indication of the numberof fuel rods in jeopardy may be obtained by the application of the
|statistical heat transfer data to average rod power and mechanicalconditions.,
'O:
An analysis for the most probable conditions has been made based on. the average conditions described in 3 2 3 2.2. The results of this
.
I 000001833 37
.. - . . . . _ . - - - .. _ _ . . . - . .- -- -
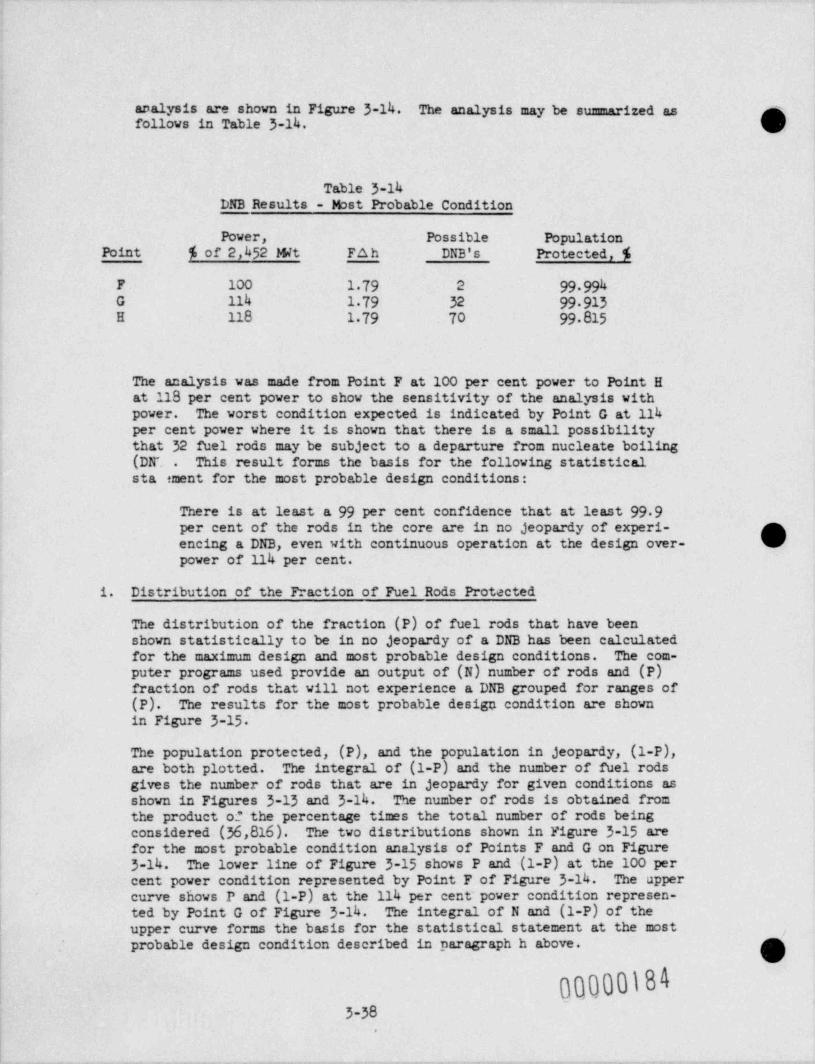
__
1
l
analysis are shown in Figure 3-14. The analysis may be summarized as1follows in Table 3-14.,,
Table 3-14DNB Results - Mast Probable Condition
Power, Possible PopulationPoint % of 2,452 Mit Fah DNB's Protected,%
F 100 1 79 2 99 994G 114 1 79 32 99 913H 118 1 79 70 99 815
The analysis was made from Point F at 100 per cent power to Point Hat 118 per cent power to show the sensitivity of the analysis withpower. The worst condition expected is indicated by Point G at 114per cent power where it is shown that there is a small possibilitythat 32 fuel rods may be subject to a departure from nucleate boiling(DF. . This result forms the basis for the following statisticalsta ement for the most probable design conditions:
There is at least a 99 per cent confidence that at least 99 9per cent of the rods in the core are in no jeopardy of experi-encing a DNB, even with continuous operation at the design over-power of 114 per cent.
1. Distribution of the Fraction of Fuel Rods Protected
The distribution of the fraction (P) of fuel rods that have beensh'own statistically to be in no jeopardy of a DNB has been calculatedfor the maximum design and most probable design conditions. The com-puter programs used provide an output of (N) number of rods and (P)
,fraction of rods that will not experience a DNB grouped for ranges of
| (P). The results for the most probable design condition are shown| in Figure 3-15
! The population protected, (P), and the population in jeopardy, (1-P),' are both plotted. The integral of (1-P) and the number of fuel rods
gives the number of rods that are in jeopardy for given condi.tions asshown in Figures 3-13 and 3-14. The number of rods is obtained fromthe product of the percentage times the total number of rods beingconsidered (36,816). The two distributions shown in Figure 3-15 arefor the most probable condition analysis of Points F and G on Figure3-14. The lower line of Figure 3-15 shows P and (1-P) at the 100 percent power condition represented by Point F of Figure 3-14. The uppercurve shows P and (1-P) at the 114 per cent' power condition represen-
| ted by Point G of Figure 3-14. The integral of N and (1-P) of thei upper curve forms the basis for the statistical statement at the most ,
probable design condition described in para 6raph h above.'
000001843-38
.
. . - , , - . - -
_._
? j. Hot Channel Performance Snmmary-
.
The hottest unit cell with all surfaces heated has been axamined forhot channel factors, DNB ratios, and quality for a range of reactorpowers. The cell has been examined for the maximum value of Fah
nuclear of 1.85 The hot channel was assumed to be located in afuel assembly with 95 per cent of the average fuel assembly flow.The heat generated in the fuel is 07 3 per cent of the-total nuclear' heat. The remaining 2 7 per cent is assumed to be generated in thecoolant as it proceeds up the channel within the core and is reflec-ted as an increase in AT of the coolant.
Error bands of 65 psi operating pressure and i 2 F are reflected in-the total core and hot channel thermal margin calculations in thedirection producing the lowest DNB ratios or highest qualities.
The DNB ratio versus power is shown in Figure 3-16. The DNB ratio inthe hot channel at the maximum overpower of 114 per cent is 138 whichcorresponds to a 99 per cent confidence that at least 94 5 per centof the fuel channels of this type are in no jeopardy of experiencinga DNB. The engineering hot channel factors corresponding to theabove confidence-population relationship are described in 3 2 3 2.2and listed below:
F = 1.008q
F ., = 1.013'
q
F ==0 992A
The hot channel exit quality for various powers is shown in Figure3-17 The combined results may be summarized as follows:
Reactor Power, % DNB Ratio (BAW-168) Exit Quality, %
100 1.60 o107 5 (trip setting) 1.47 2.6114 (maximum power) 1 38 54149 1.00 23 0
i
3 2 3 1.2 Fuel and Cladding Thermal Conditions
000001h,-,
a. Fuel j
A digital computer code is used to calculate the fuel temperatureThe program uses uniform volumetric heat generation across the fuel
l disneter, and external coolant conditions and heat transfer coeffi--
'
( cients determined for thermal-hydraulic channel solutions. The fuelthermal conductivity is varied in a radial direction as a function o.f^ '
the temperature variation. Values for fuel conductivity were used as;
'..;-
| 3-39L
.- _. _. ~ _...__ - . . - _ _ , _ , . _ . _ . - , . - _ . . _ . .t . . . _ . . _ ..
-. - .
shown in Figure 3-18, a plot of fuel conductivity versus te=perature.The heat transfer from the fuel to the clad is calculated with a fuel gand clad expansion model proportional to temperatures. The temper-ature drop is calculated using gas conductivity at the beginninlifeconditionswhenthegasconductivityis0.1 Btu-ft/hr-F-ftg-of-
.
The gas conduction model is used in the calculation until the fuelthermal expansion relative to the clad closes the gap to a dimensionequivalent to a contact coefficient. The contact coefficient is de-pendent upon pressure and gas conductivity.
A plot of fuel center temperature versus linear heat rate in kv/ft isshown in Figure 3-19 for beginning-of-life conditions. The linearheat rate at the maximum overpower of 11h per cent is 19.9 kv/ft.The corresponding center fuel te=perature shown in Table 1-2 is h,h00F. The center and average temperatures at 100 per cent power arek,160 and 1,385 F as shown in Table 3-1.
The peaking factors used in the calculation are
FAh = 1.85
F = 1.70g
F ,, = 1.03q
F .(nue, and mech.) = 3.2hq
.
A conservative value of 1.03 was assu=ed for the heat flux peakingfactor, F ,,. The assigned value corresponds to a 99 per cent con-gfidence and 99.99 per cent population-protected relationship as de-scribed in the statistical technique.
b. Clad
The assumptions in the preceding pa agraph were applied in the calcu-| 1ation of the clad surface temperature at the maximum overpower.| Boiling cond tions pervail at the hot spot, and the Jens and Lottes'
relationship 20) for the coolant-to-clad AT for boiling was used todetermine the clad temperature. The resulting maximum claculated cladtemperature is 65h F at a system operating pressure of 2,185 psig.
1
00000186
43-h0
_
_
O.'
3232 Thermal and Hydraulic Evaluation
3232.1 Introduction
Summsu y results for the characteristics of the reactor design are presented in
3231. The Statistical Core Design Technique employed in the design repre-sents a refinement in the methods for evaluating pressurized water reactors.Corresponding single hot channel DNB data were presented to relate the newmethod with previous criteria. A comprehensive description of the new tech-
l nique is included in this section to permit a rapid evaluation of the methodsused.
The BAW-168 correlation is a B&W design equation. An extensive review of dataavailable in the field was undertaken to derive the correlation and 'to deter-mine the confidence, population, and DNB relationships included in this section.A comparison of the BAW-168 correlation with other correlations in use is alsoincluded.
A detailed evaluation and sensitivity analysis of the design has .been made byexamining the hottest channel in the reactor for DNB ratio, quality, and fueltemperatures. BAW-168 DNB ratios have been compared with W-3 DNB ratios tofacilitate a comparison of the design with PWR reactor core designs previouslyreviewed.
,
I
3 2 3 2.2 Statistical Core Design Technique
The core thermal design is based on t. Statistical Core Design Technique devel-' oped by B&W. The technique offers many substantial improvements over older
methods, particularly in design approach, reliability of the result, and math-I ematical treatment of the calculation. The method reflects the performance of
the entire core in the resultant power rating and provides insight into the
i reliability of the calculation. This section discussee the technique in orderto provide an understanding of its engineering merit,'
The statistical core design technique considers all parameters that affect thesafe and reliable operation of the reactor core. By considering each fuel rodthe method rates the reactor on the basis of thrs yrformance of the entire core.The result then will provide a good measure of t'.e core safety and reliabilitysince the method provides a statistical statement for the total core. Thisstatement also reflects the conservatism or design aargin in the calculation.
| A reactor safe operating power has always been determined by the ability of the| coolant to remove heat from the fuel material. The criterion that best measures
*this ability is the DNB, which involves the individua.1 parameters of heat flux,coolant temperature rise, and flow area, and their intereffects. The DNB cri-terion is commonly applied through the use of the departure from nucleate boil-r
! ing ratio (DNBR). This is the minirun ratio of the DNB heat flux (as computedby the DNB correlation) to the surface heat flux. The ratio is a measure ofI
| the. margin'betiieen the operating power and the power at which a DNB might be| expected to occur in that channel. The DNBR varies over the channel length,
and it is the min 4=nm value of the ratio in the channel of interest that isV used. .
00000187-
3-41- - -- ._ - _. . . . - . - _ _ . _ .
The calculation of DNB heat flux involves the coolant enthalpy rise and coolantflow rate. The coolant enthalpy rise is a function of both the heat input andthe flow rate. It is possible to separate these two effects; the statistical
hot channel factors required are a heat input factor, Fq, and a flow area fac-tor, F . In addition, a statistical heat flux factor, Fq , is required; theaAheat flux factor statistically describes the variation in surface heat flux.The DNBR is most limiting when the burnout heat flux is based on mini == flow
area (small F ) and maximum heat input (large Fq), and when the surface heatAflux is large (large F "). The DNB correlation is provided in a best-fit form,Qi.e., a form that best fits all of the data on which the correlation is based.To afford protection against DNB, the DNB heat flux computed by the best-fitcorrelation is divided by a DNB factor (B.F. ) greater than 1.0 to yield thedesign DNB surface heat flux. The basic relationship
YM 1DNBR = B.F. * A' Q * Q" xFn
surface Q
involves as parameters statistical hot channel and DNB factors. The DNB factor(B.F. ) above is usually assigned a value of unity when reporting DNB ratiosso that the margin at a given condition is shown directly by a DNER greaterthan 1.0, i.e., 1 38 in the hot channel. -
To find the DNB correlation, selected correlations are compared with DNB dataobtained in the B&W burnout loop and with published data. The comparison isfacilitated by preparing histograms of the ratio of the experimentally deter-
mined DNB heat flux ( $E ) to the calculated value of the burnout heat flux g( & ). A typical histogram is shown in Figure 3-20.C
A histogram is obtained for each DNB correlation considered. The histogramsindicate the ability of the correlations to describe the data. They indicate,qualitatively, the dispersion of the data about the mean value--the smallerthe dispersion, the better the correlation. Since thermal and hydraulic datagenerally are well represented with a Gaussian (normal) distribution (Figure3-20), mathematical parameters that quantitatively rate the correlation can be
,
( casily obtained for the histogram. These same mathematical parameters are thei basis for the statistical burnout factor (B.F. ).1
( In analyzing a reactor core, the statistical information required to describethe hot channel subfactors may be obtained from data on the as-built core,from data on similar cores that have been constructed, or from the specified;
| tolerances for the proposed core. Regardless of the source of data, the sub-i factors can be shown graphically (Figures 3-21 and 3-22).
All the plots have the same characteristic shape whether they are for subfactors,hot channel factors, or turnout factor. The factor increases with either in-creasing population or confidence. The value used for the statistical hot chan-nel and burnout factor is a function of the percentage of confidence desiredin the result, and the portion of all possibilities desired, as well as theamount of data used in determining the statistical factor. A frequently usedassumption in statistical analyses is that the data available represent aninfinite sample of that data. The implications of this assumption should be -
noted. For instance, if limited data are available, such an assumption leads g
00000188,_,
_
!DU' to a somewhat opt'imistic result.' The assumption also 'impl'ies that more
information exists for a given sample than is . indicated by the data; itimplies 100 per cent confidence in the end result. The PE4 calculationa'.procedure does not make this assu=ption, but rather uses the specifiedsample size to yield a result that is much more meanin6ful and statisti-cally rigorous. The influence of the amount of data for instance can beillustrated easily as follows : Consider the heat flux factor which hasthe form
F,=1tKaq p ,,
where F i, is the statistical hot channel factor for heatqflux
K is a statistical multiplying factor
ep ,, is the standard deviation of the heat flux fac-tor, including the effects of all the subfactors
If 7 p ., = 0.05 for 300 data points, then a K factor of 2.608 is re-gi quired to protect 99 per cent of the population. 'The value of the hot
channel factor then is.
F ,, = 1t (2.608 x 0.050) = 1.1304q
and vill provide 99 per cent ec.nfidence for the calculation. If, in-stead of using the-300 data points, it is assumed that the data repre-sent an infinite sa=ple, then the K factor for 99 per cent of the popu-
lation is 2 326. The value of the hot channel factor in this case is|
F,=1t (2 326 x 0.050) = 1.1163q!
which implies 100 per cent confidence in the cale at en. The values| of the K factor used above are taken from SCR-607, 21 The same basic
techniques can be used to handle any situation involving variable confi-dence, population, and number of points.
Having established statistical hot channel factors and statistical DIOfactors, we can proceed with the calculation in the classical manner.The statistical factors are used to determine the minimum fraction ofrods protected, or that are in no jeopardy of experiencing a DNB at eachnuclear power peakin6 factor. Since this fraction is known, the maxi-mum fraction in jeopardy is also known. It should be recognized thatevery rod in the core has an associative DIG ratio that is substantiallygreater than 1.0, even at the design overpower, and that theoreticallyno rod can have a statistical population factor of 100 per cent, no cat-ter how large its DIG ratio.
Since both the fraction of rods in jeopardy at any particular nuclear
( ') power peaking factor and the number of rods operating at that peakingf._
'
factor are known, the total number of rods in jeopardy in the whole core
3-u3 00000189
- - .
. - - . - -.
can be obtained by simple summation. Se calculation is made as a function ofpower, and the plot of rods in jeopardy versus reactor overpower is obtained g(Figure 3-23). The summation of the fraction of rods in jeopardy at each peak-ing factor summed over all peaking factors can be made in a statistically rig-orous manner only if the confidence for all populations is identical. If aninfinite sample is not assumed, the confidence varies with population. Toform this summation then, a conservative assumption is required. B&W's totalcore model assumes that the confidence for all rods is equal to that for theleast-protected rod, i.e., the minimum possible confidence factor is associatedwith the entire calculation.
The result of the foregoing technique, based on the maximum design conditions(114 per cent power), is this statistical statement:
2 ere is at least a 99 per cent confidence that at least 99 5 percent of the rods in the core are in no jeopardy of experiencing aDNB, even with continuous operation at the design overpower.
Se maximum design conditions are represented by these assumptions:
The maximum design values of FAh (nuclear max / avg total fuel roda.heat input) are obtained by increasing the maximum calculated valueof F Ah by a factor of 1.033 to provide additional design margin.
b. The maximum value for Fz (nuclear max / avg axial fuel rod heat input)is determined for the limiting transient or steady state condition.
c. Every coolant channel in the core is assumed to have less than the
nominal flow area represented by engineering hot channel area factors,F , less than 1.0.A
d. Every channel is assumed to receive the minimum flow associated withcore flow maldistribution.
e. Every fuel rod in the core is assumed to have a heat input greaterthan the maximum calculated value. This value is represented byengineering hot channel heat input factors, Fq and Fqn, which aregreater than 1.0.
f. Every channel and associated fuel rod has a heat transfer marginabove the experimental best-fit limits reflected in DNB ratiosgreater than 1.0 at maximum overpower conditions.
The statistical core design technique may also be used in a similar manner toevaluate the entire core at the most probable mechanical and nuclear conditionsto give an indication of the most probable degree of fuel element jeopardy. Theresult of the technique based on the most probable design conditions leads to astatistical statement which is a corollary to the maximum design statement:
00000l90 ,
O50 h bl
3-%
r u - =*-w p w ' -- W
_
~
There is at least a 99 per cent confidence that at least 99 9'per~
' cent of the rods in the core arc in no jeopardy of experienciraa DNB, even with continuous operation at the design overpower.
The most probable design conditions are assumed to be the same as themaximum design conditions with these exceptions:
a. Every coolant channel is assumed to have the nominal flow
area (F = 1.0).A
b. Every fuel rod is assumed to have (1) the maximum. calculatedvalue of heat input, and (2) Fq and Fqa are assigned valuesof 1.0.
c. The flow in each coolant channel is based on core flow andpower distributions.
d. Every fuel red is assumed to have a nominal value for FA hnuclear.
The full meaning of the maximum and most probable design statements re-quires additional co= cent. As to the 0 5 per cent or 0.1 per cent ofthe rods not included in the statements, statistically, it can be saidthat no more than 0 5 per cent or 0.1 per cent of the rods vill be injeopardy, and that in general the number in jeopardy vill be fever than
O 0 5 per cent or 0.1 per cent. The statements do not mean to specify aV given number of DNB's, but only acknowledge the possibility that a given
nu=ber could occur for the conditions assumed.
In summary, the calculational procedure outlined here represents a sub-stantially improved design technique in two ways:
a. It reflects the performance and safety of the entire core inthe resultant power rating by considering the effect of eachrod on the power rating,
b. It provides infor=ation on the reliability of the calculationand, therefore, the core through the statistical statement.
32323 Correlation of Heat Transfer Data
The BAW-168 report (Ref. 18) serves as a reference for the "best-fit"fom of the design relationship used by B&W. This heat transfer corre-lation has been found to be the most satisfactory in the representationof both uniform and nonuniform heat flux test data. The BAW-168 correla-tion is used by comparing the integrated average heat flux along a fuelrod to a DNB heat flux limit predicted by the correlation. For uniformheat flux the integrated average heat flux is equal to the local heatflux. The comparison is carried out over the entire channel length.The point at which the ratio,of.the DNB heat flux to the integrated
,
average heat flux is a mint::um ist selected as the DNB point, and thatvalue of the ratio at that" point is the DNB ratio (DNBR) for that chan-
U nel.
.
00000191g,-. _ - . . .. .-. .-
_ _ _
.
This particular discussion deals with the comparison of DNB data to gthree particular correlations. The Tccorrelation in the case of BAW-168,(e trelations selected were the B&W1 ) a cor gtion with which theindustry is familiar in the case of WAPD-188, eci and a correlation re-cently proposed forthe case of W-3.s23)use in the design of pressurized water reactors in
The data considered for the purpose of these comparisons were takenfrom the following sources:
a. WAPD-188 (Ref. 22).
b. AEEW-R213 (Ref. 24).
Columbia University Data (Ref. 25, 26, and 27).c.
d. Argonne National Laboratory Data, ANL (Ref. 28).
The Babcock & Wilcox Company Data, B&W (Ref. 29).e.
f. The Babcock & Wilcox Cc=pany Euratom Data (Ref. 30).
The co=parison of data to the BAW-168 correlation is presented as histo-grams of the ratio of the experimental DNB heat flux ($ ) to the calcu-Elated heat flux (4C). The data from each source were Brouped by pres-sure and analyzed as a 6roup; batches were then prepared including com-con pressure groups from all sources. Altogether there are 41 different &data Broups and batches considered. Histograms for only the BAW-168 Wcorrelation are presented to minimize the graphical material. 'Ihe in-fomation required for the generation of histogra=s of the other twocorrelations was also prepared.
The co=parison of the various correlations to each other is facilitatedthrou6h the use of tabulations of pertinent statistical parameters. Thestandard deviation and mean value were obtained from the computed valuesof ($ /? ) for each group or batch. A comparison of standard deviations| E C
'
is somewhat indicative of the ability of the correlation to representthe data.
! However, differences in mean values from group to group and correlationto correlation tend to complicate this type co=parison. A relativelysimple method may be used to compare the correlations for various data;
! this method uses the coefficient.cf variation (Ref. 31) which is thel
ratio of the standard deviation (e) to the mean Y. The coefficient ofvariation may be thought of as the standard deviation given in per cent;it essentially nomalizes the various standard deviations to a ec= monmean value of 1.0.
['
Table 3-15 is a tabulation of the data source, heat flux type, and cor-responding histogram nu=bers. The histo 6ra=s are shown on Figures 3-24through 3-39
Y00000192
3-k6
- -
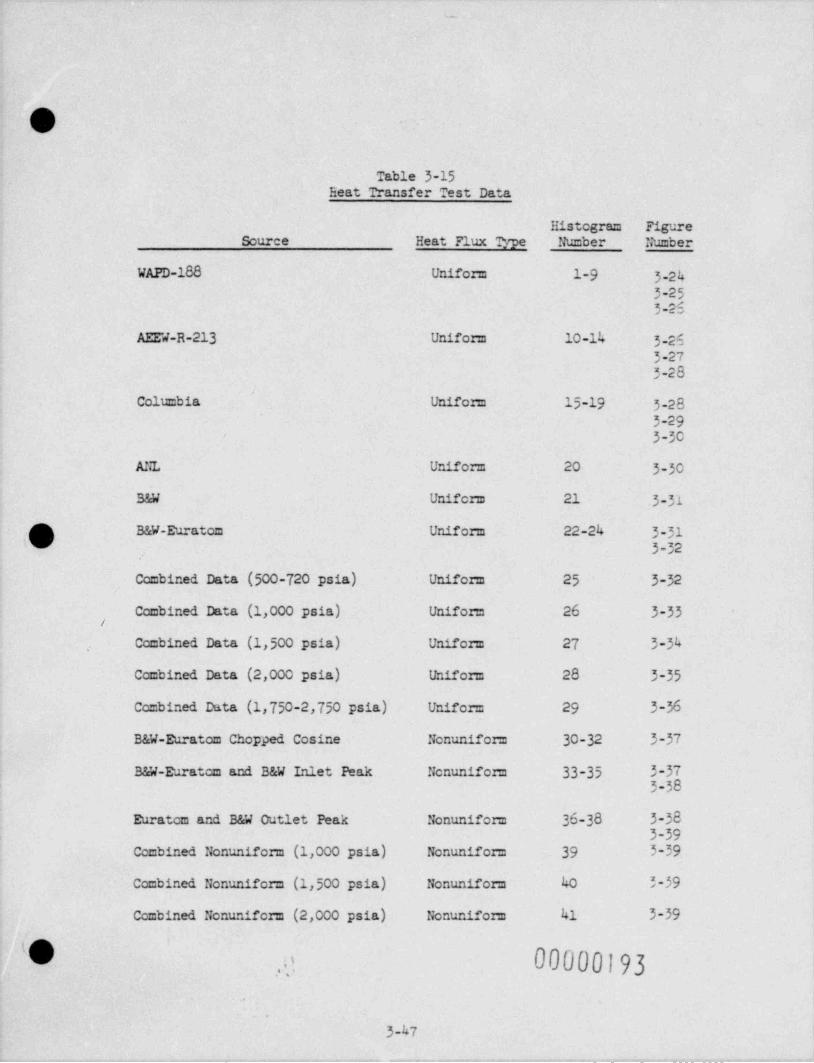
. __ - .
_ i
I
|
. (3~ *Q'
Table 3-15Heat Transfer Test Data'
Histogram FigureSource Heat Flux Type Number Number
WAPD-188 Unifom 1-9 3-243-253-25
AEEW-R-213 Unifom 10-14 3-263-273-28
Columbia Unifom 15-19 3-283-293-30'
ANL Unifom 20 3-30
B&W Unifo m 21 3-31
k[ B&W-Euratom Unifom 22-24 3-313-32
Combined Data (500-720 psia) Unifom 25 > 3-32,
Combined Data (1,000 psia) Unifom 26 3-33
Combined Data (1,500 psia) Unifo m 27 3-34,
Combined Data (2,000 psia) Unifom 28 3-35
Combined Data (1,750-2,750 psia) Unifor= 29 3-36
B&W-Euratom Chopped Cosine Nonuniform 30-32 3-37
B&W-Euratom and B&W Inlet Peak Nonunifom 33-35 3-373-38
Euratom and B&W Outlet Peak Nonunifom 36-38 3-383-39
Combined Nonunifom (1,000 psia) Nonunifo m 39 3-39
Combined Nonunifom (1,500 psia) Nonunifom 40 3-59
Combined Nonunifom (2,000 psia) Nonunifo m 41 3-39
D 00000193'
g.
.
e O
, 3 47
. . . . _ . _ .., _ . _ . _ . _ . _ . _ , _ . _ _ - . . . _ . . _ . ~ _ - . - . _ _ _ _ _ . _ _ _ _
.- , .
1
The histograms graphically demonstrate the distribution of ($ ) for geach data group. The Gaussian type distribution of ($ /@C) a ou theEmean for the group is apparent in the large data grour,. Some datagroups are too amall to provide meaningful histograms, but they are pre-sented in order to complete this survey.
The data were used as presented in the source for the calculation of
($ /@C); n p ints were discarded for any reason. A good correlationEshould be capable of representing DNB data for a full range of all per-tinent parameters. The result of the comparison on this basis is dem-
onstrated in Table 3-15 The data source, pressure, histogram figurenu=ber, heat flux type, and number of data points in the group are tab-ulated. For each of the three correlations the following data are indi-cated:
e/i The coefficient of variation based on all available data inthe group.
nR The number of data points rejected using Chauvenet's crite-rion (Ref. 31). This criterion is statistical in nature andis applied to the values of ($ /@C .E ap n s @at falloutside certain limits with respect to the main body of dataare rejected.
(e/5)' The coefficient of variation based on the original data sam-ple less those points rejected by Chauvenet's criterion,i.e., based on n-ng values of ($ /@C)* h,E
It is unfortunate that Chauvenet's criterion must be applied to thevalues of ($ /@C) rather than to the original data, since applicationEto ($ /@C) leads to the rejection of points for either of two reasons:E
a. Bad data points,
b. Inability of the correlation to represent a particular data! point.
It is not desirable to reject points for the second reason, and yet onemight expect to encounter so=e bad data. The logical choice then f.s topresent data both ways, i.e., with art. without Chauvenet's criterion ap-plied. Of the 41 groups and batches analyzed the following is observedfrom Table 3-15:
| Groups and Batches of Data Groups and Batches of Data
With Smallest er/i Without With Smallest e/5 WithCorrelation Chauvenet's Criterion Chauvenet's criterion
,
l
| BAW-168 38 36WAPD-188 2 3
00b00194 0
3-48
!_ _ _
_
Chauvenet's criterion rejected the following number of points for eachcorrelation:
Uniform Nonunifom Total
BAW-168 (Groups only) 32 1 33BAW-168 (Batches Oniv) 39 0 39WAPD-188 (Groups only) 34 2 36WAPD-188 (Batches only) 33 o 33W-3 (Groups only) 59 12 71,
W-3 (Batches only) 50 9 59
Several no able peculiarities exist in the tabulation of Table 3-16.
The Columbia data 500 psia group contained only five data points; fourwere rejected by Chauvenet's criterion, leaving one point. A standarddeviation cannot be computed for one point; therefore all three values
of (e/T )' are shown as not available (N.A.). Neither the BAW-168 northe WAPD-188 predicted any negative DNB heat fluxes; the W-3 predicted93 negative values for unifom data. The fact that only 59 were re-jected for this correlation indicates that the remaining 34 uniformpoints which were negative (93-59'= 34) were close enough to the bodyof the data to be considered statistically significant. Table 3-16may be consolidated somewhat as below by 'abulating the number of groups'"' " '*"'" ' " ' " '''"" " "'''***"'' ' ''''''' " "''"'" ' ""*"'''''C) interval for each correlation.
(e/I)Interval BAW-168 BAW-168:(a) WAPD-188 WAPD-188'(a) w.3 w 3e(a)
_
Negative o o o o 2 oo-o.1 6 8 o o o 10.1-0.2 24 24 13 13 1 50.2-0 3 8 8 7 8 3 10 3-0.4 1 0 3 4 1 20.4-o.5 1 0 5 7 5 60 5-o.6 o o 6 5 3 4o.6-o.7 o o 3 2 1 1o.7-o.8 o o 2 1 7 8o.8-o.9 1 o 0. 0 1 50 9-1.o o o o o 1 oGreater
than 1.0 o o 2 0 16 7
Total 41 40 41 40 41 40
('}Chauvenet's criterion applied.
(*fh00000195
i' .) , 5-49.
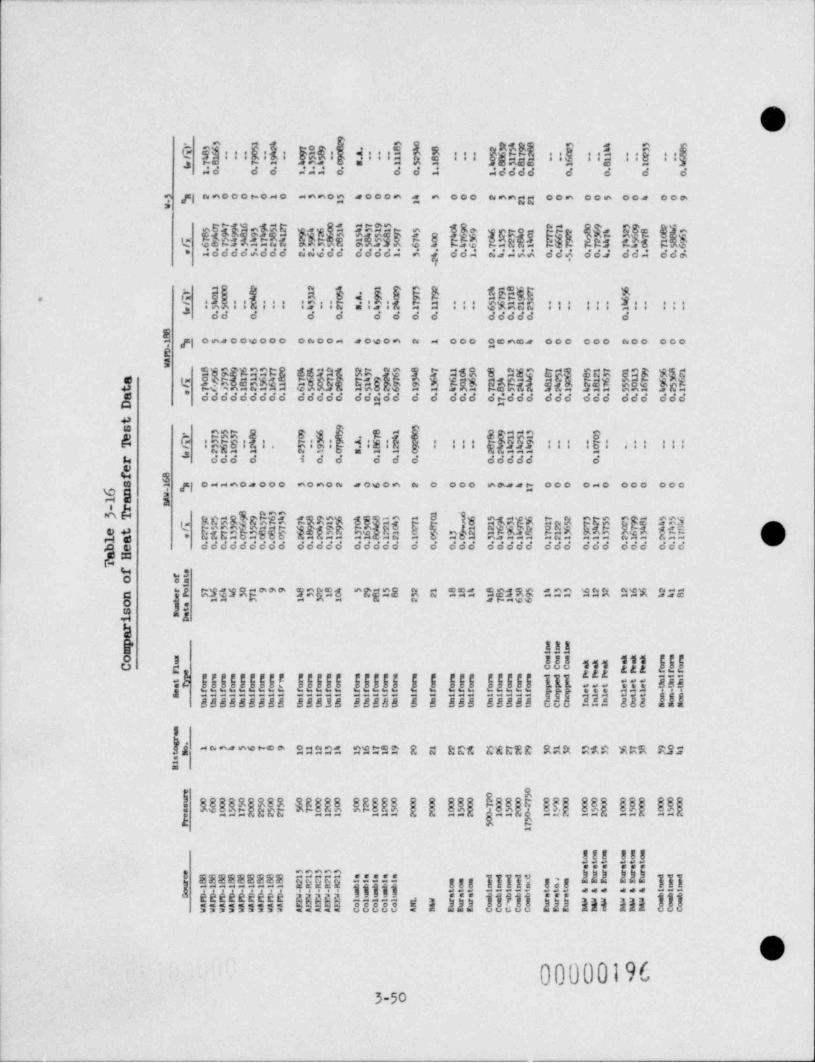
_. .
0;o
i tii:il:!:1!:1i::iiie:::fi!!!::1ti!::i::fAd & 4 AAA & d d A Addda a d 6 6
7 f|nnooowo-o -anog sooon g n ooo anngg oon com oo, com
k E, $ E" " ",
* AddddAddd adido ddddA A ddA ddAAA ddA dd2 dda ddi
M :h|::.::: :;r:nd:,k:fkb EEhkk :::E $4 *a : : : swasc ::: E:: : : :
. - ce -# && a d d & 6 6 6 ddddd a
3 fgonsoowooo onoo- noeon = - ooo oene, ooo ooo moo ooo&E
ggEk*g0tg (g22h mm *l 0 3 ERE ESEsl" 9E IEE REw $$*Ec!R 7 c8R 8 28 B~E ck gag*
ce EcBan cRR5 Enfi3 e*y ddddddddd ddddd difdd d 6 ddd afddd did did ddd dds
t -
|R"9 :g : . R:y: .e- a n~=can e -=0 k : :: 16: : : : : : :' 1:E !I : : : : W" .2fSnWs A =m- m - 2 --- -3% ddd d i d & & 6 4 ddddd 6
$M p|o--nosooo nonom eowon m o ooo em44g ooo o-o ooo ooo
M = 2
E U
RCa$Qkk"IROI${|~{da M E* SRy *Elsl%a no-a "gEaa EE* *%-
^
E R R x.elL,
L.- 886 E-KR am EE&n--xoo - ,aR- S. a c--- -n- ---g g - -- -u - -
p v ddddddddd ddddd ddddd 6 a ddd 46666 ddd ddd add addh
% .
O ojR$$$R"*** TRgSs *R 08 a c SS' SesRR % 0 %2n 2%% 2;g
3' Ee E E a ""a**"" ~ ~o2 ~.a
&+I& I!!
25 s.i s s i.s.s i e s i n g s a.s s.s i a i s.i a i.n.s i.s 1, i.f.f. !!! !!!o ! 838 555
::: B. a. i.r.. . --, 188888888 88838 88888 i i lii ninie c 288 EEE &&&
s
ki da^"***** 2220% 0$3SR 2 202 CARER RXR A" A %RR RS; aI
8A b$$$$6|[en $$$$$ EEEEE | | $$k EEk Elk $$| $$| $$|, g g ----- --- --- -- -- -- -
S. R. R. R. R. R.8EE 088 Illb $$$$$$$$$ hhhhh ##### sus --- jE58 llll 8J8
11111A 444466666 $$$$ 88888 ! R 222 $$$3! 222 111 111 333sus --- -- ---
$sussssss
000000196
3-50
_
As is seen from the tabulation the column for.BAW-168 with Chauvenet'scriterior spplied indicates a grouping of 0.1 to 0.2, and a maximum
value of 0.28780 is noted from Table 3-16. For WAPD-188 the spread isgreater with a maximum value of 0 74018. For W-3 the spread is stillgreater, and a maximum value of 1 7483 is noted. The negative valuesof DNB heat flux predicted by the W-3 correlation are in part respon-sible for the large spread in (e/ T).
The ability of the BAW-168 correlation to fit both unifom and nonuni-form heat flux data over a vide range of pertinent variables leads usto believe that it is the best DNB correlation available.
3 2 3 2.4 Evaluation of the Thermal and }{ydraulic Design
a. Hot Channel Coolant Quality and Void Fraction
An evaluation of the hot channel coolant conditions providesadditional confidence in the themal design. Sufficientcoolant flow has been provided to insure low quality and voidfractions. The quality in the hot channel versus reactorpower is shown in Figure 3 40 The sensitivity of channeloutlet quality with pressure and power level is shown by the2,185 and 2,120 psig system pressure conditions examined.These calculations were made for an FA h of 1.85 Additionalcalculations for a 10 per cent increase in FA h to 2.035 were
| p made at 114 per cent power. The significant results of bothj Q calcula ions are summarized in Table 3-17 The effects of
Iusing at Fah of 179 are shown in Fig'tre 3-40
Table 3-17Hot Channel.Cociant Conditions
Exit Exit Void OperatingPcuer, % Fah gality,% Fraction, % Pressure, psig
100 1.85 (-)2.4(D) 0 5(a) 2,185| 114 1.85 2.8 13 5 2,185
130 1.85 9.4 36 9 2,185114 2.035 8.7
35 0(a)2,185
100 1.85 0 38 2,120114 1.85 5.4 25 2 2,120130 1.85 1r.1 45 2 2,120114 2.035 11.' 43 4 2,120
|
(")Subcooled volds.( (b) Negative indication of quality denotes subcooling| of 10.2 Btu /lb.|
! O 00000197
3-51'
. _ . _ _ _ - -_ _ , _ . _.
- _
The conditions of Table 3-17 vere determined with all of the hothchannel factors applied. Additional calculations were made for
unit cell channels without engineering hot channel factors to showthe coolant conditions more likely to occur in the reactor core.
Values for Fah of 1 79 and 1.85 were examined with and withoutfuel assembly flow distribution hot channel factors at 2,185 psigas shown on Figure 3-41. These results show that the exit qual-ities from the hottest cells should in general be considerablylower than the maximum design conditions.
b. Core Void Fraction
The core void fractions were calculated at 100 per cent power forthe normal operating pressure of 2,185 psig and for the minimumoperating pressure of 2,120 psig. The influence of core fuel as-sembly flow distribution was checked by determining the total voidsfor both 100 and 95 per cent total core flow for the two pressureconditions.
The results are as follows:
Flov, % Pressure, psig Core Void Fraction, %
100 2,185 0.007100 2,120 0.033
95 2,185 0.04195 2,120 0.127
The most conservative condition of 95 per cent flow at 2,120 psigresults in no more than 0.13 per cent void volume in the core.Conservative maximum design values for FAh nuclear described byLine A of Figure 3-12 were used to make the calculation.
The void program uses a combination of Bowring's (33) model withZuber's (3k) correlation between void fraction and quality. TheBovring model considers three different regions of forced convec-tion boiling. They are:
(1) Highly Subcooled Boiling
In this region the bubbles adhere to the vall while moving up-vard through the channel. This region is terminated when thesubcooling decreases to a point where the bubbles breakthrough the laminar sublayer and depart from the surface. Thehighly subcooled region starts when the surface temperature ofthe fuel reaches the surface temperature predicted by the Jensand Icttes equation. 'lhe highly subcooled region ends when
sat bulk = n6 (A)-TV
00000198 9.
3-52
sf^
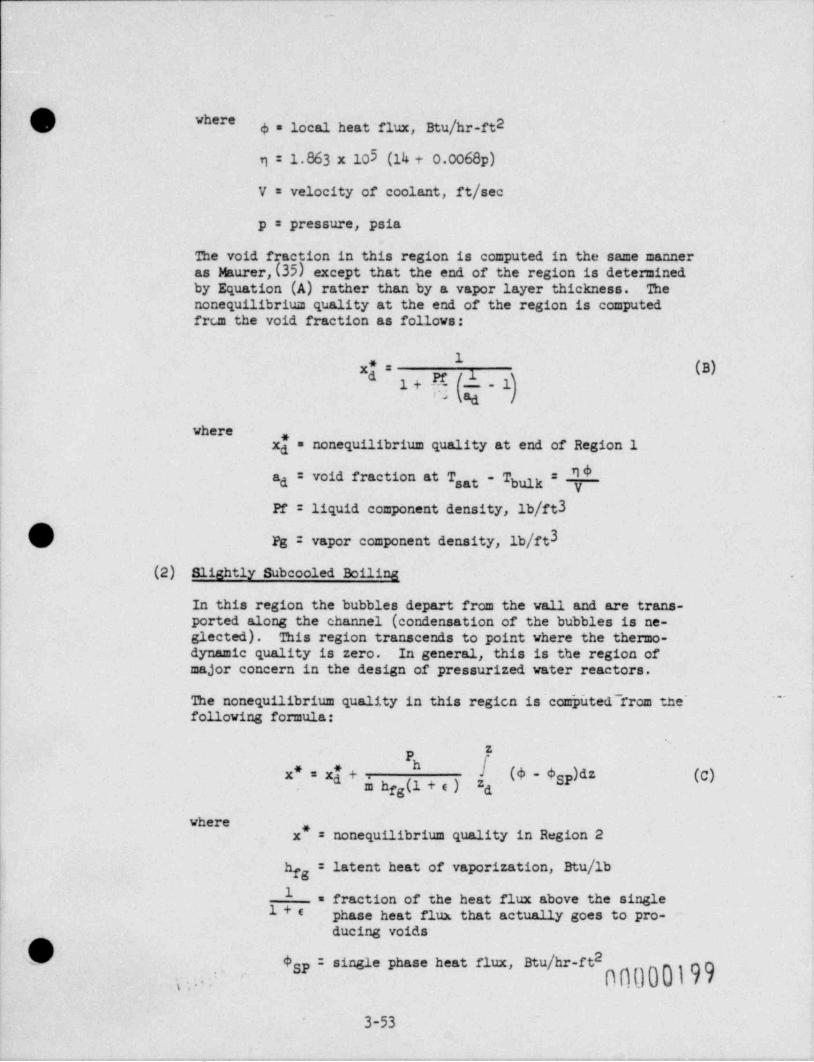
_
O ' r- &.1calheatf1ux, Btu /hrf12
y = 1.863 x 10⁵ (14 + o.co68p)
V=velocityof" coolant,ft/sec
p = pressure, psia
2e void fraction in this region is computed in the same manneras Maurer,(35) except that the end of the region is determinedby Equation (A) rather than by a vapor layer thickness. Thenonequilibrium quality at the end of the region is computedfrcm the void fraction as follows:
1(B)x{= , pf 1
lt 1'
h adwhere ,
xd = nonequilibrium quality at end of Region 1
ad : void fraction at Tsat - Tbdk*
| Pf : liquidcomponentdensity,lb/ft3L A| V Pg c vaporcomponentdensity,1b/ft3
(2) Slightly Subcooled Boiling .
In this region the bubbles depart from the vall and are trans-ported along the channel (condensation of the bubbles is ne-glected). Bis region transcends to point where the thermo-dynamic quality is zero. In general, this is the region ofmajor concern in the design of pressurized water reactors,
l The nonequilibrium quality in this regica is conipUted from the' ~~ -
| following formula:i
*P
x*=xj+m. ! (& - &gp)dz (C)hfg(1 + e ) dZ
* = nonequilibrium quality in Region 2x,
l
fg=latentheatofvaporization, Btu /lb! h
| 1 = fraction of the heat flux above the single1+e phase heat flux that actually goes to pro-
' ducing voids
.[% - &gp
.
singlephaseheatflux, Btu /hr-ft2c
, . . c. ' n0000199-.
3-53
- . . __. - _ _ . - .-- -. . -- - - , . . . . . - - .
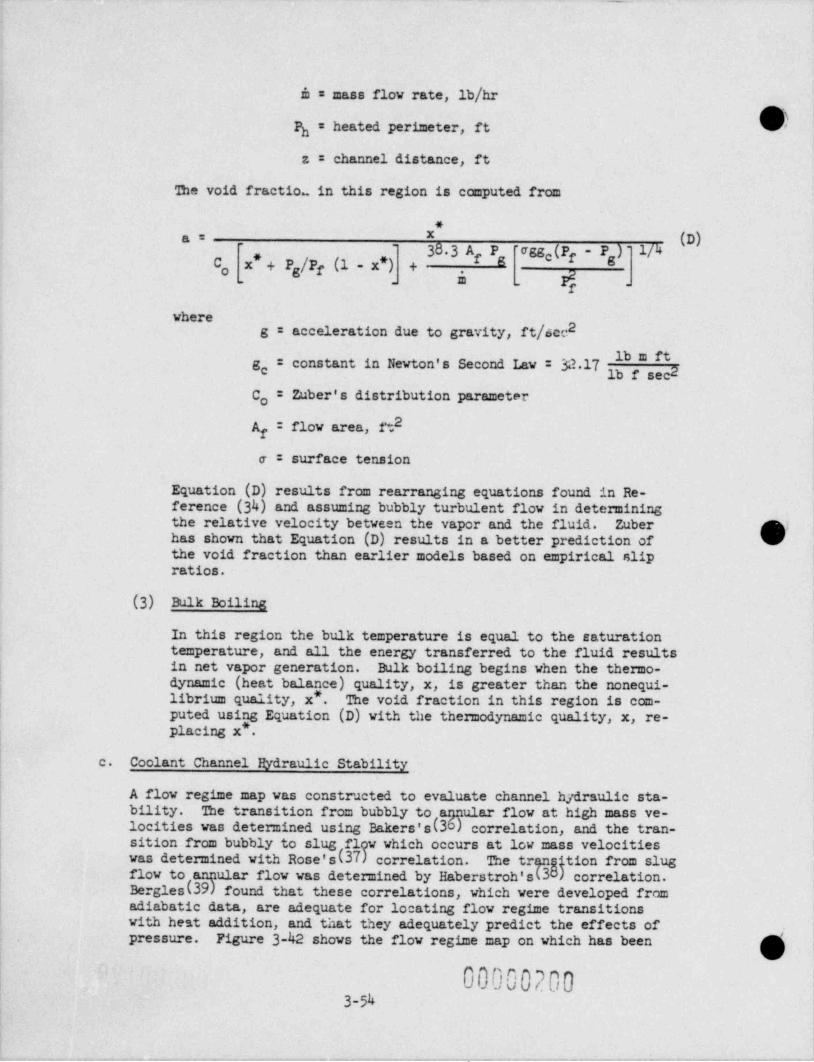
_
b = mass flow rate, lb/hr
O'Ph = heated perimeter, ft
z: channel distance, ft
2e void fraction in this region is computed from
*X
(D)a=-
38 3 A P 'agge(P - P )" 1/4', f g f g+ P /Pf (1 - x*)C x +go ,
. . m . f .
Whereg: accelerationduetogravity,ft/sce2
"g constant in Newton's Second Law : 32.17:e 2
Zuber's distribution parameterC :o
2A : flow area, ftf
e: surface tension
Equation (D) results from rearranging equations found in Re-ference (34) and assuming bubbly turbulent flov in determiningthe relative velocity between the vapor and the fluid. Zuber 31has shown that Equation (D) results in a better prediction of Wthe void fraction than earlier models based on empirical slipratios.
(3) Bulk Boiling
In this region the bulk temperature is equal to the saturationtemperature, and all the energy transferred to the fluid resultsin net vapor generation. Bulk boiling begins when the thermo-
,
dynamic (heat balance) quality, x, is greater than the nonequi-'
librium quality, x*. The void fraction in this region is com-
placing x*g Equation (D) with the themodynamic quality, x, re-puted usin
.
!
c. Coolant Channel Hydraulic Stability|
| A flow regime map was constructed to evaluate channel h;/draulic sta-| bility. Se transition from bubbly to ar3nular flow at high mass ve-
locities was determined using Bakers's(3b> correlation, and the tran-sition from bubbly to slug!was determined with Rose's(flgv which occurs at low mass velocities37/ correlation. The tr9nflowto(angularflowwasdeterminedbyHaberstroh'sug4tionfromslug> correlation.Bergles 39) found that these correlations, which were developed from|
| adiabatic data, are adequate for locating flow regime transitionsI with heat addition, and that they adequately predict the effects of
pressure. Figure 3-42 shows the flow regime map on which has been
i 000002003-54
. __ .-. . _ - . . _ .-- .
plotted a point representing operating conditions in the hot channel-
at 114 per cent overpower. To aid in assessing the conservatism ofthe design, an additional point is plotted at 130 per cent overpower.Inspection shows that both pointo lie well within the bubbly flowregime. Since the bubbly flow regime is hydraulically stable, noflow instabilities should occur. This flow regime map was preparedfor the hot unit cell at the me.ximum design condition characteristicsoutlined in 3 2 3 1.1.
The confidence in the design is based on both experimental resultsobtained in multiple rod bundle burnout tests and analytical evalua-tions. Three additional flow regime maps were constructed for nom-inal and postulated worst case conditions to show t'e sensitivity ofthe analysis with respect to mass flow rate, channei dimensions andmixing intensity in unit, corner, and wall-type cells. The resultoare shown in Figures 3-43, 3-44, and 3-45 The mass velocity andquality in each type of channel for the two cases are plotted on *,t.e.
figures. The conditions assumed for the nominal and postulated erstcase are given in 3 2 3 2.4 J.
Data from the burnout tests performed by B&W on a 9-rod bundle simu-lating the core geometry are also plotted on the maps. The open datapoints on the maps represent the exit conditions in the various typechannels just previous to the burnout condition for a representativesample of the data points obtained at the design operating pressureof 2,200 psia. In all of the bundle tests the pressure drop, flowrate, and rod temperature traces were steady and did not exhibit anyof the characteristics associated with flow instability.
Inspection of these maps shows that the nominal conditions are farremoved from unstable flow regimes. The evaluation also shows thatunder the worst conditions that have been postulated the reactor willbe operating in the hydrodynamically stable, bubbly flow regime.
d. Hot Channel DNB Comparisons
DNB ratios for the hottest channel have been determined for the BAW-168 and W-3 correlations. The results are shown it. Figure 3-46. DNB
ratios for both correlations are shown for the 1 50 axial max /avssymmetrical cosine flux shape from 100 to 150 per cent power. meBAW-168 DNB ratio at the maximum design power of 114 per cent is 1 38;the corresponding W-3 value is 1 72. This compares with the suggestedW-3 design value of 1 3 It is interesting to note that the calculatedDNB ratio reaches a value of 1.0 at about 150 per cent power with theBAW-168 equation which adequately describes DNB at the high qualitycondition of 20 per cent. The W-3 calculation is accurate to about130 per cent power, but because of quality limitations it cannot beused to examine the channel at the 150 per cent power condition.
The sensitivity of DNB ratio with F Ah and Fz nuclear was examinedfrom 100 to 114 per cent power. De detailed results are labeled inFigure 3-46. A cosine flux shape with an Fz of 1.80 and an FAh of1.85 results in a W-3 DNB ratio of 1.45 and a BAW-168 ratio of 1 33The W-3 value is well above suggested design values, and the BAW-168
000002013-55
. . . - , - - .- . _ . - - -
l
Ii
value of 1 33 corresponds to a hot channel confidence of 99 per centg ''that about 93 per cent of the population is in no Jeopardy as shown
in the Population-DIB ratio plot in 3 2 3 2.2, statistical core De-sign Technique.
The influence of a change in F Ah was determined by analyzing the hotchannel for an FAh of 2.035 This value is 14 per cent above themaximum calculated value of 1 79 and 10 per cent above the maximumdesign value of 1.85 'lhe resulting BAW-168 DNB ratio is 1.22 andthe W-3 value is 1.26. Both of these values are well above the cor-relation best-fit values of 1.0 for the severe conditions assumed.
e. Reactor Flov Effects
Another significant variable to be considered in the evaluation of
the design is the total system flow. Conservative values for systemand reactor pressure drop have been detemined to insure that therequired system flow is obtained in the as-built plant. The experi-mental programs previously outlined in Section 1 vill confirm thepressure drop and related pump head requirements. It is anticipatedthat the as-built reactor flow will exceed tne design value and villlead to increased power capability.
An evaluation of reactor core flow and power capability was made bydetermining the maximum steady state power rating versus flow. Theanalysis was made by evaluating the hot channel at the overpower con-ditions while maintaining (a) a DNB ratio of 138 (BAW-168), and (b)the statistical core design criteria. The results of the analysis hare shown in Figure 3-47 The power shown is the 100 per cent rating,and the limiting condition is 114 per cent of the rated power. Anexamination of the slope of the curve indicates stable characteristics,and a 1 per cent change in flow changes the power capability by onlyabout 1/2 per cent.
f. Reactor Inlet Temperature Effects
The influence of reactor inlet temperature on power capability at agiven flow was evaluated in a similar manner. A variation of 1 F inreactor inlet temperature vill 2 esult in a power capability change ofslightly less than 1/2 per cent
g. Fuel Temperature
A fuel temperature and gas pressure computer code was developed tocalculate fuel temperatures, expansion, densification, equiaxed andcolumnnr grain growth, center piping of fuel pellets, fission gasrelease, and fission gas pressure. Program and data comparisons weremade on the basis of the fraction of the fuel diameter within thesestructural regions:
(1) Outer limit of equisxed grain growth - 2,700 F.
(2) Outer limit of columnnr grain growth - 3,200 F.
(3) Outer limit of molten fuel (UO ) -5,000F.g2
3-56
._ _
_
$ . Data from References 40 through 43 were used to compare calculatedana experimental fractions of the rod in grain growth and centralmelting.
The radial expansion of the fuel pellet is computed from the meanfuel temperature and the average coefficient of linear expansion forthe fuel over the temperature range considered This model combinedwith the model for calculating the heat tranaf cefficient was ccm-pared with the model developed by Notley et al of A3CL. The dif-ference in fuel growth for the two calculation models was less thanthe experimental scattei -f data.
Se fuel may be divided into as many as 30 radial and 70 axial in-crements for the analysis. An iterative solution for the temperaturedistribution is obtained, and the thermal conductivity of the fuel isinput as a function of temperature. Se relative thermal expansionof the fuel and cladding is taken into account when determining thetemperature drop across the gap between the fuel and cladding surfaces.The temperature drop across the gap is a function of vidth, mean tem-perature, and gas conductivity. D e conductivity of the gas in thegap is detemined as a function of burnup and subsequent release offission product gases. In the event of fuel clad contact, contactcoefficients are determined on the basis of methods suggested by Rossand Stoute(48). Se contact coefficient is determined as a functionof the mean conductivity of the interface materials, the contact
p pressure, the mean surface roughness, the material hardness, and thef conductivity of the gas in the gap.
The analytical model computes the amount of central void expectedwhenever the temperature approaches the threshold temperature forfuel migration, and readjusts the density sccording to the new ge-ometry.
De program 2tes a polynomial fit; relationship for fuel taermal con-
| ductivity. " ree relationships were used to evaluCe the effects of! conductivity A comparison of
the reference design C1fg' -)142@these conductivity relationships with5) is shown in Figure 3-48. De valuessuggested in GEAP-4624\ e.nd CVNA-246 @7) are very similar up to
| 3,000 F and the former values are more conservative above 3,000 F.McGrath 471 concludes that the CVNA-246 values are lover limits forthe high temperature conditions. Fuel center temperatures for allthree of the conductivity relationships at the peaking factors givenin 3 2 3 1.2 have been calculated to evalus,e the margin to centralmelting at the maximum overpower and to show the sensitivity of thecalculation with respect to themal conductivity. Since the powerpeaks vill be burned off with irradiation, the peaking factors usedare conservative at end-of-life.
I 00000203aesu1ts
2e results of the analysis with the methods described above are shown
n in Figures 3-49 and 3-30 for beginning and end-of-life conditions.V Re beginning and end-of-life gas conductivity values are 0.1 and 0.01
Btu /hr-ft-Frespectively. The calculated end-of-life center fuel2
.3-57
!._ _- _ _ _ . _ . ., _ .__ _ . _ - __ . . _ . _ _ ~_ _ -- _ . _ _
temperatures are higher then the beginning-of-life values because ofthe reduction in the conductivity of the gas in the gap. The effect gis apparent even though a contact condition prevails. The calcula-tion does not include the effects of fuel swelling due to irradiation.S e calculated contact pressures are conservatively lower than thoseexpacted at end-of-life conditions in the hottest fuel rods, and thefuel temperatures shown in the above figures are conservatively higher.
Se BW model gives very good results when compared to the results ofothers in the field as is shown in Figure 3-50. In the linear heatrange of most interest, i.e., approximately 20 kv/ft, there is onlyabout 300 F difference between the maximum and minimum values calcu-lated. Also the am11 differences between the BW curve and the othercurves indicate the relative insensitivity of the results to the shapeof the conductivity at the elevated te=peratures.
The most conservative assumptions, using GEAP-4624 data with relativelylittle increase in thermal conductivity above 3,000 F, result in cen-tral fuel melting at about 22 kv/ft, which is 2 kv/ft higher than themax hum design value of 19 9 kv/ft at 114 per cent power. Furtherevaluation of the two figures shows that central fuel melting is pre-dicted to occur between 22 and 26 kv/ft depending on the time-in-lifeand conductivity assumptions.
The transient analyses at accident and normal conditions have beenmade using the GEAP-4624 fuel thermal conductivity curve to reflecta conservative value for the max hum average te=perature and storedenergy in the fuel. Use of this curve results in a his;her tempera- gture and therefore a lover Doppler coefficient, since it decreaseswith temperature. Bus the resultant Doppler effect is also con-servative.
h. Fission Gas Release
The fission gas release is based on results rted in GEAP-4596. b9),
! Additional data from GEAP-431k(50), AECL-603 , and CF-60-12-14(52)have been compar9d v1th the suggested release rate curve. Se re-lease rate curvel 9) is representative of the upper limit of release4
data in the temperature region of most importance. A design release! rate of 43 per cent and an internal gas pressure of 3,300 psi are used
to determine the fuel clad internal design conditions reported in| 3 2.4.2:. Fuel Assemblies.
The design values for fission gas release from the fuel and for the,
I maximum clad internal pressure were determined by analyzing variousoperating conditions and assigning suitable margins for possible in-creases in local or average burnup in the fuel. Adequate margins are
| provided without utilizing tne initial porosity voids present in theUO2 fuel. A detailed analysis of the design assumptions for fissiongas release, and the relationship of burnup, fuel growth, and initialdia=etral clearance between the' fuel and clad, are summarized in thefollowing paragraphs. An evaluation of the effect of having the fuelpellet internal voids available as gas holders is also included.
O
3-58 00000704
. -
..
H (1) Design Assumptions -
.
(a) Fission Gas Release Rates
h e fission gas release rate is calculated as a function offuel temperature at the design overpower of 114 per cent.Se procedures for calculating fuel temperatures are dis-
. cussed in 3 2 3 2.4 g. S e fission gas release curve andthe supporting data are shown in Figure 3-51. Most of thedata is on or below the design release rate curve. A re-lease rate of 51 per cent is used for the portion of thefuel above 3,500 F. Se fuel temperatures were calculatedusing the GEAP-4624 fuel thermal conductivity curve to ob-tain conservatively high values for fuel temperatures.
(b) Axial Power and Burnup Assumptions
Se temperature conditions in the fuel are detemined forthe most severe axial power peaking expected to occur. Twoaxial power shapes have been evaluated to determine the max-imum release rates. Researe150and170 max /avgshapes
'as shown_in Figure 3-11 and repeated as part of Figure 3-52of this analysis. Se quantity of gas released is found byapplying the temperature-related release rates to the quan-tities of fission gas produced along the length of the hotfuel rod.
Be quantity of fission gas produced in a given axial loca-tion is obtained from reactor core axial region burnupstudies. B ree curves showing the axial distribution ofburnup as a local to average ratio along the fuel rod areshown in Figure 3-52. values of 100,~300, and 930 days ofoperation are shown.
S e 930-day, or end-of-life condition, is e : conditionwith the maximum fission gas inventory. Le average burn-up at the end of life in the hot fuel rod is 38,150 MWD /Mwhich has been determined as follows:
CalculatedHotBundleAverageBurnup, MWD /m 33,000
Hot Fuel Rod Burnup Factor 1.05
Margin for Calculation Accuracy 1.10.
HotRodMaximumAverageBurnup, MWD /m 38,150
l Re local burnup along the length of the fuel rod is teproduct of the hot rod maximum average value above thelocal to average ratio shown in Figure 3-52. De tinghot rod local maximum burnup for the 930-day, end- fe
condition is about 42,00016fD/M. Bis is the maxis _,O calculated value. However, local values to 55,000 MWD /m,
~
have been evaluated to insure adequate local fuel cladding|
| 00000205L 3-59
- . . . . . . . - . - - . - . . . . . . - - - . . - . - - . - . - .- - - - - -
__
strength for possible increases in average or local burnupover the life of the fuel for various fuel management pro-cedures.
(c) Hot Rod Power a siptions
De naximum hot rod total power occuring at any time in thelife of the fuel has been used to calculate the overpowertemperature conditions. A hot rod power of 1.85 times theaverage rod power has been applied. Bis results in a max-imum Jinear heat rate of 19 9 kv/ft which corresponds to114 per cent of the maximum linear heat (17.49) shown in
| Table 3-1. This is a conservative assumption when coupled
| vith the end-of-life fission gas inventory since bundle araindividual fuel rod poaer is expected to decrease with fuelburnup. A study of the power histories of all of the fuelassemblies to equilibrium conditions shows that the powersin the bundles during the last 300 days of operation arenot more than 1 3 times the average bundle power. me peakbundle ratio of 1.69 (1.85 + hot rod ratio) vill only occurduring the first two fuel cycles when the fission gas in-ventory is less than the maximum value.
(d) Fuel Growth Assumptions
The fuel growth was calculated as a function of burnap as
indicated in 3 2.4.2.1. Fuel pellet dimensions in the ther-mal temperature and ges release models were increased to theend-of-life conditions as determined above.
(e) Gas Conductivity and Contact Heat Transfer Assumptions
The quantity of fission gas released is a function of fueltemperature. The temperatures are influenced by threefactors: (a) the conductivity of the fission gas in thegap between the fuel and clad, (b) the diametral clearance
,
between fuel and clad, and (c) the heat transfer conditions'
when the fuel expands enough to contact the clad.
2A gas conductivity of 0.01 Btu /hr-ft -F based ca 43 per centrelease of fission gas at the end-of-life condition was usedin the analysis. Diametral clearances of 0.0025 to 0.0075in. reflecting minimum and maximum clearances after fuelgrowth were analyzed. S e contact heat transfer coefficientswere calculated as suggested in Reference 48.
(2) S - m of ResultsThe fission gas release rates were determined in the first eval-uation. Rates were found for various cold diametral clearancesand axial power peaking and burnup shapes. The results are shownin Figure 3-53 The levest curve is the expected condition fora 1 70 axial power shape with a 930-day axial burnup distribution
|as shown in F1 ure 3-52. Se increase in release rate with6
,
1
3-6 00000206
. - . .. -. ..
..
:
i diametral clearance results from the fact that the fuel' tempera-ture must be raised to higher values before contact with the fuel
clad is made. The release rate at the minimum clearance of 0.0025in is 19 per cent. This is the condition that produces the max -imum clad stress due to fuel growth with irradiation. Se assem-bly of maximum size pellets with minimum internal diameter clad-
L ding will produce this condition after fuel growth. In the eventa few hot pellets have the maximum diameter and the remainderhave the minimum diameter, then the average cold gap would be0.0035 in. producing a slightly larger release rate. The re-lease rate of 33 per cent for the maximum diametral clearancewil1 not occur with the maximum stress condition due to fuelgrowth, since the fuel nan grow into the cle vance.
Two additional cases were examined to check the sensitivity ofthe calculations to axial power and burnup shapes. The resultsare shown by the upper two curves in Figure 3-53 2e top curveis a plot of the release rates when it is assumed that both the
axial power and burnup inventory of fission gas are distributedwitha170 max /avgratioassnownonFigure3-52. similar re-sults are shown for the 1 50 max / avg ratio. Rese curves showthe release rates expected are not strongly influenced by thevarious power and burnup shapes.
The second evaluation shows the resulting internal pressures dueto the release of fission product gases. Plots of pressures for,
the expected 930-day axial burnup distribution and a 1.70 max /avg axial power shape are shown in Figure 3-5h. The lower curveis a plot of internal gas pressure with open pores.(5 per centof the fuel volume is available to hold the released gas). Seupper data band is for a closed pore condition with all releasedgas contained outside the fuel pellets in spaces between the ex-panded dished ends of the pellets, the radial gaps (if any), and
! the void spaces at the ends of the fuel rods. Se band of datashown reflects the effect of fuel densieication and grain growthdescribed in 3 2 3 2.4. The upper limit is for an ideal thermalmodel without grain growth or densification; the lover limitsare for the design model. The calculation of the maximum pres-
I sure is also relatively insensitive to the axial burnup distri-i bution as shown by the dashed line in Figure 3-54 for a 150
maximum to average axial power and burnup shape. (21s corre-sponds to a local burnup peak of 37,000 MWD /MTU.)
The allowable design inte nal pressure of 3,300 psi is well abovethe maximum values of internal pressures calculated for open orclosed pellet pores, and the maximum internal pressure shouldonly occur with the maximum diametral clearance condition. Amodest increase in average fuel burnup can be tolerated withinthe prescribed internal pressure design limits.
It has been indicated in Reference 44 and in AECL-1598 that the_
UO2 fuel is plastic enough to flow under low stresses when thetemperature is above 1,800 F. That fraction of the fuel below
.. ,
0%WU--
3 61
.- .-. . _. . - -- . - - _ . . -
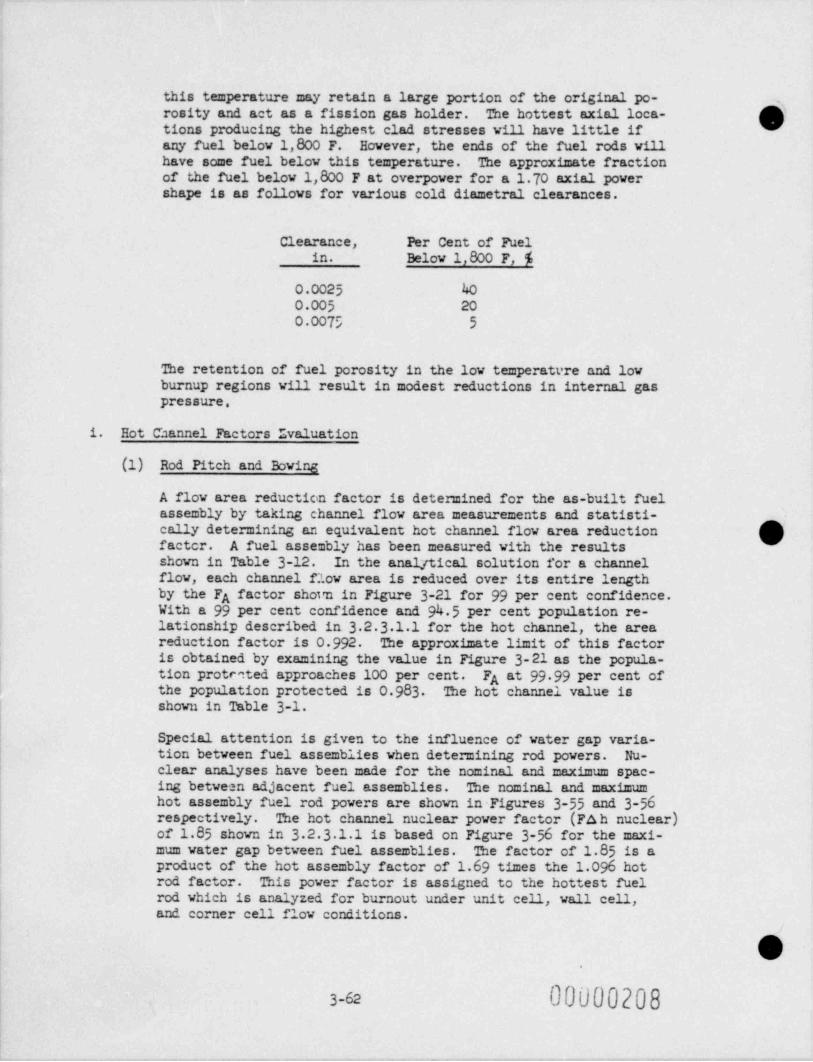
this temperature may retain a large portion of the original po-rosity and act as a fission gas holder. The hottest axial loca-tions producing the highest clad stresses vill have little ifany fuel below 1,800 F. However, the ends of the fuel rods willhave some fuel below this temperature. The approximate fractionof the fuel below 1,800 F at overpower for a 1 70 axial powershape is as follows for various cold diametral clearances.
Clearance, Per Cent of Fuelin. Below 1,800 F, %
0.0025 400.005 200.0075 5
The retention of fuel porosity in the lov temperatvre and lovburnup regions will result in modest reductions in internal gaspressure.
1. Hot Channel Factors Evaluation
(1) Rod Pitch and Boving
A flow area reduction factor is determined for the as-built fuelassembly by taking channel flow area measurements and statisti-cally determining an equivalent hot channel flow area reduction hfacter. A fuel asse=bly has been measured with the results
shown in Table 3-12. In the analytical solution for a channelflow, each channel flow area is reduced over its entire lengthby the FA factor shovn in Figure 3-21 for 99 per cent confidence.With a 99 per cent confidence and 94.5 per cent population re-lationship described in 3 2 3 1.1 for the hot channel, the areareduction factor is 0 992. D e approximate limit of this factor
j is obtained by examining the value in Figure 3-21 as the popula-| tion prote ted approaches 100 per cent. FA at 99 99 per cent of| the population protected is 0 983 2 e hot channel value is! shown in Table 3-1.|| Special attention is given to the influence of water gap varia-'
tion between fuel assemblies when detemining rod powers. Nu-clear analyses have been made for the nominal and maximum spac-ing between adjacent fuel assemblies. The nominal and maximumhot assembly fuel rod powers are shown in Figures 3-55 and 3-56respectively. The hot channel nuclear power factor (FAh nuclear)of 1.85 shown in 3 2 3 1.1 is based on Figure 3-56 for the maxi-mum vater gap between fuel assemblies. The factor of 1.85 is aproduct of the hot assembly factor of 1.69 times the 1.096 hotrod factor. This power factor is assigned to the hottest fuelrod which is analyzed for burnout under unit cell, vall cell,and corner cell flow conditions.I
Y3-62 00000208
. ..
._ _ _ _ . _ ..
_
|
(2) Fuel Pellet Diameter,' Density, and Enrichment' Factors,
Variations in the pellet size, density, and enrichment are re-.flected in coefficients of variation numbers 2 through 7 ofTable 3-12. These variations have been obtained from the mea-sured or specified tolerances and combined statistically asdescribed in 3 2 3 2.2 to give a Power factor on the hot rod.-
For the hot channel confidence and population conditions, this,
. factor, Fq, is 1.008 and is applied as a power increase over the'
full length of the hot fuel rod. Se local heat flux factor,Fqn, for 99 per cent confidence and 94.5 per cent population is1.013 These hot channel values are shown in Table 3-1. Secorresponding values of Fq and Fqn with 99 99_per cent popula-tion protected are 1.017 and'1.03 respectively. A conservativevalue of Fqn of 1.03 for 99 per cent confidence and 99 99 per
; cent population is used for finding the maximum fuel linear heatrates as shown in 3 2 3 1.2.
R ese factors are used in the direct solution for channel en-thalpies and are not expressed as factors on enthalpy rise asis often done. The coefficients of variation will be under con-tinuous review during the final design and develognent of thefuel assembly.
(3) Flow Distribution Effects' Inlet Plenum Effects,
F
The final inlet plenum effects wi.L1 be determined from the 1/6i scah model flow test now in progress. "he initial runs indi-
cate satisfactory flow' distribution. Although the final nucleari analysis and flow test data may show that the hot bundle posi-
tions receive average or better flow, it has been assumed thatthe flow in the hot bundle position is 5 per cent less than aver-age bundle flow under isothennal conditions corresponding to themodel flow test conditions. An additional reduction of flow dueto hot assembly power is described below.
Redistribution in Adjacent Channels ofDissimilar Coolant Conditions
| The hot fuel assembly flow is less than the f_sw through an aver-! age assembly at the same core pressure drop because of the in-
creased pressure drop associated with a higher enthalpy and qual-ity condition. B is effect is allowed for by making a directcalculation for the hot assembly flow. Se combined effects ofupper and lower plenum flow conditions and heat input to the hotassemblies will result in a hot assembly flow of about 85 to 95per cent of the average assembly flow depending on the final ple-num effects and assembly power peaks. Se worst combination ofeffects has been assumed in the initial design, and the hot as-
f sembly flow has been calculated to be about 85 per cent of the-.
S average assembly flow at 114 per cent overpower. Actual hot as-sembly flows are calculated rather than applying an equivalent
ihot channel enthalpy rise factor. ~
000002M*
- - :/.; :<; : , 3-63
._. .. __ _ . . __ _ __ _ . _ _ _ . _ . . _ _ _ _ . _ . . _ . . _ _ . _ _ . _ . . . . . . . _

_
Physical Mixing of Coolant Between Channels
The flow distribution within the hot assembly is calculated witha mixing code that alicvs an interchange of heat between channels.Mixing coefficients have been determined from multirod mixingtests. The fuel assembly, consisting of a 15 x 15 array of fuelrods, is divided into unit, vall, and corner cella as shown bythe heavv lines in Figure 3-55 The mixed enthalpy for everycell n,t.etermined simultaneously so that the ratio of cell toaverage assembly enthalpy rise (Enthalpy Rise Factor) cad thecorresponding local enthalpy are obtained for each cell. Typicalenthalpy rise factors are shown in Figures 3-55 and 3-56 for cells
j surrounding the hottest fuel rod located in the corner of the as-| sembly. The assumptions used to described the channels for the
peaking and enthalpy rise factors shown are given in Wall andCorner Channels Evaluation, 3 2 3 2.4 j, which follows.
J. Evaluation of the DNB Ratios in the Unit, Wall, and Corner Cellsi
DNB Results
The DNB ratios in the hot unit cell at the maximum design condition! described in 3 2 3 1 are shown in Figure 3 46. The relationships
shown are based on the adata in the BAW-168(10) pplicat4on of) single channel heat transferi'
and W-3(23,66 correlations. An additionalsensitivity analysis of the assembly has been made utilizing 9-rodassembly heat transfer DNB test data that is more representative ofthe actual vall and corner cells geometry effects than single channeldata.
,
| The sensitivity of the assembly design with respect to variations ofmass flow rate (G), channel spacing, mixing intensity, and local peak-
i ing en the DNB ratios in the fuel assembly channels has been evaluatedI by analyzing the nominal conditions and a postulated vorst case (sn-
dition. The su= mary results are shown below in Table 3-18.
Table 3-18DNB Ratios in the Fuel Assembly Channels
Nominal Case
Cell Type G,1b/hr-ft2 x 10-6 DNBR
Corner 1 59 2.20Wall 1 90 2.11Unit 2 52 2.01
Postulated Worst Case
Cell Type G,1b/hr-ft2 x 10-6 DNBR
Corner 1 32 1 70Wall 1.6h 1.65 hUnit 2.29 1 73
3-64'
. . . _ . .
The DNBR's sbove are ratios of the' limiting heat flux to the localflux along the length of the channels. The limiting heat flu::es havebeen determined from the 9-rod assembly DNB test data.
S e DNB ratios in all channels are high enough to insure a confidence-population relationship equal to or better than that outlined in3 2 3 1.1 for the hot unit cell channel. The postulated worst caseconditions are more severe than the required maximum design conditions.
Tht rssults of the assembly tests and this evaluation show that theperfeinance of the vall and corner cells is more sensitive to localenthalp than to the local mass velocities. Although the mass flowrates in the corner and vall cells are lower than in the unit cell,the total flow in these cells is relatively higher than the mass flowrates imply because of the increased space between the outer rods andthe perforated can. This results in more favorable power-to-flowratios than the mass flow rates indicate.
The DNB ratios were obtained by comparing the local heat fluxes andcoolant conditions with heat transfer data points from 9-rod fuelassembly heat transfer tests for uniform heat flux with an appropriatecorrection for a nonuniform axial power shape. Typical results areshown in Figures 3-57 and 3-58 for the nominal and vorst case condi-tions in the corner cell. The line defined by a best fit of the data
~
is shown on cach figure as a solid line. A design limit line, sbovn
(\.>}as dotted, hau been determined by lowering the best-fit line to accountfor the effects of nonuniform flux shapes. Se magnitude of the re-duction was determined by ecm:parison with the results of the. stomnonuniform test data Reference 19 and the results of more rec .t non-uniform tests conducted by B&W.
The limiting best-fit lines were derived from a ;-rod fue.1 assembl*;test section 72 in. long with rod diameter, pitch spacing, and sacergrids of the type to be used in the reference design. A total of 513data points between 1,000 psi and 2,450 psi has been obtained. Onehundred and sixty-two of these points were used for the limiting linesin the PWR pressure and mass flow ranges. The ranges of test variablesfor the 162 data points used were:
Pressure - 1,800 to 2,450 psit
i Mass Flow Rate - 1.0 to 3 5 x 10⁶ lb/hr-ft2| Quality - -5 to +20 per cent
All of the cell conditions of interest in this analysis fall withinthis range of parameters.
Fuel Rod Power Peaks and Cell Coolant Conditions '
1* 2 e nominal case loc'l-to-average rod powers and the local-to-averageaexit enthalpy rise ratios are shown in Figure 3-55 for the het corner,hot vall, and hot unit cells in the hot fuel assembly. Values shownare for nominal water gaps between the hot fuel assembly and adjacent
'
3-65
-. , _- ._ , , - .- - - . - -.- .. _ - - - . - . . - - - - .
-
.
fuel assemblies with nominal rod-to-vall spacing, with nominal flow to gth9 hot fuel assembly, and with a nominal intensity of turbulence, wa (*), equal to 0.03
Additional tests are being run to determine the maximum values of in-tensity of turbulence associated with the fuel assembly. The expectedvalue is greater than 0.03 since this value is obtained in smoothtubes, and the spacers and can panel perforations should induce moreturbulence.
. The postulated worst case loccl-to-average rod powers and exit en-| thalpy rise ratios in the hot fuel assembly are shown in Figure 3-56.
The factors were determined for this case with twice the nominal watergaps between the hot fuel assembly and adjacent fuel assemblies withminimum rod-to-vall spacing, with minimum flow to the hot fuel assem-bly, and with a minimum assumed intensity of turbulence, a, equal to,
! 0.01.(
In neither the nominal nor the postulated vorst case analysis haa any|
credit been taken for the coolant which is flowing in the water gapsbetween the fuel assemblies and which serves to reduce enthalpi.es inthe peripheral cells of the hot fuel assembly by mixing with the cool-ant in those cells through the can panel perforations. In both cases,however, the effective roughness of the can panel perforations and itseffect on reducing the flow in the peripheral cells of the fuel assem-bly has b^en accounted for. B e magnitude of the effective roughnesswas obtained from the results of a series of flow tests performed on Ma mockup of the outer two rews of fuel rods and the can panels of two Wadjacent fuel assemblies. The rod-to-vall spacing in the peripheralcells of the fuel assembly has been increased to compensate for theeffects of the can panel in reducing the flow in the peripheral cells.The nominal distance from the center of the outside rods to the canpanel is 0 324 in. 2 e corresponding postulated vorst case dimensionwas assumed to be 0 310 ir.
| Fuel Assembly power and Flow Conditions!
The nominal and postulated vorst cases were run at 114 per cent re-actor power with the nominal and worst F Ah factora shown in 3 2 3 1.1 c.''he 150 modified cosine axial power shape of Figure 3-11 was used todescribe the worst axial condition.
.....
(a)The intensity of turbulence,e , is defined as
V{/VwhereV{isthetransverseco=ponentofthefluctuatingturbulentvelocity,
| and V is the coolant velocity in the axial direction. This method of com-I puting mixing is described by Sandberg, R. O., and Bishop, A. A., CVTR g
Thermal-Hydraulic Design for 65 K4 Gross Fission Power, CVNA-227 W
3-66 f2
. . . .
._
The hot assembly flow under nominal conditions without a flow mal- '
distribution effect is 93 per cent of the aversge assembly flow, andthe reduction in flow is due entirely to heat input effects. The hotassembly flow under the worst postulated conditions is 85 per centof the average assembly flow and considers the worst combined effectsof heat input and flow maldistribution.
Summary
Analysis of all' B&W bundle data to date indicates tnat the B&W methodvill correlate data with less deviation than previous methods. In-dications are that this is also true when considering nonuniform axialpower distributions. Additional bundle testa vill be conducted withnonuniform axial power distribution to confinn that the use of a powershay correction factor based on single channel and annular specimensis conservative.
Completion of the test programs outlined in this report and evaluationof the experimental data vill provide final design correlations andflow relationships that will give complete confidence in the conser-vatism of the design and the B&W analytical procedures.
It should be noted that the postulated verst case is worse than thehot channel permitted by our specifications. Even with this postu-lated worst case, the design is still conservative, and there is very
; little difference in the perfonnance of the various channels. ThisI indicates that the outside cell geometries have been compensated cor-| rectly to account for vall effects.!
i!
It
.
1
I
:
||
* .
.
3-67
. ___._ __
___. .- --
3.2.h MECHfdlICAL DESIGN LAYCGT
3.2.4.1 Internal Lavout
OReactor internal co=ponents include the upper plenu= assembly, the core supportassembly (consisting of the core support shield, vent valves, core barrel, lover |1grid and flow baffle, thermal shield, and surveillance specimen holder tubes),and the incore instrument guide extensions. Figure 3-59 shows the reactor ves-sel, reactor vessel internals arrangement, and the reactor coolant flow path.Figure 3-60 shows a cross section through the reactor vessel, and Figure 3-61shows the core flooding arrangement.
Reactor internal co=ponents do not include fuel assemblies, control rod assem-blies (CRA's), surveillance specimen asse=blies, or incore instrumentation.Fuel assemblies are described in 3.2.L.2, control rod assemblies and drives in3.2.4.3, surveillance specimen assemblies in h.k.3, and incore instrumentationin 7.3.3.
The reactor internals are designed to support the core, maintain fuel asse=blyalign =ent, limit fuel assembly movement, and maintain CRA guide tube align =entbetween fuel assemblies and control rod drives. They also direct tie flow ofreactor coolant, provide ga==a and neutron shielding, provide guides for incoreinstrumentation between the reactor vessel lover head and the fuel asse=blies,support the surveillance specimen assemblies in the annulus between the thermalshield and the reactor vessel vall, and support the internals vent valves. 1These vent valves are provided to relieve pressure generated by steaming in thecore following an inlet pipe rupture so that the core vill re=ain sufficientlycovered with coolant. All reactor internal components can be removed frc= thereactor vessel to allow inspection of the reactor internals and the reactor ves-sel internal surface.
A shop fitup and checkout of all internal components in an as-built reactor ves-sel mockup will insure proper alignment of =ating parts before shipment. Du==vfuel assemblies and control rod. assemblies vill be used to check fuel asse=blyclearances and CRA free movement.
In anticipation of lateral deflection of the lower end of the core support as-se=bly as a result of hori:cntil seismic loadings, integral veld-attached, de-flection-limiting spacer blocks have been placed on the reactor vessel insidevall. In addition, these blocks limit the rotation of the lover end of thecore support assembly whien could conceivably result from flow-induced torsionalloadings. The blocks allow free vertical movement of the lower end of the in-ternals for thermal expansion throughout all ranges of reactor operating con-ditions, but in the unlikely event of a flange, circumferential veld, or boltedjoint failure the blocks vill limit the possible core drop to 1/2 in or less.The final elevation plane of these blscks vill be established near the sameelevation as the vessel support skirt attachment to minimize dynamic loadingeffects on the vessel shell or bottom head. Preliminary calculations indicatethe impact loading on the stcp. blocks for a 1.'k in. core drop would be approxi-mately 5 g's total. Llock location and geometry will be evaluated and deter-mined to transfer this loading through the. vessel support skirt to the reactorbuilding concrete. A significant reduction in impact loading can be achievedthrough proper stop block design and detailed analysis. A 1/2 in, core dropwill not allow the lower end of the CRA poison rods
O'
o.ononp743-68 (Revised 1-15-68)
.-
- - , _ . . . _ -. -_ ..
1
|
|
j- to disengage from their respective fuel assembly guide tubes if the CRA'sy are in the full-out position, ~since approximately' 6-1/2 in. of rod length,
would remain in-the fuel assembly guide tubes. Acoredropof1/2in.vill not result in a significant reactivity change. The core cannot re-tate and bind the. drive lines because rotation of the core support assen-,
bly is prevented by the stop blocks.,
The failure of the core support shield and core barrel upper flanges, orrelated flanges and other circumferential joints, is not considered cred-ible on the basis of the conservative design criteria and large safetyfactors employed in the internals design. The final internals designvill be espable of withstanding various combinations of forces and load-ings resulting from the staf,1c veight of internals (179,000 lb total),core with control rod drive line (303,000 lb total), dynamic load fromtrip (10 g's gives 207,000 lb), seismic (0.10 g vertical gives 48,000 lb),coolant flow hydraulic loading (230,000 lb), and other related loadings.The algebraic sum of this simplified loading case is 507,000 lb. This
I results in a tensile stress of about 700 psi in the core support shield '
; shell, which is approximately 4 per cent of the material yield strength.Final internals component weights, seismic analysis, dynamic loadingsfrom flow-induced vibration, detailed stress analysis with considerationfor thennal stress during all transients, and resolution of fabricationdetails such as shell rolling tolerances and weld joint preparation de-tails will increase the stress levels listed above. As a final designcriterion, the core support components will meet the stress requirementsof the ASME Code, Section III, during normal operation and transients.
(. The structural integrity of all core support circumferential weld joints
in the internals shalls vill be insured by compliance with the radio-graphic inspection requirements in the code above. The seismic analysiswill include detailed calculations to' determine the maximum structuralresponse of the reactor vessel and internals. T'-te analysis will be per-
i formed as described in 3 1.2.h l.
In the event of a major loss-of-coolant accident, such as a 36 in. diam-I
eter reactor coolant pipe break near the reactor vessel outlet, the fuelassembly and vessel internals vould be subjected to dynamic loadings re-sulting from an oscillating (approximately sinusoidal) differential pres-sure across the core. A preliminary analysis of this postulated accidentindicates that the fuel assemblies vould move upward less than 3/8 in.Some deflection of the internals structures would occur, but internalscomponent failure vill not occur. The occurrence of a loss-of-coolantaccident and resulting loadings will be evaluated during the detailed de-sign period for the fuel assemblies and related internals structural com-ponents.
The deflections and movements described above vould not prevent CRA in-sertion because the control rods are guided by split tubes throughouttheir travel, and the guide tube to fuel assembly alignment cannot changeregaviless of related component deflections. CRA trip could conceivablybe delayed momentarily as a result of the oscillating pressure differen-tial. However, the CRA travel time to full insertion vould remain rela-tively unaffected as transient pressure oscillations are dampened out inapproximately 0 5 sec. On this basis, the CRA travel time to 2/3 inser- 1tion on a trip command will be approximately 1.55 see instead of the spec-
! itied 1.40 sec. Also,
3-69 (Revised 1-15-68) 00000215
- . . . - - . - - . - - - , - - - . - - - . - - - , - _ . _ , . - _ - , - . - . - , , - - , , , ,
this possible initial minor delay in trip initiation vould not contribute tothe severity of the loss-of-coolant accident because at the initiation of CRA gtrip, the core would be suberitical from voids. W
Material for the reactor internals bolting vill be subjected to rigid qualitycontrol requirements to insure structural integrity. The bolts vill be dye-penetrant inspected for surface flav indications after all fabrication opera-tions have been completed. Torque values vill be specified for the final as-sembly to develop full-bolting capability. All fasteners vill be lock-veldedto insure assembly integrity.
3 2.4.1.1 Upper Plenum Assembly
The upper plenum a?nenbly is located directly above the reactor core and is re-moved as a single component before refueling. It consists of upper and centergrid assemblies, CRA guide tubes, and a flanged cylinder with openings for re-actor coolant outlet flow. The upper grid is a series of parallel flat barsintersecting to form square lattices and is velded to the plenum cylinder topflange. A machined upper end on each CRA guide tube is located and welded tothe plenum cover which is attached to the upper grid bars. CRA guide tubesprovide CRA guidance and protect the CRA from the effects of coolant cross-flow.
Each CRA guide tube consists of an outer tube housing and sixteen slotted tubeswhich are properly oriented and brazed to a series of castings. As the tubestre slotted for their full length, the brazement provides continuous guidancefor the CRA full stroke travel. Design clearances in the guide tube vill ac- s
commodate some degree of misalignment between the CRA guide tubes and the fuelassemblies. Final design clearances vill be established by tolerance studiesand by the results of the Control Rod Drive Line Facility (CRDL) prototypetests. Preliminary test results are described in 3 2.4 3 5
The center grid assembly consists of parallel flat bars intersecting to formsquare lattices. The bars are attached to a flange which is bolted to the,
plenum cylinder lover flange. The center grid assembly locates the lower endof the individual CRA guide tube relative to the upper end of the correspond-ing fuel assembly.
Locating slots in the upper plenum assembly top flange engage the reactor ves-cel top flange locating devices to align the upper plenum assembly with the re-cetor vessel, reactor closure head control rod drive penetrations, and thecore support shield. The bottom of the upper plenum assembly is guided andaligned by locating blocks attached to the inside of the core support shield.
3 2.4.1.2 Core Support Assembly
The core support assembly consists of the core support shield, core barrel,lover grid and flow baffle, thermal shield, and surveillance specimen holdertubes.
Static loads from the assembled components and fuel assemblies, and dynamicloads from CRA trip, hydraulic flov, thermal expansion, seismic disturbances,and loss-of-coolant accident considerations, are all carried by the core sup- ,
port assembly. g34
00000216_
v v
n(") The core support asse=bly co=ponents are described as follows:
a. Core Support Shield
The core support shield is a large flarged cylinder which =ateswith the reactor vessel opening. The top flange rests on acircu=ferential ledge in the reactor vessel top closure flange.The core support shield lower flange is bolted to the core bar-rel. The cylinder vall has two nozzle openings for reactorcoolant outlet flow. Locating blocks on the inside of the cyl-inder vall near the botto= Suide and align the upper plenu=chamber relative to the core support shield.
The reactor vessel outlet nozzles are sealed to the =atire com-ponents of the core support shield by the differential ther=alexpansion between the carbon steel reactor vessel and the stain-less steel core support shield. The nozzle seal surfaces arefinished and fitted to a predetemined cold gap providireclearance during core support asse=bly installation and re= oval.At reactor operating te=perature the mating =etal surfaces arein contact to =ake a seal without exceeding allowable stressesin either the reactor vessel or internals.
b. Core Barrel
The core barrel supports the fuel asse=blies and lover grid andflow baffle, and directs the reactor coolant flow through thevessel. The barrel consists of a flanged cylinder, a series ofinternal horizontal spacers bolted to the cylinder, and a seriesof vertical plates bolted to the inner surfaces of the horizon-t< spacers to fo= an inner vall enclosing the fuel asse=blies.Construction of the core barrel vill be si=ilar to that of the
| reactor internals co=ponent developed by B&W for the Indian| Point Station Unit No. 1.
Coolant flow is downward along the outside of the core barrelcylinder and upward through the fuel asse=blies contained inthe core barrel. A s=all portion of the coolant flows upwardthrou6h the space between the core barrel outer cylinder andthe inner plate vall.
! Coolant pressure in this space is maintained slightly lover than| the core coolant pressure to avoid tension loads on the bolts| attachirq the plates to the horizontal spacers. The vertical'
plate inner vall vill be carefully fitted together to reducereactor coolant leakage to an acceptable rate.
The upper flange of the core barrel outer cylinder is bolted tothe =ating lever flange of the core support shield, and thelower flange is bolted to the =ating flange of the lover grid
p) - and flow baffle. All bolts will be inspected and installed as,
' V i
" 00000?I7~
._.
.
d: scribed in 3 2 3.1, and vill be lock-velded aft:r final assembly.
c. Iover Grid and Flow Baffle
he lover grid provides alignment and support for the fuel assembliesand aligns the incore instrument guide extensions with the fuel as-sembly incore instrument tubes. We lower grid consists of two flatplate and bar lattice structures separated by short tubular columnssurrounded by a flanged cylinder. The top flange is bolted to thelower flange of the core barrel. Se lover grid top flange alsopositions and supports the themal shield.
Se flow baffle is a dished plate with an external flange which isbolted to the bottom flange of the lower grid. The flow baffle isperforated to distribute the reactor coolant entering the bottom of.the core.
d. Thermal Shield
A cylindrical stainless steel thermal shield is installed in theannulus between the core barrel outer cylinder and the reactor ves-sel inner vall. The thermal shield reduces the neutron and gaianainternal heat generation in the reactor vessel vall and thereby re-duces the resulting thermal stresses.
The themal shield is supported on, positioned by, and attached tothe lover grid top flange. Also, the thermal shield upper end ispositioned by spacers between the thermal shield and the core barrelouter cylinder to minimize the possibility of thermal shield vibra- gtion. The thermal shield attachment is designed to prevent fasteners Wfrom being loaded in shear. Fasteners are lock-velded after finalassembly.
e. Surveillance Specimen Holder Tubes
Surveillance specimen holder tubes are installed on the core supportassembly outer vall to contain the surveillance specimen assemblies.The tubes extend from the top flange of the core support shield to,
| the lower end of the thermal shield. The tubes will be rigidly at-tached to prevent flow-induced vibration. Slip joints at the loverend of the core support shield will allow the shield to be removedfrom the core support assembly without destructively removing thesurveillance specimen holder tubes.
f. Intern'als Vent Valves 1
Internals vent valves are installed in the core support shield toprevent a pressure unbalance which might interfere with core coolingt
| following a loss-of-coolant accident. In its natural state and underall normal operating conditions, the vent valve vill be. closed. In
; the event of a loss-of-coolant accident in the cold leg er the reactor
3-72 (Revised 1-15-68)
on m 8.
-
, _ . _ m -w- ,.,-._w--, ,-, w.,- -
_
.
(~j loop, the valve vill open to permit steam generated in the core to 1y_/ flow directly to the leak and will prevent the core from bacomingmore than 1/2-uncovered after emergency core coolant has been sup-
-
plied to the reactor vessel. The preliminary design of the laternalsvent valve is shown in Figure 3-61a.
Each valve assembly consists of a hinged disc, valve body with seal-ing surfaces, split-retaining ring, and fasteners. Each valve assem-bly is installed into a machined mounting ring, integrally velded inthe core support shield vall. The mounting ring contains the neces-sary features to retain and seal the perimeter of the valve _ assembly.Also, the mounting ring includes an alignment device to maintain thecorrect orientaticn of the valve assembly for hinged-disc operation.Each valve assembly vill be remotely handled as a unit for removslor installation. Valve component parts, including the-disc. will beof captured-design to minimize the possibility of part loss to thecoolant system, and all fasteners will include a positive lockingdevice. The hinged-disc vill include an integral arm hook, eye, orother device for remote inspection of disc function.
The preliminary arrangement consists of lk-in. diam check valve assem-blies installed in the cylindrical vall of the internals core supportshield. The valve centers are coplanar and are h2 in, above.the planeof the reactor vessel coolant nozzle centers. In cross section, thevalves are spaced around the circumference of the core support shield i
vall.
h',",N) The hinge design vill consist of a shaft, two valve body journal re-.
.
'
ceptacles, two valve disc journal receptacles , and four flanged shaftjournals (bushings). Loose clearances vill be used between the shaftand journal inside diameters, and between the journal outside diametersand the,ir receptacles. This feature provides eight loose rotationalclearances to minimize any possibility of impairment of disc-freemotion in service. In the event that one rotational clearance shouldbind in service, seven loose rotational clearances would remain toallow unha=pered disc-free motion. In the worst case, at least four
. clearances must bind or seize solid to adversely affect valve disc-
| free motion.| *
! In additien, the valve disc vill contain a self-alignment feature sothat the external differential pressure vill adjust the disc sealface to the valve body seal face. This feature minimizes the possi-
|; bility of increased leakage and pressure-induced deflection loadings
| on the hinge parts in service.:!
| The external side of the disc vill be contoured to absorb the impactI
| load of the edqsc on the reactor vessel inside vall without transmit-.
ting exe,es;si've impact loads to the hinge parts as a result of a loss '.
of-coolant accident.
L 0.0000219L -
3-72a (Revised 1-15-68)
. ... _ . . _- , .-. - -. .. .- - .. .-

3 2.4.1 3 Incore Instrument Guide Extensions
The incore instrument guide extensions guide the incore instrument assemblies hbetween the instrument penetrations in the reactor vessel bottom head and theinstrument tubes in the fuel assemblies. Sufficient clearance in the instru-ment guide extensions provides for minor misalignment between the reactor ves-sel inistrument penetrations and the instrument guide extension tubes. A per-forated shroud tube, concentric with the instrument guide tube, adds rigidity
O.
OnMc. ao.
||
| 3-72b (Revised 1-15-68)1
!
l_
|- . - - - --. . _ . . _ _ . _ . _ _ ._ ___._ _ _
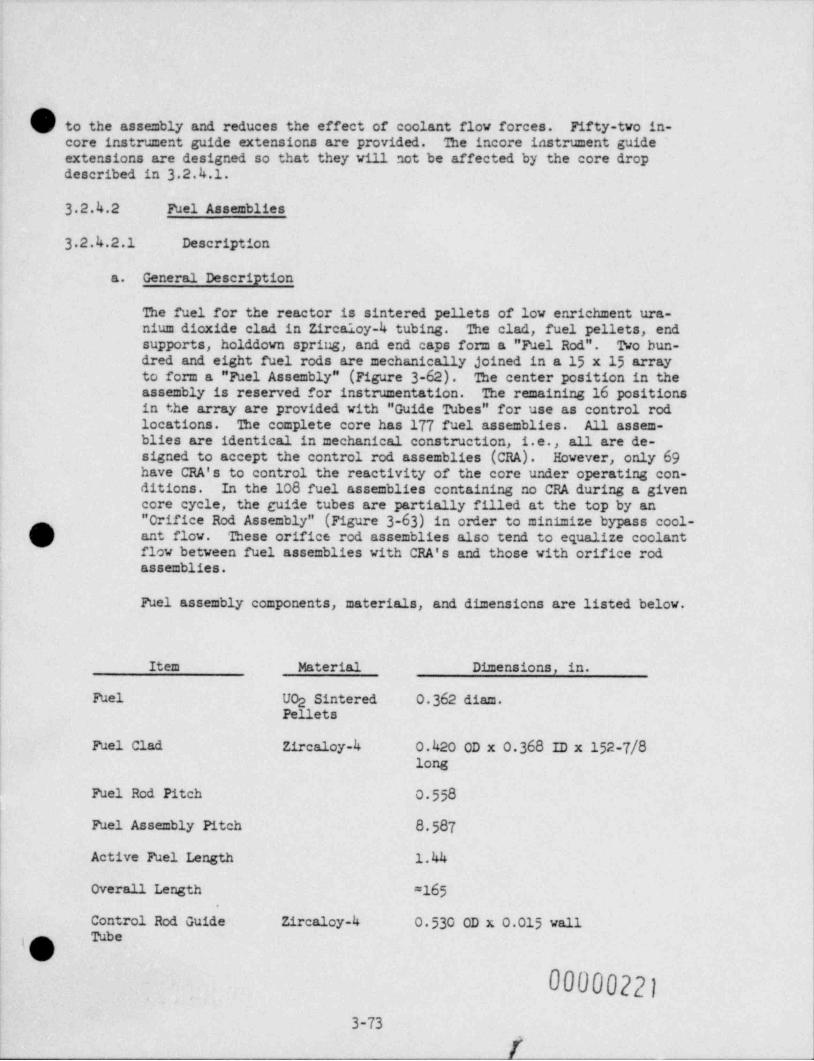
(( / to the assembly and reduces the effect of coolant flow forces. Fifty-two in-
core instrument guide extensions are provided. The incore instru=ent guideextensions are designed so that they will not be affected by the core drop
described in 3 2.4.1.
3 2.4.2 Fuel Assemblies
3 2.4.2.1 Description
a. General Description
The fuel for the reactor is sintered pellets of lov enrichment ura-nium dioxide clad in Zircaloy-4 tubing. The clad, fuel pellets, endsupports, holddown spring, and end caps form a " Fuel Rod". Two bun-dred and eight fuel rods are mechanically joined in a 15 x 15 arrayto form a " Fuel Assembly" (Figure 3-62). The center position in theassembly is reserved for instrumentation. The remaining 16 positionsin the array are provided with " Guide Tubes" for use as control rodlocations. 'the complete core has 177 fuel assemblies. All assem-blies are identical in mechanical construction, i.e., all are de-signed to accept the control rod assemblies (CRA). However, only 69have CRA's to control the reactivity of the core under operating con-ditions. In the 108 fuel assemblies containing no CRA during a givencore cycle, the guide tubes are partially filled at the top by an" Orifice Rod Assembly" (Figure 3-63) in onier to minimize bypass cool-(q ant flow. These orifice rod assemblies also tend to equalize coolantgflow between fuel asse=blies with CRA's and those with orifice rodassemblies.
Fuel assembly components, materials, and dimensions are listed below.
Item Material Dimensions, in.
| Fuel UO2 Sintered 0 362 diam.| Pellets
Fuel Clad Zircaloy-4 0.420 OD x 0 368 ID x 152-7/8| long
| Fuel Rod Pitch 0 558
| Fuel Asse=bly Pitch 8 587|
Active Fuel Length 1.44
Overall Length =165
Control Rod Guide Zircaloy-4 0 530 OD x 0.015 vallp Tube;b
00000221,
3-73
f
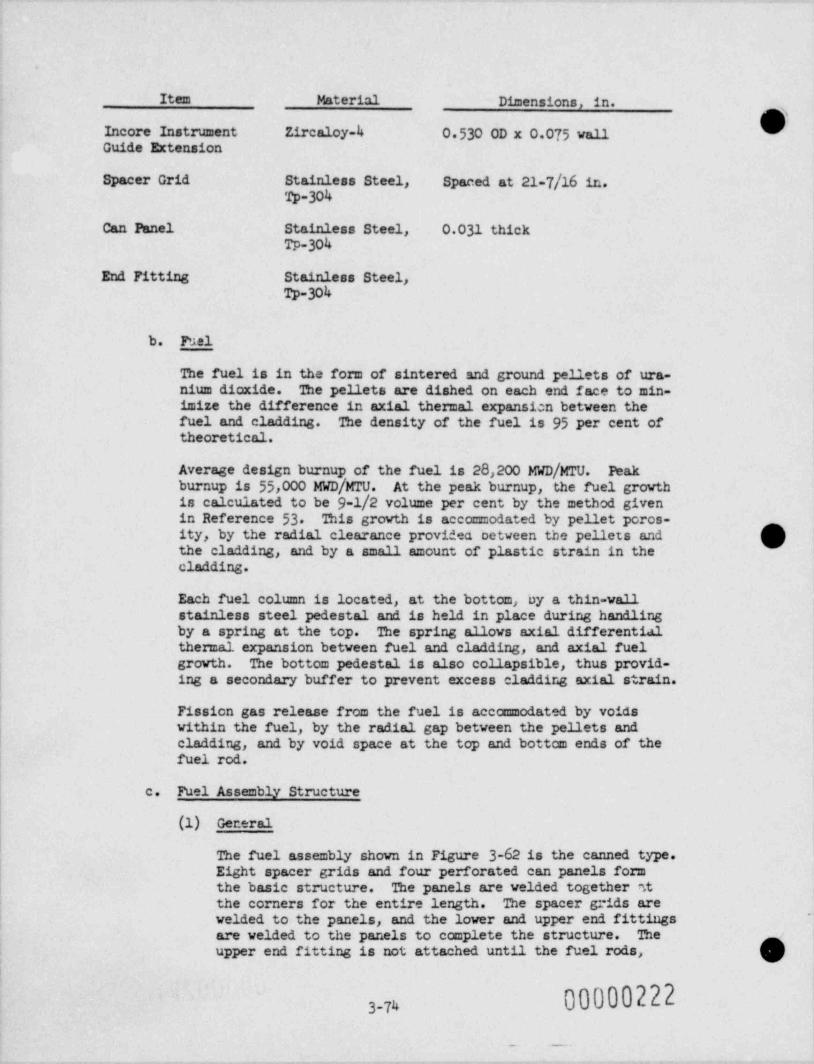
1
!
Item Materini Dimensions, in.
h|Incore Instrument Zircaloy-4 0 530 OD x 0.075 van'
Guide Extension
Spacer Grid Stainless Steel, Spacedat21-7/16in.Tp-304
Can Panel Stainless Steel, 0.031 thickTP-304
End Fitting Stainless Steel,Tp-304
b. Fuel
The fuel is in the form of sintered and ground penets of ura-nium dioxide. The pellets are dished on each end face to min-imize the difference in axial themal expansion between thefuel and cladding. The density of the fuel is 95 Per cent oftheoretical.
ofthefuelis28,200 MWD /MTU. PeakAveragedesignburnup/MTU.burnup is 55,000 MWD At the peak burnup, the fuel growthiscalculatedtobe9-1/2volumepercentbythemethodgivenin Reference 53 This growth is accommodated by pellet poros-ity, by the radial clearance providea cetween the pellets and hthe cladding, and by a small amount of plastic strain in thecladding.
Each fuel column is located, at the bottom, by a thin-vallstainless steel pedestal and is held in place during handlingby a spring at the top. The spring allows axial differentialthemal expansion between fuel and cladding, and axial fuelgrowth. The bottom pedestal is also co napsible, thus provid-
| ing a secondary buffer to prevent excess cladding axial strain.
Fissien gas release from the fuel is accommodated by voidswithin the fuel, by the radial gap between the pellets andcladding, and by void space at the top and bottom ends of the
i fuel rod.
c. Fuel Assembly Structure,
1
(1) General
The fuel assembly shown in Figure 3-62 is the canned type.Eight spacer grids and four perforated can panels formthe basic structure. The panels are velded together at
| the corners for the entire length. The spacer grids are~
! velded to the panels, and the lover and upper end fittingsare velded to the panels to complete the structure. Theupper end fitting is not attached until the fuel rods,
000002223-w
. -
- w
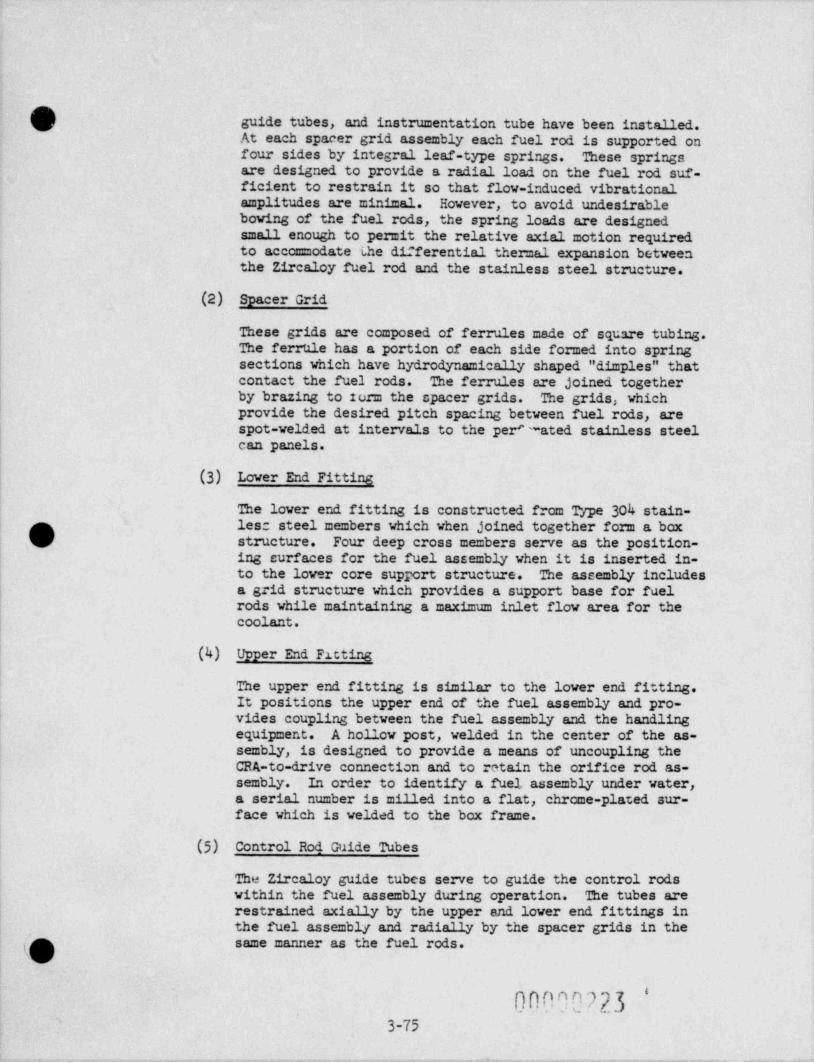
.
|
O suide tude , = 1= tr# e=t *1o= *=de h ve dee= 1= t 11 a.~
At each spacer grid assembly each fuel rod is supported onfour sides by integral leaf-type springs. These. springsare designed to provide a radial load on the fuel rod suf-
ficient to restrain it so that flov-induced vibrationalamplitudes are minimal. However, to avoid undesirablebowing of the fuel rods, the spring loads are designedsmall enough to permit the relative axial motion requiredto accommodate the differential thermal expansion betweenthe Zircaloy fuel rod and the stainless steel structure.
.(2) Spacer Grid
These grids are composed of ferrules made of square tubing.The ferrule has a portion of each side formed into springsections which have hydrodynamically shaped " dimples" that
| contact the fuel rods. The ferrules are joined togetherby brazing to Iorm the spacer grids. The grids, whichi
'
provide the desired pitch spacing between fuel rods, arespot-velded at intervals to the per' ~ated stainless steelcan panels.
!
| (3) Lover End Fitting
The lover end fitting is constructed from Type 304 stain-p les: steel members which when joined together form a boxk structure. Four deep cross members serve as the position-
|
'
ing curfaces for the fuel assembly when it is inserted in-to the lover core support structure. The assembly includesa grid structure which provides a support base for fuelrods while maintaining a maximum inlet flow area for thecoolant.
(4) Upper End htting
The upper end fitting is similar to the lover end fitting.It positions the upper end of the fuel assembly and pro-
| vides coupling between the fuel assembly and the hmM14ngequipment. A hollow post, velded in the center of the as-sembly, is designed to provide a means of uncoupling theCRA-to-drive connection and to retain the orifice rod as-sembly. In order to identify a fuel assembly under water,a serial number is milled into a flat, chrome-plated sur-face which is velded to the box frame.
(5) Control Rod Guide Tubes
The Zirealoy guide tubes serve to guide the control rodswithin the fuel assembly during operation. The tubes arerestrained axially by the upper and lover end fittings in
|,
the fuel assembly and radially by the spacer grids in thesame manner as the fuel rods.
. -
Onn00723'
3-75
. . - _ . - . - - - . . - - . . - . - - - - . . . .-.- . .- . . . . - -
3 2.4.2.2 Evaluation ga. Fuel Rod Assembly
(1) General
The basis for the design of the fuel rod is discussed in 3 1.E 4.Materials testing and actual operation in reactor service withZircaloy cladding has demonstrated that Zircaloy-4 material hassmple corrosion resistance and sufficient mechanical prcpertiesto maintain the integrity an,i serviceability required for designburnup.
(2) Clad Stress
Stress analysis for cladding is based on several conservativeassumptions that make the actual margins of safety greater thancalculated. For example, it is assumed that the clad with thethinnest vall and the greatest ovality permitted by the specifi-cation is operating in the region of the core where performancerequirements are severest. Fission gas release rates, fuelgrowth, and changes in mechanical properties with irradiationare based on a conservative evaluation of currently availabledata. Thus, it is unlikely that significant failure of the clad-ding vill result during operation.
The actual clad stresses are considerably below the yield strength. $
Circu=ferential stresses due to external pressure, calculated husing those combinations of clad dimensions, ovality, and eccen-tricity that produce the highest stresses, are shown in Table3-19 The maximum stress of 33,000 psi compression, at the de-sign pressure of 2,500 psi, is the sum of 22,000 psi compressivemembrane stress plus 11,000 psi compressive bending stress dueto ovality at the clad OD in the expansion void, and at the be-ginning-of-life. The maximum stress in the heat-producing zone
; is 32,000 psi at design pressure, 27,000 psi at operating pres-1 sure. At this stress, the material may creep sufficiently to
allow an increase in ovality until further creep is restrainedby support from the fuel. Contactloadsontheorderof20lb/in, of length are sufficient to counteract the bending stress.Creep collapse tests have indicated a long time collapse resis-tance in excess of the requirement to prevent collapse in the
I end void. As the fuel rod internal pressure builds up with time,these stresses are reduced.
Late in life, the fuel rod internal pressure exceeds the systempressure, up to a maximum difference of 1,110 psi. The resul-tant circumferential pressure stress of 9,000 psi is about 1/4of the yield strength and therefore is not a potential source
| of short time burst. The possibility of stress-rupture burst! has been investigated using finite-difference methods to esti-
| mate the long time effects of the increasing pressure on thei clad. The predicted pressure-time relationship produces stresses| that are less than 1/3 of the stress levels that would produce h
3-76 Nb h')24_
,w 9w, p- w w--- +-h - y ~ - ,, ,
1
N' stress rupture at the end.of-life. Outpile stress-rupture data
were used, but the greater than 3:1 margin on stress is :norethan enough to account for decreased stress-rupture strengthdue to irradiation. Clad circumferential stresses are listed
in Table 3-19
The free gas content of the fuel rod is calculated by consider-- ing (1) initial helium fill gas, (e) initial water vapor andatmospheric gases adsorbed on the fuel, and (3) fission productgases. 'Ihe water vapor present initially is expected to disso-ciate over the life of the fuel and enter into hydriding and;
| oxidizing reactions. The gas remaining at the end-of-life, when'
the maximum internal pressures exist, consists of the atmosphericgases and helium present initially plus the released-fissiongases.
The fission gas production is evaluated for a range of neutronfluxeg and the fissionable material present over the life of thefuel.(54) A design value for gas production has been determinedas 0.29 atoms of gas per fission.
O
O00000225
_ . . ..
#
3-Tl.,.__ _ _ _ .- . _ _._,. _ . - _ . . , . . _ . _ . . _ . . _ - . _ . . _ . . _ _ . . . . _ - . _ . _ _ - - _ ._
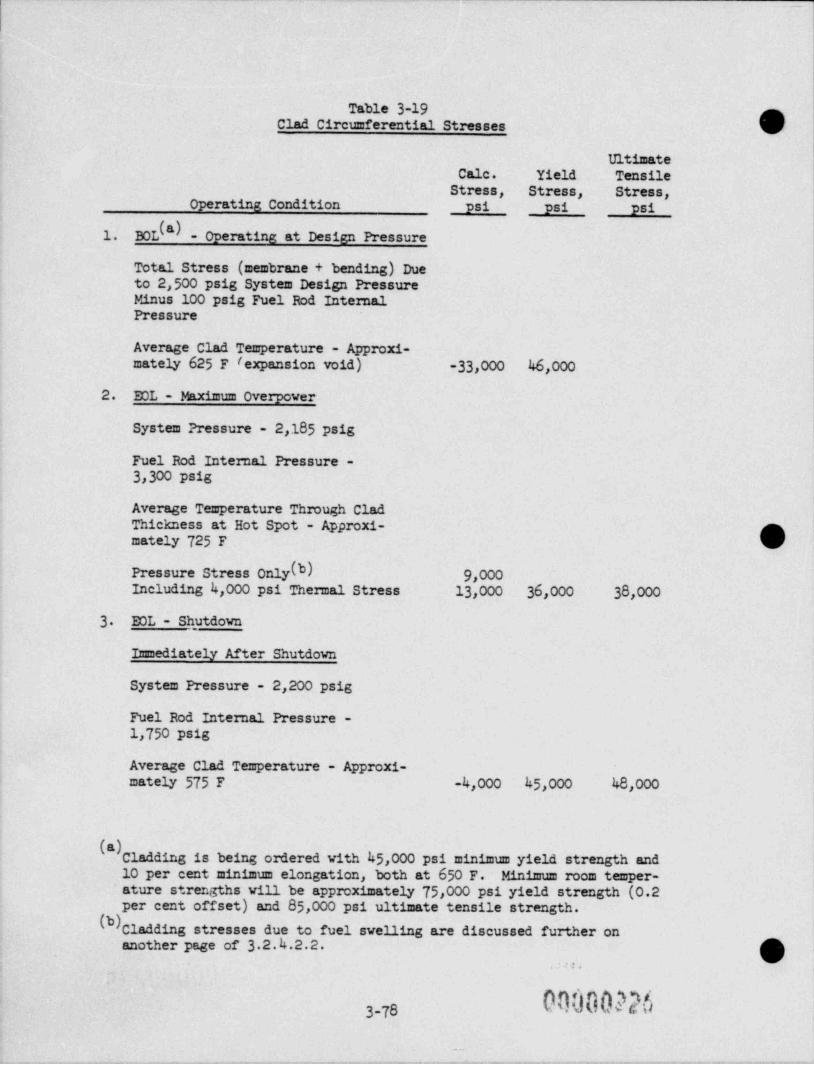
._
Table 3-19Clad Circumferential Stresses
UltimateCalc. Yield Tensile
Stress, Stress, Stress,Operating Condition psi psi psi
BOL(") - Operating at Design Pressure1.
Total Stress (membrane + bending) Dueto 2,500 psig System Design PressureMinus 100 psig Fuel Rod InternalPressure
Average Clad Temperature - Approxi-mately 625 F Iexpansion void) 33,000 46,000-
2. EOL - Maximum Overpower
System Pressure - 2,185 psig
Fuel Rod Internal Pressure -3,300 psis
Average Temperature Through CladThickness at Hot Spot - Approxi- gmately 725 F W
Pressure Stress Only(b) 9,000Including 4,000 psi Themal Stress 13,000 36,000 38,000
- 3 EOL - Sh_utdown
Immediately After Shutdown
System Pressure - 2,200 psig
Fuel Rod Internal Pressure -1,750 psig
Average Clad Temperature - Approxi-mately 575 F 4,000 45,000 48,000-
(a) Cladding is being ordered with 45,000 psi minimum yield strength and10 per cent minimum elongation, both at 650 F. Minimum room temper-ature strengths vill be approximately 75,000 psi yield strength (0.2per cent offset) and 85,000 psi ultimate tensile strength.
( ) Cladding stresses due to fuel swelling are discussed further onanother page of 3 2.4.2.2. g
: .
3-78
.__
-w .w - o- -w -- y--- -- ,r-r - *rr----+ tn e --=w -we --'s * w -*
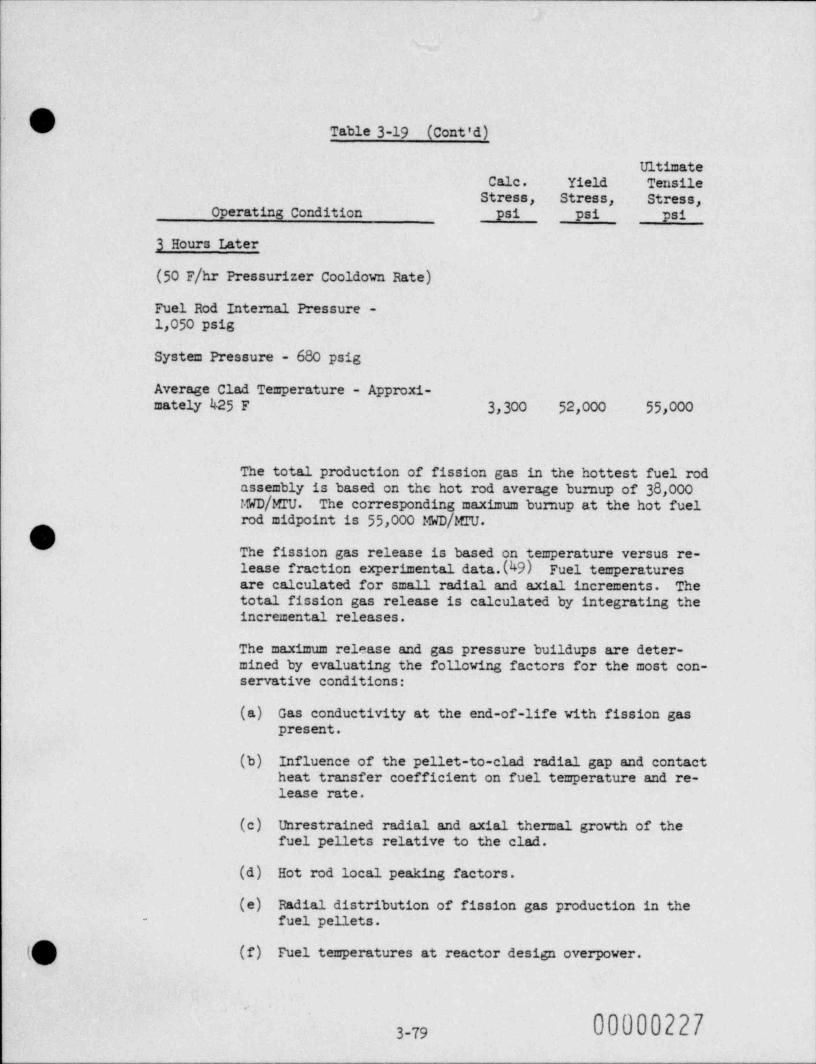
I
,
Table 3-19 (Cont'd)
UltimateCalc. Yield Tensile
Stress, Stress, Stress,operating Condition psi psi psi
3 Hours Later
(50F/hrPressurizerCooldownRate)
Fuel Rod Internal Pressure -1,05o psig
System Pressure - 680 psig
Average Clad Temperature - Approxi-mately 425 F 3,300 52,000 55,000
The total production of fission gas in the hottest fuel rodassembly is based on the hot rod average bumup of 38,000WD/MrU. The corresponding maximum burnup at the hot fuelrod midpoint is 55,000 WD/MrU.
O The fission gas. release is based on temperature versus re-lease fraction experimental data.(49) Fuel temperaturesare calculated for small radial and axial increments. Thetotal fission gas release is calculated by integrating theincremental releases.
The maximum release and gas pressure buildups are deter-mined by evaluating the following factors for the most con-servative conditions:
(a) Gas conductivity at the end-of-life with fission gaspresent.
(b) Influence of the pellet-to-clad radial gap and contactheat transfer coefficient on fuel temperature and re-lease rate.
(c) Unrestrained radial and axial thermal growth of thefuel pellets relative to the clad.
(d) Hot rod local peaking factors.
(e) Radial distribution of fission gas production in the- fuel pellets.
(f) Fuel temperatures at reactor design overpower.
' ~
000002273 79
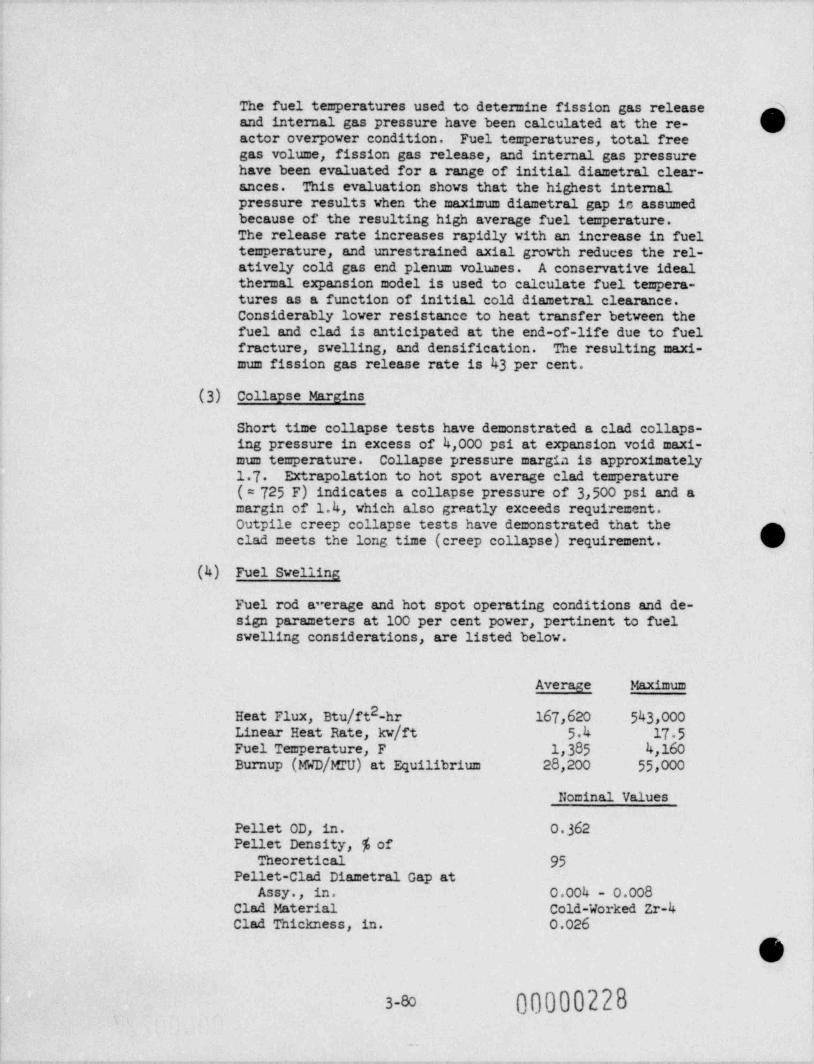
The fuel temperatures used to determine fission gas release Nand internal gas pressure have been calculated at the re-actor overpower condition. Fuel temperatures, total freegas volume, fission gas release, and internal gas pressurehave been evaluated for a range of initial diametral clear-ances. This evaluation shows that the highest internalpressure results when the maximum diametral gap in assumedbecause of the resulting high average fuel temperature.The release rate increases rapidly with an increase in fueltemperature, and unrestrained axial growth reduces the rel-atively cold gas end plenum volumes. A conservative idealthermal expansion model is used to calculate fuel tempera-tures as a function of initial cold diametral clearance.Considerably lower resistance to heat transfer between thefuel and clad is anticipated at the end-of-life due to fuelfracture, swelling, and densification. The resulting maxi-mum fission gas release rate is 43 per cent.
(3) Collapse Margins
Short time collapse tests have demonstrated a clad collaps-ing pressure in excess of 4,000 psi at expansion void maxi-zum temperature. Collapse pressure margia is approximately17 Extrapolation to hot spot average clad temperature( = 725 F) indicates a collapse pressure of 3,500 psi and amargin of 1.4, which also greatly exceeds requirement. s
Outpile creep collapse tests have demonstrated that theclad meets the long time (creep collapse) requirement.
(4) Fuel Svelling
Fuel rod a"erage and hot spot operating conditions and de-sign parameters at 100 per cent power, pertinent to fuelswelling considerations, are listed below.
Average Maximum
2HeatFlux, Btu /ft-hr 167,620 543,000LinearHeatRate,kv/ft 5.4 17 5
| Fuel Temperature, F 1,385 4,160Burnup (IGD /MI'U) at Equilibrium 28,200 55,000
Nominal Values
Pellet OD, in. 0 362| Pellet Density, % of
Theoretical 95Pellet-Clad Diametral Gap at
Assy., in. 0.004 - 0.008Clad Material Cold-Worked Zr-4Clad Thickness, in. 0.026
93-80 00000228
_
w- + y-w.- -- ,- p -a-1s 7 ay- ,-----e.y - ,e - - , -- -
. - . . -.
1
l
The capability of Zircaloy-clad 002 fuel in solid rod formto perfom satisfactorily in PWR service has been amply .demonstrated through operation of the CVTR and Shippingportcores, and through results of their supplementary develop-ment programs, up to approximately 40,000 !WD/)EU.
As outlined below, existing experimental information sup->
ports the various individual design parameters and oper-ating conditions up to and perhaps beyond the maximumburnup of 55,000 MWL/IEU, but not in a single experiment.However, the LRD irradiation test program, currently in
. progress, does combine the items of concern in a singleexperiment, and the results are expected to be availableto contribute to final design' confirmation.
(5) Application of Experimental Dtta to Design Adequacy of theClad-Fuel Initial Gap to Accommodate Clad-Fuel DifferentialThermal Expansion
Experimental Work
Six rabbit capsules, each containing three Zr-2 clad rods
Test Reactor (45) gth, vere irradiated in the Westinghouseof 5 in. fuel lenatpowerlevelsupto24kv/ft. The 94
per cent theoretical density (T.D.) UO2 pellets (0.430 OD)
O had initial clad-fuel'diametral gaps of 6, 12, and 25 mils.t' No dimensional changes were observed. Central melting oc-
curred at 24 kv/ft only in the rods that had the 25 milinitial gap.
Two additional capsules were tested.(53) The specimenswere similar to those described above except for lengthand initial gap. Initial gaps of 2, 6, and 12 mils wereused in each capsule. In the A-2 capsule, three 38-in.-longrodswereirradiatedto3,450 MWD /)CUat19kv/ftmaximum. In the A-4 capsule, four 6-in.-long rods wereirradiated to 6,250 MWD /}EU at 22.2 kv/ft maximum _. Nocentral melting occurred in any rod, but diameter in-creases up to 3 mils in the A-2 capsule and up to 1 5 milsin the A-4 capsule were found in the rods with the 2 milinitial' gap.
Application
In addition to demonstrating the adequacy of Zircaloy-cladUO2 pellet rods to operate successfully at the power' levelsof interest (and without central melting), these experimentsdemonstrate that the design initial clad fuel. gap of 4 to 8mils is adequate to prevent unacceptable clad diameter in-crease due to differential themal expansion between theclad and the fuel. A maximum local diametral increase of
O. less than 0.001 in. is indicated for fuel rods having theminimum initial gap, operating at the maximum overpowercondition. \*
'
000002293-81
!! . - . . _ , , , _ ._ ~..- r_ _.. _ . _ _ , . . . . . _ _ _ . . . . . - . . _ _ _ , . . _ _ , . . . _ . _ _ , _ , . . . . . . . . . _ _ _ _ . , . _ , . . . _ , _ . _ ,
(6) Adequacy of the Available Voids to Accommodate Differential - '
Expansion of Clad and Fuel, Including the Effects of FuelSvelling
Experimental Work
Zircaloy-clad, UO2 pellet-type rods have performed success-fully in the Shippingport reactor up to approximately 40,000wD/Mru.
Bettis Atomic Power Laboratory (53) has irradiated plate-type UO2 fuel (96-98 per cent T.D.) up to 127,000 MWD /MrUand at fuel center temperatures between 1,300 and 3,800 F.This work indicates fuel swelling rates of 0.16% AV/1020f/cc until fuel internal voids are filled, then 0 7% AV/1020 f/ccafterinternalvoidsarefilled. This point of" breakaway" appears to be independent of temperature overthe range studied and dependent on clad restraint and thevoid volume available for collection of fission products.The additional clad restraint and greater fuel plasticity(from higher fuel temperatures) of rod-type elements tendto reduce these swelling effects by providing greater re-sistance to radial swelling and lover resistance to longitu-dinal swelling than was present in the plate-type test speci-mens.
This is confirmed in part by the work of Frost, Bradbury, gand Griffiths of Harwell(56) in which 1/4 in. diameter UO2 Wpellets clad in 0.020 in. stainless steel with a 2 mil
diametral gap were irradiated to 53,300 WD/Mru at a fuelcenter temperature of 3,180 F vithout significant dimensionalchange.
In other testing (57) 0. '.50 in. OD, 82-96 per cent T.D. oxidepellets (20 per cent Pu, 80 per cent U) clad with 0.016 in,stainless steel with 6-8 . ail diametral gaps have been irra-diated to 77,000 MWD /MrU at fuel temperatures high enoughto approach central melting without apparent detrimentalresults. Comparable results were obtained on rods svaged,
( to 75 per cent T.D. and irradiated to 100,000 WD/MrU.
Application
l Based on the BAPL experimental data, swelling of the fuelI rods is estimated as outlined below.
Fuel is assumed to swell uniformly in all directions. Clad-pellet differential themal expansion is calculated to be,
! about 0.004 in. at the maximum linear heat rate, so thatall of the minimum initial gap of 0.004 in, is filled upby themal expansion. If the initial gap exceeds the mini-mum, the additional gap volume is assumed available to
jaccommodate swelling. This additional void volume may ginitially tend to be filled by pellet themal expansion W
0000023033,
_
i
because of the low contact pressure and resultant low con- ,
tact coefficient, but as the fuel swells, the contact pres- )sure must increase if the clad is to be stretched. Where I
'
-fuel cracking tends to fill the radial gap, it is assumed |that the crack voids are available to absorb swelling.
The external effect of fuel swelling is assumed to occurat 0.16% AV/1020 f/ccuntilthe5percentinitialvoidinthe 95 per cent T.D. pellets is filled at about 9 x 10²⁰f/cc. From that time on, swelling is assumed to take placeat 0 7% AV/1020 f/cc until the maximum burnup of 13 6 x10²⁰ r/ce (55,000 WD/Mru) is reached. Total fuel volumeincreaseis4-1/2 percent,whichresultsina1-1/2percent diameter increase in a rod with the 0.004 in. mini-mum initial gap. Clad stress is estimated at 22,000 psi,so that the elastic strain is about 0.2 per cent. Netplastic strain is 1 3 per cent. similar calculations indi-cate that fuel rods with maximum burnup and the nominalclad-fuel gap (0.006 in, at assembly) will have clad plasticstrains of about 0.6 per cent at the end-of-life. Based on-outpile data, stress rupture should not be a problem atthese strains.
Qualitative information from ISBR(30) suggests that' swell-ing rates for this design may exceed those indicated by the
O BAPL data because of the higher fuel temperatures. However,the A.E.R.E. tests (56) and the General Electric tests (57)ts
do not support more than a small increase in post " break-away" swelling rates at temperatures of interest.
Fuel Swelling Studies - LRD Irradiation Program (59)
.Dimensional stability of UO2 under inpile conditions simu-
| lating large reactor environments is under investigation.This study is currently being carried out under USAEC Con-tract AT(30-1)-3269, "Large Closed-Cycle Water ReactorResearch and Development Program".
Parameters contributing to swelling are burnup, heat rating,fuel density and grain size, and clad restraint. These aresystematically being studied by irradiating a series ofcapsules containing fuel rods. These experiments were as-signedbytheAECtoETR/MIR. Test variables are shown inTable 3-20.
' O-
..
P 00000231|l- 3-83|'
-. . . _ . . - . . . . . . . - . . . . - _ _ _ . . . . . . . _ . _ . .
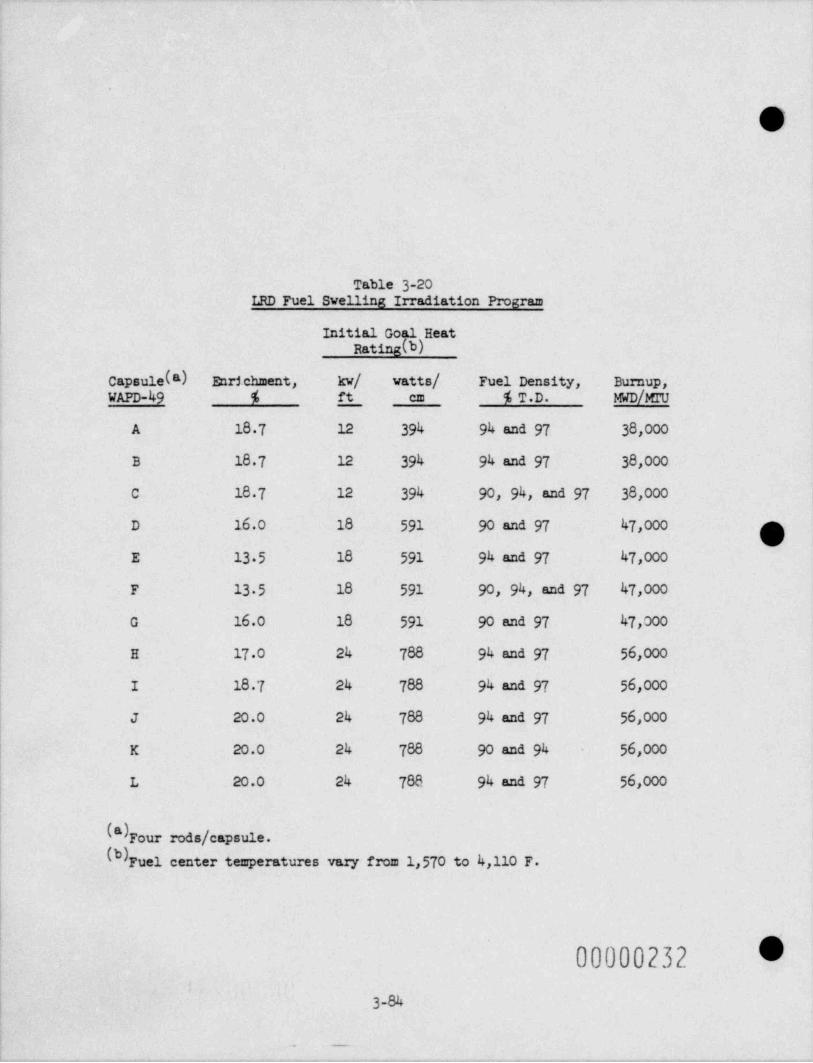
.-
O
i| Table 3-20l LRD Fuel Swelling Irradiation Program
Initial coal HeatRating (b)
capsule (a) Enrichment, kv/ vatts/ Fuel Density, Burnup,WAPD-49 % ft em % T.D. MWD /MrU
A 18 7 12 394 94 and 97 38,000
B 18 7 12 394 94 and 97 38,000
c 18 7 12 394 90, 94, and 97 38,000
D 16.0 18 591 90 and 97 47,000 gE 13 5 18 591 94 and 97 47,000
F 13 5 18 591 90, 94, and 97 47,000
o 16.0 18 591 90 and 97 47,000
H 17.o 24 788 94 and 97 56,000
| I 18 7 24 788 94 and 97 56,000|'
J 20.0 24 788 94 and 97 56,000
K 20.0 24 788 90 and 94 56,000
L 20.0 24 788 94 and 97 56,000
l
("Fourrods/ capsule.( } Fuel center temperatures vary from 1,570 to 4,110 F.
00000232 Y3-84
,
,
o m
1- . . .-. .- . . .. . - - . .-_ , .-
1
)
r'
. (_)/.
Effect of Zircaloy Creep
The effect of Zircaloy creep on the amount of fuel rod growthdue to fuel swelling has been investigated. Clad creep has theeffect of producing a nearly constant total pressure on the cladID by permitting the clad diameter to increas9 ag the fuel di-ameter increases. Based on out-of-pile data, tN1 1 per centcreep will result in 10,000 hr (corresponding approximately tothe end-of-life diametral swelling rate) from a stress of about22,000 psi at the = 720 F average temperature through the cicdat the hot spot. At the start of this high swelling period(roughlythelast1/3ofthecorelife),thereactorcoolantsystem pressure would more or less be balanced by the rod in-ternal pressure, so the total pressure to produce the clad stressof 22,000 psi vould have to come from the fuel. Contact pres-sure would be 2,400 psi. At the end-of-life, the rod internalpressure exceeds the system pressure by about 1,100 psi, so theclad-fuel contact pressure would drop to 1,300 psi. Assumingthat irradiation produces a 3:1 increase in creep rates, theclad stress for 1 per cent strain in 10,000 hr would drop toabout 15,000 psi. Contact pressures would be 1,800 psi at thebeginning of the high.svelling period, 700 psi at the end-of-life. Since the contact pressure was assumed to be 825 psi incalculating the contact coefficient used to determine the fuelpellet thermal expansion, there is only a short period at the
/~ very end-of-life (assuming the 3 1 increase in creep rates dueb--} to irradiation) when the pellet is slightly hotter than calcu-
lated. The effect of this vould be a slight increase in pelletthermal expansion and therefore in clad strain. Considering the
improbability that irradiation vill actually increase creep ratesby 3:1, no change is anticipated.
b. Overall Assembly
(1) Assurance of Control Rod Assembly Free Motion
The 0.058 in. dia=etral clearance between the control rod guidetube and the control rod is provided to cool the control rod andto insure adequate freedom to insert the control rod. As indi-cated below, studies have shown that fuel rods vill not bow suf-ficiently to touch the guide tube. Thus, the guide tube vill notundergo deformation caused by fuel rod bowing effects. Initiallack of straightness of fuel rod and guide tube, plus other ad-verse tolerance conditions, conceivably could reduce the 0.083in. nominal gap between fuel rod and guide tube to a minirum ofabout 0.045 in., including amplification of bowing due to axialfriction loads from the spacer grids. The maximum expected fluxgradient of 1.176 across a fuel rod vill produce a temperaturedifference of 12 F, which will result in a thermal bow of lessthan 0.002 *in. Under these conditions,
O 00000233.
3-85!
_ _ . , _ _ . . m-._. . - _ - . . . , - - _ _ _ -- _
for the fuel rod to touch the guide tube, the thermal gradient
across the fuel rod diameter would have to be on the order of300 F.
OThe effect of a DNB occurring on the side of a fuel rod adja-cent to a guide tube vould result in a large temperature differ-ence. In this case, however, investigation has shown that theclad temperature would be so nigh that insufficient strengthwould be available to generate a force of sufficient magnitudeto cause a significant deflection of the guide tube. In addi-tion, the guide tube would experience an opposing gradient thatwould resist fuel rod bowing, and its internal cooling wouldraintain temperatures much lower than those in the fuel rodcladding, thus retaining the guide tube strength.
(2) Vibration
The semiempirical expression developed by Burgreen was usedto calculate the flow-induced vibratory anplitudes for the fuelassembly and fuel rod. The calculated amplitude is 0.010 in.for the fuel assembly and less than 0.005 in. for the fuel rod.The fuel rod vibratory amplitude correlates with the measuredamplitude obtained from a test on a 3 x 3 fuel rod assembly.In order to substantiate what is believed to be a conservativelycalculated a=plitude for the fuel assembly, a direct measure-ment will be obtained for a full-size prototype fuel assemblyduring testing of the assenbry in the Control Rod Drive LineFacility (CRDL) at the B&U Research Center, Alliance, Ohio.
(3) Demonstration |hIn addition to the specific items discussed above, the overallmechanical performance of the fuel assembly and its individualcomponents is being demonstrated in an extensive experinentalprogram in the CRDL.
3.2.h.3 Control Rod Drive System
3.2.h.3.1 Description 7
The control rod drive system includes drive mechanisms which actuate controlrod assemblies and axial power shaping rod assemblies , drive controls, p;versupplies , position indication, operating panels and indicators , safetydevices, enclosures, housings, and mountings. Criteria applicable to drivemechanisms for both control rod assemblies and axial power shaping rodassemblies are given in 3.2.h.3.1.1. Additional requirements for the mechanismswhich actuate only control rod assemblies are given in 3.2.h.3.1.2.
3 2.h.3.1.1 General Design Criteria
00 flo' n 2 3 A'a. Sincle Failure ' v
No single failure shall inhibit the trotective action of the con-trol rod drive system. The effect of a single failure shall he. limited to one control rod drive.
O
3-86 (Revised 7-15-69)
__.
l
;i y-
i fO b. | Uncontrolled Withdrawal
-Ho single; failure or chain of failures shall cause uncontrolled 7~ withdrawal .of any control ' rod assembly (CRA).
.c. Ecuinment Removal-
The disconnection of plug-in. connectors , modules , and subassemblies -- from the ' protective circuits shall be annunciated or shall cause areactor trip.
d. Position Indication
Continuous position indication, as well as an upper and lower posi-tion limit indication, shall be provided for esch control rod drive.The accuracy. of the position indicators shall be consistent withthe tolerance set by reactor safety analysis,
e. System Monitoring
The control rod drive control system shall include provisions formonitoring conditions tnat are- important t safety and reliability.These include rod position deviation and power supply voltage,
f. Drive Sneed
N' The control rod drive control system shall provide for. single uni-form speed of the mechanism. The drive controls , or. mechanismand motor combination, shall have an inherent speed limiting. fea-ture. The speed of.the mechanism shall be 30 in./ min for bothinsertion and withdrawal. The withdraval speed shall be limitedso as not to exceed 25 per cent overspeed ir. the event of speedcontrol fault.
g. Mechanical Stons
Each control rod drive shall have mositive mechanical stops at'i
both ends of the stroke or travel. The stons shall be capable ofreceiving the full operating force of the mechanisms without fail-ure.
3.2.4.3 1.2 . Additional Design Criteria
The following criteria are applicable only to the mechanisms which actuatecontrol rod assemblies.
a. CRA Positionine
The control rod drives shall provide for controlled withdrawal orinsertion of the control rod assemblies (CRA) out of, or into,the reactor core to establich and hold the cover level required.
j 'l The drivi s are' also capable of rapid insertion or trip for emergency';
- reactor c:nditions.' Y$ !I:|,
00000235'3-87 (Revised 7-15-69)'
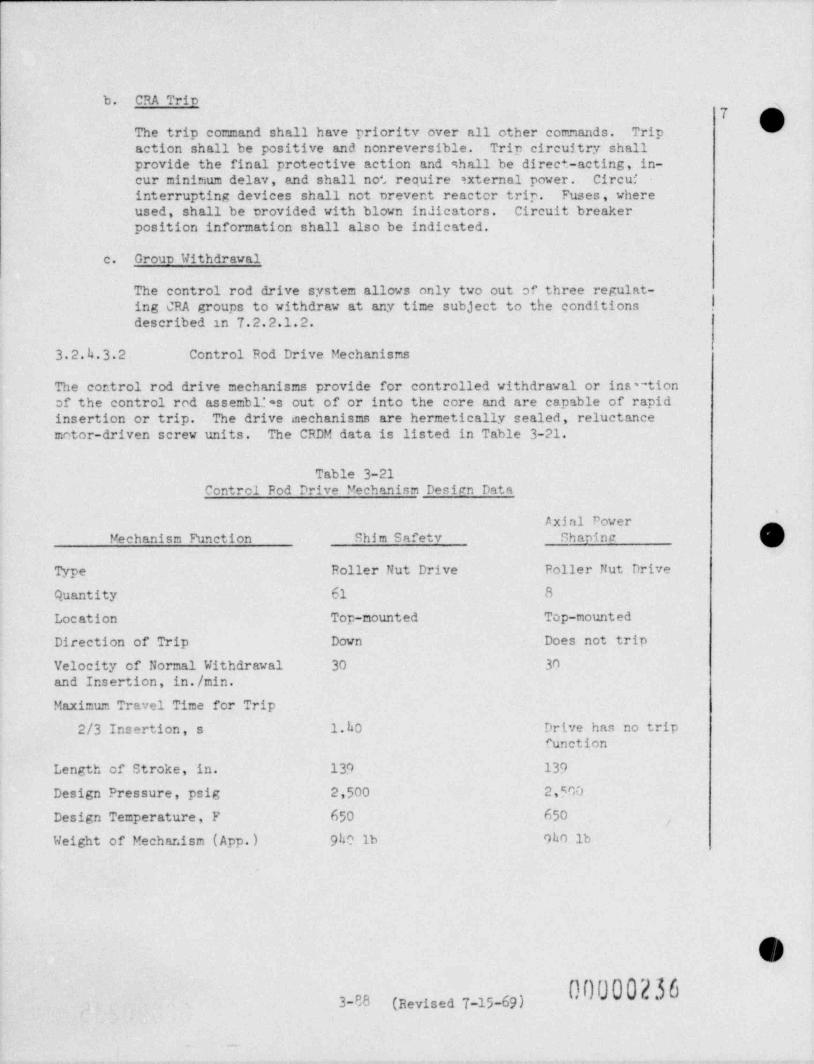
b. CRA Trin ,
7 gThe trip command shall have priority over all other commands. Tripaction shall be positive and nonreversible. Trip circuitry shallprovide the final protective action and shall be direct-acting, in-cur minimum delav, and shall not require external power. Circui
interrupting devices shall not prevent reacter trip. Fuses, whereused, shall be urovided with blown indicators. Circuit breakerposition information shall also be indicated,
c. Groun Withdrawal
The control rod drive system allows only two out of three regulat-ing CRA groups to withdraw at any time subject to the conditions !described in 7.2.2.1.2.
3 2.h.3.2 control Rod Drive Mechanisrm
The control rod drive mechanisms provide for controlled withdrawal or ins-~ tionof the control red assemb12-s out of or into the core and are capable of rapidinsertion or trip. The drive mechanisms are hermetically sealed, reluctancemotor-driven screw units. The CRDM data is listed in Table 3-21.
Table 3-21Control Pod Drive Mechanism Desien Data
Axial Power
hMechanism Punction Shim Safety Shapine
Type Roller Nut Drive Poller Nut Drive
Quantity 61 8
Loc ation Top-mounted Top-nounted
Direction of Trip Down Does not trip
Velocity of Normal Withdrawal 30 30and Insertion, in./ min.
Maximum Travel Time for Trip
2/3 Insertion, s 1.h0 Drive has no trip
function
L;ngth of Stroke, in. 139 139
D; sign Pressure, psig 2,500 2,500
D: sign Temperature, F 650 650 ,
Weight of Mechar. ism ( App. ) 9ho lb 9ho Ib
_
O000002*363-88 (Revised 7-15-69)
_ _
a
+
I
[v~) 3 2.h.3.2.1 Shim Safety Drive vechanisn
The drive mechanism consists of a motor tube which houses a lead screw and itsc rotor assembly and a buffer. The end of the motor tube is closed by a cap andvent assembly. A motor stator is placed down over the motor tube pressure ves-sel, and position indication svitches are arranged outside. the motor tube ex-tension.
The control rod drive output elenent is a translating screw shaft which is cou-pled to the contrcl rod. The screw is driven by an anti-friction nut elementwhich is rotated magnetically by a motor stator located outside the pressureboundary. Current impressed on the stator causes the senarqble nut halves toengage; a mechanical spring causes ~them to disengage the -screw in the absenceof a current. For rapid insertion, the nut separat3s to release the screwshaft which then falls into the core by gravity. A hydraulic buffer withinthe upper housing decelerates the falling assembly to a lov speed a shortdistance above its ftll-in position. The final deceleration- is accommodatedby the down-stop buffer spring.
This mechanism incorporates proven principles and material combinations and isbased on extensive analytical, developmental, design, test, and manufacturingexperience obtained over the years for the Shippingport and ae Naval NuclearProgram.
The control rod drive is shown in Figures 3-6h and 3-65 Subassemblies of thecontrol rod drive are described as follows:
a. Motor Tubeq'# The motor tube is a three-piece velded' assembly designed and manu-
factured in accordance with the requirements of the ASME Code, Sec-tion III, for Class A nuclear pressure vessel. Materials conform toASTM or ASMS, Section II, Material Specifications. All velding shallbe performed by personnel qualified under ASME Code, Section IX,Welding Qualifications. The motor tube vall between the rotor as-sembly and the stator is constructed of magnetic material to presenta small air gap to the motor. This region of the motor tube is oflov alloy steel clad on the inside diameter with stainless steel orwith Inconel. The upper end of the motor tube functions only as apressurized enclosure for the withdrawn lead screw and is made ofstainless steel transition-velded to the upper end of the low alloysteel notor section. The lover end of the lov allov steel tube sec-tion is velded to a stainless steel machined forring which is flanged
| at the face which contacts the vessel control rod nozzle. Double! gaskets , which are separated by a ported test annulus , seal the
flanged connection between the motor tube and the reactor vessel.
b. Motor
The motor is a synchronous relu'tance unit with a slip-on stator. Therotor assembly is described in F tragraph (f). The stator is a h8-slotfour-pole arrangement with water 'ooling coils wound on the outside ofits casing. The stator is encansulated after vinding to establish ahermetically sealed unit. It is six phase star-connected for operationin a pulse-stepping mode and advances 15 mechanical degrees per step.
~
:.('O. The stator assembly is mounted over the motor tube h6t[Mng as shownl_ in Figure 3-65
000.0.02373 89 (Revised 7-15-69)
L
.
.
c. Can and Vent Valve 17 s
The upper end of the motor tube is closed by a cap containing a vaporbleed port and vent valve. The bleed port and vent balve and the cap-to-motor tube closures have double seals. The car is retained by abolting ring threaded to the outside of the notor tube. The retainingbolts are made long so as to be elastic enough te provide positiveseal preload at any assembly temperature fron 20 to 650 F. The jminimum preload is equal to the 3750 psig proof pressure force.
,
Id. Actuator
|
The actuator consists of the translating lead screw, its rotating nutassembly, and the toraue taker assembly on the screw. The actuator
lead screw travel is 130 inches.
e. Lead Screw
The lead screw has a lead of 0.750 in. The thread is double leadwith a single pitch spacing of 0.375 in. Thread lead error is heldto 0.0005 in, maximum in any 6 in. for uniform loading with the roll-er nut assemblies. The thread form is a modified ASMZ vith a flantangle that allows the roller nut to disengage without lifting thescrew.
f. Fotor Assembly
The rotor assembly consists of a bal] bearing supported rotor tubecarrying and limiting the travel of a pair of scissors arms. Eachof the two arms carry a pair of ball bearing supported roller (nut)assemblies which are skewed at the lead screv helix angle for engare-ment with the lead c;t av. The current in the motor stator (two of asix vinding stator) causes the arms that are rivoted in the rotor tubeto move radially toward the motor tube vall to the limit urovidedthereby engaging the four raller nuts with the centrally located leadscrev. Also, four separating springs mounted in the scissor armskeep the rollers disengaged when the power is renoved from the statorcoils. A second radial bearing mounted to the urner end of the rotortube has its outer race pinned to both scissor arms thereby synchro-nizing their motion during engagement and disencarement. 'Jhen a threephase rotating magnetic field is ap;11ed to the motor stator, theresulting force produces rotor assembly rotation.
g. Torcue Extension Tube and Tornue Taker .
The torque extension tube is a separate tubular assembly containinga keyvay that extends the full length of the lead screw travel. Thetube assembly is supported against rotation and in elevation by theupper end of the motor tube extension. The lower end of the tubeassembly supports the buffer and is the down stop. A set of index-ing serrations mate to prevent rotation and orient the toraue exten-sion tube with the motor tube below the can and vent valve assembly.
An integral shoulder at the top of the tube rests against a step inthe motor tube inside diameter to provide a vertiell support.
3-90 (Revised 7-15-69) 00000238__
_
-
.gN,) *
The toraue taker assembly consists _of the position indicator perma- 7nent magnet, the buffer piston, and a positioning key. The torque
' taker key fixed at :the top of the lead screw is mated with' the torqueextension t'.b'e keyvay to provide both radial and. tangential position-ing of'the lead screv.
h. Buffer
The buffer assenbly is canable of decelerating the ' translating mass.fron the unpressurized terminal velocity to zero velocity withoutanplying greater than ten times- the gravitational force on the con-trol rod. -The vater buffer consists of a piston fixed to the topend of the screv shaft and a cylinder which is . fixed to the lover.
end of the toroue extension tube. Twelve inches above the bottomstop, the piston at the top of the screw enters the cylinder. Guid-ing is accomplished because the piston and torque key are in a singlepart, and the cylinder and keyway are in a single mating part. As
the piston travels .into the cylinder, water is driven'into the centerof the lead screw through holes in the upper section which producethe damping pressure drop. The number of holes presented to the buf-fer chamber is reduced as the rod moves into the core, so. that the
danping coefficient increases as the velocity reduces, thereby pro-viding an approximately uniform deceleration. A large helical bufferspring is used to take the kinetic energy of the drive line at the end
rs of the water buffer stroke. The buffer spring accepts a five-foot
(_) per .-cond impact velocity of the drive line and control rod withan inscEataneous overtravel of one inch past the normal down stop.The inclusion of this buffer spring permits practical clearances in
the water buffer.
*
i. Lead Screv Guide
The lead screw guide bushing acts as a primary thermal barrier andas a guide for the screv shaft. As a primary thermal barrier, thebushing allows only a small path for free convection of' vater be-tween the mechanism and the closure head nozzle. Fluid temperature
in the nechanism is largely governed by the flow of water up anddown through this bushing. The diametral clearance between screwshaft and tushing is large enough to preclude jamming the screw shaftand small enough to hold the free convection to an acceptable value.In order to obtain trip travel times of acceptably small values, itis necessary to provide an auxiliary flow path around the guide bush-ing. The larger area path is necessary to reduce the pressure dif-ferential reauired to drive water into the nechanism to equal thescrew displacement. The auxiliary flow paths are closed for smallpressure differentials (several inches of water) by ball check valveswhich prevent the convection flow but open fully during trip.
y3
" J 00000239
:t
3-90a L(Revised T-15-69).
j. Position Indications
7Two methods of position indication are provided; one, an absoluteposition indicator and the other, a relative position indicator. |hThe absolute position transducer consists of a series of magneticallyopertted reed switches mounted in a tube parallel to the motor tubeextension. Each switch is hermetically sealed. Switch contactsclose when a nermanent magnet mounted on the upper end of the leadscrew extension comes in close proximity. As the lead screw (andthe control rod assembly) moves, switches operate sequentiallyproducing an analogue vo]tage proportional to position. .The ac-curacy of the analogue signal is + 1.h 7er cent and produces areadout of approximately + 2 5 per ce. accuracy. Additional reedswitches are included in the same tube with the absolute positiontransducer to provide full withdrawal and insertion signals. Therelative position indicator consists of a small tulse-steppingmotor driving a potentiometer that generates a signal accuracy of+ 0.7% producing a position readout of + 1.7% accuracy. -
k. Motor Tube Desien Criteria
The motor tube 6esign complies with Section III of the ASME Boiler
and Pressure Vessel Code for a Class A vessel. The operating tran-ient cycles, which are considered for the stress analysis of the re-actor pressure vessel, are also considered in the motor tube desirn.
Quality standards relative to material selection, fabricatien, andinspection are specified to $nsure safety function of the housingsessential to accident prevention. Materials conform to ASTM or ASPE,Section II, Material Specifications. All velding shall be perfonned ||by personnel cualified under ASME Code, Section IX, Welding Qualifi-cations. These design and fabrication procedures establish qualityassurance of the assemblies to contain the reactor coolant safely atoperating tenterature and pressure.
In the highly unlikely event that a pressure barrier conronent or thecontrol rod drive assenhly does fail catastrophically, i.e., rupturedcompletely, the following results vould ensue:
1. Control Rod Drive Nozsle
The assembly would be ejected upward as a missile until it wasstopped bv the missile shield over the reactor. This upwardmotion would have no adverse effect on adjacent assemblies.
2. Motor Tube
The failure of this component anywhere above the lover flangeveuld result in a missile-like ejection into the missile shield-ing over the reactor. This upward motion would have no adverseeffect on adjacent mechanisms.
3.2.h.3.2.2 Axial Power Sharing Rod Drive
For actuating the partial length control rods which maintain their set positionduring a reactor-trip of the shin safety drive, the CRDM is modified so thatthe roller nut assembly vill not disengage from the lead screw on a loss ofpower to the stator. Except for this modification, the shin drives and theaxial power shaping rod drives are identice.l. nn
I !! O b. O ? 4 03-90b (Revised 7-Ir.69) ''-
_

__ -- . . - . _ _ - _ _ -
O<
(DELETED)
1
;
Ot
i
!
00000241 :
.
O:.
.
3-91 (Revised T-15_69)
----- _ . _ __ _ _._ _ _____ _ _ __ . _ _ _ _ _ ,
F
7
Paragraph deleted.
3 2.4 3 3 Control Rod Drive System Evaluation
a. Desien Criteria
The system vill be designed, tested, and analyzed for com-pliance with the design criteria. A preliminary safetyanalysis of the control rod drive motor control subsystemwas conducted to determine failures of logic functions. It
was concluded that no single failure in any CRA controlvould prevent CFA insertion, nor cause inadvertent CRAwithdrawal of another CFA or CRA eroup.
b. Materials Selection
Materials are selected to be compatible with, and operatein, the reactor coolant. Certified mill test reports con-taining chemical analysis and test data of all materialsexposed to the reactor system fluid shall be provided andmaintained for the control rod drives. Certificates ofcompliance for other materials and components shall alsobe provided.
c. Relation to Desien Termerature
All parts of. the control rod drive exposed to reactor cool-ant are designed to operate at 650 F, although it is ex-pected that all parts vill operate considerably cooler.Some tests have been completed, and additional tests areplanned, to closely determine the operating temperaturegradients throughout the drive mechanism during all phasesof operation. These tests will also provide an indicationof the amount of convection that takes place within the
water space of the mechanism.
d. Desien Life
The design life of the control rod drive control system isas follows:
00000242
0
3-92 (Revised 7-15-69)
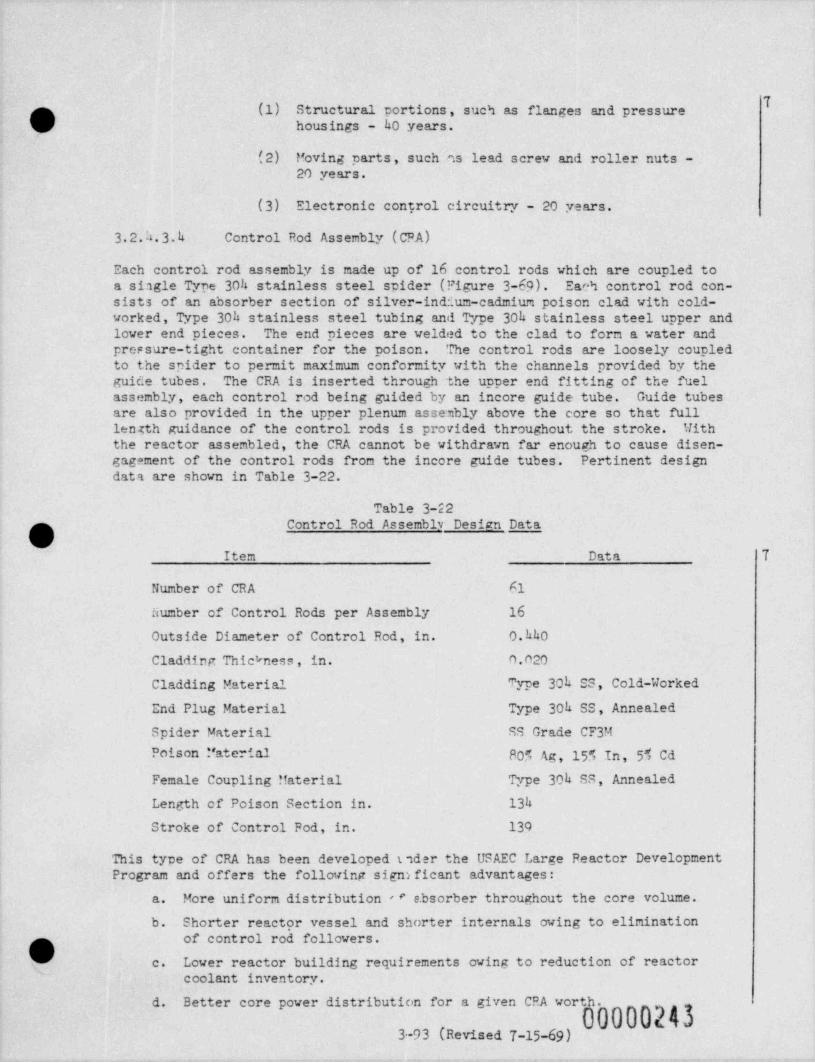
Tp (1) Structural portions , such as flanges and pressure( ) housings - h0 years.
(2) 14oving parts, such ns lead screw and roller nuts -20 years.
(3) Electronic control circuitry - 20 years.
3.2.h.3.h. Control Rod Assembly (CFA)
Each control rod assembly is made up of 16 control rods which are coupled toa single Type 30h stainless steel spider (Figure 3-69). Each control rod con-sists of an absorber section of silver-indium-cadmium poison clad with cold-worked, Type 304 stainless steel tubing and Type 30h stainless steel upper andlover end pieces. The end pieces are velded to the clad to form a water andpressure-tight container for the poison. The control rods are loosely coupledto the spider to permit maximum conformity with the channels provided by theguide tubes. The CRA is inserted through the upper end fitting of the fuelassembly, each control rod being guided by an incore guide tube. Guide tubesare also provided in the upper plenum assembly above the core so that fulllength guidance of the control rods is provided throughout the stroke. Withthe reactor assembled, the CRA cannot be withdrawn far enough to cause disen-gagement of the control rods from the incore guide tubes. Pertinent designdata are shown in Table 3-22.
Table 3-22Control Rod Assembly Design Datap
%JItem Data T
Number of CRA 61
Number of Control Rods per Assembly 16
Outside Diameter of Control Rod, in. 0.hh0
Cladding Thict< ness , in. 0.020
Cladding Material Type 30h SS, Cold-Worked
End Plug Material Type 30h SS, Annealed
Spider Material SS Grade CF3MPoison Paterial 805 Ag, 155 In, 55 Cd
Female Coupling !!aterial Type 30h SS, Annealed
Length of Poison Section in. 134
Stroke of Control Pod, in. 139
This type of CRA has been developed nder the USAEC Large Peactor Development- Program and offers the following sign)ficant advantages:
a. More uniform distribution e e.bsorber throughout the core volume.
b. Shorter reactor vessel and shorter internals owing to eliminationof control rod followers.
N c. Lower reactor building requirements owing to reduction of reactor''
'. coolant inventory.
. d. Better core power distribution for a given CRA vorth.
3-93 (Revised 7-15-69) 000 002 4 3- . . -
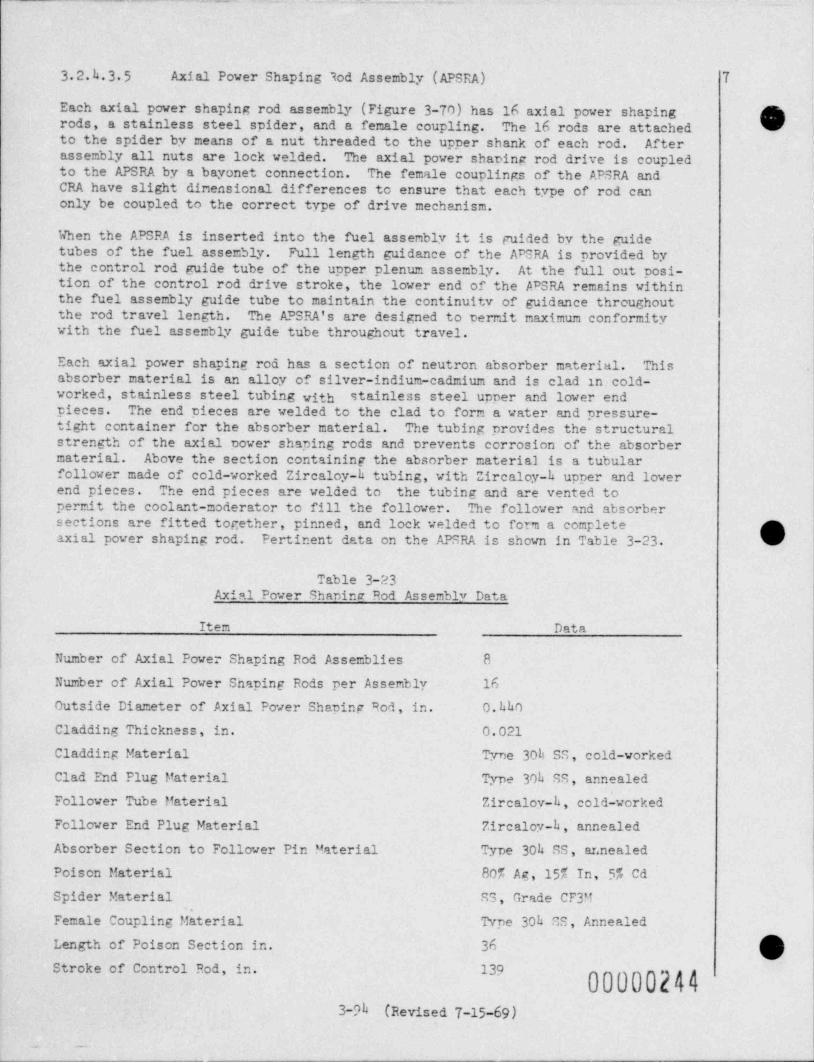
- -n - ~_ .- ~._
3.2.h.3 5 Axial Power Shaping lod Assembly ( APSRA) 7
Each axial power shaping rod assembly (Figure 3-70) has 16 axial power shaping '
rods, a stainless steel spider, and a female coupling. The 16 rods are attachedto the spider by means of a nut threaded to the upper shank of each rod. Afterassembly all nuts are lock velded. The axial power sharing rod drive is coupledto the APSRA by a bayonet connection. The female couplings of the APSRA andCRA have slight dinensional differences to ensure that each type of rod canonly be coupled to the correct type of drive mechanism.
When the APSRA is inserted into the fuel assenbly it is guided by the guidetubes of the fuel assembly. Full length guidance of the APGRA is provided bythe control rod guide tube of the upper plenum assembly. At the full out posi-tion of the control rod drive stroke, the lower end of the APSRA remains withinthe fuel assembly guide tube to maintain the continuity of guidance throughoutthe rod travel length. The A"SRA's are designed to termit maximum conformitywith the fuel assembly guide tube throughout travel.
Each axial power shaping rod has a section of neutron absorber material. Thisabsorber material is an alloy of silver-indium-cadmium and is clad in cold-vorked, stainless steel tubing with stainless steel upper and lower endpieces. The end pieces are velded to the clad to form a water and pressure-tight container for the absorber material. The tubing provides the structuralstrength of the axial power shaping rods and urevents corrosion of the absorbermaterial. Above the section containing the absorber material is a tubularfollower made of cold-worked Zircaloy-h tubing, with Zircaloy h upper and lowercnd pieces. The end pieces are velded to the tubing and are vented topermit the coolant-moderator to fill the follower. The follower and absorber
sections are fitted together, pinned, and lock welded to form a complete gaxial power shaping rod. Pertinent data on the APSRA is shown in Table 3-23. T
Table 3-23Axial Power Shanine Rod Assemb1v Data
Item Data
Number of Axial Power Shaping Rod Assemblies 8
Humber of Axial Power Shaping Rods per Assembly 16
Outside Diameter of Axial Power Shaping Rod, in. 0.hhoCladding Thickness, in. 0.021Cladding Material Tyne 30h SS, cold-workedClad End Plug Material Type 30h SS, annealed
Follover Tube Material Zircalov-h, cold-workedFollower End Plug Material Zircaloy-h, annealedAbsorber Section to Follower Pin Material Type 30h SS , annealed
Poison Material 80% Ag, 15% In, 5% Cd
Spider Material RS, Grade CF3M
Fcrale Coupling M terial Type 30h SS, Annealed
Length of Poison Section in. 36 gStroke of Control Rod, in. 139
000002443-9h (Revised 7-15-69)
_ __
,
.
D's ./ - 7
' These axial power shaping rods are designed to withstand all operatingloads _ including those resulting from hydraulic forces and thermal gradients.
iThe ability of the axial power shaning rod clad to resist collapse due tothe systen nressure has been demonstrated by an extensive collapse test -progran on Zircaloy h tubing. Internal pressure is not generated withinthe clad since the Ag-In-Cd alloy does not yield gaseous products underirradiation. Svelling of the absorber naterial is negligible, and willnot cause unacceptable clad strain.
. Mechanical interference between axial power shaping rods and the ~ fuelassembly gu!de ubes can be tolerated, since the mechanical interferencebetween axial pver shaping rods and the fuel assembly guide tubes mustbe. expected. The parts involved are flexible and result in very smallfriction drag loads. Thernal distortions of the rods are small becauseof the low heat generation and adequate coolinF. Consequently, the APSRA'svill not encounter significant frictional resistance to their. notion in
the guide tubes.
| D, V!
i
l
~
!
!
'
'n 00000245y'
* .
3-pha (Revised 7-15-69)
33 TESTS AND INSPECTIONS
331 NUCLEAR TESTS AND INSPECTION
3 3 1.1 Critical Experiments
An experimental program (65-67)~to verify the relative reactivity worth of theCRA has recently been completed. Detailed testing established the vorth ofthe CRA under various conditions similar to those f - the reference core.These parameters include control rod arrangement in .L CRA, fuel enrichments,fuel element geometry, CRA materials, and soluble boron concentration in themoderator.,
Gross and local power peaking were also studied, and three-dimensional.pover-peaking data were taken as a function of CRA insertion. Detailed peaking datavere also taken between fuel assemblies and around the water holes left bywithdrawn CRA's. The experimental data are being analyzed and will becomepart of the experimental bench mark for the analytical models used in the de-sign.
3 3 1.2 Zero Power, Approach to Power, and Power Testing
Boron worth and CRA vorth (including stuck-CRA vorth) vill be determined byphysics tests at the beginning of each core cycle. Recalibration of boronworth and CRA vorth is expected to be performed at least once during each core
-cycle. Calculated values of boron worth and CRA vorth vill be adjusted to the, 0 test values as necessary. The boron vorth and CRA vorth at a given ti=e in| core life vill be based on CRA position indication and calculated data as ad-i justed by experimental data.
!
The reactor coolant will be analyzed in the laboratory periodically to deter-'
mine the boron concentration, and th- reactivity held in boron vill then becalculated from the concentration and the reactivity worth of boron.
The method of =aintainin6 the hot shutdown margin (hence stuck-CRA margin) isrelated to operational characteristics (load patterns) and to the power-peak-ing restrictions on CRA patterns at power. The CRA pattern restrictions villinsure that sufficient reactivity is always fully withdrawn to provide adequateshutdown with the stuck-CRA margin. Power peaking as related to CRA patternsand shutdown margin vill be monitored by reactivity calculations, and inter-
| locks vill be provided to prevent CRA patterns that produce excessive powerpeakingand/orreductionofshutdownmargin.
Operation under all power conditions will be monitored by incore instrumenta-tion, and the resulting data vill be analyzed and compared with multidimen-sional calculations in a continuing effort to provide sufficient support forfurther power escalations..q
332 THERMAL AND HYDRAULIC TESTS AND INSPECTION
332.1 Reactor Vessel Flow Distribution and Pressure Drop Test
- A 1/6-scale model of the reactor vessel and internals will be tested to measure
| 000002463-95
_ _ _ _ _ _ _ , _ _ _ _ _ _ _.__ _ . _ -. _ _ - _ _ _ ~ , - -,.., _ _ .
||
a. Tha flow distribution to c ch fu;l ass;mbly of the rr.ctor cora and to |
develop, if necessary, devices required to produce the desired flowdistribution.
b. Fluid mixing between the vessel inlet nozzle and the core inlet, and /gbetween the inlet and outlet of the core.
c. The overall pressure drop between the vessel inlet and outlet nozzles,and the pressure drop between various points in the reactor vessel flowcircuit.
The reactor vessel, thermal shield, flow baffle, core barrel, and upper plenumassembly are made of clear plastic to allow use of visual flow study techniques.All parts of the model except the core are geometrically similar to those in theprototype reactor. However, the simulated core was designed to maintain dynamicsimilarity between the model and prototype.
Each of the 177 simulated fuel assemblies contains a calibrated flow nozzle at itsinlet and outlet. The test loop is capable of supplying cold water (80 F) to threeinlet nozzles and hot water (180 F) to the fourth. Temperature vill be measured
in the inlet and outlet no sles of the reactor model and at the inlet and outletof each of the fuel assemblies. Static pressure taps will be located at suitablepoints along the flow path through the vessel. This instrumentation will providethe data necessary to accomplish the objectives set forth for the tests.
3.3.2.2 Fuel Assembly Heat Transfer and Fluid Flow Tests
B&W is conducting a continuous research and development program for fuel assemblyheat transfer and fluid flow applicable to the design of the reference reactor.Single-channel tubular and annular test sections and multiple rod assemblies havebeen tested at the B&W Research Center.The reactor thermal design is based upon burnout heat transfer experiments with 1
(a) multiple rod, heated assemblies with uniform heat flux, and (b) single rod, hannular heaters with nonuniform axial heat flux, at design conditions of pressureand mass velocity. These experiments are being extended to test nonuniform mul-tiple rod heater assemblies as described in 1 5.h. The results of these tests will
be applied to the final thermal design of the reactor and the specification of op-erating limits.
3.3.2.2.1 Single-Channel Heat Transfer Tests
A large quantity of uniform flux, single-channel, critical heat flux data has been| obtained. References to uniform flux data are given in BAW-168 and 3.2.3.2.3 of| this report. The effect on the critical heat flux caused by nonuniform axial
power generation in a tubular test section at 2,000 psi pressure was investigatedas early as 1961.(29) This program was extended to include pressures of 1,000,
6 lb/hr-ft2.(63) The1,500, and 2,000 psi and mass velocities up to 2.5 x 10effect on the critical heat flux caused by differences in the radial and axial
power distribution in an annular test section van recently investigated at reac-tor design conditions.(64) Data were obtained at pressures of 1,000, 1,500, 2,000,
6 lb/hr-ft2,| and 2,200 psi and at mass velocities up to 2.5 x 10
The tubular tests included the following axial heat flux shapes where P/P is localto average pover:
a. Uniform Heat Flux (P/P) = 1.000 constant
b. Sine Heat Flux (T/P) max = 1.396 @ 50% L
00000247 O,
3-96 (Revised 1-15-68)
c. Inlet Peak Heat Flux (P/P) = 1 930 @ 25% L
O d. Outlet Peak Heat Flux (P/E) = 1 930 @ 75% L
Tests of two additional, nonunifom, 72-in. heated length, tubular tests wereundertaken to obtain data for peaking conditions more closely related to thereference design. The additional flux shapes being tested are
a. Inlet Peak Heat Flux (P/5) = 1.65 6 28% L
b. Outlet Peak Heat Flux (P/E)mu = 1.65 @ 72% L
These tests, still in progress, vill cover approximately the same range ofpressure, mass flow, and AT as the multiple rod fuel assembly tests.
3 3 2.2.2 Multiple Rod Fuel Assembly Heat Transfer Tests
Critical heat flux data are being obtained from 6-ft-long, 9-rod fuel assem-blies in a 3 x 3 square array. A total of 513 data points were obtained cover-ing the following conditions:
0 5 T s 250g
1,000 5 P 5 2,400
6 60.2 x 10 5 G 5 3 5 x 10
whereAT = M et s % coo % , Fg
P = pressure, psia
2G = mass velocity, lb/hr-ft
The 6eometry of this section consisted of nine rods of 0.420 in. diameter on a0 558 in. square pitch. Analysis of the last data of this set is in process.
3 3 2.2 3 Fuel Assembly Flow Distribution and Pressure Drop Tests
Flow visualization and pressure drop data have been obtained from a 10-times-full-scale model of a single rod in a square flow channel. These data havebeen used to refine the spacer ferrule designs with respect to mixing turbu-lence and pressure drop.
Flow distribution in a square 4-rod test assembly has been measured. A saltsolution injection technique was used to detemine the average flow rates inthe simulated reactor assembly corner cells, vall cells, and unit cells. In-terchannel mixing was obtained for the same assembly. These data have beenused to confirm the flow distribution and mixing relationships employed in thecore thermal and hydraulic design. Additional mixing, flow distribution, and
,
04 00000248.-
3-97
_ _ _ _ _ _ __ , .__ _ __. _ _
- - .
pressure drop data vill be obtained to improve the core power capability. Thefollowing fuel assembly geometries vill be tested to provide additional data:
9|'
Ia. A 3 x 3 array identical to that for which critical heat flux data
have been obtained to provide additional interchannel mixing data.|
b. A 4 x 6 array divided in half by a perforated plate simulating adja- '
cent fuel assemblies to provide data on mixing between assemblies.
c. A full scale 15 x 15 rod fuel assembly to provide additional flowdistribution, mixing, and pressure drop information applicable to acomplete assembly.
1
(DELETED)
333 FUEL ASSliNBLY, CONTROL ROD ASSEMBLY, AND CONTROL RODDRIVE MiiUHANICAL TESTS AND INSPECTION
To demonstrate the mechanical adequacy and safety of the fuel assembly, con-trol rod assembly (CRA), and control rod drive, a number of functional testshave been performed, are in progress, or are in the final stages of prepara-tion.
@3331 Prototype Testing
A full scale prototype fuel assembly, CRA, and control rod drive is presentlybeing tested in the Control Rod Drive Line (CRDL) Facility located at the B&WResearch Center, Alliance, Ohio.. This full-size loop is capable of simulatingreactor environmental conditions of pressure, temperature, and coolant flow.To verify the mechanical design, operating compatibility, and characteristicsof the entire control rod drive fuel assembly system, the drive vill be strokedand tripped in excess of expected operating life requirements. A portion ofthe testing vill be perfomed with maximum misalignment conditions. Equipmentis available to record and verify data such as fuel assembly pressure drop,
I vibration characteristics, hydraulic forces, etc., and to demonstrate control
| rod drive operation and verify scram times. Al'. prototype ccmponents will beGxa=inedperiodicallyforsignsofmaterialfretting, wear,andvibration/fatigue to insure that the mechanical design of the equipment meets reactoroperating requirements. Preliminary test results are given in 3 2.4 3 5
After the prototype fuel assembly has been tested under simulated reactoroperating conditions, it will be installed in the full-size, low pressure loopto verify specific fuel assembly design data. These data include pressuredrop, coolant interchannel mixing, and coolant velocity profiles.
3332 Model Testing
Many functional improvements have been incorporated in the design of the proto-type fuel assembly as a result of model tests run to date. For example, the g
|
3-98 (Revised 1-15-68) 00000249
!I
_ -. _ . , . - . . . - . - _ , - _ . _ _ _ - - _
p spacer Brid to fuel rod contact area was fabricated to 10 ti=es reactor sizeV and tested in a loop simulating coolant flov Reynolds numbers of interest.
Thus, visuany, the shape of the fuel rod support areas vas optimized with re-spect to mini =1 zing the severity of flow vortices. Also, a 9-rod (3 x 3) ac-tual size model was fabricated (using production fuel assembly materials) andtested at 6h0 F, 2,200 psi, and 13 fps coolant flov. Principal objectives ofthistestweretoevaluatefuelrodcladdin6tospacergridcontactwear,and/or fretting corrosion resulting from flow-induced vibration._ A vide range ofcontact loads (including small clearances) was present in this specimen. Nosignificant wear or other flow-induced da= age was observed after 210 days ofloop operation.
3333 co=ponent and/or Material Testine;
33331 Fuel Rod Claddin6
Extensive short time collapse testing was performed on Zircaloy-4 tube speci-mens as part of the B&W overall creep-collapse testing program. Initial testspecimens were 0.k36 in. OD vith van thicknesses of 0.020 in., 0.024 in., and0.028 in. Ten 8-in.-long specimens of each thickness vere individually testedat 680 F at slowly increasing pressure until collapse occurred. Collapse pres-sures for the 0.020 in. van thickness specimens ranged from 1,800 to 2,200ps18, the 0.024 in. specimens ranged from 2,800 to 3,200 psig, and the 0.028in, specimens ranged from h,500 to 4,900 psig. The material yield strength ofthese specimens ranged from 65,000 to 72,000 psi at room temperature, and was35,800 psi at 680 F.
1"I Additional Zircaloy-4 short t1=e collapse specimens were prepared with a ma-terial yield stress of 78,000 psi at room temperature and 48,500 psi at 615 F.Fif teen specimens having an OD of 0.k10 in, and an ID of 0 365 in. (0.0225 in,nominal vall thickness) were tested at 615 F at increasing pressure until col-lapse occurred. Collapse pressures ranged from h,470 to h,960 psig.
Creep-collapse testing was performed on the 0.h36 in. OD specimens. Twelvespecimens of 0.024 in. vall thickness and 30 specimens of 0.028 in vall thick-ness were tested in a single autoclave at 680 F and 2,050 psig. During thistest, two 0.02h in. van thickness specimens collapsed during the first 30 daysand two collapsed between 30 and 60 days. None of the 0.028 in. vall thicknessspecimens had conapsed after 60 days. Creep-collapse testing was then per-formed on thirty 0.410 in. OD by 0 365 in. ID (0.0225 in. nominal vall) speci-mens for 60 days at 615 F and 2,140 psig. None of these specimens collapsed,and there were no significant increases in ovality after 60 days.
Results of the 60-day, creep-collapse testing on the 0.h10 in. OD specimensshowed no indication of incipient collapse. The 60-day period for creep-collapse testing is used since it exceeds the point of primary creep of thematerial, yet is sufficiently long to enter the ' ye when fuel rod pressurebegins to build up during reactor operation, i.e., past the point of maximumdifferential pressure that the clad would be subjected to in the reactor.
In_ order to help optimize the final clad thickness, additional clad-collapsep testing is scheduled .for 1967 using specimens fabricated to the reference de-s j sign fuel clad dimensidns, material specifications, and operating s.' ~
250.
3-99
-.
-_
3.3.3.3.2 Fuel Assembly Structural Components
The mechanical design of the prototype can panel assemblv is the result ofan extensive can panel design and structural evaluation procram. The full-size, simulated loop, functional testing noted in 3.3.31 is expected toverify can panel design criteria. Prototype static and dynamic load testingis underway to verify can panal structural adequaev for vibration, handling,operation, and seismic loads.
In the mechanical design of the spacer grids , narticular attention is givento the ferrule-to-fuel-rod contact points. Sufficient load must be appliedto position the fuel rods and to minimize fuel rod vibration, yet allowaxial thermal differential expansion, and not produce fretting vear in che fuelrod cladding. Static load and functional testing of the prototvre grids villdemonstrate their adequacy to perform within the design requirements.
c itrol n d Drive Tests and Inspection3.3 3.h or
3.3.3.b.1 Control Pod Drive Developmental Tests
7The prototype roller nut drive is under test at the B&W Research Center,Alliance, Ohio.
Near characteristics of critical components have indicated that naterial com-natibility and structural desiFn of these components vill be adequate for theli fe of the mechanism.
The development program has been ecmpleted and the complete prototype con-trol rod drive is being subjected to environmental testing under simulatedreactor conditions (except radiation) in the Control Rod Drive Line (CRDL)Facility at Alliance. Environmental tests include:
Onerational Tests
nperating speeds.
Temperature profiles.
Trip times for full and partially withdrawn control rod assemblies(CRA) for var $ous flow-induced pressure drops across the CRA.
Life Tests
(Uith internals assembled to maximum misaliennent permitted bydrawing dimensions and tolerances. )
No. of Partial Strohe Span of Control Rod StrokeStroke Cveles Lencth, in. From " Pull-Tn" Desition, in.
1,550 83 From 56 to 1305, hon 50 71 121
8.900 ns 11h 1308,50n 13 126 139
No. of Trip
0000025 O' " *
$00 130 From 0 to 139
3-100 (Revised 7-15-69)
1
|
|
p() Misalignment Tests ,
t100 full strokes and 100 full stroke tries with internals tolerancesaltered to l'.5 times maximum allowable misalignment.
Coupling Tests
Complete check of coupling operations after testing.
The cycles above meet the: total test reauirements of 5,000 full strokes and500 trips. The assembly will be comoletely disassembled and inspected atvarious B&W facilities after completion of environmental' testa.
3 3.3.h.2 Control Rod Drive Control System DevelopmentalTests,
A control rod drive power supply unit has been built in group nrototype
form. Following the combined test of the power supply and mechanisn,thermal, life, and simulated failure tests vill be conducted. The sinulatedfailure test will be designed to verify the safety analvnis.
The control rod drive control system vill be tested in conluction with the con-trol rod drive notor control to insure proper eneratien. cirulated failure test-ing vill also be perforced on the ecmbined systen to insure that protectiverequirements are being met.
() The position indicator and limit switch subsystem has been built in prototypefons and life-tested mechanically under expected environnental conditiens.Further testing, both mechanical and electrical, vill be done under expectedenvironmental conditions at the B&W Pesearch Center. Characteristics to bedetermined will include accuracy, repeatability, linearitv, short termstability, and long term stability.
3 3.3.h.3 Production Tests
Production tests discussed in this section vill be nerforced either on thedrives installed, or. on drives nanufactured to the same snecifications. Thefinished control rod drive vill be proof-tested as a connlete systen, i .e. ,mechanism, motor control, and system control working as a system. Thin proof-testing vill be above and beyond any developnental testing performed in theproduct development stages.
Mechanism production tests vill include
a. Ambient Tests
Coupling tests.
Operating speeds.
.
'
'l 00000252
3-101 (Revised 7-15-69)*
4
_ _ _ _ _ _ _ _ _ _ _ _ _ _ _ _ _ . _ _ _ _ _ _ _ _ . _ _ _ _ _ _ _ _ _ . _ _ _ . _ _ _ _ _ . _ . _ _ _ _ _ _ _ _ . _ _ _ _ _ _ _ _ _ _ _ _ _ _ _ _ _ _ _ _ _ _ _ _ _ _ _ _ _ _ _ _ _ _ _ _ _ _ _ _ _ _ _ _ _ _ _ _ _ . _ _ _ _ _ _ _ _
_-
Position indication..O \Trip tests.
b. Operational Tests
iOperating speeds. |
)Position indication.
Partial and full stroke cycles.
Partial and full stroke trip cycles.|
| Control system production tests will be performed as described in the follow-j ing paragraphs.|
The finished hardware vill be systematically operated through all of its oper-ating modes, checked over the full range of all set points, and checked forproper operation of all patch plugs. This will check completeness and properfunctioning of viring and components.
The operating modes to be checked will include such things as automatic opera-tion, manual group operation, trim or single CM operation, position indicationof all CM's, travel limit on all CM's, trip circuit operations, IN command,01/r command, etc.
The trip circuit or circuits will be tested by repeated operation. The over-all trip time vill be measured.
The accuracy and repeatability of the position indication and limit switch sys-tems vill be tested.
Power supply tests will be performed to detemine the upper and lower operatingvoltage and to prove inrounity to switching transients.
Fault conditions vill be simulated to prove that no unsafe action results fmmdefective components, circuits, or viring. Ability to detect unsafe fault con-ditions at the operating console vill be determined. Typical of faults to be,
| simulated are
i a. Defective limit switch or circuit.| b. Impmper UM group patch.; c. Defective patch plugs.
d. Defective group sequencer.e. Defective clock.f. Defective automatic control signal.g. Defective command line.h. Defective fuses.i. Defective single'CM control circuit or switch.J. Defective povar supply.k. Defective motor translator.1. Defective motor cable.m. .Defectivc g,sition transmitter. 00000253 g
3-102|
l'
- .._. . - .,. . .- . . - - . - . .- - - . . . . - . - , , - . . , , . - - .- ,
-_
() The finished hardware vill be visually inspected for quality of workman-D ship. This inspection vill include an examination of the enclosure,cable entrances, dust-tightness, maintenance features, drawers and cableretractors, fasteners, stiffeners, module counts, wire harnesses, andother similar details.
334 INTERNALS TESTS AND INSPECTIONS
The internals upper and love" plenum hydraulic design vill be evaluatedandguidedbytheresultsfromthe1/6-scalemodelflowtestwhichisde-scribed in detail in 3 3 2.1. These test results vill indicate areas ofgross flow maldistribution and allow verification of vessel flow-pressuredrop computations. In addition, the test results will provide measuredpressure pulses at specific locations to aid in assessing the vibrationresponse characteristics of the internals components.
The effects of internals misalign=ent will be evaluated on the basis of
the test results from the CRDL tests described in 3 3 3 4. These testresults, when correlated with the internals guide. tube final design, villinsure that the CRA vill have the capability for a reactor trip or fastinsertion under all modes of reactor operation in the reactor coolant en-
viron=ent. These tests will not include the effects of neutron flux ex-posure.
After completion of shop fabrication, all internals components will beN shop-fitted and asse= bled to final design requirements. The assembled
internals components will be installed in a mockup of the as-built reac-,
'
ter vessel for final shop fitting and alignment of the internals for themating fit with the reactor vessel. Dummy fuel and CRA's will be used tocheck out and insure that a=ple clearances exist between the fuel and in-ternals structures guide tubes to allow free movement of the CRA through-out its full stroke length in various core locations. Fuel assembly mat-ing fit vill be checked at all core locations. The dummy fuel and CRA'svill be identical to the production components except that they will bemanufactured to the most adverse tolerance space envelope; even thoughthe assembly weights will be representative of the production units, thedu==y components will not contain fissionable or poison materials.
Internals shop fabrication quality centrol tests, inspection, procedures,and methods vill be similar to the pressure vessel tests described in de-tail in h.1.4.
With regard to the internals surveillance spe:imen holder tubes, the ma-terial irradiation surveillance program is described in 4.4 3
All internal emironents can be re=oved from the reactor vessel to allowinspection of all vessel interior surfaces (see 4. +.J.). Internals com-ponents surfacer ean be inspected when the internals are removed to thecanal stors6e loc'ation.
0000 W \
3-103.
The internals vent valves will be designed to relieve the pressure generated 1by steaming in the core following the LOCA so that the core vill remain suffi-ciently covered. The valves will be designed to withstand the forces resultingfrom rupture of either a reactor coolant inlet or outlet pipe. Testing of thevalves vill consist of the following:
A full-size valve assembly (seat, locking mechanism, and socket) willa.be tested at steady-state conditions at the maximum pressure expectedto result during the blowdown.
b. Sufficient tests will be conducted at zero pressure to determine thefrictional loads and clearances in the hinge assembly, the inertiaof the valve cover, and the deflections resulting from impact of thecover so that the valve response to cyclic blowdown forces may bedetermined analytically.
The valve assembly will be pressurized to determine what pressurec.differential is required to cause the valve to begin to open. A de-termination of the pressure differential required to open the valveto its maximum open position will be simulated by mechanical means.
d. A valve assembly will be installed and removed remotely in a teststand to judge the adequacy of handling equipment.
Since the temperature differential existing across the valve assembly duringnormal operation in the reactor is only approximately 55 F, and since the samematerial is used for the valve seat, socket, and cover, there is no need toconduct tests at elevated temperatures.
OThe valves are located in a region of relatively low velocity and turbulence,and preliminary analysis indicates that there is insufficient energy in thecoolant to cause vibrational proble:rs. Therefore, no testing to prove the vi-bration adequacy of the valve is planned.
During refueling outages after the reactor vessel head and the internals ple-num assembly have been removed, the vent valves vill be accessible for visualand mechanical inspection. A remote inspection tool vill be provided to en-gage.with the previously mentioned valve dise hook or eye. With the aid ofthis tool, the valve disc can be manually exercised to evaluate the dise free-dom. The hinge design will incorporate special features, as described in3. 2. h .1( f) , to minimize the possibility of valve disc motion impairment dur-ing its service life.
Remote installation and removal of the vent valve assemblies will be performedwith the aid of another tool which will include unlocking and operating fea-tures for the wedge ring. This handling tool design will be functionally de-veloped and tested on a fu]l-size mockup of the vent valv'e installation config-uration prior to valve manufacture.
With the aid of the above described inspection tool, a visual inspection of thevalve body and disc sealing faces can be performed for evaluation of observedsurface irregularities.
O000002553-103a (Revised 1-15-68)
the valve disc, hinge shaft, shaft journals (bushings), disc journal recepta- 1-
clas, and valve body journal receptacles will be designed to withstand withoutfailure the internal and external differential pressure loadings resulting
7- from a loss-of-coolant accident. These valve materials will be nondestructively
tested and accepted in accordance with the ASME Code III requirements for ClassA press'ure vessels.
The hinge materials will be selected on the basis of their corrosion resistance,surface hardness, antiga111ng characteristics, and compatibility with matingmaterials in the reactor coolant environment.
A remote inspection of hinge parts is not planned until such time as a valveassembly is removed because its free-disc motion has been impaired. In theunlikely event that a hinge part shauld fail during normal operation, the mostsignificant indication of such a failure would be a change in the free-disc mo-tion as a result'of altered rotational clearances.
4
O
'
f. f * q._.
,-
(*~ \
~
000002563-103b (Revised 1-15-68)
1
. . _ _ _ _ . , - - . .. --- , -. ,_
-
_
34 REFERDiCIS
(1) Putnam, G. E., TOPIC - A Fortran Program for Calculating Wansport of gParticles in Cylinders, IDO-16968, April 1964.
(2) Ave:y, A. F., The Prediction of Neutron Attenuation in Iron-Water Shields,AEEW-R125, April 1962.
(3) Bohl, H., Jr., et _al_., P3)C1, A One-Dimensional Multigroup P-3 Programfor the Philco-2000 Computer, WAPD-TM-272.
(4) Bohl, H., Jr. and Hemphill, A. P., MUFT-5, A Fast Neutron Spectrum Pro-gram for the Philco-2000, WAPD-TM-218.
(5) Amster, H. J. and Callaghan, J. C., KATE-1, A Program for CalculatingWigner-Wilkins and Maxwellian-Averaged Themal Constants on the Philco-2000, WAPD-TM-232.
(6) Marlove, O. J. and Suggs, M. C., WANDA-5, A One-Dimensional Neutron Dif-fusion Equation Program for the Philco-2000 Computer, WAPD-TM-241.
(7) Honeck, H. C., THERMOS, A Thermalization Transport Theory Code for Reae-tor Lattices, BNL-5826.
(8) Cadwell, W. R., Buerger, P. F., and Pfeifer, C. J., The PDQ-5 and PDQ-6Programs for the Solution of the Two-Dimensional Neutron Diffusion-Dep3etion Problem, WAPD-TM-477
(9) Marlove, O. J., Nuclear Reactor Depletion Programs for the Philco-2000Computer, WAPD-TM-221.
(10) Lathrop, K. P., DIF-IV, A FORTRAN-IV Program for Solving the MultigroupTransport Equation With Anisotropic Scattering, LA-3373
(11) Joanou, G. D. and Dudek, J. S., GAM-1: A Consistent P1 Multigroup Codefor the Calculation of Fast Neutron Spectra and Multigroup Constants,GA-1850.
(12) Baldwin, M. N., Physics Verification Experiments, CORE I, P28 and InitialConversion Ratio Measurements, BAW-TM-454.
(13) Clark, R. H. and Pitts, T. G., Physics Verification Experiments, Core I,BAW-TM-455
(14) Clark, R. H. and Pitts, T. G., Physics Verification Experiments, CoresII and III, BAW-TM-458.
l (15) Spinks, N., "The Extrapolation Distance at the Surface of a Grey Cylin-drical Control Rod",13 lear Science and Engineering 22, pp 87-93, 1965
(16) Clark, R. H., Batch, M. L., and Pitts, T. G., Lumped Burnable PoisonPzugram - Final Report, BAW-3492-1.
(17) Neuhold, R. J., Xenon Oscillation, BAW-305, 1966.
O3-104
00000257
O(18) Wilson, R. H. and Ferrell, J. K., Correlation of Critical Heat Flux for
Boiling Water in Forced Circulation at Elevated Pressures, The Babcock& Wilcox Company, BAW-168, November 1961.
(19) U.S.-Euratom Joint R&D Program, Burnout Flow Inside Round Tubes With Non-unifom Heat Fluxes, The Babcock & Wilcox Company, BAW-3238-9, May 1966.
(20) Jens, W. H. and Iottes, P. A., Analysis of Heat Transfer Burnout, Pres-sure Drop, and Density Data for High Pressure Water, ANL-4627, May 1951.
(21) Owen, D. B., Factors for One-Sided Tolerance Limits and for VariableSa=pling Plans, SCR-607, March 1963
(22) DeBortoli, R. A., et_ al., Forced Convection Heat Transfer Burnout Studiesfor Water in Rectangular Channels and Round Tubes at Pressures Above 500psia, WAPD-188, Bettis Plant, Pittsburgh, Pennsylvania, 1958.
(23) USAEC Docket 50-244, Exhibit D-3, entitled " Rochester Gas and ElectricCorporation, Brookwood Nuclear Station Unit No.1", (Third Supplement to:Preliminary Facility Description and Safety Analysis Report, February28,1966).
(24) Lee, D. H. and Obertelli, J. D., An Experimental Investigation of ForcedConvection Burnout in High Pressure Water. Part 1, Round Tubes WithUniform Flux Distribution, AEEE-R-213, August 1963
O (25) Matzner, B. and Griffel, J., Bimonthly Progress Report (MPR-XIII-11 r212-63), Task XIII of Contract AT(30-3)-187, Basic Experimental StudieE~of Boiling Fluid Flov and Heat Transfer at Elevated Pressures, for 'M .vember and December 1963, January 27, 1964.
(26) Matzner, B. and Griffel, J., Monthly Progress Report (MPR-XIII-6-63),Task XIII of Contract AT(30-3)-187, Basic Experimental Studies of Boil-ing Fluid Flow and Heat Transfer at Elevated Pressures, for June 1963,
|
June 28, 1963l
(27) Matzner, B., Monthly Progress Report (MPR-XIII-5-63), Task XIII of Con-tractAT(30-3)-187, Basic Experimental Studies of Boiling Fluid Flow andHeat Transfer.at Elevated Pressures, for May 1963, May 31,1963
(28) Internal Me=o, Weatherhead, R. J. to Inttes, P. A., Critical Heat Flux(Burnout) in Small Diameter Tubes at 2000 psia, December 29, 1956.
i
|(29) Svenson, H. W., Carver, J. R., and Kakarala, C. R., The Influence of
Axial Heat Flux Distribution on the Departure Fmm Nucleate Boiling in aWater Cooled Tube, ASME Paper 62-WA-297
(30) Nonunifom Heat Generation Experimental Pmgram, Quarterly Progress Re-Port No. 7, January - March 1965, BAW-3238-7, Joint U.S.-Euratom B&DProgram, A E Contract No. AT(30-1)-3236. .
h (31) Hald, A.,: Statistical Theory With Engineering Applications, John Wiley &Sons, Inc., New York, 1955
9 $00002583-105
._ _
(32) Worthing, A. G. and Geffner, J., Treatment of Experimental Data, John gWiley & Sons, Inc., New York, 1943
(33) Bowring, R. W., Physical Model, Based on Bubble Detachment, and Calcula-tion of Steam Voidage in the Subcooled Region of a Heated Channel,HPR-10, OECD Halden Reaktor Project, December 1962.
(34) zuber, N. and Findlay, J. A., Average Volumetric Concentrations in TwoPhase Flov Systems, Presented at the ASME Winter Meeting, 1964. To bepublished in tne ASME Transactions.
(35) Maurer, G. W., A Method of Predicting Steady-State Boiling Vapor Frac-,
| tions in Reactor Coolant Channels, Bettis Technica: Review, WAPD-BT-191
(36) Baker, 0., Simultaneous Flov of 011 and Gas, Oil and Gas Journal, Vol.11, pp 185-195, 1954.
(37) Rose, S. C., Jr., and Griffith, P., Flow Properties of Eubbly Mixtures,ASME Paper No. 65-HT-38, 1965
(38) Haberstroh, R. D. and Griffith, P., The Transition From the Annular tothe Slug Flow Regime in Two-Phase Flow, MIT TR 5003-28, Department ofMechanical Engineering, MIT, June 1964.
(39) Bergles, A. E. and Suo, M., Investigation of Boiling Water Flow Regimesat High Pressure, NYO-3304-8, February 1, 1966.
O(h0) Notley, N. J. F., The Themal Conductivity of Columnar Grains in Irradi-ated U02 Fuel Elements, AECL-1822, July 1963
(41) Lyons, M. F., et al., UO2 Fuel Rod Operation With Gross Central Melting,GEAP-426k, October 1963,
(42) Notley, M. J. F., g _al_., zircaloy-Sheathed U02 Fuel Elements Irradiatedat Values of Integral kd6 Detween 30 and 83 w/cm. AECL-1676, December1962.
(43) Bain, A. S., Melting of UO2 During Irradiations of Short Daration, AECL-2289, August 1965
(44) Notley, M. J. F., et al,., The Iongitudinal and Diametral Expansions ofUO2 Fuel Elements, AECL-2143, November 1964.
(h5) Duncan, R. N., Rabbit Capsule Irradiation of UO , CVNA-142, June 1962.2
I (46) Lyons, M. F., et al. UO Pellet Thermal Conductivity From IrradiationsWith Central M Et Eg, G -4624, July 1964.,
| (47) McGrath, R. G., Carolinas-Virginia Nuclear Power Associates, Inc., Re-search and Development Program, Quarterly Progress Report for the PeriodApril - May - June 1965, CVNA-246.
O00000259
3-106
-P w+ cy g r p - o -
,-c-- -e.
_ _ _ _ _-.
O (48) Ross, A. M. and Stoute, R. L., Heat Transfer Coefficients Between UO2and Zircaloy-2, _AECL-1552, June 1962.
(49) Hoffman, J. P. and Coplin, D. H., The Release of Fission Gases FromUranium Dioxide Pellet Fuel Operated at High Temperatures, GEAP-4596,September 1964.
(,') Spolaris, C. N. and Megerth, F. H., Residual and Fission Gas ReleaseFrom Uranium Dioxide, GEAP-4314, July 1963
(51) Fuel, ABCL-603,195b.et al., Behavior of Uranium Dioxide as a ReactorRobertson, J. A. L.
-
(52) Parker, G. W., e_t,al., Fission Product Release From U02 by High Tempera-t
ture Diffusion and Melting in Helium and Air, CF-60-12-14, ORNL, Febru-,
j ary 1961.!
(53) Daniel, R. C., e_t al_., Effects of High Burnup on Zircaloy-Clad, Bulk U028Plate Fuel Element Samples, WAPD-263, September 1962.
(54) Biomeke, J. O. and Todd, Mary F., Uranium Fission Product Production asa Function of Thermal Neutron Flux, Irradiation Time, and Decay Time,ORNL-2127, Part 1, Vol. 1 and 2.
(55) Duncan, R. N., CVTR Fuel Capsule Irradiations, CVNA-153, August 1962.
(56) Frost, Bradbury, and Griffiths (AERE Harwell), Irradiation Effects inFissile Oxides rmd Carbides at Iow and High Burnup Levels, Proceedingsof IAEA Symposium on Radiation Damage in Solids and Reactor Materials,Venice, Italy, May 1962.
(57) Gerhart, J. M., The Post-Irradiation Examination of a Pu0 -UO22 Fast Re-actor Fuel, GEAP-3833
(58) Atomic Energy Clearing House, Vol. 12, No. 3, P 11.
(59) Large closed-Cycle Water Reactor Research and Development Program Prog-ress Report for the Period, January 1 to March 31, 1964, WestinghouseElectric Corporation, Pittsburgh, Pa., 1964, WCAP-3269-2. Also WCAP-3269-3 for period from April 1 to June 30, 1964.
(60) Physical and Mechanical Properties of Zircaloy-2 and -4, WCAP-3269-41,Figure 18.
(61) Burgreen, D., Byrnes, J. J., and Benforado, D. M., " Vibration of Rods,
Induced by Water.in Parallel Flow", Trans. ASME 80_, p 991, 1958.t
(62) Large Closed-Cycle Water Reactor IED Program, Progress Report for thePeriod January 1 to March 31, 1965, WCAP-3269-12.
p (63) Burnout for Flow. Inside Round Tubes With Nonuniform Heat Fluxes, BAW-d 3238-9, May 1966.
00000260'
3-107_. , .. - - - - . .. - .. . _ - _ . - - . _ . , . - . - - - _ - - . . . . - _.
(64) Nonunifom Heat Generation Experimental Program, BAW-3233-13, July 1966. g(65) Clark, R. H., Physics Verification Experiments, Cores IV and V, BAW-TM-
178, September 1966.
(66) Clark, R. H., Physics Verification Experiment, Core VI, BAW-TM-179,December 1966.
(67) Clark, R. H., Physics Verification Experiment, Axial Power Mapping onCore IV, BAW-TM-255, December 1966.
(68) Larsen, P. S., et al., DNB Measurements for Upwanis Flow of Water in an| Unheated Square Channel with a Single Unifomly Heated Rod at 1600-2300'
psia, Proceedings of the Third International Heat Transfer Conference,August 1966.
I
|
00000261|-
3-108'
.. .- . .. . - . .
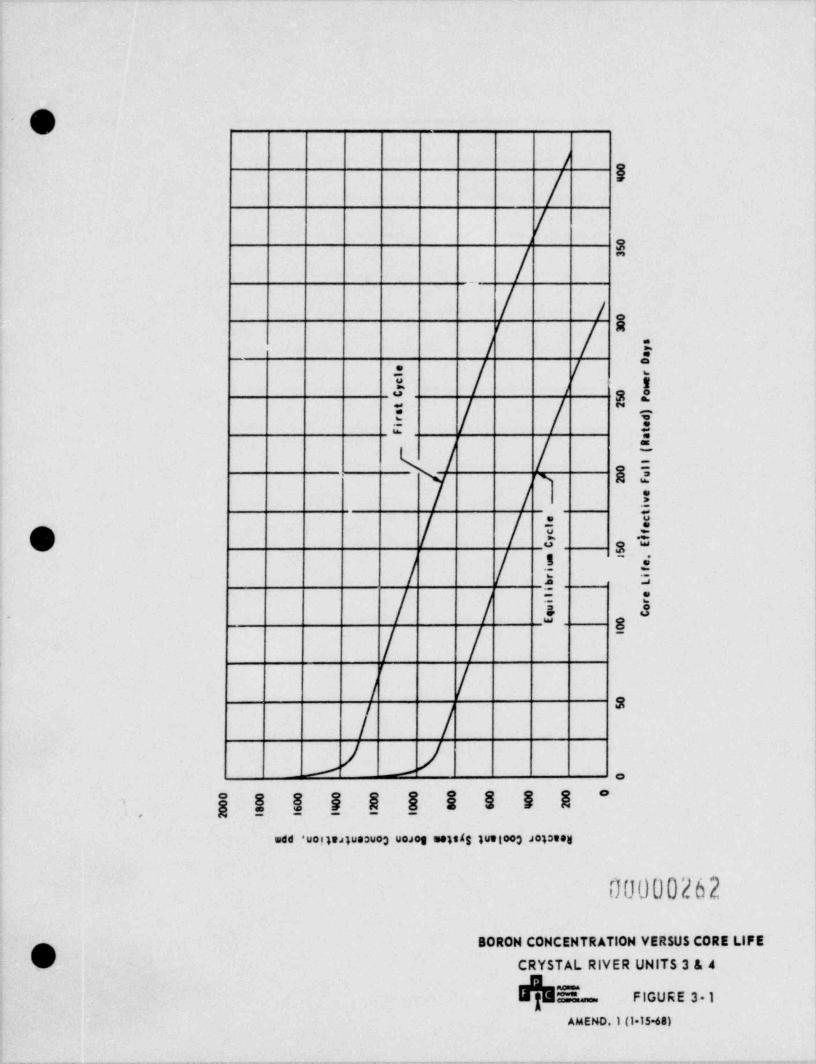
O| '/
t' S
/ ~
_
/ /{ f $
/ / :-.-
i / / i! / / "i
| / i|2rw
.!'
o / / i ,i
/ / i ~s= .
.
,/ ,/2 3 t
e |-
| / */ // j
- - ,
,
add 'uo!)eagueouog uoJos metsig guetoog Jo}sesy
00000262
BORON CONCENTRATION VER$US CORE LIFEg\J CRYSTAL RIVER UNITS 3 & 4
- FIGURE 3 1
AMEND.1 (1 15-68)
. . - . . - - - - _ - . _ . _ - . _ _ . . - _ . - .._ . _ , _ _ _ . _ . _ _ _ _ _ _ . _ , , . _ _ . _ . _ _ _ _ _ _ _ _ _ . . _ . - _ _ __
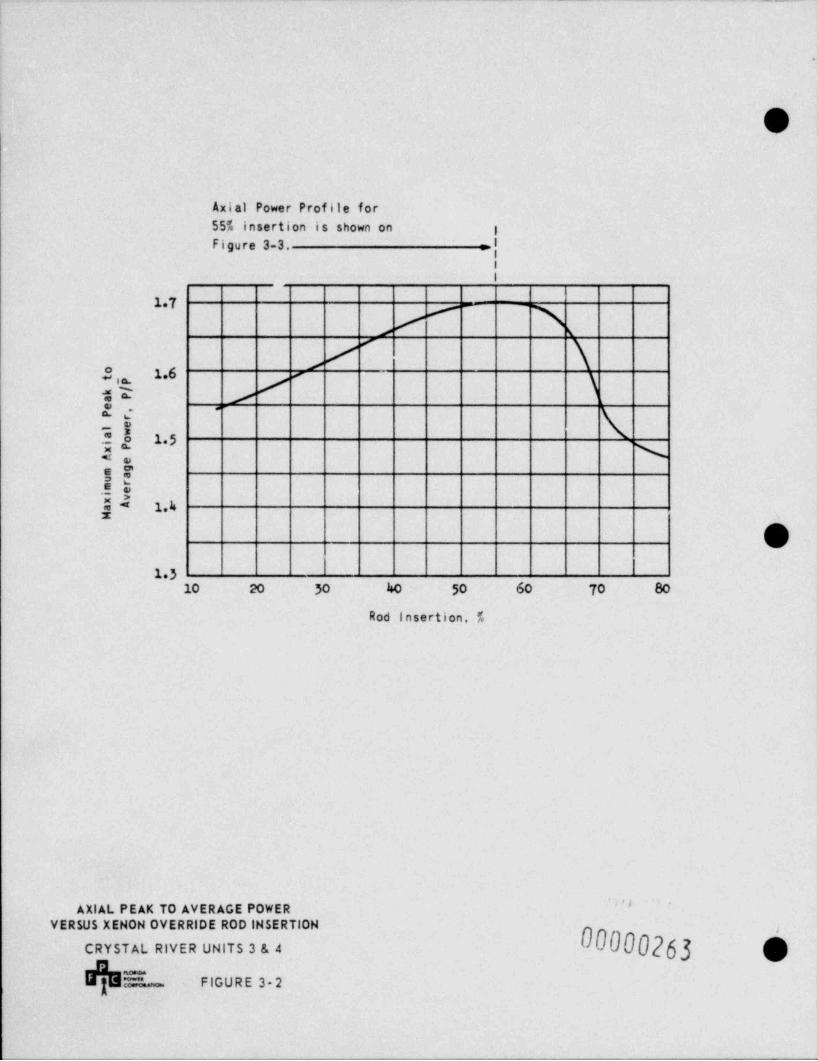
. . . . . . ... .. . ._
|'
!
|
,,
li
O|1
Axial Power Profile for557. insertion is shown onFigure 3-3. :|
|
|
17 y-
r/>
/ \'j
fig 15 xe E'EtjE 1.k
O13
10 20 30 40 50 60 70 80
Rod insertion, f.
''# '
AXlAL PEAK TO AVERAGE POWERYER5US XENON OVERRIDE ROD INSERTION
000263 8CRYSTAL RIVER UNITS 3 & 4
IA FIGURE 3-2
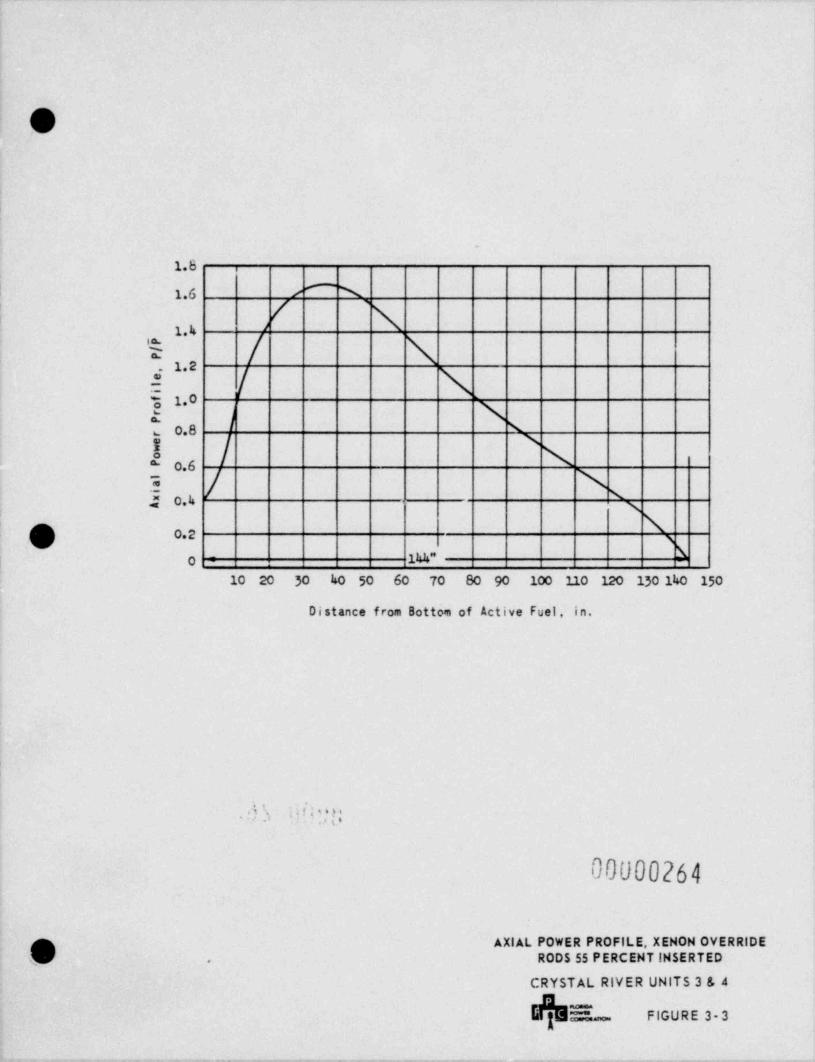
O
.
1.6
| 1.6 / \
1.4
s / N1.2.
1.0a
0.8 \u
f \
O.6'
| \%x;< o.u 3
0.2
144"! 0 :
10 20 30 40 50 60 70 80 90 100 110 120 130 140 150
Distance from Bottom of Active Fuel, in.
t
!
.d j i h I 5 ? ,* h ;
00000264
( AXIAL POWER PROFILE, XENON OVERRIDEO ROD 5 55 PERCENT INSERTED,
CRYSTAL RIVER UNITS 3 & 4
E- FIGURE 3-3
-- . . - . . . . .
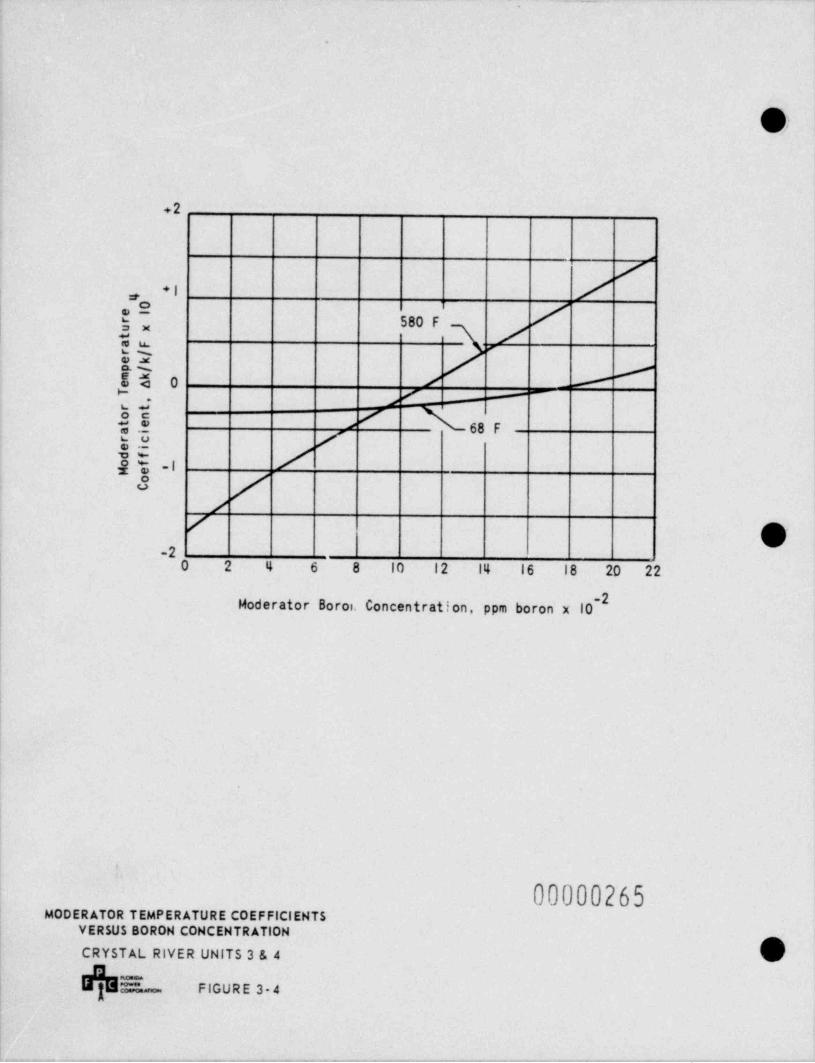
_ _ _ _ __ . . _
.
!
'
'
l
|
|
+2 |
-
+1 /,
E 580 F3* /e .t -
it /8n% 0 1 -/f --
,
/ 68 Fea /E. _ |x
/' O
-20 2 4 6 8 10 12 14 16 18 20 22
Moderator Boroi. Concentration, ppm boron x 10~
1|
i
f
00000265| MODERATOR TEMPERATURE COEFFICIENTS
VERSUS BORON CONCENTRATION
CRYSTAL RIVER UNITS 3 & 4-
||||"o.- FIGURE 3-4
. , - - _ _ - - , . . - , . - . . .. , - _- . ,. . - . .-. . . . - - . . . - . . . - - -_ . .-
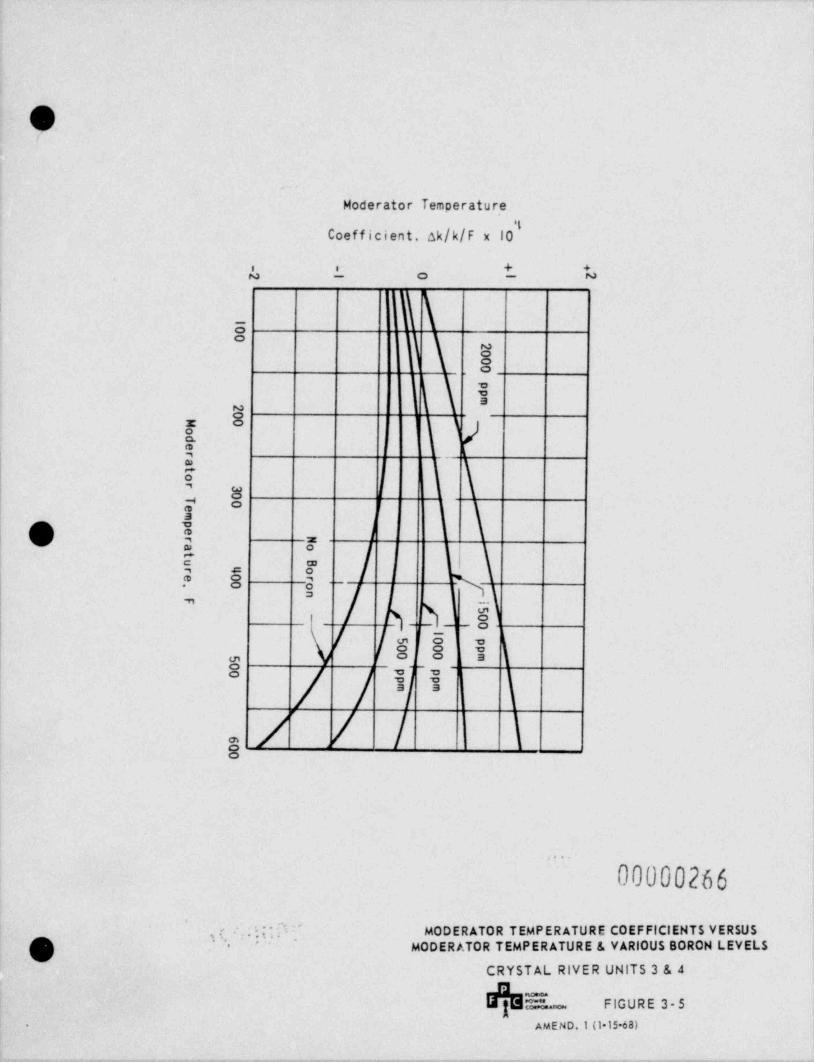
O'
s
xBtyou *e E ' % s.f
a.Eu ac4 4a *sm x 9,
- - + +2 i 0 1 2
1p
-
--
0
'y02000
" fppm
20
#"1M 0odera
#to
_r 3
0T 0
pem
Oper N
N - #a otu Br 4 o,e 0 r
!N , gl ; 00 o
F
1en
5
jx%0
l
s5 p0 p0 m5
0
p%'p
Np p
-0
m m
<
\ N-
6_'0
0
-
OoOOoNWo
_a ' goW<S= sha*mQ3 * uo=.nEU5U >m=aam, !.
f. ,
2og=No= >31 =y$m d ><= Omm g@z . =>w a.
c.-~O-
a J
Um *F<.E2megEFm"d,.J
-oamw n7" wg-|
<s[d iy?s.
,h r f: ;;. ; !: . '-ij-ief'; , *i | !. , '|| r
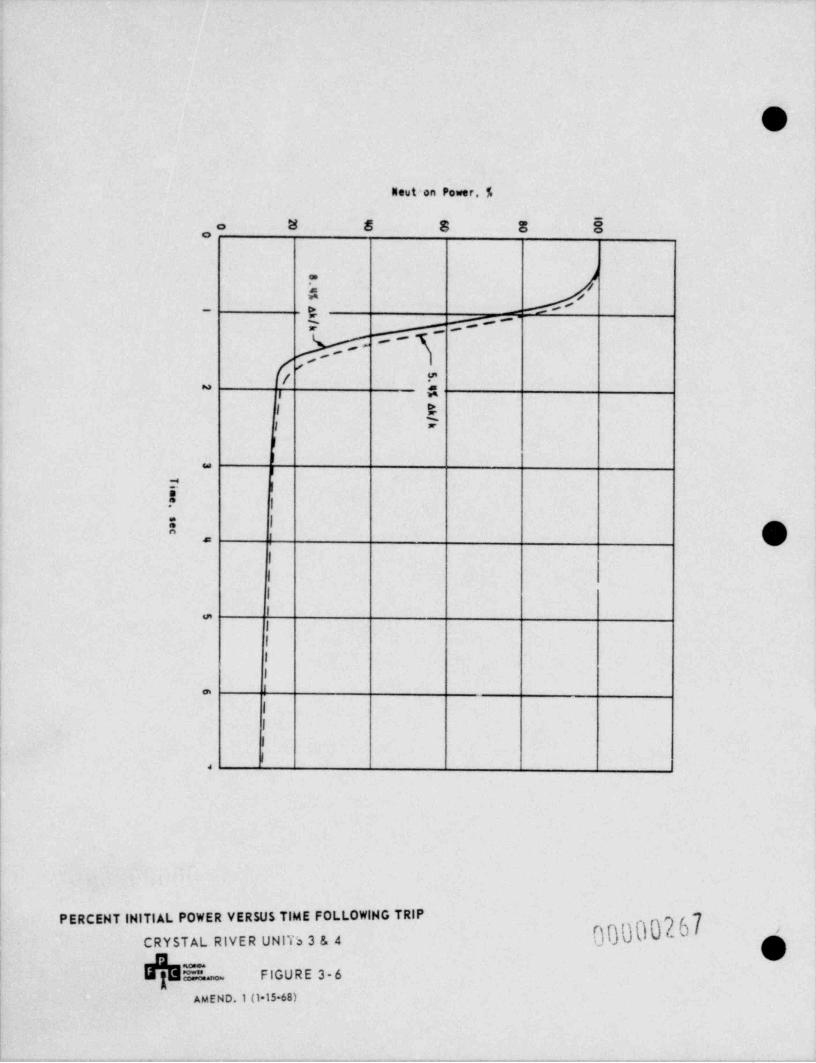
:
I
~9 i1
I
lieut >on Power, %
o 8 8 8 8 5o
/0 ',/B #
-
A --
<;- ,-
, -,I *
5I
I
I"
I
2 |
.I I
i ,' O,
l
i
I
*I
I
I
I
Ie
{ I
Ii
| I
'a
|
|PERCENT INITIAL POWER VER$US TIME FOLLOWING TRIP
000007.67|
CRYSTAL RIVER UNITS 3 & 4
| -
l m FIGURE 3-6
AMEND.1 (115 68)
-~-. ._ _ , .- . . . - . - . . . , . .. . .-. .. . . _ . . .
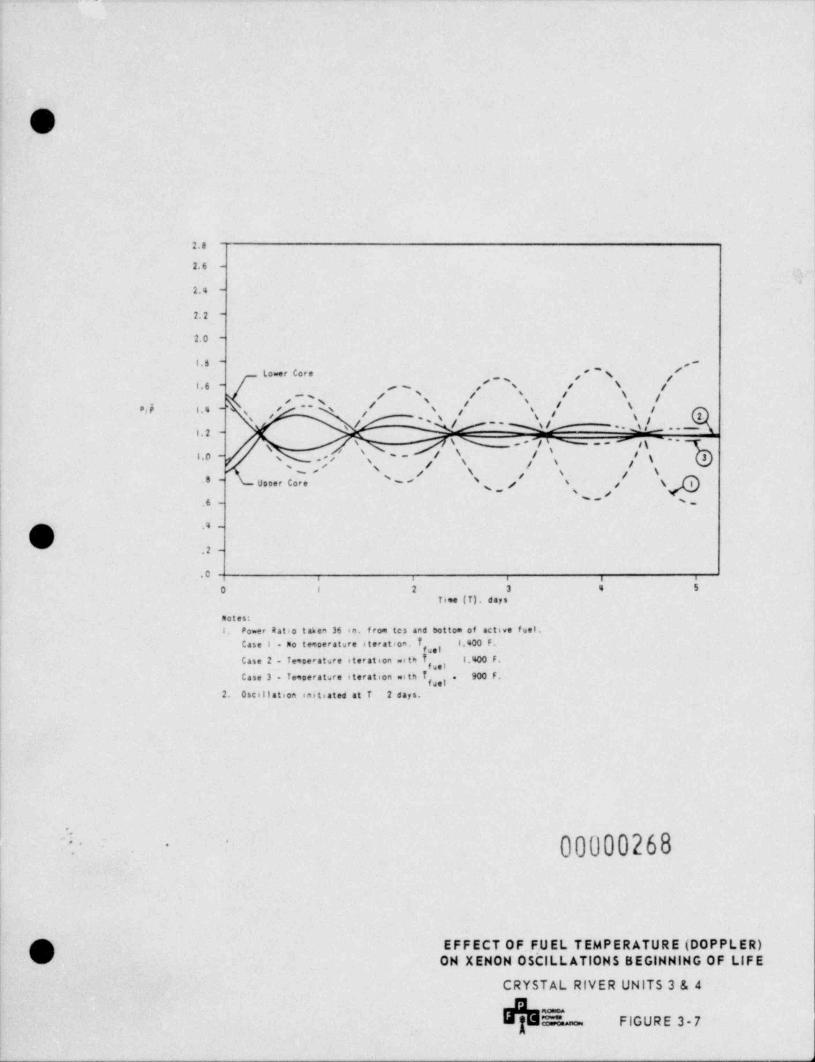
..
f~
U
2..
2. 6 -
.
2.4 -
2. 2 -
2. 0 -
1.8 - ,,
Lower Core **g /# #/ ~ 's f % f1.6 - p%
N / \ / \ /,
,-s / gg / # / \"-e, P 1.4 -' / % s g fs
! !' '' ** -1. 2 -"
s%,f'%..- ,g'--isy,,' \ \ / i- /1.0 - s g,
/ / \\ /
i '% ,' s g g,#''8- vooer Core -- % s gj
,
'-.6- %.
|O :',:I
0i , , , s
0 1 2 3 4 5
Tsee (T). days
Notes:
,I. Po.er Ratio takea 36 in. f rom ten and bottom of active f uel,
l Case i . no tecoerature steration. f, l.400 F.
Case 2 Te*oerature steration with f,j f 400 F.
Case 3 - Temoerature iteration with f, 900 F..
2. Oscillation insteated at T 2 days.
|
| '.
00000268".' '-
(3 EFFECT OF . FUEL TEMPERATURE (DOPPLER)'V ON XENON OSCILLATIONS BEGlHNING OF LIFE
CRYSTAL RIVER UNITS 3 & 4
aois""- FIGURE 3-7
.h
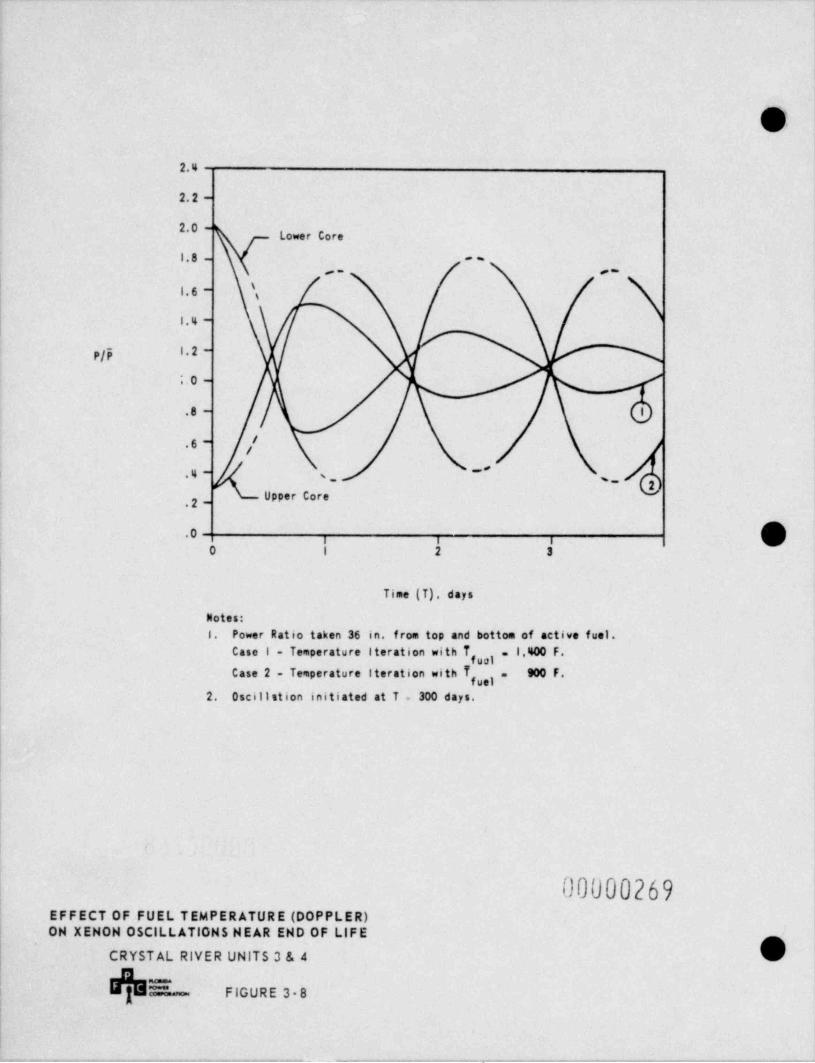
. - _.
O,
2.4
2.2 -
2.0 -Lower Core
1. 8 - --
a. r~
1. 6 - \1.4 -
1.2 -pfp
;,0 -
.8 - I
|.6-
~'t .4- s. '-
2Upper Core
.2-
.0 , , ,O I 2 3
Time (T), days
flotes:1. Power Ratio taken 36 in. from top and bottom of active fuel.
Case I - Temperature iteration with 7, . 1,400 F.
Case 2 - Temperature lieration with 7, 900 F..
2. Oscillation initiated at T . 300 days.
00000269EFFECT OF FUEL TEMPERATURE (DOPPLER)OH XENON OSCILLATIONS NEAR END OF LIFE
CRYSTAL RIVER UNITS 3 & 4
i -"'""
FIGURE 3-8! -=
|
. . . . . . . - - . .. - - . . . -. . . - . . - . - _ . - - - - - . - . . - -
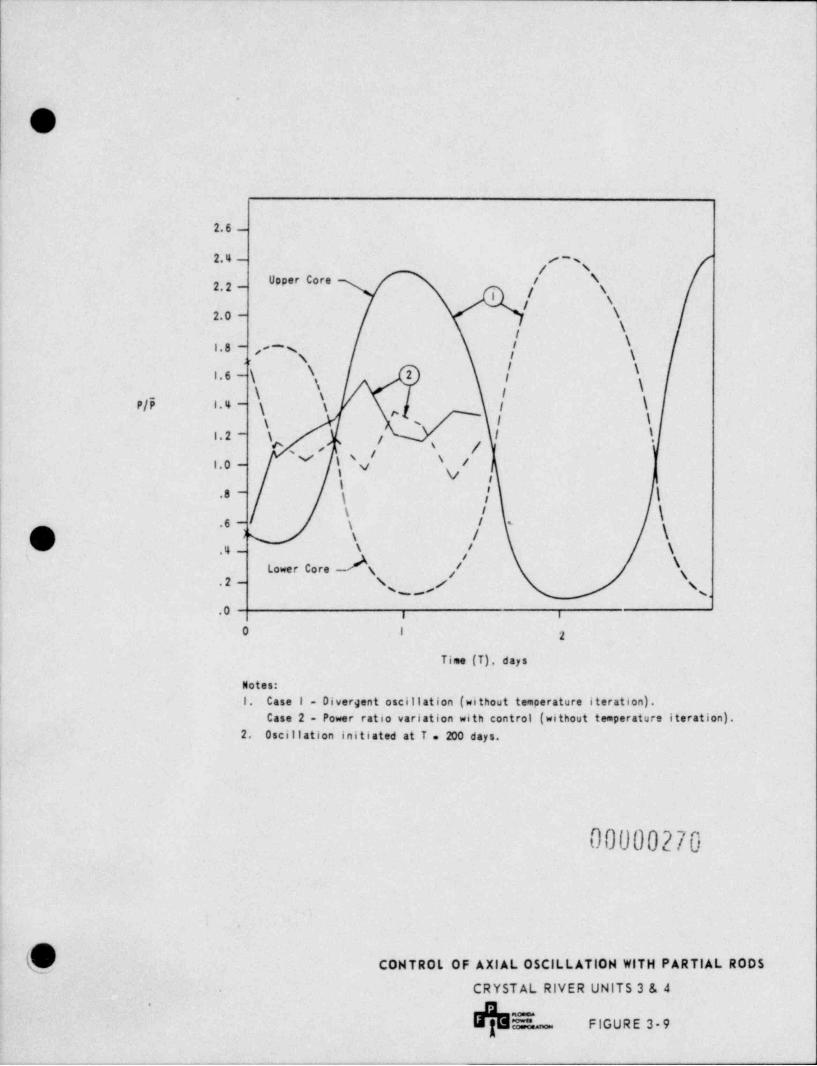
.
2. 6 -
2.4 - es
Uoper Core / \2.2 -
\/
2.0 - \\
I.8 - ,#~ s | $
l.6 - \ 2 ;
\ t iP/P l.4- \ \ I \
,l \\ ~
I \|2~ \, / , , ;,
1. 0 - I 'v /g
8~ \ | \\ l \
.6 - \ / '
) s / \O .4 _ \ / \Lower Core s / \.2- N ,,/ ss
.0 i i
0 1 2
Time (T). days
Notes:! 1. Case 1 - Divergent oscillation (without temperature iteration).
Case 2 - Power ratio variation with control (without temperature iteration).2. Oscillation initiated at T . 200 days.
||
00000270
Q couraot or ixiit oscittirios wirn einriit noos
CRYSTAL RIVER UNITS 3 & 4
FIGURE 3 9-
. -
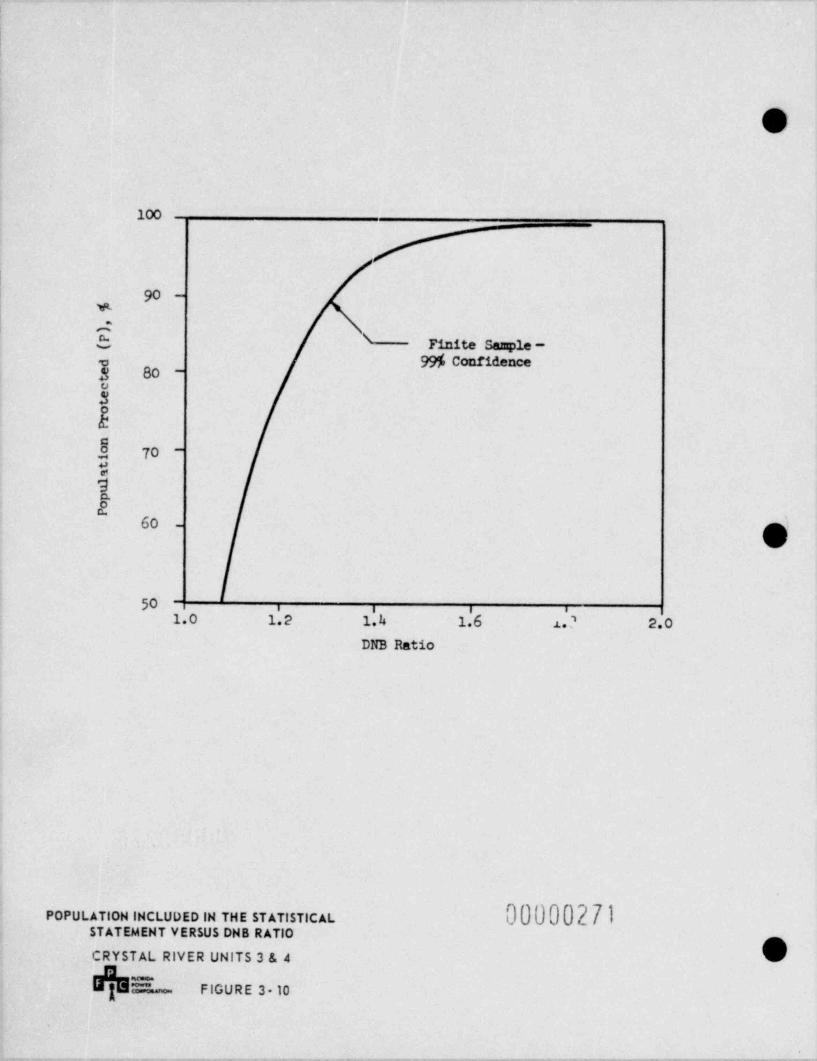
- - - -
|
|
|
O
100
90 -
w
\Finite Sample-
3 80 -99% Confidencee
.Yu>
b
70 -Y9&c.
60 - g'-
50 - i i i i
1.0 1.2 1.4 1.6 1.3 2.0DNB Ratio
POPULATION INCLUDED IN THE STATISTICAL 00000271STATEMENT VERSUS DNB RATIO
CRYSTAL RIVER UNITS 3 & 4
FIGURE 3 10-
.
--n- -- .mm,.,n.,,,----w -------ee,-v,- ---,w , --,e .-w+ , n-,-- , , w---w ,,,,,v-w,.,-,,nnmeen,, -.e.,,,,,- am,-enm-,w.~wn----,,,,,e re, ,,m m., - , , , , - -
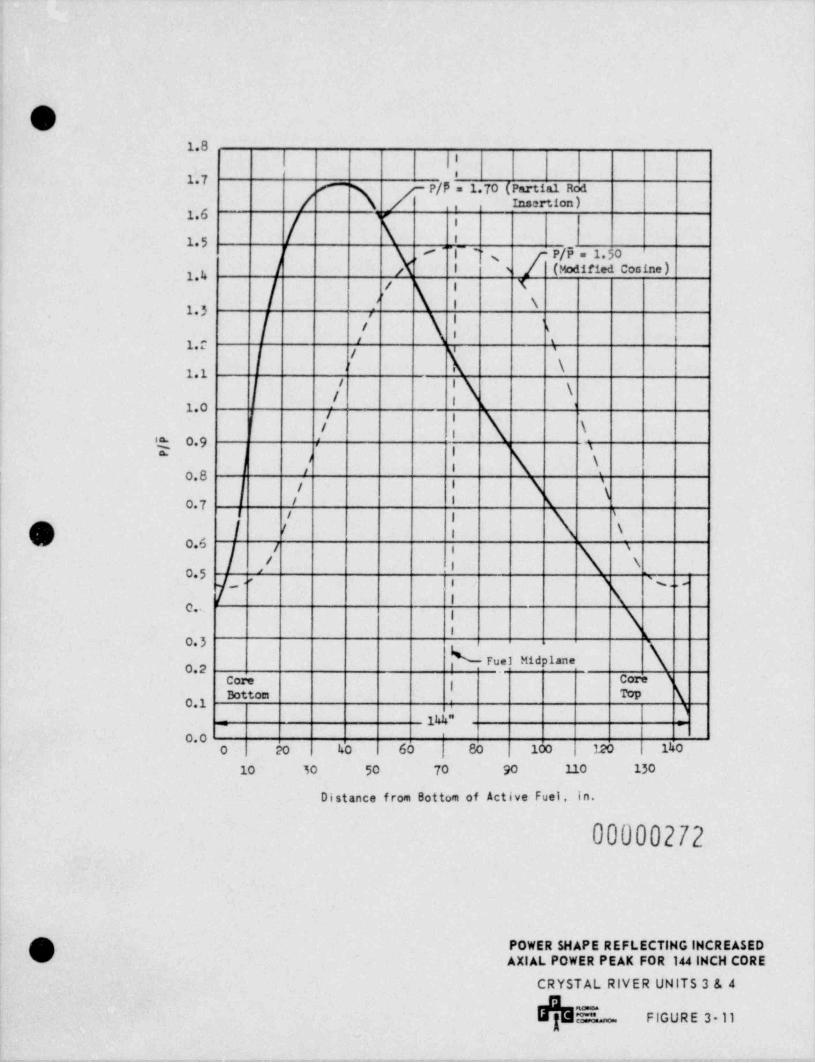
1.8,
,1.7
/ [ P/P = 170 (Partial Rodr
Insertion ),1.6
15-~|- 'r
[ P/E = 150'
)''
(Modified Cosine)| s1.4
f ; X/ \ | \13 /
/ | ,
/ 4,s '
f |
\,
,
'''
/ |\ \1.0 / g
/ \l'a. o,9 \,>
s21 ,' | \ \0.8
, i 3 '
O.7 # '\
0.6
// \
\
- s,'05s T '%..-| \
0..|
1 L
Fuel Mid laneP0.2
Core Core T|
0.1 '
{ T
144" ;
0.00 20 40 60 80 100 120 140
10 30 50 70 90 110 130
Distance from Bottom of Active Fuel, in.
00000272
O POWER SHAPE REFLECTlHG INCREASEDV AXIAL POWER PEAK FOR 144 INCH CORE
CRYSTAL RIVER UNITS 3 & 4
'E FIGURE 3 11
- - -
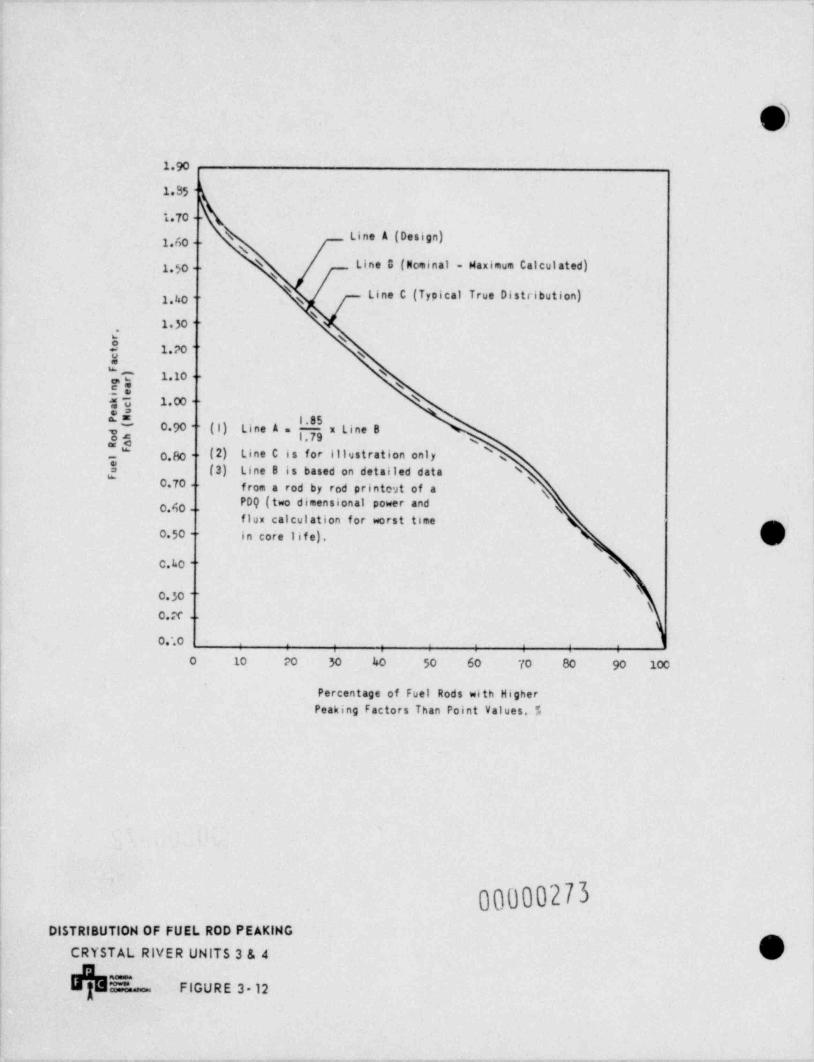
.
1 90
1.85 -
1 70 --"' ( '"I "U1.f>0 -- g
1 50 Line 3 (Nominal - Maximum Calculated)N
LineC(TroicalTrueDistribution)1.h0 - NN
130--,
6 N{ 1.?O - s
? 1.10 -- NF= N
3$ 1.00 - \
EEg 0 90 - (1) Line A
I.85x Line Bo e 1.79 s
"_ o,go . (2) Line C is for illustration only 's.I (3) Line 8 is based on detailed data N
0.70 - from a rod by rod printout of a gCAO-- PDQ (two dimensional power and g
flux calculation for worst time-
0 50 - incorelife).C.L0 - \
0 30 -\
0.X -
0. ~.0 , , , , ,
, ,
0 10 PO 30 ko 50 60 70 80 90 100
Percentage of Fuel Rods with HigherPeaking Factors Than Point Values. 7
00000273DISTRIBUTION OF FUEL ROD PEAKING
CRYSTAL RIVER UNITS 3 & 4_**"* FIGURE 3- 12-
|
I
!1
.. - , - - - - , . , -
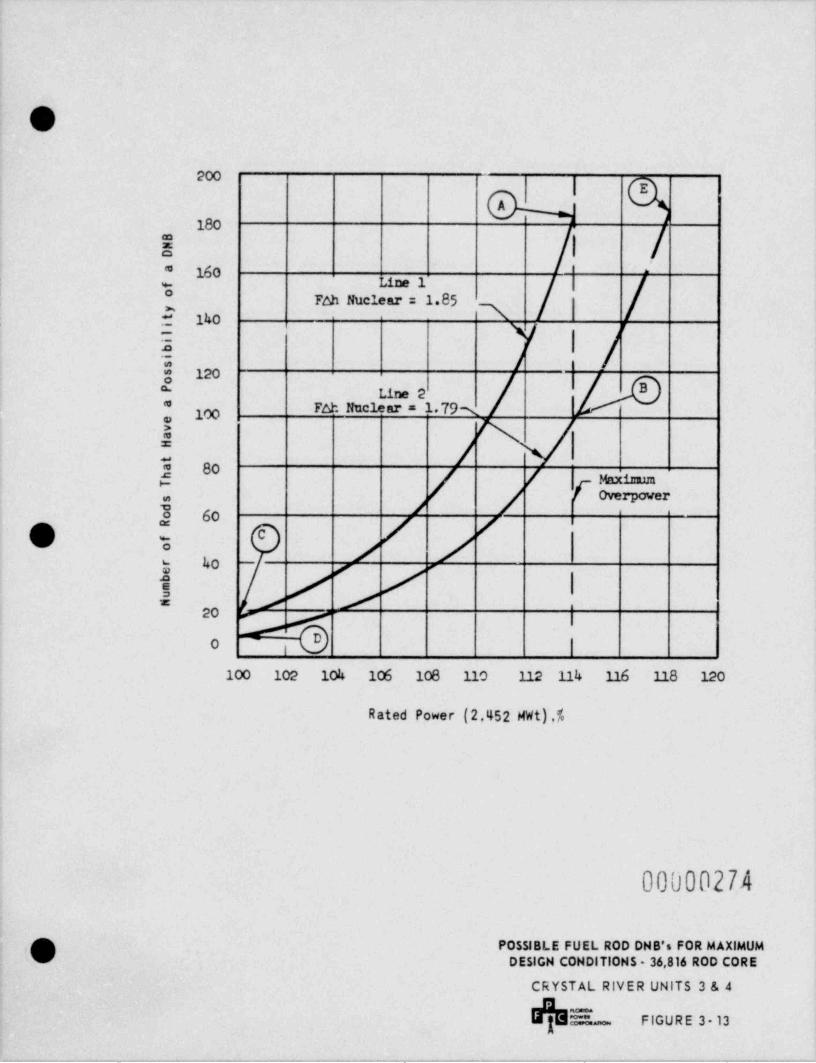
O200
| E
180
= | /* 160 -
% Line 1
Foh Nuclear = 1.85$ 140
Y} //3
;;g 120" Line 2
100 FAh Nuclear = 1.79s:I
80! p 7 ,,1,,
j #60 !C
go -Au
e f r
/ |*
20 -
|A
~ ib I
100 102 104 106 108 HO H2 H4 H6 H8 120
Rated Power (2,452 MWt),7
00000274
POSSIBLE FUEL ROD DNB's FOR MAXIMUM,
DESIGN CONDITIONS - 36,816 ROD CORE
CRYSTAL RIVER UNITS 3 & 4
E- FIGURE 3 13
__ - - . .. . . _ _ _ _ _
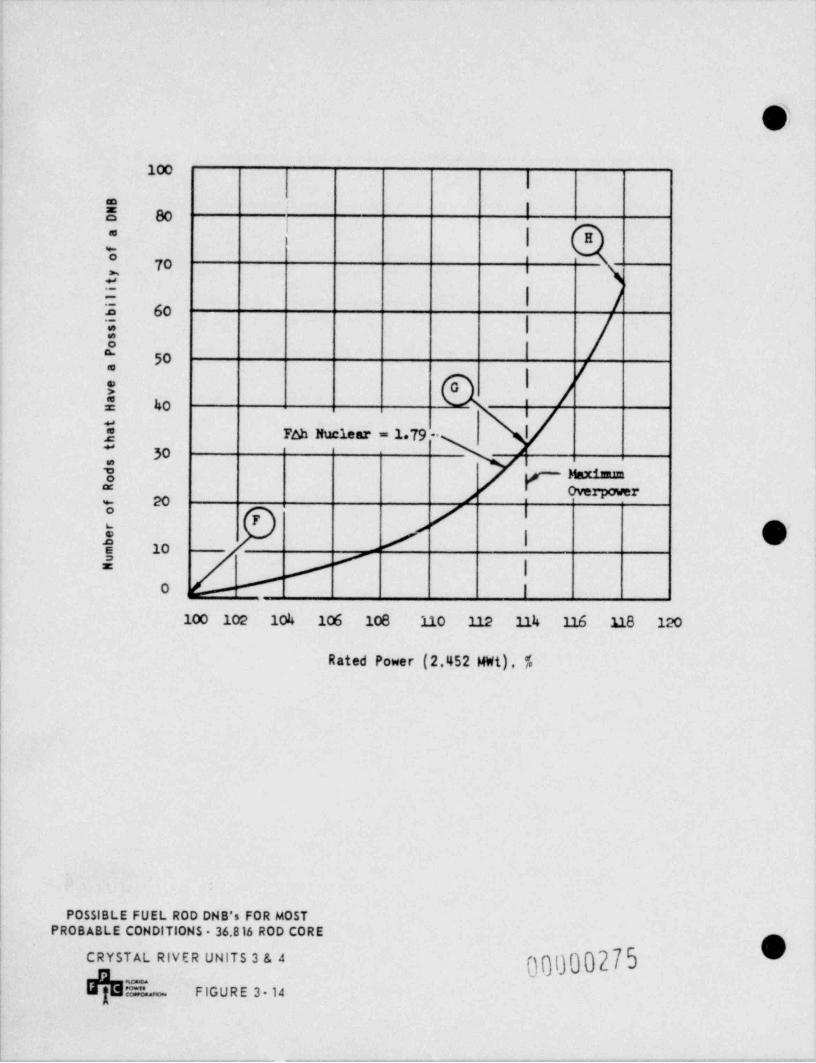
1Mg
I e '
| H*
t ,7a \'
= | )-
60I:
o|'
50
| |'*
/:E 40 '
3 Fah Nuclear = 179 -- |
[ 30 2
g 8 vi--=
20 j overpower'
r / |*
} / | he 10 "
E / |#0 |
100 102 104 106 108 110 112 114 116 n8 120
Rated Power (2,452 MWt), %
POSSIBLE FUEL ROD DNB's FOR MOSTPROBABLE CONDITIONS - 36.816 ROD CORE
0'nggo0275CRYSTAL RIVER UNITS 3 & 4
I"d"" - FIGURE 3- 14
-._.-_-_, ., . .- -... .- - -._ , . - . - . . . . , . - . - . . , . - . . . . _ _ _ , _ , _ . - . , . . . - - . -. . - . . . . . . - - .-
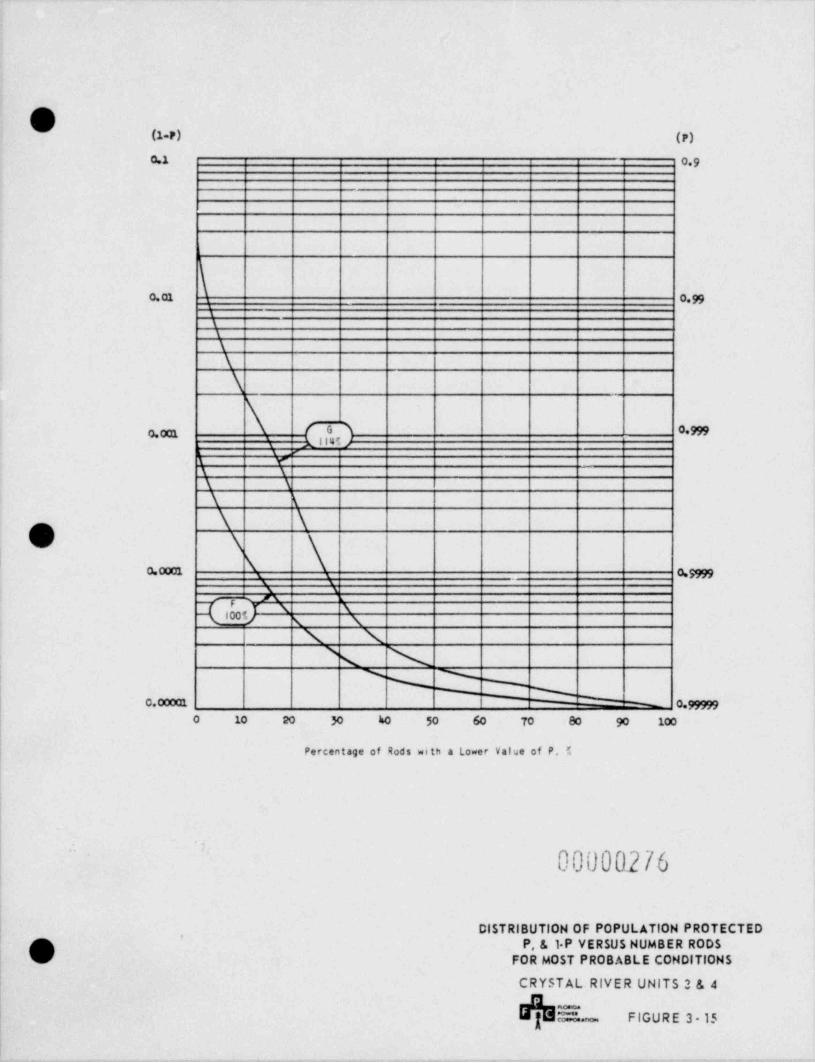
(1 P) (P)
0.1 09
0.01 0 99,
\
\
\
\
\
q,'3 0 9990. . .
L 'r -r''
\ r\ \
\ \
\ \
\ \O xt \- 0.,,,,.
N i
5/ ( \x x
A \'
i N %_
0.00001 ~ 0 999990 10 20 30 40 50 60 70 80 90 100
Percentage of Rods with a Lower Value of P, "
||
'00000276
|
DISTRIBUTION OF POPULATION PROTECTED'
, p/ P, & 1 P VERSUS NUMBER RODSt FOR MOST PROBABLE CONDITIONS
CRYSTAL RIVER UNITS 3 & 4i =
| == FIGURE 3- 15
.. . .
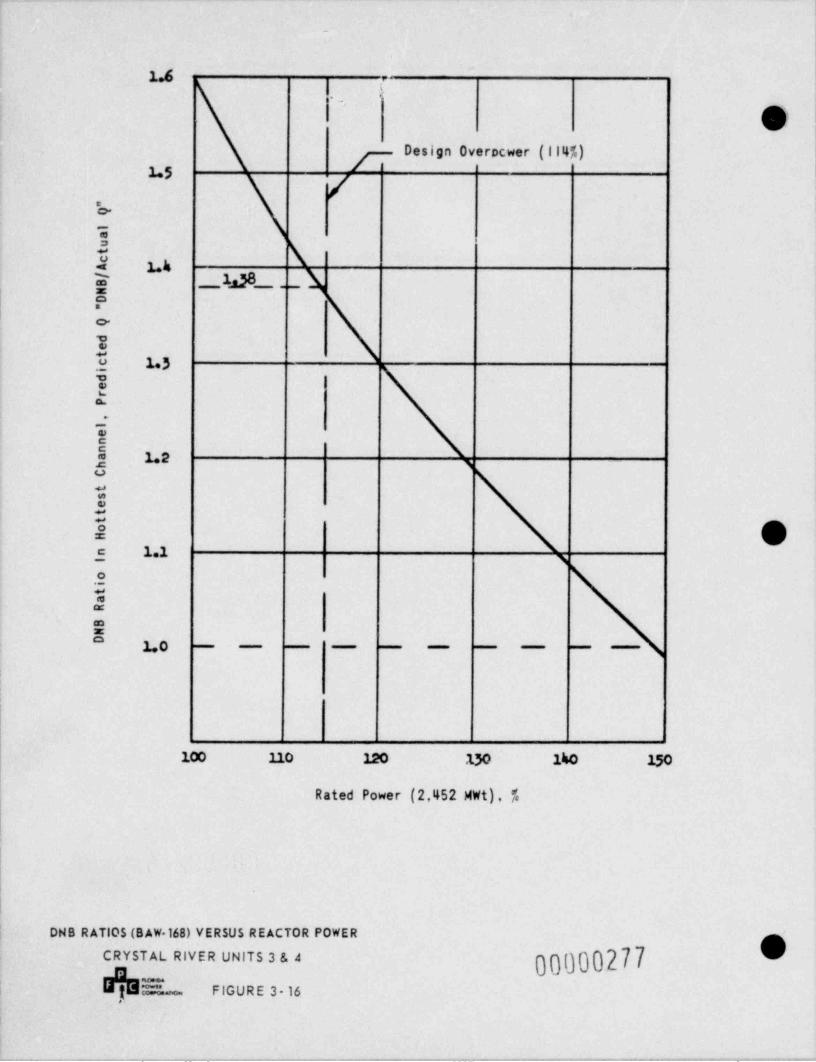
..-
m
.,
1.6 ,,
'_.,
ODesignOverocwer(ll4%)
15! ,
'o. i
%
1.4=
y _lM__ _ko.
35 15mEa.
*.-
Ej La ,
%.S
3 Oc 1.1 3.2%a:
E1,o - - - _ _ _
|
i
100 110 120 130 iho 15o
RatedPower(2,452MWt),%
i
|
| DNS RATIOS (BAW 168) VERSUS REACTOR POWER I0000277CRYSTAL RIVER UNITS 3 & 4
i Em FIGURE 3 16
-- . - - _ - - _ _ . - - _ - _ _ _ __ _
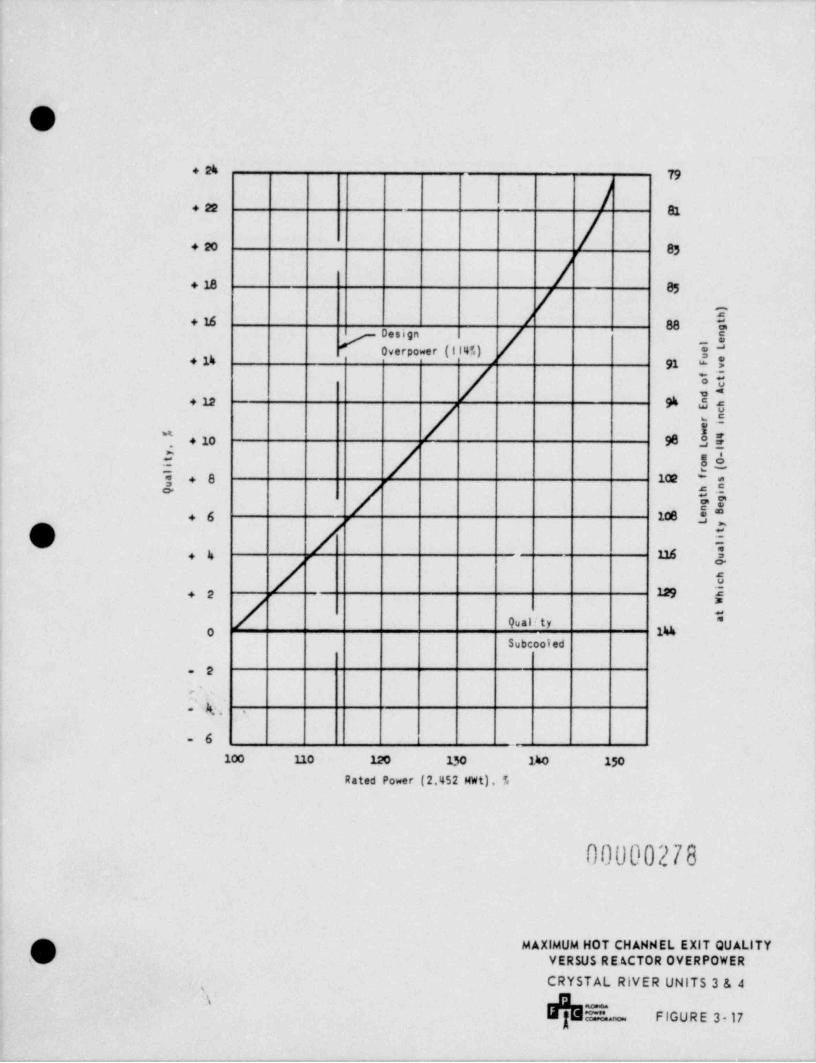
O. . 1,
). . ,
+ m e,
+ 18 05
! -
. t. a >
0 wer(114f.) 3+ 14 91 '>
/ u. . . m,
/ e*+ lo 90 3$
E$=+8 10E 'Er
+ 6 106 3,r
O / i. , -
/ s5 $+2
Quality
Subcooled
2-
a'
' k; ,- .
-6100 no 120 130 1ho 150
Rated Power (2.452 MWt). %
00000278
p MAXIMUM HOT CHANNEL EXIT QUALITY%) VERSUS REACTOR OVERPOWER
CRYSTAL RIVER UNITS 3 & 4
E.no FIGURE 3- 17
-- - - - - - _-
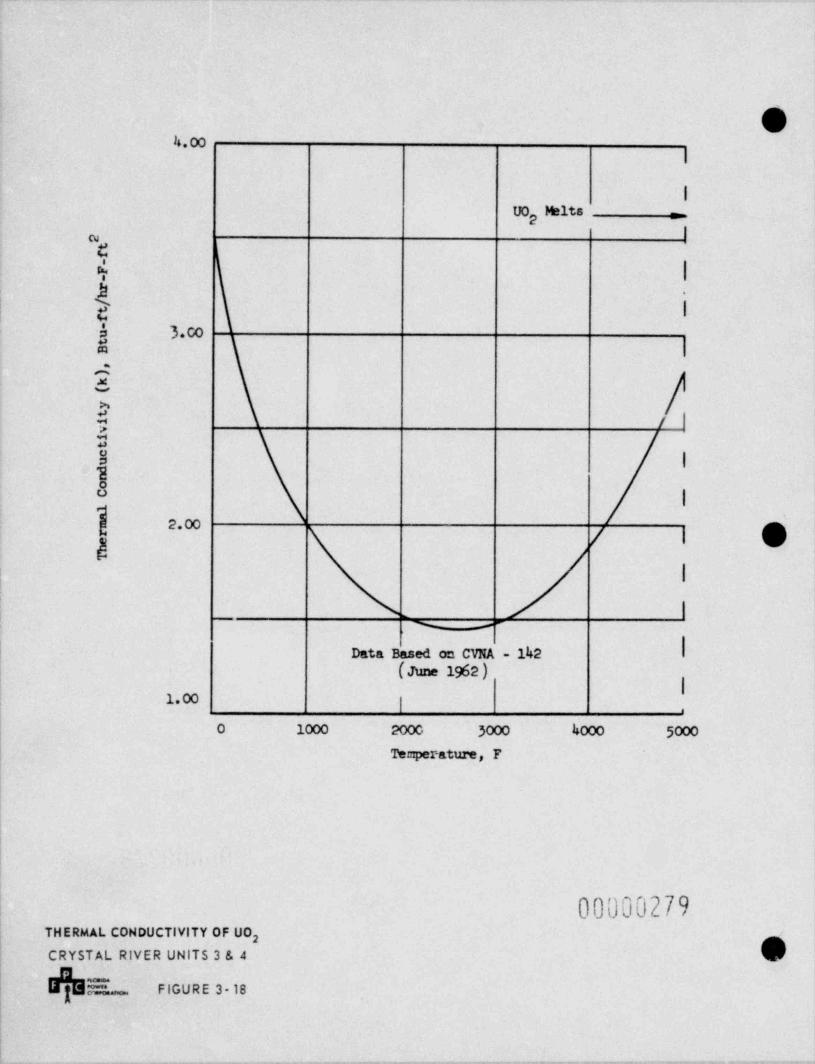
.
e4.00
I
IUO r1t* =2
Icu
C
4 1n, .
| > I| u
S 3.005 I~
69~.: /l::U l18
|
} e.m/ \ e;
j i
I_,
Data Based on CVNA - 142(Jtme 1962)
I1.m
i ,
O 1000 2000 3000 4000 5000
Temperature, F
00000279THERMAL CONDUCTIVITY OF UO
CRYSTAL RIVER UNITS 3 & 4
| m)s_ eiOuRe 3.ie
!
- _ _ _ _ . _ - _ . , . _ _ _ _ _ _ _ _ . - _ _ . - _ _ . . . - - - - _ _ . . _ _ _ . _ _ _ _ _ _ - _ _ .. .
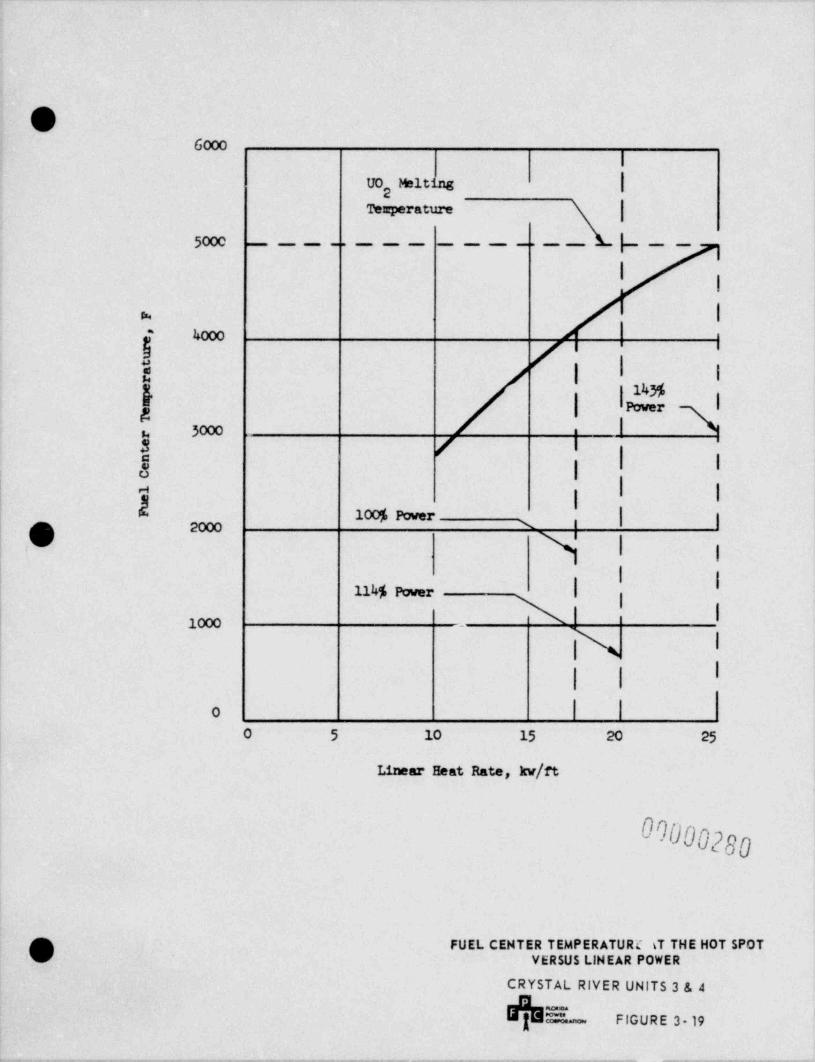
O6000
|
UO Melting |Temperature |
5000 p--_ _ _ -. _ _ _ ___-. - -
11
>/ |~4000--
i
e | I I
& Io"er55 |Pw
u 3000 !a
f [- I
a I:
| |-
100% Power | |,0 y i ,
pg
Inu$ Power i I
'1000 -
\ l
,|\ l
| II
O | |0 5 10 15 20 25
LinearHeatRate,kw/ft
000002gg
OxFUEL CENTER TEMPERATURE ST THE HOT SPOT
VERSUS LINEAR POWER
CRYSTAL RIVER UNITS 3 & 4
b= FIGURE 3- 19'
_ - _ - - ___-_- _- __
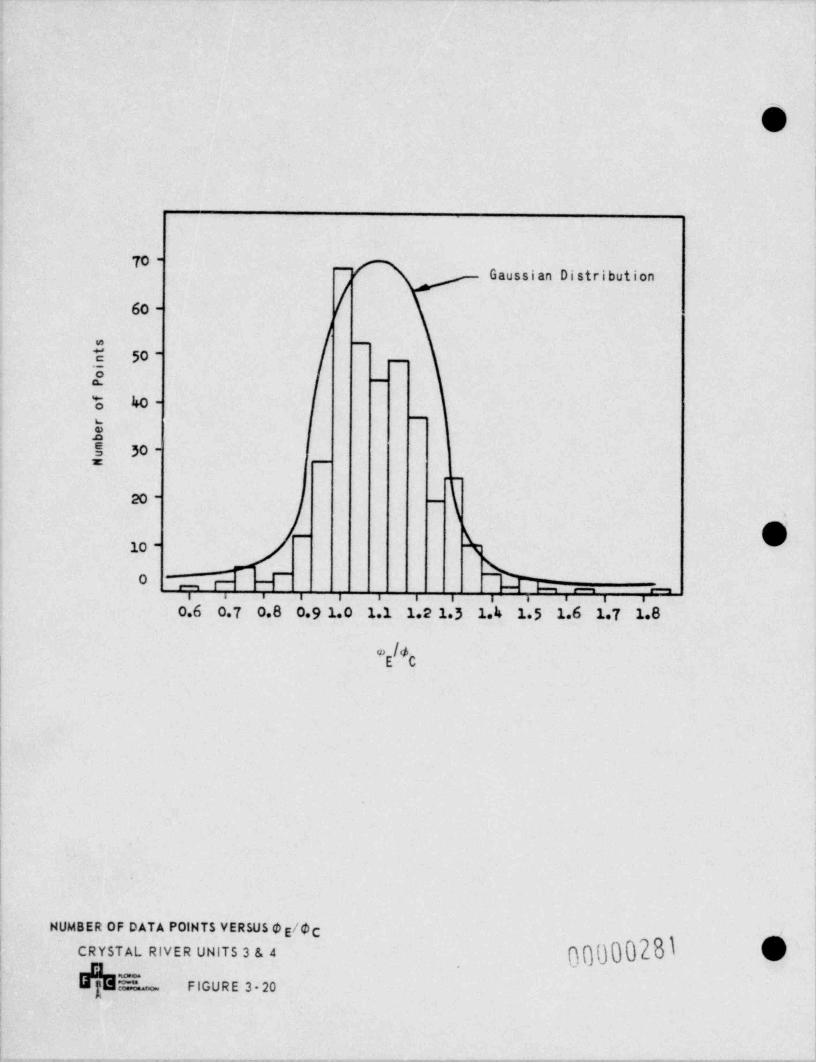
- . . . ..
I
l
!
To - -
Gaussian Distribution
60 -
= -
T 50 - _
'8-a.
t 40 --u
25 30 -x -
.
20 - -
~
10 -
'o - -r T -4 % .-i . > i i , i i . . ..
o.6 07 o.8 o.9 1.0 1.1 1.2 1 3 1.4 15 1.6 17 1.8
eE C
|.
;
i
|
|
!
l
HUMBER OF DATA P0lHTS VERSUS $ /DCE
n0000281 sCRYSTAL RIVER UNITS 3 & 4
E. FIGURE 3-20
it _... _ , . . . , _ , . , . _ . . - _ _ _ _ _ _ . . _ , . , _ . . ,___ ,_ _.,_, _ __ _ , _ . _ . , _ _ _ , , _ _ _ , . , _ , _ . _ _ _ , , , _ . _ , _ _ _ . . _ , _ _ , , _ , _ _ , _ _ _ ,
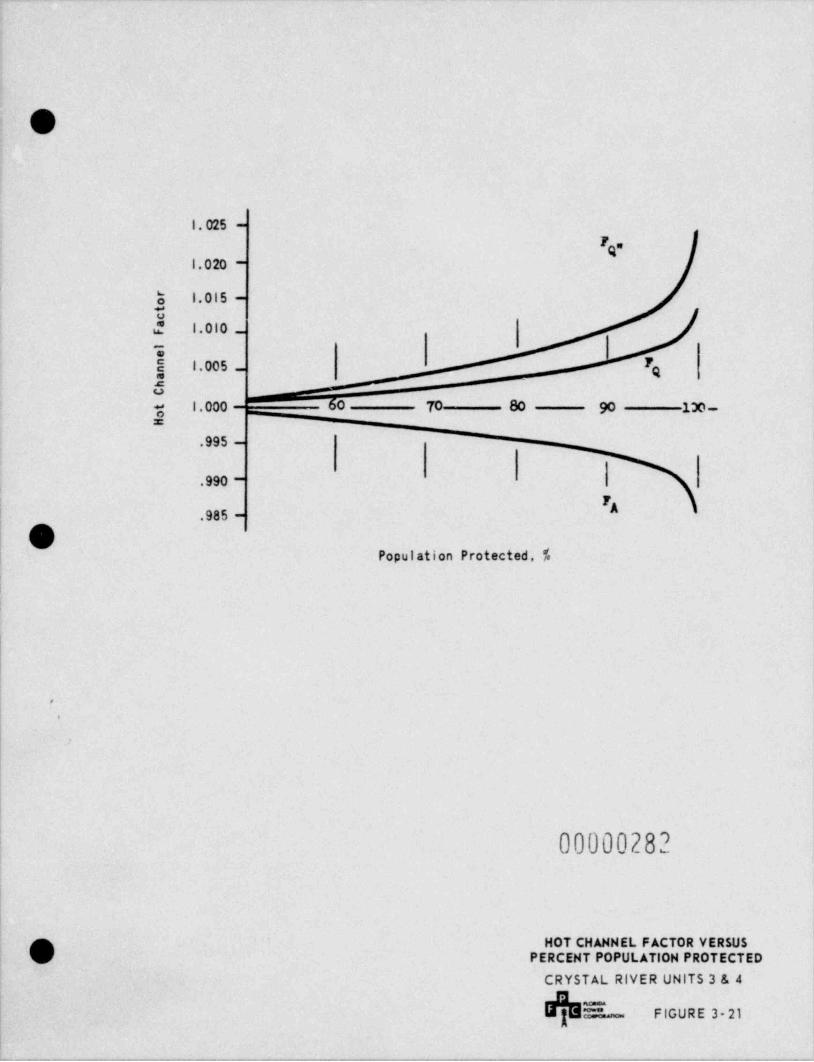
. . __.
O
l. 025 -
1.020 -
1.015 -oo2 1.010 _
%l.005 _ Pg
u
y 1.000 0 70 80 90 13o _z
.995 -
.990 -| T
Al .985 -
.OPopulation Protected, f.
|
..
t
00000282
HOT CHANNEL FACTOR VERSUSA() PERCENT POPULATION PROTECTED
CRYSTAL RIVER UNITS 3 & 4
-
FIGURE 3-21"*"--
- . . . . _ . . _ ..._ _ _._.._.-, _ . . _ _ . . _ . _ _ - _ . _ _ _ _ . . _ _ . . . _ . _ _ _ _ _ _ _ _ _ _ . _ . _ _ , . . - _ _ . . _ _ . _ _ _ . - _ _ _ _ _ . _ _ _ _ _ _ . . . _ . _ _ _ . . _ _ -
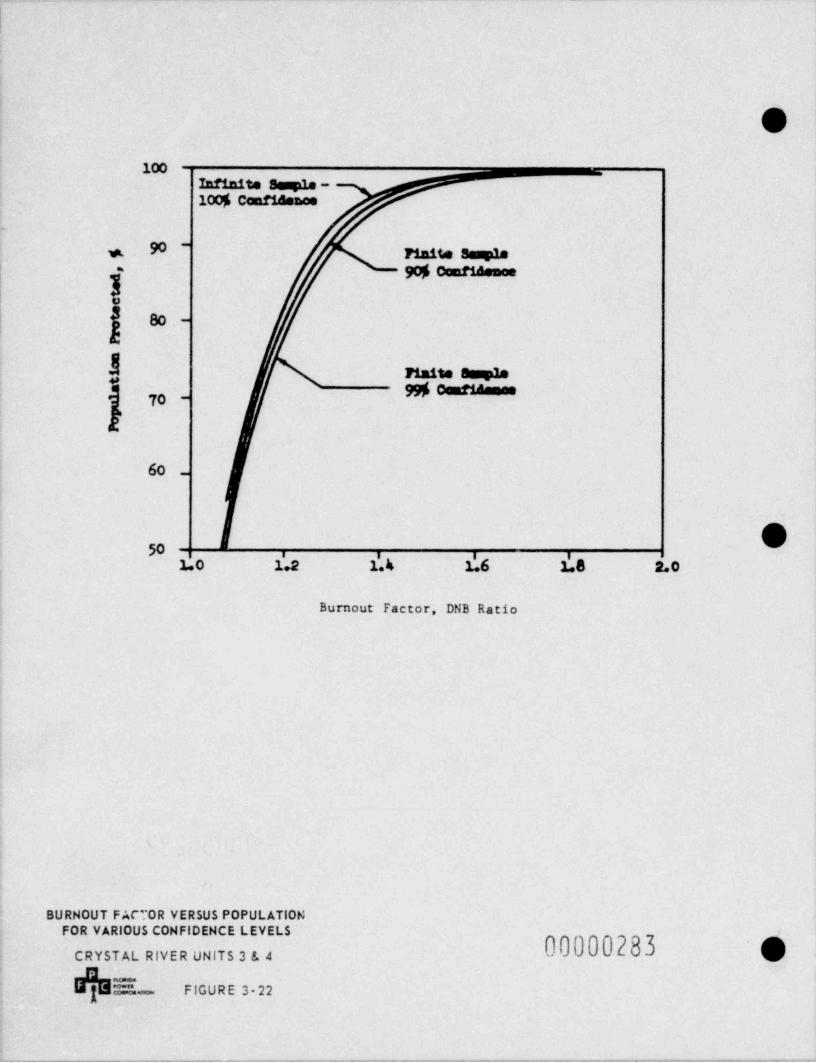
~ _ _ _ - . .. ..
,
100Infinite Saugde -100% Cond h
.
* Finite w90%confidemosj
v
80 -
i =.e =70 -
60 _
'
1.0 l.2 l'. 4 d6 $8 2.0
Burnout Factor, DNB Ratio
!
BURNOUT FACTOR VER$US POPULATIONFOR VARIOUS CONFIDENCE LEVELS
CRYSTAL RIVER UNITS 3 & 44
"a'''l= = FIGURE 3 22,
- --__- --___.___---_._.-_-_-.--.-.....-_.-,-....,vm.,--..--w,---,---.=..
_._-,_,,,,,.--,,~,,,,e. _ _ . . . . , , - - ,--
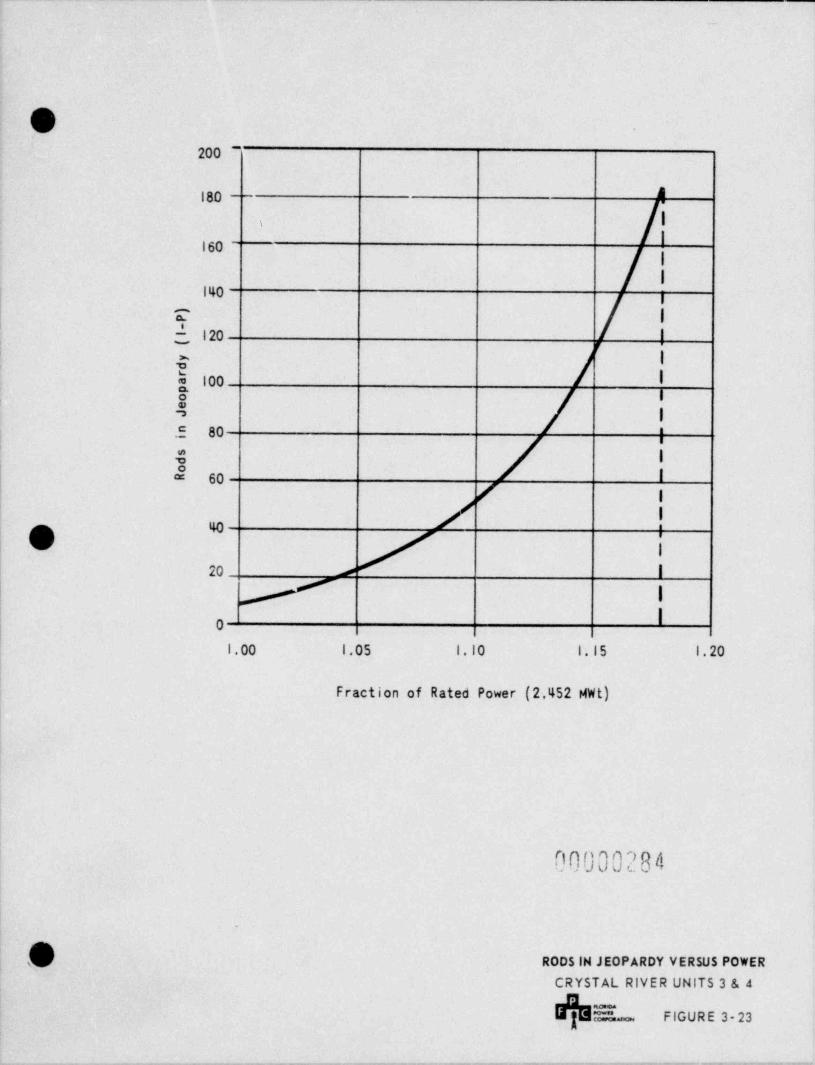
.-
0200 -
180 -- 4
I,
i160
j
i140 j
r i
d 120 !
= 100 l
,8i
I
| .5 80 *
'
1=
E I60 ( |
/ !"O f i20 > I
!
O
l.00 1.05 1.10 1.15 1.20
Fraction of Rated Power (2,452 MWt)
00000284
RODS IN JEOPARDY VERSUS POWER
CRYSTAL RIVER UNITS 3 & 4
'C"" o FIGURE 3-23
. . _ _ - _ _ - - - - - - - . -
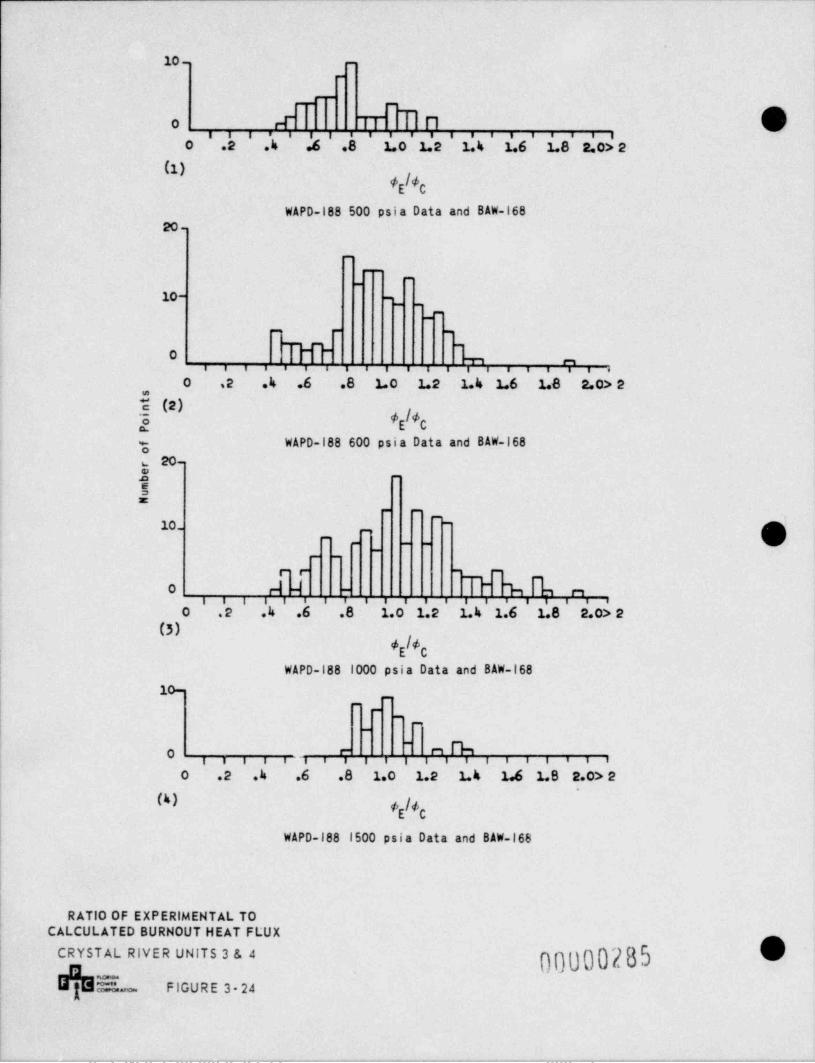
.
10 _
_
__
O # TT" En hi i i . . . . . . . . . . . . . . . . ,
0 .2 .4 .6 .8 .1. 0 1.2 1.4 1.6 1.8 2.0> 2
(1)(E *C
WAPD-188 500 psia Data and 8AW-16820-
-
--_
_
10-, _
-
. . ,
O ....,,,..e,, , . . . . . . , , ,
0 .2 .h .6 .8 1.0 1.2 1.k 1.6 1.8 2.0> 2,
-
(E *Cg WAPD-188 600 psia Data and 8AW-168
20-gn -
5x
- -. .
lo- -
__
- - ._
_ _
r r - -
N4...,,,,, h, %. , m.0
i i i i i , .
0 .2 .4 .6 .8 1.0 1.2 1.4 1.6 1.8 2.0> 2
#g/*C
i WAPD-188 1000 psia Data and BAW-168
10-_
--
"'-
_
bO F Mi i i i i i i i i i i i i e i i i i
O .2 .k .6 .8 1.0 1.2 1.4 1.6 1.8 2.0> 2
5 f |+gg
WAPD-188 1500 psia Data and 8AW-168
I| RATIO OF EXPERIMENTAL TO
CALCULATED BURNOUT HEAT FLUX
00000285 0CRYSTAL RIVER UNITS 3 & 4-
0|||"- FIGURE 3-24
.. _ _ . . . _ . - _ __ _ . _ _ . . _ . . _ _ _ _ . _ _ _ _ _ . _ _ . . _ _ . _ . . _ . _ _ _ _ _ _ _ . . . . _ . . _ _ . _ , . . . . . . .
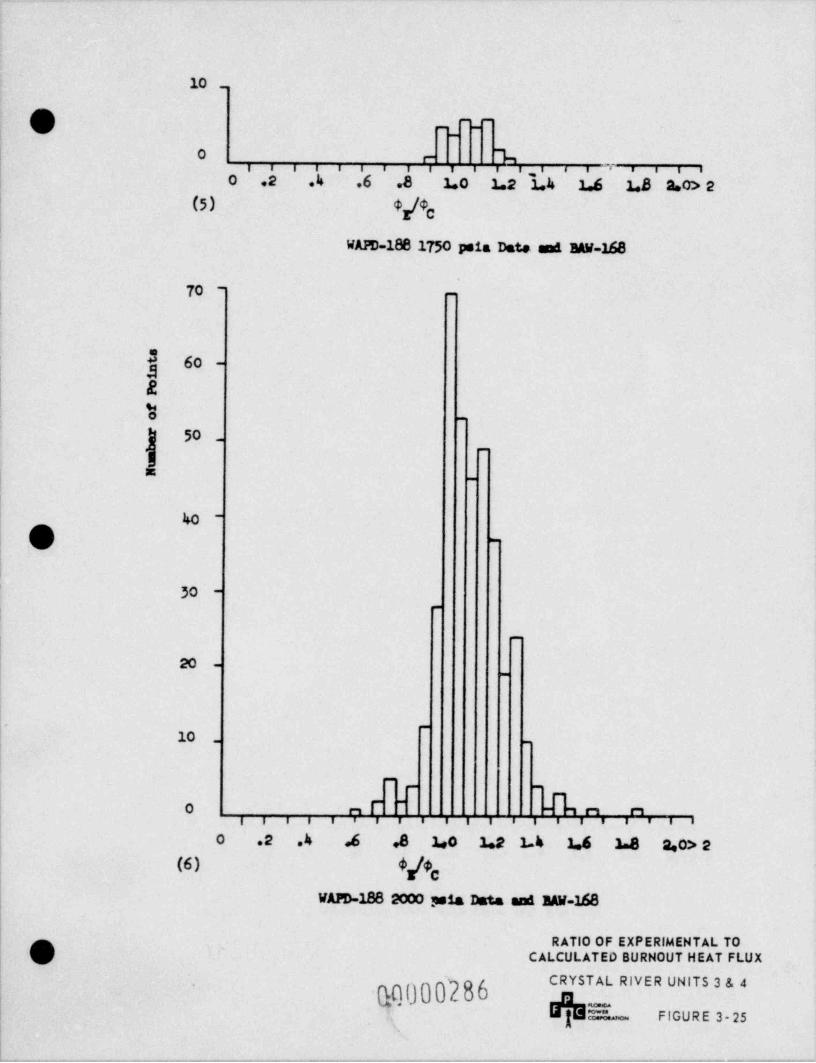
10 . |
Q - -_ -
_
O 1r-, e i i i e i i 1 i i i,i i i' > i i i
O .2 .4 .6 .8 LO L2 LA 14 LB 2.0> 2(5) $/$c
WAPD-186 1750 psia Date ama BAW-168
.
70 --
I 60 -
A&
1s -
50 -
_
m_
40 -
O -
30 -
~
|
_
20 -
-
. -
10 . -
-_ _
_
0 e, I'~
'" "~
, , i i i , ,,iiiiiiiie > > i i
0 .2 4 4 .8 1.0 1.2 14 1.6 L8 a,0> 2.
(6) 4/$evA m-188 2000 pia Data and BAW-168
RATIO OF EXPERIMENTAL TOO CALCULATED BURNOUT HEAT FLUX
CRYSTAL RIVER UNITS 3 & 4t0.000286
~._' " "
FIGURE 3-25--,
.---..,v- , , , .. e,,-,,-,w.... ,..~,,.-,..s.,_--,,,_w...~.......--,-,,,--e, ,..,-,--,,,,-.%w,-....,,-.wm,,w.-,-,e.w,,,--nw,se- - - -
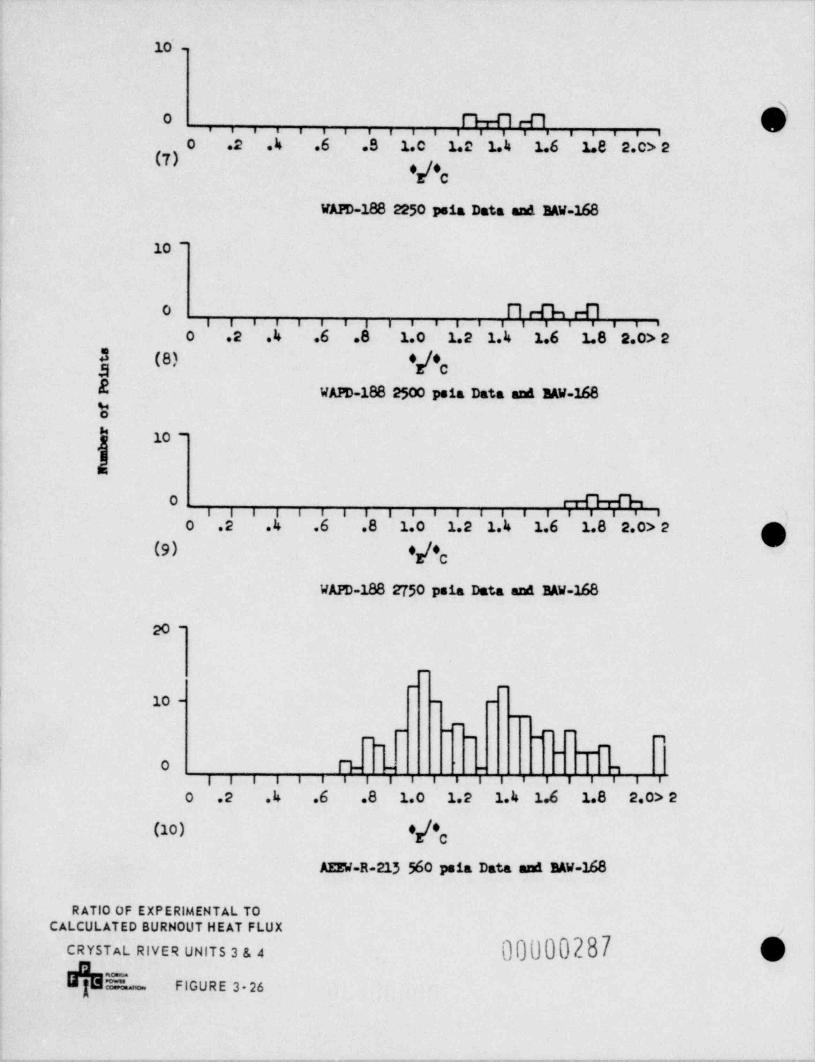
10' .
0 ("%-{~1 r-("1. . . . . . . . i . . i i i ,,, .
0 .2 .4 .6 .8 .1.c 1.2 1.4 1.6 1.8 2.c> 2(7) *g*c
WAPD-188 2250 Psia Data and BAW-168
10 -
| 0 n e-rk e-n. . .'
i i i , i . . i i i i i i i ii.O .2 .4 .6 .8 1.0 1.2 1.4 1.6 1.8 2.0> 2 i
j (8) */*cE WAPD-188 2500 Psia Data and BAW-168o"
10 -
0 Mi i i i i i i i i i e i i i iiiiiii
0 .2 .4 .6 .8 1.0 1.2 1.4 1.6 1.8 2.0> 2 g(9) I*E 'c
WAFD-188 2750 pois Data and BAW-168
to -
_
_ -
10 - - -,
__
_- - .- -
,_ _- -
_ __
0 I'l- ,- -
| 1 i e i i i i i i i i iiiiiii
0 .2 .4 .6 .8 1.0 1.2 1.4 1.6 1.8 2.0> 2
(10) *g*c
AEEW-R-215 560 psia Data and BAW-M8
RATIO OF EXPERIMENTAL TOCALCULATED BURNOUT HEAT FLUX
.
CRYSTAL RIVER UNITS 3 & 4 00000287 9.o**~"
FIGURE 3-26--
- .- .-.. . - - . . .- ... ., . - - . - .-. . - . . . - - - . - . - . . - . . . - - . _ . - - . . - . . - - . - . . . . - - . - . . , -
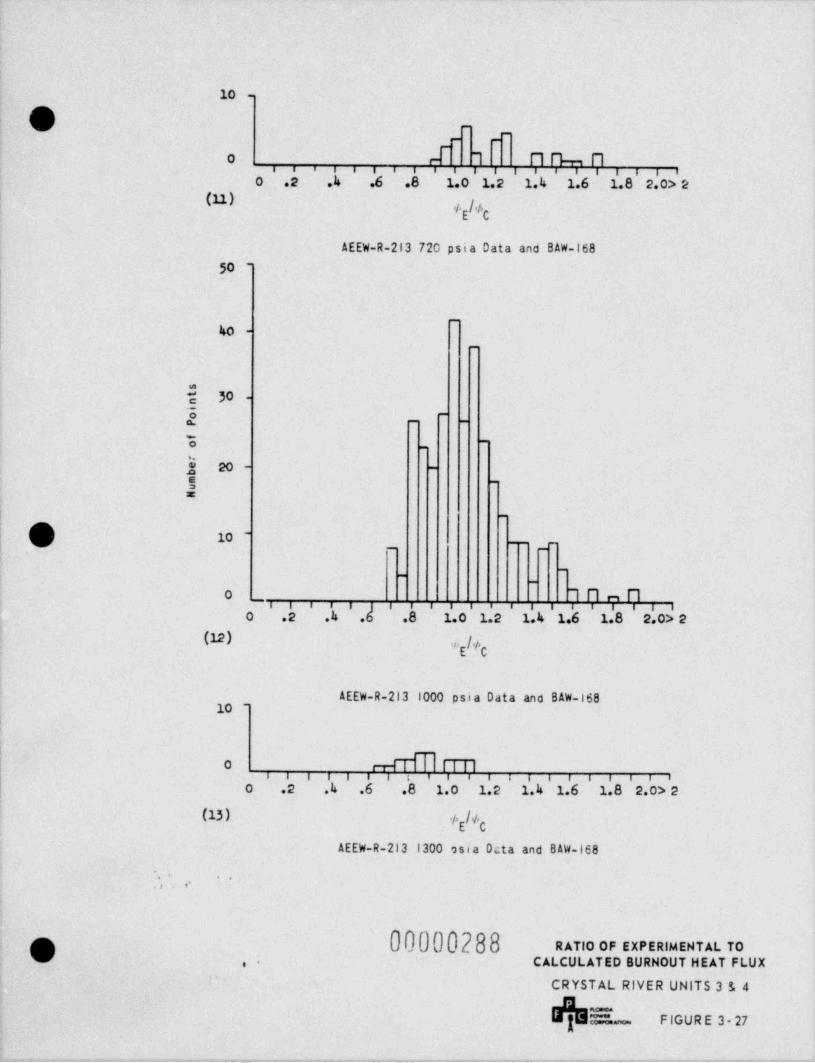
10 -
O .
-_ _
d -
...1 n. O. _,., nO
. . . . . . i i i i i i .0 .2 .h .6 .8 1.0 1.2 1.4 1.6 1.8 2.0> 2
SE 'C
AEEW-R-213 720 psia Data and BAW-168
50 -t
If
_
ko -| -
$ 30 --
_
, _ _
o -
.
3m- -
! -
x
i -
10 -_
__ __
-
__
. i....l.nnno _i i i i i i . i i i .
0 .2 .h .6 .8 1.0 1.2 1.k 1.6 1.8 2.0> 2(12) .g/*c
AEEW-R-213 1000 psia Data and BAW-168,
10 -r
M. i T I .n0i i i i i i . . . i i i i . .
0 .2 .h .6 .8 1.0 1.2 1.k 1.6 1.8 2.0> 2
(13) # #E CAEEW-R-213 1300 osia Octa and BAW-168
, , '*
.-
n 00000288 aATiO Or exesaiussTAL 10V CALCULATsD BURNOUT HsAT eLUX,.
CRYSTAL RIVER UNITS 314-
|||" FlGURE 3-27
. --_ _ _ -_.--_____. -_ . _ _ . ...___ _._ _ . - - _ _ -_.. _ _ _ _.
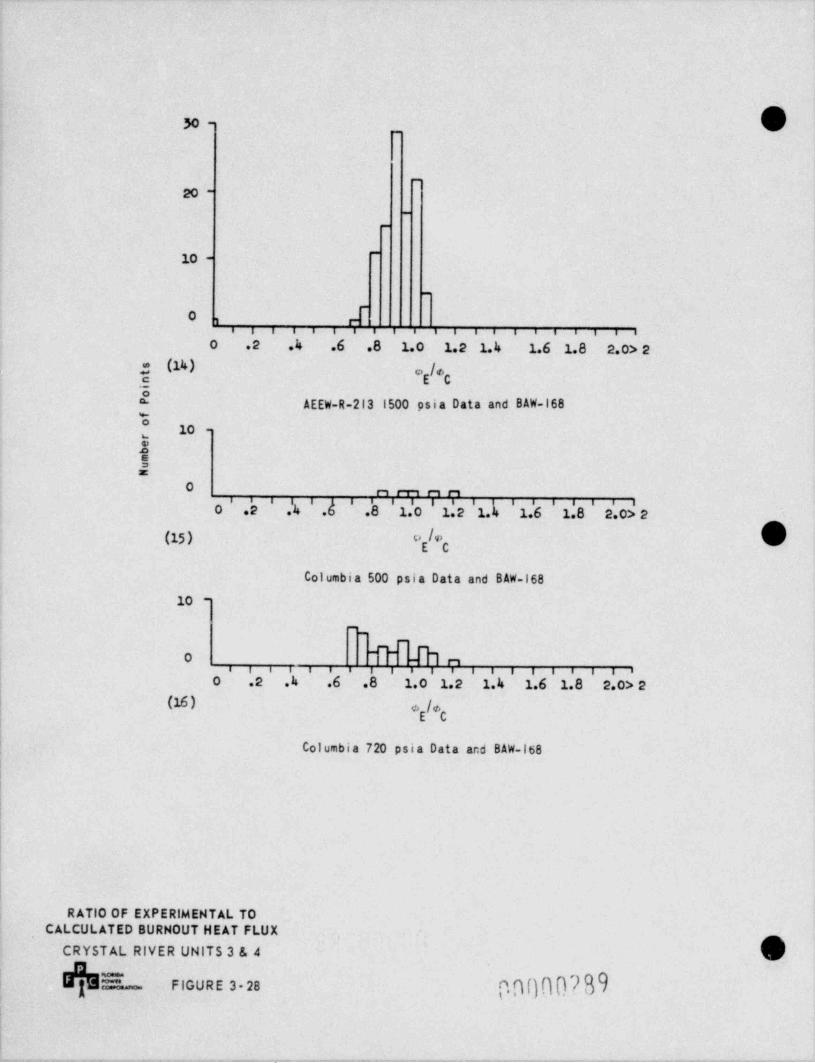
@N~_
_
20 -_
_
-
10 -
-
d0 ,
i i . . . i i i . . . . . . . . i i i i i0 .2 .4 .6 .8 1.0 1.2 1.4 1.6 1.8 2.o> 2
(14) o /e*
.g E C0~ AEEW-R-213 1500 psia Data and BAW-168o
10 -,
E*,z
o .n,,,nni i i i i i . i i i i i i . . . . . iO .2 .4 .6 .8 1.0 1.2 1.4 1.6 1.8 2.0> 2
(15) 5'E 'C
Columbia 500 psia Data and BAW-168
10 -
_
_
Onoi i i i . . .iiiiie i iiie i i i
0 .2 .4 .6 .8 1.0 1.2 1.4 1.6 1.8 2.0> 2(16) #/CE
Columbia 720 psia Data and BAW-168
||
RATIO OF EXPERIMENTAL TOCALCULATED BURNOUT HEAT FLUX
CRYSTAL RIVER UNITS 3 & 4
fiOI)OO2hE~ FIGURE 3-28
!
- - - - , . . . . -, . . - . . - - . - - - . . . _ . - - .. - - - - . . .- .. - - .- .- . . . . ..
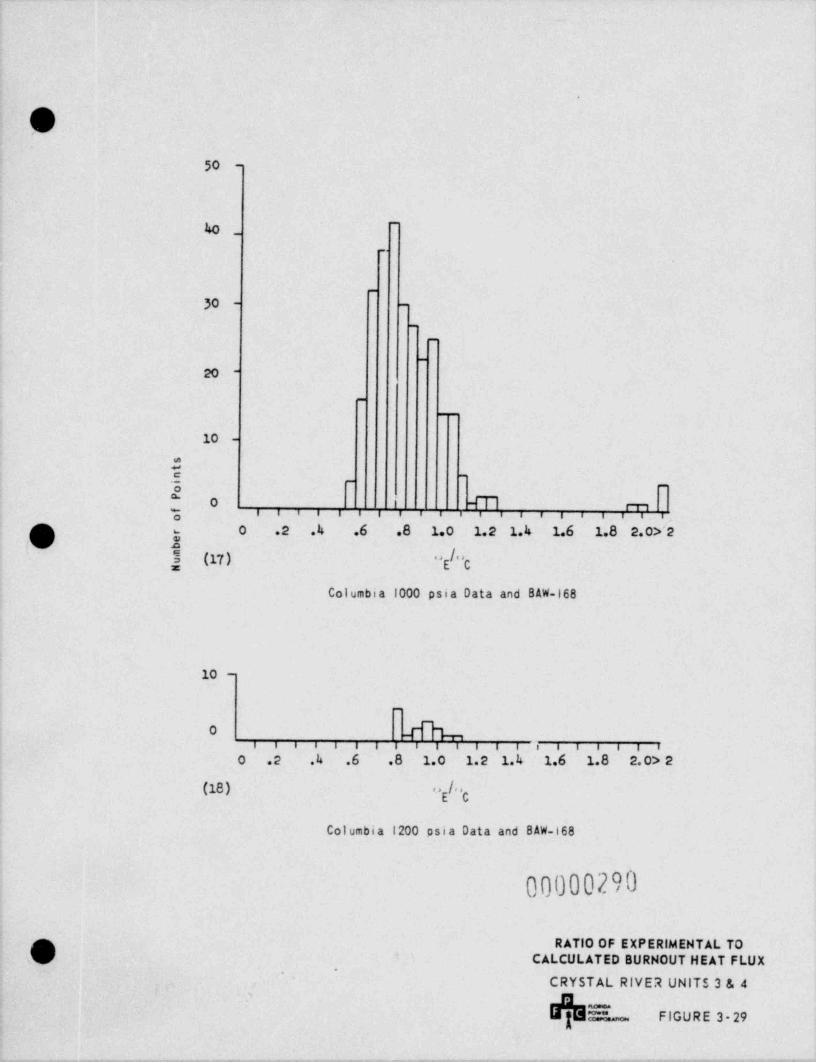
_
O50 -
"
40 _..
-
30 - -
_
_
_
20 -
.
__
10 -
0.c -
_
"
" -fTlo 1 r,,g i i e i e i i e i i i i e i e i i i i i,
p 0 .2 .4 .6 .8 1.0 1.2 1.4 1.6 1.8 2. 0>' 2-
id E3 (17) ''E "Cz
Columbia 1000 psia Data and BAW-168
10 -
.
bOi i i e i i e i e i i i i i i e i i e i i
0 .2 4 .6 .8 1.0 1.2 1.4 1.6 1.8 2. 0> 2
(18) "E "C
Columbia 1200 psia Data and 8AW-168
00000290
fs RATIO OF EXPERIMENTAL TO() CALCULATED BURNOUT HEAT FLUX'
~
CRYSTAL RIVER UNITS 3 & 4
E FIGURE 3-29
. . . . . -- _ . .
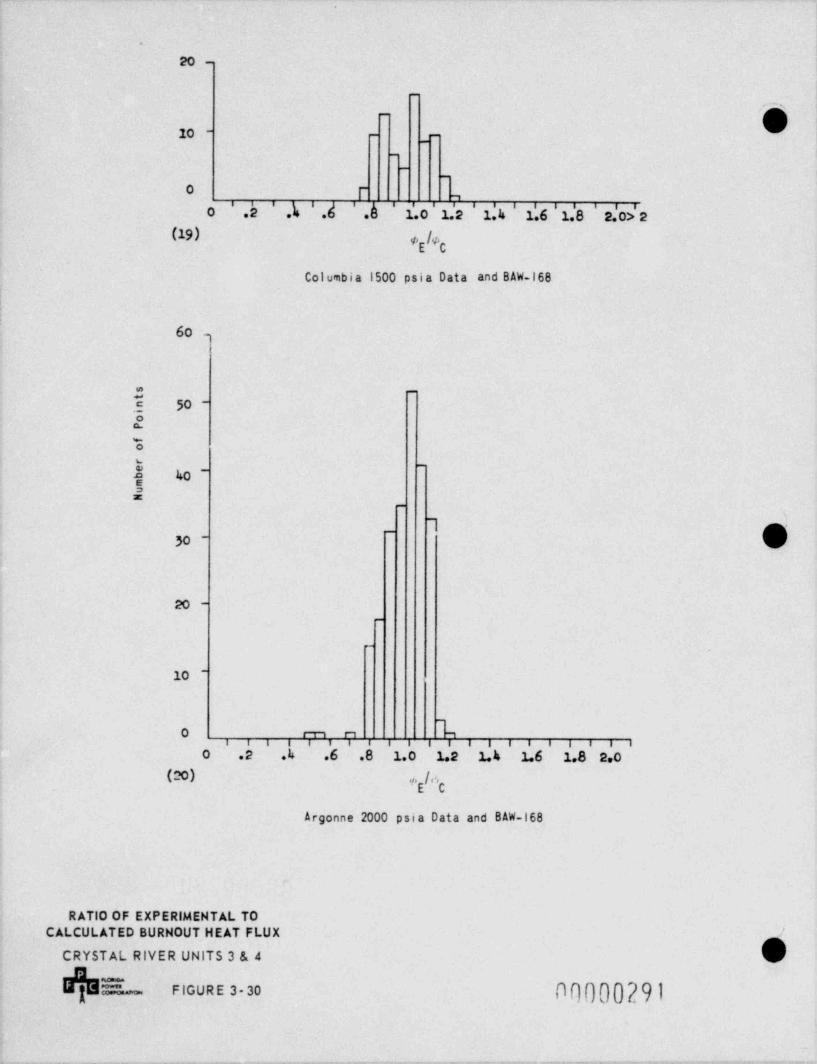
-.
.
to -
1
_ 1
_'
lo - - _- |_
~
_
0 [ ,
0 '.2 ' .h ' .d ' .b ' l'.0 ' 1.'2 ' 1.4 ' l'.6 ' 1.'8 ' 2.'O> 2'
(19)*E *C
Columbia 1500 psia Data and BAW-168
||
60 ,
-
5 50 ~2%
$~
40 -4*
_
30 -~
20 -_
_
10 -
0 ,7,7,,,,, , , , , , , , , , , ,0 .2 .4 .6 .8 1.0 1.2 1.4 1.6 1.8 2.0
(20)"'E 'C
Argonne 2000 psia Data and BAW-168
RATIO OF EXPERIMENTAL TOCALCULATED BURNOUT HEAT FLUX
CRYSTAL RIVER UNITS 3 & 4
E FIGURE 3 30 [lOQQQ29 )
. . . . . . - , ,_ . - , . - . -. , --. . . ., -- - . . .
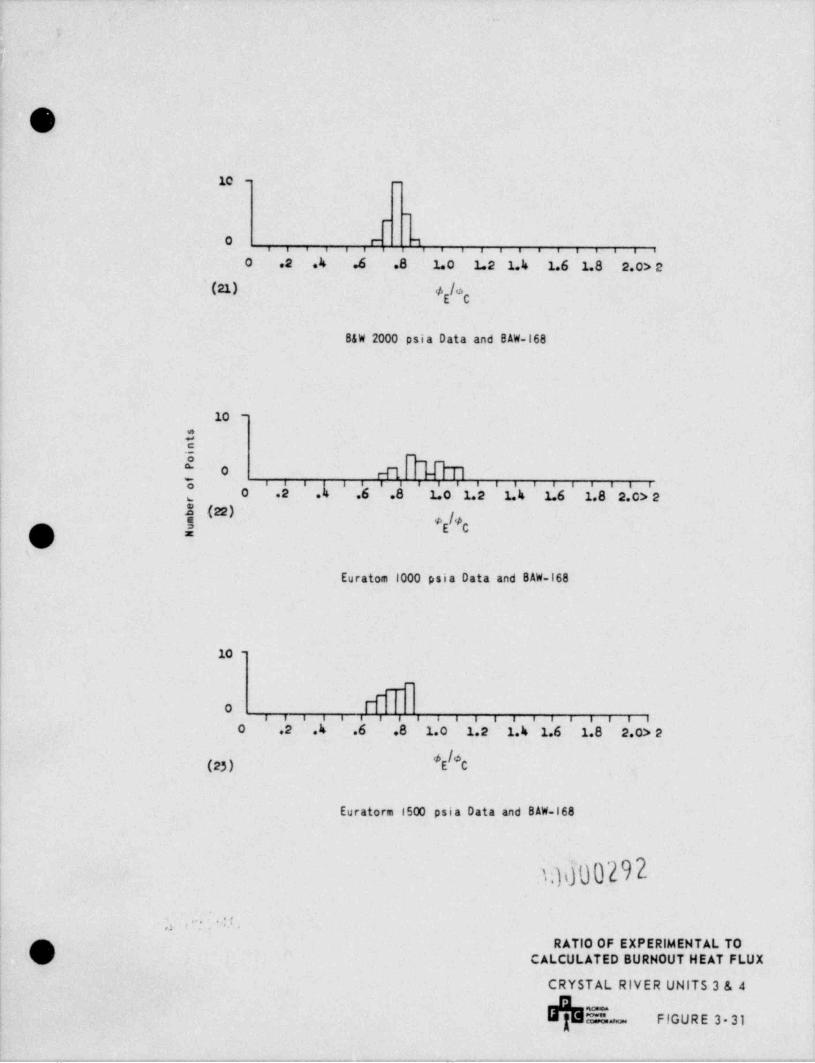
i
!
O
10 - -
-
-
O r ,a i . i s 6 . . . . . . .......
0 .2 .4 .6 .8 1. 0 1.2 1.4 1.6 1.8 2.0> c
'(21) #E C
B&W 2000 psia Data and BAW-168
10 -
O.E -o
[ 0 r-f'l Dt
! o 3 8 8 i , ie i s a s i s i s a a a i , i
0 .2 4 .6 .8 1.0 1.2 1.4 1.6 1.8 2.C> 2'
u
S (22) # /#=; E C
Euratom 1000 psia Data and BAW-168
!
10 -
__-
5....,,,,,.,,,,,0. , , . .
0 .2 4 .6 .8 1.0 1.2 1.4 1.6 1.8 2.0> 2
#(23) E C
Euratorm 1500 psia Data and BAW-168
|
?0000292
U..
, , ,
RATIO OF EXPERIMENTAL TOCALCULATED BURHOUT HEAT FLUX
CRYSTAL RIVER UNITS 3 & 4
== F!GURE 3 31
_._ _ _ . _ _ _ _ _ . . , _ _ , , _ . _ _ . . . . . . _ _ _ __ . . . . _ . . . . _ . . . _ _
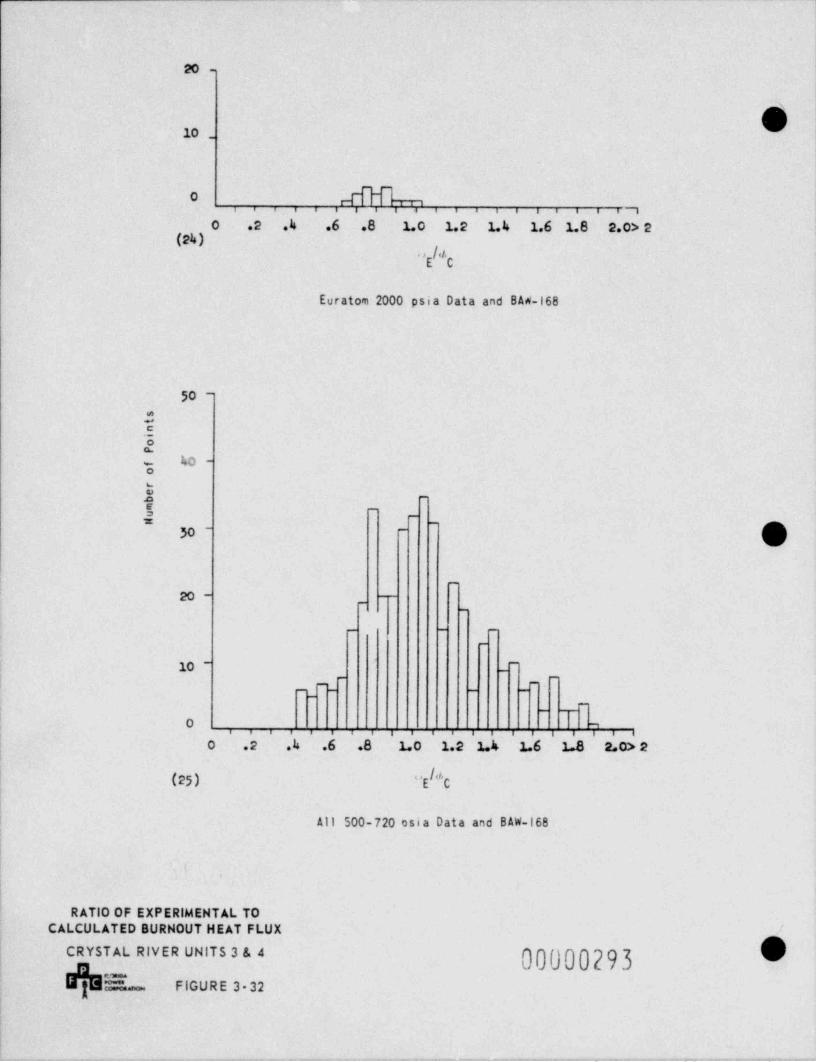
1!
|
20 - |
10 _
d .i ... ..i,iO
ii--i - i i i i
O .2 .h' .6 .8 1.0 1.2 1.4 1.6 1.8 2.O> 2 |
(24). , htg c
Euratom 2000 psia Data and BA*'-168
50 -*
.52
40 --o
Uo -
K-
=_
_
30 --
po __
_
_
_ _ _
; 10 - _
-
[ -_
i__ _ _
-
i-
To ,i i i i i e i>i. .. . .ii.,
( 0 .2 .h .6 .8 1.0 1.2 1.k 1.6 1.8 2.O> 2
I (25) "E "'C
All 500-720 osia Data and BAW-168.
(
RATIO OF EXPERIMENTAL TOCALCULATED BURNOUT HEAT FLUX
00f)00293 0f CRYSTAL RIVER UNITS 3 & '
3 FIGURE 3 32
- _ _ , ._. . . _ _ - . _ _ , . . _ _ _ . . . . _ . _ - - . . _ .
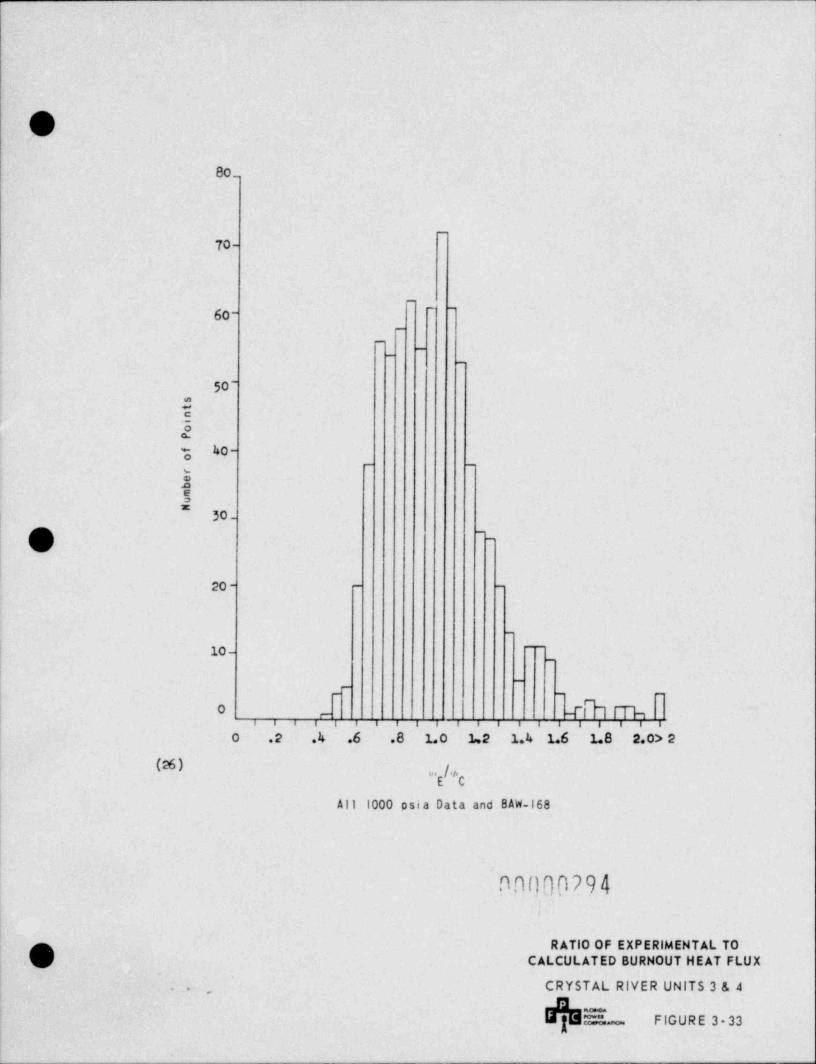
,OU
80_
_
70-
_
60-' ~
_
-
-
_
50-
.52g 40-
- -
E$x
! 30.'
_
~ % s|_
l
|'
20 _ _
_
10---
_
-
_
. _ _
gg% [.Th.0 ,_
; i . . . . . . . . , . . . . . . . .
O .2 .4 .6 .8 1. 0 L2 1.4 1.6 1.8 2.0> 2'
W). /.,,cg
All 1000 psia Data and BAW-168
nn000794,
,f w. RATIO OF EXPERIMENTAL TO
() CALCULATED BURNOUT HEAT FLUX;
CRYSTAL RIVER UNITS 3 & 4.,,
-
=- FIGURE 3 33
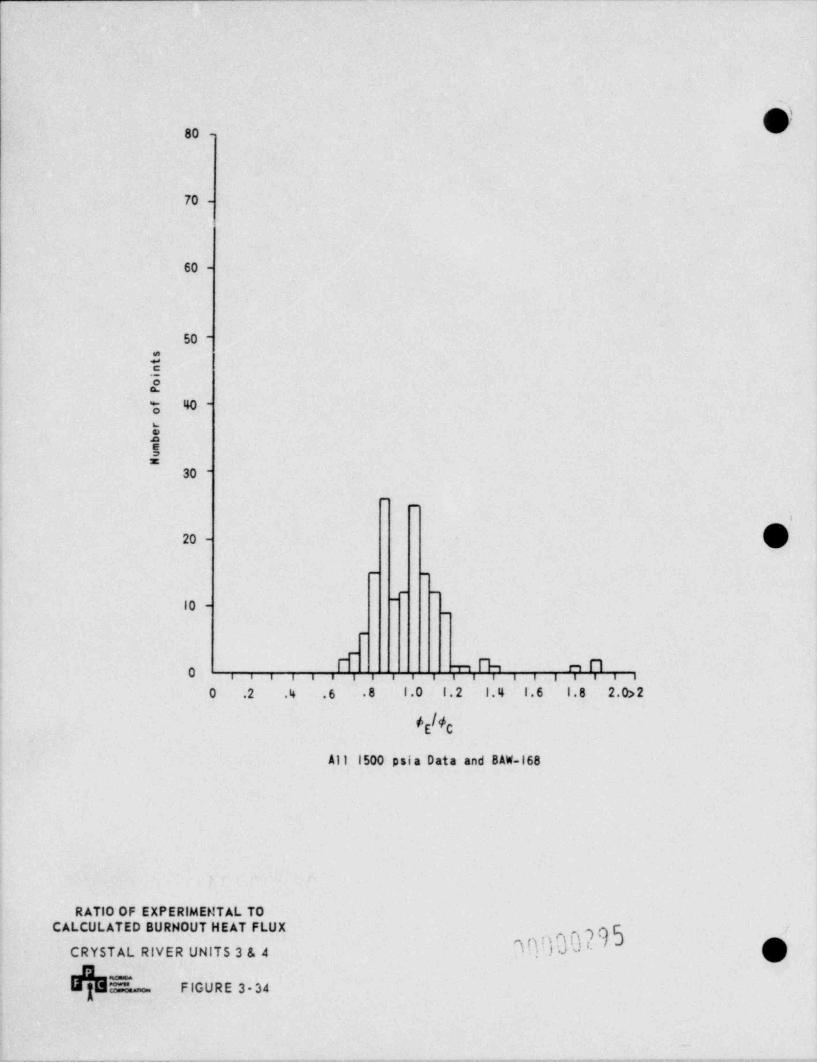
80 -|
I
|
70 -
!
' 60 -
50 -
.52% 40 -
ti4
30 --
_
20 -
- .
_ _
10 --
_
m@ m M,O i , ii i i i i i i i i i i i i i i i i
0 2 4 6 8 1.0 1.2 1.4 1.6 1.8 2. 0> 2.. . .
(E C
All 1500 psia Data and BAW-168
RATIO OF EXPERIMENTAL TOCALCULATED BURNOUT HEAT FLUX -
CRYSTAL RIVER UNITS 3 & 4 Y: h-
h FIGURE 3-34
_
* - - - - - * --m_-- - - - - - a---y v - y w-- gewv-- -w =---gv ,--ev ---c.y --*-o.-W- -w--y- -%yw g ,9g y w-,e, , - - --9m 9y.w-999- , -.-wmn - . , ,w w
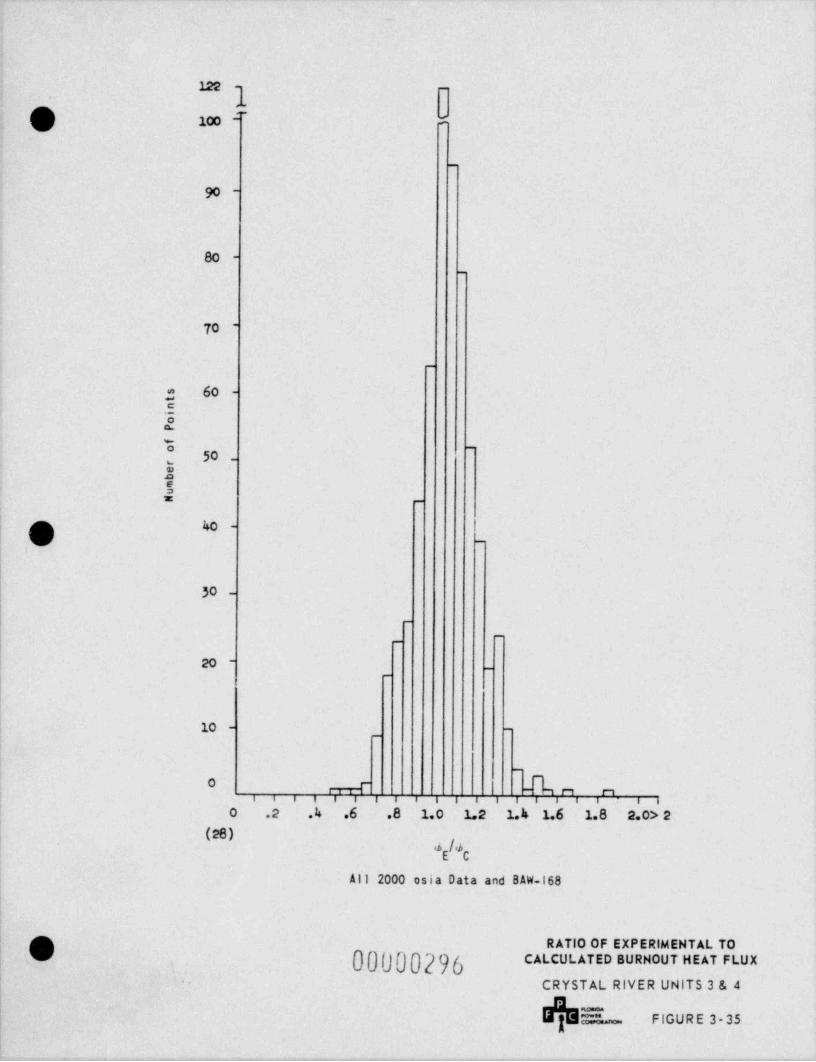
._.
122 -
tm .
(j 100,--
_
90 -
80 -_
70 -
_
60 -.5;
2o -
50 -m
25= _
" -
| Q _
30 -
_
-
_
20 - _
_
|1
| 10 - -
_
_
,..I O r,0r,
i . . i i iiiiie i i i i i i i i io .2 .4 .6 .8 1.0 1.2 1.4 1.6 1.8 2.o> 2
(28)<hE C
All 2000 osia Data and BAW-168
! Q RATIO OF EXPERIMENTAL TO'
00IJ00296'U c^'c"'^''"""""'""^'''"*
CRYSTAL RIVER UNITS 3 & 4*
1-
== FIGURE 3 35
- _
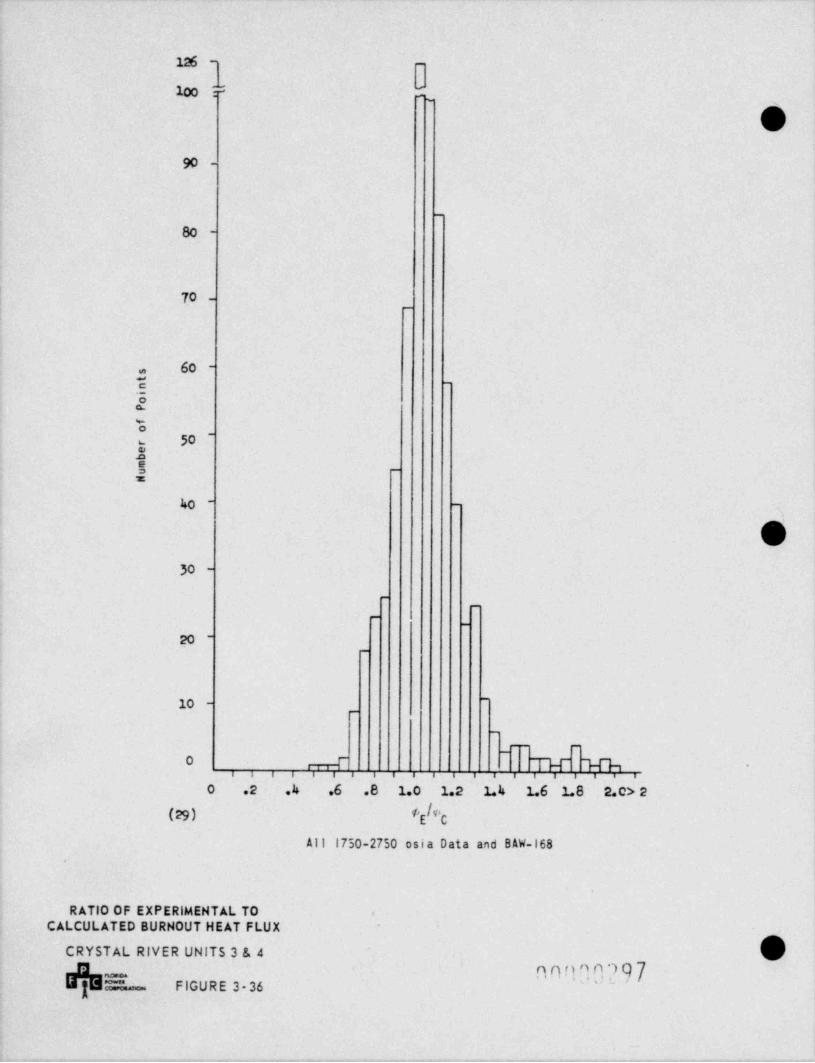
126 - -
100 i: (O
90 -
_
80 -
| 70 -l
-
60 -c -
'5CL
o-
50u
E
$~
40 - -
630 -
-
_
~_
20 -_
10 --
_
-
__ __
0 r,,-r.ii........ T.I-r.M. -
. > i . . . .
0 .2 .4 .6 .8 1.0 1.2 1.4 1.6 1.8 2.c> 2
(29) f'E 'C
All 1750-2750 osia Data and BAW-168.
RATIO OF EXPERIMENTAL TO ,
CALCULATED BURNOUT HEAT FLUX -
^ CRYSTAL RIVER UNITS 3 & 4
nn400?97_
h FIGURE 3-36 '~
- - . --. . . . . . __.
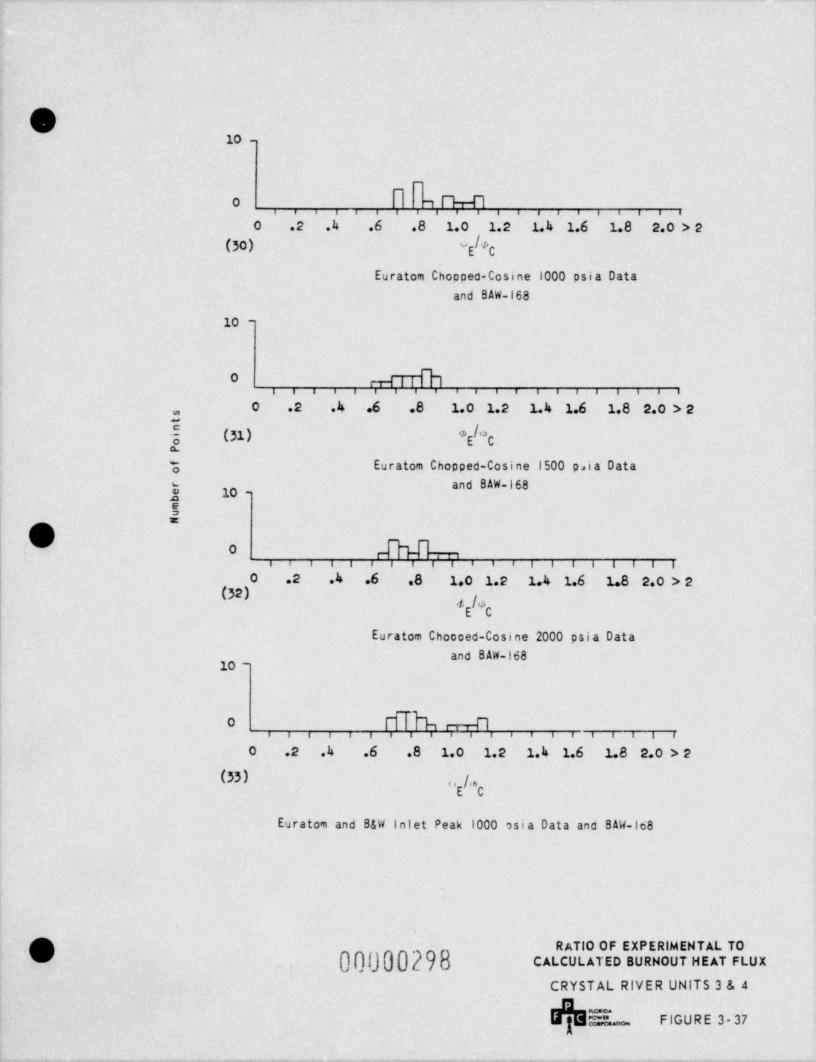
l.-
Oa10 -
b , m M.Oi i . . 4 i i i i . . . . . . . i i i
0 .2 .4 .6 .8 1.0 1.2 1.4 1.6 1.8 2.0 > 2
(30) o #E C
Euratom Chopped-Cosine 1000 psia Data
and BAW-168
10 -
. M ..iii .ii .0
i i . . i i
0 .2 .k .6 .8 1.0 1.2 1.4 1.6 1.8 2.0 > 2.-
y (31) *E Ca.
% Euratom Chopped-Cosine 1500 p.ia Data"" ' 'IO0
3 10 -
{ !=
|0" 0i i i i i . iiiiie i i e i iie i i
0 .2 .4 .6 .8 1.0 1.2 1.4 1.6 1.8 2.0 > 2(32)
4 #E C
Euratom Chocoed-Cosine 2000 psia Data
_and BAW-168
hhii,i M.0
i i i i . . . . . , ,iii,
0 .2 .4 .6 .8 1.0 1.2 1.4 1.6 1.8 2.0 > 2(33) i, / .
Euratom and B&W inlet Peak 1000 osia Data and BAW-168
L] 00000298RATIO OF EXPERIMENTAL TO
cA'cu'Ars0 suawouT NEAT etux
CRYSTAL RIVER UNITS 3 & 4
E- FIGURE 3 37
.. - - .- - - - . -- - -
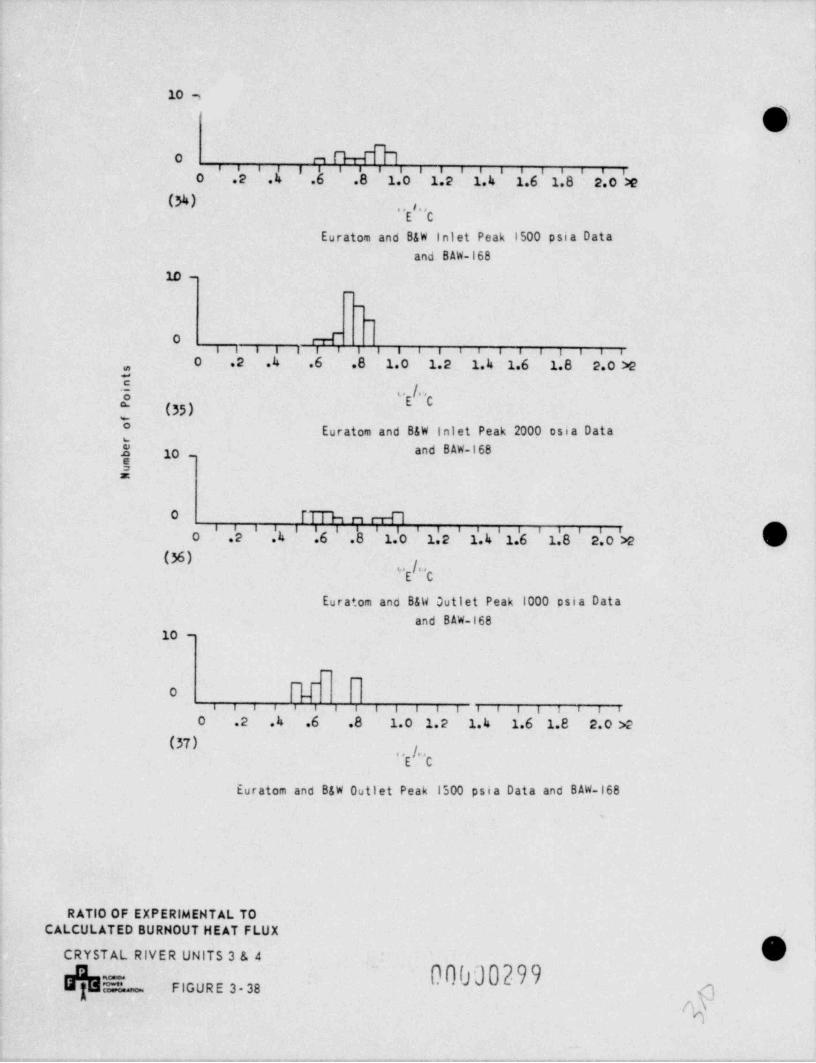
,
10 m!
O!
O r,i i i i , i i i i i i i . i i i i i i i i
0 .2 .4- .6 .8 1.0 1.2 1.4 1.6 1.8 2.0 :e
(N) ., s.,
Euratom and B&W Inlet Peak 1500 psia Dataand BAW-168
1D -.-
0 &i i i i i e i i e i i i i . . i i i . . .
0 .2 .4 .6 .8 1.0 1.2 1.4 1.6 1.8 2.0 >2.
"c/-
"E ' 'c[ (35)
Euratom and B&W Inlet Peak 2000 osia Data
10 - and BAW-168$x
0 [% n r-rflO ' .'2 .'k
'.6 ' .h ' 1.'O ' 1 2 ' 1. 4 ' 1.6 ' 1. 8 ' 2. 0 >2
' ' '
(36)s /"'cg
Euratom and B&W Outlet Peak 1000 psia Dataand BAW-168
10 -
-
NOi i i i iiie i i i iie i i i 3 i i i
0 .2 .4 .6 .8 1.0 1.2 1.4 1.6 1.8 2.0 >2(37)
. . I.''c! Euratom and B&W Outlet Peak 1500 psia Data and BAW-168
,
RATIO OF EXPERIMENTAL TOCALCULATED BURNOUT HEAT FLUX
;
CRYSTAL RIVER UNITS 3 & 4
00000299-
h FIGURE 3-38 3QA\G
, . - . . .- . . - . _ _ . . .- . - . , _ . . .. -.
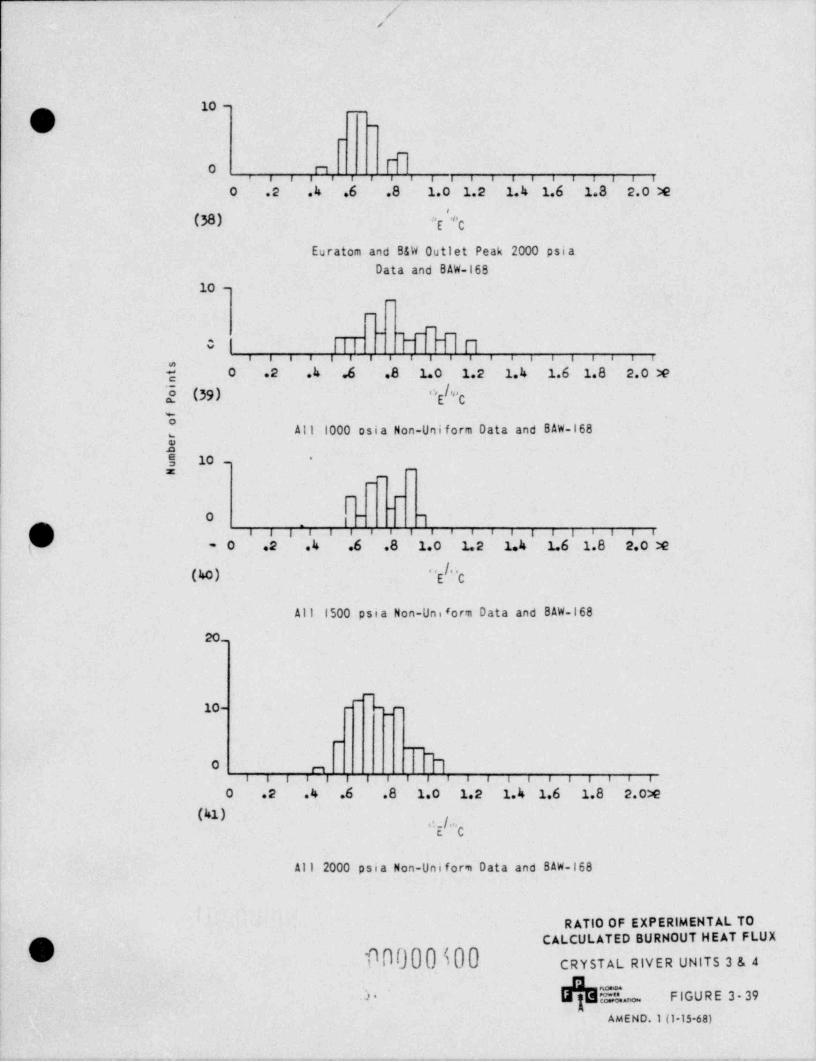
_ _ _ - -
//
10 -,q __
Gi _
_
d.. i .,ii.
0 mr i i i i i i i i
0 .2 .4 .6 .8 1.0 1.2 1.4 1.6 1.8 2.0 M
(38) *E 'c
Euratom and B&W Outlet Peak 2000 psiaData and BAW-168
10 -_
_
~
0 i nT-
W Cni e i i a i i i i i i i i i e i i i . i i,
; O .2 4 .6 .8 1.0 1.2 1.k 1.6 1.8 2.0 M
2 (39) '''E ''c0
All 1000 osia Non-Uniform Data and BAW-168,
EB 10 - *
-=_
_
f- _~0 q
Qw_
i.i i i i i . . i i i . . . i i i i i . .-0 .2 .4 .6 .8 1.0 1.2 1.k 1.6 1.8 2.0 Mg
(40) 'E "C
1500 psia Non-Uni orm Data and BAW-168fAll
20_
|
_
-
10- - - _-|
-__
h0 ,mi i i i a iiiiie i i i e i i i e i
0 .2 .4 .6 .8 1.0 1.2 1.4 1.6 1.8 2.0>e
(41) le.g .'c
All 2000 psia Non-Uniform Data and BAW-168
RATIO OF EXPERIMENTAL TOCALCULATED BURNOUT HEAT FLUX[J 00000400 CRYSTAL RIVER UNITS 3 & 4
'
3* 3 FIGURE 3 39
AMEND.1 (1-15-68)
.. ,. - . , - - . . , . . . - . - , - - - - - . . - - , . - - . . _ _ . - . . . . - - -
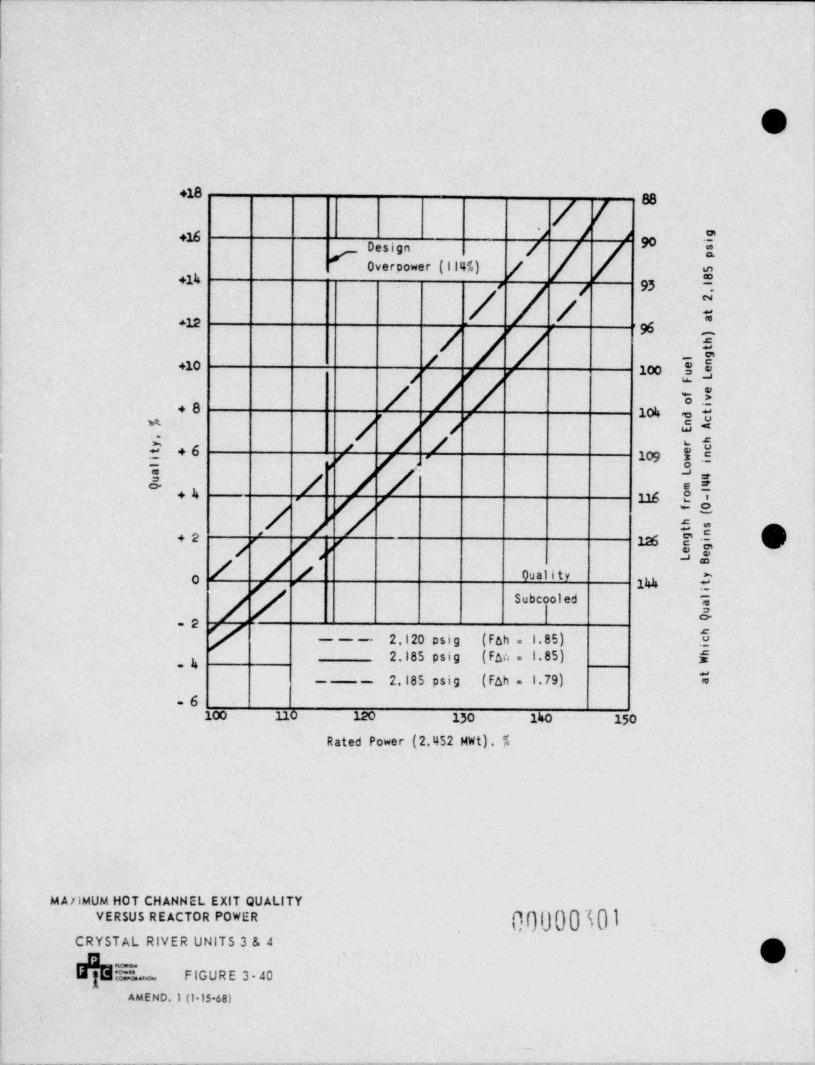
..- . . _ . ,
1
O
+18 88
/ f*
Design NOverpower (ll4%) / g
+14f 95 .e
i / / xN
412 -
; ' 96'
7 -
k+10 100 $g g
+8 104-
*e
.j'/ff 3 Ea
: / 2 5- +6 i109 g .5g ,
',
A., / /[ j$u6
+2 r' 126/ fs f O EO 0"'I
144 ${ 7 ,
Subcooled =
| 52,120 psig (Fah= 1.85) $---
2.185 psig (Fan . l.85) f-ka
2,185 psig (Fah . l.79) *- -
-6100 110 120 130 140 150
Rated Power (2,452 MWt). %
MA7| MUM HOT CHANNEL EXIT QUALITY
00000T01 -VERSUS REACTOR POWER
CRYSTAL RIVER UNITS 3 & 4 g| d h a _ rioURe 3 40
AMEND.1 (1 15 68)
Ii
-.
. _ _ _ _ _ _ _ _ _ _ . . _ _ _ _ _ _ _ _ . _ _ . . . . - . . . . . _ . . . _ _ _ . . . . . . - . . . . . . _ . - . . , , , . , _ , _ , - . . . . . - . . . . - . . _ - - . _ , - . - . . . . . . , . .. . . . ---
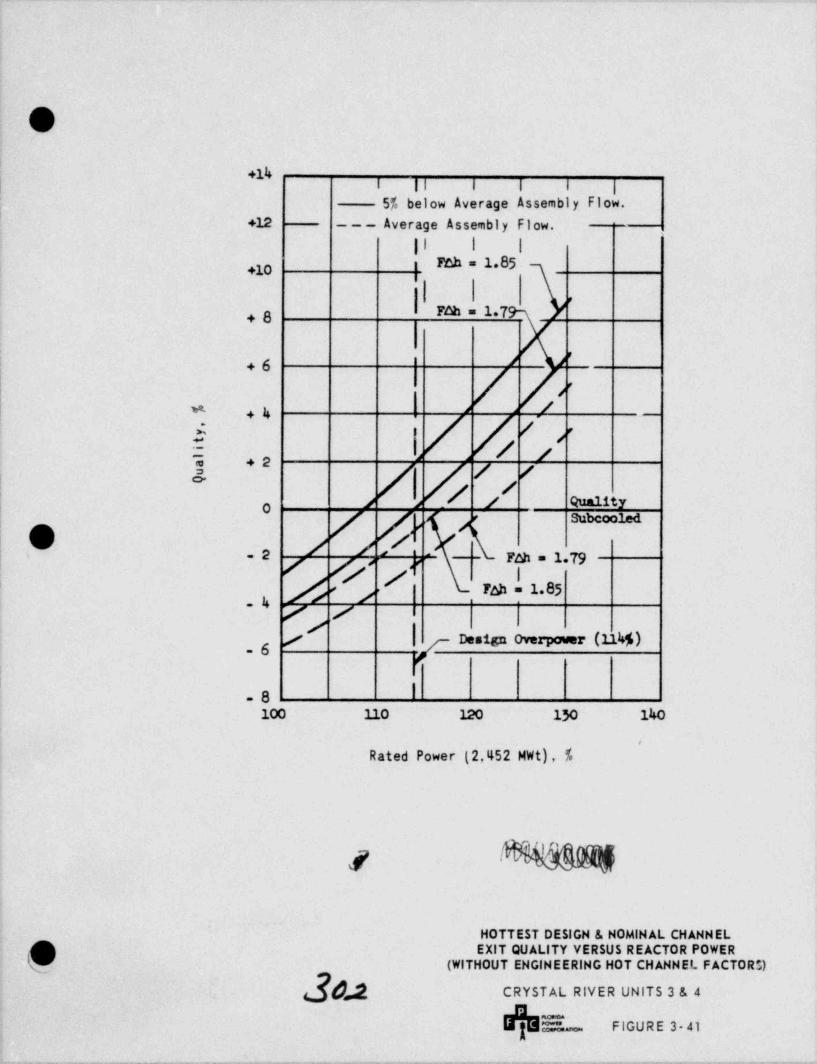
_ _
j
|
'
O; +14| I Il i I i |, 5% below Average Assembly Flow.
+12 --- Average Assembly Flow.,
Il i IFah = 1.85+10
a
p
,g Fah = 1 7
'
+6 /-
/-- .4 . .
5 / // ''
-. ., .2
/ /I 4"*1$t:'A '0
O /, //. K ah = 1 79r Subcoo:.ed
-2 / F'i
| ,
/ / |/ Fan - 1.85i
f,,
/'/I[ "'** "" IllO)#-6
-8 |
100 110 120 130 140
s
Rated Power (2,452 MWt), %
HOTTEST DESIGN & NOMINAL CHANNEL
O.EXIT QUALITY VERSUS REACTOR POWER
% (WITHOUT ENGINEERING HOT CHANNEL FACTORS)
dJ CRYSTAL RIVER UNITS 3 & 4
$s_ ,,euRe 2 4,
. _ _ _ . _ -. - -___._ _ __
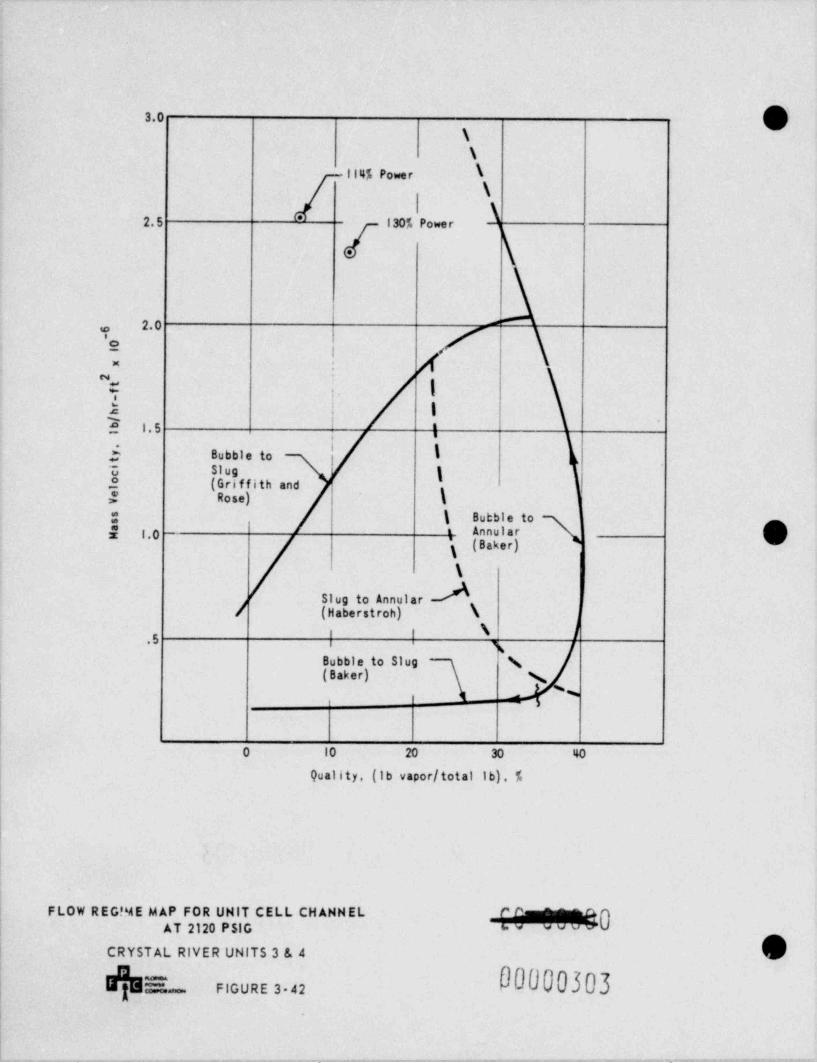
g3.0
\
|14% Power \
\,|*2.5 130% Power
)2~0 "
! f \l-
2 : i3 1.5 I
'
*i
3.
$ Bubble to $'
['S Slug }3 (Griffith andJ Rose) k3 % Bubble toE I.0 t Annular
g (Baker)\
Slug to Annular/ (Haberstroh) \
i f \$
# i gBubble to Slug N
. (Baker) N*
i 3
|
| 0 10 20 30 40
Quality (Ib vapor / total Ib), %
t
FLOW REG!ME MAP FOR UNIT CELL CHANNEL0
CRYSTAL RIVER UNITS 3 & 4
E FIGURE 3-42 03
|
|_. ..- .. . - ._ . - . . . - . - - - . - . - . _ . . . . . - .
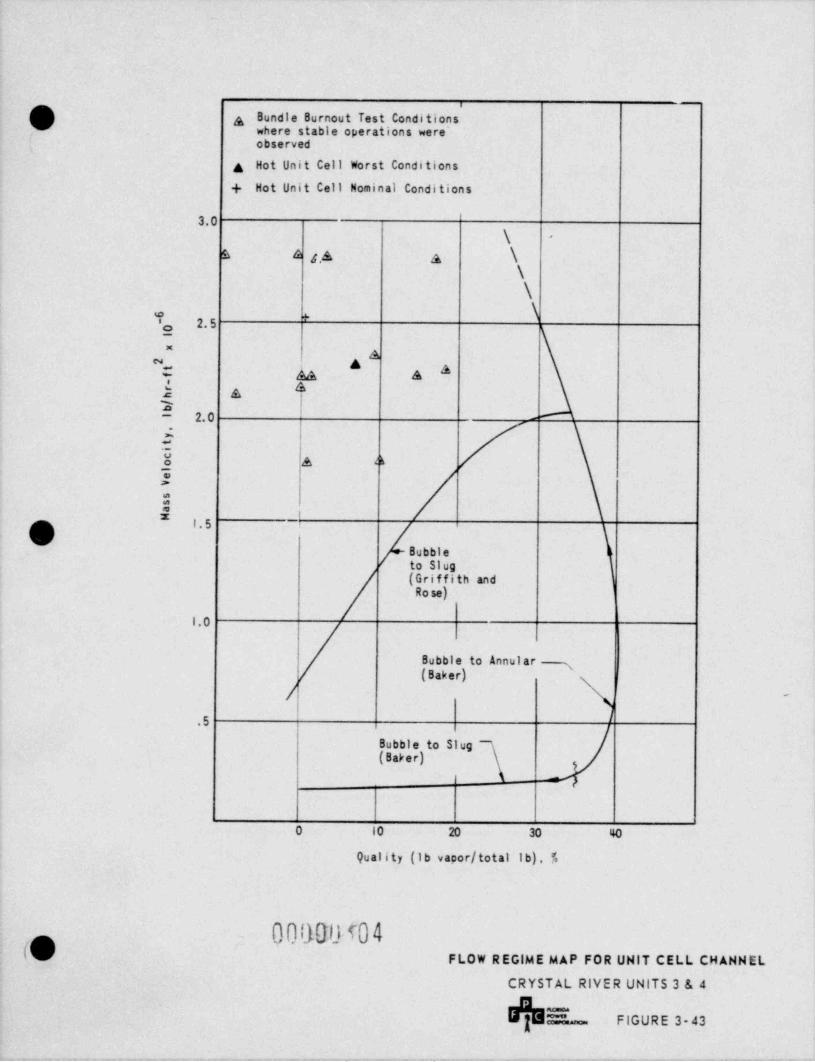
g Bundle Burnout Test Conditionsih where stable operations were'' observed
A Hot Unit Cell Worst Conditions+ Hot Unit Cell Nominal Conditions
3.0\ -
6 4 s.A a \\
\
' o_ 2. 5' \. .
.
Sm A AO da AI a 63 |
-- 2. 0458 A d
E::E 6
i.5 >
Bubbleto Slug(Griffith and
Ro se)
1.0
Bubble to Annular x(Baker)
/ -
.5
Bubble to Slug(Baker) ,
_
0 10 20 30 40
Quality (Ib vapor / total Ib), 7
FLOW REGIME MAP FOR UNIT CELL CHANNEL
CRYSTAL RIVER UNITS 3 & 4
5- FIGURE 3-43
- . _ . _ . - - .
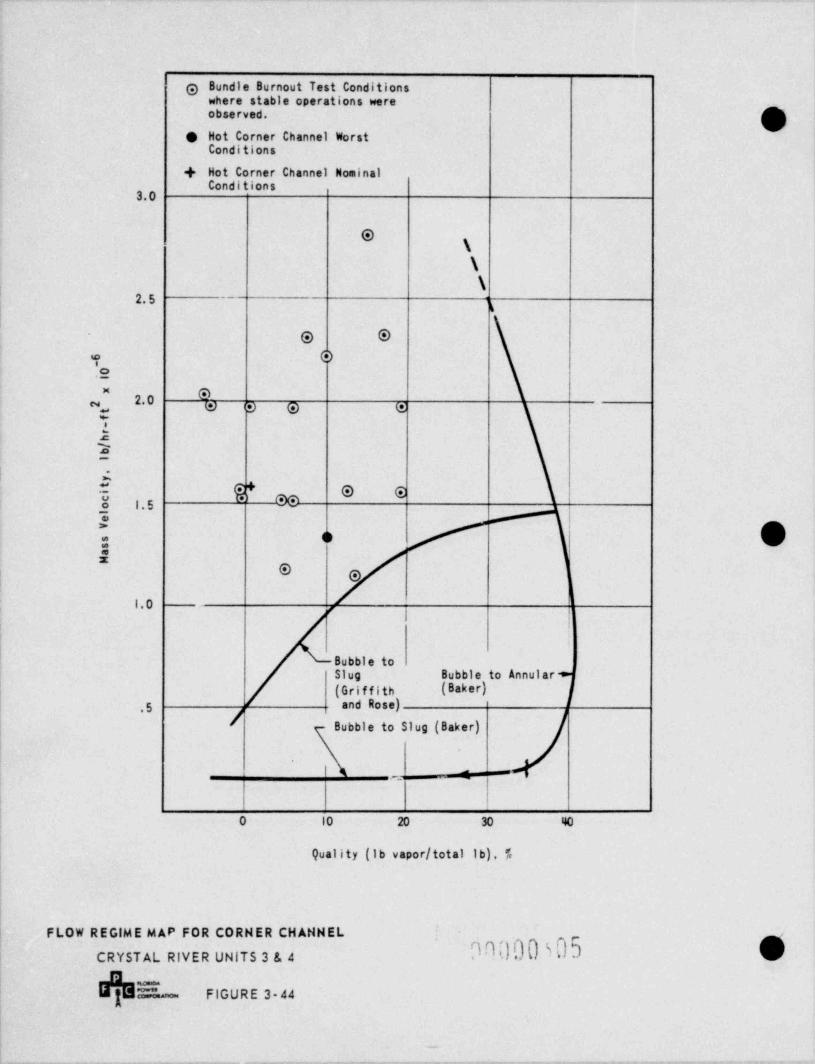
g Bundle Burnout Test Conditionswhere stable operations wereobserved.
9 Hot Corner Channel WorstConditions
+ Hot Corner Channel NominalConditions '
3.0
*\
\
\2. 5 g
!
O O
i O.o* S2.0% W @ @ E7a2-
| 4
h 1.5 N
j y eoZ
O! O!
|0 r ;
,
Bubble toSlug Bubble to Annular *(Griffith (Baker)
5 . andRose) '
j Bubble to Slug (Baker)i
I; I :
-
<_
0 10 20 30 %
Quality (Ib vapor / total Ib), %
FLOW REGIME MAP FOR CORNER CHANNEL
9n.)00s05 eCRYSTAL RIVER UNITS 3 & 4
_
h FIGURE 3-44|
| -
_ - _ _ , _ _ . _ . _ , . _ _ _ _ . _ _ _ _- .-- --_ - _-- - - - - - - -- - ~ . - - - - - - - - -- - - - - - - -
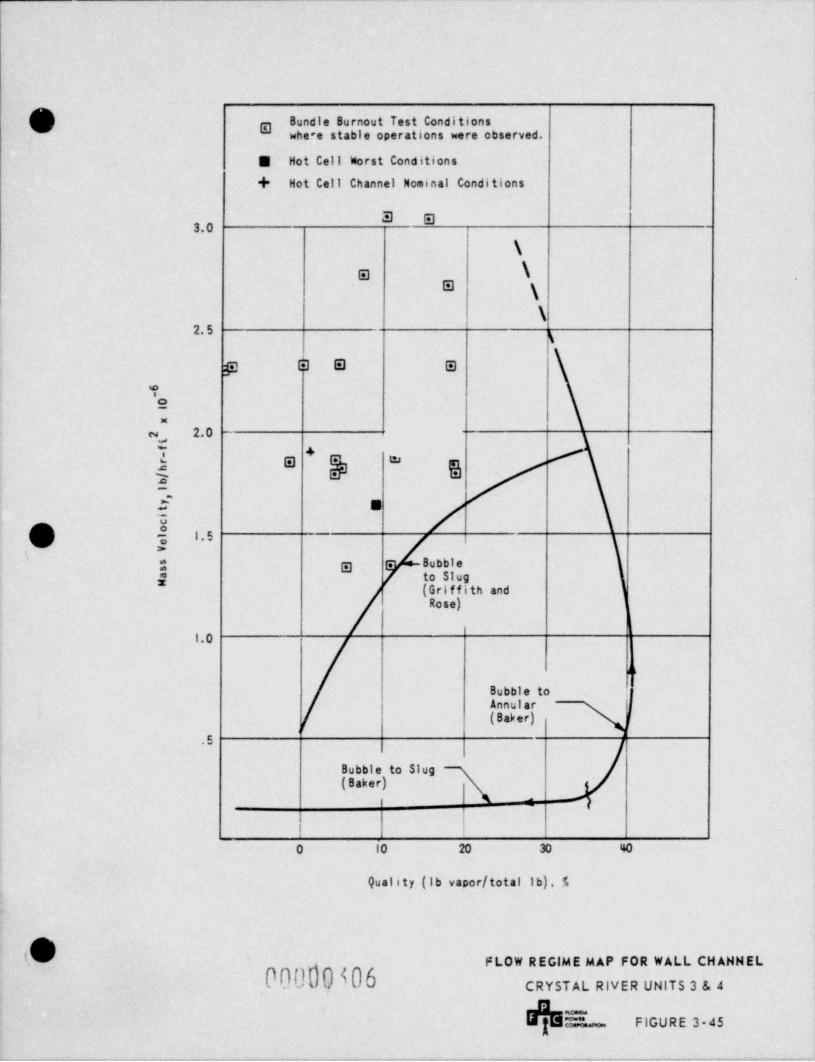
__
Bundle Burnout Test Conditionsg where stable operations were observed.
5 Hot Cell Worst Conditions
+ Hot Cell Channel Nominal Conditions
3.0
\
e \8 \
\2. 5
g
g s e ee'o
M
u, 2.0i$ +h $e
-
g 1.5i *
Bubbleg g .
.; to Slug(Griffithand
Rose)
1.0
d 6
Bubble to i
Annular I
( Baker) f'
.5
Bubble to Slug(Baker)
:
0 10 20 30 %
Quality (Ib vapor / total Ib), 7
k FLOW REGIME MAP FOR WALL CHANNEL'
CRYSTAL RIVER UNITS 3 & 4
= FIGURE 3-45-
. . . . - - - - -- ._ . -
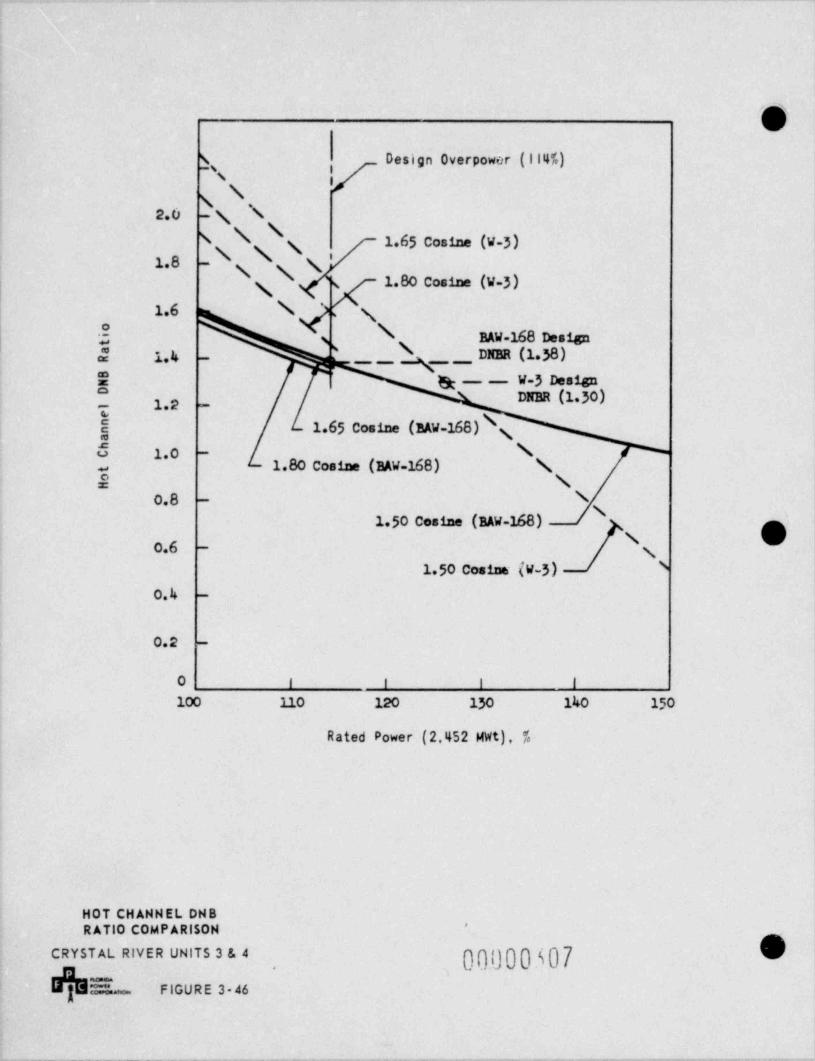
- - - . . -
9% Design Overpower (ll%)
g2.0 g\-
\ \ 1.65 Cosine (W-3)\ \ i1.8 g N-
1.80 Cosine (W-3)s
| 1.6 \ ..
'
g$ \ MW-168 Design3
'E 1.4 _,___,,D M (1 58)-
,,,,_ __
E & - W-3 DesignDM (130)1.2 ---
1.65 Cosine (MW-168)\\d 1.0 -
1.80 Cosine (MW-168) \~
E \N0.8 -
1 50 Cosine (MW-168)\0.6 - g
150Cosins(W-5) N
O.4 -
0.2 -
0 | | | |
100 110 120 130 140 150
RatedPower(2,t452MWt),7
HOT CHANNEL DNB*
RATIO COMPARISON
0%00507 OCRYSTAL RIVER UNITS 3 & 4
E. FIGURE 3-46
w
w_m-- '---_.-----*---e =e .---w --w--m--e.-w.- e. w- *--93 w - -e e ---we---v- w.wg-ew---wew- -eW- r-- 3p-w---q-me +-sy--+ -wt w,.-g, ww w ww grw-w-- wy--w- g
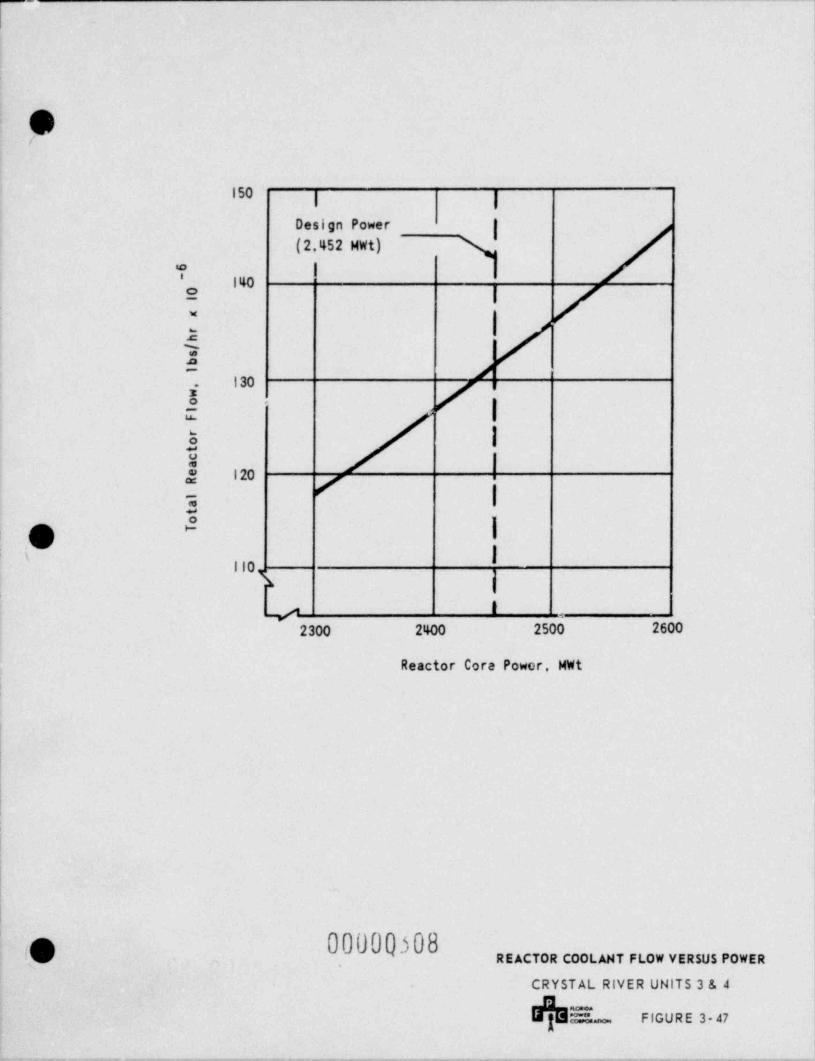
.
O(
150| g
K|Design Power(2,452MWt)'
I*'
140
imD
}130.
b|'
',-u.
8 |1* 120 [
|3
.O 1#ji
'
110
is .
2300 2400 2500 2600
Reactor Core Power, MWt
!
|
i
i
|
(;) 00000.$08 REACTOR COOLANT FLOW VERSUS POWER
CRYSTAL RIVER UNITS 3 & 4
E. FIGURE 3 47
. . _ _ - . _ - - _ _ _ _ _ _.-.
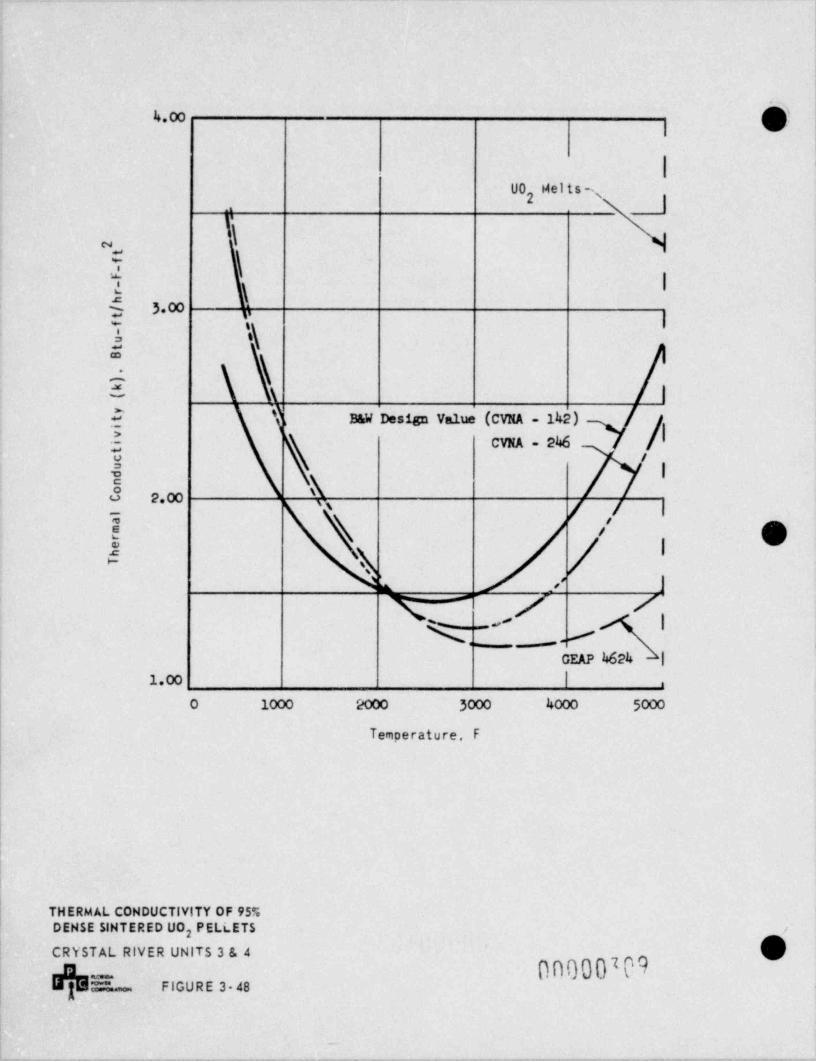
,
h4.00
I'
00 He ts s2
T\~., \i |2 \
3.* 6Iy i
,
52 \ \i \ \ |
$ Ba# Design Value (CVNA - 142) ['
[ CVNA - 2ME #
g
3 h'
2*: n 7 i \
! \ / e5 4 / '
S / J- - -
'TI-GEAP h624 |
1.00 | .
O 1000 2000 3000 4000 5000
Temperature, F
l
THERMAL CONDUCTIVITY OF 95r.DENSE SINTERED UO PELLETS
2
CRYSTAL RIVER UNITS 3 & 4
00000209_
|||||%. FIGURE 3-48
..
-r g . - - , . .m-e ,. m.,,-e ,--m,-- ,mg e ,ee-g- ,., efi-- ,e- m a , ,,,,,-.,,,-.,.m.- ,yww,i ,,..,.,eg ..wep+ g g99Wemw*muv e -=c *-=e+Wv-t='-9-*
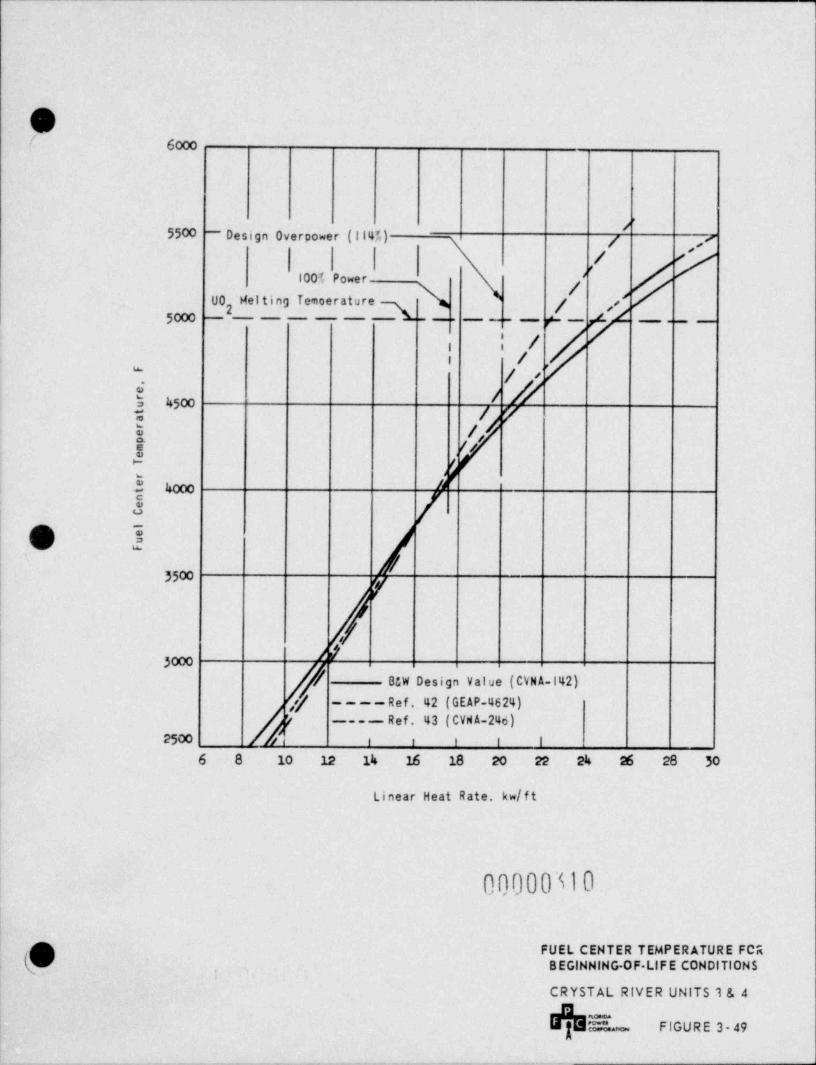
1
O/ 6000
/5500 - Design Overpower (1147.) f ,e
1005 Power #
eltingTemoerature's.\ / /U02 gj,50 . r__ - _ . _ _ _ _ _ _____
! /l
,/ j /\w
i / //'5"i < y
/,|;
e //e,
$ 4000 #
o It
3500Y
l
|
3000
/ BW Design Value (CVNA-142)
// -- _- Ref. 42 (GEAP-4624)jr ---- Ref. 43 (CVN A-246)'
1 2500 h, e e 1 t |
6 8 10 12 14 16 18 20 22 24 26 28 30
Linear Heat Rate, kw/ft
00000410
O FUEL CENTER TEMPERATURE FC;i'
h BEGINNING-OF LIFE CONDITIONS,
CRYSTAL RIVER UNITS 1 & 4
b FIGURE 3-49
- - -. .- .-
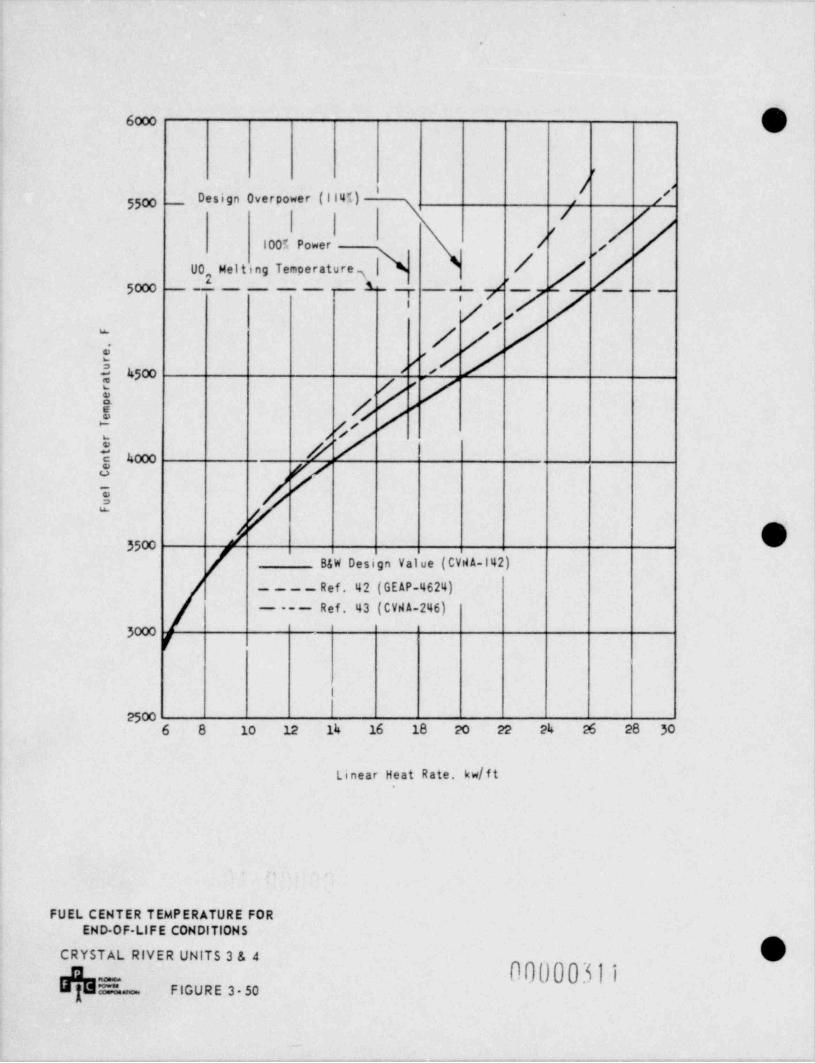
~
li
6000
''
$$oo ._ Design Overpower (ll4%) j',
| /|
100% Power / ,
UO,, Melting Temperature 3|\ / / // /__ _' '
Smo s- r ; j __ _ __
' /i / / /2 u,. ///
/|/e:
,//u /
Y 4000 ///
v'-
> e,,.
[ B&W Design Value (CVNA-142)
- -- Ref. 42 (GEAP-4624)
----- Ref. 43 (CVN A-246)3000 g
i
25006 8 10 12 14 16 18 20 22 24 26 28 3o
Linear Heat Rate. kw/f t
n
FUEL CENTER TEMPERATURE FOREND-OF LIFE CONDITIONS
CRYSTAL RIVER UNITS 3 & 4
00000311_"'"" FIGURE 3-50-~
me
,w ,. v -- --%w-- - - e , - - .,-.w e p -
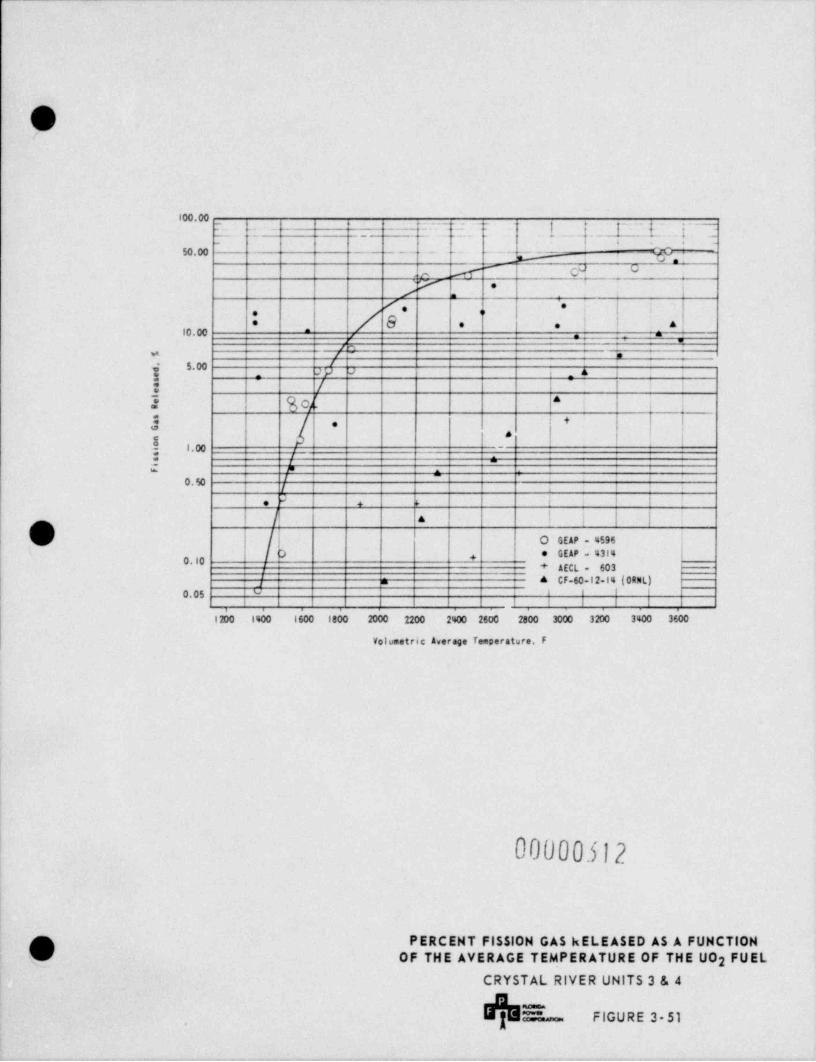
, - . .
( ), . . -
100.00:. . . :. :2: --- y y -. . , . _1..
-,
~ . _ _] . L'
_
'' ~
50.00 --.. -- __
"- e -A CH G
7. *
'. I- ; ,
,/,,.
8 I I.
* * . A,0,00 .
,.. -
_
[* ,
'5.00*, 'Y ' t .A5 :
/ i ~ i i
'3C) {=
.+J e
*8; 1.00 _
,
i .
# ' - '0.50 / i i ,
*e 4 k i i t i
Y A I | | | ,
f'\t /\~/ O GEAP - 4596
D * GEAP 4314' +O.10 + AECL - 603a CF-60-12-14 (0RitL)_I e i
0.05 v i . i i i i
i i i i f |
I I400 1600 1800 2000 2200 2400 2600 2800 3000 3200 3s00 3600
Volumetric Average Temperature, F
|
||
|
00000512
,r ' PERCENT FISSION GAS kELEASED AS A FUNCTIONk.y) OF THE AVERAGE TEMPERATURE OF THE UO2 FUEL
CRYSTAL RIVER UNITS 3 & 4
no m~ FIGURE 3-51-
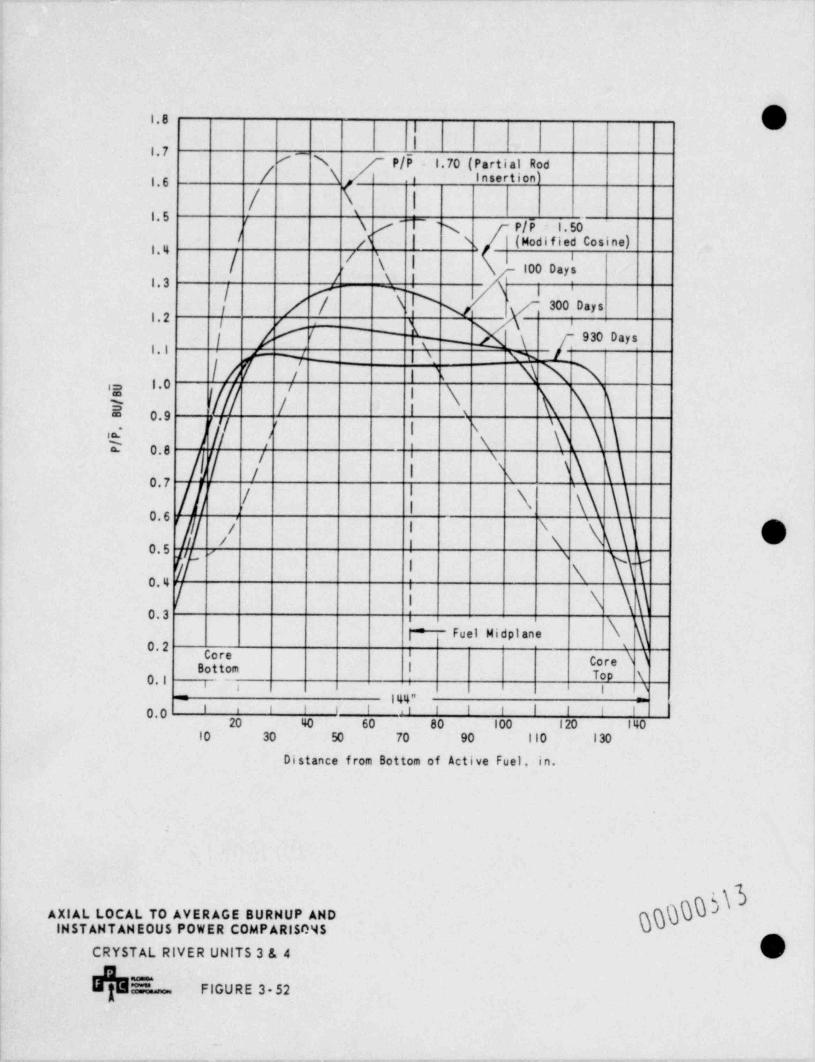
.
e,l.8I
I~ ~ N P/P - 1.70 (Partial Rod'
1.6 ' Insertient
/ II* / \ / 'N P/ P - 1. 50
/ f | \ (Modified Cosine)
[ \ 100 Oay''
/ ff y 30i0.,s' '
'' 'i ;-i % /; ,,0 0.,s,
1.1_ | x n
!Nf / | \ N \i
''*VD / | \ VN )
2''
/# / ! \ \\ \\' ''
N/ / i x \\ \\'
''
/h / | \ \\ \\' 'g ,/ | N % \\ e'' V ! x Y#
'
0. 4 ,
i
f I \ \\)0.3 i
F Fuel Midplane0.2
Core 'Core I
Bottom l0.1 Top \
, , , 3,
: c IW" = .
' ' ' ' ' ! '' ' ' ' I I ' '0.020 40 60 80 100 120 140,
10 30 50 70 90 110 130
j Distance from Bottom of Active Fuel, in.
|||
! tOQOh #| AXlAL LOCAL TO AVERAGE BURNUP AND
! INSTANTANEOUS POWER COMP ARISO'45
CRYSTAL RIVER UNITS 3 & 4
m)=-giouRE352
l~
_ _ _ . ,_. __ _ . . .--
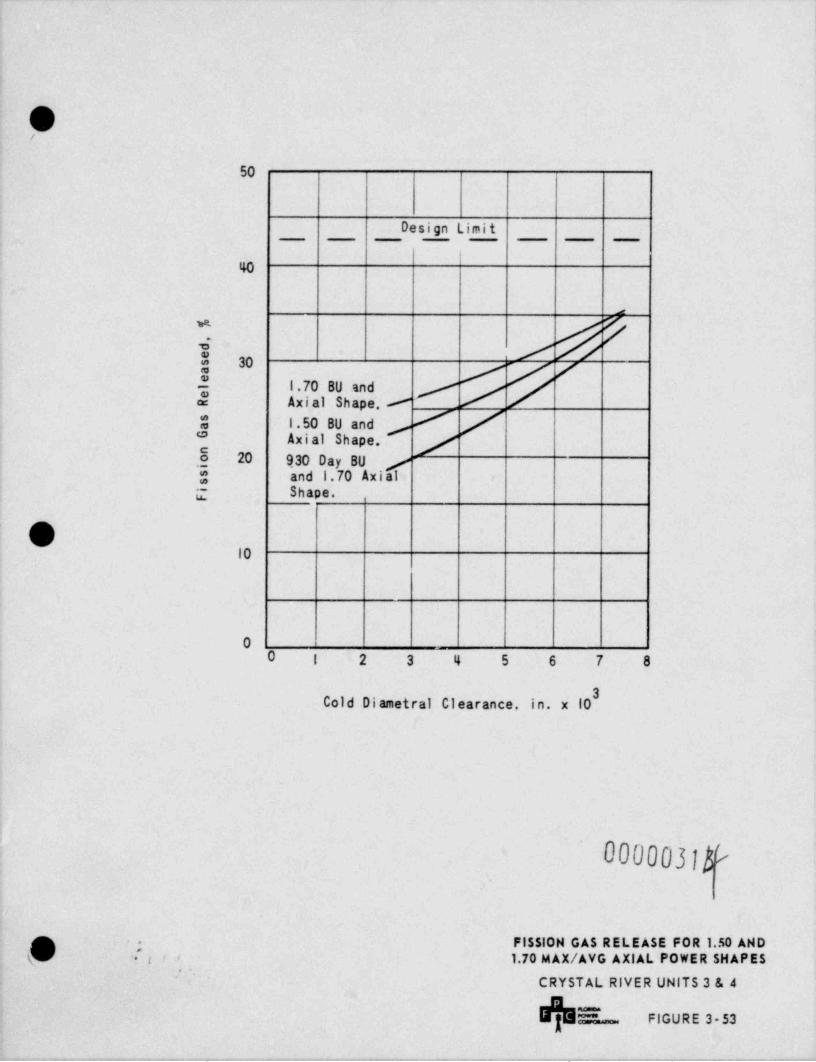
.
O/
50
Design Limit
40
m
/.
'8 / /*0 // /
1.70 BU and /-
Axial Shape. #a:
[$ l.50 BU andAxial Shape jf
*
.g 20 930 Day BUand 1.70 Axi l-
C Shape.
O10
00 1 2 3 4 5 6 7 8
Cold Diametral Clearance, in. x 10
'
000003i$L
,A FIS$10N GAS RELEASE FOR 1.50 AND-
'
k *t i i 1.70 MAX / AVG AXlAL POWER SHAPES'
CRYSTAL RIVER UNITS 3 & 4
~
h FIGURE 3-53
- _ . . _. _-
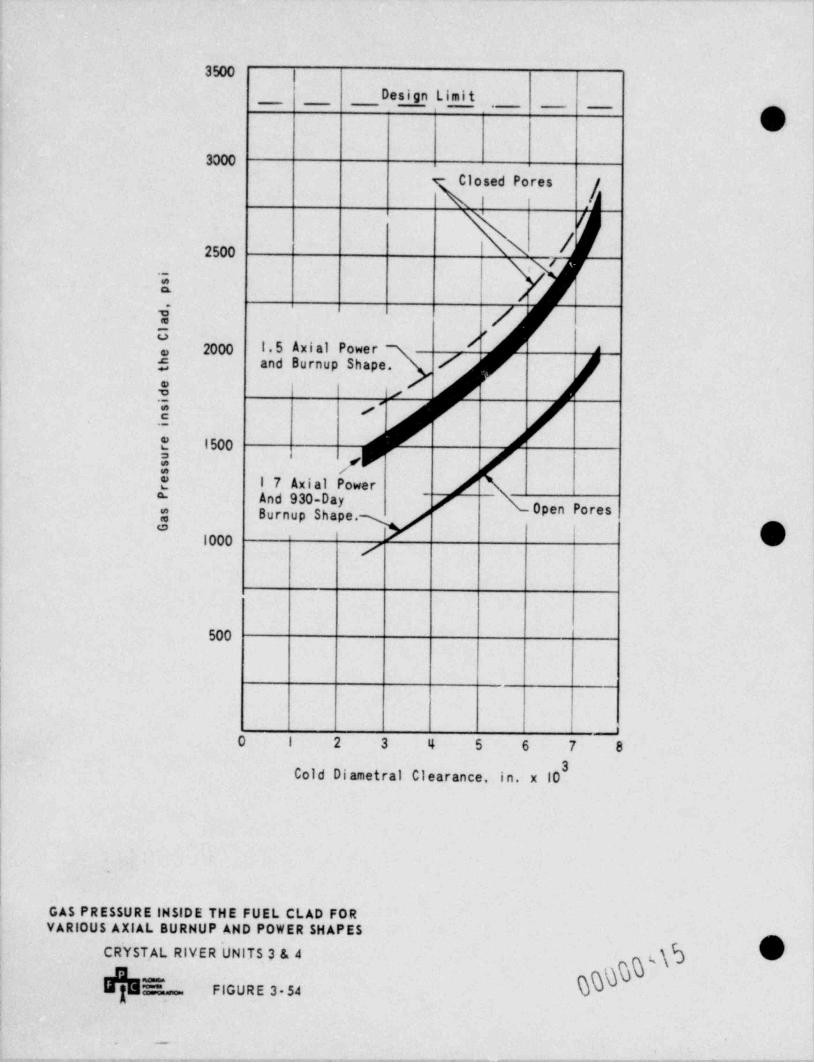
._ . . .
3500
Design Limit
O|3000
losed Pores
| \ /Y2500'
.'
__
,.-
$ 2000 1.5 Axial Power5 and Burnup Shape.
: -._
2 1500 ---
! /2 1 7 Axial Power
Open Poresa npS pe.
'| || |500
||
'! O l 2 3 4 5 6 7 8
Cold Diametral Clearance, in. x 10
.
GAS PRESSURE INSIDE THE FUEL CLAD FORVARIOUS AXIAL BURNUP AND POWER SHAPES
CR'YSTAL RIVER IJNITS. 3 & 4 5\bh = - eGuRE3 54 @-
. --
---w-e- , , . ,-wn-w, --w-o g- an , . - , , - -,, -c,noe , , - - , - - , ,.--,,m ,--,,,.,,,,,,,maaw------,-,,--.--,- ,,-e.,,a, ,,-u--w,. ,m.s,- ,, a-,-- ,-m ,,w-,-

-
O(
l
|
--- :r: 1. 3.4 .9-9 . . ;e . ): . .e . .: -----
.. :e -.003 , ,. . . : ., C.)s- :i- .Li'
d3-e = -43-s-d3-43- =
) ..x. ...:2 :
*I I 5' ' ~ ~?
43 6 ebe'
14s =.. :8 1. ".12 - 1.015
- ?~E - 9 9 2.9~: 9~ . 01-
..:12 . . f.6 . 016
.. : . 3,e- .m .. .e. ,. .. ... ..... ..
n; ear restir.g ra:::r
IEr.thalpy Fise Fs:*.:r
00000ig'
'A NOMINAL FUEL ROD POWER AKS ANDkb CELL EXIT ENTHALPY RISE RATIOS
| CRYSTAL RIVER UNITS 3 & 4'
E FIGURE 3 55
. _ . - - -_-_- ._ --_
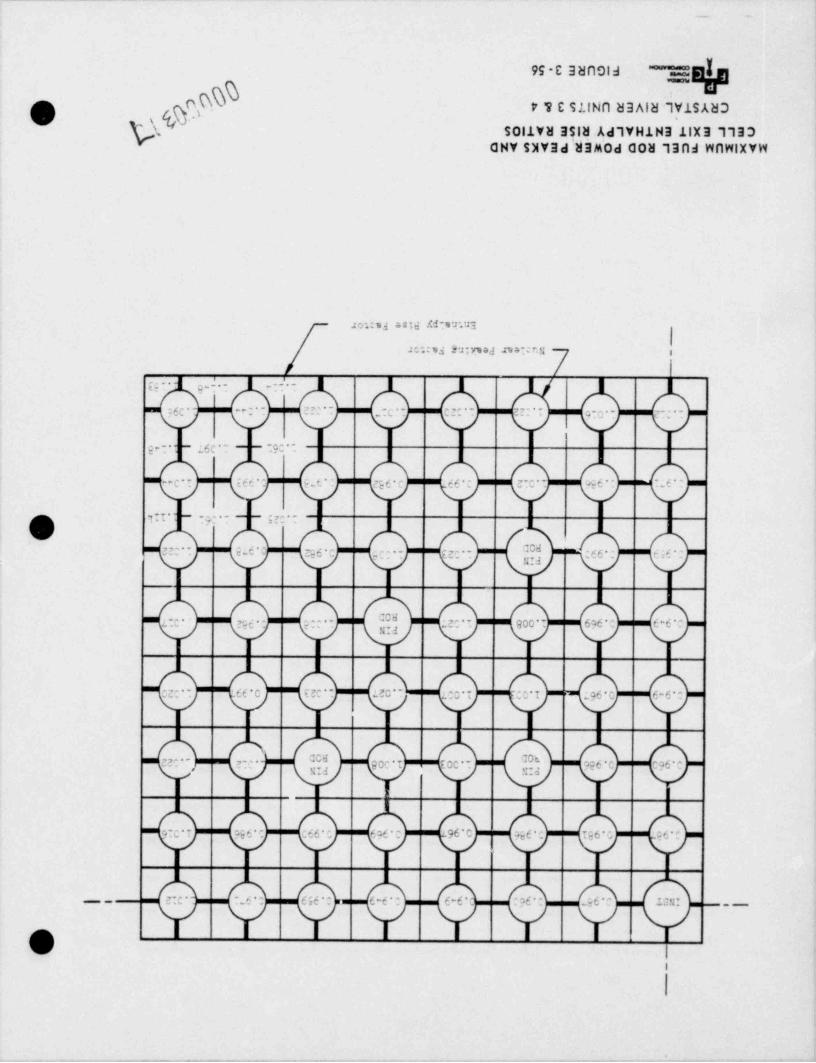
__ _ _ _ _ _ . _ _ . _ . . . _ . . _ _ . _ . . _ _ _ . _ . _ . . _ . _ _ _ _ _ _ _ _ . _ _ _ _ . ~ _ _ . _ _ . _ . . . . . _ . . _ _ _ _ _ _ _ _ . _ . . -
_ _
99-C 3HOOld -
-
O F T C SilNO H3AlH 1Y1SAH3.>s
\ Sol 1VM ESl3 Ad lVH1H3 ilX31133QNY SXY3dl3kod 00H 190d WnWlXYW
l
Jou ng asTd Ai'9 7^.*J3
,I l/ = , u ., w .d . c.
gg : - g J.. '
.-- -
:-6C ' ' "" 2 " 2?C " ~C" ?:'' ??:'I Gio'- ':*-
ge-* ;6C'~ !?:*-
~*C'T E66*' 9 t' ?E 6 * 66*: CT0 " 096*" *6*'-
"'' ''=~~ " = ' ~OC0d??:" Eid*C ?E6': .0-*- E20.. '66*: dif':Ed
L*C' 56* @ :: " 1.20** 900 " 696*: 6*6*
:.e: - .ee c te: - te - ;:0 : ::0 1 ;96 C 6-6 :
?? ** ?!C " 90C*! t0C'* I ?96*C,
9:C*T 966*: :66* 696 0 '96*C 9s6* is6*C 96*:
2'C' 6*: 6M*: a 6*6*: 6-6 *( 096*: s6': J.2C-- __
O,
I
_ - - - -
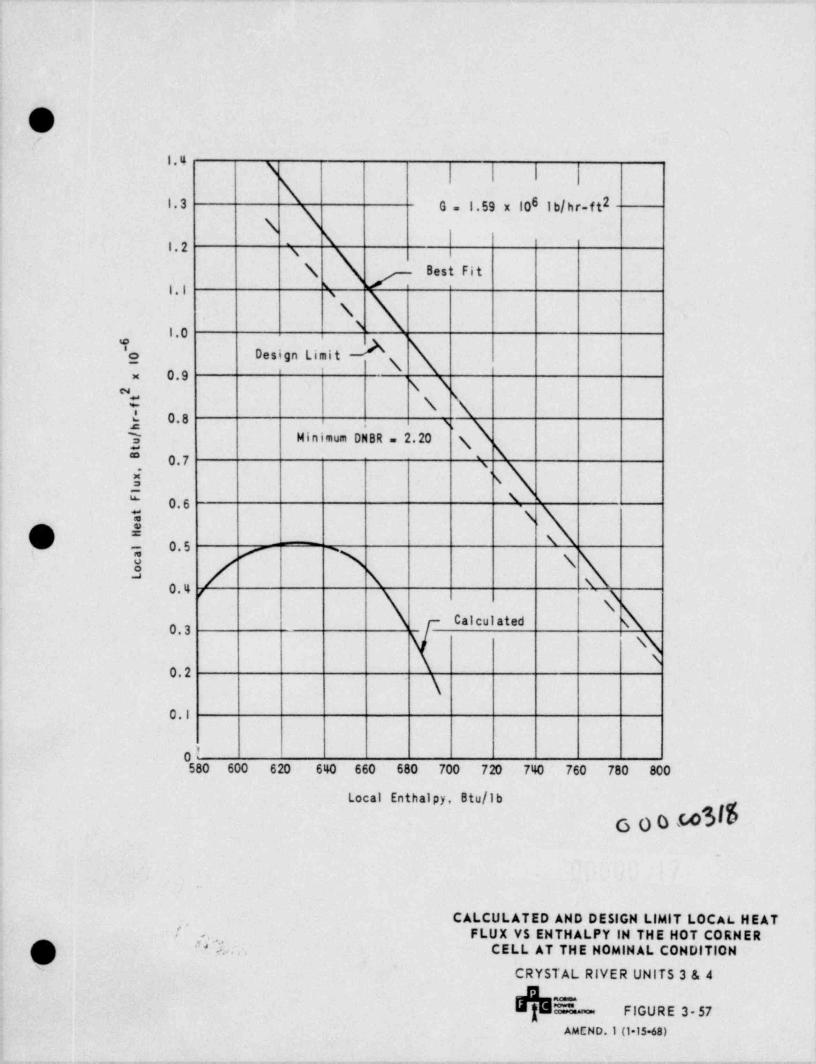
,
|
l
ba/
*\ | | |
1.3 G l.59 x 106 l b/ hr-f t2N \
s1.2 \\ Best Fit
l.I 3
\1.0
Design Limito
x 0.9 g
i \ \; 0.8 x,
7 Minimum DNBR 2.20 N \*'** 0.7 \d \C '0.6% \S
\0.5j gi
\/ \30.4 x.g g
Calculated0.3
0.2
0.1
580 600 620 640 660 680 700 720 740 760 780 800
Local Enthalpy, Btu /lb
a o o 5000_
,
CALCULATED AND DESIGN LIMIT LOCAL HEATl',, FLUX VS ENTHALPY IN THE HOT CORNER
/~(",T 33'i CELL AT THE HOMINAL CONDITION
/~
,
CRYSTAL RIVER UNITS 3 & 4
-"
FIGURE 3 57-
AMEND.1 (1*15 68)
. _ . ..__ - .. . _ . . - _ . . . _ , . _ . _ . . _ . _ . .
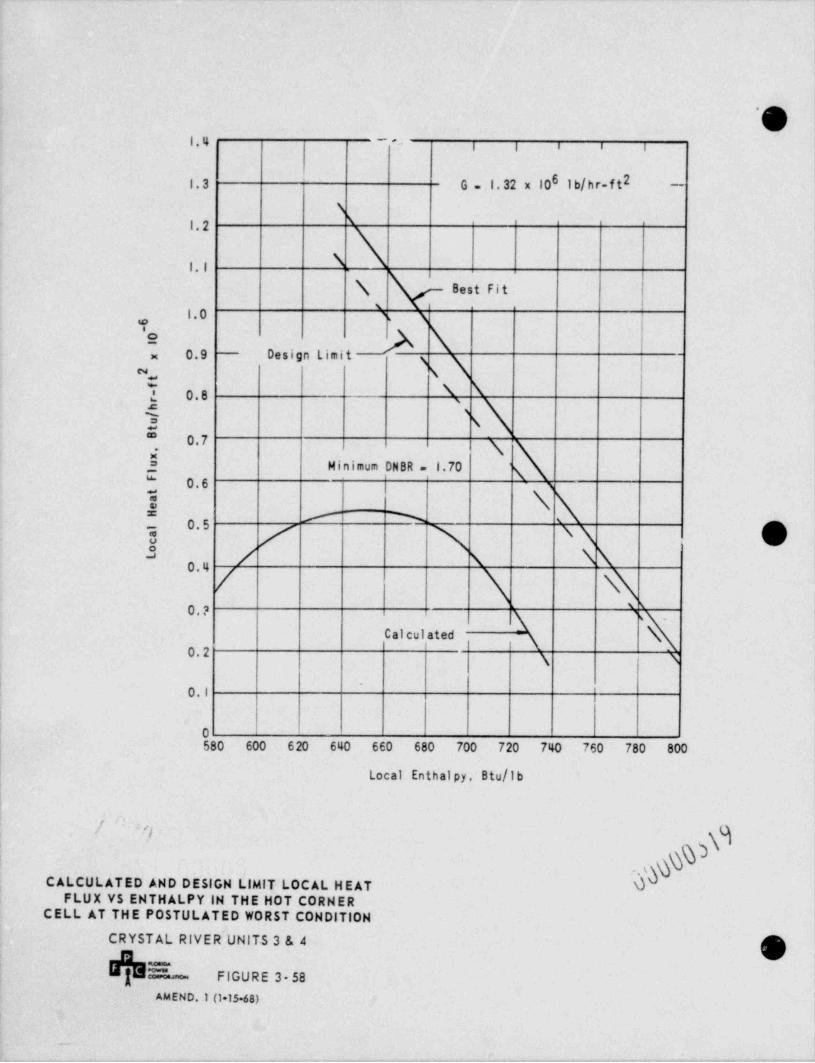
O'
l.4 " 'Gi i i i i
61. 3 G 1.32 x 10 l b/ h r-f t2 _.
'
Nl.2
1.1
\ 8est Fit
1.0 \ T,
x 0.9 Design Limit gN \U \ \L 0.8 se
s$ \"'
O.7 \[= Minimum DN8R - 1.70 \" 0.6 3
1 \ \1= 7' %o5i y x xx 90 / \ hk
''
/ \ NN0.? N ,
Cal culated \g0.2 g N
0.1
l
i 0| 580 600 6 20 640 660 680 700 720 740 760 780 8001
Local Enthalpy 8tu/lb
/ ' ' : <,
I .\h.
CALCULATED AND DESIGN LIMIT LOCAL HEAT OFLUX VS ENTHALPY IN THE HOT CORNER
CELL AT THE POSTULATED WORST CONDITION
CRYSTAL RIVER UNITS 3 & 4 gFIGURE 3-58====o
AMEND.1 (1 15-68)
_.
-w m -e + - < p sw.-
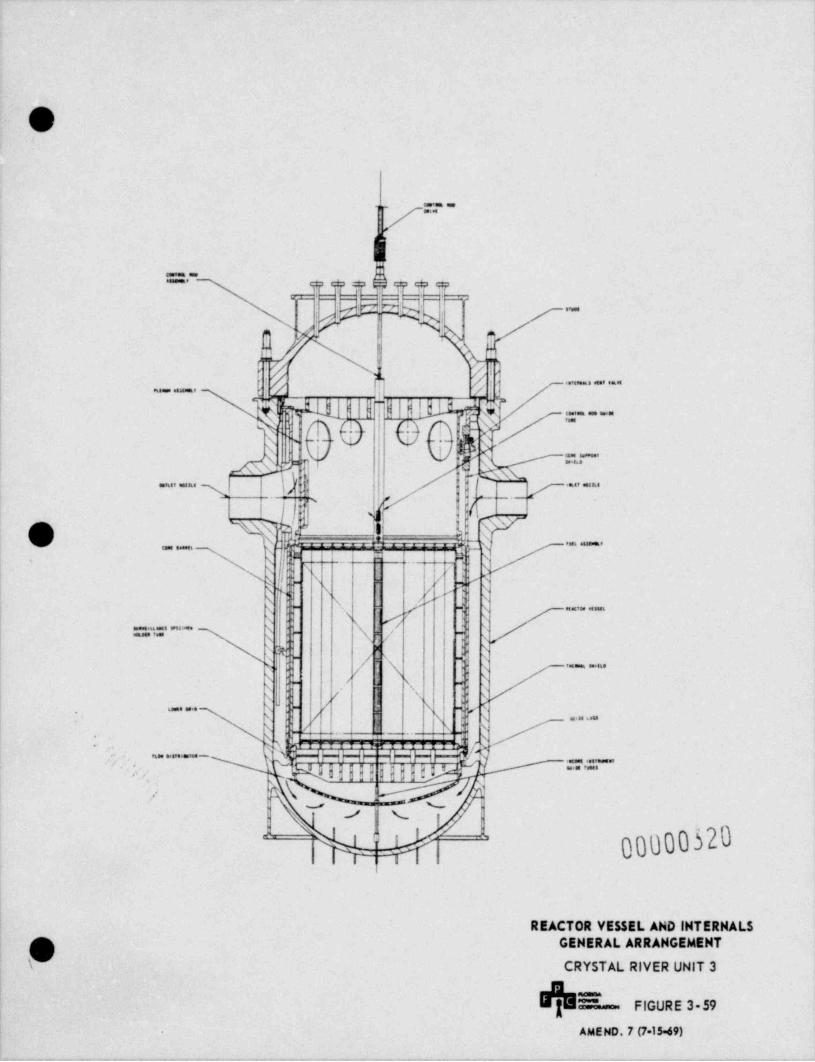
,=.--.
~O'~ m aw a m p upg q _ ___. ,-- ==
is Z."1 % '"
%,.7 *, ,
I. , s
J $ r --__ _
'9 ['QM i WInl __ .
N '
V F (j) !k'
. , .
\1 I i
$I til %C"~1
k ,L__['*" "''"'"*'' N,
'N < !! AL FvPa _
. . _ _ _ d,#
. F _-_ . _ . ,
sz.___
- ;.
Nd ,i : \ / dP s.
\ //) )DN[ qs - f a x .._
\ a)[,/'h \\ ,
:' i:' "''* }' F i-
d S
,
|-
s (:I 4 ( / 'y T ;=
..f
,
'| f 's' '
s
/ \- s4 ,<.. g p ,
! s L / ! s _J s
{ p m , mm m ,24|gs. ,
p HHHHH| 1- =~====-..
,
' ' , \ \ jj!!ij||B3''GB * " " '
'1t _
> N
- WW 00000520^
REACTOR VE5SEL AND INTERNALSn GENERAL ARRANGEMENT(AP CRYSTAL RIVER UNIT 3
-- FIGURE 3-59
AMEND. 7 (715 49)
- _ .
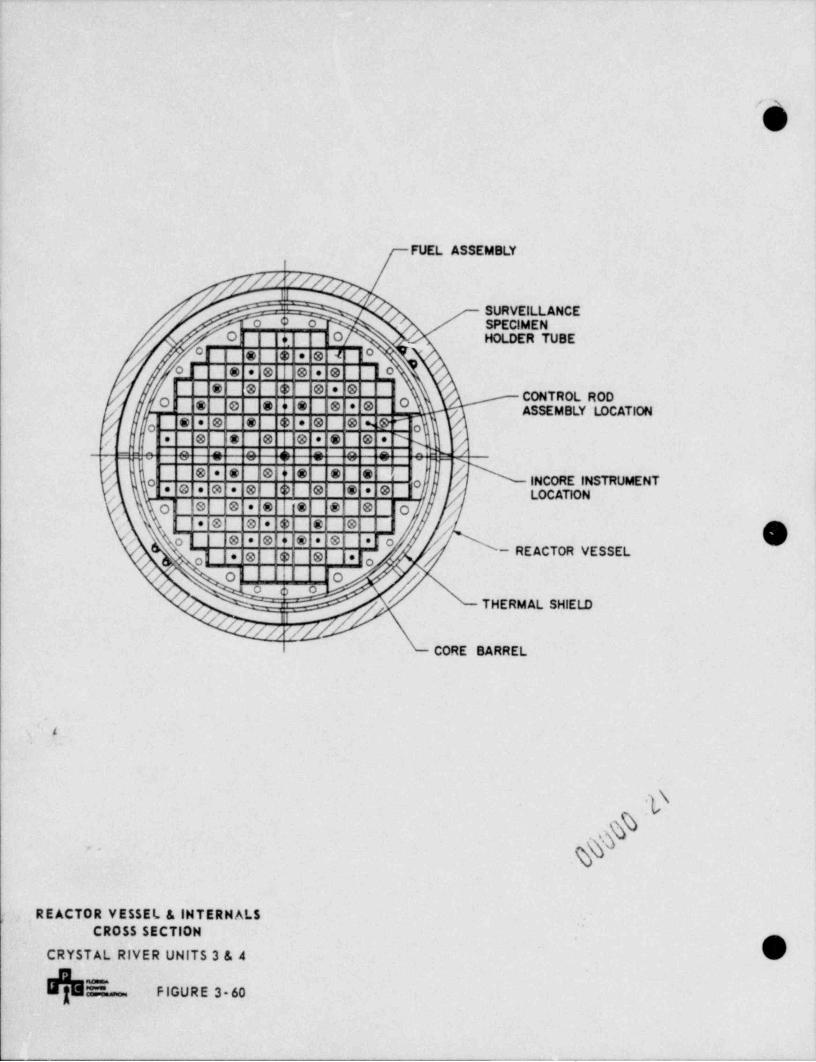
/
FUEL ASSEMBLY
////'
SURVEILLANCE,
o C o SPECIMENO + O HOLDER TUBE
O e e e e 4 0 '
[ O e e e le . O o8 8 8 * O'
CONTROL ROO8 8 8 " 8 8 * O ASSEMBLY LOCATIONf
8 * 8 8 8 * 8 8 ''@oN '
7- * 0 |S 0 0 * e e * g,
2:,:, o O O O O O O O :- :A--
"
/ INCORE INSTRUMENTo* O = 0 * e O e e . O | LOCATION// O e 0 . :e e e e o p'
* 0 0 e e e lee o e e e e e e e l . 'o
- REACTOR VESSEL'g , g g g i,
/ O I O'
'O O
THERMAL SHIELD
/,;y //
CORE BARREL
*
i
<.
p. . REACTOR VESSEL & INTERNAL 5CROSS SECTION
. CRYSTAL RIVER UNITS 3 & 4
afe=- riouRE 3 6o
.. _ . -- - .
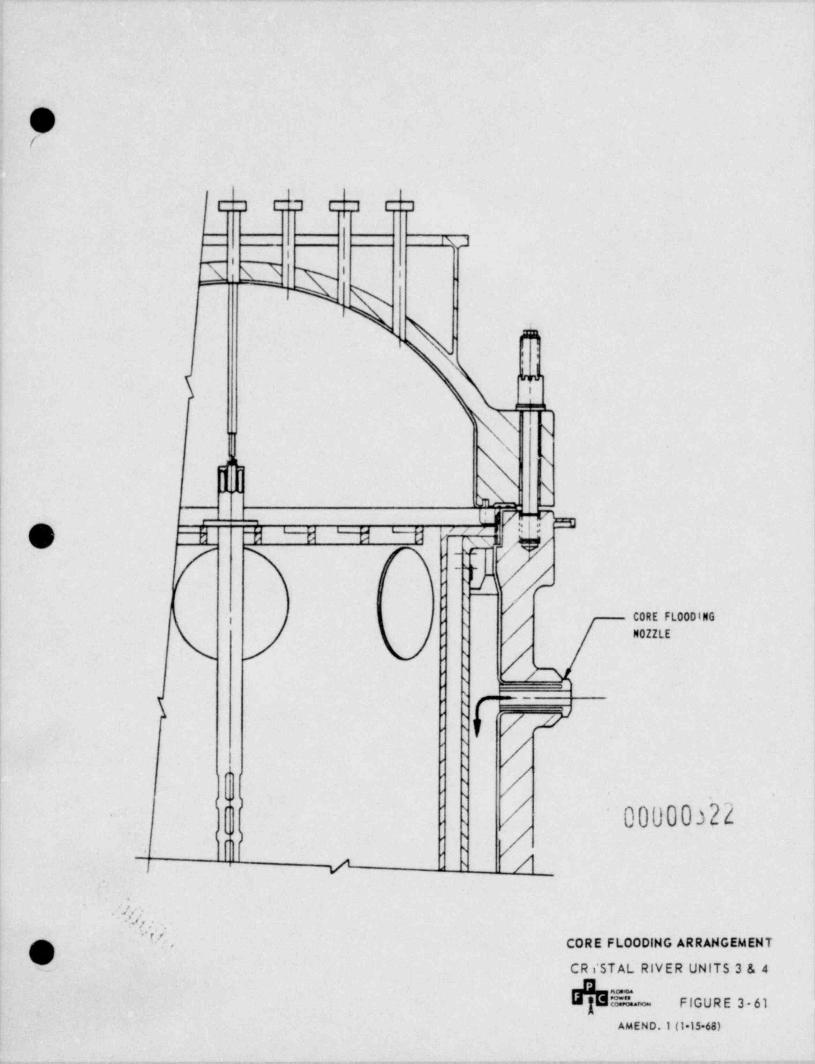
O(
t
C] C] C] C]
IN .JI
- 1
~k'N 3 ,
j ,
c\
- \
L-
, JjNN|o 1 m% % , -_x c- - '/. ,
; & /r/-
,
CORE FLOODING/3 -
/ MOZZLE'<
! : /-s,
j : m--
- : | uy#/'
:
: /..
-
: / 00000322''.
-
'fil : /'
-
/1 / .
$'' CORE FLOODING ARRANGEMENT,
d CRiSTAL RIVER UNITS 3 & 4ne
%- FIGURE 3-61
AMEND.1 (I 15 68)
- . - . .. ., - --,- - . , . . - - . _ . - . . .,.
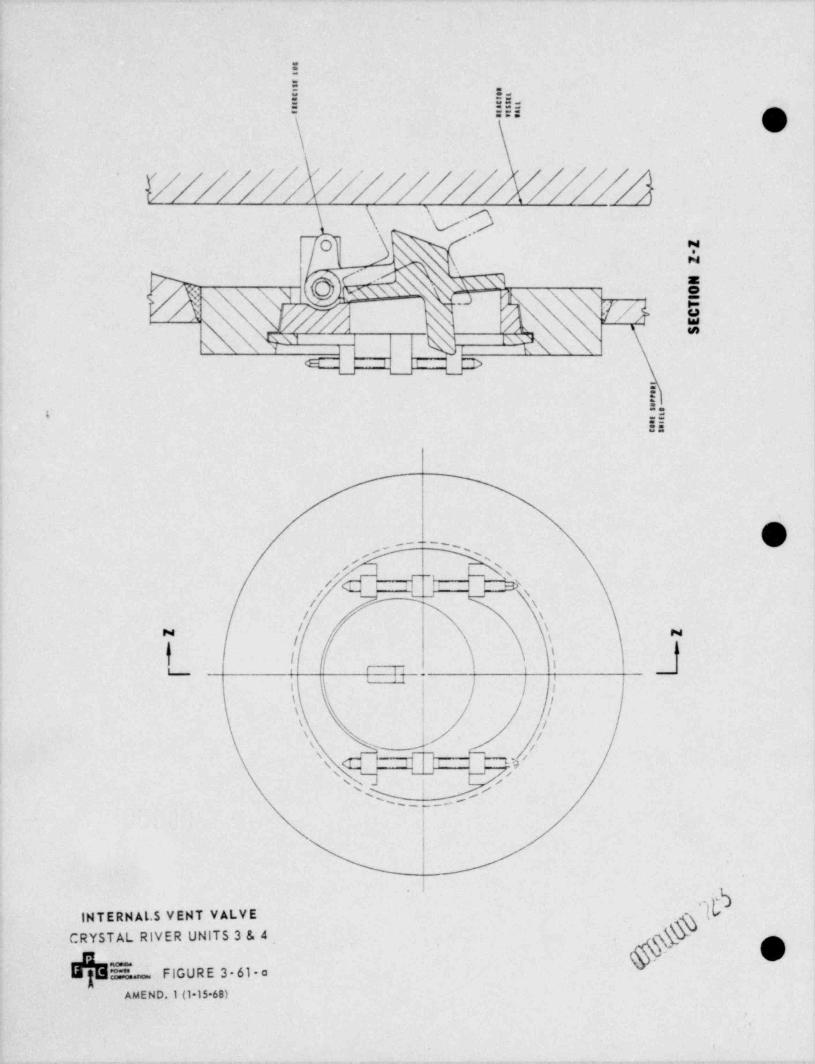
:
=
5
g===-
VMH/WH/W// //HA/\. \ - 9~j 'No ~
- . \N
,/ M- __
!
& 5
55
h'' ---
< n%--
-,- w
/ \/ \
N/ \
, ms ,' j* -
i 1 j
a ,,/'s
\ '
V1
,qINTERNALS VENT VALVE M'
CRYSTAL RIVER UNITS 3 & 4
h' OhE_ ricuRe 3 61-o
AMEND.1 (1 15 68)
,
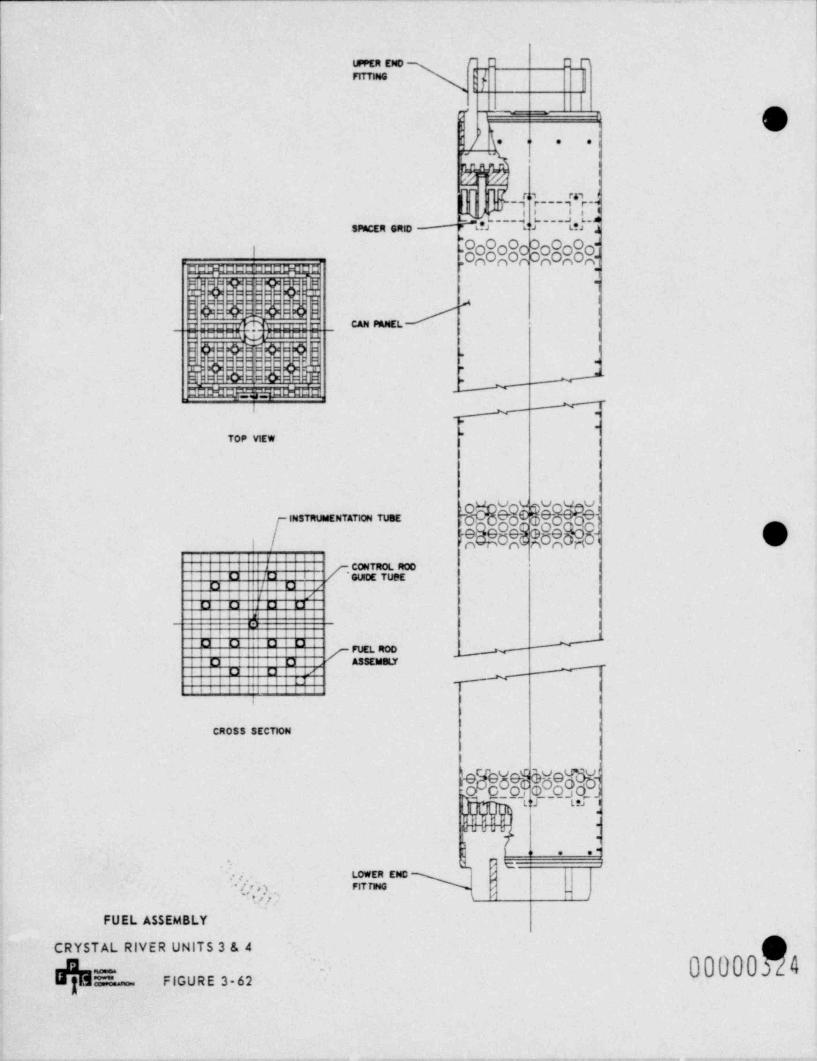
._ .
UPPER END {: :f
I
[ j,
,;y . .|.. .
*em |
|' .|
-
_p,._ _ _ c,, _J| t it I
SPnCER ORD s d5 ~ ~~%Y~"$t5'j
28R8g808R8R8#.'
W CCI"f]QnTWlPF. "
N h S 550 h, ! 1y - . g :: . ,
d @.4c===g
% 5'.: 9 W l:F :
b 9 Ec.: :r
I3 '
|a. L m t /? u O CAN PIMIEL ' .r _m ~ _, a |q -gr m ,
Sh I'
:g :: ;, --a -
!D $ j#4e o e ,,
w .EEcoc2 "a
_#-, -
TOP VIEW ]*
\ |
l
l
|
INSTRUMENTATION TUGE~ OO 6'O ~3
'
O
hU Oi| n nnI li r|' - CONTROL R00 j*
D io / *GUmE TUPED ! l Q s
* t i JD D || 0 0 | |' i *' I
,
Iiii YO ! C i 0 0iii ! ,
O I . ASSEMBLYD i *
D D t/"
<
| I~
|
| |
|
CROSS SECTION |
|
t l
O OLHJ LS I
.
! .
( , . .9L ?t' , , , . LOWER ENO |
'-
*/ r n FITTING '
--
'hij) , 1
FUEL ASSEMBLY
CRYSTAL RIVER UNITS 3 & 4
-"'"" FIGURE 3-62-
. _ . , . . _ _ _ _ .
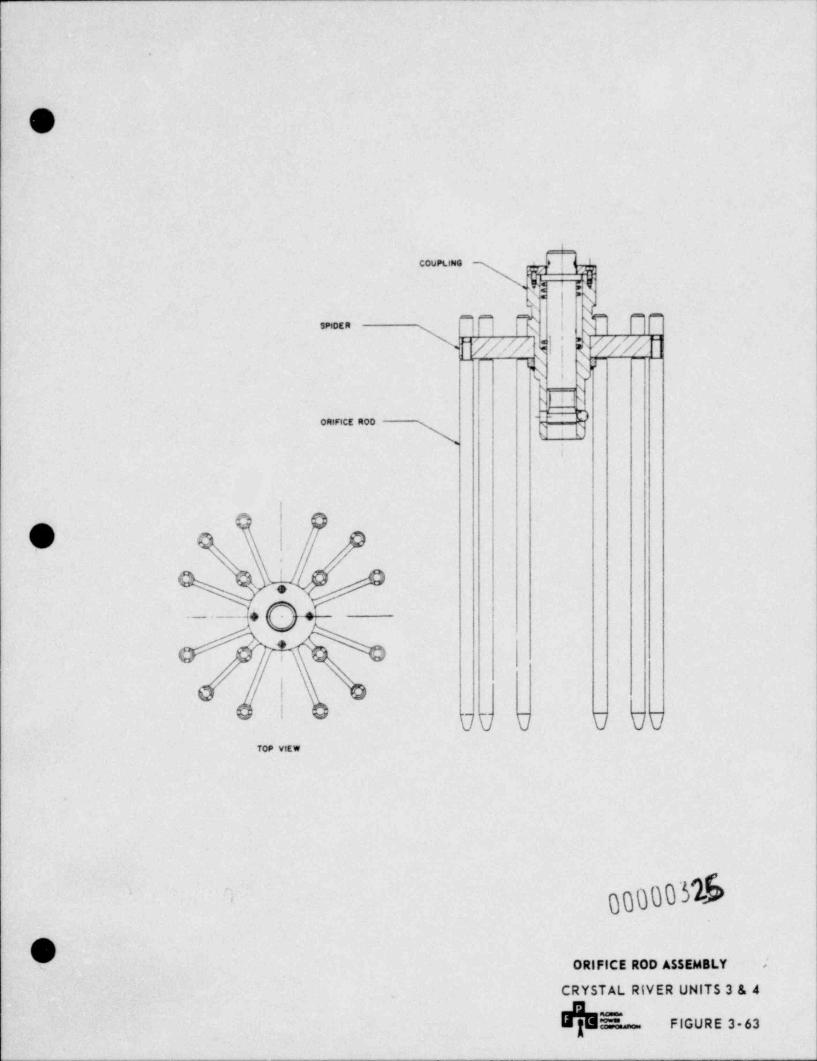
_
.
[sx
COUPUNG %wv.tnn d i M nr-- xd~////, '
5) V "
- -
;S,Qr//// -
,fs -
i s;
onwice noo -DQK 3, 1
,
'
.
,- !
._ _ . _ _._ e w- .
i
~
I * 00 0 0 00TOP VtEW
QQhhi
("r'
' ORIFICE ROD ASSEMBLY ,
CRYSTAL RIVER UNITS 3 & 4
- FIGURE 3 63
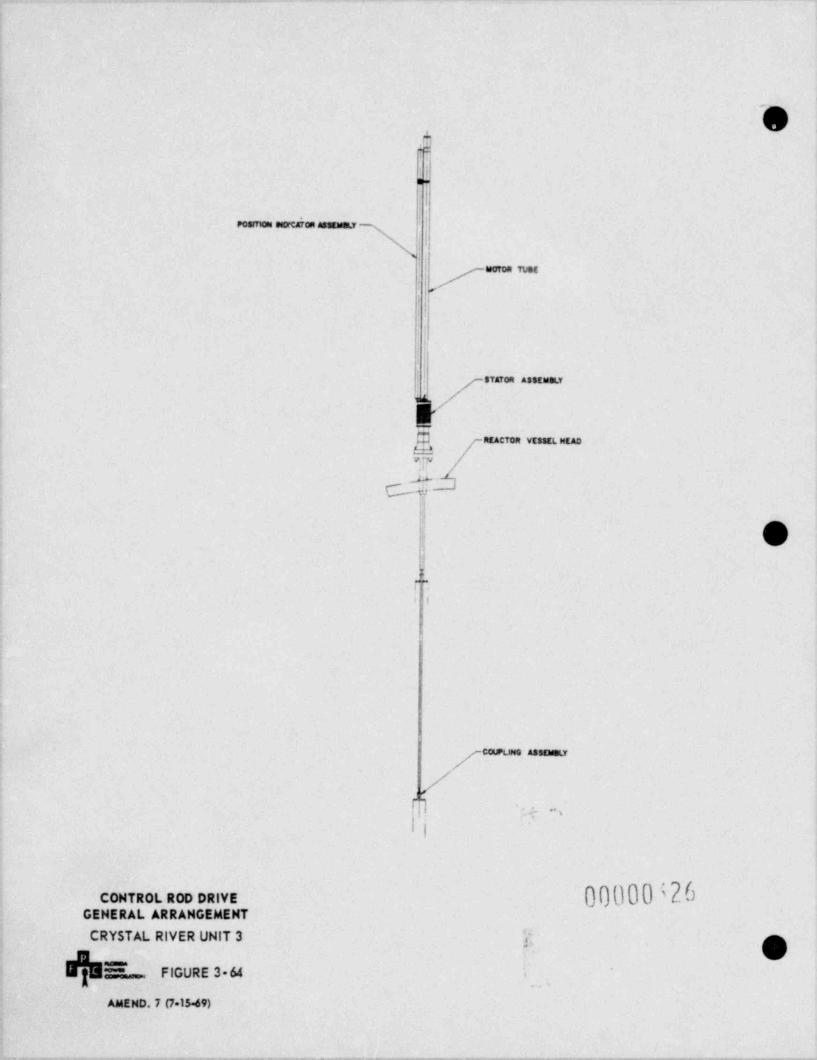
. . . .
~O.
&i
--
!
n.r. a. -|
|Worom , vet
,
iii
t .
,,,,. .... ,
m ..a=5',7s..rs
J
|,| 9.
!
?. ,
I
COUPUNG .4SOggL,
/m :+ .
I I
00000(26coHrRot == oaivEGENERAL ARRANGEMENT
CRYSTAL RIVER UNIT 3 y;
E- FIGURE 3-64 i.
AMEND. 7 (715 49)
. .- - - . - . . . _ . . . . - . . . . . . . . , _ . , . . . . - . . . . - - - . . . . - . _ . - , . . . . . - . . . - _ . . . _ . . - . . . - . - . - - . _ . . . .
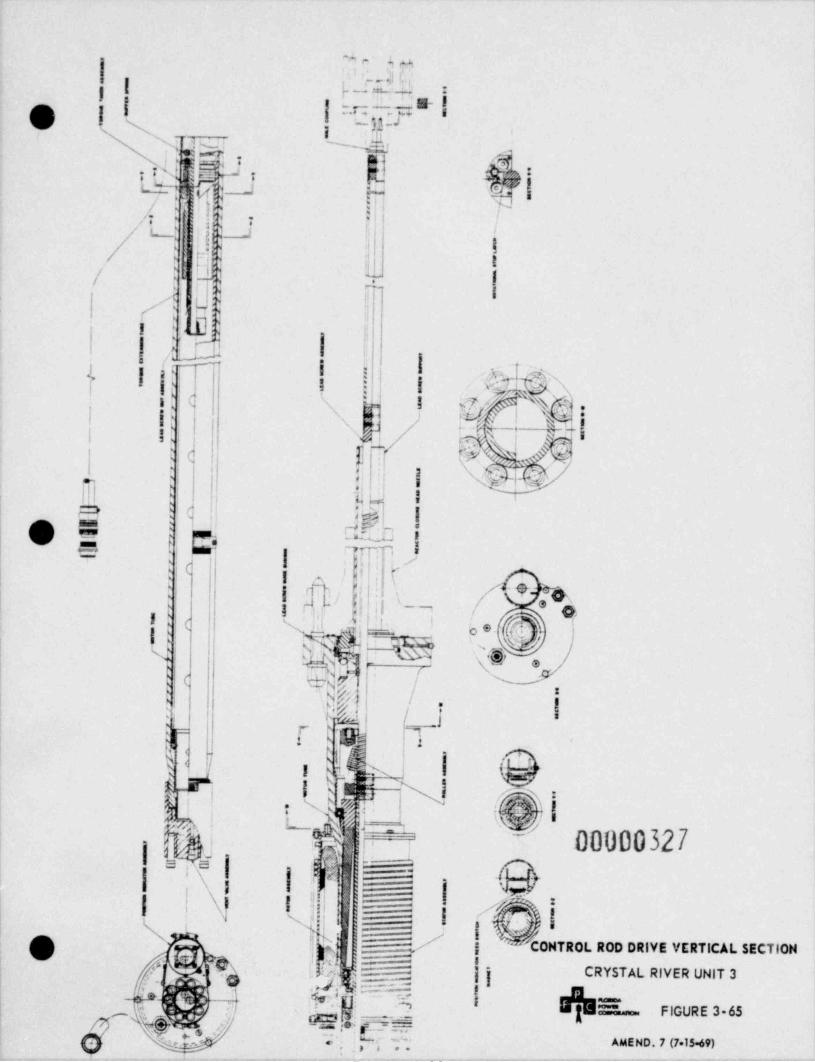
, ,. u'|,' h;
![p J2 {P'.
.
-
z.r: - 4 5- |O ,
x i w .
gp m, ..
-i I
% N,H Hm/
;
I/. :i b ;I
<- m'L;t . .
1;|!p-i ! j,
! j:1 : :i i/ l d L.- I
i :-
i.,
<! wLP (i: ci !
i<!E l .! l'
i|[-.p1 ,
47$Ni ! ij 4it c xv i
L[er|. .
| *; N q., nr *
I !x no _y- .
I i; v._ esY' .'t c [. Q% . -; :: ,I s & l,
iT) t ,w,<
. .'
Oi | ti F;pq i
A : c : Ii
l 1-
g Ib (, -<
r C, ,
| [i }a<
!if,! a - [ ' Y[ oi x;
t ,i ;1 4< 4
t < . ,-Ix o-_-,
1 3% 's,
I N '
i_ M '
A ' e; < s s t a,
Nf.r :$ I j l
,
I ! q T=
hf| b. / i
6.n@ ix l
_r) i m g xis ,
.! . o , _.-
| e: ' it ;p-o
; . ii .I 00000327
~
, n.,Nj Ic ve - ; -
f|
-
'= -
i ,
i j i pimi = .
- =
I IN i : i,
| h -j/|
ONTROL ROD DRIVE VERTICAL SECTION
| / .-g - !. M E =- 2 ]j CRYSTAL RIVER UNIT 3.I
[ NIN _ :NI N k I b=- FIGURE 3-65O, &. g? :/ cekm I
y,tj J' j If-
AMEND. 7 (715 49).
_ , . . __ ___ ._ _ . _ . . .. . - -
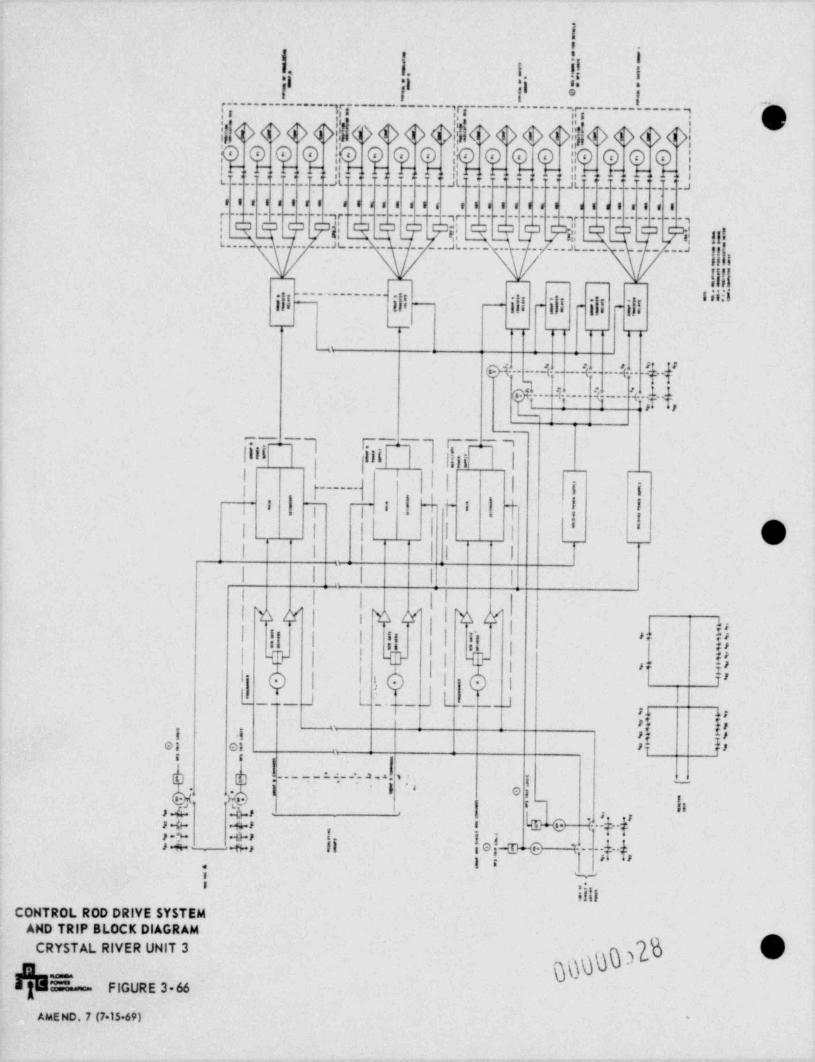
Is
! I.
k.iI I,. 1. ., !! I
. s. .
I I*
g.____________.q
,!O O O <1>|!iiO O O O!sio O O 0,g_ _ _ _ _7,__ .,
ili c @ O O !!$$i$ !i.. ;$$$ !$$$$ !! $i$$ !_... __...__.__..sL...__ .........JL.- - ...L. _JL........ ...J
e e Is I ss a s a : s a s s e a a s ea e a a s a e s s e Ip. . .. .. ..S p -
-
S r..._. ...... 3
!9 FM 9 '6 9 9./.R!! Fi!
!!{!
t...._ . .. ... ...x.___ ..___..su..._ . . . ..su____ _ _ _ __.sgj
lill'iid;|i jji ii!
- - - - - - - - - - - - - -
;}i ;ji |i_ _ _
__ ___
. - < ' .
( .. . k1|.. .k... ..
7. .. 4.,. . . . .sg..4.;4.4,
_ _ _
q ri |7 : ,|._ _
|111 Il g9j
| p_ _ _ _ _.] l| | i i'
14tl I t >! !i
i T ' 'i
I I I | | | G' '
i i i l i i
i I I I I II I I IIiw a|Iwat i na ;l
!) | i'i ai !! I I !! i
'"
I t i I ? I e "pi ,e
_Q___l I !O I e i
i
J L n _ _.JL J 1L _ _ _ _ _ _ _
4 1;
#h f7; .; it i
el Cl 'I h's s y, |
L;.._ _ y__ 2 .!h,.,4, , g[ 1
. I e'- o.
|$g -)r, | f.l, .c | II8-
F s-c s.
* *i, ''h-.
Dde +9 I -S r,-% 4., i
7.1---1 i@@s.4.- -+s ||{ g- --f,
sGlI:,
s'
illiCONTROL ROD DRIVE SYSTEM
AND TRIP BLOCK DIAGRAM
hCRYSTAL RIVER UNIT 3 ,
h=_ eicuRE 3 66-
AMEND. 7 (715 69) '
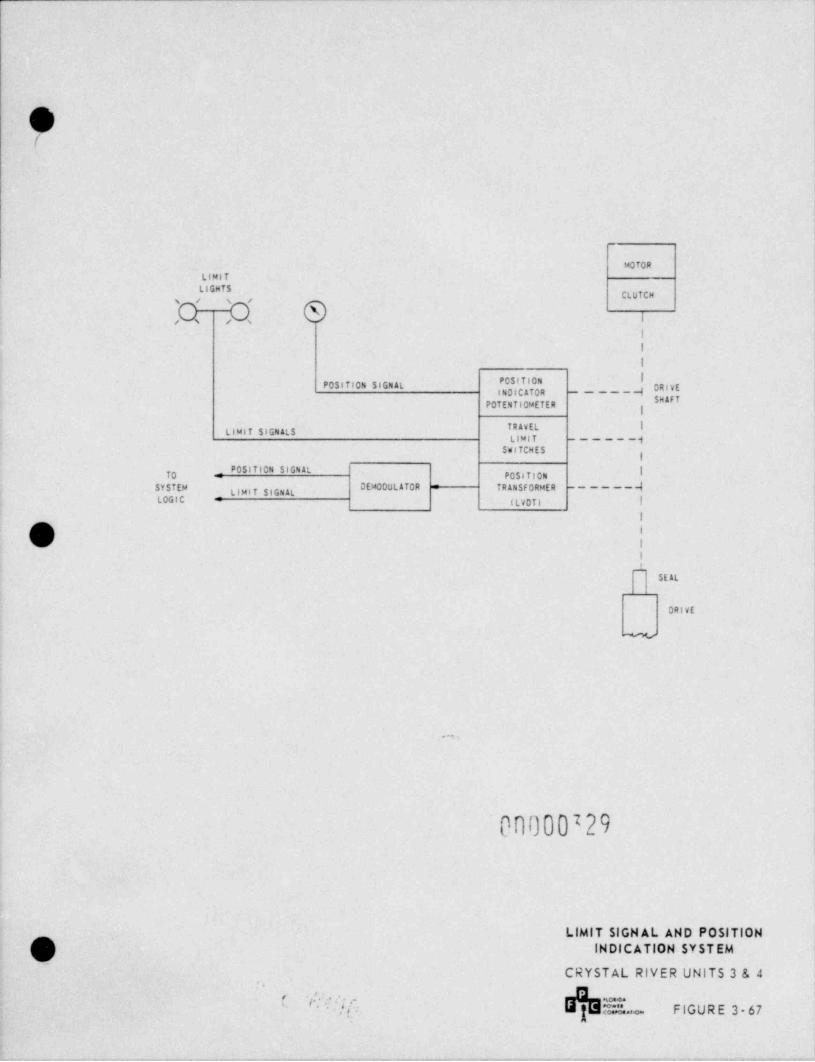
73k
MOTOR
LIMITLIGHTS
CLUTCH
MM o i
l
l
|
IPC56T10NP051 TION SIGNAL ORivEINDICATOR -----H
I"#'IPOTENil0 METER ;
IRAVIL ILIMif SIGNALSLIMIT ------q
SelTCHES
. POSITION SIGNAL |TO - PCSiT1cN$YSTEM DEMODULATOR : TRANSFORMER -------4g,,,y 3,g,3(LOGIC (LVOTI |
|
Os |t
SEAL
drive
%
. . ,
00000729
LIMIT SIGN AL AND POSITION
' (n) INDICATION SYSTEM
CRYSTAL RIVER UNITS 3 & 4
' ~ ? 'l5 5 FIGURE 3 67!
- -- .
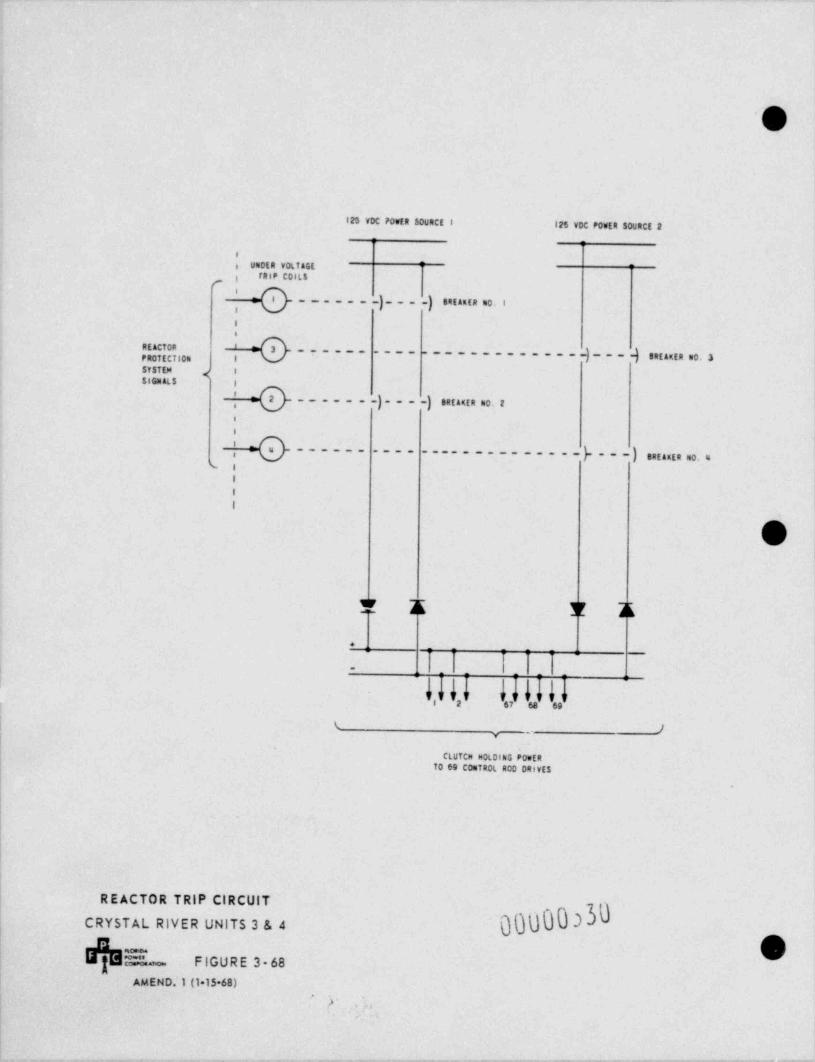
. ..
'O
125 VDC 70wfR SOURCE 8 125 VDC POWER s0URCr 2
e
e U 0ER VOLTaGt: ft P C0,Ls
- - - - - - -) _ - - ) su ant =0. i
,
,eacgt - - - - - - - - - - - - - -) - - - } . n , q , ,,, , 3R -----_ --__
,sysitu <sismats
- - - - - - -) - - - -) strantR no. 2,
i
-----_-_-_----p--_),,,,,,,,,,------ .---
- ,1
I
I
O
r x x x.
I
p r f,v f.,4' h.u h.,u.
t
I ( )Y
CLUTCN HOLD 1h3 PoetaTO 69 CONTROL 200 ORivts
REACTOR TRIP CIRCulT
000%33CRYSTAL RIVER UNITS 3 & 4
T4 . FIGURE 3 68AMEND.1 (115 68)
'
5' . > ,
|
-- - , , . _ . , . . - - , , . - - - - - - - ..-
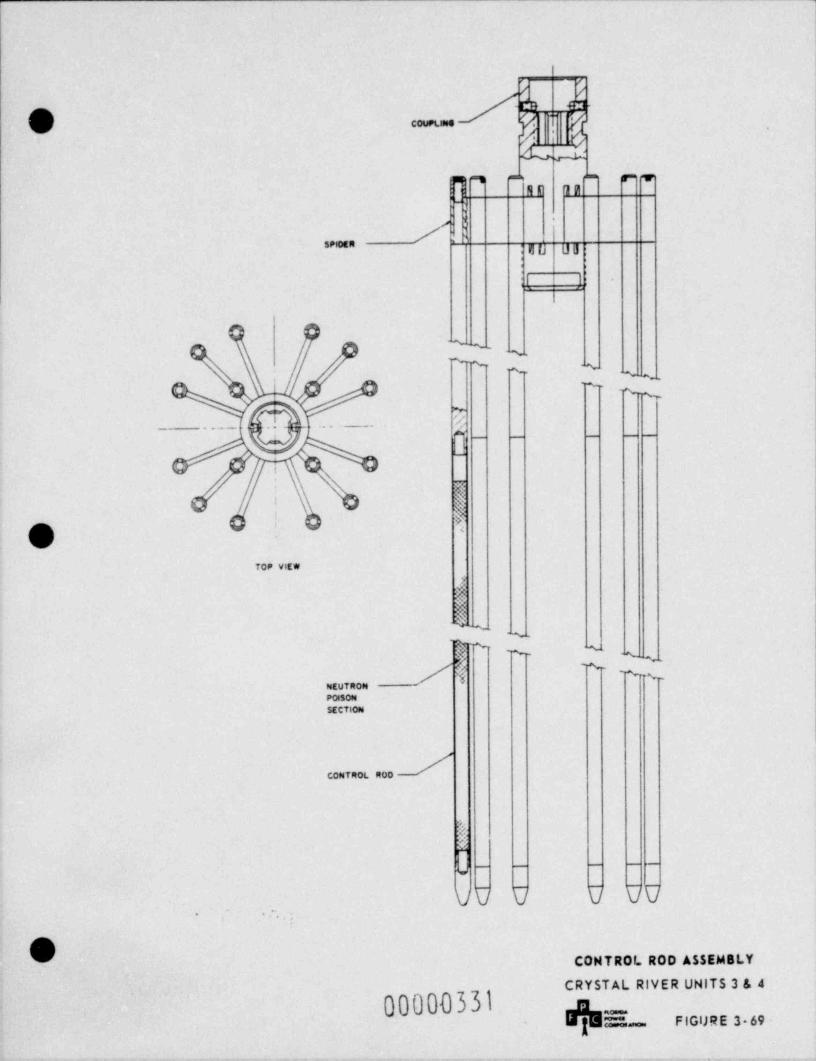
r -- p/ /
j' ' , ..@ g.CouPLNet - ,
L .
! ,/
LE-. .- r. ,imi ,
l RI 1R'
;-
,.
I.
/,spioen -
50 05',
i l. ,
| |
i
ns.s,'%.g,
'
~.%. '%.g,''
-N.s,
%
. .- - . .. 'h_ _ _ _ _
!
2! ?
IOTOP VIEW
X
!$?n
k %,
s.N'%, 's.:r %. .s
.||''/?h '%-
NEUTRONPOSONSECTION
CONTROL ROD
$:S
h _ _ _ _ _
VV V V VU. .
.
,~,,
CONTROL ROD A55EM8LYn,/
CRYSTAL RIVER UNITS 3 & 4
00000331 ._
M- FIGijRE 3 69 -
.
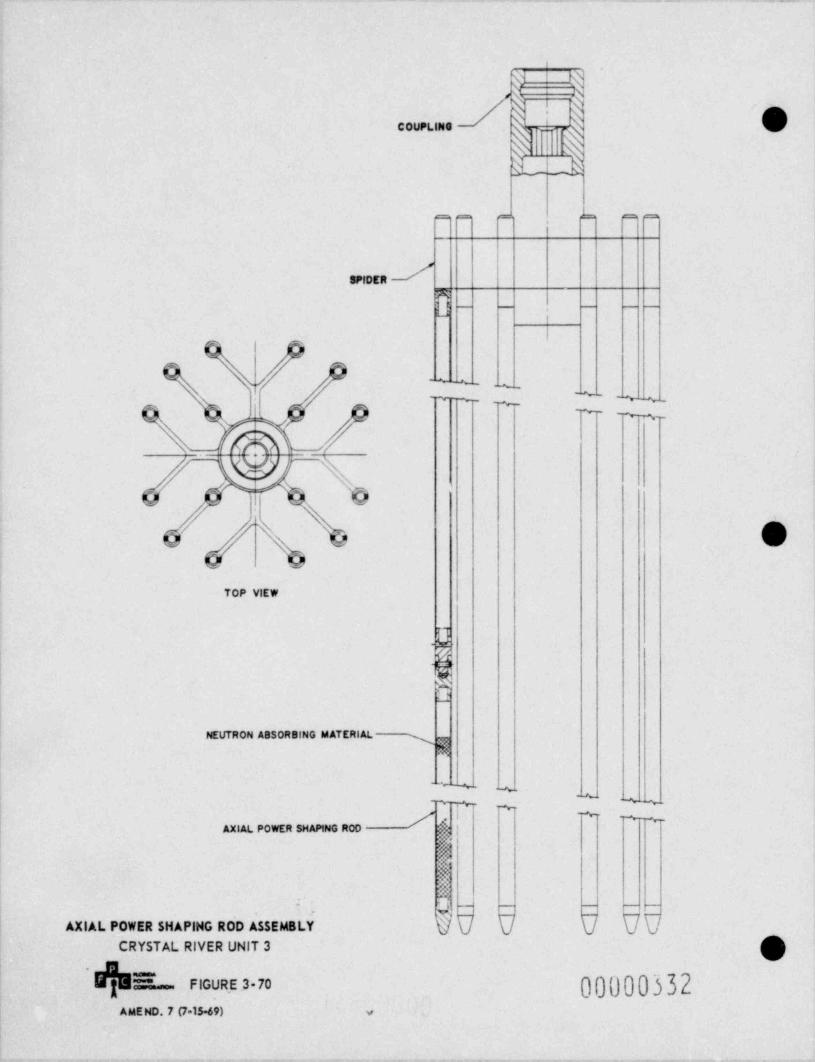
A n.--- --.e. ...e 4 .g.a..
i
-g ._.
.. ._.
SPIDER d
- - - --,
I
/ -~-~. ._. .~.. _ _ . ._ . _.
'
'"%W.,
'N
\o*< --
,
0@ =
TOP VIEW
_d
| jm
NEUTRON ABSORBING MATERIAL
-+-+. . ,
~ ' **-+.*+ ,,.
| / ''' ~~~~-A m tro.ER - Roo
Wm
AXIAL POWER SHAPlHG RdD ASSEMBLY DV V U UV gCRYSTAL RIVER UNIT 3
$=- eicuR.e 3 7o 00000332AMEND. 7 p.1549) v
. - .
Related Documents