Italian Pizza Restaurant Marketing Research Report Smart Marketing, Inc. Pre pare d by Te am 1 Cory Dunkovich Martin Diaz Michael Reichenberger Tony Weber Marketing Research Section 321-02 Pre pare d for: Dr. Maxwell K. Hsu Date Submitted: 4 May, 2015

MKTG321-01_Part3.doc
Aug 18, 2015
Welcome message from author
This document is posted to help you gain knowledge. Please leave a comment to let me know what you think about it! Share it to your friends and learn new things together.
Transcript
Italian Pizza Restaurant Marketing Research Report Smart Marketing, Inc.
Prepared by Team 1 Cory Dunkovich
Martin Diaz Michael Reichenberger
Tony Weber
Marketing Research Section 321-02
Prepared for: Dr. Maxwell K. Hsu
Date Submitted: 4 May, 2015
TABLE OF CONTENTS
SMART MARKETING, INC. MARKETING RESEARCH REPORT
Executive Summary ........................................................................3
Introduction ...................................................................................3
Objectives......................................................................................4
Literature Review ...........................................................................4
Secondary Data Analysis .................................................................7
Research Methodology ....................................................................8
Empirical Findings..........................................................................8
Discussions .................................................................................. 10
Limitations .................................................................................. 11
Conclusion and Recommendations .................................................. 11
References ................................................................................... 13
Appendix ..................................................................................... 13
2
Executive Summary In the fast food industry, good companies really only offer three prime components to
satisfy their customers. These components entail product price, quality, and customer service. Within each of these three components, there are additional points of emphasis regarding things like cleanliness, ingredient quality, and order time. Realistically there is a tradeoff between these three main components, requiring most successful chains to pick between two. Our business will target students from age 18-24. The University of Wisconsin-Whitewater has approximately 12,159 students. The students of Whitewater have been used as a template to expand on the U.S. college-age market. Of that sample size, 86% of the 2014-2015 total enrollment is White/Caucasian. 82% of the total students on campus are also full-time. 13% of the students on campus are from out of state. It is absolutely vital to understand our audiences. The majority of our primary data was collected in the library on campus. Our results included approximately 61 responses. Of those responses 32 males and 39 females filled out our questionnaire completely and thoroughly. We also found that males tend to order from larger market pizza brands like Pizza Hut and Toppers while females tend order from local pizzerias like Rosa’s and Gus’s. Our main focal points will be price optimization, brand recognition, and customer satisfaction. Empirical analysis found that college students order pizza 1.66 times per week, on average. The students are likely to order more pizza if they are more satisfied. Our hypothesis measured customer service and product quality as the main coefficients of satisfaction. The variables of satisfaction were measured on a Likert Scale (1=very dissatisfied, 7=very satisfied) and their means were calculated as follows: customer service = 5.13, product quality 5.59. Customer satisfaction leads to brand loyalty. So our test of satisfaction was with average number of pizza orders per week against customer service and product quality. We’ve compared order frequency to customer satisfaction of service and product quality. We found that the linear regression number of times ordered a week equates to 1.33 + .038(Customer Satisfaction). With that being said, we reject the null hypothesis and our alternative hypothesis will be to exclude service and keep price in the equation. Our previous hypothesis will now be changed to: If we can satisfy our customers by focusing on excellent pricing, ultimately our brand loyalty will flourish. Introduction
Don’t think McDonald’s and ancient Greece have anything in common other than old fryers? Believe it or not but the fast food industry dates back all the way to 300 b.c. Places like inns and taverns were geared towards those from a different land simply passing through or setting new roots. As of late, it is reported by the USDA that over forty-three percent of American meals are eaten on the go, and that one in four Americans eat fast food on a daily basis. In 1970, the fast food industry brought in around six billion dollars in domestic revenue. In 2014, Franchise Help analyzed the fast food industry and reported that revenue skyrocketed to over $160 billion alone at an annualized rate of about 8.6%.
We aim to translate data found through various resources into information useful to our pizza restaurant brand to potentially penetrate the market as effectively as possible. The first step in doing so will be gathering an assortment of secondary data regarding the fast food industry as well as more specifically, the pizza industry. Our group will study the environment of the fast food restaurant business among students enrolled in a college curriculum. We want to
3
focus on those enrolled in a college curriculum for a reason. We want to not only focus on students in the undergrad demographic, typically between the ages of eighteen and twenty-five, but also better understand the graduate demographic. Objectives
First we narrowed down the segment size and market share of the primary pizza chains along with a handful of the major indirect competitors. Indirect competitors may include any brands from the fast food, retail, or the restaurant market. Along with analyzing competitors, our group also be conducted a detailed SWOT analysis to provide additional analytics about the industry as a whole. For this particular project, however, we focused more on the threats and opportunities within the local market. A composition of data regarding direct competitors like Little Caesar’s, Pizza Hut, and Papa John’s as well as indirect competitors like McDonald’s, Wendy’s, and Subway is crucial in determining how successful our pizza business can potentially be. As a group we compiled several empirical examples of students’ purchasing habits. A collection of primary survey data has been gathered in the perspective of the college student. However, customer satisfaction does play a large role in the restaurant industry. We then reviewed the relationship between individual satisfaction and other variables such as; product value, brand loyalty, and brand perception of the average collegiate community.
Our most recent step was to conduct primary research. Our primary research method was to develop a survey according to our target market, demographic, and industry. Our marketing team wrote quick yet relevant questions to ensure that our responses are both accurate and helpful. Our other mode of primary research lies in a focus group setting. With the results we uncover through our testing and surveying, we presented the information we found to our focus groups. Doing this give us an insight into the personal opinion, perception, and quality of information we extract from our sample size. The answers they provide were then analyzed and implemented in our final survey. This information solidified our hypothesis so we can then, develop the framework for our marketing and branding strategy.
Literature Review
Marketing research has been done for every product across every marketing segment with the primary goals of increasing product utilization, rebuy frequency, and increased product recommendation. In order to accomplish all three goals, the customer must at least be satisfied with the product. Satisfying everyone is near impossible because different groups of people from gender, age, culture, etc. have drastically different preferences. The fast-food industry is highly competitive with many different options to choose from and companies need to do something to separate themselves and stand out from the crowd.
North Americans have been eating more meals outside of their home than ever before. In the article, “Positioning of Fast-Food Outlets in Two Regions of North America: A Comparative Study Using Correspondence Analysis” by Kara, Kaynak, and Kucukemiroglu (1996), they comment on this trend:
…, North Americans will consume more than half of their meals outside the home by the end of the century which will also account for nearly 50 percent of their household food expenditures… Of course, this trend is also significantly dependent on a number of demographic and lifestyle changes that accounted for the significant growth in meals consumed outside of the home. However,
4

currently, many types of fast-food outlets are benefitting from this apparent trend. Due to relatively inexpensive costs and quick convenient service, fast-food outlets have become a “home away from home” for breakfast, lunch, and dinner. (p.101) This goes to show how significant the trend of eating out really is with today’s
generation. Everyone wants things done fast and done now. Students often grab food on their way to and from class, professionals want a quick lunch between meetings, and parents are rushed with work and taxiing their kids to practice and other events and need a quick meal between those busy activities. It seems as though no one has the time to cook a meal at home any more. Fast-food provides an outlet for all of those busy people at a cheap cost. Fast-food restaurants can provide their speedy product at a low cost because their materials are very inexpensive. On top of that, fast-food restaurants have the most convenient locations of any restaurant industry because they are made for customers to grab their food on the go.
The key question for fast-food industries now is; how are they going to make their product stand out as the preferred choice from their many other competitors? Fast-food restaurants are looking to attain a positive perception and satisfy consumer’s preferences in order to excel in this market trend. Perceptions are formed from a combination of word-of-mouth communication, exposures to promotion, past personal experience, and other similar sources. Consumers’ perceptions will differ between different countries and geographical areas and it is important to note some of these perceptions might be incorrect. As the only thing a company can truly control is themselves, it is the responsibility of the companies to make sure they are creating an atmosphere where the customers have positive interactions in order to rid of any incorrect perceptions. At the end of the day, if the customers are not satisfied with the quality of the product, the service, or the atmosphere, the company needs to take a step back, listen to what the customers are saying, and implement the necessary changes.
Consumer preference is crucial for fast-food restaurants because they need to know what their market segment is. Different geographical areas such as the U.S. and Canada are close in location, yet they provide us with different market segments. According to Kara, Kaynak, and Kucukemiroglu (1996), delivery service, variety, speed of service, quality, cleanliness, and friendly staff are the most important factors that influence U.S. consumers’ fast-food restaurant preference. For Canadian consumers, seating capacity, cleanliness, nutritional value, friendly personnel, and variety are influencing factors that determine their preference. It is easy to see how culturally, preferences can be so drastically different. As far as age groups are concerned, younger buyers want variety, price, delivery service, and location. Middle-aged consumers look for speed and friendly personnel. And finally older buyers prefer cleanliness, nutritional value, and quality of taste. This goes to show that even consumers in the same geographical area have different preferences based on other factors, namely age. The occasional, less frequent buyers seek promotions and price deals as well as look to meet their children’s requests. As all of these preferences are vitally important for companies to know, let’s not forget the main reason consumers choose fast-food. The most preferred fast-food restaurant for both U.S. and Canadian consumers is the restaurant which is closest to their home. Consumers do not want to have to go out of their way to get food. They want their food fast, after all the title is “fast”-food. Having a convenient location is extremely important in drawing customer traffic to a fast-food restaurant.
Services need to be looked at from the customer’s point of view because they need to be perceived as relevant and important. For the U.S. and France, commonalities among services and classifications include physical, contact, separability, riskiness, switching, person/object
5

relationship, and judgment. Differences include convenience, physical nature of the service, and relationship and service delivery. Cunningham, Young, Ulaga, and Lee’s study suggests “consumers view services on the basis of if the service is personalized or standardized, and if there is a physical component to the service” (p.429).
Brand loyalty is vitally important for fast-food companies. Creating a more consumer oriented company is becoming increasingly necessary for fast-food outlets. According to the article “The Influence of Customer Brand Identification on Hotel Brand Evaluation and Loyalty Development” by Fung So, King, Sparks, and Wang, the strength of customers’ brand loyalty is a commonly used indicator of brand strategy success. Service quality, perceived value, customer satisfaction, and brand trust are all factors that create loyalty. Brand trust is based primarily on the personal experiences customers have with the brand. When a consumer has one or many experiences with the brand, they begin to identify with that brand. Identification is one of the most important things a brand can do with a consumer. “Identification occurs when an individual sees himself as psychologically intertwined with the characteristics of the group.” (So, King, Sparks, Wang, 2013). Consumers are more likely to identify strongly with the brand when consumers perceive the brand as having high quality. If a brand can contribute to a consumer’s sense of belonging to a social group or enhance their positive image within their social group, customers are more likely to be satisfied with that brand. And again, when a company is satisfied with a brand, they are more likely to be repeat customers and tell others about the brand as well.
Brand image can also play an important role in setting apart one brand from another. Brand Image is the perception of the customer which is perceived and persuaded by the customer them self, while buying the commodity and service. Brand image can take into account whether the product or service has components such as: good impression, feel good, fitting to lifestyle or social group, meeting expectations, etc. In a market, like pizza, where the products are similar and do not consistently have distinct variation, brand image can be the attribute to set one brand apart from the rest.
Customer satisfaction is possibly the most valuable component to having a successful brand. The customer satisfaction portion determines whether a customer feels delighted and satisfied, and prevents the customer from looking cheap. Brand loyalty intention centers itself on similar criteria and seamlessly translates into a customer’s more frequent use on the brand (Nischay, Upamannyu, and Shilpa 2014).
A study, “Effect of Brand Image on Customer Satisfaction and Loyalty Intention and the Role of Customer Satisfaction Between Brand Image and Loyalty Intention” by Nischay, Upamannyu, Shilpa (2014), has proven that brand image can be directly linked to customer satisfaction; while customer satisfaction can be directly linked to loyalty intention. The common factor between these two conclusions is customer satisfaction. That then leads to a hypothesis which was confirmed through multiple regression analyses that customer satisfaction can serve as a mediator to link brand image and loyalty intention through a cause and effect relationship. In conclusion, a brand should focus on marketing their image in order to increase their customer satisfaction; resulting in customer loyalty intention.
The same study also proves that loyalty intention is unaffected by target market demographics: the characteristics that make each one of a company's customers unique. Attributes like age, gender, income, and qualifications do not prove to have an effect on loyalty intention. Instead, brand image plays and customer satisfaction play more vital roles in loyalty intention. Nischay, Upamannyu, and Shilpa (2014) based their research off a then current hypothetical model for a cosmetic brand in India. The model was the one described above, in
6
which brand image serves as a mediator to connect customer satisfaction with loyalty intention. Their primary research was basic: gathered and analyzed to demonstrate the validity of the hypothetical model. Their survey only reached 200 people, thus the numbers needed to be reconstructed to make the data from the cosmetic brand more applicable to their study. Our survey is projected to be of a similar size and will have to be reconstructed in order to parallel the findings with the pizza industry. We will have to follow a similar process in our study that was done in the “anchor” article.
From these articles related to preferences, perceptions, brand loyalty, and services, we can conclude that fast-food restaurants have a lot on their plate when it comes to separating themselves from the competition. Appealing to every market segment at one is impossible, so companies need to select the main areas their brand will focus on. With such a vast difference in culture, age, and gender, the opportunity to find a niche in the fast-food market should seem inviting to new businesses. When a company can successfully establish a niche to satisfy consumer needs they will have increased product utilization, rebuy frequency, and increased product recommendation.
In order to learn from the overview above and apply it to our market strategy, we must focus on the perception of our brand, customer satisfaction, and price optimization. Companies in the fast-food industry essentially all sell the same thing. They all sell easy, quick, and tasty products along with the "on the go" lifestyle that corresponds. However, each of our direct and indirect competitors sell their lifestyle in different ways. What is the difference between Burger King and McDonalds? Not much other than how they approach their audiences. A McDonald’s loyalist and a Burger King loyalist is perceived as two very different types of people, but those specific customers essentially want the same thing. Customers have certain traits that match up with specific brands. Smart Marketing, Inc. must do just that to create an adaptable and student-friendly brand to be successful.
Secondary Data Analysis
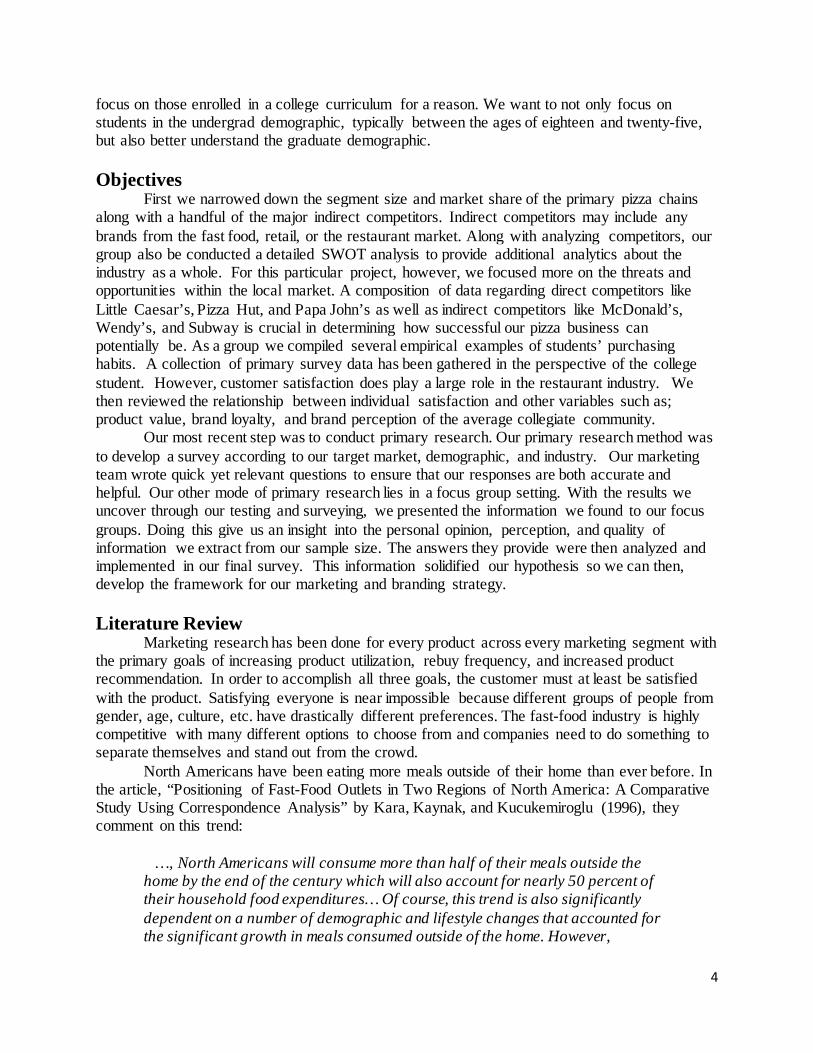
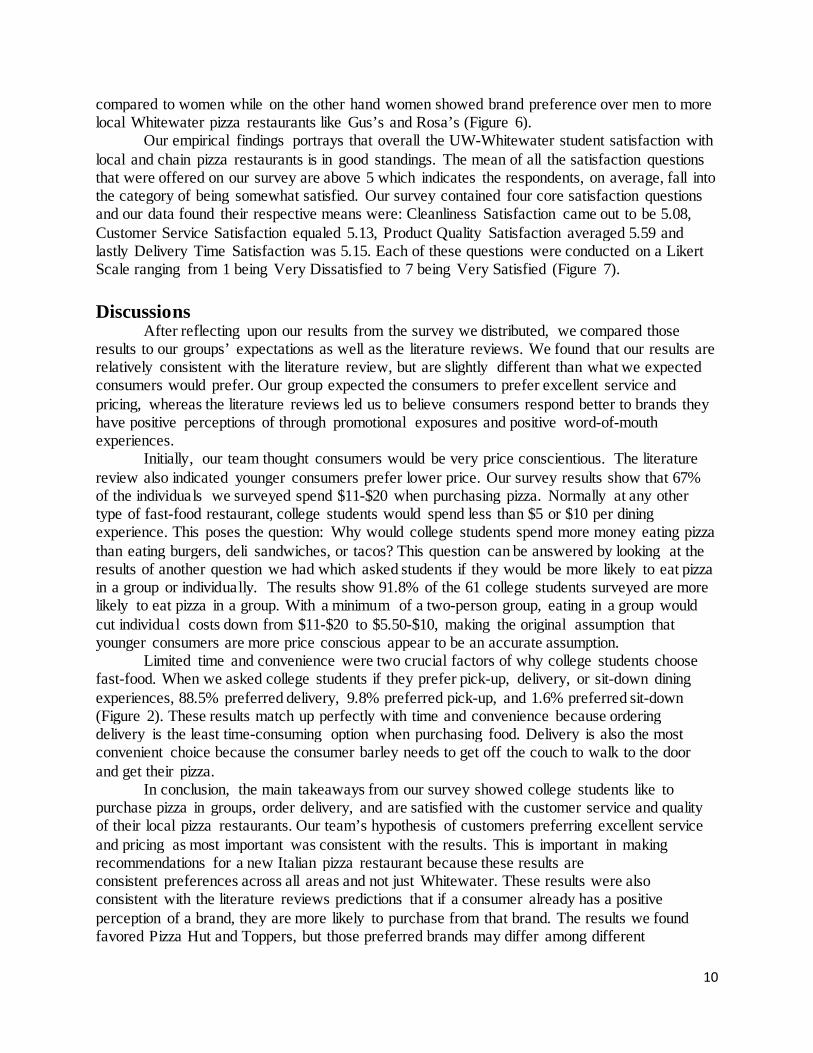
In our secondary data we aimed to analyze the many key aspects of the fast food industry and market while also breaking down the market segmentation into quick service versus full service restaurants. The fast food industry is booming to say the least and many top notch competitors have grown to stand above the rest, (examples seen in Image 1) are McDonald’s Corporation, Yum! Brands, Inc., Subway and Wendy’s Company. This chart also dives into and proclaims each individual companies market share, for example McDonald’s Corp. which holds the leading market share for the fast food industry.
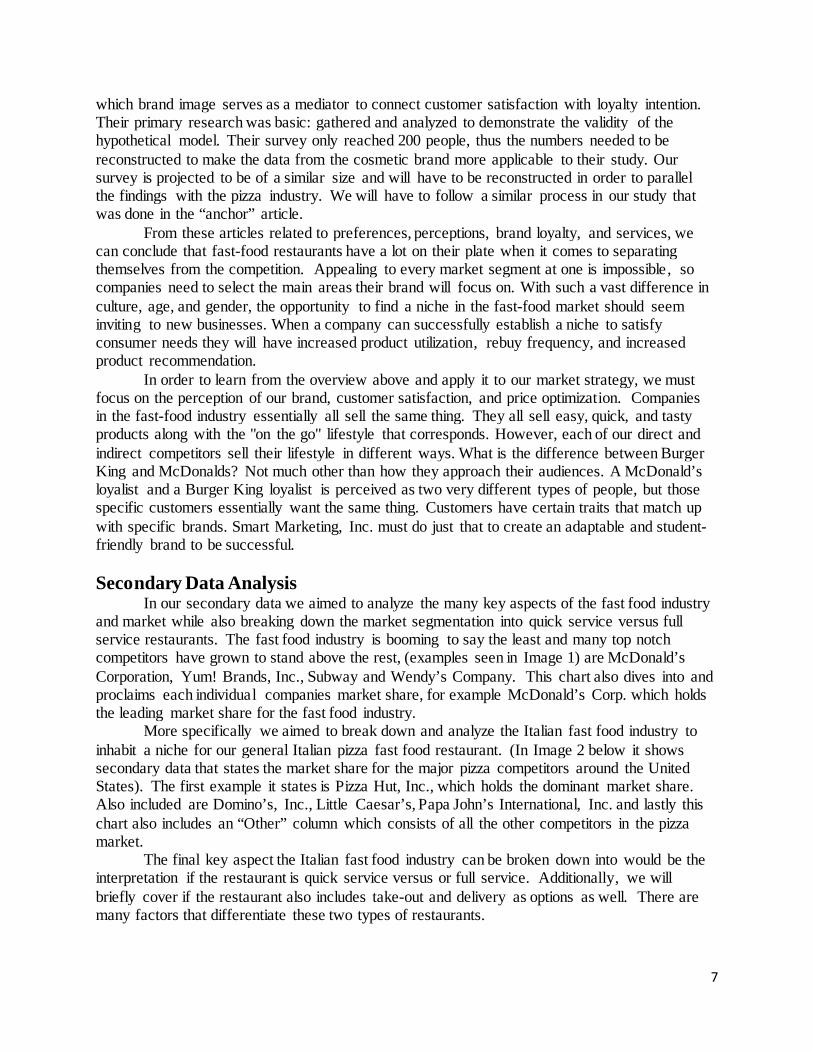
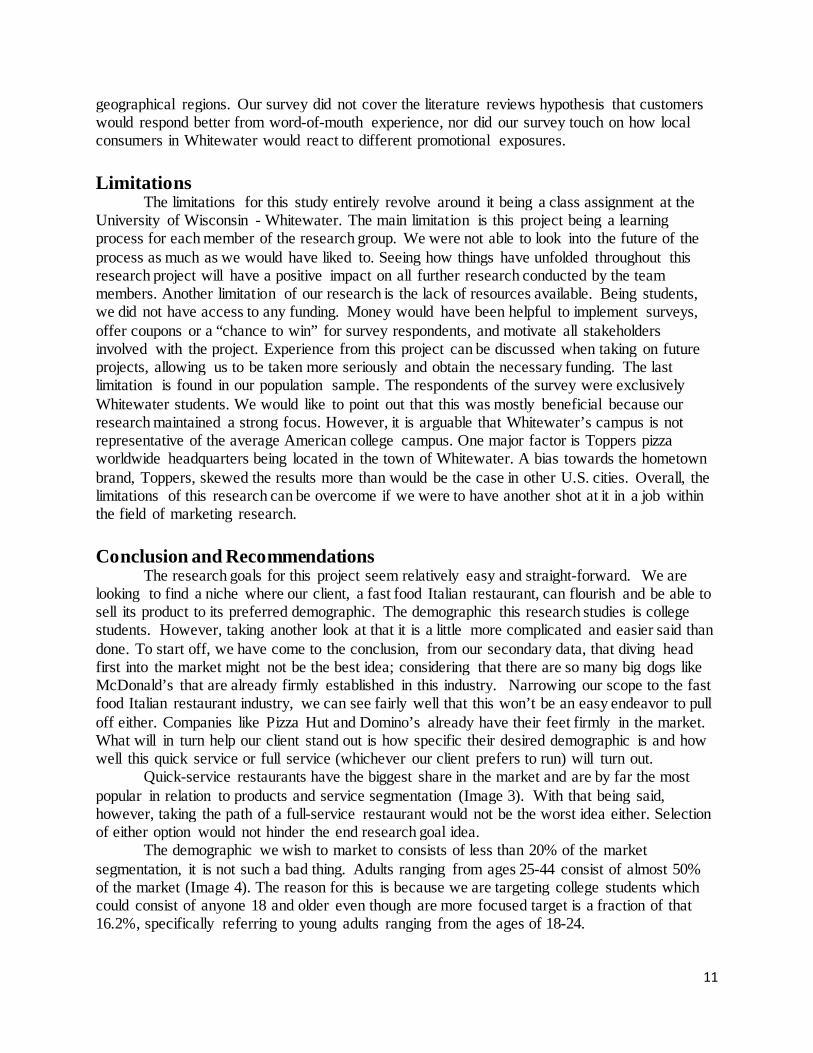
More specifically we aimed to break down and analyze the Italian fast food industry to inhabit a niche for our general Italian pizza fast food restaurant. (In Image 2 below it shows secondary data that states the market share for the major pizza competitors around the United States). The first example it states is Pizza Hut, Inc., which holds the dominant market share. Also included are Domino’s, Inc., Little Caesar’s, Papa John’s International, Inc. and lastly this chart also includes an “Other” column which consists of all the other competitors in the pizza market.
The final key aspect the Italian fast food industry can be broken down into would be the interpretation if the restaurant is quick service versus or full service. Additionally, we will briefly cover if the restaurant also includes take-out and delivery as options as well. There are many factors that differentiate these two types of restaurants.
7
Quick service restaurants are known for their delivery and take-out orders, what they lack in quality, they make up for in speed and nominality. This type of pizza restaurant makes up a huge portion of the market revenue and consists of many huge companies, for example Papa John’s, Domino’s and Little Caesar’s all fall into this category.
On the other hand full service restaurants are specifically known for their family and sit down atmosphere. This type of pizza restaurant also is primarily known for having waiters as well instead of you picking up your food and leaving people almost always sit down to eat at the establishment. This form of pizza restaurant in most cases serves a higher end pizza but for the higher quality it is a custom that it also includes a price premium and can be more expensive. An example from the industry that directly reflects this type of restaurant would be Pizza Hut due to the fact that it offers all of the said options. This restaurant includes a sit down atmosphere but also allows its patrons to order food for delivery and takeout. Research Methodology
Our research methodology started off using primarily a focus group of around 5 people, which lasted about 45 minutes and was conducted in the library. We did this so we could better construct a survey that suited the peers around the campus. The survey we ended up making consisted of 24 questions about various topics about certain pizza brands, pricing, customer satisfaction and ended with demographics (refer to questionnaire at the end of the appendix). Our group made the decision of hand distributing the surveys and interviewing people in person instead of doing an electronic questionnaire. A reason we chose to perform this more difficult route was because we wanted to surveys to be a more personable experience for our candidates and our interviewees.
The next step which was data analysis and diving more into our empirical findings consisted of mainly making charts and graphs on SPSS. Through this application we were able to find interesting trends and behavioral aspects about how individuals answered our questions. Our first trend that was simple enough but still was a good find during our data collection was how much people normally spent on their visits to pizza restaurants. This was a very important find because pricing was a factor that we addressed in our hypothesis. Another huge trend that we found out but ultimately expected (considering we are on a college campus) was that there were a prominent number of people that prefer ordering pizza for delivery, while under the influence and while being in a group setting. This conclusion was derived from three different questions but was a very useful trend nonetheless when analyzing our target market. Additionally, we learned which pizza brands have the most brand loyalty around campus as well. A trend we didn’t expect however was that males tended to prefer chain pizza restaurants like Pizza Hut or Toppers and in contrast females preferred more local, family owned restaurants like Gus’s Pizza or Rosa’s Pizza. Lastly, our final findings revolved around customer satisfaction. Across the board we split customer satisfaction into 4 variables: Cleanliness, Customer Service, Product Quality, and Delivery Time. The means were as follows: 5.08 (Cleanliness), 5.13 (Customer Service), 5.59 (Product Quality) and 5.15 (Delivery Time). Overall, our method and course of action for how we handled all our data collection and went about analyzing it paid off in the end. To conclude, SPSS was a very reliable program for analyzing all the data we managed to collect from our survey. Empirical Findings
8
The primary research has been structured and conducted to test our hypothesis. Our hypothesis is that customers will be granted satisfaction and develop brand loyalty when an organization focuses on excellent service and pricing. This hypothesis was derived from our multiple regression analysis. The empirical findings of the survey support our hypothesis. The findings also go on to uncover variables that relate to customer satisfaction and loyalty. These newfound variables (product quality, delivery time, cleanliness) are also thought to increase the brand quality which, in turn, increases brand satisfaction and loyalty. It is important to remember that our survey was implemented exclusively to college students at the University of Wisconsin - Whitewater and, therefore, reflects the target audience of our client.
Empirical findings from our survey indicate that 67%; the majority, of college students will spend $11-$20 per pizza visit. “Visit” in this case is intended to include any pizza order method: delivery, pick-up, sit-down (Figure 2).
Nearly 87% of respondents spend less than or equal to $20 per visit. 98% of respondents spend less than or equal to $30 per visit. Only 1 respondent indicated that their average spending on pizza is $31-$40 per visit. Our focus group said they would never spend over $40 on pizza. No respondent in the survey marked that they would spend greater than $40, and so our ceiling dollar amount held true (Figure 1).
Empirical findings from our survey indicate that 88.5% of college students prefer delivery over other options when ordering pizza. Out of 61 respondents, a mere 10%, 6 students, prefer pick-up and 2%, 1 student, prefers sit-down as a pizza ordering methods. 5 out of the 6 that prefer pick-up fall in the $11-$20 range and the last falls in the $21-$30 range. The 1 student that prefers sit-down falls in the $21-$30 range (Figures 1 and 2).
Empirical findings for two of the survey questions nearly mirror one another. Question 9 asks, “Would you be more likely to order pizza while under the influence?” While previously in the survey, question 6 asks, “Are you more likely to order pizza in a group setting?” The similarity in data between these two questions reasonably proves that our college demographic is more likely to order pizza while under the influence in a group setting.
Respondents indicated that 93% of college students would be more likely to order pizza while under the influence and nearly 92% or college students are more likely to order pizza in a group setting. There was only one respondent marked that they are more likely to order pizza under the influence, but not in a group setting (Figures 3 and 4).
Without customer satisfaction brand loyalty would be a thing of the past. Brand loyalty reflects each individual customer’s preference over another similar brand. Relating back to our hypothesis once again brand loyalty works hand in hand with customer satisfaction. Without one the other wouldn’t exist or be relevant. It shows that predominantly chain pizza restaurants with larger market share like Pizza Hut are still the most popular and most familiar in college campuses and towns. Toppers and Pizza Hut were the most prominent choices in our survey, (Figure 5) combined taking up 52.50% of our answers. Separately however Toppers was the brand of choice by only a minor difference compared to Pizza Hut (Figure 5).
Lastly, we had one additional intriguing finding through our survey that must be touched on and that’s the brand loyalty of men versus women. It’s safe to assume that on this particular college campus chain restaurants are the preferred reference hands down, which is true to a point (Figure 5). We narrowed the scope of this question however and broke it down by gender preference. Men showed a brand preference to chain restaurants like Pizza Hut and Toppers
9
compared to women while on the other hand women showed brand preference over men to more local Whitewater pizza restaurants like Gus’s and Rosa’s (Figure 6).
Our empirical findings portrays that overall the UW-Whitewater student satisfaction with local and chain pizza restaurants is in good standings. The mean of all the satisfaction questions that were offered on our survey are above 5 which indicates the respondents, on average, fall into the category of being somewhat satisfied. Our survey contained four core satisfaction questions and our data found their respective means were: Cleanliness Satisfaction came out to be 5.08, Customer Service Satisfaction equaled 5.13, Product Quality Satisfaction averaged 5.59 and lastly Delivery Time Satisfaction was 5.15. Each of these questions were conducted on a Likert Scale ranging from 1 being Very Dissatisfied to 7 being Very Satisfied (Figure 7). Discussions
After reflecting upon our results from the survey we distributed, we compared those results to our groups’ expectations as well as the literature reviews. We found that our results are relatively consistent with the literature review, but are slightly different than what we expected consumers would prefer. Our group expected the consumers to prefer excellent service and pricing, whereas the literature reviews led us to believe consumers respond better to brands they have positive perceptions of through promotional exposures and positive word-of-mouth experiences.
Initially, our team thought consumers would be very price conscientious. The literature review also indicated younger consumers prefer lower price. Our survey results show that 67% of the individuals we surveyed spend $11-$20 when purchasing pizza. Normally at any other type of fast-food restaurant, college students would spend less than $5 or $10 per dining experience. This poses the question: Why would college students spend more money eating pizza than eating burgers, deli sandwiches, or tacos? This question can be answered by looking at the results of another question we had which asked students if they would be more likely to eat pizza in a group or individually. The results show 91.8% of the 61 college students surveyed are more likely to eat pizza in a group. With a minimum of a two-person group, eating in a group would cut individual costs down from $11-$20 to $5.50-$10, making the original assumption that younger consumers are more price conscious appear to be an accurate assumption.
Limited time and convenience were two crucial factors of why college students choose fast-food. When we asked college students if they prefer pick-up, delivery, or sit-down dining experiences, 88.5% preferred delivery, 9.8% preferred pick-up, and 1.6% preferred sit-down (Figure 2). These results match up perfectly with time and convenience because ordering delivery is the least time-consuming option when purchasing food. Delivery is also the most convenient choice because the consumer barley needs to get off the couch to walk to the door and get their pizza.
In conclusion, the main takeaways from our survey showed college students like to purchase pizza in groups, order delivery, and are satisfied with the customer service and quality of their local pizza restaurants. Our team’s hypothesis of customers preferring excellent service and pricing as most important was consistent with the results. This is important in making recommendations for a new Italian pizza restaurant because these results are consistent preferences across all areas and not just Whitewater. These results were also consistent with the literature reviews predictions that if a consumer already has a positive perception of a brand, they are more likely to purchase from that brand. The results we found favored Pizza Hut and Toppers, but those preferred brands may differ among different
10
geographical regions. Our survey did not cover the literature reviews hypothesis that customers would respond better from word-of-mouth experience, nor did our survey touch on how local consumers in Whitewater would react to different promotional exposures. Limitations
The limitations for this study entirely revolve around it being a class assignment at the University of Wisconsin - Whitewater. The main limitation is this project being a learning process for each member of the research group. We were not able to look into the future of the process as much as we would have liked to. Seeing how things have unfolded throughout this research project will have a positive impact on all further research conducted by the team members. Another limitation of our research is the lack of resources available. Being students, we did not have access to any funding. Money would have been helpful to implement surveys, offer coupons or a “chance to win” for survey respondents, and motivate all stakeholders involved with the project. Experience from this project can be discussed when taking on future projects, allowing us to be taken more seriously and obtain the necessary funding. The last limitation is found in our population sample. The respondents of the survey were exclusively Whitewater students. We would like to point out that this was mostly beneficial because our research maintained a strong focus. However, it is arguable that Whitewater’s campus is not representative of the average American college campus. One major factor is Toppers pizza worldwide headquarters being located in the town of Whitewater. A bias towards the hometown brand, Toppers, skewed the results more than would be the case in other U.S. cities. Overall, the limitations of this research can be overcome if we were to have another shot at it in a job within the field of marketing research. Conclusion and Recommendations
The research goals for this project seem relatively easy and straight-forward. We are looking to find a niche where our client, a fast food Italian restaurant, can flourish and be able to sell its product to its preferred demographic. The demographic this research studies is college students. However, taking another look at that it is a little more complicated and easier said than done. To start off, we have come to the conclusion, from our secondary data, that diving head first into the market might not be the best idea; considering that there are so many big dogs like McDonald’s that are already firmly established in this industry. Narrowing our scope to the fast food Italian restaurant industry, we can see fairly well that this won’t be an easy endeavor to pull off either. Companies like Pizza Hut and Domino’s already have their feet firmly in the market. What will in turn help our client stand out is how specific their desired demographic is and how well this quick service or full service (whichever our client prefers to run) will turn out.
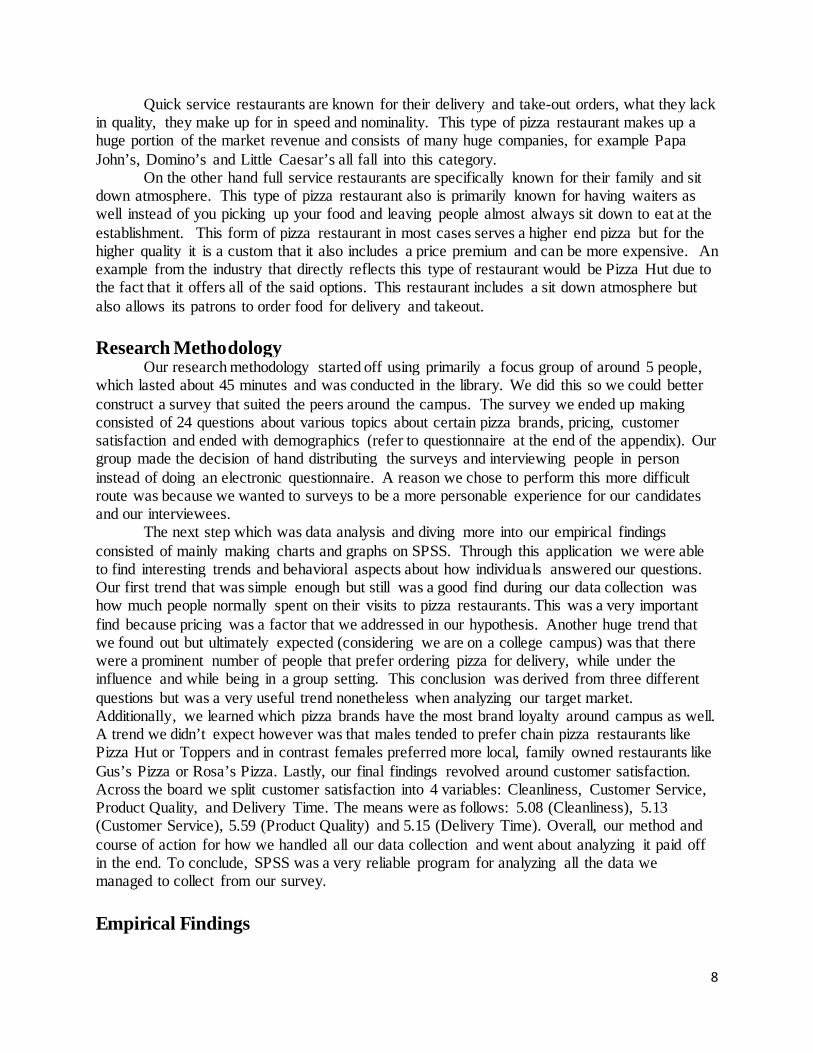
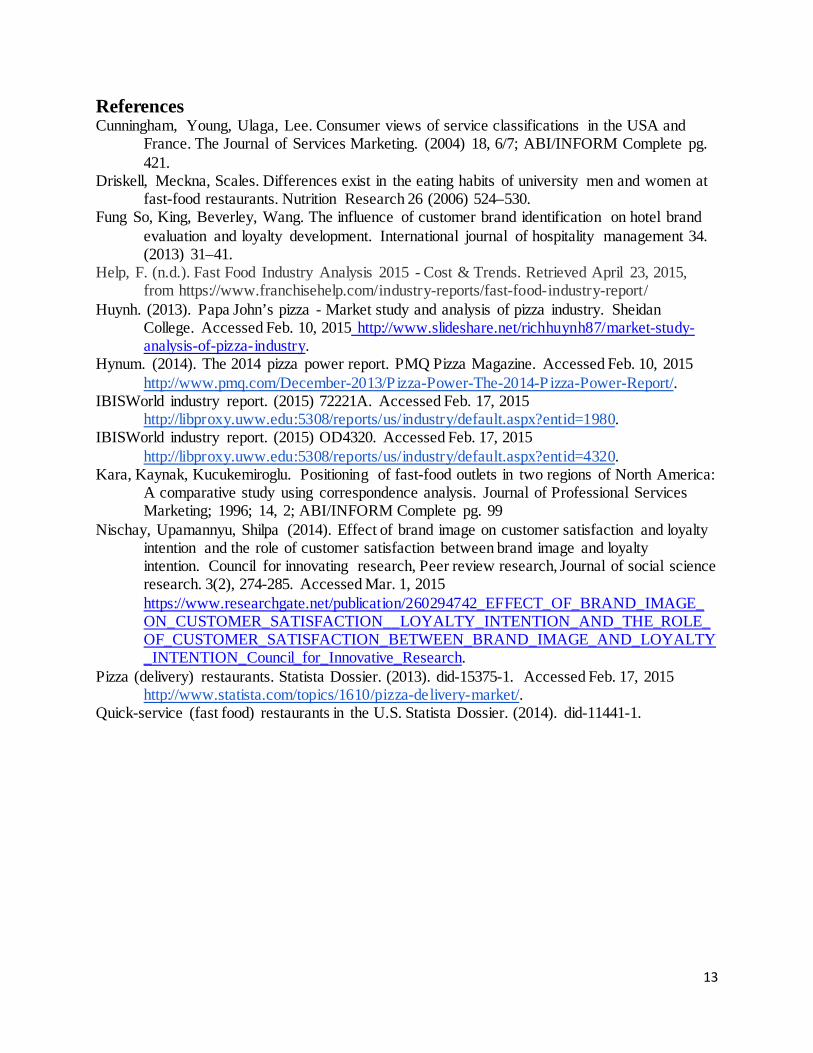
Quick-service restaurants have the biggest share in the market and are by far the most popular in relation to products and service segmentation (Image 3). With that being said, however, taking the path of a full-service restaurant would not be the worst idea either. Selection of either option would not hinder the end research goal idea.
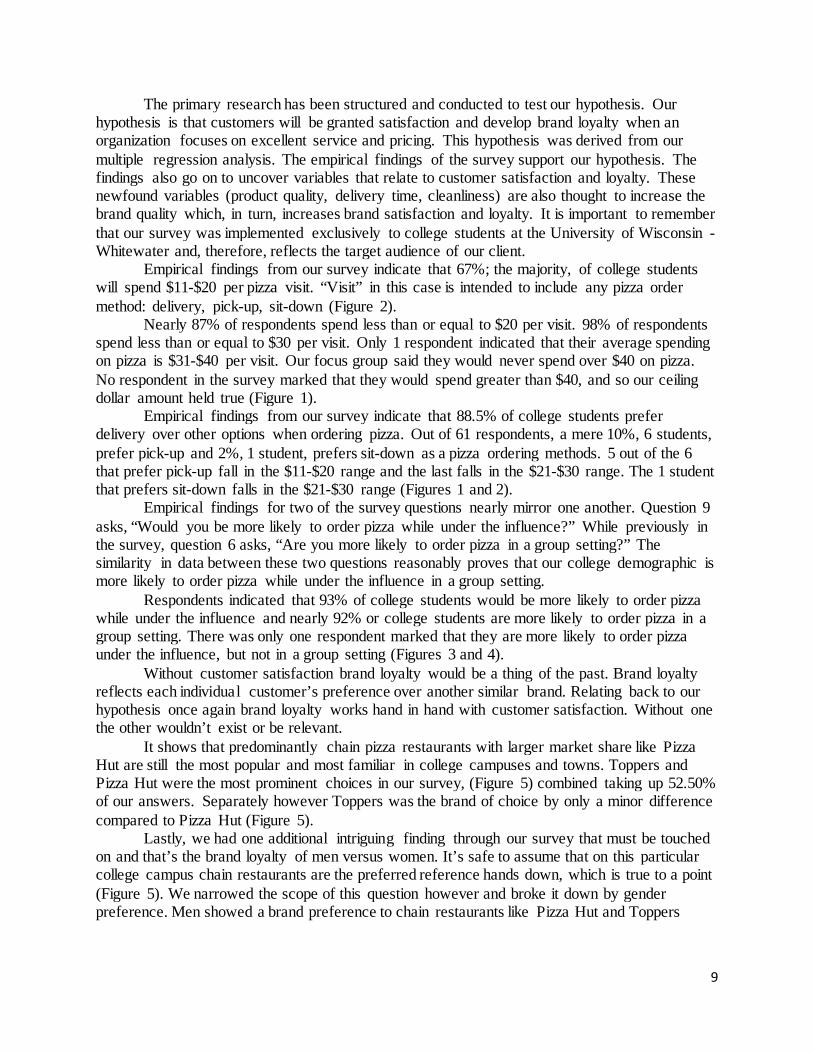
The demographic we wish to market to consists of less than 20% of the market segmentation, it is not such a bad thing. Adults ranging from ages 25-44 consist of almost 50% of the market (Image 4). The reason for this is because we are targeting college students which could consist of anyone 18 and older even though are more focused target is a fraction of that 16.2%, specifically referring to young adults ranging from the ages of 18-24.
11

Lastly, referring to the data we found that is relatable from our literature review we can make many key conclusions that will help us take some well informed steps in the right direction. Our first big example is on the value of nutrition. People perceive themselves as wanting to lose weight, so our product has to be somewhat healthy to say the least. We want it to appeal to the demographic while still being as healthy for them as our client can make it. Secondly, depending on where this restaurant opens, being the U.S. or Canada, each place values different things over others. To make this more clear an example: people from the U.S. value the quality of the food, cleanliness of the restaurant and friendliness of staff over nutritional value and variety of products and this is vice versa for Canada. So taking this into consideration will also be a valuable and knowledgeable approach when deciding every characteristic our client wishes to have in their restaurant. Another thing to consider is the consumer’s perception of similar restaurants. Again, what this means is McDonald’s, Wendy’s and Burger King all sell their own types of burgers and are grouped together in that said category of having similar products. Even then consumers have their own specific preferences about each restaurant and may only eat exclusively at one of those establishments. Another thing to review that plays off of what was just said is brand loyalty. So if a customer has a great time at a certain place and enjoys the atmosphere and the products they offer they will most likely return again and again because they keep having great impressions and experiences. The primary data and secondary data we discovered was utilized to get a better understanding of the industry, the market, the demographics and accomplish exactly what we wanted to best aid our client. In conclusion, since our research goal was to allow our client flourish in the United State college fast-food market through customer satisfaction; our high hypothesis was derived from exactly that. High customer satisfaction leads to high re-buy behavior and a positive word of mouth.
12
References Cunningham, Young, Ulaga, Lee. Consumer views of service classifications in the USA and
France. The Journal of Services Marketing. (2004) 18, 6/7; ABI/INFORM Complete pg. 421.
Driskell, Meckna, Scales. Differences exist in the eating habits of university men and women at fast-food restaurants. Nutrition Research 26 (2006) 524–530.
Fung So, King, Beverley, Wang. The influence of customer brand identification on hotel brand evaluation and loyalty development. International journal of hospitality management 34. (2013) 31–41.
Help, F. (n.d.). Fast Food Industry Analysis 2015 - Cost & Trends. Retrieved April 23, 2015, from https://www.franchisehelp.com/industry-reports/fast-food-industry-report/ Huynh. (2013). Papa John’s pizza - Market study and analysis of pizza industry. Sheidan
College. Accessed Feb. 10, 2015 http://www.slideshare.net/richhuynh87/market-study-analysis-of-pizza-industry.
Hynum. (2014). The 2014 pizza power report. PMQ Pizza Magazine. Accessed Feb. 10, 2015 http://www.pmq.com/December-2013/Pizza-Power-The-2014-Pizza-Power-Report/.
IBISWorld industry report. (2015) 72221A. Accessed Feb. 17, 2015 http://libproxy.uww.edu:5308/reports/us/industry/default.aspx?entid=1980.
IBISWorld industry report. (2015) OD4320. Accessed Feb. 17, 2015 http://libproxy.uww.edu:5308/reports/us/industry/default.aspx?entid=4320.
Kara, Kaynak, Kucukemiroglu. Positioning of fast-food outlets in two regions of North America: A comparative study using correspondence analysis. Journal of Professional Services Marketing; 1996; 14, 2; ABI/INFORM Complete pg. 99
Nischay, Upamannyu, Shilpa (2014). Effect of brand image on customer satisfaction and loyalty intention and the role of customer satisfaction between brand image and loyalty intention. Council for innovating research, Peer review research, Journal of social science research. 3(2), 274-285. Accessed Mar. 1, 2015 https://www.researchgate.net/publication/260294742_EFFECT_OF_BRAND_IMAGE_ON_CUSTOMER_SATISFACTION__LOYALTY_INTENTION_AND_THE_ROLE_OF_CUSTOMER_SATISFACTION_BETWEEN_BRAND_IMAGE_AND_LOYALTY_INTENTION_Council_for_Innovative_Research.
Pizza (delivery) restaurants. Statista Dossier. (2013). did-15375-1. Accessed Feb. 17, 2015 http://www.statista.com/topics/1610/pizza-delivery-market/.
Quick-service (fast food) restaurants in the U.S. Statista Dossier. (2014). did-11441-1.
13
Appendix Image 1
Image 2
Image 3
14
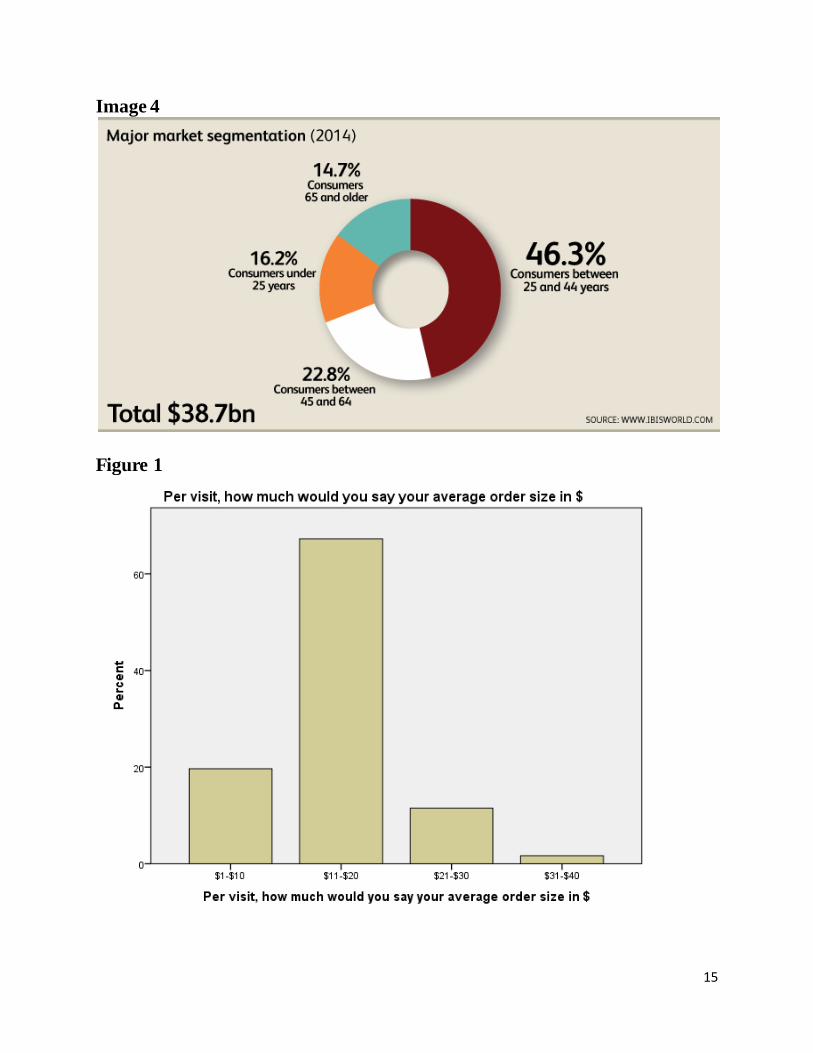
Image 4
Figure 1
15
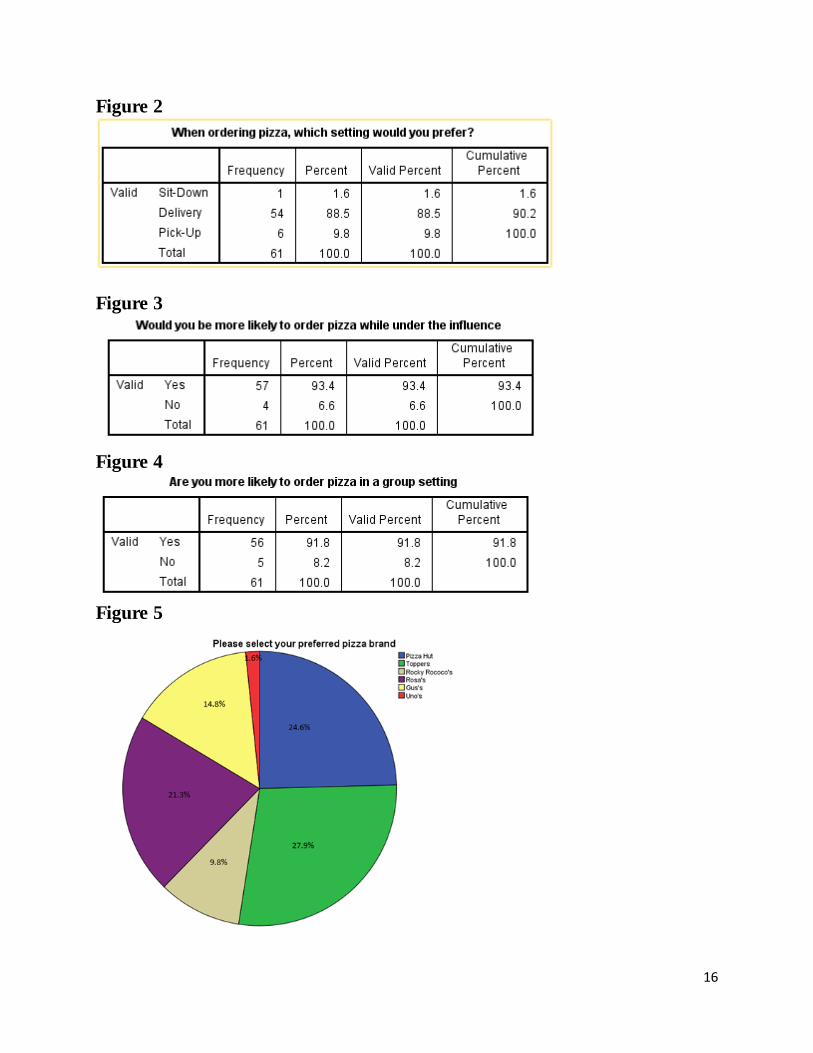
Figure 2
Figure 3
Figure 4
Figure 5
16
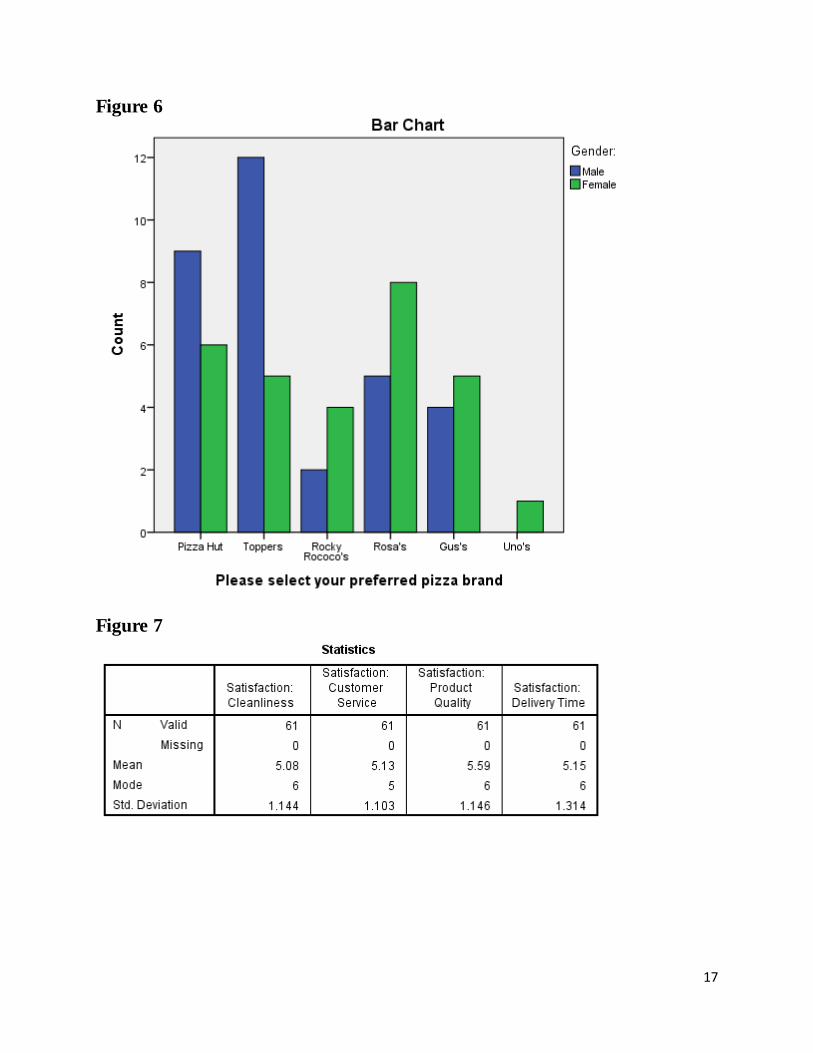
Figure 6
Figure 7
17

Figure 8.1
Figure 8.2
18
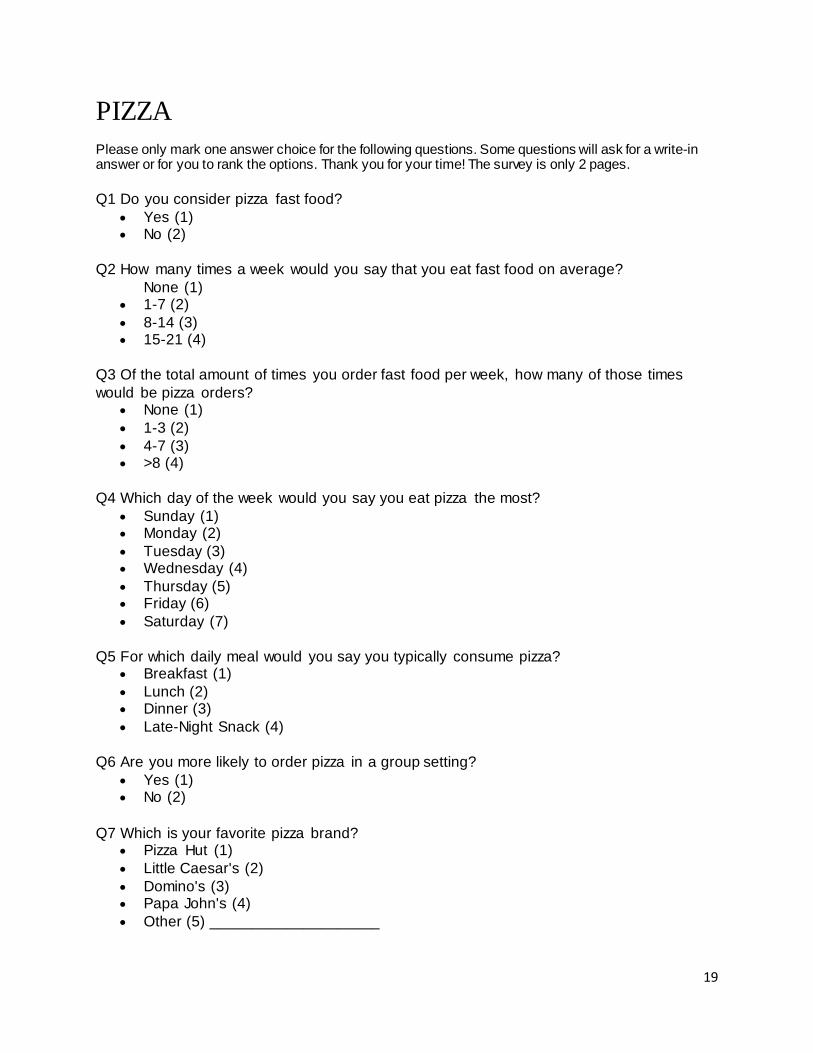
PIZZA Please only mark one answer choice for the following questions. Some questions will ask for a write-in answer or for you to rank the options. Thank you for your time! The survey is only 2 pages. Q1 Do you consider pizza fast food?
• Yes (1) • No (2)
Q2 How many times a week would you say that you eat fast food on average?
None (1) • 1-7 (2) • 8-14 (3) • 15-21 (4)
Q3 Of the total amount of times you order fast food per week, how many of those times would be pizza orders?
• None (1) • 1-3 (2) • 4-7 (3) • >8 (4)
Q4 Which day of the week would you say you eat pizza the most?
• Sunday (1) • Monday (2) • Tuesday (3) • Wednesday (4) • Thursday (5) • Friday (6) • Saturday (7)
Q5 For which daily meal would you say you typically consume pizza?
• Breakfast (1) • Lunch (2) • Dinner (3) • Late-Night Snack (4)
Q6 Are you more likely to order pizza in a group setting?
• Yes (1) • No (2)
Q7 Which is your favorite pizza brand?
• Pizza Hut (1) • Little Caesar's (2) • Domino's (3) • Papa John's (4) • Other (5) ____________________
19
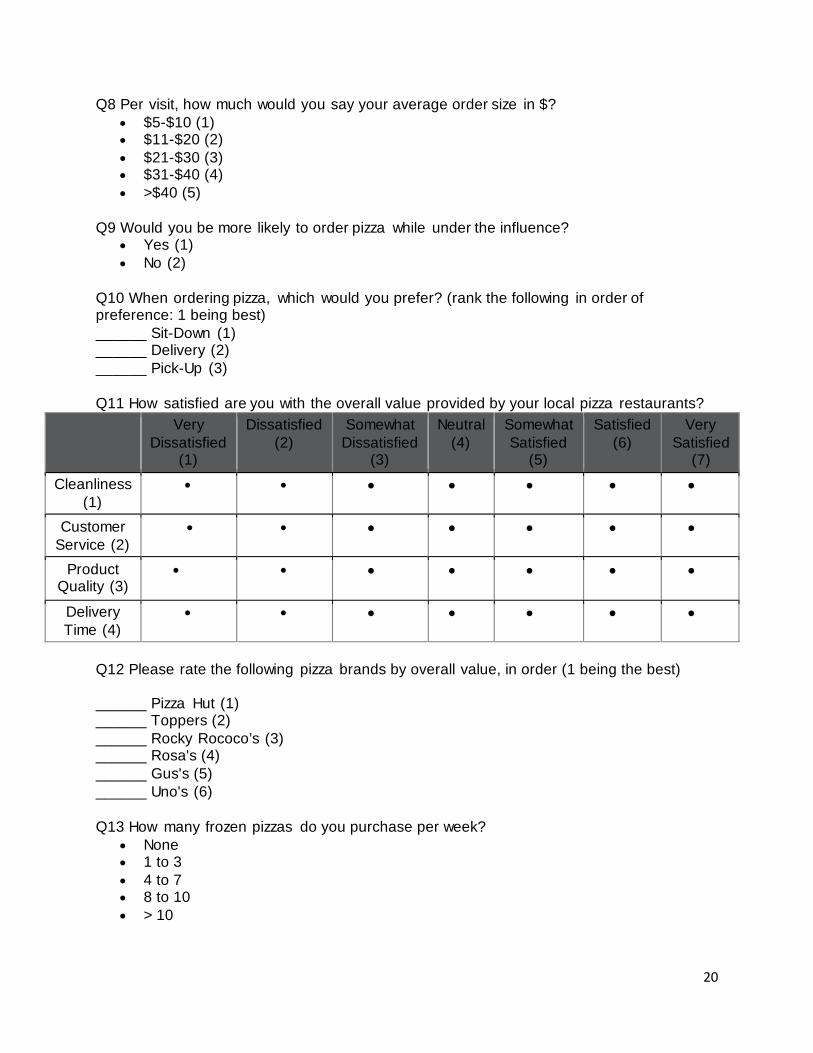
Q8 Per visit, how much would you say your average order size in $? • $5-$10 (1) • $11-$20 (2) • $21-$30 (3) • $31-$40 (4) • >$40 (5)
Q9 Would you be more likely to order pizza while under the influence?
• Yes (1) • No (2)
Q10 When ordering pizza, which would you prefer? (rank the following in order of preference: 1 being best) ______ Sit-Down (1) ______ Delivery (2) ______ Pick-Up (3) Q11 How satisfied are you with the overall value provided by your local pizza restaurants?
Very Dissatisfied
(1)
Dissatisfied (2)
Somewhat Dissatisfied
(3)
Neutral (4)
Somewhat Satisfied
(5)
Satisfied (6)
Very Satisfied
(7) Cleanliness
(1) • • • • • • •
Customer Service (2)
• • • • • • •
Product Quality (3)
• • • • • • •
Delivery Time (4)
• • • • • • •
Q12 Please rate the following pizza brands by overall value, in order (1 being the best)
______ Pizza Hut (1) ______ Toppers (2) ______ Rocky Rococo’s (3) ______ Rosa's (4) ______ Gus's (5) ______ Uno's (6) Q13 How many frozen pizzas do you purchase per week?
• None • 1 to 3 • 4 to 7 • 8 to 10 • > 10
20
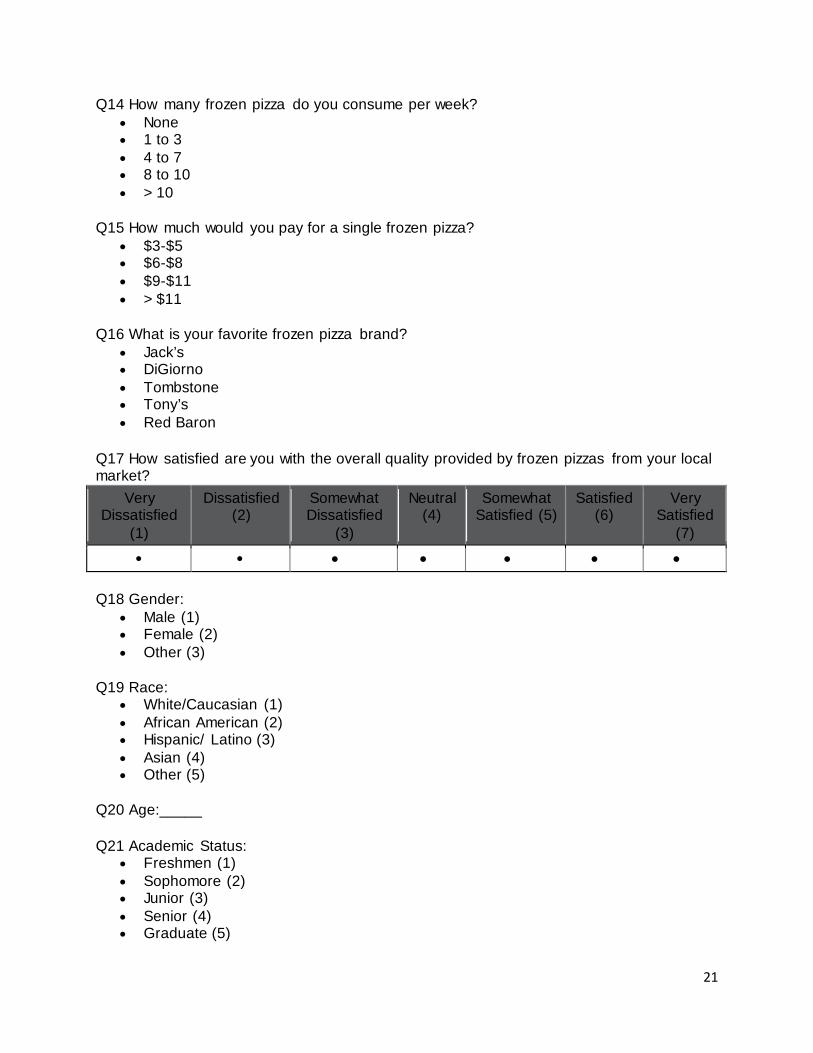
Q14 How many frozen pizza do you consume per week? • None • 1 to 3 • 4 to 7 • 8 to 10 • > 10
Q15 How much would you pay for a single frozen pizza?
• $3-$5 • $6-$8 • $9-$11 • > $11
Q16 What is your favorite frozen pizza brand?
• Jack’s • DiGiorno • Tombstone • Tony’s • Red Baron
Q17 How satisfied are you with the overall quality provided by frozen pizzas from your local market?
Very Dissatisfied
(1)
Dissatisfied (2)
Somewhat Dissatisfied
(3)
Neutral (4)
Somewhat Satisfied (5)
Satisfied (6)
Very Satisfied
(7) • • • • • • •
Q18 Gender:
• Male (1) • Female (2) • Other (3)
Q19 Race:
• White/Caucasian (1) • African American (2) • Hispanic/ Latino (3) • Asian (4) • Other (5)
Q20 Age:_____ Q21 Academic Status:
• Freshmen (1) • Sophomore (2) • Junior (3) • Senior (4) • Graduate (5)
21
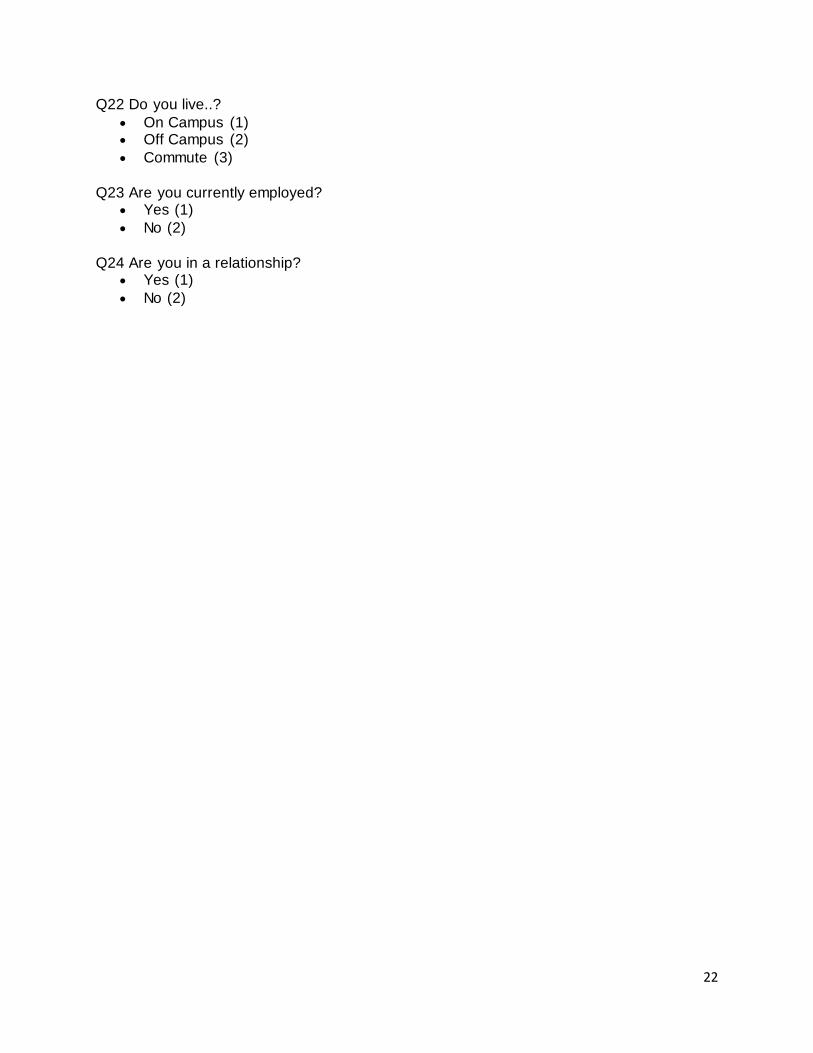
Q22 Do you live..? • On Campus (1) • Off Campus (2) • Commute (3)
Q23 Are you currently employed?
• Yes (1) • No (2)
Q24 Are you in a relationship?
• Yes (1) • No (2)
22
Related Documents