Measuring Execution Quality in a Fragmented Market (US) MARKIT BROKER ANALYSIS March 30, 2015

MKT_Broker_Analysis_Measuring_Execution_Quality_in_a_Fragmented_Market(US)_March2015_report
Aug 15, 2015
Welcome message from author
This document is posted to help you gain knowledge. Please leave a comment to let me know what you think about it! Share it to your friends and learn new things together.
Transcript
Measuring Execution Quality in a Fragmented Market (US)
MARKIT BROKER ANALYSIS
March 30, 2015

Measuring Execution Quality in a Fragmented Market (US) – March 30, 2015 \ 2
Has Implementation Shortfall exhausted its usefulness in evaluating execution quality for large equity orders?This report is an update of a previously published report that focuses on brokers and their ability to minimize the price impact required to execute an institutional size order. The report introduces a unique set of execution quality metrics designed to fill the gap left by ordinary TCA benchmark analysis. These measures pioneered by Markit’s trading analytics group untangle the interaction of a client’s orders in the market with the interactions of others in the market to isolate the cumulative price impact of acquiring liquidity.
Of particular interest in this report are those orders that demand more than 5% of a stock’s average daily trading volume. This study confirms that brokers are having differing levels of success in leveraging their trading talent and technologies to minimize the cost of acquiring liquidity. The report also reveals the glaring inadequacy of relying on IS measures which effectively act as a proxy for execution interval momentum. Using IS to judge execution quality is like using the visible coastline to understand the continent that lies beyond it.

This report update applies a number of innovative measures developed to more precisely evaluate the sell-side’s ability to deliver value to Markit clients through effective liquidity management.
The simple VWAP and Implementation Shortfall benchmarks relied on by traditional TCA providers fail to deliver any reliable insight into the efficient sourcing of liquidity. Both of these popular benchmark-driven measures are overwhelmed by the noise of short-term market drift and the influence of competing orderflow in a security. Though the influence of market related drift and short-term alpha require significant attention from traders, they are distinctly different from judging the impact and effectiveness of a client’s liquidity sourcing for their own executions.
To better measure successful liquidity management, Markit has developed four unique analysis metrics that we use to examine each order in our universe:
— Cumulative Liquidity Charge® (CLC)
— % of Order/Overall Adverse Ticks
— Order Average Trade Size (ATS) as a % of Interval ATS
— CLC Forecast Error
Our ongoing research into execution quality using these metrics confirms that there are strategies and execution providers that consistently deliver superior trading outcomes. This achievement results in lower realized cumulative price impacts, reduced adverse tick exposure, high relative fill sizes and positive CLC Forecast Errors. Consistent success across these metrics requires that a firm optimize their trading technology,address liquidity fragmentation and neutralize aggressive trading competitors.
Introduction
Measuring Execution Quality in a Fragmented Market (US) – March 30, 2015 \ 3
High Frequency Trading competitors continue to capture the market’s imagination.
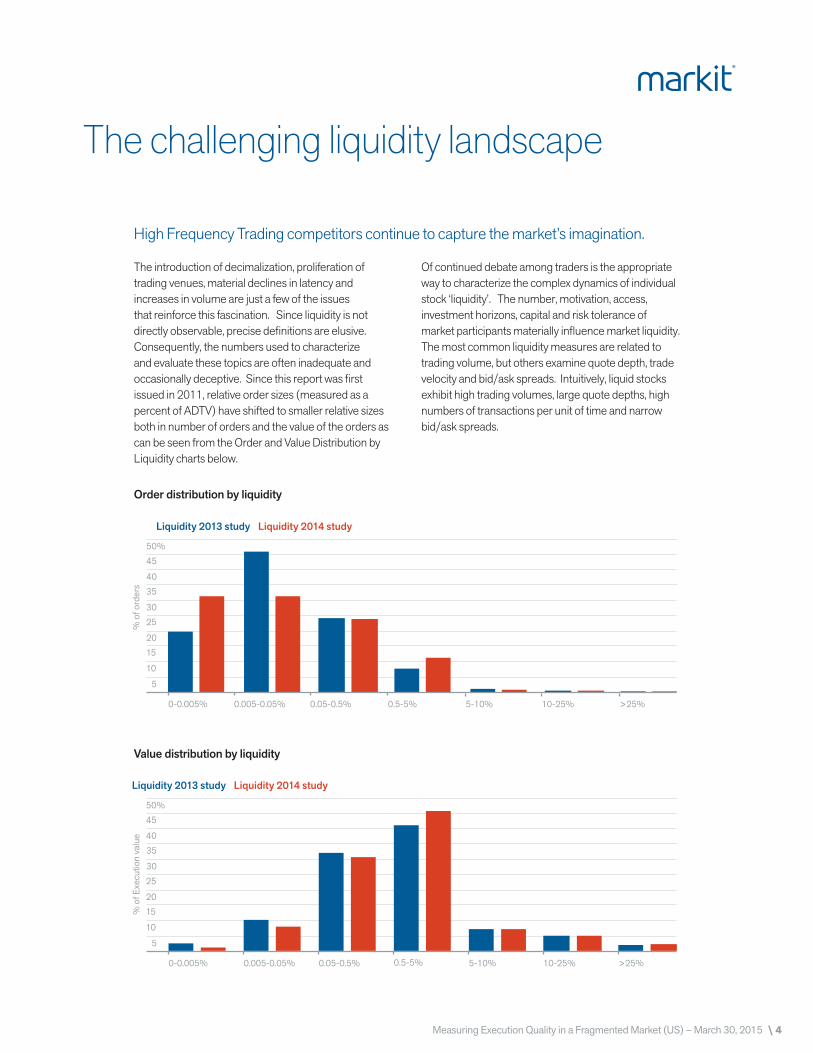
The introduction of decimalization, proliferation of trading venues, material declines in latency and increases in volume are just a few of the issues that reinforce this fascination. Since liquidity is not directly observable, precise definitions are elusive. Consequently, the numbers used to characterize and evaluate these topics are often inadequate and occasionally deceptive. Since this report was first issued in 2011, relative order sizes (measured as a percent of ADTV) have shifted to smaller relative sizes both in number of orders and the value of the orders as can be seen from the Order and Value Distribution by Liquidity charts below.
Of continued debate among traders is the appropriate way to characterize the complex dynamics of individual stock ‘liquidity’. The number, motivation, access, investment horizons, capital and risk tolerance of market participants materially influence market liquidity. The most common liquidity measures are related to trading volume, but others examine quote depth, trade velocity and bid/ask spreads. Intuitively, liquid stocks exhibit high trading volumes, large quote depths, high numbers of transactions per unit of time and narrow bid/ask spreads.
Order distribution by liquidity
Liquidity 2013 study Liquidity 2014 study
0-0.005% 0.005-0.05% 0.05-0.5% 0.5-5%
% o
f ord
ers
5-10% 10-25% >25%
50%45
4035
3025
2015
10
5
Value distribution by liquidity
Liquidity 2013 study Liquidity 2014 study
0-0.005% 0.005-0.05% 0.05-0.5% 0.5-5% 5-10% 10-25% >25%
50%45
4035
3025
2015
10
5
% o
f Exe
cutio
n va
lue
The challenging liquidity landscape
Measuring Execution Quality in a Fragmented Market (US) – March 30, 2015 \ 4

The Order Distribution by Liquidity chart above shows that buy-side traders have continued to parcel orders into smaller and smaller trade sizes over the last few years. Over 30% of orders in the 2014 sample are between 0 and 0.005% of daily volume. This trend confirms that desks are adding more active liquidity management to their trading process. It also shows that investment managers are disseminating orders to the market in less chunky sizes as they continually become aware of the dangers of information leakage and predatory trading. Accordingly, the Value Distribution by Liquidity above shows an increase in notional value traded for orders ranging from 0. 5% - 5% of day’s volume, while larger orders between 5% and 25% of day’s volume saw a stable trend.
Trading volumes drive much of the perception of liquidity in today’s equity market. Increasingly, traders differentiate conceptually between the sources of the transactions in the market. A quote from a few months ago sums up the concerns on this issue, “Liquidity is the depth of the market as expressed by the number of unique shares available to transact. If the same two people pass a thousand shares back and forth a thousand times a minute, it looks like a million shares of volume on the tape. But there are only a thousand shares of liquidity. That distorts market signals.”
As the above quote suggests, the emergence of high frequency trading operations with ultra-short investment horizons has materially changed equity market liquidity dynamics.
A new class of quasi market maker has evolved and has successfully woven together the communication, computation and automation advantages of technology. These capabilities translate into a firm’s ability to be on the inside bid and offer of thousands of stocks across 50+ venues in the US. The latency advantage offered by co-location allows HFT’s the option of cancelling those quotes before they can be a true source of liquidity. Recent statistics indicate that the message to execution ratio may be 30:1 or higher.
It would be naive to not consider the P&L advantages for a competitive low-latency trading firm who, having identified offers lifted on one venue, wouldn’t immediately cancel offers on other venues. Not only would that apparent liquidity disappear, but it’s conceivable that this signal, combined with corroborating pattern recognition analysis, would prompt a more aggressive bid in the stock in anticipation of the trading demand . In this scenario, the pattern of signals by an institutional buyer may have converted a passive liquidity provider to an active anticipatory competitor. These dynamics would certainly tighten bid/ask spreads and increase volumes, but would they improve actual liquidity or merely create the illusion of liquidity? It is these dynamics that are inspiring the development of increasingly sophisticated trading technologies by the brokers that are competing for agency orderflow.
THE CHALLENGING LIQUIDITY LANDSCAPE
Measuring Execution Quality in a Fragmented Market (US) – March 30, 2015 \ 5

Liquidity metrics in context
Most institutional trading desks understand that liquidity management must be considered in the context of the investment goal itself.
The catalysts for the buy/sell decision are often of primary importance since they often contain important information about expectations for the future direction of prices. Optimal liquidity management should leverage these investment priorities to simultaneously balance the exposure to the cumulative price impact of their executions and the price drift experienced during completion of the order. This reality propelled Markit to develop a technique that accurately differentiates the price impact of accessing liquidity from the price drift related to trade timing. This innovation is a key advancement in acquiring the numbers required to put liquidity management into context within the overall investment process.
In addition to measures related to deciphering the path of prices over the execution period, there are opportunities to directly examine the elements of volume into context of what transpired over the trading interval.
When properly conceived, such measures will help better separate actionable liquidity from the illusion of liquidity. For example, quotes that evaporate may influence the average bid or ask size, but only trades that actually occur are considered in calculating the average trade size for a stock. Similarly, the bid/ask spread can expand and contract from transitory quotes, but actual spreads at execution and the price changes that accompanied them are a measurable reality.
Ancillary metrics often associated with liquidity management include individual fill rates and price reversals that occur immediately following an execution or the completion of an order. This type of analysis is outside the scope of this report. You can request the reports “Liquidity Charge® & Price Reversals: Is High Frequency Trading Adding Insult to Injury?” and “Evaluating Liquidity Capture: The TCAP Ratio” for more details.
Measuring Execution Quality in a Fragmented Market (US) – March 30, 2015 \ 6

The price impact for liquidityCumulative Liquidity Charge®
Few would argue with the fact that institutional size liquidity comes at a price.
Unfortunately, few practitioners have accurate insight into the size of the price concession, how it accumulates and when it’s incurred. It’s our experience that once this information gap is filled, traders act to fine-tune trading strategies and ensure that their agency execution providers are efficiently managing their liquidity management responsibilities.
The ability to accurately calculate the size of the price concession requires that the standard implementation shortfall measure has to be broken into its constituent parts which we refer to as the Cumulative Liquidity Charge® and Timing Consequence®. An order’s Cumulative Liquidity Charge isolates the cumulative price impact specifically resulting from an order’s individual executions. The calculation examines the market conditions related to each individual execution that comprises a completed order. This analysis is accomplished by matching each time-stamped execution from a given order to the trade and quote data for the security. Any price concessions (adverse ticks) directly related to the executions are identified and accumulated over the life of the order. These cumulative price concessions provide a unique
insight into the liquidity dynamics that existed during the execution interval. A more detailed review of this innovative calculation technique is available in Markit’s December of 2008 report titled “Anatomy of a Footprint”.
It stands to reason that the larger the relative size of spreads the greater the potential exposure to cumulative price changes for the execution of an institutional size order. To properly account for this phenomenon we developed a Spread-Adjusted Cumulative Liquidity Charge. Normalizing the Cumulative Liquidity Charge by dividing it by the Spread Cost of each stock traded is an effective way to assure that the measure is contextualized to the stock specific properties that directly influence the price impact of completing an order. It also enhances our ability to make standardized comparisons of broker performance. For example, a broker with a Spread-Adjusted CLC of 200% on average pays the equivalent of twice the bid/offer spread on every share across the entire order, while a broker that pays 25% required less than a quarter of the spread cumulative concession to execute the order. We use this measure to rank the brokers in the study.
Spread-Adjusted Cumulative Liquidity Charge: The Cumulative Liquidity Charge normalized by the Spread Cost.
Cumulative Liquidity Charge Spread Cost
Spread - Adjusted CLC =
Implementation Shortfall: The total slippage between Arrival Price and Execution Price. This is calculated for each execution and aggregated into the total Implementation Shortfall. This is the sum of two parts: Cumulative Liquidity Charge and Timing Consequence.
Cumulative Liquidity Charge® (CLC): The total impact cost that the trader had on the market. This is the sum of the Cumulative Spread Charge and the Liquidity Premium. The calculation accounts for the cumulative effect of liquidity concessions made throughout the execution horizon and is a measure of the trader’s ‘footprint’ in the name.
Spread Cost: The bid/ask spread as a percentage of the stock price.
B/A SpreadStock Price
Spread Cost =
Measuring Execution Quality in a Fragmented Market (US) – March 30, 2015 \ 7

Adverse ticks Insight into a key driver of trading costs
In addition to accurately calculating the charge for liquidity, a few properly devised tick-based measures fill in the gaps in the liquidity management landscape.
These measures focus on execution management by putting the fill size and price changes experienced during the order’s execution into context. An often overlooked element fundamental to the dynamics of liquidity for a stock is the security’s tick structure. Tick structure relates to the path price changes can take from trade to trade. There are three paths a security can take from the last trade: an uptick, a down tick or a zero tick (the same price as the last execution). The path and distribution of these price moves have a material influence on the cumulative price impact of an order.
Of the many liquidity related measures available on Markit’s Trade EQM trading analytics platform, the ability to compare an order percent of adverse ticks to that of the overall tick structure of the stock during the trade is truly enlightening (AdvTick%). Adverse ticks, defined as an uptick on a buy or a downtick on a sell, on the individual trades that make up a larger order are what accumulate to create price impact. Interestingly, the majority of equity trades occur at the previous trade price (on a zero tick); there is no price impact for the liquidity. For some large capitalization stocks the number of zero ticks on any trading day routinely approaches 90% of all trades. Our research has consistently confirmed that strategies that can avoid adverse ticks routinely deliver the best execution results.
% Order Adverse Ticks: The percent of all fills in the order that were incurred on adverse ticks. An adverse tick is defined as buying on an up-tick or selling on a down-tick.
% Order Adverse Ticks =Total Order Adverse Tick Executions Total Order Executions
% Overall Adverse Ticks =Total Adjusted Market Adverse Tick Executions Total Adjusted Market Executions
Average Trade Size as a % of Market Average Trade Size (ATS%Mkt): The broker’s average trade size for the order as a percentage of the average trade size in the market within the order’s execution horizon.
ATS % Mkt =
Order Size Total Order Executions
Market Average Trade Size
CLC Forecast Error: The error term between the Cumulative Liquidity Charge and the Liquidity Charge Estimate. A positive (negative) value indicates outperformance (underperfomrance) versus the estimate. The broker’s average trade size for the order as a percentage of the average trade size in the market within the order’s execution horizon.
% Overall Adverse Ticks: The percent of all market fills during the order’s execution horizon that were adverse ticks (less the order’s adverse ticks and executions).
Measuring Execution Quality in a Fragmented Market (US) – March 30, 2015 \ 8

Average trade size One aspect of fill quality
Markit’s October 2009 report “The Risks of Flying under the Radar” and our November 2009 report “Beware of the VWAP Trap” both illustrate the risk of cutting large orders up into too many individual trades. Both reports illustrate the signaling risks that can occur when automated strategies ‘over-parcel’ to adhere to the VWAP strategy parameters or when they are realizing low fill rates. Smaller fill sizes increase the number of executions required to complete an order, which increases the probability of incurring price concessions for liquidity. Also, it often lengthens execution timeframes and the risk of information signaling.
The calculation of the Average Trade Size for an order is simply the total shares traded divided by the number of individual executions required to complete it. The same calculation is done for the overall trading activity in the stock for the same execution interval. Comparing these numbers provides insight into the average fill size of the market versus the order over the execution interval.
An average fill size below the market average could indicate that the order strategy or algorithm is over parceling given the average liquidity of the stock, or that it is executing on less liquid venues. We have developed more granular fill rate measures that improve upon this simple metric, but unfortunately they require more extensive data tagging that only a subset of our client base requires of their execution providers. For more information please see “Evaluating Liquidity Capture: The TCAP Ratio”.
Measuring Execution Quality in a Fragmented Market (US) – March 30, 2015 \ 9

CLC Forecast Error An accurately contextualized view of execution quality
After nearly a decade of research, Markit introduced a new forecasting model designed to accurately forecast the cumulative price change required to execute a specific size order over a specific time frame.
The model is a departure from the ubiquitous ‘impact’ models that rely simply on the stock’s historic price volatility to approximate a wide range of possible outcomes. The technique breaks new ground by considering the non-linearity of order size, the changing nature of bid/ask spreads and the dynamic nature of a stock’s ‘tick risk’. A stock’s tick risk is related to the probability of an individual execution occurring on an adverse tick, for example an uptick on a buy order. Since price impact, at its most basic level, is created by the cumulative costs of crossing the spread to obtain liquidity, this model accurately reflects the actual mechanics of trading.
The bottom-up approach of this model provides a uniquely synchronized comparison for each order, rather than relying on a categorized set of actual client trades. This approach allows us to account for the changing nature of the cost drivers on a day to day basis.
Since these accurate forecasts are based on both the most recent market data and the specific trade size and time horizon of an order, they become a perfectly calibrated benchmark for broker evaluations. For more information on the model, please see “Markit’s Impact Cost Model: Unparalleled Accuracy”, “Slaying the Myth of Equity Impact Forecast Models” and “Enhanced Liquidity Risk Estimates for VaR Models”.
We Spread-Adjusted the CLC Forecast Error performance to assure that brokers trading the most difficult orders (large orders in stocks with large relative spreads) are not unduly penalized, further improving the quality of the broker comparisons.
Measuring Execution Quality in a Fragmented Market (US) – March 30, 2015 \ 10

Broker performance analysis Order difficulty categories
There is increasing interest in the impact of advancements in order routing technology on a client’s largest, most important and hardest to trade orders.
To shed some light on this issue we’ve conditioned our execution quality analysis on daily trading volume (DTV) as a proxy for order difficulty. The orderflow we analyze on behalf of clients is dominated by orders below 0.5% of DTV. For that reason we created seven liquidity categories that approximate the distribution of orders across our execution universe.
The analysis is based on Markit client data from October 2013 to December 2014. The execution data represents more than 13 million orders made up of more than 226 million executions totaling more than 54 billion shares. We limited the analysis to 14 firms, the top executing firms in our universe along with a couple of the top performing minority brokers in the sample. We have substituted the Greek alphabet for the broker names as we’ve done in previous reports. These comparisons are constructed to provide insight into the broad performance differences between the top execution providers; we encourage our clients to combine these insights with their own execution quality rankings from Markit’s Trade EQM trading analytics platform.
The first three categories represent the least challenging orders over the period. Table 1 (see Page 12) (0% - 0.005% DTV) is sorted by the Spread-Adjusted CLC metric and represents the truly small orders, providing an overview of orders that are often completed in a few executions. These executions are often smaller than the resting liquidity of the market, which results in lower average trade sizes than the market (ATS % Mkt). Given the consistency in the size of the orders, the average trade size is below the market for all the brokers in the survey. Since these small orders are often executed with expediency, the percent of adverse ticks for the orders tend to be much higher than those of the market over the execution interval (positive Net % Adverse Ticks). Broker Lambda had only 12% adverse ticks higher than the market while the worst experience was 48%. Consistent with the small demand for liquidity and limited number of child executions for this category, most of the brokers’ average CLC’s are generally between 1-3 bps.
The new ‘Spread-Adjusted CLC Forecast Error’ column in Table 1 highlights that some brokers slightly improved on the model’s expectation of price impact. Of course, the nominal values of the estimates for these orders are so small that the impact of the error is negligible. The issue with the Implementation Shortfall (IS) benchmark becomes evident as the magnitude of the ‘Intra-trade Momentum’ translates directly into the realized IS performance. The numbers clearly illustrate the challenge of using the IS benchmark as a metric to study liquidity management given the dominant influence of a stock’s short-term price drift, even for executions with the shortest execution intervals.
The slightly larger order sizes in Table 2 (0.005% - 0.05%) and Table 3 (0.05% - 0.5%) on Page 12 begin to illustrate a wider divergence in broker performance across the categories. In Table 2, the larger order sizes use an increased amount of the market’s resting liquidity as execution sizes for many brokers exceed 100% of the interval average trade size. The adverse tick performance remains consistent with the earlier category as the ‘get it done’ philosophy for the still small orders takes a toll on the relative tick performance. The advantage of the Spread-Adjusted calculations is revealed in Tables 2 and 3 (see Table 3 on Page 12) as the variability in Spread Cost increases across the orders executed by each of the brokers. There is a perceptible increase in the size and variability in the CLC’s across the two categories, with the nominal CLC’s tripling in Table 3. This effect is confirmed by the Spread-Adjusted CLC’s as well. Broker Zeta and Alpha continue to perform impressively in these two categories and the basic relative performance rankings of the brokers remains intact across the three least liquidity-demanding categories of orders.
Measuring Execution Quality in a Fragmented Market (US) – March 30, 2015 \ 11

Measuring Execution Quality in a Fragmented Market (US) – March 30, 2015 \ 12
ORDER DIFFICULTY CATEGORIES

In Table 4 (0.5% - 5%) the category represents a significant change in the liquidity demands of the orders. The Spread Costs rise across most of the brokers, as more small capitalization stocks are included in the data. The variety of execution techniques increases as these orders increasingly benefit from more ‘block’ style of executions. This is borne out in the substantial shift in average trade sizes relative to the market (ATS % Mkt). The execution periods also lengthen due to the liquidity demands and the adverse tick spreads begin to decline for certain brokers as order instructions are of an increasingly participatory nature.
The CLC price impact measures begin to discriminate between those brokers who are consistently delivering the smallest execution ‘footprints’. Broker Zeta had the minimum price impact as measured by the CLC benchmark and Alpha’s impact was in line with the average. Broker Delta and Pi had positive average CLC Forecast Errors, indicating that they consistently delivered lower price impacts than the liquidity circumstances surrounding their orders would suggest.
Most institutional trading desks approach trades that exceed 5% of a day’s trading volume in a stock with increased attention. This increased focus may be the result of the trade being a major shift in portfolio exposure, either a position acquired over a significant period to be liquidated or a new position expected to generate significant excess return. The more visible nature of these orders is usually a call to arms to use the best brokers, order routing technologies and liquidity management strategies.
Table 5 (5% - 10%) illustrates that broker Gamma, Lambda and Delta delivered impressively low average price impacts and succeeded across most of the execution quality metrics in 5% - 10% DTV. Broker Alpha and Pi also did very well relative to the CLC estimates. Though down the list on the price impact performance measures, broker Zeta delivered high quality liquidity management relative to the expected difficulty of the orders in this DTV category.
ORDER DIFFICULTY CATEGORIES
Measuring Execution Quality in a Fragmented Market (US) – March 30, 2015 \ 13
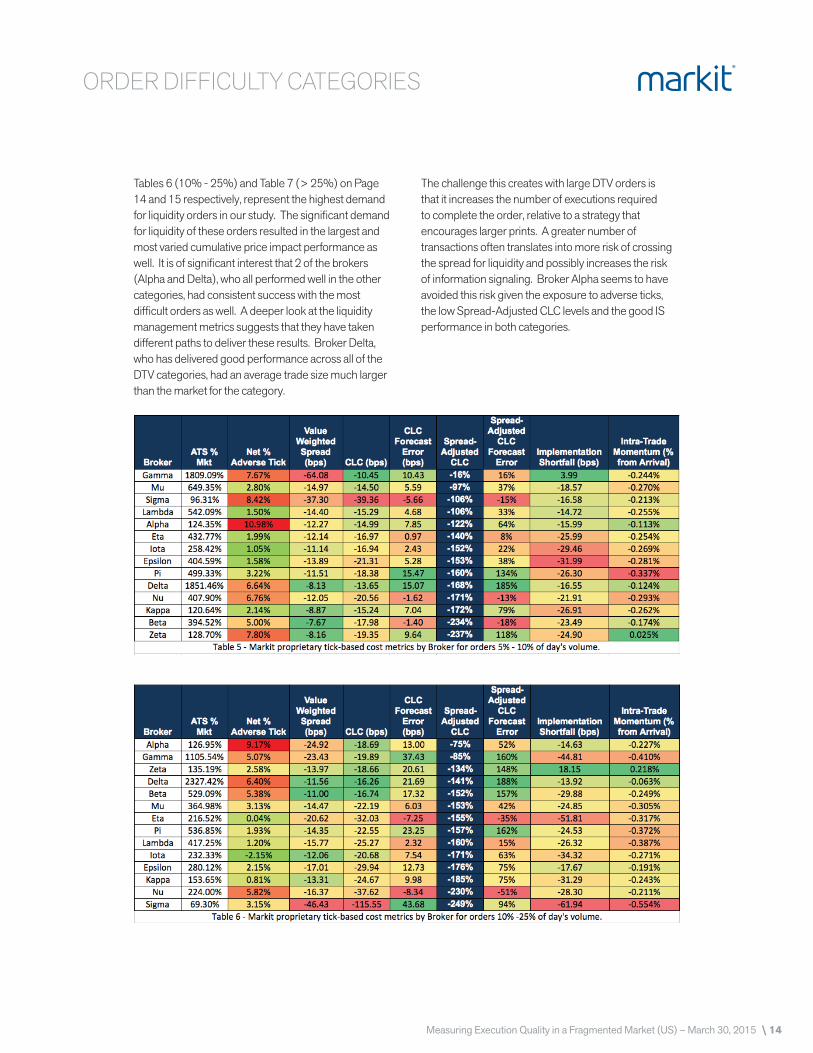
Tables 6 (10% - 25%) and Table 7 (> 25%) on Page 14 and 15 respectively, represent the highest demand for liquidity orders in our study. The significant demand for liquidity of these orders resulted in the largest and most varied cumulative price impact performance as well. It is of significant interest that 2 of the brokers (Alpha and Delta), who all performed well in the other categories, had consistent success with the most difficult orders as well. A deeper look at the liquidity management metrics suggests that they have taken different paths to deliver these results. Broker Delta, who has delivered good performance across all of the DTV categories, had an average trade size much larger than the market for the category.
The challenge this creates with large DTV orders is that it increases the number of executions required to complete the order, relative to a strategy that encourages larger prints. A greater number of transactions often translates into more risk of crossing the spread for liquidity and possibly increases the risk of information signaling. Broker Alpha seems to have avoided this risk given the exposure to adverse ticks, the low Spread-Adjusted CLC levels and the good IS performance in both categories.
ORDER DIFFICULTY CATEGORIES
Measuring Execution Quality in a Fragmented Market (US) – March 30, 2015 \ 14

Broker Mu’s large average trade size in both categories suggests that they engaged in a more traditional block trading strategy. This technique had the benefit of limiting their exposure to adverse ticks and reducing their exposure to the negative momentum encountered during their execution intervals. Out of the top cumulative price impact performers, broker Detla and Gamma delivered the best performance relative to the expected difficulty of the orders they executed.
This consistent ability to deliver better than forecast execution results, without consistently having the lowest cumulative price impacts, suggests that broker Gamma may be receiving a larger share of hardest to trade names in our study. Distinguishing these kinds of circumstances reveals why well designed liquidity management metrics are crucial to appreciating the many dimensions of execution quality.
ORDER DIFFICULTY CATEGORIES
Measuring Execution Quality in a Fragmented Market (US) – March 30, 2015 \ 15

Broker performance analysisSummary graphs
The overall performance, measured by the average Spread-Adjusted cumulative price impact of each broker’s executions across each of the DTV categories, is illustrated in Graph 1. It is obvious that the top executing brokers are tightly grouped in the easiest to manage liquidity categories. As the order difficulty increases the brokers begin to differentiate themselves, as most practitioners would expect. This graph also illustrates the performance consistency of many of the top brokers. Our initial investigations of the top brokers confirm that significant technology, expertise and infrastructure investments have been made by each of the firms.
Broker Alpha’s performance across the largest DTV categories is remarkable. Brokers Gamma makes significant performance gains in the middle ground of the liquidity categories where most institutional activity occurs. Brokers Nu and Sigma drop precipitously to the bottom ranking in the most difficult order category. This suggests that certain trading technologies that succeed for a majority of institutional orders may not be designed for the liquidity management requirements of high DTV orderflow.
Graph 1 - Spread-Adjusted CLC by Broker and Order Liquidity.
0%
-600
-200
-400
-1400
-1200
-800
-1000
Alpha Beta Delta Epsilon Eta Gamma Iota Kappa Lambda Mu Nu Pi Sigma Zeta
0-0.005% 0.005- 0.05% 0.05-5% 5-10% 10-25% 10-25% >25%
Spre
ad-A
djus
ted
CLC
(Bid
/Offe
r Spr
ead
Uni
ts)
% of Day's Volume
Graph 2 - Spread-Adjusted CLC Forecast Error by Broker and Order Liquidity.
1000%
400
200
800
600
-400
-600
-800
0
-200
Alpha Beta Delta Epsilon Eta Gamma Iota Kappa Lambda Mu Nu Pi Sigma Zeta
0-0.005% 0.005- 0.05% 0.05-5% 5-10% 10-25% 10-25% >25%
Spre
ad-A
djus
ted
CLC
For
ecas
t Err
or (B
id/O
ffer S
prea
d U
nits
)
% of Day's Volume
Measuring Execution Quality in a Fragmented Market (US) – March 30, 2015 \ 16

Graph 2 (see Page 16) illustrates the overall results of the brokers with regard to their Spread-Adjusted CLC Forecast Error performance over the analysis period. The value of introducing the price impact forecast error is evident as it validates the performance of some of the top liquidity management brokers (Alpha & Pi). The measure also provides an avenue to address the contextual challenge that haunts all relative comparisons in trading analysis.
Brokers Pi and Alpha consistently delivered high quality execution results relative to the expected difficulty of the orders as the orders crossed the 0.5% DTV threshold into the most difficult DTV categories. These results, especially as they relate to the use of algorithms and other strategy related techniques, would be missed by all other metrics, especially evaluation based on the IS benchmark.
SUMMARY GRAPHS
Measuring Execution Quality in a Fragmented Market (US) – March 30, 2015 \ 17

Broker performance analysisPerformance consistency
Graphs 3 through 4 (see Page 18-19) illustrate the quarterly average results for the top and bottom 3 brokers based on the Spread-Adjusted CLC rankings for the DTV category displayed. The same brokers were re-used for the quarterly time series graphs of the Spread-Adjusted CLC Forecast Errors. The graphs provide an interesting insight into the changing nature of each broker’s performance across the liquidity management metrics over time. Graph 3 (see Page 18) focuses on the 0.5% - 5% DTV order category and confirms that the top broker, Alpha and Gamma, have maintained leadership at the top end of the performance scale over time.
Graph 4 (see Page 19), which details the CLC Forecast Errors, confirms the positive performance characteristics of the top brokers. It also provides an indication that broker Delta may be providing more value than the price impact metrics alone may reveal. This insight was confirmed by our fieldwork as broker Delta has been bringing new technologies on-line with the goal of enhancing their performance with larger institutional orders.
Graphs 5 & 6 reveal the quarterly time series for the aggregation of the top DTV categories, everything above 5% DTV is included in the results. Graph 5 confirms the performance characteristics of broker Alpha. Graph 6 shows the significant value added by broker Delta’s liquidity management strategies relative to the price impacts expected from these most difficult orders. The time series performance of the least successful brokers highlights the performance volatility that often surrounds the execution of the industry’s most complicated orders. It also confirms the necessity to systematically conduct this kind of analysis over time to develop the rich datasets required for accurate interpretation of the results.
Graph 3 - Time Series of Spread-Adjusted CLC for Top 3 & Bottom 3 Performing Brokers in Orders Between 0.5% and 5% of Day’s Volume.
0%
-150
-50
-100
-200
-250
Alpha Beta Delta Gamma Nu Pi
Q42014
Q32014
Q22014
Q12014
Q42013
Spre
ad-A
djus
ted
CLC
(Bid
/Offe
r Spr
ead
Uni
ts)
Measuring Execution Quality in a Fragmented Market (US) – March 30, 2015 \ 18

Graph 4 - Time Series of Spread-Adjusted CLC Forecast Errors for Top 3 & Bottom 3 Performing Brokers in Orders Between 0.5% and 5% of Day’s Volume.
100%
-50
50
0
-250
-200
-100
-150
Alpha Beta Delta Gamma Nu Pi
Q42014
Q32014
Q22014
Q12014
Q42013
Spre
ad-A
djus
ted
CLC
For
ecas
t Err
or (B
id/O
ffer S
prea
d U
nits
)
Graph 5 - Time Series of Spread-Adjusted CLC for Top 3 & Bottom 3 Performing Brokers in Orders Greater than 5% of Day’s Volume.
0%
-600
-200
-400
-1200
-1000
-800
-1400
Alpha Beta Delta Gamma Nu Pi
Q42014
Q32014
Q22014
Q12014
Q42013
-1600Spre
ad-A
djus
ted
CLC
(Bid
/Offe
r Spr
ead
Uni
ts)
Graph 6 - Time Series of Spread-Adjusted CLC Forecast Error for Top 3 & Bottom 3 Performing Brokers in Orders Greater than 5% of Day’s Volume.
800%
500
700
600
200
300
400
100
Alpha Beta Delta Gamma Nu Pi
Q42014
Q32014
Q22014
Q12014
Q42013
0-100
Spre
ad-A
djus
ted
CLC
For
ecas
t Err
or (B
id/O
ffer S
prea
d U
nits
)
PERFORMANCE CONSISTENCY
Measuring Execution Quality in a Fragmented Market (US) – March 30, 2015 \ 19

Conclusion
The significant investments in trading technology made by the top equity execution providers should translate into improved execution quality for institutional equity orders.
As brokers compete for the orderflow that will provide a return on their investment, they spend great effort to describe their innovations but rarely are they in the position to share definitive results. Our investigation into execution quality is designed to assist in making those comparisons; comparisons that are instrumental in assuring that the industry’s increasingly engineered solutions are achieving the desired results. This study confirms that a subset of brokers are consistently delivering high quality executions. We also found that those successes transcend the most liquid orders and extend to the most challenging equity orders, those orders from 5% to 25% of a day’s trading volume.
The metrics introduced in this report are specifically designed to improve the evaluation of liquidity management. The measures focus on understanding an execution provider’s ability to minimize the cumulative price impact of acquiring the liquidity required to complete an order. Our research confirms that success in limiting these direct costs also reduces exposure to information signaling and unnecessarily long execution intervals. This study also illustrates the significant compromise of relying solely on traditional benchmarks like Implementation Shortfall (IS) to evaluate broker execution quality, especially the ability to manage high percent of DTV orders.
The analysis confirmed that 3 brokers out of 14 in the study are delivering consistently high quality execution results across many of the DTV categories. Two in particular, broker Alpha and Delta are accomplishing this success in materially different ways. Brokers Pi has performance that suggests they have superior algorithmic decision schemes that force liquidity charges to the most benign part of the execution horizon, the end.
We maintain that these comparisons are constructed to provide insight into the broad performance differences between the top execution providers; we encourage our clients to work with our analyst team to combine these insights with their own execution quality rankings from Markit’s Trade EQM trading analytics platform.
03/30/15
More information
For more information on the products and services from Markit, please contact us at [email protected] or call one of our sales offices:
London +44 20 7260 2000
New York +1 212 931 4900
Amsterdam +31 20 50 25 800
Boulder +1 303 417 9999
Dallas +1 972 560 4420
Frankfurt +49 69 299 868 100
Hong Kong +852 3478 3948
Tokyo +81 3 6402 0130
Toronto +1 416 777 4485
Singapore +65 6922 4200
Sydney +61 2 8076 1100
markit.com
® Markit makes no warranty, expressed or implied, as to accuracy, completeness or timeliness, or as to the results to be obtained by recipients of the products and services described herein, and shall not in any way be liable for any inaccuracies, errors or omissions herein. Copyright © 2015, Markit Group Limited and Leading Risk. All rights reserved. Any unauthorised use, disclosure, reproduction or dissemination, in full or in part, in any media or by any means, without the prior written permission of Markit Group Limited is strictly prohibited.
Related Documents