ARTICLES Mitotic cell-cycle progression is regulated by CPEB1 and CPEB4-dependent translational control Isabel Novoa 1,3,4 , Javier Gallego 1,2 , Pedro G. Ferreira 1 and Raul Mendez 1,4 Meiotic and early-embryonic cell divisions in vertebrates take place in the absence of transcription and rely on the translational regulation of stored maternal messenger RNAs. Most of these mRNAs are regulated by the cytoplasmic-polyadenylation-element- binding protein (CPEB), which mediates translational activation and repression through cytoplasmic changes in their poly(A) tail length. It was unknown whether translational regulation by cytoplasmic polyadenylation and CPEB can also regulate mRNAs at specific points of mitotic cell-cycle divisions. Here we show that CPEB-mediated post-transcriptional regulation by phase-specific changes in poly(A) tail length is required for cell proliferation and specifically for entry into M phase in mitotically dividing cells. This translational control is mediated by two members of the CPEB family of proteins, CPEB1 and CPEB4. We conclude that regulation of poly(A) tail length is not only required to compensate for the lack of transcription in specialized cell divisions but also acts as a general mechanism to control mitosis. Cytoplasmic elongation and shortening of the poly(A) tail regulate the translation of specific mRNAs in germ cells, fibroblasts and neurons, driving meiotic progression and senescence and modulating neuronal synaptic plasticity 1–4 . The hallmark of these mRNAs is the cytoplasmic polyadenylation element (CPE), which resides in their 3´ untranslated regions (UTRs) and serves as the binding site for CPE-binding protein (CPEB1) 5 . In Xenopus oocytes and early-stage embryos, CPEB1 is a dual-function protein. In unstimulated conditions, CPEB1 maintains the mRNA in a repressed state by blocking the accessibility of the cap to the translation initiation machinery through the recruitment of eIF4E- binding proteins such as maskin and 4E-T and by shortening the poly(A) tail through the recruitment of the deadenylase PARN 6–8 . In response to developmental cues and stimulation by Aurora A kinase, CPEB1 dissoci- ates from the repression complex and recruits a polyadenylation complex consisting of cleavage and polyadenylation specificity factor (CPSF), the cytoplasmic poly(A) polymerase GLD2 and symplekin to elongate the poly(A) tail and activate translation 9–12 . In early mitotic cell divisions in Xenopus embryos, CPEB1 promotes both polyadenylation-induced trans- lation of mRNA encoding cyclin B1 in M phase (embryonic mitosis) and maskin-mediated translational repression in S phase (DNA synthesis) 13,14 . However, these early embryonic divisions consist entirely of alternating S and M phases without intervening G1 and G2. They take place in the absence of transcription, without cell growth or activation of cell-cycle checkpoints. Although these results indicate that CPEB1 is important for embryonic cell divisions, there was no direct evidence that cytoplasmic polyadenylation and CPEB1 function in non-embryonic mitosis. In in vitro assays, mRNA encoding Xenopus cyclin B1 can be polyadenylated by extracts from nocodazole-arrested MCF7 cells (that is, containing both the nuclear and the cytoplasmic polyadenylation machinery) in a CPE-dependent manner 13 . Analysis of the mRNA poly(A) tail lengths in asynchronous NIH3T3 and yeast cells indicates that asynchronous cells contain mRNAs with poly(A) tails with a broad range of lengths and, at least in yeast, it has been suggested deadenylation may have a funtion during the cell cycle 15,16 . However, yeast lack CPEB-like proteins and there is no evidence of cytoplasmic polyadenylation in this system 17 . It was therefore unclear whether endogenous mRNAs are deadenylated and readenylated during non-embryonic mitosis. If this was occurring, it was also uncertain as to which mRNAs would be targeted, and whether cytoplasmic polyadenylation is integral to the control of mitotic cell-cycle progression. Here we show that both CPEB1 and CPEB4 regulate phase- specific changes in the poly(A) tail length of hundreds of mRNAs during the mitotic cell cycle and that this mechanism of gene expression regula- tion drives entry into M-phase and cell proliferation. RESULTS Phase-specific mRNA poly(A) tail regulation during mitosis To address whether subsets of mRNAs were specifically polyadenylated and deadenylated in a phase-specific manner during mitosis, we per- formed genome-wide screening based on the differential purifica- tion of mRNAs according to their poly(A) tail length. HeLa cells were 1 Gene Regulation Program, Centre for Genomic Regulation (CRG), C/ Dr Aiguader 88, 08003 Barcelona, Spain. 2 Present address: Institut d’investigacions Biomèdiques August Pi i Sunyer (IDIBAPS), Hospital Clínic de Barcelona, C/Villarroel no. 170, 08036 Barcelona, Spain. 3 Present address: Institut Recenca Vall d’Hebron, psg. Vall d’Hebron no. 119–129, 08035 Barcelona, Spain. 4 Correspondence should be addressed to R.M. or I.N. (e-mail: [email protected]; [email protected]) Received 15 December 2009; accepted 15 March 2010; published online 4 April 2010; DOI:10.1038/ncb2046 NATURE CELL BIOLOGY ADVANCE ONLINE PUBLICATION 1 © 2010 Macmillan Publishers Limited. All rights reserved.

Welcome message from author
This document is posted to help you gain knowledge. Please leave a comment to let me know what you think about it! Share it to your friends and learn new things together.
Transcript

A RT I C L E S
Mitotic cell-cycle progression is regulated by CPEB1 and CPEB4-dependent translational controlIsabel Novoa1,3,4, Javier Gallego1,2, Pedro G. Ferreira1 and Raul Mendez1,4
Meiotic and early-embryonic cell divisions in vertebrates take place in the absence of transcription and rely on the translational regulation of stored maternal messenger RNAs. Most of these mRNAs are regulated by the cytoplasmic-polyadenylation-element-binding protein (CPEB), which mediates translational activation and repression through cytoplasmic changes in their poly(A) tail length. It was unknown whether translational regulation by cytoplasmic polyadenylation and CPEB can also regulate mRNAs at specific points of mitotic cell-cycle divisions. Here we show that CPEB-mediated post-transcriptional regulation by phase-specific changes in poly(A) tail length is required for cell proliferation and specifically for entry into M phase in mitotically dividing cells. This translational control is mediated by two members of the CPEB family of proteins, CPEB1 and CPEB4. We conclude that regulation of poly(A) tail length is not only required to compensate for the lack of transcription in specialized cell divisions but also acts as a general mechanism to control mitosis.
Cytoplasmic elongation and shortening of the poly(A) tail regulate the translation of specific mRNAs in germ cells, fibroblasts and neurons, driving meiotic progression and senescence and modulating neuronal synaptic plasticity1–4. The hallmark of these mRNAs is the cytoplasmic polyadenylation element (CPE), which resides in their 3´ untranslated regions (UTRs) and serves as the binding site for CPE-binding protein (CPEB1)5. In Xenopus oocytes and early-stage embryos, CPEB1 is a dual-function protein. In unstimulated conditions, CPEB1 maintains the mRNA in a repressed state by blocking the accessibility of the cap to the translation initiation machinery through the recruitment of eIF4E-binding proteins such as maskin and 4E-T and by shortening the poly(A) tail through the recruitment of the deadenylase PARN6–8. In response to developmental cues and stimulation by Aurora A kinase, CPEB1 dissoci-ates from the repression complex and recruits a polyadenylation complex consisting of cleavage and polyadenylation specificity factor (CPSF), the cytoplasmic poly(A) polymerase GLD2 and symplekin to elongate the poly(A) tail and activate translation9–12. In early mitotic cell divisions in Xenopus embryos, CPEB1 promotes both polyadenylation-induced trans-lation of mRNA encoding cyclin B1 in M phase (embryonic mitosis) and maskin-mediated translational repression in S phase (DNA synthesis)13,14. However, these early embryonic divisions consist entirely of alternating S and M phases without intervening G1 and G2. They take place in the absence of transcription, without cell growth or activation of cell-cycle checkpoints. Although these results indicate that CPEB1 is important for embryonic cell divisions, there was no direct evidence that cytoplasmic
polyadenylation and CPEB1 function in non-embryonic mitosis. In in vitro assays, mRNA encoding Xenopus cyclin B1 can be polyadenylated by extracts from nocodazole-arrested MCF7 cells (that is, containing both the nuclear and the cytoplasmic polyadenylation machinery) in a CPE-dependent manner13. Analysis of the mRNA poly(A) tail lengths in asynchronous NIH3T3 and yeast cells indicates that asynchronous cells contain mRNAs with poly(A) tails with a broad range of lengths and, at least in yeast, it has been suggested deadenylation may have a funtion during the cell cycle15,16. However, yeast lack CPEB-like proteins and there is no evidence of cytoplasmic polyadenylation in this system17. It was therefore unclear whether endogenous mRNAs are deadenylated and readenylated during non-embryonic mitosis. If this was occurring, it was also uncertain as to which mRNAs would be targeted, and whether cytoplasmic polyadenylation is integral to the control of mitotic cell-cycle progression. Here we show that both CPEB1 and CPEB4 regulate phase-specific changes in the poly(A) tail length of hundreds of mRNAs during the mitotic cell cycle and that this mechanism of gene expression regula-tion drives entry into M-phase and cell proliferation.
REsulTsPhase-specific mRNA poly(A) tail regulation during mitosisTo address whether subsets of mRNAs were specifically polyadenylated and deadenylated in a phase-specific manner during mitosis, we per-formed genome-wide screening based on the differential purifica-tion of mRNAs according to their poly(A) tail length. HeLa cells were
1Gene Regulation Program, Centre for Genomic Regulation (CRG), C/ Dr Aiguader 88, 08003 Barcelona, Spain. 2Present address: Institut d’investigacions Biomèdiques August Pi i Sunyer (IDIBAPS), Hospital Clínic de Barcelona, C/Villarroel no. 170, 08036 Barcelona, Spain. 3Present address: Institut Recenca Vall d’Hebron, psg. Vall d’Hebron no. 119–129, 08035 Barcelona, Spain. 4Correspondence should be addressed to R.M. or I.N. (e-mail: [email protected]; [email protected])
Received 15 December 2009; accepted 15 March 2010; published online 4 April 2010; DOI:10.1038/ncb2046
nature cell biology advance online publication 1
© 2010 Macmillan Publishers Limited. All rights reserved.
A RT I C L E S
synchronized with a double thymidine blockade (DTB) and samples were taken at 2 or 8 h after release, when cells were, respectively, at the S phase or formed a mixed population of cells in G2 and M phases with a DNA content of 4N (hereafter referred as G2/M phases). Total RNA was extracted from these samples and subjected to two parallel procedures of RNA purification (Fig. 1a). One procedure included the isolation of mRNAs with short poly(A) tails by poly(U)-chromatogra-phy18 followed by elution at low temperature (Fig. 1b). The rationale of this selection was that only ‘stored’ mRNAs, which could be reactivated by cytoplasmic polyadenylation in later mitotic phases, would be pro-tected from degradation in their short poly(A) tail forms. The other procedure consisted of oligo(dT) chromatography to isolate mRNAs independently of their poly(A) tail length (Fig. 1c). The reference and test RNA samples were labelled and hybridized to whole-genome gene expression microarrays. Comparison of the total mRNA levels, normal-ized by poly(U)-isolated fractions, revealed mRNA specific changes on
the poly(A) tail length between G2/M and S phases (differential polya-denylation), whereas comparison of the oligo(dT)-isolated fractions revealed changes in mRNA levels as the result of the equilibrium between transcription and degradation (gene expression). Graphical representa-tion of microarray data of differential polyadenylation (Fig. 1d, x axis) versus gene expression (y axis) exposed a group of 222 mRNAs with longer poly(A) tails in G2/M and shorter tails in S phase (Fig. 1d, blue dots, Supplementary Information, Table S1), and a group of 349 mRNAs with longer poly(A) tails in S phase and shorter tails in G2/M (Fig. 1d, yellow dots; Supplementary Information, Table S2). This result indicated that there are hundreds of mRNAs subjected to regulation by changes in their poly(A) tail length during the mitotic cell cycle, in a phase-spe-cific manner. These mRNAs lose their long poly(A) tails acquired in the nucleus and escape mRNA degradation, similarly to maternal mRNAs, to be reactivated in later cell-cycle phases. The number of mRNAs dif-ferentially polyadenylated during the cell cycle is of the same order of
A130
A0
A450
190
242
320
a
0 4 8 10 12 14 16 18 20 22 24
Cdc20
f
bp 0 4 8 10 12 14 16 18 20 22 24 bp
190242Deadenylated320
404489501692
900
Polyadeadenylated
Hours after DTB Hours after DTB
SG2/M
G1S
SG2/M
G1S
CDKN3
GAPDH
bp
320
A50
A0
–3.0
–2.0
-1.0
1.0
2.0
3.0
–2.0 –1.5 –1.0 –0.5 0.0 0.5 1.0 1.5 2.0
d
Differential Polyadenylation G2/M vs S
Gen
e ex
pre
ssio
n G
2/M
ver
sus
S
–1.50
–1.00
–0.50
0.00
0.50
1.00
1.50
CDC20MTA1CDCA8PWP1
UHRF2FKBP10PCNADEGS1
EGR1PCNXNOTCH2WIPI49
Log 2
ratio
of o
ligo(
dT)
/pol
y(U
)-p
urifi
ed m
RN
As
G2/
M v
ersu
s S
1.37
1.35
1.15
1.11
1.12
–1.0
6–1
.20
–1.4
4–1
.50
–1.4
9–2
.45
1.38
e
RNA, 7 As
RNA, 20 As
RNA, 73 As
Actin mRNA
25 35 45 55 Elution T (ºC)
b
RNA, 20 As
RNA, 73 As
Actin mRNA
I E
100% 28
%10
0% 24%
100% 24
%
I E
I E
c
Reference Test
Tª elutionPoly(A) < 30 Poly(A) > 9
Geneexpression
Differentialpolyadenylation
Total RNA Total RNA
Olig
o(d
T)
Pol
y(U
)
Figure 1 Genome-wide analysis of poly(A) tail length regulation of mRNAs during the mitotic cell cycle. (a) Screening scheme to identify mRNAs differentially polyadenylated between G2/M versus S phases. mRNAs with a short poly(A) tail were purified by poly(U) chromatography (reference), and oligo(dT) chromatography was used to select mRNAs independently of their poly(A) tail length (test). Differential polyadenylation between G2/M and S was measured by hybridizing the test and reference mRNAs to microarrays. Gene expression differences were measured by hybridizing only the oligo(dT) fraction. (b) Purification of RNAs by poly(U) chromatography. Total RNA and in vitro synthesized RNAs with defined poly(A) tail lengths of 7, 20 and 73 As were mixed and bound to poly(U)-Sepharose and eluted stepwise at different temperatures (T). RNAs eluted at each temperature were analysed by northern blotting and hybridization to specific probes for each synthetic RNA and for mRNA encoding actin. A temperature of 35 °C was chosen for the elution of mRNAs with a short poly(A) tail. (c) Purification of RNAs by oligo(dT) chromatography. RNAs (as in b) were bound to oligo(dT) columns and eluted as indicated by the manufacturer (I, input; E, eluate). The
percentages of eluted RNAs versus input are indicated. (d) Graph of the microarray data of differential polyadenylation versus gene expression at G2/M versus S. Each dot represents the data for each gene of the array: grey dots represent genes with fold change in polyadenylation status of between 1.3 and −1.3, blue dots indicate genes with a fold change of 1.3 or more (222 genes), and yellow dots indicate genes with a fold change of −1.3 or less (349 genes). (e) Validation of the microarray data of mRNAs differentially polyadenylated between S phase and G2/M phases. mRNAs differentially polyadenylated were validated by qRT–PCR of the mRNAs purified by oligo(dT) chromatography and poly(U) chromatography. The graph shows the log2 of the ratio of oligo(dT)-purified to poly(U)-purified mRNAs of G2/M versus S phases, and the corresponding fold change is indicated for each bar. Validated mRNAs had a value above or below the 1.3 and −1.3 thresholds (pink lines). (f) Poly(A) tail assay of Cdc20, CDKN3 and GAPDH mRNAs during the mitotic cell cycle. The corresponding phases of the cell cycle are indicated with arrows. bp, base pairs. Uncropped images of blots are shown in Supplementary Information, Fig. S7.
2 nature cell biology advance online publication
© 2010 Macmillan Publishers Limited. All rights reserved.
A RT I C L E S
magnitude (one-third) as the genes showing changes at the mRNA level (Supplementary Information, Fig. S1a); 36.77% of the genes differentially polyadenylated also showed changes in transcript levels, but only 12.7% of the genes regulated at the level of expression were also differentially polyadenylated. The plot combining differential polyadenylation and gene expression (Fig. 1d) shows no direct correlation between mRNA levels and polyadenylation, with a round distribution equally representa-tive of all four possible combinations (that is, more polyadenylated and less expression, less polyadenylated and more expression). Moreover, many of these differentially polyadenylated mRNAs encode proteins related to cell death, the cell cycle and cellular growth and prolifera-tion (Supplementary Information, Fig. S1b) and have previously been identified as essential genes for the cell cycle, for proliferation and for survival19,20 (Supplementary Information, Fig. S1c).
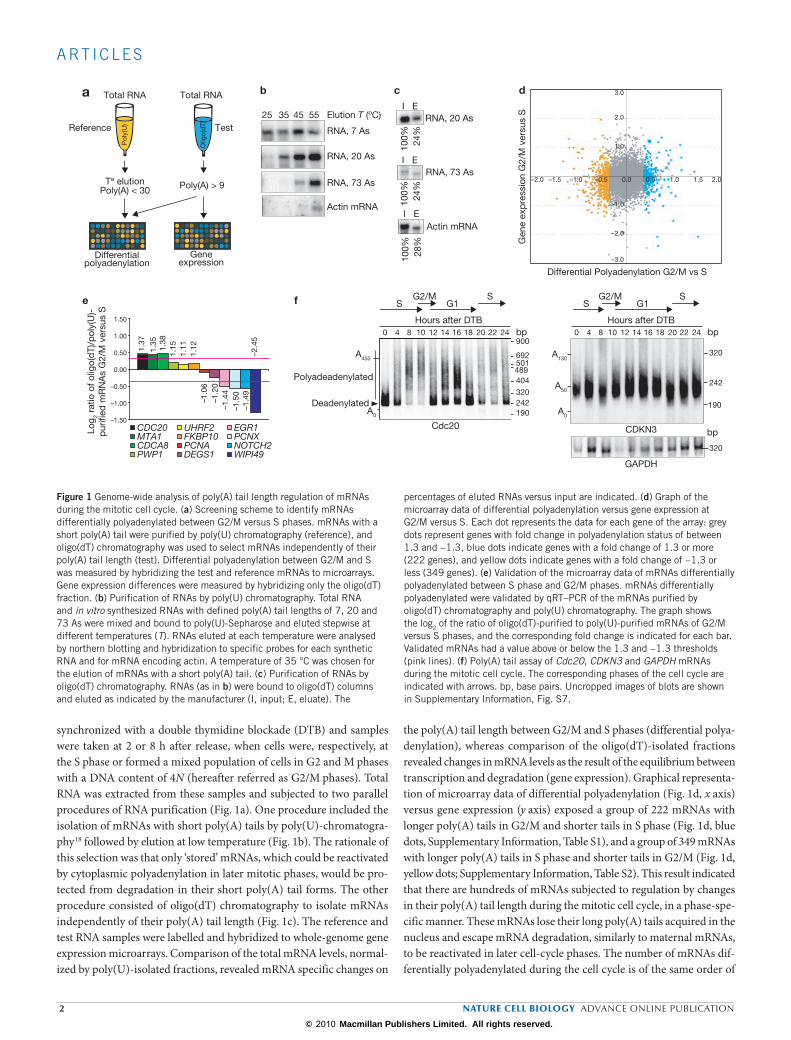
To confirm the microarray results we first validated the differential dis-tribution of 12 random mRNAs in the poly(U)-isolated versus oligo(dT)-isolated fractions measured by quantitative real-time (qRT) PCR (Fig. 1e). We then directly measured, in a time-course comprising the entire cell cycle (Supplementary Information, Fig. S2a), the poly(A) tail length of ten mRNAs identified in the microarray (Fig. 1f; Supplementary Information, Fig. S3). The mRNA encoding the cell-cycle regulator Cdc20 (ref. 21) showed a longer poly(A) tail at the S–G2/M transition (4–10 h after DTB), and a shorter one at the beginning of S phase (0 h after DTB). The mRNA encoding CDKN3, another key regulator of the cell cycle22, showed a longer poly(A) tail at G1 (12–18 h after DTB) and a shorter one at S phase (4–8 h after DTB). Glyceraldehyde-3-phosphate dehydro-genase (GAPDH) served as a negative control (Fig. 1f). Similar results were obtained for CDC45L, TRIO, CCNE1, ISG20, PNRC2, GDF15, ANKRD2 and FADD, with cell-cycle changes in poly(A) tail length, and in some cases changes in transcript levels, reflecting the microarray results (Supplementary Information, Fig. S3). Thus, the phase-specific changes in poly(A) tail length observed in the genome-wide analysis can be con-firmed by monitoring individual mRNAs through the cell cycle. The overall validation rate by both approaches was 76.19% (Supplementary Information, Fig. S1d). To test whether cell-cycle changes in polyadenyla-tion were reflected in changes in translation efficiency we next analysed the distribution of mRNAs encoding Cdc20, CDKN3, CCNE1, PNRC2 and TRIO into light or heavy polysomes for each pool of cells in S or G2/M phases. In agreement with the changes in poly(A) tail length, Cdc20 mRNA was present in heavier polysomes in G2/M phases than in S phase (Fig. 2a) and this resulted in accumulation of the protein in G2/M phases (Fig. 2b). The polysomal profile of CDKN3, CCNE1, PNRC2 and TRIO mRNAs also showed a correlation of translation efficiency and poly(A) tail-length modification with higher translation in S phase (Fig. 2a). Also consistent with the phase-specific changes in polyadenylation are the reported protein level changes during the cell-cycle progression for KIF20A, CDH1 and CCNE1 (refs 23–25). Thus, cell-cycle changes in polyadenylation were reflected at the protein product levels.
Both CPEB1 and CPEB4 mediate cytoplasmic polyadenylationWe next examined whether these changes in poly(A) tail length were mediated by members of the CPEB family of proteins. Four members of the CPEB family (CPEB1–4) have been identified in vertebrates, with partly overlapping patterns of expression26. CPEB1 regulates the poly(A) tail length of CPE-containing mRNAs and their translation efficiency in oocytes, fibroblasts and neurons and during early embryonic divisions,
whereas CPEB3 has recently been identified as a translational repres-sor in neurons that neither mediates cytoplasmic polyadenylation nor recruits CPSF100 (ref. 27). The function of CPEB2 and CPEB4 in polya-denylation and translation has not been defined. First we determined the expression of the four members of the CPEB family in HeLa cells. CPEB4 and CPEB1 mRNAs were the most abundantly expressed, whereas CPEB3 mRNA was undetected and CPEB2 mRNA was expressed at very low levels (Fig. 3a). To address whether the expressed CPEBs were able to mediate translational activation by cytoplasmic polyadenyla-tion, they were cloned and fused to MS2-binding protein. These fusion proteins, in addition to green fluorescent protein (GFP)-tagged MS2 as negative control and MS2–CPEB from Xenopus (MS2–CPEB(X)) as positive control, were expressed in Xenopus oocytes microinjected with a luciferase reporter mRNA bearing MS2-binding sites (Fig. 3b). In response to progesterone, luciferase activity was stimulated when CPEB(X), CPEB1 and CPEB4 fusion proteins, but not CPEB2, were expressed. This translational stimulation was accompanied by cytoplas-mic polyadenylation of the reporter RNA (Fig. 3c). Further characteriza-tion revealed that CPEB4 was able to interact with CPSF as reported for CPEB1 (Fig. 3d)10. Taken together, these data indicate that of the three CPEBs expressed in HeLa cells, CPEB1 and CPEB4, but not CPEB2, were
02468
101214161820
02468
101214161820
0
5
10
15
20
25
30
35
1 2 3 4 5 6 7 8 9 10 11121314 15 161 2 3 4 5 6 7 8 9 10 11121314 15 16
0
2
4
6
8
10
12
14
16
0
2
4
6
8
10
12
14
16
Cdc20 mRNA CDKN3 mRNA
CCNE1 mRNA PNRC2 mRNA
TRIO mRNA
Fraction number Fraction number
1 2 3 4 5 6 7 8 9 10 11121314 15 161 2 3 4 5 6 7 8 9 10
10 2 4 6 8 10
11121314 15 16
1 2 3 4 5 6 7 8 9 10 11121314 15 16
Fraction number
Fraction number
Fraction number
Per
cent
age
of t
otal
mR
NA
sig
nal
Per
cent
age
of t
otal
mR
NA
sig
nal
Per
cent
age
of t
otal
mR
NA
sig
nal
40S 60/80S Polyribosomes
a
b
Anti-Cdc20Anti-tubulin
50
Hours after DTBMr(K)
Figure 2 Regulation of translation efficiency of mRNAs differentially polyadenylated during the mitotic cell cycle. (a) Sedimentation on sucrose density gradients of Cdc20, CDKN3, CCNE1, PNRC2 and TRIO mRNAs of cells synchronized at S phase and G2/M phases. HeLa cells were synchronized at S phase (red line) and at G2/M phases (black line), and the mRNA distribution through the sucrose density gradient was analysed by qRT–PCR. The fractions in which ribosomal subunits and polyribosomes sedimented are indicated. Cdc20 mRNA peaks at a higher fraction at G2/M, indicative of an increased translation efficiency and in agreement with its longer poly(A) tail length. In addition, CDKN3, CCNE1, PNRC2 and TRIO mRNAs peak at lower fractions at G2/M, correlating with their shorter poly(A) tails at G2/M. (b) Western blot analysis of Cdc20 and tubulin during the mitotic cell cycle. DTB, double thymidine blockade. Uncropped images of blots are shown in Supplementary Information, Fig. S7.
nature cell biology advance online publication 3
© 2010 Macmillan Publishers Limited. All rights reserved.

A RT I C L E S
able to mediate cytoplasmic polyadenylation and translational activation by recruiting CPSF. To gain further insight into the functional relation-ship between CPEB1 and CPEB4 we analysed whether they recognized similar sequences and might thus regulate overlapping mRNA targets. For this purpose we performed gel retardation assays with cyclin B1
3´ UTR, the best-characterized substrate for CPEB1 (ref. 28). Purified His-tagged CPEB1, CPEB2 and CPEB4 proteins were able to bind this 3´ UTR, although CPEB1 had a slightly higher affinity (Fig. 3e; 90% of cyclin B1 probe was shifted with 112 nM CPEB1, 150 nM CPEB4 and more than 300 nM CPEB2). Moreover, these interactions were abolished
100 63
14
83
89
0
20
40
60
80
100
120
b
a
Pol
yad
enyl
ated
Non-adenylated
CPEB1
598
CPEB2 CPEB3 CPEB4
451395
Tran
slat
ion
stim
ulat
ion
(+ p
roge
ster
one)
(per
cent
age
of M
S2–
CP
EB
(X))
MS2
–GFP
Con
trol
Con
trol
Con
trol
Con
trol
MS2
–CPE
B(X
)M
S2–C
PEB
1
MS2
–CPE
B(X
)
MS2
–CPE
B(X
)
MS2
–CPE
B(X
)
MS2
–CPE
B1
MS2
–CPE
B2
MS2
–CPE
B2
MS2
–CPE
B4
MS2
–CPE
B4
Progesterone
MS2
–CPE
B(X
)
Con
trol
MS2
–CPE
B1
MS2
–CPE
B4c
CP
EB
4
CP
EB
1
No
CP
EB
4
CP
EB
1
No
Input Flag IP
d
Flag–CPEB4
Flag–CPEB1
99Anti-Flag
CPSF100117
0 37 75 112 150 224 300 0 37 75 112 150 224 300 nM
CPEB1 CPEB4
Shift
Free probe
e
0 37 75 112 150 224 300 0 37 75 112 150 224 300 nM
CPEB2 MS2–GFP
Shift
Free probe
Shift
Free probe
CP
EB
1
3′ U
TR-B
1
99Anti-MS2
Progesterone
MS2–CPEB2MS2–CPEB1
MS2–CPEB4
P
P
P
Anti-CPEB
9999
P P EndogenousCPEB(X)
bp
0 ×1 ×5 ×10 ×15 ×20 0 ×1 ×5 ×10 ×15 ×20CPEB(X)CPEB4CPEB1
3′ UTR-B1 3′ UTR-B1-CPEs
Shift
Free probe
f g
CPEB4
Unlabelled competitor3′ UTR-B1-CPEs
Unlabelled competitor3′ UTR-B1
3′ UTR-B1
0.1 0.25 0.5 1 0.1 0.25 0.5 1 0.1 0.25 0.5 1 0.1 0.25 0.5 1 RT (µl)
+ +– +– +–
+– +– +–
+– –– +– –––– –+ –– –+–– +– –– +–
+– ++ ++ ++ + ++ ++
+– +– +– +– +– +–
Mr(K)
Mr(K)
Figure 3 CPEB1 and CPEB4 can mediate cytoplasmic polyadenylation and stimulate translation of mRNAs. (a) Semiquantitative PCR for CPEB1–4 from reversed transcribed mRNAs (RT) from HeLa cells. (b) Translation stimulation of a reporter luciferase mRNA containing a 3´ UTR with MS2-binding sites and polyadenylation signal. Oocytes were not microinjected (control) or were microinjected with RNAs encoding MS2–GFP or different MS2–CPEBs hybrids and treated or not with progesterone. The percentage of translation stimulation was normalized to MS2–CPEB(X) (100% stimulation). Results are shown as means and s.d. Expression of MS2 proteins and endogenous CPEB(X) was measured by immunoblotting. (c) Polyadenylation assay of labelled RNA containing MS2-binding sites and polyadenylation signal injected into oocytes previously microinjected with the different MS2-hybrid proteins, and then incubated or not with progesterone. The positions of the non-adenylated and polyadeadenylated RNAs are indicated. (d) Co-immunoprecipitation of CPSF100 with Flag-tagged CPEB1 and CPEB4. The cytoplasmic extracts (input) and the Flag-immunoprecipitated fractions
(Flag-IP) were analysed with anti-Flag- and anti-CPSF100 antibodies. (e) Gel retardation assay with in vitro radiolabelled 3´ UTR of cyclin B1 (Xenopus). The indicated molar concentrations of purified CPEB1, CPEB2, CPEB4 and MS2–GFP were incubated with the labelled RNA, and protein complexes were analysed by native gel electrophoresis and autoradiography. The positions of the free RNA probe (free probe) and the RNA–protein complex (shift) are indicated. (f) Gel retardation assay with in vitro radiolabelled 3´ UTR of cyclin B1 wild type (3´ UTR-B1) or CPE mutated (3´ UTR-B1-CPEs). Purified CPEB1, CPEB4 and CPEB(X) (150 nM each) were incubated with the indicated labelled RNA. (g) Gel retardation assay in the presence of unlabelled competitor, either wild-type or CPE-mutated 3´ UTR cyclin B1 RNA. In vitro radiolabelled 3´ UTR of cyclin B1 was incubated with purified CPEB4 (150 nM), and the protein–RNA complexes formed were incubated with the indicated unlabelled competitor (between 1-fold (×1) and 20-fold (×20) molar concentration). Uncropped images of blots are shown in Supplementary Information, Fig. S7.
4 nature cell biology advance online publication
© 2010 Macmillan Publishers Limited. All rights reserved.

A RT I C L E S
b
a1.2
1.0
0.8
0.60.4
0.2
0.0
c
CPEB4CPEB1
Anti-CPEB1
Con
trol
Rel
ativ
e co
py
num
ber
CP
EB
1 m
RN
A
CPEB1 shRNA versus control shRNA
Differential polyadenylation
54
1.2
1.0
0.8
0.60.4
0.2
0.0Rel
ativ
e co
py
num
ber
CP
EB
4 m
RN
A
Days after Dox addition
Con
trol
CP
EB
1
CP
EB
4
CP
EB
1+4
No
shR
NA
shRNA
*CPEB1
CPEB1 Western blot
Days after Dox addition
CPEB4
IgG
Con
trol
CP
EB
1
CP
EB
4
CP
EB
1+4
No
shR
NA
shRNA
CPEB4 IP
Anti-CPEB4
99
CPEB4 shRNA versus control shRNA
Gen
e ex
pre
ssio
n
Differential polyadenylation
Gen
e ex
pre
ssio
n
–3.0
-2.0
-1.0
1.0
2.0
3.0
–2.0 -1.5 -1.0 -0.5 0.0 0.5 1.0 1.5 2.0
–3.0
-2.0
-1.0
1.0
2.0
3.0
–2.0 -1.5 -1.0 -0.5 0.0 0.5 1.0 1.5 2.0
Log 2
ratio
of o
ligo(
dT)
/ p
oly(
U)-
pur
ified
mR
NA
s C
PE
B4
shR
NA
vers
us c
ontr
ol s
hRN
A
Log 2
ratio
of o
ligo(
dT)
/ p
oly(
U)-
pur
ified
mR
NA
s C
PE
B1
shR
NA
vers
us c
ontr
ol s
hRN
A
–3.3
6
-1.4
1
-1.8
2
-1.6
1
-2.3
8 -1.9
4
–5.5
0
–2.7
3
–1.5
3
–3.0
0
1.24
-1.1
7
–2.2
9
–3.0
7
–1.1
9
–1.1
8
–1.4
2
d
–3.0
–2.5
–2.0
–1.5
–1.0
–0.5
0
0.5
–3.0
–2.5
–2.0
–1.5
–1.0
–0.5
0
0.5
EBAG9CASP6TNFAIP3DCAMKL2CYB561CROTPHF20SPOPFBXL17NFIBZFXPDE4DIPLMO2XPAKIF14FRAG1DVL3
EBAG9CASP6TNFAIP3DCAMKL2CYB561CROTPHF20SPOPFBXL17NFIBZFXPDE4DIPLMO2XPAKIF14FRAG1DVL3
–1.2
9
–1.2
7
–2.1
7
–1.2
8
–1.8
6
–1.2
5–5
.50
–1.4
3
1.01
–2.4
0
1.22
1.16
–2.1
6
–1.7
7
1.03–1
.21
–1.1
4
e
Mr(K)
Mr(K)
0 2 4 6 8
Wild typeCPEB1 shRNACPEB4 shRNAControl shRNA
Wild typeCPEB1 shRNACPEB4 shRNAControl shRNA
0 1 2 3 4 5 6 7 8
Figure 4 Genome-wide analysis of regulation of poly(A) tail length in CPEB1 and CPEB4 knockdown cells. (a) Relative mRNA levels for CPEB1 and CPEB4 were measured by qRT–PCR of different shRNA-expressing cells. Samples were taken between days 0 and 8 of doxycycline (Dox) addition. (b) CPEB4 immunoprecipitation (IP) followed by western blot against CPEB4, and CPEB1 western blot to measure CPEB4 and CPEB1 protein levels of different shRNA-expressing cells. Cells were treated with doxycycline for 4 days, and cytoplasmic cell extracts were prepared. The anti-CPEB1 antibody recognizes a non-CPEB1 protein (asterisk). (c) Graph of the microarray data of differential polyadenylation versus gene expression of CPEB1 knockdown versus control shRNA-expressing cells (left) and CPEB4 knockdown versus control shRNA-expressing cells (right). Each dot represents the data for each gene of the array: grey dots represent genes with fold change in polyadenylation status of between 1.3 and −1.3, blue dots indicate genes with a fold change of 1.3 or more (204
genes in CPEB1 knockdown; 67 genes in CPEB4 knockdown; 21 genes in common), and yellow dots indicate genes with a fold change of −1.3 or less (120 genes in CPEB1 knockdown; 132 genes in CPEB4 knockdown; 35 genes in common). (d, e) mRNAs differentially polyadenylated were validated by qRT–PCR of the mRNAs purified by oligo(dT) chromatography and poly(U) chromatography. The graph shows the log2 of the ratio of oligo(dT)-purified to poly(U)-purified mRNAs of CPEB1 shRNA versus control shRNA-expressing cells (d) or CPEB4 shRNA versus control shRNA-expressing cells (e), and the corresponding fold change is indicated for each bar. Validated mRNAs had a value above or below the 1.3 and −1.3 thresholds (pink lines). In all, 17 candidates from the CPEB1-regulated mRNAs were analysed, and 14 were validated (82.3% validated). From the 17 CPEB1-regulated candidates, 11 mRNAs were also validated in the CPEB4 shRNA-expressing cells. Uncropped images of blots are shown in Supplementary Information, Fig. S7.
nature cell biology advance online publication 5
© 2010 Macmillan Publishers Limited. All rights reserved.
A RT I C L E S
when CPEs were inactivated by point mutations or competed with non-labelled CPE-containing RNA (Fig. 2f , g). CPE-containing mRNAs can therefore be regulated by both CPEB1 and CPEB4, although they recog-nize these targets with different affinities. A previous report has shown a specific cis element recognized by the RNA-binding domain of CPEB4 but not by CPEB1 (ref. 27). Taken together, these results suggest that CPEB1 and CPEB4 might recognize overlapping but not identical target mRNAs. Although CPEB4 is more similar in its RNA-binding domain to CPEB3, our data indicate that CPEB4 and CPEB1 are functionally related, and CPEB4 can act as translational activator, in contrast with CPEB3, which was shown to be a repressor27.
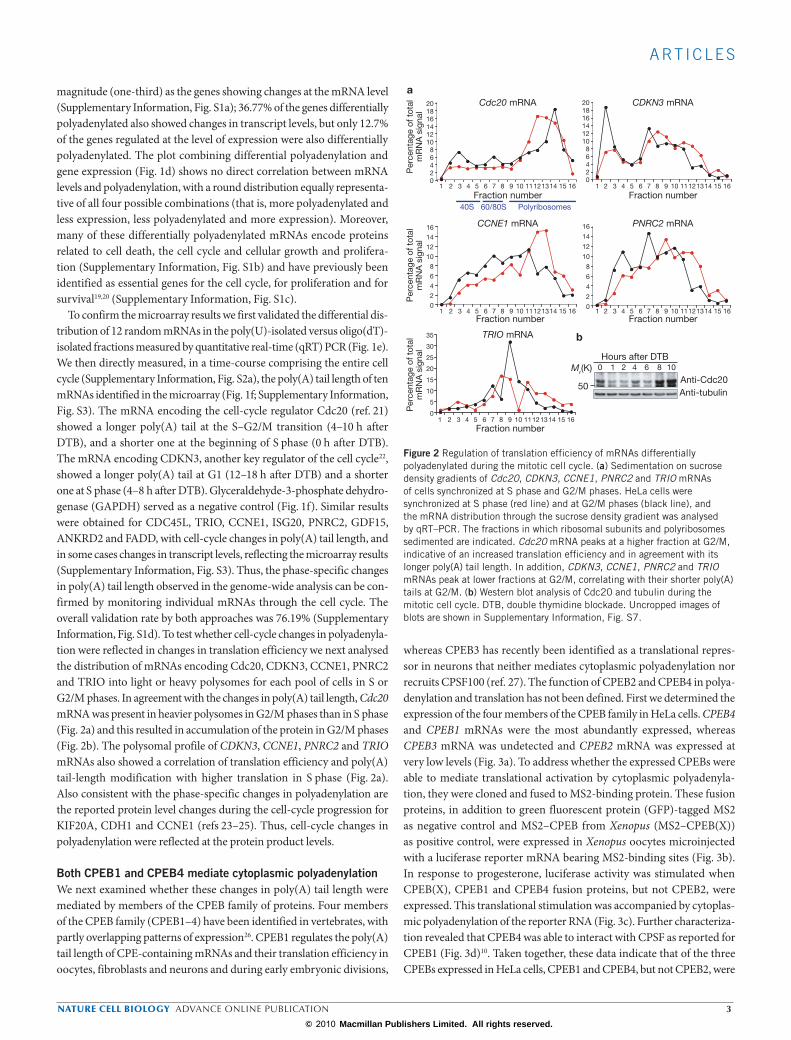
Mitotic poly(A) tail regulation by CPEB1 and CPEB4We next examined whether CPEB1 and/or CPEB4 could regulate polya-denylation changes during mitosis. Knockdown cells for CPEB1 and CPEB4 were obtained by expressing short hairpin RNAs (shRNAs) against these CPEBs with a doxycycline-inducible system29. The levels of CPEB1 and CPEB4 mRNAs and proteins were significantly decreased after 3 days of doxycycline addition (Fig. 4a, b). CPEB1 shRNA also pro-duced a decrease in CPEB4 protein levels, most probably as a result of
the regulation of CPEB4 by CPEB1, as we have observed in Xenopus oocytes (A.I. and R.M., unpublished observations). We then examined the impact of CPEB1 and CPEB4 knockdown on the mRNA polyade-nylation patterns at G2/M, using the same approach as that described in Fig. 1a. Both knockdown cells showed a group of mRNAs (Fig. 4c, yellow dots) with shorter poly(A) tails than in cells expressing control shRNAs, reflecting mRNAs that require CPEB to be polyadenylated at G2/M. We also found a group of genes with longer poly(A) tails in the absence of CPEB activity (Fig. 4c, blue dots), indicating that mRNAs were deade-nylated in a CPEB-dependent manner. In both cases, CPEB1 and CPEB4 regulated mRNA-encoded proteins enriched in cell-cycle-regulated fac-tors (Supplementary Information, Fig. S4). We have therefore identi-fied 324 mRNAs regulated by CPEB1 at G2/M and 199 regulated by CPEB4 (Supplementary Information, Tables S3 and S4). The fact that these populations were partly overlapping (56 genes in common) but still detectable in the single knockdowns is consistent with CPEB1 and CPEB4 having overlapping but not identical functions. Note that mRNAs whose poly(A) tail length may be regulated by either CPEB1 or CPEB4 at other phases of the cell cycle would not have been detected in this screen-ing. For 17 random mRNAs we analysed the differential distribution in
c
85
116
53
53
Mr(K)
b
a
3.5
3.0
2.5
2.0
1.5
1.0
Control shRNA
0 4 10 12 0 4 10 12 0 4 10 12 0 4 10 12
CPEB1 shRNA CPEB4 shRNACPEB1 + CPEB4
shRNA
bp
320
242
Deadenylated
Pol
yad
enyl
ated
Cdc20
Deadenylated320
404
489501
692
900
Mnt mRNA polyadenylation
0.5
0.0
Rat
io o
f olig
o(d
T)/p
oly(
U)-
pur
ified
mR
NA
s
Control shRNA Control shRNA
0 4 10 12 0 4 10 12 0 4 10 12
CPEB1 shRNA CPEB4 shRNACPEB1 + CPEB4
shRNA
Hours after DTB0 4 10 12 0 4 10 12
Anti-Mnt
Anti-Sp1
Anti-Cdc20
Anti-tubulin
A130=
A50=
A0
Hours after DTB
CDKN3
*
ControlshRNA
CPEB1shRNA
CPEB4shRNA
CPEB1+CPEB4shRNA
Figure 5 Mitotic polyadenylation and translation defects in CPEB1 and CPEB4 knockdown cells. (a) Poly(A) tail test for CDKN3 and Cdc20 of samples taken at different time points after DTB of cells expressing the different shRNAs. Asterisk indicates the radioactive signal of the loading dye. (b) Mnt mRNA polyadenylation analysis by quantification of Mnt mRNA of oligo(dT)-purified mRNAs and poly(U)-purified mRNAs of samples taken after 8 h release of DTB of cells expressing the different
shRNAs. The ratio of Mnt mRNA between oligo(dT)-purified and poly(U)-purified mRNAs was calculated for each sample. An increase in this ratio is a reflection of a longer poly(A) tail. Data is the mean from two experiments. (c) Western blot analysis of Cdc20 and Mnt of the different shRNA-expressing cells (as in a). Tubulin and Sp1 served as loading controls for the cytoplasmic and nuclear fractions, respectively. Uncropped images of blots are shown in Supplementary Information, Fig. S7.
6 nature cell biology advance online publication
© 2010 Macmillan Publishers Limited. All rights reserved.

A RT I C L E S
the poly(U)-isolated versus the oligo(dT)-isolated fractions measured by qRT–PCR with a success rate of 82.3% (Fig. 4d, e).
To further address the requirement for CPEB in the changes in poly(A) tail length during the cell cycle, we performed a polyadenylation time course of the previously characterized CDKN3 and Cdc20 mRNAs in the single-CPEB knockdowns and the double CPEB1 + CPEB4 knockdown. The changes in CDKN3 mRNA poly(A) tail length during the cell cycle were partly affected in the single knockdowns and were completely abolished in the double knockdown, in which it displayed a short poly(A) tail at all times tested (Fig. 5a). In contrast, changes in polyadenylation of Cdc20 mRNA during the cell cycle were not affected in either single or double knockdowns (Fig. 5a). We also analysed the polyadenylation of mRNA encoding Mnt, a protein member of the Myc/Max/Mad network of transcriptional factors that regulates cell proliferation, differentiation and transformation30. The microarray data indicated that Mnt mRNA was more polyadenylated as a result of knocking down CPEB1, and this was confirmed for the single knockdowns and the double knockdown (Fig. 5b). This result confirms that some, but not all, of the mRNAs showing cell-cycle-dependent changes in the poly(A) tail require CPEB. Moreover, the fact that the double knock-down had a stronger phenotype indicates that the functions of CPEB1 and CPEB4 are partly redundant. To test whether the changes in polyadenyla-tion observed during the cell cycle and in the knockdowns were reflected in changes in protein levels, we analysed Mnt and found increased Mnt protein expression in the CPEB1 and double CPEB1 + CPEB4 knockdowns (Fig. 5c). As a control, the enhanced expression of Cdc20 protein at G2/M was not affected in either knockdown (Fig. 5c). Thus, knockdown-derived changes in polyadenylation were reflected at the protein product levels. Although many of the mRNAs regulated by CPEB1 and CPEB4 correspond to genes
that have not yet been characterized, several others have been described to regulate cell-cycle functions (CDKN3, Mnt, STXBP2, FANCC, PDE4C, KIF14 and XPA)19,22,30.
CPEB1 and CPEB4 are required for cell proliferation and mitotic entryBecause the downregulation of CPEB1 and CPEB4 produces defects in polyadenylation and gene expression in mitosis, we next examined the consequences of CPEB depletion on cell proliferation and cell-cycle pro-gression. As the shRNA-expressing cells co-expressed the red fluorescent protein (RFP) and GFP markers, whereas the control (wild-type) cells had only the RFP marker, we were able to follow the differential prolif-eration of wild-type and shRNA-expressing cells, mixed in a 1:1 ratio, by fluorescence-activated cell sorting (FACS) analysis (Fig. 6a). We found that, whereas the expression of a control shRNA had no impact on cell proliferation, the CPEB knockdowns showed proliferation defects that were modest for the CPEB4 knockdown, stronger for the CPEB1 knock-down, and stronger still for the double knockdown. This cell proliferation defect was confirmed by analysing the cell doubling time of the different CPEB-depleted cells (Fig. 6b). We then tested whether the slower prolifera-tion originated in a higher rate of cell death, but we found only a modest increase in the cell death marker annexin V in the double CPEB1 + CPEB4 knockdown cells (Fig. 6c). The mitotic index was also examined and found to be unaltered in the different shRNA-expressing cells (Fig. 6d).
We therefore proceeded to analyse whether there were abnormalities in cell-cycle progression that could account for the cell proliferation defects observed for CPEB1, CPEB4 and CPEB1 + CPEB4 knockdown. First, cells released from a single thymidine blockade at G1/S were examined
Cell Doubling Time (hours)
Cel
l dou
blin
g tim
e (h
ours
)
Con
trol
shR
NA
CPE
B1
shR
NA
CPE
B4
shR
NA
CPE
B1+
CPE
B4
shR
NA
23
b
a
0
1
2
3
4
5
Per
cent
age
of t
otal
cel
ls
Con
trol
shR
NA
CPE
B1
shR
NA
CPE
B4
shR
NA
CPE
B1+
CPE
B4
shR
NA
0
10
20
30
40
50
60
70
80c
Per
cent
age
of A
nnex
in
V-p
ositi
ve c
ells
Con
trol
shR
NA
CPE
B1+
CPE
B4
shR
NA
MM
Stre
ated
61.5
18.4
5.9
18.9 19.1
29.12.37 2.50
2.472.30
d
0 4 8 12 16 20 24
Per
cent
age
of c
ells Control shRNA
0
20
40
60
80
100
0
20
40
60
80
100
0 4 8 12 16 20 24
Wild typeWild type Wild type
Wild type
shCPEB1
0
20
40
60
80
100
0 4 8 12 16 20 24
shCPEB4
0
20
40
60
80
100
0 4 8 12 16 20 24
shCPEB1+shCPEB4
Time (days) Time (days) Time (days) Time (days)
0
5
10
15
20
25
30
35
Figure 6 Cells knocked down for both CPEB1 and CPEB4 showed cell proliferation defects. (a) Control cells expressing the doxycycline regulator and the RFP were mixed 1:1 with different shRNA-expressing cells co-expressing the RFP and GFP markers. These co-cultured cells were incubated in the presence of doxycycline for the indicated periods, and the two populations of cells were followed by FACS analysis to monitor cell proliferation. The percentages of wild-type cells versus the different shRNA-expressing cells are indicated. (b) The cell doubling time was calculated
for the different shRNA-expressing cells. (c) Cell death analysis of control shRNA-expressing cells and double CPEB1 + CPEB4 knockdown by staining with annexin V. Cells were exposed to doxycycline for 7 days. As a positive control HeLa cells were treated with methyl methane-sulfonate (MMS) for 24 h. Resulats are shown as mean values from six experiments, error bars indicate s.d. (d) Mitotic index of asynchronous cultures for the different shRNA-expressing cells. Results are shown as the mean value from three experiments, error bars indicate s.d.
nature cell biology advance online publication 7
© 2010 Macmillan Publishers Limited. All rights reserved.
A RT I C L E S
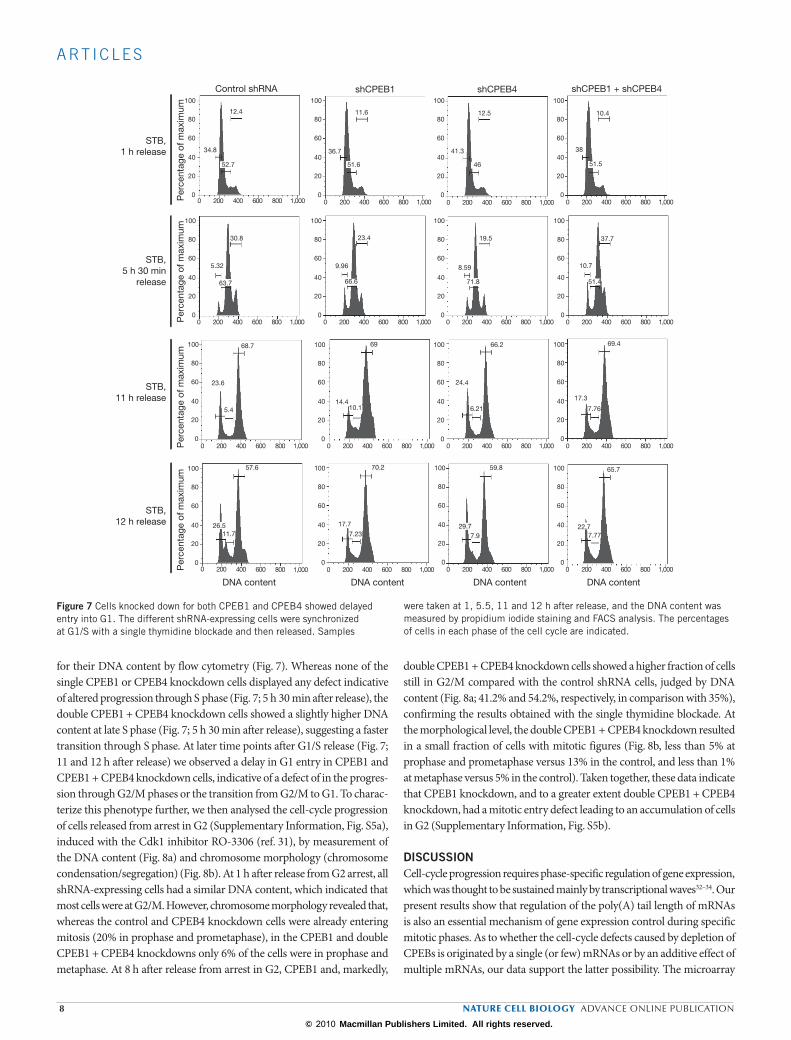
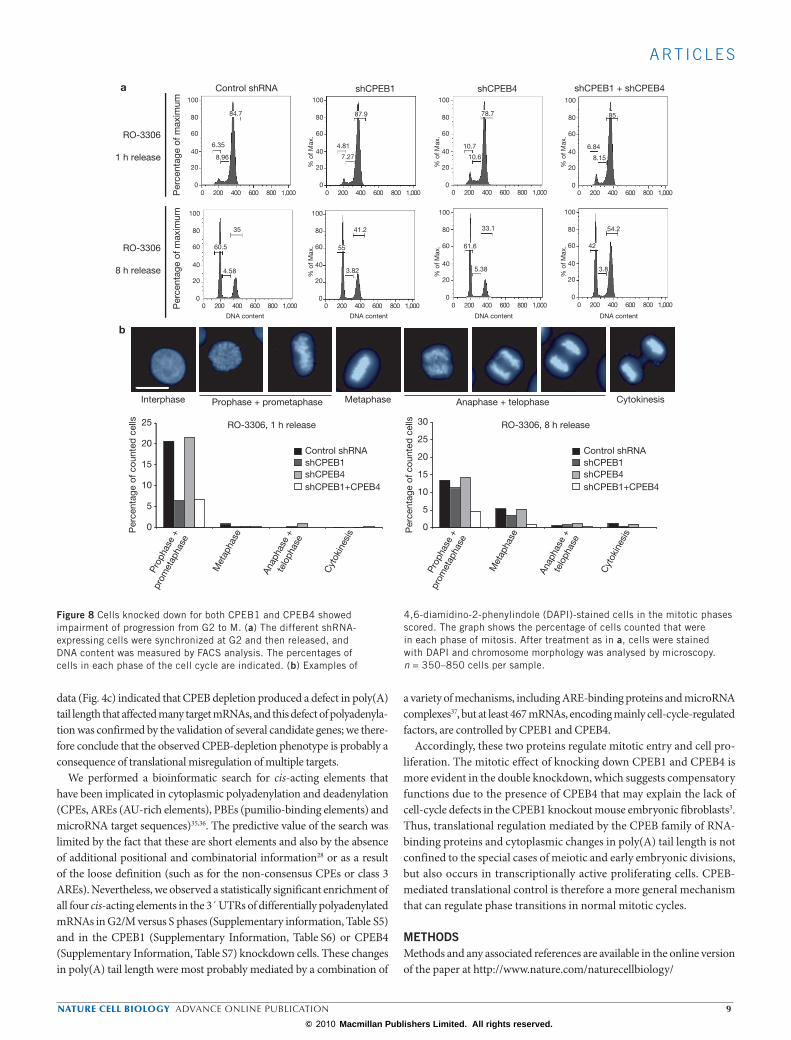
for their DNA content by flow cytometry (Fig. 7). Whereas none of the single CPEB1 or CPEB4 knockdown cells displayed any defect indicative of altered progression through S phase (Fig. 7; 5 h 30 min after release), the double CPEB1 + CPEB4 knockdown cells showed a slightly higher DNA content at late S phase (Fig. 7; 5 h 30 min after release), suggesting a faster transition through S phase. At later time points after G1/S release (Fig. 7; 11 and 12 h after release) we observed a delay in G1 entry in CPEB1 and CPEB1 + CPEB4 knockdown cells, indicative of a defect of in the progres-sion through G2/M phases or the transition from G2/M to G1. To charac-terize this phenotype further, we then analysed the cell-cycle progression of cells released from arrest in G2 (Supplementary Information, Fig. S5a), induced with the Cdk1 inhibitor RO-3306 (ref. 31), by measurement of the DNA content (Fig. 8a) and chromosome morphology (chromosome condensation/segregation) (Fig. 8b). At 1 h after release from G2 arrest, all shRNA-expressing cells had a similar DNA content, which indicated that most cells were at G2/M. However, chromosome morphology revealed that, whereas the control and CPEB4 knockdown cells were already entering mitosis (20% in prophase and prometaphase), in the CPEB1 and double CPEB1 + CPEB4 knockdowns only 6% of the cells were in prophase and metaphase. At 8 h after release from arrest in G2, CPEB1 and, markedly,
double CPEB1 + CPEB4 knockdown cells showed a higher fraction of cells still in G2/M compared with the control shRNA cells, judged by DNA content (Fig. 8a; 41.2% and 54.2%, respectively, in comparison with 35%), confirming the results obtained with the single thymidine blockade. At the morphological level, the double CPEB1 + CPEB4 knockdown resulted in a small fraction of cells with mitotic figures (Fig. 8b, less than 5% at prophase and prometaphase versus 13% in the control, and less than 1% at metaphase versus 5% in the control). Taken together, these data indicate that CPEB1 knockdown, and to a greater extent double CPEB1 + CPEB4 knockdown, had a mitotic entry defect leading to an accumulation of cells in G2 (Supplementary Information, Fig. S5b).
DIsCussIoNCell-cycle progression requires phase-specific regulation of gene expression, which was thought to be sustained mainly by transcriptional waves32–34. Our present results show that regulation of the poly(A) tail length of mRNAs is also an essential mechanism of gene expression control during specific mitotic phases. As to whether the cell-cycle defects caused by depletion of CPEBs is originated by a single (or few) mRNAs or by an additive effect of multiple mRNAs, our data support the latter possibility. The microarray
Per
cent
age
of m
axim
umP
erce
ntag
e of
max
imum
Per
cent
age
of m
axim
umP
erce
ntag
e of
max
imum
STB,1 h release
STB,5 h 30 min
release
STB,11 h release
STB,12 h release
0 200 400 600 800 1,000 0 200 400 600 800 1,000 0 200 400 600 800 1,000 0 200 400 600 800 1,000
0 200 400 600 800 1,000 0 200 400 600 800 1,000 0 200 400 600 800 1,000 0 200 400 600 800 1,000
0 200 400 600 800 1,0000 200 400 600 800 1,0000 200 400 600 800 1,0000 200 400 600 800 1,000
0 200 400 600 800 1,000 0 200 400 600 800 1,000 0 200 400 600 800 1,000 0 200 400 600 800 1,000
100
80
60
40
20
0
100
80
60
40
20
0
100
80
60
40
20
0
100
80
60
40
20
0
100
80
60
40
20
0
100
80
60
40
20
0
100
80
60
40
20
0
100
80
60
40
20
0
100
80
60
40
20
0
100
80
60
40
20
0
100
80
60
40
20
0
100
80
60
40
20
0
100
80
60
40
20
0
100
80
60
40
20
0
100
80
60
40
20
0
100
80
60
40
20
0
12.4
52.7
34.8
11.6
36.7
51.6 46
41.3
12.5
38
10.4
51.5
30.8
5.32
63.7
9.96
23.4
66.6
19.5
8.59
71.8
37.7
10.7
51.4
7.76
17.3
69.4
24.4
66.2
6.21
69
14.410.1
23.6
5.4
68.7
57.6
26.511.7
70.2
17.7
7.2329.7
7.9
59.8
22.77.77
65.7
Control shRNA shCPEB1 shCPEB4 shCPEB1 + shCPEB4
DNA content DNA content DNA content DNA content
Figure 7 Cells knocked down for both CPEB1 and CPEB4 showed delayed entry into G1. The different shRNA-expressing cells were synchronized at G1/S with a single thymidine blockade and then released. Samples
were taken at 1, 5.5, 11 and 12 h after release, and the DNA content was measured by propidium iodide staining and FACS analysis. The percentages of cells in each phase of the cell cycle are indicated.
8 nature cell biology advance online publication
© 2010 Macmillan Publishers Limited. All rights reserved.
A RT I C L E S
data (Fig. 4c) indicated that CPEB depletion produced a defect in poly(A) tail length that affected many target mRNAs, and this defect of polyadenyla-tion was confirmed by the validation of several candidate genes; we there-fore conclude that the observed CPEB-depletion phenotype is probably a consequence of translational misregulation of multiple targets.
We performed a bioinformatic search for cis-acting elements that have been implicated in cytoplasmic polyadenylation and deadenylation (CPEs, AREs (AU-rich elements), PBEs (pumilio-binding elements) and microRNA target sequences)35,36. The predictive value of the search was limited by the fact that these are short elements and also by the absence of additional positional and combinatorial information28 or as a result of the loose definition (such as for the non-consensus CPEs or class 3 AREs). Nevertheless, we observed a statistically significant enrichment of all four cis-acting elements in the 3´ UTRs of differentially polyadenylated mRNAs in G2/M versus S phases (Supplementary information, Table S5) and in the CPEB1 (Supplementary Information, Table S6) or CPEB4 (Supplementary Information, Table S7) knockdown cells. These changes in poly(A) tail length were most probably mediated by a combination of
a variety of mechanisms, including ARE-binding proteins and microRNA complexes37, but at least 467 mRNAs, encoding mainly cell-cycle-regulated factors, are controlled by CPEB1 and CPEB4.
Accordingly, these two proteins regulate mitotic entry and cell pro-liferation. The mitotic effect of knocking down CPEB1 and CPEB4 is more evident in the double knockdown, which suggests compensatory functions due to the presence of CPEB4 that may explain the lack of cell-cycle defects in the CPEB1 knockout mouse embryonic fibroblasts3. Thus, translational regulation mediated by the CPEB family of RNA-binding proteins and cytoplasmic changes in poly(A) tail length is not confined to the special cases of meiotic and early embryonic divisions, but also occurs in transcriptionally active proliferating cells. CPEB-mediated translational control is therefore a more general mechanism that can regulate phase transitions in normal mitotic cycles.
METHoDsMethods and any associated references are available in the online version of the paper at http://www.nature.com/naturecellbiology/
0
5
10
15
20
25
30
0
5
10
15
20
25
a
RO-3306
1 h release
Interphase Prophase + prometaphase Metaphase CytokinesisAnaphase + telophase
Per
cent
age
of c
ount
ed c
ells RO-3306, 1 h release
RO-3306
8 h release
DNA content DNA content DNA content DNA content
b
RO-3306, 8 h release
Control shRNAshCPEB1shCPEB4shCPEB1+CPEB4
Control shRNAshCPEB1shCPEB4shCPEB1+CPEB4
Per
cent
age
of c
ount
ed c
ells
Prop
hase
+
prom
etap
hase
Met
apha
se
Anap
hase
+te
loph
ase
Cyt
okin
esis
Prop
hase
+
prom
etap
hase
Met
apha
se
Anap
hase
+te
loph
ase
Cyt
okin
esis
% o
f Max
.%
of M
ax.
% o
f Max
.%
of M
ax.
% o
f Max
.%
of M
ax.
100
80
60
40
20
0
100
80
60
40
20
0
100
80
60
40
20
0
100
80
60
40
20
0
100
80
60
40
20
0
100
80
60
40
20
0
100
80
60
40
20
0
100
80
60
40
20
00 200 400 600 800 1,000
0 200 400 600 800 1,000 0 200 400 600 800 1,000
0 200 400 600 800 1,000
0 200 400 600 800 1,000
0 200 400 600 800 1,000
0 200 400 600 800 1,000
0 200 400 600 800 1,000
84.7
6.35
8.96
4.81
87.9
7.27
10.7
78.7
10.6
6.84
8.15
85
3.8
42
54.233.1
61.6
5.38
41.2
55
3.82
35
60.5
4.58
Control shRNA shCPEB1 shCPEB4 shCPEB1 + shCPEB4
Per
cent
age
of m
axim
umP
erce
ntag
e of
max
imum
Figure 8 Cells knocked down for both CPEB1 and CPEB4 showed impairment of progression from G2 to M. (a) The different shRNA-expressing cells were synchronized at G2 and then released, and DNA content was measured by FACS analysis. The percentages of cells in each phase of the cell cycle are indicated. (b) Examples of
4,6-diamidino-2-phenylindole (DAPI)-stained cells in the mitotic phases scored. The graph shows the percentage of cells counted that were in each phase of mitosis. After treatment as in a, cells were stained with DAPI and chromosome morphology was analysed by microscopy. n = 350–850 cells per sample.
nature cell biology advance online publication 9
© 2010 Macmillan Publishers Limited. All rights reserved.

A RT I C L E S
Note: Supplementary Information is available on the Nature Cell Biology website.
AckNowledGeMeNtsAnti-MS2 antibodies were provided by Mike Kiledjian (Rutgers University), anti-CPSF100 antibodies by James Manley (Columbia University), and anti-CPEB1 antibodies by Dominique Weil (Institut Andre Lwoff). We thank Oscar Fornas (Flow Cytometry Facility at UPF) and Lauro Sumoy (Microarray Facility) for technical advice, and members of the Méndez and Fátima Gebauer laboratory, Mercedes Fernández, Juan Valcárcel, Josep Vilardell, Roderic Guigó and other colleagues from the Gene Expression Program, for helpful advice and critically reading the manuscript. This work was supported by grants from the Spanish Ministry of Science and Innovation, Fundació ‘Marató de TV3’ to R.M., and FIS and Marie Curie Reintegration grants to I.N. R.M. is a recipient of a contract from the I3 contract (MEC), and I.N. from the ‘Programa Ramón y Cajal’ (MEC).
AuthoR coNtRIbutIoNsJ.G. performed the experiments shown in Figs 3b–d, 4b and 5a. P.G.F performed the motif analysis of 3´ UTR sequences shown in Supplementary Information, Tables S5–S7. I.N. performed the rest of the experiments. I.N. and R.M. contributed to the experimental design and prepared the manuscript.
coMPetING FINANcIAl INteRestsThe authors declare no competing financial interests.
Published online at http://www.nature.com/naturecellbiologyReprints and permissions information is available online at http://npg.nature.com/reprintsandpermissions/
1. Richter, J. D. & Klann, E. Making synaptic plasticity and memory last: mechanisms of translational regulation. Genes Dev. 23, 1–11 (2009).
2. Richter, J. D. CPEB: a life in translation. Trends Biochem. Sci. 32, 279–285 (2007).
3. Groisman, I. et al. Control of cellular senescence by CPEB. Genes Dev. 20, 2701–2712 (2006).
4. Burns, D. M. & Richter, J. D. CPEB regulation of human cellular senescence, energy metabolism, and p53 mRNA translation. Genes Dev. 22, 3449–3460 (2008).
5. Hake, L. E. & Richter, J. D. CPEB is a specificity factor that mediates cytoplasmic polyadenylation during Xenopus oocyte maturation. Cell 79, 617–627 (1994).
6. Stebbins-Boaz, B., Cao, Q., de Moor, C. H., Mendez, R. & Richter, J. D. Maskin is a CPEB-associated factor that transiently interacts with elF-4E. Mol. Cell 4, 1017–1027 (1999).
7. Minshall, N., Reiter, M. H., Weil, D. & Standart, N. CPEB interacts with an ovary-specific eIF4E and 4E-T in early Xenopus oocytes. J. Biol. Chem. 282, 37389–37401 (2007).
8. Kim, J. H. & Richter, J. D. Opposing polymerase–deadenylase activities regulate cyto-plasmic polyadenylation. Mol. Cell 24, 173–183 (2006).
9. Barnard, D. C., Ryan, K., Manley, J. L. & Richter, J. D. Symplekin and xGLD-2 are required for CPEB-mediated cytoplasmic polyadenylation. Cell 119, 641–651 (2004).
10. Mendez, R., Murthy, K. G., Ryan, K., Manley, J. L. & Richter, J. D. Phosphorylation of CPEB by Eg2 mediates the recruitment of CPSF into an active cytoplasmic polyadenyla-tion complex. Mol. Cell 6, 1253–1259 (2000).
11. Dickson, K. S., Thompson, S. R., Gray, N. K. & Wickens, M. Poly(A) polymerase and the regulation of cytoplasmic polyadenylation. J. Biol. Chem. 276, 41810–41816 (2001).
12. Mendez, R. et al. Phosphorylation of CPE binding factor by Eg2 regulates translation of c-mos mRNA. Nature 404, 302–307 (2000).
13. Groisman, I., Jung, M.-Y., Sarkissian, M., Cao, Q. & Richter, J. D. Translational control of the embryonic cell cycle. Cell 109, 473–483 (2002).
14. Cao, Q., Kim, J. H. & Richter, J. D. CDK1 and calcineurin regulate Maskin association with eIF4E and translational control of cell cycle progression. Nature Struct. Mol. Biol. 13, 1128–1134 (2006).
15. Meijer, H. A. et al. A novel method for poly(A) fractionation reveals a large population of mRNAs with a short poly(A) tail in mammalian cells. Nucleic Acids Res. 35, e132 (2007).
16. Beilharz, T. H. & Preiss, T. Widespread use of poly(A) tail length control to accentuate expression of the yeast transcriptome. RNA 13, 982–997 (2007).
17. Mendez, R. & Richter, J. D. Translational control by CPEB: a means to the end. Nature Rev. Mol. Cell Biol. 2, 521–529. (2001).
18. Jacobson, A. Purification and fractionation of poly(A)+ RNA. Methods Enzymol. 152, 254–261 (1987).
19. Kittler, R. et al. Genome-scale RNAi profiling of cell division in human tissue culture cells. Nature Cell Biol. 9, 1401–1412 (2007).
20. Silva, J. M. et al. Profiling essential genes in human mammary cells by multiplex RNAi screening. Science 319, 617–620 (2008).
21. Yu, H. Cdc20: a WD40 activator for a cell cycle degradation machine. Mol. Cell 27, 3–16 (2007).
22. Poon, R. Y. & Hunter, T. Dephosphorylation of Cdk2 Thr160 by the cyclin-dependent kinase-interacting phosphatase KAP in the absence of cyclin. Science 270, 90–93 (1995).
23. Zimmerman, W. C. & Erikson, R. L. Polo-like kinase 3 is required for entry into S phase. Proc. Natl Acad. Sci. USA 104, 1847–1852 (2007).
24. Listovsky, T. et al. Mammalian Cdh1/Fzr mediates its own degradation. EMBO J. 23, 1619–1626 (2004).
25. Fontijn, R. D. et al. The human kinesin-like protein RB6K is under tight cell cycle control and is essential for cytokinesis. Mol. Cell. Biol. 21, 2944–2955 (2001).
26. Theis, M., Si, K. & Kandel, E. R. Two previously undescribed members of the mouse CPEB family of genes and their inducible expression in the principal cell layers of the hippocampus. Proc. Natl Acad. Sci. USA 100, 9602–9607 (2003).
27. Huang, Y. S., Kan, M. C., Lin, C. L. & Richter, J. D. CPEB3 and CPEB4 in neurons: analysis of RNA-binding specificity and translational control of AMPA receptor GluR2 mRNA. EMBO J. 25, 4865–4876 (2006).
28. Pique, M., Lopez, J. M., Foissac, S., Guigo, R. & Mendez, R. A combinatorial code for CPE-mediated translational control. Cell 132, 434–448 (2008).
29. Wiznerowicz, M. & Trono, D. Conditional suppression of cellular genes: lentivirus vector-mediated drug-inducible RNA interference. J Virol 77, 8957–8961 (2003).
30. Popov, N., Wahlstrom, T., Hurlin, P. J. & Henriksson, M. Mnt transcriptional repressor is functionally regulated during cell cycle progression. Oncogene 24, 8326–8337 (2005).
31. Vassilev, L. T. et al. Selective small-molecule inhibitor reveals critical mitotic functions of human CDK1. Proc. Natl Acad. Sci. USA 103, 10660–10665 (2006).
32. Cho, R. J. et al. Transcriptional regulation and function during the human cell cycle. Nature Genet. 27, 48–54 (2001).
33. Orlando, D. A. et al. Global control of cell-cycle transcription by coupled CDK and network oscillators. Nature 453, 944–947 (2008).
34. Bahler, J. Cell-cycle control of gene expression in budding and fission yeast. Annu. Rev. Genet. 39, 69–94 (2005).
35. Belloc, E., Pique, M. & Mendez, R. Sequential waves of polyadenylation and deadenyla-tion define a translation circuit that drives meiotic progression. Biochem. Soc. Trans. 36, 665–670 (2008).
36. Giraldez, A. J. et al. Zebrafish MiR-430 promotes deadenylation and clearance of maternal mRNAs. Science 312, 75–79 (2006).
37. Goldstrohm, A. C. & Wickens, M. Multifunctional deadenylase complexes diversify mRNA control. Nature Rev. Mol. Cell Biol. 9, 337–344 (2008).
10 nature cell biology advance online publication
© 2010 Macmillan Publishers Limited. All rights reserved.

DoI: 10.1038/ncb2046 M E T H O D S
METHoDsAntibodies. Anti-CPEB4 (NM_030627) rabbit polyclonal antibodies were raised against amino acids 1–302, and His–CPEB(X) was used to produce antibodies against Xenopus CPEB1. Mnt, Sp1 and tubulin were from Santa Cruz Biotech; Cdc20 was from Abcam; Flag was from Sigma.
Oligonucleotides. For semiquantitative PCR: CPEB1, 5´-CCAAGCTTCCAA-TATCTTTCGAAGGATAAATGC-3´ (sense) and 5´-GGCCGTCGACAAGTCA-GACCCAAGGGGATCCAGAG-3´ (antisense); CPEB2, 5´-CCA AGCT TGCCGCC TTCCTGCAGCAGAGGAACT-3´ (sense) and 5´-GGC CGTCGACCA TACATTCT ACTTCGAT CCTGGTC-3´ (antisense); CPEB3, CC 5´-GGATCCC ATGCAGGAT GATTTACTGATGGAC-3´ (sense) and 5´-GGCCGT CGACGTGCTGGGTCTGCGCCAGGCCGATC-3´ (antisense); CPEB4, 5´-CCGGATCCATGGGGGATTACGGGTTTGGAGTGC-3´ (sense) and 5´-GGC CGTCGACCTCCCTGGTGAAAGAAACTTGCATC-3´ (antisense).
For qRT–PCR: CPEB1, 5´-CCTGGGTATTAGCCGACAGT-3´ (sense) and 5´-GCCTCAGCATTTAGCATTCC-3´ (antisense); CPEB4, 5´-TGGGGA-TCAGCCTCTTCATA-3´ (sense) and 5´-CAATCCGCCT ACAAACACCT-3´ (antisense); Mnt, 5´-TAGTGGC TGTTCATGCTCCA-3´ (sense) and 5´-TCTCA-GGTTTCA GTGCAGGTT-3´ (antisense); α-galactosidase (housekeeping gene), 5´-CTCAGAAGGCTGGAAGGATG-3´ (sense) and 5´-GAGGGTCTG CCTGA-AGTCTG-3´ (antisense).
CPEB1 were directed against 5´-GGTACTGAGCATGCTCCATAA-3´, and shRNAs for CPEB4 were directed against 5´-GCTGCAGCA TGGAGA-GATAGA-3´.
The specific oligonucleotides used for the poly(A) test were as follows: Cdc20, 5´-TGAGGCTATGGCGCTGTTTTGAGTT-3´; CDKN3, 5´-CCAT-GTCTGAAATGTCAGTTCTCTA-3´; GAPDH, 5´-CTGGCATTG CTCTCAA-TGACAACTTT-3´.
Plasmid constructions. The DNA corresponding to six repeats of the MS2-binding site was subcloned downstream of the firefly luciferase ORF followed by cyclin B1 CPE mutated 3´ UTR. Enhanced green fluorescent protein (EGFP)–MS2 was described in ref. 38. MS2-binding proteins were obtained by PCR amplifi-cation of MS2 and subcloning into pET30 or Bluescript already containing the different CPEBs tested. CPEB1, CPEB2 and CPEB4 were subcloned into pRSET C to produce His-tagged fusion proteins in Escherichia coli. CPEB1 and CPEB4 were subcloned into pFlag–CMV2 to produce Flag-tagged fusion proteins. The cyclin B1 3´ UTR was described in ref. 28.
CPEB protein purification and RNA gel retardation assays. His–CPEB proteins were expressed in E. coli and bacteria pellets were lysed in CelLytic B Cell Lysis Reagent (Sigma) and purified by Ni2+-nitrilotriacetate agarose (Qiagen). RNA labelled probe (3.7 fmol) was incubated with the purified proteins as indicated in ref. 39.
Poly(A) tail test (RNA-ligation-coupled RT–PCR) and qRT–PCR differen-tial polyadenylation validation. Poly(A) tail tests were performed with 2 µg of total RNA as described40. The cDNA obtained was amplified with FastStart Taq DNA polymerase (Roche) in the presence of 5 µCi of [α-32P]dATP. For valida-tion of differentially polyadenylated mRNAs between S phase and G2/M phases (Supplementary Information, Fig. S1e), and CPEB1 and CPEB4 differentially polyadenylated mRNAs (Fig. 4d, e), and Mnt poly(A) tail changes (Fig. 5b), mRNA levels of the oligo(dT)-purified mRNAs (ALL fraction) and poly(U)-chormatography (SHORT fraction, eluted at low temperature) were measured by qRT–PCR. The ratio of each specific mRNA between oligo(dT)-purified and poly(U)-purified, and the corresponding fold change (G2/M phases versus S phase; CPEB1-depleted or CPEB4-depleted cells versus control cells) was calcu-lated for each sample. An increase in this ratio, or a positive fold change, is a reflec-tion of a longer poly(A) tail, and a decrease indicates a shorter poly(A) tail.
Polysome profile analysis. Cells were lysed in polysome extraction buffer (15 mM Tris-HCl pH 7.4, 300 mM NaCl, 15 mM MgCl2, 1% Triton X-100, 1 mg ml−1 heparin, 100 µg ml−1 cycloheximide, and protease inhibitors) and nuclei were removed by centrifugation. The supernatant was layered on top of a linear sucrose density gradient (10–45%) and ultracentrifuged in a SW41Ti rotor at 35,000 r.p.m. for 200 min. Fractions were collected and RNA was extracted by phenol/chloroform and ethanol precipitation.
Oocyte preparation and microinjection. Stage VI Xenopus oocytes were obtained from Xenopus females as described previously41.
Translational control and cytoplasmic polyadenylation by MS2 tethering. Translation and polyadenylation of luciferase-MS2-binding sites reporter mRNA were assayed as described previously42. Oocytes were microinjected with 60 fmol of in vitro synthesized RNAs encoding the different MS2-fusion proteins, and oocytes were incubated overnight. Then 0.02 fmol of reporter luciferase with MS2-binding sites and polyadenylation signal together with 0.02 fmol of normal-izing Renilla luciferase RNA were microinjected. Translational activation of luci-ferase-MS2 reporter were referred to MS2–CPEB(X), taking the latter as 100%. Polyadenylation of luciferase-MS2-binding sites reporter mRNA was performed by microinjecting oocytes to produce expression of the MS2-fusion proteins; oocytes were then injected with 3.2 fmol of labelled reporter mRNA.
Cell extracts and Flag-immunoprecipitation. HeLa cells were lysed in Triton buffer (20 mM HEPES pH 7.0, 150 mM NaCl, 1% Triton X-100, 10% glycerol, 1 mM EDTA, 1 mM phenylmethylsulphonyl fluoride, 1 × protease inhibitors (Sigma)). The lysates were centrifuged at 14,000 r.p.m. and supernatant was saved for protein analysis of cytoplasmic proteins; the pellet was resuspended in gel loading buffer for nuclear protein analysis. 293T cells were transfected with the different plasmids by calcium precipitation. Cell lysates were prepared in Triton buffer supplemented with 50 µg ml−1 RNase A. Extracts from each sam-ple were incubated overnight with anti-Flag (4 µg) bound to 30 µl of protein G-Sepharose (GE-Healthcare) and the bound proteins were washed six times with Triton buffer.
Synchronization of HeLa cells and microscopy. Synchronization at the G1/S border was done by double thymidine (Calbiochem) treatment (12 h with 2 mM thymidine, 12 h release, and 12 h with 2 mM thymidine). Late G2 synchroniza-tion was achieved by treatment with 9 µM RO-3306 (Calbiochem) for 20–24 h (ref. 31). For analysis of nuclei by microscopy, cells were fixed and mounted with Vectashield mounting medium with DAPI.
CPEB knockdown cell lines. shRNAs against CPEB1 and CPEB4 were designed and cloned into the lentivirus vector pLV-THM29, and virus production was per-formed as indicated in http://tronolab.epfl.ch/. First a cell line was established that expressed the doxycycline KRAB repressor and RFP (named WT in Fig. 6a); cells were then infected with the different shRNA-producing viruses that co-expressed GFP and selected by cell sorting for RFP-positive and GFP-positive after 3 days of induction with doxycycline (4 µg ml−1). mRNA levels for CPEB1 and CPEB4 were measured by qRT–PCR and normalized to the housekeeping gene α-galactosidase. For the microarray experiment, poly(A) tail test and protein analysis, the different shRNA-expressing cells were DTB synchronized between days 3 and 5 of treatment with doxycycline (4 µg ml−1), and samples were col-lected on day 5 of doxycycline addition. For DNA content analysis, cells were synchronized with RO-3306 or a single thymidine blockade (between days 4 and 5 of doxycycline treatment), and samples were collected on day 5 of doxycycline addition. For analysis by microscopy, cells were synchronized with RO-3306 (between days 6 and 7 of doxycycline treatment), and samples were fixed on day 7 of doxycycline addition.
RNA purification and microarray analysis. For G2/M versus S phases differen-tial polyadenylation screening, HeLa cells were synchronized by DTB and samples were taken after 2 h release (S phase) and 8 h release (G2/M phases). Three differ-ent experiments were performed for each experimental condition. Total RNA was purified by two different procedures for each sample: poly(U) chromatography and oligo(dT) chromatography. For poly(U) chromatography18, 100 µg of total RNA was bound to poly(U)-Sepharose (Sigma) and eluted at 35 °C to isolate mRNAs with a short poly(A) tail (fewer than 30As, SHORT fraction = reference sample). For oligo(dT) chromatography, mRNAs were purified independently of their poly(A) tail length with Ambion Poly(A)Purist kit from 20 µg total RNA (ALL fraction = test sample). Test and reference samples (100 ng) were labelled using Two-Color Microarray-Based Gene Expression Analysis (Agilent). Gene expression DNA microrrays from Agilent (human 22K oligonucleotide microar-rays; G4110B) were hybridized and scanned at the Microarray Unit of the CRG and the ratio of ALL fraction mRNAs to SHORT fraction mRNAs was obtained. The data for ALL fraction/SHORT fraction between G2/M and S phases were
nature cell biology advance online publication 11
© 2010 Macmillan Publishers Limited. All rights reserved.
M E T H O D S DoI: 10.1038/ncb2046
analysed to identify the mRNAs undergoing changes in this ratio, indicative of differential polyadenylation. For G2/M versus S phases gene expression analy-sis, only the oligo(dT)-purified RNAs were labelled and hybridized as described previously. Three biological replicate experiments were performed, and for all three biological replicates each experimental pair of labelled samples was co-hybridized on two separate microarrays with dye swapping to correct for dye bias effects. The data from these 12 microarrays were then subjected to signifi-cance analysis of microarrays (SAM) analysis43 to detect statistically significant differences in differential polyadenylation between the different experimental samples. We considered genes that showed at least a 1.3-fold change up or down to be regulated relative to the control sample with a q value of 5 or less (false discovery rate below 5%).
Results were plotted (Fig. 1d) as log2[(ALL fraction G2/M)/(SHORT fraction G2/M)] − log2[(ALL fraction S)/(SHORT fraction S)] against log2[(ALL fraction G2/M)/(ALL fraction S)].
For the CPEB knockdown versus control shRNA-expressing cells differential polyadenylation screening, cells were synchronized by DTB and samples were collected after 8 h release (G2/M phases). Three replicates for each condition were obtained and the same poly(U) and oligo(dT) chromatography procedures were performed for these samples. For all three biological replicates each experimental pair of labelled samples was co-hybridized on two separate microarrays with dye swapping to correct for dye bias effects (six microarray hybridizations for each shRNA-expressing cell).
Gene expression DNA microrrays from Agilent (whole human genome oligonucleotide microarrays, 44K; G4112F) were used. Results were plotted (Fig. 4c) as log2[(ALL fraction CPEB1 knockdown)/(SHORT fraction CPEB1
knockdown)] − log2[(ALL fraction control cells)/(SHORT fraction control cells)] against log2[(ALL fraction CPEB1 knockdown)/(ALL fraction control cells)]. The same applies to the data of CPEB4 shRNA-expressing cells against control shRNA-expressing cells.
Microarray data were submitted to GEO with the accession numbers GSE15399I, GSE15547 and GSE15549.
Flow cytometry. DNA content was measured by staining with propidium iodide and analysis by flow cytometry (FACScan) as indicated44. Cell death was measured with Alexa Fluor 647 annexin V conjugate (Invitrogen) and analysed by flow cytometry with an LSR machine (Becton Dickinson). Flow cytometry data were analysed with Cell Quest and FlowJo software.
38. Eliscovich, C., Peset, I., Vernos, I. & Mendez, R. Spindle-localized CPE-mediated translation controls meiotic chromosome segregation. Nature Cell Biol. 10, 858–865 (2008).
39. Walker, J., de Melo Neto, O. & Standart, N. Gel retardation and UV-crosslinking assays to detect specific RNA-protein interactions in the 5´ or 3´ UTRs of translationally regulated mRNAs. Methods Mol. Biol. 77, 365–378 (1998).
40. Belloc, E. & Mendez, R. A deadenylation negative feedback mechanism governs meiotic metaphase arrest. Nature 452, 1017–1021 (2008).
41. de Moor, C. H. & Richter, J. D. Cytoplasmic polyadenylation elements mediate masking and unmasking of cyclin B1 mRNA. EMBO J. 18, 2294–2303 (1999).
42. Pique, M., Lopez, J. M. & Mendez, R. Cytoplasmic mRNA polyadenylation and transla-tion assays. Methods Mol. Biol. 322, 183–198 (2006).
43. Tusher, V. G., Tibshirani, R. & Chu, G. Significance analysis of microarrays applied to the ionizing radiation response. Proc. Natl Acad. Sci. USA 98, 5116–5121 (2001).
44. Sancho, M., Diani, E., Beato, M. & Jordan, A. Depletion of human histone H1 variants uncovers specific roles in gene expression and cell growth. PLoS Genet. 4, e1000227 (2008).
12 nature cell biology advance online publication
© 2010 Macmillan Publishers Limited. All rights reserved.

s u p p l e m e n ta ry i n f o r m at i o n
www.nature.com/naturecellbiology 1
DOI: 10.1038/ncb2046
Figure S1 a, Analysis of the overlap of mRNAs differentially polyadenylated and differentially expressed between G2/M and S. 571 mRNAs were found to be diferentially polyadenylated between S phase and G2/M phases, and 1648 mRNAs were found to be differentially expressed between S phase and G2/M phases. There is an overlap of 210 mRNAs, which represents 36.7% of the differentially polyadenylated mRNAs, and 12.7% of the differentially expressed mRNAs. b, Gene ontology analysis of mRNAs differentially polyadenylated between G2/M and S. Differentially polyadenylated
genes of Supplementary Information, Tables 1 and 2 were submitted to Ingenuity software to assign common molecular functional groups. c, List of differentially polyadenylated genes that were also found to be required for cell cycle progression19, and for cell proliferation and survival20. d, Summary table with the candidate mRNAs tested. The PCR based poly(A) tail test data correspond to the experiments of Fig. 1f, and Supplementary Information, Fig. S3, and the qRTPCR validated mRNAs data correspond to the experiment of Fig. 1e. 21 mRNAs were analyzed and 16 were validated (76.19% validated).
a b-lo
g(p-
valu
e)
Cel
l Dea
th
Cel
l Cyc
le
Cel
lula
r Gro
wth
and
Pro
lifer
atio
n
Gen
e Ex
pres
sion
Cel
l Mor
phol
ogy
Cel
lula
r Dev
elop
men
t
DN
A R
eplic
atio
n, R
ecom
bina
tion,
and
Rep
air
Cel
lula
r Com
prom
ise
RN
A Po
st-T
rans
crip
tiona
l Mod
ifica
tion
Cel
lula
r Mov
emen
t
Mol
ecul
ar T
rans
port
Smal
l Mol
ecul
e B
ioch
emis
try
Cel
lula
r Fun
ctio
n an
d M
aint
enan
ce
Cel
l-To-
Cel
l Sig
nalin
g an
d In
tera
ctio
n
Cel
lula
r Ass
embl
y an
d O
rgan
izat
ion
Prot
ein
Synt
hesi
s
Dru
g M
etab
olis
m
Lipi
d M
etab
olis
m
Cel
l Sig
nalin
g
Car
bohy
drat
e M
etab
olis
m
10.0
7.5
5.0
2.5
0.01648571 210210210210
mRNAs differentially polyadenylated S vs G2/M phases
mRNAs differentially expressed S vs G2/M phases
mRNAs in common
dPCR based poly(A) qRTPCR validation
Number Gene Name tail test G2/M vs S Validated1 CDC20 + + +2 CDKN3 + +3 CDC45L + +4 TRIO + +5 CCNE1 + +6 ISG20 + +7 PNRC2 + +8 GDF15 + +9 ANKRD2 + +
10 FADD + +11 MTA1 + +12 CDCA8 + +13 PWP1 - -14 UHRF2 - -15 FKBP10 - -16 DEGS1 - -17 PCNA - -18 EGR1 + +19 PCNX + +20 NOTCH2 + +21 WIPI49 + +
BTBD6 control controlGAPDH control control control
Total 21+ 16- 5
% validation 76.19
DCTN6 G0/1 arrestTNFRSF21 G0/1 arrestSLC20A2 G0/1 arrestTSG101 G0/1 arrestNR4A2 G0/1 arrestDEGS1 G0/1 arrestTRNT1 G0/1 arrestRSNL2 G0/1 arrestWIPI49 G0/1 arrestCDH1 G0/1 arrestPLAUR G0/1 arrestCCNE1 G0/1 arrestNCL G0/1 arrestMTHFD2 G0/1 arrestC6orf139 G0/1 arrestDKK1 G0/1 arrestSKB1 G0/1 arrestFLJ33167 G0/1 arrestIER3 G0/1 arrestCXCL2 G0/1 arrestWIPI49 G0/1 arrest
DCTN6 G0/1 arrestMGC4825 G0/1 arrestSKB1 G0/1 arrestPLAT G0/1 arrestH1F0 G2 arrestEXOSC7 S arrestNFYB S arrestGABPB2 S arrestPCNA S arrestCDC45L S arrestPOLA S arrestHIVEP2 S arrestKIF20A Cell division defectMGC11061 Cell division defcetESPL1 Cell division defectKIF23 Cell division defectANKRD2 Cell division defectZNF239 Cell division defectCDC20 Cell division defectUBC Cell division defectCDCA8 Cell division defect
ALPK2ASNSCCL20CCNE1CCNE2CDC20CDC42BPBCDC45LCDCA7CDCA8CDH1CDK2CDKN1ACDKN3CEBPGCLK4CPNE7DKC1DUSP4EGR2EHMT1
EMP1EPHA2ESPL1ETNK1EXO1FADDFHFOSBGADD45AGLI3GKH1F0IFNGR2IGFBP1IL11IL1BIL6MAPK6MAPK8MYBNOLC1
NR4A2ODF2PCNAPHKA1PIM3PIP5K1APLAUPPP6CPRKCHPTPRERELBSMAD3SMARCA2STK17BTCF4TNFSF10TRIOTSG101UHRF2WNT10BZFP36L1
Genes required for cell proliferation and survival and differentially polyadenylated
Genes required for proper cell cycle progression and identified as differentially polyadenylated
c
Mendez Fig S1
© 2010 Macmillan Publishers Limited. All rights reserved.
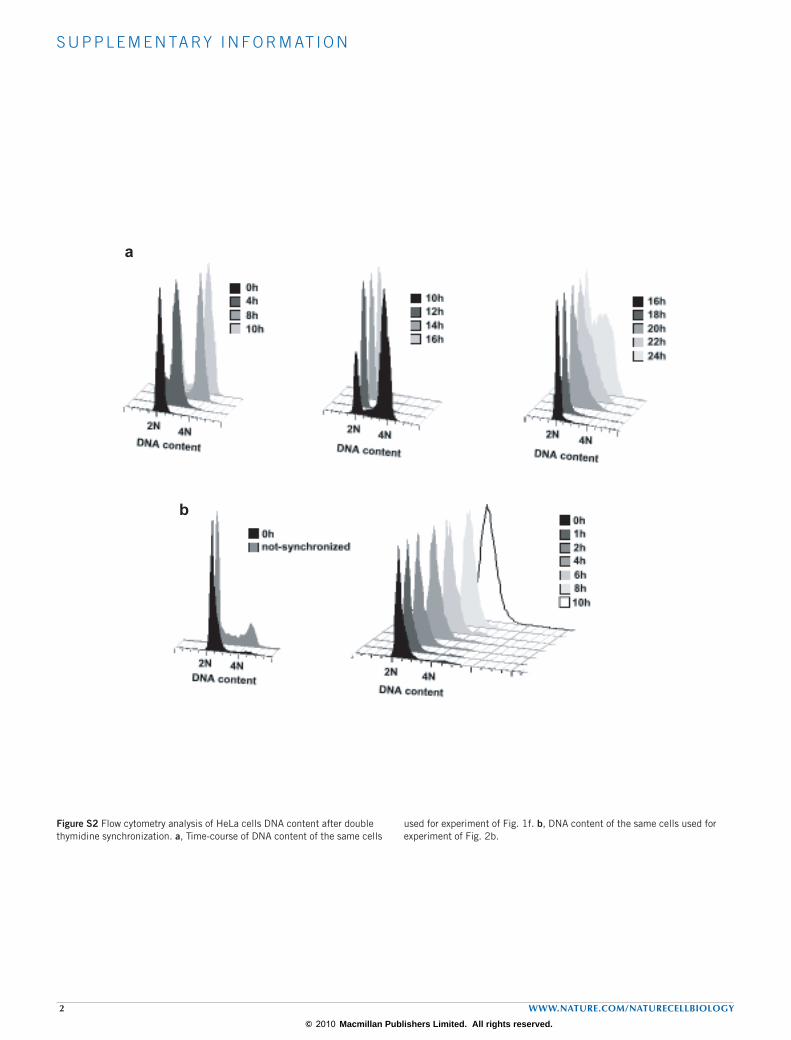
s u p p l e m e n ta ry i n f o r m at i o n
2 www.nature.com/naturecellbiology
Figure S2 Flow cytometry analysis of HeLa cells DNA content after double thymidine synchronization. a, Time-course of DNA content of the same cells
used for experiment of Fig. 1f. b, DNA content of the same cells used for experiment of Fig. 2b.
a
b
Mendez Fig S2
© 2010 Macmillan Publishers Limited. All rights reserved.
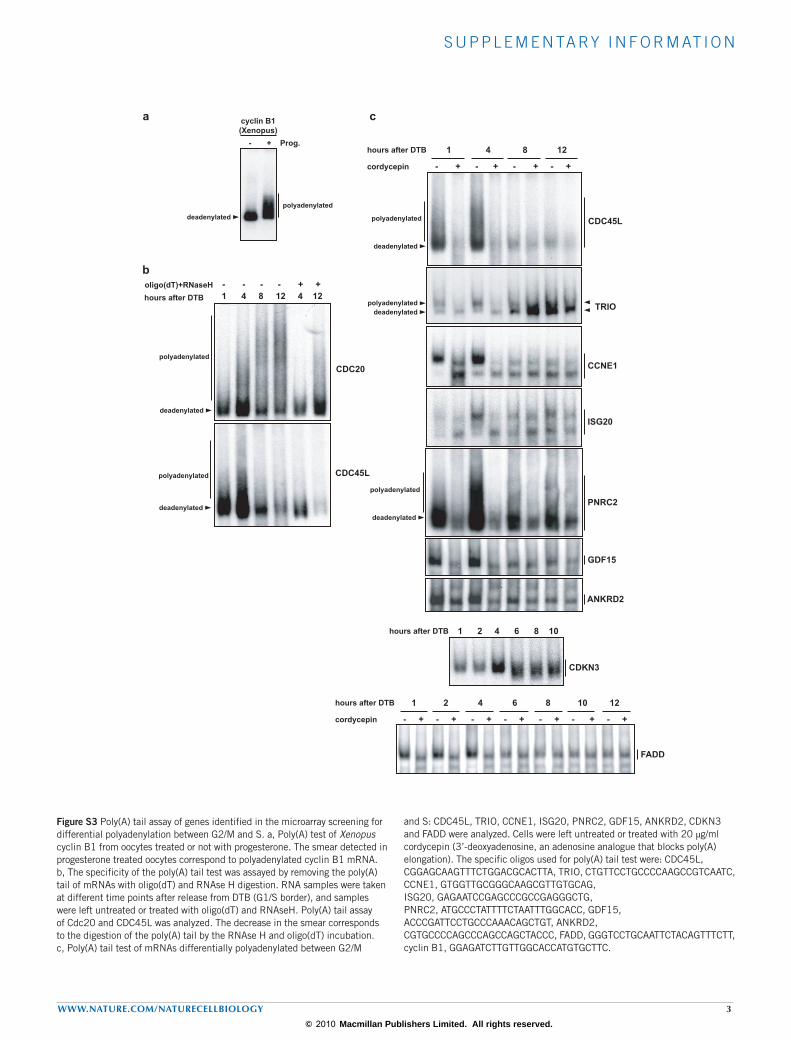
s u p p l e m e n ta ry i n f o r m at i o n
www.nature.com/naturecellbiology 3
Figure S3 Poly(A) tail assay of genes identified in the microarray screening for differential polyadenylation between G2/M and S. a, Poly(A) test of Xenopus cyclin B1 from oocytes treated or not with progesterone. The smear detected in progesterone treated oocytes correspond to polyadenylated cyclin B1 mRNA. b, The specificity of the poly(A) tail test was assayed by removing the poly(A) tail of mRNAs with oligo(dT) and RNAse H digestion. RNA samples were taken at different time points after release from DTB (G1/S border), and samples were left untreated or treated with oligo(dT) and RNAseH. Poly(A) tail assay of Cdc20 and CDC45L was analyzed. The decrease in the smear corresponds to the digestion of the poly(A) tail by the RNAse H and oligo(dT) incubation. c, Poly(A) tail test of mRNAs differentially polyadenylated between G2/M
and S: CDC45L, TRIO, CCNE1, ISG20, PNRC2, GDF15, ANKRD2, CDKN3 and FADD were analyzed. Cells were left untreated or treated with 20 µg/ml cordycepin (3’-deoxyadenosine, an adenosine analogue that blocks poly(A) elongation). The specific oligos used for poly(A) tail test were: CDC45L, CGGAGCAAGTTTCTGGACGCACTTA, TRIO, CTGTTCCTGCCCCAAGCCGTCAATC, CCNE1, GTGGTTGCGGGCAAGCGTTGTGCAG, ISG20, GAGAATCCGAGCCCGCCGAGGGCTG, PNRC2, ATGCCCTATTTTCTAATTTGGCACC, GDF15, ACCCGATTCCTGCCCAAACAGCTGT, ANKRD2, CGTGCCCCAGCCCAGCCAGCTACCC, FADD, GGGTCCTGCAATTCTACAGTTTCTT, cyclin B1, GGAGATCTTGTTGGCACCATGTGCTTC.
a c
b
cyclin B1 (Xenopus)
- + Prog.
polyadenylated deadenylated
1 4 8 12 4 12 - - - - + +
polyadenylated
deadenylated
CDC20
oligo(dT)+RNaseH hours after DTB
CDC45L polyadenylated
deadenylated
1 4 8 12
- + - + - + - +
hours after DTB
cordycepin
polyadenylated
deadenylated
CDC45L
polyadenylated deadenylated TRIO
CCNE1
ISG20
PNRC2 polyadenylated
deadenylated
GDF15
ANKRD2
1 2 4 6 8 10 hours after DTB
CDKN3
1 2 4 6
- + - + - + - + - + - + - +
hours after DTB
cordycepin
8 10 12
FADD
Mendez Fig S3
© 2010 Macmillan Publishers Limited. All rights reserved.
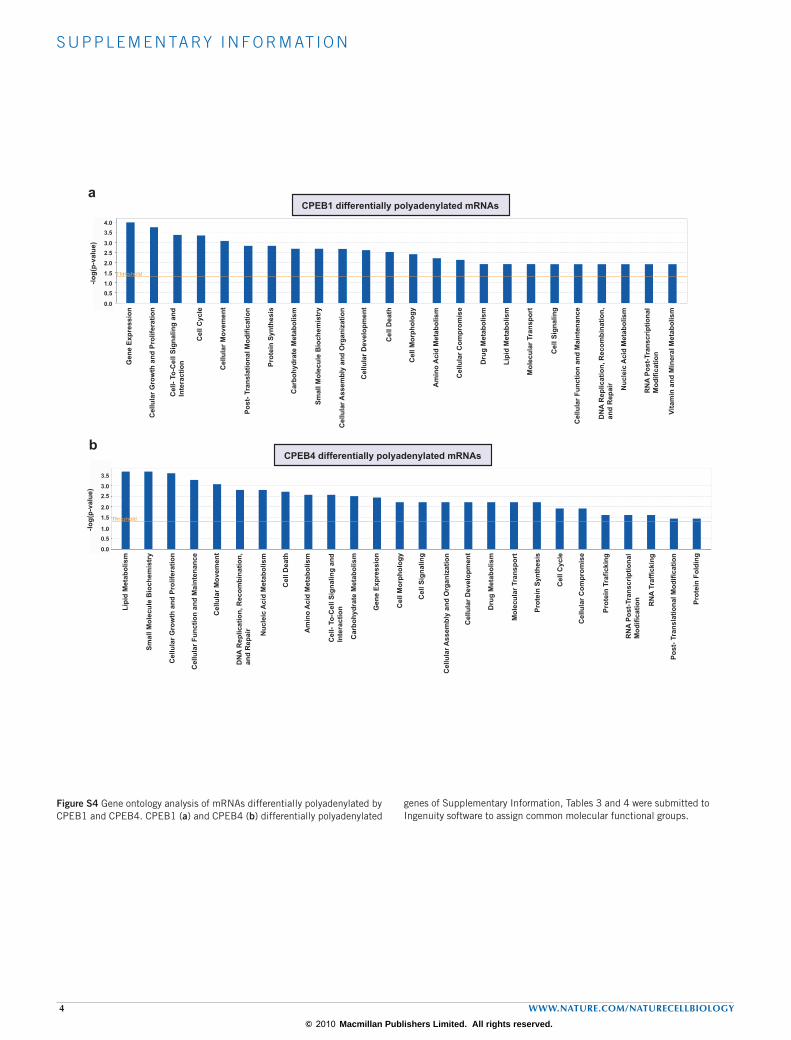
s u p p l e m e n ta ry i n f o r m at i o n
4 www.nature.com/naturecellbiology
Figure S4 Gene ontology analysis of mRNAs differentially polyadenylated by CPEB1 and CPEB4. CPEB1 (a) and CPEB4 (b) differentially polyadenylated
genes of Supplementary Information, Tables 3 and 4 were submitted to Ingenuity software to assign common molecular functional groups.
a
b
-log(
p-va
lue)
4.0 3.5
3.0 2.5
2.0
1.5
1.0 0.5
0.0
Gen
e Ex
pres
sion
Cel
lula
r Gro
wth
and
Pro
lifer
atio
n
Cel
lula
r Mov
emen
t
Cel
l- To
-Cel
l Sig
nalin
g an
d In
tera
ctio
n
Cel
l Cyc
le
Post
- Tra
nsla
tiona
l Mod
ifica
tion
Prot
ein
Synt
hesi
s
Car
bohy
drat
e M
etab
olis
m
Smal
l Mol
ecul
e B
ioch
emis
try
Cel
lula
r Ass
embl
y an
d O
rgan
izat
ion
Cel
lula
r Dev
elop
men
t
Cel
l Dea
th
Cel
l Mor
phol
ogy
Am
ino
Aci
d M
etab
olis
m
Cel
lula
r Com
prom
ise
Dru
g M
etab
olis
m
Lipi
d M
etab
olis
m
Mol
ecul
ar T
rans
port
Cel
l Sig
nalin
g
Cel
lula
r Fun
ctio
n an
d M
aint
enan
ce
DN
A R
eplic
atio
n, R
ecom
bina
tion,
an
d R
epai
r Nuc
leic
Aci
d M
etab
olis
m
RN
A Po
st-T
rans
crip
tiona
l M
odifi
catio
n
Vita
min
and
Min
eral
Met
abol
ism
-log(
p-va
lue)
3.5
3.0 2.5
2.0
1.5
1.0 0.5
0.0
CPEB4 differentially polyadenylated mRNAs
CPEB1 differentially polyadenylated mRNAs
Gen
e Ex
pres
sion
Cel
lula
r Gro
wth
and
Pro
lifer
atio
n
Cel
lula
r Mov
emen
t
Cel
l- To
-Cel
l Sig
nalin
g an
d In
tera
ctio
n
Cel
l Cyc
le
Post
- Tra
nsla
tiona
l Mod
ifica
tion
Prot
ein
Synt
hesi
s
Car
bohy
drat
e M
etab
olis
m
Smal
l Mol
ecul
e B
ioch
emis
try
Cel
lula
r Ass
embl
y an
d O
rgan
izat
ion
Cel
lula
r Dev
elop
men
t
Cel
l Dea
th
Cel
l Mor
phol
ogy
Am
ino
Aci
d M
etab
olis
m
Cel
lula
r Com
prom
ise
Dru
g M
etab
olis
m
Lipi
d M
etab
olis
m
Mol
ecul
ar T
rans
port
Cel
l Sig
nalin
g
Cel
lula
r Fun
ctio
n an
d M
aint
enan
ce
DN
A R
eplic
atio
n, R
ecom
bina
tion,
an
d R
epai
r Nuc
leic
Aci
d M
etab
olis
m
RN
A Po
st-T
rans
crip
tiona
l M
odifi
catio
n Prot
ein
Fold
ing
RN
A Tr
affic
king
Prot
ein
Traf
icki
ng
Mendez Fig S4
© 2010 Macmillan Publishers Limited. All rights reserved.

s u p p l e m e n ta ry i n f o r m at i o n
www.nature.com/naturecellbiology 5
Figure S5 a, Flow cytometry analysis of DNA content after G2-synchronization of HeLa cells with RO-3306. Cells were treated for 20-23 hours with 9 µM RO-3306 and DNA content analyzed at different time-points after RO-3306 removal. b, Cell cycle distribution of cells based on the experiments of DNA content and
nuclei analysis after G2 synchronization with RO-3306. The % of cells at prophase+prometaphase, metaphase, anaphase+telophase, and cytokinesis are the same as indicated in Fig. 8b. The % of cells in interphase corresponding to G2 and G1+S phases were calculated based on the DNA content data of Fig. 8a.
a
DNA content
RO-3306-1h release
% o
f cou
nted
cel
ls
b
G2 prophase+ prometa phase
metaphase anaphase+ telophase
cytokinesis G1+S
RO-3306-8h release
% o
f cou
nted
cel
ls
G2 prophase+ prometa phase
metaphase anaphase+ telophase
cytokinesis G1+S
DNA content DNA content
DNA content DNA content DNA content
Cel
l cou
nt
Cel
l cou
nt
Not-synchronized R0-3306, 0h release
R0-3306, 1h release
R0-3306, 4h release
R0-3306, 8h release
R0-3306, 12h release
control shRNA
CPEB1 shRNA
CPEB4 shRNA
CPEB1+CPEB4 shRNA
control shRNA
CPEB1 shRNA
CPEB4 shRNA
CPEB1+CPEB4 shRNA
Mendez Fig S5
© 2010 Macmillan Publishers Limited. All rights reserved.
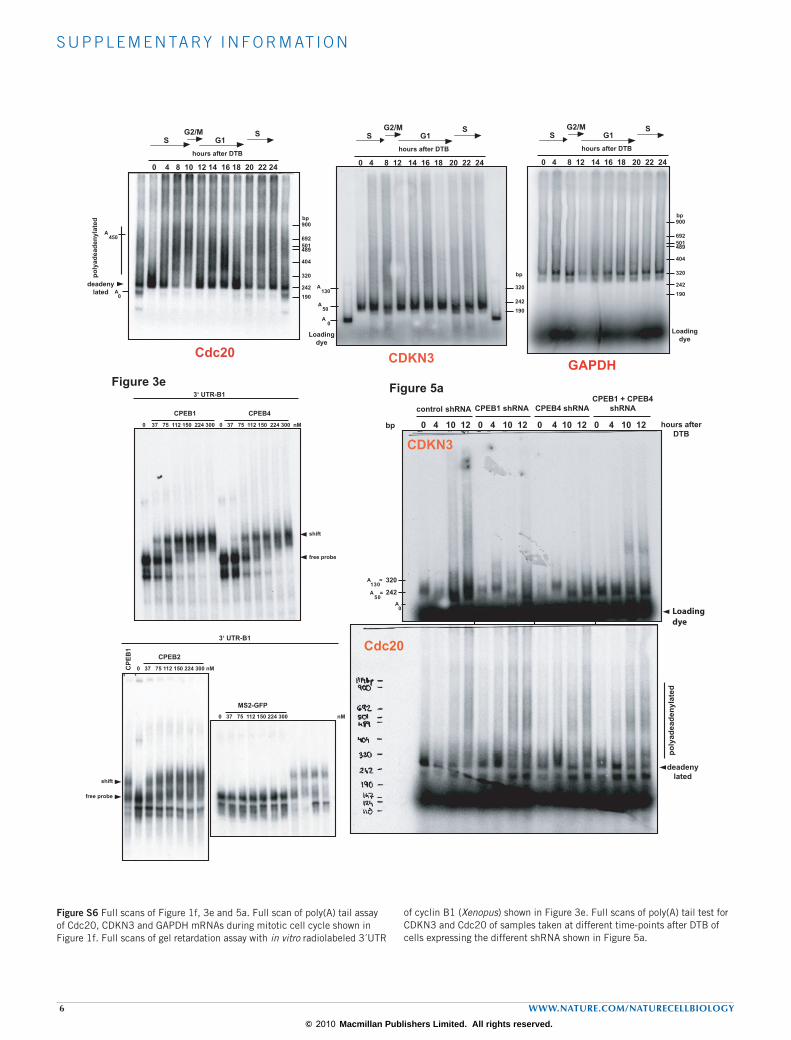
s u p p l e m e n ta ry i n f o r m at i o n
6 www.nature.com/naturecellbiology
Figure S6 Full scans of Figure 1f, 3e and 5a. Full scan of poly(A) tail assay of Cdc20, CDKN3 and GAPDH mRNAs during mitotic cell cycle shown in Figure 1f. Full scans of gel retardation assay with in vitro radiolabeled 3´UTR
of cyclin B1 (Xenopus) shown in Figure 3e. Full scans of poly(A) tail test for CDKN3 and Cdc20 of samples taken at different time-points after DTB of cells expressing the different shRNA shown in Figure 5a.
0 4 8 10 12 14 16 18 20 22 24
Cdc20
Figure 1f
hours after DTB
SG2/M
G1S
0 4 8 12 14 16 18 20 22 24
hours after DTB
SG2/M
G1S
CDKN3 GAPDH
bp
190242
320
404
489501692
900
A0
A450
deadenylated
poly
adea
deny
late
d bp
190242
320
404
489501692
900
Loadingdye
0 4 8 12 14 16 18 20 22 24
hours after DTB
SG2/M
G1S
Loadingdye
bp
190242
320A130
A50
A0
deadenylated
poly
adea
deny
late
d
Figure 5acontrol shRNA
0 4 10 12 0 4 10 12 0 4 10 12 0 4 10 12
CPEB1 shRNA CPEB4 shRNACPEB1 + CPEB4
shRNA
bp hours afterDTB
Loadingdye
320
242
A130
=
A50
=
A0
0 37 75 112 150 224 300 0 37 75 112 150 224 300 nM
CPEB1 CPEB4
shift
free probe
Figure 3e3‘ UTR-B1
0 37 75 112 150 224 300 nM
CPEB2
MS2-GFP
shift
free probe
CPE
B1
0 37 75 112 150 224 300 nM
3‘ UTR-B1
CDKN3
Cdc20
Mendez Fig S6
© 2010 Macmillan Publishers Limited. All rights reserved.

s u p p l e m e n ta ry i n f o r m at i o n
www.nature.com/naturecellbiology 7
Figure S7 Full scans of western blots from figures Figures 2b, 3b, 3d, 4b and 5c.
Figure 2b
anti-Cdc20
anti-tubulin
50
M r(K) 0 1 2 4 6 8 10
hours after DTB
194
116
97
50
194
116
97
37
Figure 3b
- + - + - + CTL
MS2-CPEB(X)
MS2-CPEB1
99
M r(K)
anti-MS2
- + - + - + CTL
MS2-CPEB(X)
MS2-CPEB2
- + - + - + Prog. CTL
MS2-CPEB(X)
MS2-CPEB4
P
P
anti-CPEB
116
194
MS2-GFP
99
M r(K)
116
194
P99
M r(K)
116
194
99
116
194
50
endogenousCPEB(X)
PendogenousCPEB(X)
CPE
B4
CPE
B1
noCPE
B4
CPE
B1
no
input Flag IPFigure 3d
anti-Flag
CPSF100
Flag-CPEB4
Flag-CPEB1
99
M r(K)
117
54
99
M r(K)
117
54anti-CPSF100
Figure 4b
anti-CPEB1
CPEB4
IgG
anti-CPEB454
M r(K)
99
117
CPEB1
Cont
rol
Cont
rol
CPEB
1
CPEB
4
CPEB
1+4
No shRNA
CPEB1 Western
*
Cont
rol
CPEB
1
CPEB
4
CPEB
1+4
No shRNA
CPEB4 IP
99
M r(K)
117
54
Figure 5c
85
Mr(K)
198
116
54
37
control shRNA
0 4 10 12 0 4 10 12 0 4 10 12
CPEB1 shRNA CPEB4 shRNACPEB1 + CPEB4
shRNA
hours after DTB0 4 10 12 0 4 10 12
anti-Mnt
control shRNA
85
Mr(K)
198
116
54
anti-Cdc20
85
Mr(K)198
116
54
37
85
Mr(K)198
116
54
37
anti-tubulin
85
Mr(K) 198
116
54
37
85
Mr(K)
198
116
54
anti-Sp1
85
Mr(K)198
116
54
37
85
Mr(K)198
116
54
37
Mendez Fig S7
© 2010 Macmillan Publishers Limited. All rights reserved.
Related Documents