Mitochondrial Membrane Potential by Object Spot Counting Using Gen5™ to Analyze Mitochondrial Membrane Potential A p p l i c a t i o n N o t e Cell Biology, Cell Imaging BioTek Instruments, Inc. P.O. Box 998, Highland Park, Winooski, Vermont 05404-0998 USA Phone: 888-451-5171 Outside the USA: 802-655-4740 Email: [email protected] www.biotek.com Copyright © 2017 Sarah Beckman, PhD, Principal Scientist, BioTek Instruments, Inc., Winooski, VT USA Nadia A. Rana, PhD, Enzo Life Sciences, Inc., Farmingdale, NY USA Key Words: Mithocondrial Membrane Potential Spot Counting Introduction The mitochondrion is a highly dynamic organelle, often called the “powerhouse of the cell” for its ability to produce cellular energy in an efficient manner. Mitochondria are the primary manufacturers of ATP, but they also regulate iron homeostasis and the production of free radicals 1 . Mitochondria have a duality of function in that they are involved in the maintenance of viability and vitality, but also play a role in the regulation of apoptotic cell death. Studies have demonstrated that metabolic control through mitochondria is not only related to cell fate, but also plays an important role in differentiation 2 . These diverse functions of mitochondria are all at some point dependent on the mitochondrial membrane potential (MMP). Mitochondrial respiration generates an electrochemical gradient of protons made up mostly of a negative electrical potential difference across the mitochondrial inner membrane 3 . During mitochondrial oxidative phosphorylation, the transfer of electrons through electron transport chain (ETC) complexes I-IV in the inner mitochondrial membrane provides the energy to drive protons against their concentration gradient across the inner mitochondrial membrane (out of the mitochondrial cytoplasm). The result of this process is an accumulation of H+ outside the membrane, which then flow back into the mitochondria through Complex V, thus producing ATP 4 . This accumulation of H+ results in an electrochemical gradient, otherwise known as MMP. Mitochondria are present in most of the cells in a living organism, and as such, they are implicated in a wide variety of diseases. Defects in the transfer of electrons across the mitochondrial membrane can cause electrons to accumulate on the ETC complexes and enhance reactive oxygen species (ROS) production. This accumulation increases the potential for electrons to bind with free oxygen species and contributes to many pathological conditions including degenerative diseases, cancer, and aging 5 . Disruption of MMP is one of the earliest intracellular events to occur following induction of apoptosis. In mammalian cells, three responses of mitochondria following a death signal have been noted: a transient hyperpolarization of MMP, a subsequent substantial depolarization of MMP, and, in selected settings, the release of cytochrome c 6-7 . Thus, cell-based assays for analysis of MMP are extremely valuable in order to obtain insights into both cell disease and viability. Evaluating the functional status of mitochondria is critical to elucidating the role of mitochondrial activity in drug-induced toxicity, apoptosis, stem cells, and other cellular and biochemical processes. Quantitative microscopy of the intracellular distribution of membrane-permeant cationic Abstract Mitochondria are critical organelles involved in the maintenance of viability and vitality. However, mitochondria are also often involved in cell death and disease. These diverse functions of mitochondria are all at some point dependent on the mitochondrial membrane potential (MMP). Thus, analysis of membrane potential is of extreme value in order to obtain insights into both basic energy metabolism and its dysfunction. Here, we describe the use of a cationic MMP-sensitive fluorescent probe in combination with object-based spot counting analysis to assess the effects of carbonyl cyanide 3-chlorophenylhydrazone (CCCP) and ethanol (EtOH) on MMP. It was found that CCCP depolarized MMP in a concentration dependent manner. In contrast, ETOH first hyperpolarized the MMP, and subsequently depolarized at concentrations above 3%.

Welcome message from author
This document is posted to help you gain knowledge. Please leave a comment to let me know what you think about it! Share it to your friends and learn new things together.
Transcript
Mitochondrial Membrane Potential by Object Spot Counting Using Gen5™ to Analyze Mitochondrial Membrane Potential
A p p l i c a t i o n N o t e
Cell Biology, Cell Imaging
BioTek Instruments, Inc.P.O. Box 998, Highland Park, Winooski, Vermont 05404-0998 USAPhone: 888-451-5171 Outside the USA: 802-655-4740 Email: [email protected] www.biotek.comCopyright © 2017
Sarah Beckman, PhD, Principal Scientist, BioTek Instruments, Inc., Winooski, VT USANadia A. Rana, PhD, Enzo Life Sciences, Inc., Farmingdale, NY USA
Key Words:
Mithocondrial Membrane Potential
Spot Counting
Introduction
The mitochondrion is a highly dynamic organelle, often called the “powerhouse of the cell” for its ability to produce cellular energy in an efficient manner. Mitochondria are the primary manufacturers of ATP, but they also regulate iron homeostasis and the production of free radicals1. Mitochondria have a duality of function in that they are involved in the maintenance of viability and vitality, but also play a role in the regulation of apoptotic cell death. Studies have demonstrated that metabolic control through mitochondria is not only related to cell fate, but also plays an important role in differentiation2. These diverse functions of mitochondria are all at some point dependent on the mitochondrial membrane potential (MMP).
Mitochondrial respiration generates an electrochemical gradient of protons made up mostly of a negative electrical potential difference across the mitochondrial inner membrane3. During mitochondrial oxidative phosphorylation, the transfer of electrons through electron transport chain (ETC) complexes I-IV in the inner mitochondrial membrane provides the energy to drive protons against their concentration gradient across the inner mitochondrial membrane (out of the mitochondrial cytoplasm). The result of this process is an accumulation of H+ outside the membrane, which then flow back into the mitochondria through Complex V, thus producing ATP4. This accumulation of H+ results in an
electrochemical gradient, otherwise known as MMP.
Mitochondria are present in most of the cells in a living organism, and as such, they are implicated in a wide variety of diseases. Defects in the transfer of electrons across the mitochondrial membrane can cause electrons to accumulate on the ETC complexes and enhance reactive oxygen species (ROS) production. This accumulation increases the potential for electrons to bind with free oxygen species and contributes to many pathological conditions including degenerative diseases, cancer, and aging5. Disruption of MMP is one of the earliest intracellular events to occur following induction of apoptosis. In mammalian cells, three responses of mitochondria following a death signal have been noted: a transient hyperpolarization of MMP, a subsequent substantial depolarization of MMP, and, in selected settings, the release of cytochrome c6-7.
Thus, cell-based assays for analysis of MMP are extremely valuable in order to obtain insights into both cell disease and viability. Evaluating the functional status of mitochondria is critical to elucidating the role of mitochondrial activity in drug-induced toxicity, apoptosis, stem cells, and other cellular and biochemical processes. Quantitative microscopy of the intracellular distribution of membrane-permeant cationic
Abstract
Mitochondria are critical organelles involved in the maintenance of viability and vitality. However, mitochondria are also often involved in cell death and disease. These diverse functions of mitochondria are all at some point dependent on the mitochondrial membrane potential (MMP). Thus, analysis of membrane potential is of extreme value in order to obtain insights into both basic energy metabolism and its dysfunction. Here, we describe the use of a cationic MMP-sensitive fluorescent probe in combination with object-based spot counting analysis to assess the effects of carbonyl cyanide 3-chlorophenylhydrazone (CCCP) and ethanol (EtOH) on MMP. It was found that CCCP depolarized MMP in a concentration dependent manner. In contrast, ETOH first hyperpolarized the MMP, and subsequently depolarized at concentrations above 3%.
2
Application Note Cell Biology, Cell Imaging
fluorophores provides a means to measure MMP in live cultured cells3. Here we describe the use of a such a fluorescent probe in combination with object-based spot counting analysis to assess the effects of carbonyl cyanide 3-chlorophenylhydrazone (CCCP) and ethanol on MMP. We perform analysis using Gen5™ 3.03 with object spot counting capability, which allows us to accurately and efficiently determine the number of MITO-ID MP positive aggregates per cell.
Materials and Methods
Cell Culture
HeLa cells were grown in Advanced Dulbecco’s Modi-fied Eagle’s Medium (DMEM) (Gibco, Grand Island, NY) with 10% FBS (Gibco) and 1x PennStrep-Gluta-mine (Cellgro, Manassas, VA). Cells were seeded into black sided clear bottom 96-well microplates (Corning, Corning, NY) at 20,000 cells per well.
MITO-ID Membrane Potential Detection Kit
The MITO-ID Membrane Potential Detection Kit (do-nated by Enzo Life Sciences, Farmingdale, NY) was used to assess the change in MMP in perturbed HeLa cells. The probe is a cationic carbocyanine dye with a polychro-matic fluorescent emission in which the dye fluoresces green or red, depending upon MMP. In normal healthy cells with an established proton gradient across the mi-tochondrial membrane, the cationic probe is largely driven into the organelle where it exists as red fluores-cent aggregates; yet a portion of the dye remains as a green fluorescent monomer in the cytosol. The relative proportion of these localizations, aggregations and re-sultant fluorescence is dictated by the magnitude of the MMP. Hyperpolarized cells tend to exhibit more red fluo-rescence. As the mitochondrial membrane de-polarizes (MMP reduces), the cationic probe’s tendency to follow the electrical gradient is reduced and preferentially ex-ists as a green-fluorescent monomer in the cytosol.
Prior to MITO-ID Membrane Potential (MP) detection, HeLa cells were treated either with 0.5 – 16 µM of car-bonyl cyanide 3-chlorophenylhydrazone (CCCP) for 30 minutes or 0.375% - 6% ethanol (EtOH) for 6 hours. Following treatment, cells were washed 2x with 100 µL 1x assay solution prepared according to the manufac-ture’s protocol. Next, the assay solution was replaced with 100 µL detection reagent (1mL assay solution + 2 µL Hoechst + 15 µL MITO-ID MP Detection Reagent) for 15 minutes at room temperature in the dark. The detection reagent was prepared immediately prior to use. Finally, the cells were washed once with assay solution and were imaged right away.
Cell Imaging
Images were acquired using a 20x objective on the Lionheart™ FX Automated Microscope (BioTek Instru-ments, Winooski, VT) configured with DAPI, GFP, and Tex-as Red light cubes. The DAPI light cube is configured with a 377/50 excitation filter and a 447/60 emission filter. The GFP light cube uses a 469/35 excitation filter and a 525/39 emission filter. The Texas Red light cube uses a 585/29 ex-citation filter and a 624/40 emission filter. Images were taken by automatically focusing on the DAPI channel, with an offset of 10-12 on the GFP and Texas Red channels.
Image Analysis
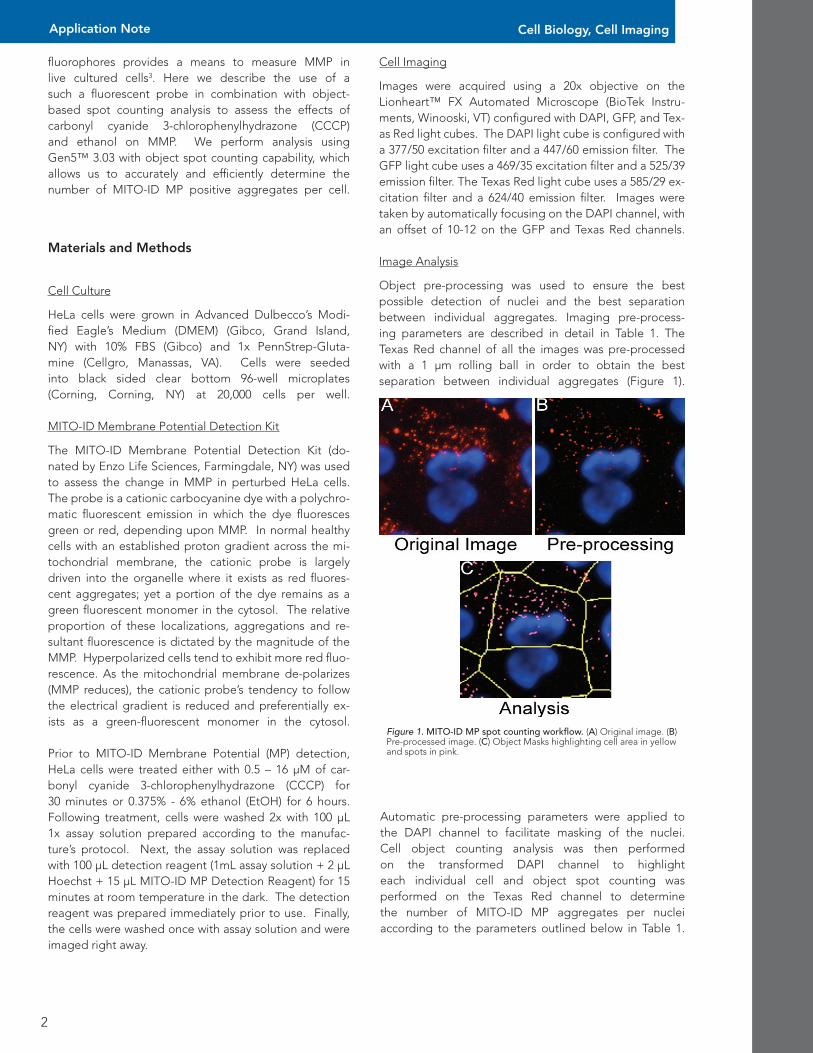
Object pre-processing was used to ensure the best possible detection of nuclei and the best separation between individual aggregates. Imaging pre-process-ing parameters are described in detail in Table 1. The Texas Red channel of all the images was pre-processed with a 1 µm rolling ball in order to obtain the best separation between individual aggregates (Figure 1).
Figure 1. MITO-ID MP spot counting workflow. (A) Original image. (B) Pre-processed image. (C) Object Masks highlighting cell area in yellow and spots in pink.
Automatic pre-processing parameters were applied to the DAPI channel to facilitate masking of the nuclei. Cell object counting analysis was then performed on the transformed DAPI channel to highlight each individual cell and object spot counting was performed on the Texas Red channel to determine the number of MITO-ID MP aggregates per nuclei according to the parameters outlined below in Table 1.
3
Application Note Cell Biology, Cell Imaging
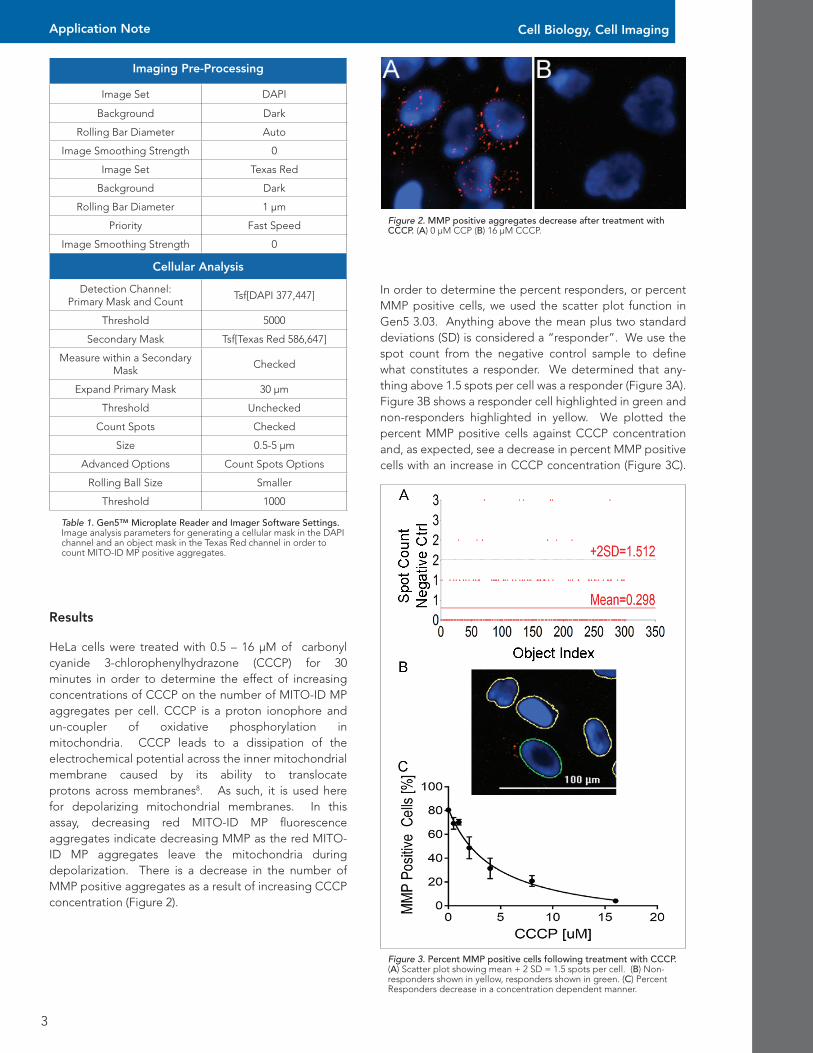
Figure 2. MMP positive aggregates decrease after treatment with CCCP. (A) 0 µM CCP (B) 16 µM CCCP.
Results
HeLa cells were treated with 0.5 – 16 µM of carbonyl cyanide 3-chlorophenylhydrazone (CCCP) for 30 minutes in order to determine the effect of increasing concentrations of CCCP on the number of MITO-ID MP aggregates per cell. CCCP is a proton ionophore and un-coupler of oxidative phosphorylation in mitochondria. CCCP leads to a dissipation of the electrochemical potential across the inner mitochondrial membrane caused by its ability to translocate protons across membranes8. As such, it is used here for depolarizing mitochondrial membranes. In this assay, decreasing red MITO-ID MP fluorescence aggregates indicate decreasing MMP as the red MITO-ID MP aggregates leave the mitochondria during depolarization. There is a decrease in the number of MMP positive aggregates as a result of increasing CCCP concentration (Figure 2).
In order to determine the percent responders, or percent MMP positive cells, we used the scatter plot function in Gen5 3.03. Anything above the mean plus two standard deviations (SD) is considered a “responder”. We use the spot count from the negative control sample to define what constitutes a responder. We determined that any-thing above 1.5 spots per cell was a responder (Figure 3A). Figure 3B shows a responder cell highlighted in green and non-responders highlighted in yellow. We plotted the percent MMP positive cells against CCCP concentration and, as expected, see a decrease in percent MMP positive cells with an increase in CCCP concentration (Figure 3C).
Imaging Pre-Processing
Image Set DAPI
Background Dark
Rolling Bar Diameter Auto
Image Smoothing Strength 0
Image Set Texas Red
Background Dark
Rolling Bar Diameter 1 µm
Priority Fast Speed
Image Smoothing Strength 0
Cellular Analysis
Detection Channel: Primary Mask and Count
Tsf[DAPI 377,447]
Threshold 5000
Secondary Mask Tsf[Texas Red 586,647]
Measure within a Secondary Mask
Checked
Expand Primary Mask 30 µm
Threshold Unchecked
Count Spots Checked
Size 0.5-5 µm
Advanced Options Count Spots Options
Rolling Ball Size Smaller
Threshold 1000
Table 1. Gen5™ Microplate Reader and Imager Software Settings. Image analysis parameters for generating a cellular mask in the DAPI channel and an object mask in the Texas Red channel in order to count MITO-ID MP positive aggregates.
Figure 3. Percent MMP positive cells following treatment with CCCP. (A) Scatter plot showing mean + 2 SD = 1.5 spots per cell. (B) Non-responders shown in yellow, responders shown in green. (C) Percent Responders decrease in a concentration dependent manner.

4
Application Note Cell Biology, Cell Imaging
Figure 4. MMP positive aggregates in HeLa cells after treatment with EtOH. (A) 0 uM EtOH (B) 0.75% EtOH (C) 3% EtOH (D) 6% EtOH.
HeLa cells were treated with 0.375 – 6 percent EtOH for 6 hours in order to determine the effect of increas-ing concentrations of EtOH on the number of MMP positive aggregates per cell. Changes in MITO-ID MP fluorescence indicated an initial hyperpolarization of the mitochondrial membrane followed by a decrease in polarization with the highest concentration of EtOH (Figure 4). This is consistent with previous stud-ies where ethanol at lower concentrations caused hyperpolarization of the mitochondrial mem-brane in ARPE-19 cells and higher concentrations of ethanol resulted in membrane depolarization9.
We again used the spot count from the negative con-trol sample of this experiment to decide what con-stitutes a responder. We determined that anything above 37 spots per cell was a responder (Figure 5A). Figure 5B shows responder cells highlighted in green and a non-responder highlighted in yellow. We plot-ted the percent MMP positive cells against EtOH treatment and see an increase in percent MMP posi-tive cells up to 3% EtOH and then a decrease in MMP positive cells at treatments above 3% (Figure 5C).
Figure 5. Percent MMP positive cells following treatment with EtOH. (A) Scatter plot showing mean + 2 SD = 37 spots per cell. (B) Non-responders shown in yellow, responders shown in green. (C) Percent Responders show initial increase with EtOH treatment followed by a decrease at concentrations above 3%.
Conclusions
In this study, we employed MITO-ID Membrane Poten-tial Dye in combination with the Lionheart™ FX Auto-mated Microscope and Gen5™ Microplate Reader and Imager Software to assess the effects of CCCP and EtOH treatment on the MMP of HeLa cells. MMP was quanti-fied by analysis of MITO-ID MP positive aggregates in cells using the Gen5 3.03 object spot counting feature. Spot counting allows for reliable and accurate measure-ments of object level MITO-ID MP aggregate analysis in live cultured cells.
5
Application Note
AN090817_15, Rev. 09/08/17
Cell Biology, Cell Imaging
References
1. Rousselle, C., Ronot, X., Leverve, X. & Mayol, J. Cy-tometric assessment of mitochondria using fluorescent probes. Cytometry Part A 79, 405–425 (2011).
2. Pérez, M. J. J. & Quintanilla, R. A. Development or disease: duality of the mitochondrial permeability transi-tion pore. Dev. Biol. 426, 1–7 (2017).
3. Lemasters, J. J. & Ramshesh, V. K. Imaging of mito-chondrial polarization and depolarization with cationic fluorophores. Methods Cell Biol. 80, 283–95 (2007).
4. Perry, S. W., Norman, J. P., Barbieri, J., Brown, E. B. & Gelbard, H. A. Mitochondrial membrane potential probes and the proton gradient: a practical usage guide. BioTechniques 50, 98–115 (2011).
5. Johannsen, D. L. & Ravussin, E. The role of mito-chondria in health and disease. Curr Opin Pharmacol 9, 780–6 (2009).
6. Gross, A. et al. Biochemical and genetic analysis of the mitochondrial response of yeast to BAX and BCL-X(L). Mol. Cell. Biol. 20, 3125–36 (2000).
7. Farrace, G. M., Piredda, L. & Matarrese, P. Transglu-taminase overexpression sensitizes neuronal cell lines to apoptosis by increasing mitochondrial membrane potential and cellular oxidative stress. Journal of Neuro-chemistry (2002). doi:10.1046/j.1471-4159.2002.00898.x
8. Martin, J, Mahlke, K & Pfanner, N. Role of an ener-gized inner membrane in mitochondrial protein import. Delta psi drives the movement of presequences. Jour-nal of Biological Chemistry (1991). at <http://www.jbc.org/content/266/27/18051.short>
9. Bonet-Ponce, L., Saez-Atienzar, S. & da Casa, C. On the mechanism underlying ethanol-induced mitochon-drial dynamic disruption and autophagy response. Biochimica et Biophysica Acta (2015).
Related Documents