Citation: Cerqueti, R.; Ciciretti, R.; Dalò, A.; Nicolosi, M. Mitigating Contagion Risk by ESG Investing. Sustainability 2022, 14, 3805. https:// doi.org/10.3390/su14073805 Academic Editor: Giuliana Birindelli Received: 2 February 2022 Accepted: 16 March 2022 Published: 23 March 2022 Publisher’s Note: MDPI stays neutral with regard to jurisdictional claims in published maps and institutional affil- iations. Copyright: © 2022 by the authors. Licensee MDPI, Basel, Switzerland. This article is an open access article distributed under the terms and conditions of the Creative Commons Attribution (CC BY) license (https:// creativecommons.org/licenses/by/ 4.0/). sustainability Article Mitigating Contagion Risk by ESG Investing Roy Cerqueti 1,2,3 , Rocco Ciciretti 4 , Ambrogio Dalò 5 and Marco Nicolosi 6, * 1 Department of Social and Economic Sciences, Sapienza University of Rome, 00185 Rome, Italy; [email protected] 2 School of Business, London South Bank University, London SE1 0AA, UK 3 Angevin Research Group in Economics and Management, University of Angers, CEDEX 01, 49036 Angers, France 4 Department of Economics and Finance, Tor Vergata University of Rome, 00133 Rome, Italy; [email protected] 5 Faculty of Economics and Business, University of Groningen, 9747 AE Groningen, The Netherlands; [email protected] 6 Department of Economics, University of Perugia, 06123 Perugia, Italy * Correspondence: [email protected] Abstract: We study whether ESG investing may mitigate the risk of contagion among equity mutual funds. More precisely, we measure the impact of fire-sale spillover, propagating throughout the financial system, on funds ranked on ESG aspects. We compare the relative loss of capitalization experienced by high- and low-ranked funds. Contagion, which is indirect since funds are not exposed to counterparty risk, is modeled using a network structure. In cases of deleveraging from funds, fire- sale spillover propagates throughout the network because of common asset holdings among funds. We find that funds’ vulnerability to contagion decreases when the level of ESG compliance increases. Moreover, the average relative loss is lower for the high-ranked funds than for the low-ranked ones. The small-size funds mainly drive the result. Our findings indicate that contagion is less effective for high-ranked funds. From a macroeconomic perspective, ESG investing represents a new opportunity for diversification that makes the system more resilient to contagion. Keywords: ESG investing; contagion risk; market impact; network; indirect contagion 1. Introduction The integration of environmental, social, and governance (ESG) factors in the invest- ment decision process is becoming a valuable practice among portfolio managers. Strategies that account for ESG information are usually implemented either by excluding from the investment universe assets in controversial business sectors (negative screening) or by tilting portfolios towards the assets with the highest ESG ranks (best-in-class strategies). The literature on ESG investing mainly focuses on the relationship between the fi- nancial profitability of an investment and its ESG rate. The evidence on the sign of such a relationship is still mixed; it depends on the analyzed period and market and the ESG rating system used. For example, Ref. [1] found that ESG funds significantly underperform conventional funds. Similarly, Ref. [2] showed that a fund’s risk-adjusted returns decrease with the level of the fund’s ESG score. Ref. [3] introduced a latent variable to measure ESG compliance and found a positive relationship between such a variable and portfolio financial performance. Ref. [4] analyzed the impact of negative screening on the efficient frontier, finding that screening impacts significantly on the opportunity set only when it is based on the environmental criterion. Refs. [5,6] found that, by tilting their portfolios towards assets with higher ESG scores, the investors can earn positive risk-adjusted returns. However, the return advantages are offset by the adoption of negative screening criteria that exclude sin stocks from the opportunity set. Indeed, systematic screening of certain assets leads to a return premium on the screened assets in equilibrium (see e.g., [7–10]). Sustainability 2022, 14, 3805. https://doi.org/10.3390/su14073805 https://www.mdpi.com/journal/sustainability

Welcome message from author
This document is posted to help you gain knowledge. Please leave a comment to let me know what you think about it! Share it to your friends and learn new things together.
Transcript
Citation: Cerqueti, R.; Ciciretti, R.;
Dalò, A.; Nicolosi, M. Mitigating
Contagion Risk by ESG Investing.
Sustainability 2022, 14, 3805. https://
doi.org/10.3390/su14073805
Academic Editor: Giuliana Birindelli
Received: 2 February 2022
Accepted: 16 March 2022
Published: 23 March 2022
Publisher’s Note: MDPI stays neutral
with regard to jurisdictional claims in
published maps and institutional affil-
iations.
Copyright: © 2022 by the authors.
Licensee MDPI, Basel, Switzerland.
This article is an open access article
distributed under the terms and
conditions of the Creative Commons
Attribution (CC BY) license (https://
creativecommons.org/licenses/by/
4.0/).
sustainability
Article
Mitigating Contagion Risk by ESG InvestingRoy Cerqueti 1,2,3 , Rocco Ciciretti 4 , Ambrogio Dalò 5 and Marco Nicolosi 6,*
1 Department of Social and Economic Sciences, Sapienza University of Rome, 00185 Rome, Italy;[email protected]
2 School of Business, London South Bank University, London SE1 0AA, UK3 Angevin Research Group in Economics and Management, University of Angers, CEDEX 01, 49036 Angers,
France4 Department of Economics and Finance, Tor Vergata University of Rome, 00133 Rome, Italy;
[email protected] Faculty of Economics and Business, University of Groningen, 9747 AE Groningen, The Netherlands;
[email protected] Department of Economics, University of Perugia, 06123 Perugia, Italy* Correspondence: [email protected]
Abstract: We study whether ESG investing may mitigate the risk of contagion among equity mutualfunds. More precisely, we measure the impact of fire-sale spillover, propagating throughout thefinancial system, on funds ranked on ESG aspects. We compare the relative loss of capitalizationexperienced by high- and low-ranked funds. Contagion, which is indirect since funds are not exposedto counterparty risk, is modeled using a network structure. In cases of deleveraging from funds, fire-sale spillover propagates throughout the network because of common asset holdings among funds.We find that funds’ vulnerability to contagion decreases when the level of ESG compliance increases.Moreover, the average relative loss is lower for the high-ranked funds than for the low-ranked ones.The small-size funds mainly drive the result. Our findings indicate that contagion is less effective forhigh-ranked funds. From a macroeconomic perspective, ESG investing represents a new opportunityfor diversification that makes the system more resilient to contagion.
Keywords: ESG investing; contagion risk; market impact; network; indirect contagion
1. Introduction
The integration of environmental, social, and governance (ESG) factors in the invest-ment decision process is becoming a valuable practice among portfolio managers. Strategiesthat account for ESG information are usually implemented either by excluding from theinvestment universe assets in controversial business sectors (negative screening) or bytilting portfolios towards the assets with the highest ESG ranks (best-in-class strategies).
The literature on ESG investing mainly focuses on the relationship between the fi-nancial profitability of an investment and its ESG rate. The evidence on the sign of sucha relationship is still mixed; it depends on the analyzed period and market and the ESGrating system used. For example, Ref. [1] found that ESG funds significantly underperformconventional funds. Similarly, Ref. [2] showed that a fund’s risk-adjusted returns decreasewith the level of the fund’s ESG score. Ref. [3] introduced a latent variable to measureESG compliance and found a positive relationship between such a variable and portfoliofinancial performance. Ref. [4] analyzed the impact of negative screening on the efficientfrontier, finding that screening impacts significantly on the opportunity set only when itis based on the environmental criterion. Refs. [5,6] found that, by tilting their portfoliostowards assets with higher ESG scores, the investors can earn positive risk-adjusted returns.However, the return advantages are offset by the adoption of negative screening criteriathat exclude sin stocks from the opportunity set. Indeed, systematic screening of certainassets leads to a return premium on the screened assets in equilibrium (see e.g., [7–10]).
Sustainability 2022, 14, 3805. https://doi.org/10.3390/su14073805 https://www.mdpi.com/journal/sustainability

Sustainability 2022, 14, 3805 2 of 13
In turn, a systematic lower demand for the screened assets leads to lower prices and thusto higher expected returns. Consistently with such theoretical prediction, Refs. [11,12]documented that the so-called “sin” stocks deliver higher returns. Such a higher returnis justified by the higher riskiness of sin stocks measured for example, via the impliedvolatility [13].
Most studies have found no statistical difference in the financial performance betweenhigh-ESG-ranked funds and conventional funds. Among them we cite [14–16]. It is still un-clear if the mixed evidence provided so far is the product of methodological issues [17,18],or is driven by the heterogeneous nature of the ESG dimensions [19].
From a different perspective, we have found evidence in the literature that investingin assets that are high-ranked on ESG reduces the risk of the investment. Firms showinghigher levels of compliance with the ESG dimensions mitigate the risk of disputes with thestakeholders [20], lower their exposition to crash risk [21], and reduce the probability ofdefault [22]. Ref. [23] showed that responsible firms with higher product diversificationare less exposed to market risk. Ref. [24] found that firms showing high compliance withthe social dimension performed better than firms with poor social performance during the2008–2009 financial crisis. Similarly, Ref. [25] found that, during crisis periods, high-ESG-ranked funds experienced lower downside risk than conventional funds. Even during therecent COVID-19 crisis, ESG investments outperformed conventional ones [26]. In general,ESG investments are perceived as a form of insurance against the higher volatility levelsfaced by the investors during crisis periods [27]. Consistent with such a finding, Ref. [28]provided empirical evidence that a system of high-ranked ESG funds presents a solid abilityto absorb external shocks, mainly if the involved funds have a small market capitalization.
The capability of high-ESG-ranked assets to reduce risk exposures appears to be awell-established feature of ESG investments, even if the literature has not been able so farto unequivocally disentangle the existing relation between ESG rates and asset returns.Hence, the investors may benefit from a general risk reduction by tilting their portfoliostowards firms with high ESG scores. This paper aims to analyze the risk associated withESG investment strategies from a systemic point of view by considering a network of equitymutual funds rated on ESG dimensions. In more detail, following [29], we define a fundvulnerability index measuring the risk of contagion for a fund in case of financial distresspropagating throughout the whole network of funds, and we show its relationship withthe fund ESG rate. Moreover, we compute the relative market value loss experienced by afund from fire-sale spillover due to deleveraging from the other funds in the network.
The analysis is performed on a network of more than 5000 funds investing in almost20,000 assets. We rate funds according to the Globe ESG rates released by Morningstar in2018. We model contagion risk by considering a bipartite network. Such a network has twosets of nodes: the first one represents funds, while the second set of nodes contains holdings.Any fund is linked to the nodes representing its holdings, and it is only indirectly connectedwith the other funds in the network through the holdings it has in common with them.Hence, funds in the network are related because of portfolio overlaps in terms of commonasset holdings. In such a context, a fund tends to liquidate part of its portfolio when theinvestors withdraw large amounts of money from the fund [30]. Portfolio deleveragingcauses the lowering of prices of the liquidated assets. Hence, if such a fund is highlyoverlapped with other funds in the network—meaning that a large part of its assets isheld in the portfolio by other funds—the overlapping funds may also experience a largeloss of value. As a consequence, they may start to liquidate their portfolio as well. Sucha mechanism may trigger a cascade of fire-sale spillover that propagates throughout thewhole network, hitting assets and funds that were not shocked at the beginning. Thisis indirect contagion since risk propagation among funds is mediated by the overlapbetween portfolios also in the absence of a direct link (which would be present in the caseof counterparty risk among the nodes).
Indirect contagion among funds has been studied, for example, by [30–32] among theothers. To measure the market impact from portfolio deleveraging, we follow [29,33], who
Sustainability 2022, 14, 3805 3 of 13
modeled the market impact on asset value as a linear function of the assets liquidated [34].Then, we construct the funds’ adjacency matrix associated with the network by computingthe liquidity-weighted overlap for any pair of funds in terms of common holdings. In theoverlap, any asset weights differently according to its market depth. A more liquid asset,having a higher market depth, has a lower weight in portfolio overlap since its marketvalue loss from deleveraging is lower. On the contrary, a less liquid asset with a lowermarket depth weighs more in the overlap since it is more responsible for risk propagation.
Given the overlap structure between portfolios, we compute the vulnerability indexfor any fund as defined in [29], measuring the percentage relative loss of market valueexperienced by a fund when any other fund in the network liquidates 1% of its assets. Wefind that the vulnerability index for the funds decreases when the level of ESG complianceincreases. In particular, the vulnerability index for the funds with the lowest ESG ratesis on average 50% higher with respect to the highest ESG-ranked funds. Moreover, fordifferent fractions of liquidated assets and different levels of ESG compliance, we measurethe relative market value that each fund loses when all funds in the network liquidate afraction of their portfolios. Results show that the average loss is lower for the highest ESG-ranked funds in all cases. In particular, liquidation of 10% of the assets provides a systemicaverage relative loss of market value which is 98% higher for the lowest ESG-ranked fundsthan for the highest ESG-ranked funds. The same analysis is also performed by measuringthe impact of fire-sale spillover for the large- and the small-size funds within the highestand lowest ESG categories. We find that the small and highest-ranked funds experience alower loss than the small and lowest-ranked ones. However, for the large funds, the impactof contagion is comparable for the two ESG categories.
Our findings indicate that fire-sale spillover from asset liquidation by funds in thenetwork has a lower impact on the funds with a higher level of ESG compliance. Thepaper contributes to the literature on ESG investing from a new perspective. Most literatureanalyzes the risk associated with ESG investing by considering each fund or asset as a stand-alone entity. We instead consider funds as interrelated entities, and the risk of ESG investingis measured in relation to the whole system. In such a framework, highly ranked fundsin ESG dimensions seem to be less affected by fire-sale spillover propagating throughoutthe network. Under this perspective, ESG investing appears to be a new opportunity fordiversification for the investors [35] that reduces the exposure to contagion risk. Usefulimplications are also for policymakers, who may promote the implementation of ESG-basedstrategies to make the financial system more resilient to systemic events.
The paper is organized as follows. Section 2 sets the hypothesis to test. Section 3introduces the model, defines the vulnerability index for a fund, and provides a measure ofthe relative market value loss from portfolio liquidation. Section 4 describes the dataset andpresents the results. Section 5 concludes. Section 6 discusses the limitations and possiblefuture extensions of the present analysis.
2. Research Hypothesis
We measure the relative loss experienced by funds in the case of deleveraging fromall the funds in the network. We test the alternative hypothesis H1—the average relativeloss for the high-ranked funds LHigh is lower than the average relative loss for the low-ranked funds LLow—against the null hypothesis H0–there is no significant difference inthe averages—
H0 : LHigh = LLow
H1 : LHigh < LLow.
The same hypothesis is also tested by considering the response of large-size andsmall-size funds within the high- and low-ESG categories.
Our hypothesis is motivated by three main aspects. First, the higher ESG-rankedfunds tend to hold assets with higher ESG scores [36]. Such a set of assets also includes non-

Sustainability 2022, 14, 3805 4 of 13
mainstream assets. By shifting the opportunity set towards the higher-ESG-ranked assets,funds exploit a different market segment and reduce their overlap with the other funds inthe network. Lower portfolio overlap is usually associated with a mitigation of the risk ofindirect contagion, leading to a reduction in systemic risk. In line with this argument, wecite [31], who considered a bipartite network of funds and assets and provided a measureof the overlap of funds in the market. Their results indicate that funds investing in lesspopular assets are less exposed to fire-sale spillover, and therefore such funds experiencedlower losses during the 2008 financial crisis. The second aspect is that the demand forhigh-ESG-ranked assets is usually driven by investors’ preference for such stocks. Indeed,responsible investors also consider personal and societal values in their investment decisionprocess [2,37]. Hence, such investors rely on longer-term strategies and are less inclinedto liquidate their portfolios in cases of financial distress. As such, high-ESG-ranked fundsare less affected by fire-sale spillover from deleveraging. Third, following the generaldiscussion in the Introduction, firms that are highly compliant with ESG factors are lessexposed to the stakeholder risk, hence making the investment less risky.
3. The Model
A bipartite network, with two distinct sets of nodes, is the standard framework tostudy indirect contagion among funds. Funds are modeled as nodes in the first set, whiletheir holdings belong to the second set of nodes. There is no direct link between two fundsin such a bipartite network. This feature reflects that two funds are not reciprocally exposedto counterparty risk. Instead, any fund is directly linked only to its constituencies and, as aconsequence, two funds are indirectly connected because of common asset holdings.
A fund exposed to large outflows reduces its position to refund investors withdrawingmoney from the fund [30]. Liquidated assets undergo a drop in value, the extent of whichdepends on how liquid the assets are. The loss in value of such assets also impacts thevalue of other funds exposed to those assets. This fact may also force other funds, sharingwith the first fund part of their assets, to liquidate their portfolios, thus causing a furtherdrop in values of the common assets and a drop in the value of the other assets in theportfolio. Contagion is indirect since it is not due to direct exposure of one fund to anotherfund. Instead, it is due to fund exposure to the same assets. Therefore, portfolio overlaps,as measured by common asset holdings, mediate the propagation of fire-sale spilloverthroughout the network.
Two key ingredients are needed to evaluate the impact of contagion in the network.The first one is the matrix h of portfolio holdings whose generic element hik provides thenumber of shares of asset k = 1, . . . , NA held by fund i = 1, . . . , NF, where NA and NF arethe number of assets and the number of funds, respectively. By denoting with pk the priceof asset k, the market value MVi of fund i is then obtained as
MVi =NA
∑k=1
hik pk. (1)
The second ingredient is a price impact function modeling the effect of liquidation onassets. We use the linear price impact model [34] as in [29,33]. Liquidation of x shares ofasset k causes a drop in its value ∆pk given by
∆pkpk
=x
λk, (2)
where λk is a measure of liquidity for asset k, which is known as market depth. Themore liquid an asset, the higher its market depth, the lower the impact on its price from
Sustainability 2022, 14, 3805 5 of 13
liquidation. For each asset k, market depth may be estimated from market data as describedin [38] or [39], according to the following ratio
λk = cADTVk
σk(3)
where c is a constant that is independent from the asset, ADTVk is the average daily tradingvolume for asset k, and σk is its volatility.
When fund j liquidates a percentage ε j of its holdings, it causes price pressure on theliquidated assets according to Equation (2). Then, fund i undergoes a loss in market value∆MVij because of the assets in common with fund j. Such a loss is expressed as
∆MVij =NA
∑k=1
hikpkλk
hjkε j. (4)
where we used Equations (1) and (2) with x = hjkε j.The loss in market value in Equation (4) may be expressed in terms of the adjacency
matrix Ω associated to the network. Its generic (i, j) element
Ωij =NA
∑k=1
hikpkλk
hjk, (5)
for i, j = 1, . . . , NF measures the portfolio liquidity-weighted overlap between funds i andj. Then, Equation (4) reads
∆MVij = Ωijε j.
Note that in the overlap any asset in common has a weight according to the inverse ofits liquidity factor. This feature of the model accounts for the fact that a more liquid asset isless affected by liquidation, hence it makes the network more resilient to contagion.
We now compute the relative loss of market value Li experienced by fund i when anyother fund j liquidates a percentage ε j of its assets
Li =1
MVi
NF
∑j 6=i
Ωijε j, (6)
where the effect of liquidation by fund i to itself is not accounted for. Following [29], wedefine the fund vulnerability index VIi for fund i as
VIi =1
MVi
NF
∑j 6=i
Ωij. (7)
Such an index is a measure, in terms of relative market value loss, of the vulnerabilityof a fund to contagion from other funds in the network starting deleveraging. Indeed,the vulnerability index for fund i provides the percentage relative loss in market valueexperienced by fund i when all the other funds liquidate 1% of their assets. This is obtainedby Equation (6) when ε j = 1% for all j = 1, . . . NF.
4. Empirical Analysis
In this section we first describe the dataset and the empirically obtained network.Then, we compute the vulnerability to contagion for each fund in the network, and wecompare the average relative loss of market value due to portfolio liquidation experiencedby the highest-ranked funds with that for the lowest-ranked funds.
Sustainability 2022, 14, 3805 6 of 13
4.1. Dataset Description
We consider a cross-section of equity mutual funds, investing either globally or in aspecific country region, rated on ESG factors by Morningstar in 2018. The initial sampleconsists of 9849 open-end equity mutual funds investing in 28,561 assets. The dataset isbuilt by matching information from different databases. Morningstar Direct (MD) providesESG rates for different fund share classes. Fund share classes are aggregated to a singlefund using the fund identifier (FundId) in MD [40]. Portfolio holdings are obtained fromMorningstar European Data Warehouse (EDW) for each fund. Financial data as tradingvolumes or returns for the assets are taken from Refinitiv (DATASTREAM).
Standard cleaning criteria are applied to the sample before carrying out the analysis.We keep in the sample only funds whose total capitalization is provided and for whichholding weights account for at least 80% of portfolio capitalization. Moreover, funds whoseholding-weight sum is greater than one are eliminated. To ensure a minimum level of funddiversification, we eliminate from the sample those funds that are too small in terms ofcapitalization (cut-off at the 2.5-th percentile) or of the number of assets in the portfolio(cut-off at the 2.5-th percentile). The screened sample consists of funds having at least acapitalization of 100,000 USD and investing in at least 14 assets. The filter on very smallfunds does not impact the results since such funds account for less than 0.05% of the totalcapitalization. Moreover, they are poorly overlapped with the other funds in the network.Hence, they are irrelevant from a systemic point of view. Screening criteria are also used atthe asset level. We keep in the sample only assets with daily observations of the returns andtrading volumes over one past year (by taking as a reference date the middle of the year,we consider the time-span end of June 2017–end of June 2018). This leads to an estimationsample of NF = 5625 funds investing in NA = 19,985 assets. Portfolio holdings are thennormalized to one for each fund in the sample.
The Morningstar Sustainability Rating System rates funds according to five classes:High (H), Above Average (AA), Average (A), Below Average (BA), and Low (L). Morn-ingstar ratings are based on company ESG scores. To receive a portfolio ESG score, at least67% of the assets under management in the fund must have a company ESG score. H(L)funds are those in the top (bottom) 10% of the score distribution. BA funds have a score thatis between the 10-th percentile and the 32.5-th percentile of the score distribution. A fundsare those in the next 35% of the distribution. AA funds are ranked in the range between the67.5-th percentile and the 90-th percentile. (For further details see the Morningstar Sustain-ability Rating at https://www.morningstar.com/content/dam/marketing/shared/research/methodology/744156_Morningstar_Sustainability_Rating_for_Funds_Methodology.pdf,accessed on 31 January 2022). Out of NF = 5625 mutual funds in our sample, 530 are rankedas L, 1312 as BA, 2020 as A, 1272 as AA, and 491 funds are ranked as H.
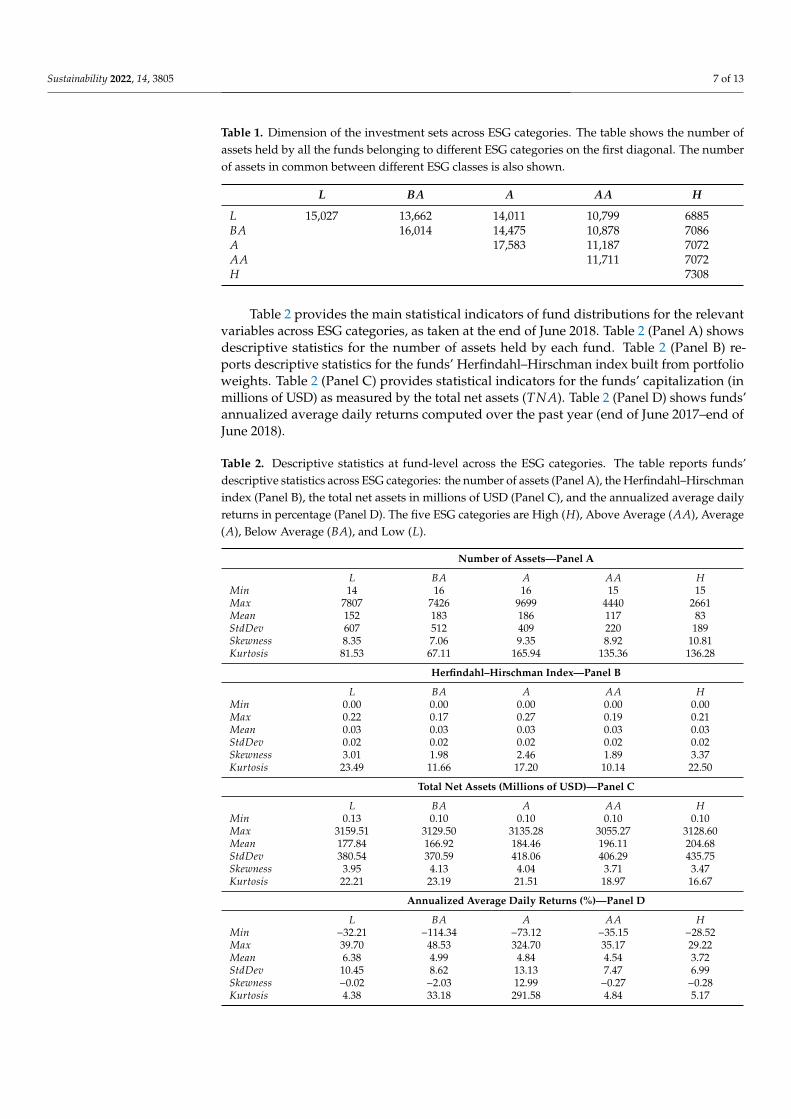
Funds belonging to different ESG categories invest in different sets of assets thatintersect with each other. Table 1 reports the dimension of the investment sets for thedifferent ESG categories as well as the number of assets in common. For example, Table 1shows that the High-ranked funds invest globally in 7308 assets. Low-ranked funds investin 15,027 assets. Out of 15,027 assets, 6885 are in common with the investment set of theHigh-ESG-ranked funds. By looking at the last column, we see that the High-ESG-rankedfunds are those with the lowest number of assets in common with the funds in the othercategories. This is, of course, due to the fact that by tilting their portfolios towards the assetswith the higher ESG performance, the High-ESG-ranked funds shift their opportunity settowards a segment of the market that the other funds do not exploit. This feature lowersthe overlap of such funds with the other funds in the network.
Sustainability 2022, 14, 3805 7 of 13
Table 1. Dimension of the investment sets across ESG categories. The table shows the number ofassets held by all the funds belonging to different ESG categories on the first diagonal. The numberof assets in common between different ESG classes is also shown.
L BA A AA H
L 15,027 13,662 14,011 10,799 6885BA 16,014 14,475 10,878 7086A 17,583 11,187 7072AA 11,711 7072H 7308
Table 2 provides the main statistical indicators of fund distributions for the relevantvariables across ESG categories, as taken at the end of June 2018. Table 2 (Panel A) showsdescriptive statistics for the number of assets held by each fund. Table 2 (Panel B) re-ports descriptive statistics for the funds’ Herfindahl–Hirschman index built from portfolioweights. Table 2 (Panel C) provides statistical indicators for the funds’ capitalization (inmillions of USD) as measured by the total net assets (TNA). Table 2 (Panel D) shows funds’annualized average daily returns computed over the past year (end of June 2017–end ofJune 2018).
Table 2. Descriptive statistics at fund-level across the ESG categories. The table reports funds’descriptive statistics across ESG categories: the number of assets (Panel A), the Herfindahl–Hirschmanindex (Panel B), the total net assets in millions of USD (Panel C), and the annualized average dailyreturns in percentage (Panel D). The five ESG categories are High (H), Above Average (AA), Average(A), Below Average (BA), and Low (L).
Number of Assets—Panel A
L BA A AA HMin 14 16 16 15 15Max 7807 7426 9699 4440 2661Mean 152 183 186 117 83StdDev 607 512 409 220 189Skewness 8.35 7.06 9.35 8.92 10.81Kurtosis 81.53 67.11 165.94 135.36 136.28
Herfindahl–Hirschman Index—Panel B
L BA A AA HMin 0.00 0.00 0.00 0.00 0.00Max 0.22 0.17 0.27 0.19 0.21Mean 0.03 0.03 0.03 0.03 0.03StdDev 0.02 0.02 0.02 0.02 0.02Skewness 3.01 1.98 2.46 1.89 3.37Kurtosis 23.49 11.66 17.20 10.14 22.50
Total Net Assets (Millions of USD)—Panel C
L BA A AA HMin 0.13 0.10 0.10 0.10 0.10Max 3159.51 3129.50 3135.28 3055.27 3128.60Mean 177.84 166.92 184.46 196.11 204.68StdDev 380.54 370.59 418.06 406.29 435.75Skewness 3.95 4.13 4.04 3.71 3.47Kurtosis 22.21 23.19 21.51 18.97 16.67
Annualized Average Daily Returns (%)—Panel D
L BA A AA HMin −32.21 −114.34 −73.12 −35.15 −28.52Max 39.70 48.53 324.70 35.17 29.22Mean 6.38 4.99 4.84 4.54 3.72StdDev 10.45 8.62 13.13 7.47 6.99Skewness −0.02 −2.03 12.99 −0.27 −0.28Kurtosis 4.38 33.18 291.58 4.84 5.17
Sustainability 2022, 14, 3805 8 of 13
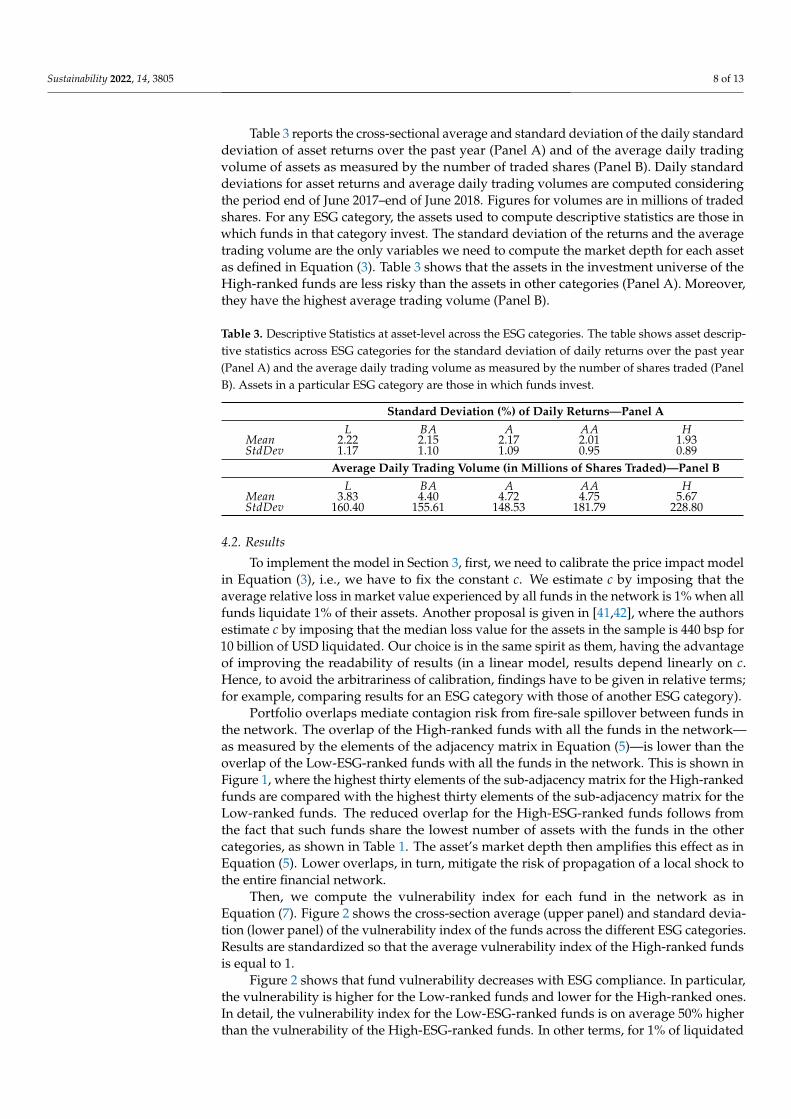
Table 3 reports the cross-sectional average and standard deviation of the daily standarddeviation of asset returns over the past year (Panel A) and of the average daily tradingvolume of assets as measured by the number of traded shares (Panel B). Daily standarddeviations for asset returns and average daily trading volumes are computed consideringthe period end of June 2017–end of June 2018. Figures for volumes are in millions of tradedshares. For any ESG category, the assets used to compute descriptive statistics are those inwhich funds in that category invest. The standard deviation of the returns and the averagetrading volume are the only variables we need to compute the market depth for each assetas defined in Equation (3). Table 3 shows that the assets in the investment universe of theHigh-ranked funds are less risky than the assets in other categories (Panel A). Moreover,they have the highest average trading volume (Panel B).
Table 3. Descriptive Statistics at asset-level across the ESG categories. The table shows asset descrip-tive statistics across ESG categories for the standard deviation of daily returns over the past year(Panel A) and the average daily trading volume as measured by the number of shares traded (PanelB). Assets in a particular ESG category are those in which funds invest.
Standard Deviation (%) of Daily Returns—Panel AL BA A AA H
Mean 2.22 2.15 2.17 2.01 1.93StdDev 1.17 1.10 1.09 0.95 0.89
Average Daily Trading Volume (in Millions of Shares Traded)—Panel BL BA A AA H
Mean 3.83 4.40 4.72 4.75 5.67StdDev 160.40 155.61 148.53 181.79 228.80
4.2. Results
To implement the model in Section 3, first, we need to calibrate the price impact modelin Equation (3), i.e., we have to fix the constant c. We estimate c by imposing that theaverage relative loss in market value experienced by all funds in the network is 1% when allfunds liquidate 1% of their assets. Another proposal is given in [41,42], where the authorsestimate c by imposing that the median loss value for the assets in the sample is 440 bsp for10 billion of USD liquidated. Our choice is in the same spirit as them, having the advantageof improving the readability of results (in a linear model, results depend linearly on c.Hence, to avoid the arbitrariness of calibration, findings have to be given in relative terms;for example, comparing results for an ESG category with those of another ESG category).
Portfolio overlaps mediate contagion risk from fire-sale spillover between funds inthe network. The overlap of the High-ranked funds with all the funds in the network—as measured by the elements of the adjacency matrix in Equation (5)—is lower than theoverlap of the Low-ESG-ranked funds with all the funds in the network. This is shown inFigure 1, where the highest thirty elements of the sub-adjacency matrix for the High-rankedfunds are compared with the highest thirty elements of the sub-adjacency matrix for theLow-ranked funds. The reduced overlap for the High-ESG-ranked funds follows fromthe fact that such funds share the lowest number of assets with the funds in the othercategories, as shown in Table 1. The asset’s market depth then amplifies this effect as inEquation (5). Lower overlaps, in turn, mitigate the risk of propagation of a local shock tothe entire financial network.
Then, we compute the vulnerability index for each fund in the network as inEquation (7). Figure 2 shows the cross-section average (upper panel) and standard devia-tion (lower panel) of the vulnerability index of the funds across the different ESG categories.Results are standardized so that the average vulnerability index of the High-ranked fundsis equal to 1.
Figure 2 shows that fund vulnerability decreases with ESG compliance. In particular,the vulnerability is higher for the Low-ranked funds and lower for the High-ranked ones.In detail, the vulnerability index for the Low-ESG-ranked funds is on average 50% higherthan the vulnerability of the High-ESG-ranked funds. In other terms, for 1% of liquidated

Sustainability 2022, 14, 3805 9 of 13
assets, the average relative loss of market value for the Low-ranked funds is 50% higherthan the same quantity for the High-ranked funds with a standard deviation that is almostdouble that for the High-ranked funds. Such a result can justify why, during crisis periods,ESG funds were able to mitigate their losses [24–26].
0 5 10 15 20 25 300
1
2
3
4
5
6
7
8109 Portfolio overlaps
Low ranked fundsHigh ranked finds
Figure 1. Portfolio overlaps. The figure compares the highest thirty portfolio overlaps, computedaccording to Equation (5), of the High-ranked funds (full circles) and of the Low-ranked funds (emptycircles) with all the funds in the network.
Low Below Average Average Above Average High0.5
1
1.5
Mea
n
Vulnerability index
Low Below Average Average Above Average High2
4
6
8
Sta
ndar
d D
evia
tion
Figure 2. Fund vulnerability index. The figure shows the cross-section average (upper panel) andstandard deviation (lower panel) of the vulnerability index as given in Equation (7) of the fundsacross different ESG categories.
Figure 3 shows the average of the relative market value loss (6) experienced by theHigh- (crossed line) and Low (dotted line)-ranked funds, when different fractions of assets

Sustainability 2022, 14, 3805 10 of 13
are liquidated by all the funds in the network. We only report results for these two categoriessince they represent the extreme cases of our dataset, and the difference in the level ofESG compliance is the highest for them. The left panel shows results when liquidation isimplemented in one step, while the right panel reports the case when the same quantity ofassets is liquidated in ten steps. Results indicate that the average relative loss of marketvalue is always lower for the High-ESG-ranked funds for any given fraction of liquidatedassets. For example, when funds liquidate 10% of their assets in one step, Figure 3 showsthat the Low-ESG-ranked funds lose 98% more than the High-ESG-ranked funds. Slowerliquidation (right panel) has, of course, a weaker impact on the market value loss for boththe Low- and the High-ESG-ranked funds. In conclusion, Figure 3 shows that contagion isless effective for the High-ESG-ranked funds.
0 2 4 6 8 10
Fraction of liquidated assets (%)
-14
-12
-10
-8
-6
-4
-2
0
Ave
rage
Rel
ativ
e Lo
ss (
%)
Quick liquidation
High rankedLow ranked
0 2 4 6 8 10
Fraction of liquidated assets (%)
-14
-12
-10
-8
-6
-4
-2
0
Ave
rage
Rel
ativ
e Lo
ss (
%)
Slow liquidation
Figure 3. Average of the relative market value loss. The figure shows the average of the relativemarket value loss (6), achieved by the High-ranked funds (crossed line) and by the Low-ranked funds(dotted line) for different fractions of assets liquidated by all the funds in the network. Liquidation isimplemented either in one step (left panel) or in ten steps (right panel).
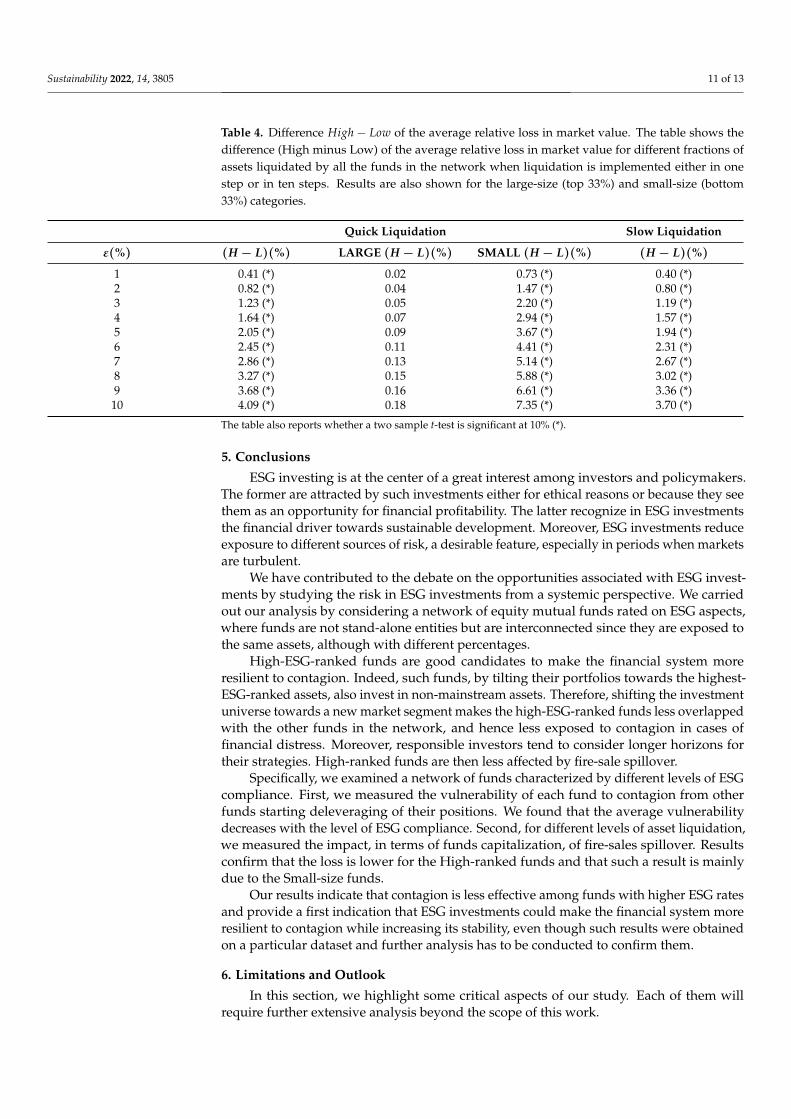
Table 4 reports the difference High− Low in the average relative loss of market valuefor different fractions of assets liquidated by all the funds in the network when liquidationis implemented either in one step (column 2-3-4) or in 10 steps (column 5). A two-samplet-test shows that, on average, the relative market value loss experienced by the High-rankedfunds is significantly lower than that for the Low-ranked ones with a p-value equal to 0.063for the quick liquidation case (column 2) and 0.064 for the slow liquidation case (column 5).The same test is performed when the comparison is made for the Large, Small, respectively,funds (top 33%, bottom 33% respectively, of the total net assets distribution within theHigh- and Low-ESG categories). Table 4 shows that the average difference is not significantfor the large-size funds. However, the average difference is significant for the small funds,with a p-value equal to 0.061. Hence the better systemic performance of the High-rankedfunds in terms of a higher resilience to contagion is driven by the small-size funds that, byconstruction, are those presenting the lowest overlaps with the other funds in the network.
Sustainability 2022, 14, 3805 11 of 13
Table 4. Difference High− Low of the average relative loss in market value. The table shows thedifference (High minus Low) of the average relative loss in market value for different fractions ofassets liquidated by all the funds in the network when liquidation is implemented either in onestep or in ten steps. Results are also shown for the large-size (top 33%) and small-size (bottom33%) categories.
Quick Liquidation Slow Liquidation
ε(%) (H − L)(%) LARGE (H − L)(%) SMALL (H − L)(%) (H − L)(%)
1 0.41 (*) 0.02 0.73 (*) 0.40 (*)2 0.82 (*) 0.04 1.47 (*) 0.80 (*)3 1.23 (*) 0.05 2.20 (*) 1.19 (*)4 1.64 (*) 0.07 2.94 (*) 1.57 (*)5 2.05 (*) 0.09 3.67 (*) 1.94 (*)6 2.45 (*) 0.11 4.41 (*) 2.31 (*)7 2.86 (*) 0.13 5.14 (*) 2.67 (*)8 3.27 (*) 0.15 5.88 (*) 3.02 (*)9 3.68 (*) 0.16 6.61 (*) 3.36 (*)10 4.09 (*) 0.18 7.35 (*) 3.70 (*)
The table also reports whether a two sample t-test is significant at 10% (*).
5. Conclusions
ESG investing is at the center of a great interest among investors and policymakers.The former are attracted by such investments either for ethical reasons or because they seethem as an opportunity for financial profitability. The latter recognize in ESG investmentsthe financial driver towards sustainable development. Moreover, ESG investments reduceexposure to different sources of risk, a desirable feature, especially in periods when marketsare turbulent.
We have contributed to the debate on the opportunities associated with ESG invest-ments by studying the risk in ESG investments from a systemic perspective. We carriedout our analysis by considering a network of equity mutual funds rated on ESG aspects,where funds are not stand-alone entities but are interconnected since they are exposed tothe same assets, although with different percentages.
High-ESG-ranked funds are good candidates to make the financial system moreresilient to contagion. Indeed, such funds, by tilting their portfolios towards the highest-ESG-ranked assets, also invest in non-mainstream assets. Therefore, shifting the investmentuniverse towards a new market segment makes the high-ESG-ranked funds less overlappedwith the other funds in the network, and hence less exposed to contagion in cases offinancial distress. Moreover, responsible investors tend to consider longer horizons fortheir strategies. High-ranked funds are then less affected by fire-sale spillover.
Specifically, we examined a network of funds characterized by different levels of ESGcompliance. First, we measured the vulnerability of each fund to contagion from otherfunds starting deleveraging of their positions. We found that the average vulnerabilitydecreases with the level of ESG compliance. Second, for different levels of asset liquidation,we measured the impact, in terms of funds capitalization, of fire-sales spillover. Resultsconfirm that the loss is lower for the High-ranked funds and that such a result is mainlydue to the Small-size funds.
Our results indicate that contagion is less effective among funds with higher ESG ratesand provide a first indication that ESG investments could make the financial system moreresilient to contagion while increasing its stability, even though such results were obtainedon a particular dataset and further analysis has to be conducted to confirm them.
6. Limitations and Outlook
In this section, we highlight some critical aspects of our study. Each of them willrequire further extensive analysis beyond the scope of this work.
Sustainability 2022, 14, 3805 12 of 13
The first aspect is related to the dataset. Our findings rely on the Morningstar Sus-tainability rating system, which is the most comprehensive and reliable dataset on funds.However, it is a well-known fact that different sustainability rating systems may evaluatethe ESG performance of firms differently and may then assign completely different ratingsto the same asset. Such an inconsistency is then inherited by funds, since funds’ ESG ratesare based on their holdings rates. Hence, any analysis on ESG investing is intrinsicallyendowed with an ESG measurement bias. The whole analysis should be implemented onother rating systems to evaluate the impact of such an issue on the results.
The second aspect concerns the time span analyzed. We considered a cross-sectionof funds at a particular date, and we estimated the financial variables we needed for theanalysis for a time span of one year. However, funds may react differently to deleveragingin turbulent or quiet periods. Hence, further analysis should be performed to test differenttime spans to confirm the results.
Finally, the third aspect is related to the model. We implemented a linear market impactmodel. Such a model is widely used in the literature since it is simple to interpret. Moreover,for small liquidated volumes, it provides a good approximation of reality. However, itmay overestimate the losses for larger volumes, and a different model could be moreappropriate.
Despite such limitations, the results are encouraging and, if confirmed, indicate thatinvestment strategies based on ESG factors may be the instrument for policymakers andinvestors to make the system less vulnerable to a systemic financial shock.
Author Contributions: All the authors contributed equally to the conceptualization and writing ofthe paper. Data curation, R.C. (Rocco Ciciretti), A.D. and M.N.; Formal analysis, M.N.; Investigation,R.C. (Roy Cerqueti), R.C. (Rocco Ciciretti) and A.D.; Methodology, M.N.; Resources, R.C. (RoccoCiciretti); Writing—original draft, M.N.; Writing—review & editing, R.C. (Roy Cerqueti), R.C. (RoccoCiciretti) and A.D. All authors have read and agreed to the published version of the manuscript.
Funding: This research was partially funded by Morningstar (contract. n. OPP635470), Etica Sgr(ref.n. R01-2019), Fondazione Cassa di Risparmio di Perugia (ref.n. 2017.0226.021), and the Universityof Perugia Fondo Ricerca di Base 2018).
Institutional Review Board Statement: Not applicable.
Informed Consent Statement: Not applicable.
Data Availability Statement: Restrictions apply to the availability of data.
Conflicts of Interest: The authors declare no conflict of interest.
References1. Bauer, R.; Derwall, J.; Otten, R. The ethical mutual fund performance debate: New evidence from Canada. J. Bus. Ethics 2007,
70, 111–124. [CrossRef]2. El Ghoul, S.; Karoui, A. Does corporate social responsibility affect mutual fund performance and flows? J. Bank. Financ. 2017,
77, 53–63. [CrossRef]3. Nicolosi, M.; Grassi, S.; Stanghellini, E. Item response models to measure corporate social responsibility. Appl. Financ. Econ. 2014,
24, 1449–1464. [CrossRef]4. Herzel, S.; Nicolosi, M.; Starica, C. The cost of sustainability in optimal portfolio decisions. Eur. J. Financ. 2012, 18, 333–349.
[CrossRef]5. Kempf, A.; Osthoff, P. The effect of socially responsible investing on portfolio performance. Eur. Financ. Manag. 2007, 13, 908–922.
[CrossRef]6. Glushkov, D.; Statman, M. The wages of social responsibility. Financ. Anal. J. 2009, 65, 33–46.7. Pástor, L.; Stambaugh, R.F.; Taylor, L.A. Sustainable investing in equilibrium. J. Financ. Econ. 2021, 142, 550–571. [CrossRef]8. Pedersen, L.H.; Fitzgibbons, S.; Pomorski, L. Responsible investing: The ESG-efficient frontier. J. Financ. Econ. 2021, 142, 572–597.
[CrossRef]9. Heinkel, R.; Kraus, A.; Zechner, J. The effect of green investment on corporate behavior. J. Financ. Quant. Anal. 2001, 36, 431–449.
[CrossRef]10. Merton, R.C. A simple model of capital market equilibrium with incomplete information. J. Financ. 1987, 42, 483–510. [CrossRef]11. Hong, H.; Kacperczyk, M. The price of sin: The effects of social norms on markets. J. Financ. Econ. 2009, 93, 15–36. [CrossRef]
Sustainability 2022, 14, 3805 13 of 13
12. Luo, A.; Balvers, R. Social Screens and Systematic Investor Boycott Risk. J. Financ. Quant. Anal. 2017, 52, 365–399. [CrossRef]13. Kim, S.; Lee, G.; Kang, H.G. Risk management and corporate social responsibility. Strateg. Manag. J. 2021, 42, 202–230. [CrossRef]14. Bauer, R.; Koedijk, K.; Otten, R. International evidence on ethical mutual fund performance and investment style. J. Bank. Financ.
2005, 29, 1751–1767. [CrossRef]15. Bauer, R.; Otten, R.; Rad, A. Ethical investing in Australia: Is there a financial penalty? Pac.-Basin Financ. J. 2006, 14, 33–48.
[CrossRef]16. Renneboog, L.; Horst, J.T.; Zhang, C. The price of ethics and stakeholder governance: The performance of socially responsible
mutual funds. J. Corp. Finance 2008, 14, 302–322. [CrossRef]17. Ciciretti, R.; Daló, A.; Dam, L. The Contributions of Betas versus Characteristics to the ESG Premium; CEIS Working Paper No.
413; 2019. Available online: https://papers.ssrn.com/sol3/Papers.cfm?abstract_id=3010234 (accessed on 31 January 2022).18. Chordia, T.; Goyal, A.; Shanken, J. Cross-Sectional Asset Pricing with Individual Stocks: Betas Versus Characteristics; SSRN Working
Paper No. 2549578; SSRN: Rochester, NY, USA, 2017.19. Galema, R.; Plantinga, A.; Scholtens, B. The stocks at stake: Return and risk in socially responsible investment. J. Bank. Finance
2008, 32, 2646–2654. [CrossRef]20. Becchetti, L.; Ciciretti, R.; Dalò, A. Fishing the Corporate Social Responsibility Risk Factors. J. Financ. Stab. 2018, 37, 25–48.
[CrossRef]21. Kim, Y.; Li, H.; Li, S. Corporate social responsibility and stock price crash risk. J. Bank. Finance 2014, 43, 1–13. [CrossRef]22. Boubaker, S.; Cellier, A.; Manita, R.; Saeed, A. Does corporate social responsibility reduce financial distress risk? Econ. Model.
2020, 91, 835–851. [CrossRef]23. Albuquerque, R.; Koskinen, Y.; Zhang, C. Corporate social responsibility and firm risk: Theory and empirical evidence. Manag.
Sci. 2019, 65, 4451–4469. [CrossRef]24. Lins, K.V.; Servaes, H.; Tamayo, A. Social capital, trust, and firm performance: The value of corporate social responsibility during
the financial crisis. J. Financ. 2017, 72, 1785–1824. [CrossRef]25. Nofsinger, J.; Varma, A. Socially responsible funds and market crises. J. Bank. Finance 2014, 48, 180–193. [CrossRef]26. Omura, A.; Roca, E.; Nakai, M. Does responsible investing pay during economic downturns: Evidence from the COVID-19
pandemic. Finance Res. Lett. 2021, 42, 101914. [CrossRef]27. Adamska, A.; Dabrowski, T.J. Investor reactions to sustainability index reconstitutions: Analysis in different institutional contexts.
J. Clean. Prod. 2021, 297, 126715. [CrossRef]28. Cerqueti, R.; Ciciretti, R.; Dalò, A.; Nicolosi, M. A new measure of the resilience for networks of funds with applications to
socially responsible investments. Phys. A: Stat. Mech. Appl. 2022, 593, 126976. [CrossRef]29. Braverman, A.; Minca, A. Networks of common asset holdings: Aggregation and measures of vulnerability. J. Netw. Theory
Finance 2018, 4, 53–78. [CrossRef]30. Coval, J.; Stafford, E. Asset fire sales (and purchases) in equity markets. J. Financ. Econ. 2007, 86, 479–512. [CrossRef]31. Flori, A.; Lillo, F.; Pammolli, F.; Spelta, A. Better to stay apart: Asset commonality, bipartite network centrality, and investment
strategies. Ann. Oper. Res. 2021, 299, 177–213. [CrossRef]32. Guo, W.; Minca, A.; Wang, L. The topology of overlapping portfolio networks. Stat. Risk Model. 2016, 33, 139–155. [CrossRef]33. Cont, R.; Schaanning, E. Monitoring indirect contagion. J. Bank. Finance 2019, 104, 85–102. [CrossRef]34. Kyle, A.S. Continuous Auctions and Insider Trading. Econometrica 1985, 53, 1315–1335. [CrossRef]35. Charfeddine, L.; Najah, A.; Teulon, F. Socially responsible investing and Islamic funds: New perspectives for portfolio allocation.
Res. Int. Bus. Finance 2016, 36, 351–361. [CrossRef]36. Joliet, R.; Titova, Y. Equity SRI funds vacillate between ethics and money: An analysis of the funds’ stock holding decisions. J.
Bank. Finance 2018, 97, 70–86. [CrossRef]37. Bollen, N. Mutual fund attributes and investor behavior. J. Financ. Quant. Anal. 2007, 42, 683–708. [CrossRef]38. Amihud, Y. Illiquidity and stock returns: Cross-section and time-series effects. J. Financ. Mark. 2002, 5, 31–56. [CrossRef]39. Almgren, R.; Thum, C.; Hauptmann, E.; Li, H. Direct Estimation of Equity Market Impact. Risk 2005, 18, 57–62.40. Patel, S.; Sarkissian, S. To group or not to group? Evidence from mutual fund databases. J. Financ. Quant. Anal. 2017,
52, 1989–2021. [CrossRef]41. Cont, R.; Wagalath, L. Fire Sales Forensics: Measuring Endogenous Risk. Math. Finance 2016, 26, 835–866. [CrossRef]42. Ellul, A.; Jotikasthira, C.; Lundblad, C.T. Regulatory pressure and fire sales in the corporate bond market. J. Financ. Econ. 2011,
101, 596–620. [CrossRef]
Related Documents