Missouri Soil Fertility and Fertilizers Research Update 2009 Agronomy Miscellaneous Publ. #10-01 January 2010 Agronomy Department College of Agriculture, Food and Natural Resources University of Missouri

Welcome message from author
This document is posted to help you gain knowledge. Please leave a comment to let me know what you think about it! Share it to your friends and learn new things together.
Transcript
Missouri
Soil Fertility and Fertilizers
Research Update
2009
Agronomy Miscellaneous Publ. #10-01 January 2010
Agronomy Department
College of Agriculture, Food and Natural Resources
University of Missouri

1
Thank You
Missouri Fertilizer and Ag Lime Distributors
The contributors to this report wish to express their sincere thanks for the willingness of
the Missouri Fertilizer and Ag Lime Distributors of the state who provide funding, through
their annual permit fees, for the research which is reported in this publication. These
research projects would not be possible without this funding source.
I want thank Dr. Randy Miles for providing the Sanborn Field Update report which is
included in this herein. While Sanborn Field does not receive financial support from the
Fertilizer/Ag Lime funds, this information provides some of the grounding base on which
agricultural research was first established in Missouri. For anyone not aware, Sanborn
Field is on the National Historic registry and is the oldest continuous plot research site,
West of the Mississippi River conducting agricultural research.
Researchers, being overtly curious people with a penchant to find out why or how
to do it better, normally have a list of topics that they want to research. Perhaps you have
a topic that is particularly perplexing to you? These people could very well be the one‘s to
ask why? If they don‘t know, then perhaps you will have just suggested the next burning
question that will become the object of new research. Any questions or ideas? If you
do, send them too us at:
Fertilizer/Ag Lime Control Service
Attn: Joe Slater
University of Missouri-Columbia
Columbia, MO 65211-8080
or email them to [email protected]
or phone 573-882-0007

2
Contributors to Report
Blevins, Dale. Professor, Agronomy, University of Missouri
Bradley, Kevin. Assoc. Professor, State Weed Scientist, University of Missouri
Burdick, Bruce. Div. of Plant Sciences, University of Missouri, Albany, MO
Doty, Randa. Agricultural Business Specialist – County Program, Northwest Region, UM
Dunn, David. Supervisor Soil Test Lab, Delta Center, Southeast Region-ANR, University
of Missouri
Ellis, Charles. Region Natural Resources Engineer
Fritschi, Felix. Asst. Professor, Div. of Plant Sciences, University of Missouri
Flatt, Wendy. Livestock Specialist and County Program Director, Howard County,
CNTRL Missouri Region, ANR
Harper, Joni Ross. Agronomy Specialist, Morgan County, Ctrl Missouri Region, ANR
Holou, Roland. Graduate Student, Plant, Insect and Microbial Science, University of
Missouri
Hoormann, Richard. Agronomy Specialist, County Program Director, Montgomery
County, East Ctrl Region - ANR
Houx, III, James H. Research Specialist, Plant Sciences, University of Missouri
Jones, Andrea.
Kallenbach, Robert. Assoc. Professor, Div. of Plant Sciences, University of Missouri
Kitchen, Newell. Adjunct Assoc. Professor of Soil Science, Soil Environment &
Atmospheric Sciences, University of Missouri
Kremer, Robert. USDA-ARS, Dept. of Soils, Environmental, and Atmospheric Sciences
Lorenz, Todd. Horticulture/Agronomy Specialist – Cooper County Program Director Ctrl
Region
Lory, John A. Extension Assistant Professor Agronomy, Ag. Ext. Plant Sciences,
University of Missouri
Miles, Randy. Associate Professor, Soil and Atmospheric Sciences, University of
Missouri
Motavalli, Peter. Assistant Professor, Soil and Atmospheric Sciences, University of
Missouri
Mueller, Larry. Research Specialist, Agronomy, University of Missouri
Nash, Pat. Dept. of Soil, Environmental and Atmospheric Sciences, University of
Missouri
Nathan, Manjula. Director, University of Missouri Soil Testing Lab
Oliveira, Luciane.
Nelson, Kelley A. Asst. Research Professor, Greenley Research, University of Missouri
Reinbott, Timothy. Research Assoc. & Superintendent Bradford Research & Extension
Scharf, Peter. Professor, State Soil Fertility Specialist, Div. of Plant Sciences, University
of Missouri
Schmitz, Gene. Livestock Specialist Benton County, Ctrl Missouri Region - ANR
Shannon, Kent. Region Natural Resources Engineer

3
Shetley, John. Dept. of Soil, Environmental and Atmospheric Sciences, University of MO
Stevens, Gene. Assistant Professor, Ag Extension Plant Sciences, University of Missouri
Sweets, Laura. Div. of Plant Sciences, University of Missouri
Thomas, Matt.
Vendrely, Dustin. MU Extension Agricultural Business Specialist
Vories, Earl. USDA-Agricultural Research Service
Wrather, Allen. Prof. Plant Sciences, Ag.–Ext. Plant Pathology

4
Table of Contents
Sanborn Field Update .................................................................................................................................. 6
Historic Sanborn Field: 2009 Growing Season ..................................................................................... 6
Randall J. Miles and Matt Thomas .................................................................................................... 6
Agricultural Lime....................................................................................................................................... 14
Final Reports .......................................................................................................................................... 15
Using Dolomitic Limestone and Timing of Phosphorus Fertilization to Maintain High Leaf
Phosphorus and Magnesium Concentrations in Stockpiled Fescue During the Winter ............. 15
Dale G. Blevins ............................................................................................................................... 15
Profitability of P and K Fertilizer With and Without Lime .......................................................... 20
David Dunn and Gene Stevens ...................................................................................................... 20
Progress Reports .................................................................................................................................... 23
Influence of pH on Carryover of Triketone Herbicides in Missouri No-till Corn and Soybean
Rotations ............................................................................................................................................. 23
Kevin Bradley and Peter Scharf ................................................................................................... 23
Field Calibration of Woodruff, Mehlich and Sikora Buffer Tests for Determining Lime
Requirement for Missouri soils ......................................................................................................... 25
Manjula Nathan, David Dunn, Kelly Nelson, Tim Reinbott, Bruce Burdick ........................... 25
Nitrogen Management ............................................................................................................................... 38
Progress Reports .................................................................................................................................... 39
Utility of Polymer-Coated Urea as a Fall-Applied N Fertilizer Option for Corn and Wheat .... 39
Peter Motavalli, Kelly Nelson, and Pat Nash ............................................................................... 39
Addressing nitrogen controversies ........................................................................................... 47
Peter Scharf and Larry Mueller ................................................................................................ 47
Nitrogen dynamics of standard and enhanced urea in corn .......................................................... 53
James H. Houx III and Felix B. Fritschi ...................................................................................... 53
Sensor-based sidedressing for cotton ...................................................................................... 56
Peter Scharf, Gene Stevens, David Dunn, Luciane Oliveira, and Andrea Jones ....... 56
Sensor-based Topdressing for Winter Wheat ......................................................................... 58
Peter Scharf, Newell Kitchen, Luci Oliveira, and Larry Mueller ...................................... 58
Miscellaneous Tests .................................................................................................................................... 61
Final Reports .......................................................................................................................................... 62
Soil Sampling and Fertility Build-up Management ........................................................................ 62
Gene Stevens and David Dunn ...................................................................................................... 62
Switchgrass and Sweet Sorghum Fertilization for Bioenergy Feedstocks .................................... 67
Gene Stevens, Roland Holou, David Dunn, and Allen Wrather ................................................ 67
Progress Reports .................................................................................................................................... 70
Environmentally Sound High Impact Forage Management Research Based Demonstrations for Increased Livestock Profitability by Increasing Forage Production and Quality .................................................................................................................. 70
Todd Lorenz, Rich Hoormann, Wendy Flatt, Gene Schmitz, Joni Ross, Dustin Vendrely, Randa Doty and Rob Kallenbach ......................................................................... 70
ENVIRONMENTALLY SOUND HIGH IMPACT FORAGE MANAGEMENT RESEARCH BASED DEMONSTRATIONS FOR INCREASED LIVESTOCK PROFITABILITY BY INCREASING FORAGE PRODUCTION AND QUALITY .......................................................... 79
Supplemental and Waste Lime overlay Progress Report ................................................ 79

5
Evaluation of Fall Dry Band Application of Phosphorous and Potassium Nutrient Needs for a
Corn/Soybean Rotation ..................................................................................................................... 81
Rich Hoormann, Charles Ellis, Kent Shannon, Peter Scharf .................................................... 81
Optimum Timing of Nitrogen and Phosphorus Applications for Improved Tall Fescue Seed
Production ........................................................................................................................................... 86
Dale G. Blevins ............................................................................................................................... 86
Foliar Fertilizer and Fungicide Interactions on Corn .................................................................... 91
Kelly Nelson, Peter Motavalli, Gene Stevens, Bruce Burdick, David Dunn, Laura Sweets,
and John Shetley ............................................................................................................................ 91
Nutrient Management in Biofuel Crop Production ........................................................................ 98
Tim Reinbott, Manjula Nathan, Kelly Nelson and Robert Kremer .......................................... 98
Updating University of Missouri Soil Test Recommendations .................................................... 106
John A. Lory ................................................................................................................................. 106
How Does Kip Grow 150+ bu/acre Soybeans? Is K+ a Key? ....................................................... 108
Tim Reinbott, Felix Fritschi, and Dale Blevins ........................................................................ 108
6
Sanborn Field Update
Historic Sanborn Field: 2009 Growing Season
Randall J. Miles and Matt Thomas Soil, Environmental, and Atmospheric Sciences Department
Introduction
Since the fall of 1888 researchers on Sanborn Field have explored the affects that different management
schemes have on the properties of the soil. The longevity of the research on Sanborn Field has made it
the third oldest research field in the world. Sanborn Field is located on the University of Missouri campus
in Columbia, MO and consists of 44 separate plots with each plot‘s area (except plot 24) consisting of
approximately 1/14 of an acre (.29ha) and measures 100.5ft by 31 ft (30.55 meters by 9.42 meter). Plot
24 is half as long as the other plots because the north half contains an automated weather station. A
layout of the field can be seen on the plot plan diagram on the next page of the report. Plots numbered 1-
7 and 9-39 are managed in an ongoing either monocrop or rotation crop scheme. Plots 40-44 are used for
other research projects, teaching, and demonstration projects. Plot 45 was established to native warm
season grass in 1990 and continues presently in this management scheme to assess carbon sequestration.
Sanborn Field is used for four primary uses: 1. Research, 2. Demonstration, 3. Documentation of the Past,
and 4. Teaching. The following objectives reflect these uses:
A. Document soil changes, crop response and nutrient balance under selected crop sequences.
B. Collect and properly store soil and plant samples for use in the future as a means of identifying
effects of environmental changes.
C. To continue to measure soil changes and crop performance in plots uniformly managed since
1888.
D. To demonstrate results of interaction that occurs through differential management of the soil-
plant-environment continuum.
E. To serve as an on-campus laboratory for teaching where varied crops grown under different
management schemes provide living examples to students.
Soil Sampling, Fertility Recommendation, and Fertility Applications
Soil sampling procedures set forth by the Second Century Plan call for the collection of soil testing
samples every 5 years with the most recent set of samples being pulled in the fall of 2003. Every 25 years
(1938, 1962, 1988), deep core samples have been taken from each plot. In 1962 and 1988, these samples
were taken according to a systematic plan with the location of each core accurately measured from the
permanent plot markers. The next set of deep cores is scheduled to be taken in 2013. All fertility and
lime recommendations are made based on guidelines set forth in the Missouri Soil Testing program.
The manure applied to selected plots is sampled and analyzed. The manure used on Sanborn Field is
collected from the Foremost Dairy Farm manure solids separated stockpile. Soil moisture of the plots and
temperature determines the timing of the manure application. Due to the aroma of the manure and the
proximity of the field to residential housing, manure is applied in the winter to forage plots and in tilled
plots the manure is applied just prior to a tillage operation.
7
8
Weather
The effects of weather conditions on growth and development of non-irrigated agriculture crops in Missouri plays a
major roll. The weather data that is presented in Table 1 was collected from a weather station located on Plot 24 on
Sanborn Field. In 1994, an automatic weather station was placed on the north half of plot 24. In 2003 the weather
station was updated to allow for real time weather information to be obtained. This information is feed back to
computer on campus and is available for viewing on the web at aes.missouri.edu/sanborn/weather/sanreal.stm.
Table 1. Temperature and precipitation data measured on Sanborn Field in 2008/09.
Month Maximum Temp. Avg. Minimum Temp. Avg. Precipitation Totals
2008/08 32 year 2008/09 32 year 2008/09 32 year
2008 inches inches
September 72.1 78.6 58.5 56.1 10.77 3.37
October 67.8 67.4 47.2 45.5 1.95 3.00
November 52.9 53.7 35.6 35.1 1.08 3.30
December 40.9 41.6 20.7 24.5 2.23 2.24
2009 56.98 41.04
January 37.9 38.0 18.3 20.6 0.12 1..82
February 48.8 42.9 27.7 24.1 2.77 2.22
March 58.5 54.7 35.9 34.0 3.53 2.76
April 63.8 65.7 44.7 44.2 6.11 4.31
May 78.3 74.6 55.0 53.9 4.72 5.19
June 84.7 82.9 66.0 62.9 8.06 4.37
July 83.1 88.3 65.1 67.5 5.45 4.10
August 83.1 87.1 64.1 65.6 3.85 4.36
September 77.0 78.6 58.5 56.3 2.88 3.37
October 59.8. 67.1 43.5 45.7 10.78 3.00
November 60.2 53.9 42.2 35.3 1.76 3.30
December 39.5 41.5 24.4 24.3 3.03 2.24
Total or
avg. 57.6 64.6 45.5 44.5 53.15 41.04

9
Cropping Systems
Continuous Wheat: Plots 2, 5, 9, and 10 Continuous wheat has been grown on Sanborn Field since the fall of 1888. The management of each of these plots
is the same expect for differences in the fertility treatments. These treatment consist of plot 2 receiving full fertility
treatments, plot 9 with no treatment, plot 10 with 6 tons/acre applied annually and plot 5 having manure applied at a
rate of 6 tons/acre plus 40# of N to the acre with ammonia nitrate
(34-0-0) being the source. Yield results for the continuous wheat plots can be seen in Table 2.
Table 2-Harvest data of winter wheat from plots 2, 5, 9, and 10 on Sanborn Field in
20089
2009 Yield 2009 Yield Average Yields Average Yields
Bushels/ Kilograms/ 1978-2009 1978-2009
Plot Treatments Acre Hectare Bushels/Acre Kg/Ha
2 Full Fertility NH NH 25.3 1700
5 Manure + N NH NH 25.9 1740
9 None 2.3 154 9.1 611
10 Manure 11.4 765 28.8 1932
NH= not harvested because of delay be wetness and subsequent bird damage
Continuous Corn: Plots 6, 7, 17, and 18 Historic plots 17 and 18 have been in continuous corn since 1889. The treatments for plots 17 and 18 are no
fertility applications and 6 tons of manure per acre, respectively. Plots 6 and 7 have been in continuous corn since
1950 and both have received full fertility treatments based on yield goal and soil test. Plot 7 was established in
1971 as a no-till plot. Yield data from the continuous corn plots can be found in Table 3.
Table 3-Harvest data of corn from plots 6, 7, 17, and 18 on Sanborn Field in 2009.
2009 Yield 2009 Yield Average Yields Average Yields
Bushels/ Kilograms/ 1978-2009 1978-2009
Plot Treatments Acre Hectare Bushels/Acre Kg/Ha
6 Full Fertility 205.4 12,879 110.2 6910
7 Full Fertility 193.4 12,126 97.6 6120
17 None 3.5 219 12.2 765
18 Manure 22.3 1398 50.6 3173
Continuous Soybean: Plot 39 In 1990 the Second Century Plan outlined that plot 39 would be in continuous soybean production. The reasoning
for looking at such a system is to assess the changes in weed, insect, and disease pressures compared to soybean
production in a rotation. This plot does receive a full fertility treatment. This plot had sparse plant population
before of extremely wet conditions at planting and therefore was not harvested..
10
Continuous Forages: Plots 22, 23, 24, and 45 The objectives of the continuous forage crops were to continue the treatments and management of the historical
timothy plots (22 and 23) and to demonstrate alternative forages for teaching purposes (24S and 45). Timothy has
been grown continuously on plot 22 and 23 since 1888. Plot 22 has received 6-tons of manure per acre annually
and plot 23 has received no additional fertilizer applications. Periodic reseeding is required on these historical plots
due to stand decline and weed encroachment. The tall fescue in plot 24 south (24S) is used for demonstration
purposes. The reason this plot is designated as south is because the north half of this plot contains the Sanborn
Field weather station. Yield results for plots 23, 24, and 25 can be found in Table 4.
Table 4. Harvest data from the continuous forage crops on Sanborn Field in
2009.
2009 2009 Average* Average*
Forage
Yields
Forage
Yields
Forage
Yields
Forage
Yields
Plot Crop Treatment Tons/Acre Kg/Hectare Tons/Acre Kg/Hectare
22 Timothy Manure 3.24 7257.6 3.12 6988.8
23 Timothy None 2.00 4480 1.57 3516.8
24
Tall
Fescue
Full
Fertility 3.90 8736 4.25 9520.0
*Averages for plots 22, 23, 24 are based data from 1991-2009.
Three-Year Rotation (Corn-Wheat/rc-Red Clover): Plots 1, 3, 4, 25, 26, 27, and 28 The historic rotation plots 25, 26, 27, and 28 were initiated in 1888, whereas plots 1, 3, and 4 were started in 1950.
The treatments for the plots is as follows: plots 1, 3, 4, and 26 receive full fertility, plot 25 receives 6 tons of
manure per acre annually, plots 28 receives full fertility minus the additions of nitrogen, and plot 27 has no
additional fertilizer added. The treatment on plot 28 was started in 1990 to evaluate the relative nitrogen
contributions from the red clover in the rotation. Yield data for this three-year rotation can be seen in Table 5.
11
Table 5. Harvest data from the corn-wheat/rc-red clover rotation on Sanborn Field in
2009.
Yield
2009 2009 2009 2009 2009 Average*
Plots Treatment Crop Grain Grain Forage Forage Grain Forage
Bu/ Kg/ Tons/ Kg/ Bu/ Kg/ Tons/ Kg/
acre ha acre ha acre ha acre ha
1 Full Red
Clover 5.06 11334. 3.9 8736
3 Full Corn 222.3 13938 132.8 8325
4 Full Wheat/RC NH NH 0.77 1725 1.59 3561
25 Manure Corn 94.2 5906 107.6 6744
26 Full Corn 214.1 13424 136.8 8573
27 None Corn 82.5 5173 75.1 4711
28 Full-N Corn 72.6 4552 92.44 5795
*Average is based on the past 5 times that particular plot was in the same crop as the year 2008
Bu/acre = Bushels/Acre Full=Full Fertility Treatment Full-N=Full Fertility minus Nitrogen
Treatment
Three-Year Rotation (Grain Sorghum-Soybeans-Wheat (rc): Plots 19, 20, and 21
This rotation was started in 1990 with the Second Century Plan. The objective of these plots is to obtain soil and
crop data for a comparison to like rotations that use corn instead of grain sorghum.
Bird cages were built with chicken wire to keep the birds from the yield strips in the grain sorghum plot and in
2004 the cages where modified with a smaller mesh bird netting to remedy the problems that occurred in the past.
Yields for this three year rotation can be found in Table 6.

12
Table 6. Harvest data form the grain sorghum-soybean-wheat (rc) rotation on Sanborn
Field in 20079
Yields
2009 2009 2009 Average*
Plots Treatment Crop Grain Grain Grain
Bu/Acre Kg/Ha Bu/Acre Kg/Ha
19 Full
Fertility
Grain
Sorghum ** ** ** **
20 Full
Fertility Wheat/RC 29.8 2003
40.7 2735
21 Full
Fertility Soybeans NH NH 44.0 2956
*Average is based on the past 4 times that the particular plot was in the same crop
as it was in 2009.
** Only one harvest in last 3 cycles
Bu/Acre=Bushels/Acre (red clover) is plowed down and no harvest yeieds are taken
NH= not harvested because of delay be wetness and subsequent bird damage
Three-Year Rotation (Corn-Soybeans-Wheat (rc): Plots 31, 32, 33, 34, 35, 36, 37, and 38 This set of plots provides many different treatments for comparisons. All plots in the rotation except for plot 36
utilize a frost seeded red clover/lespedeza mix as a fall plow-down to supply part of the nitrogen to the proceeding
crop. A lay out of the plot design is as follows:
Plot Treatment
31, 37, 38 Full fertility treatments
32 Full fertility treatments minus the additions of potassium
33 Full fertility treatment minus the additions of phosphorus
34 Manure applied at a rate of 6 tons per acre per year
35 No treatment
36 Full fertility treatments minus the red clover/lespedeza plow-down
Yields for this three-year rotation can be seen in Table 7.

13
Table 7. Harvest data form the corn-soybean-wheat (rc) rotation on Sanborn Field
in 2009.
Yields
2009 2009 Average* Average*
2009 Grain Grain Grain Grain
Plots Treatment Crop Bu/Acre Kg/Ha Bu/acre Kg/Ha
31 Full Corn 187.0 11725 126.0 7903
32 Full-K Corn 167.8 10521 116.1 7281
33 Full-P Corn 107.4 6734 101.0 6333
34 Manure Corn 173.6 10885 123.8 7760
35 None Corn 64.4 4038 83.7 52552
36 Full-(rc) Corn 200.4 12565 111.2 6972
37 Full Soybean 19.9 1337 30.8
2068
38 Full Wheat/Red
Clover 35.9 2412
37.4 2512
*Average is based on the past 5 times that particular plot was in the same crop as the
year 2009.
Bu/acre = Bushels/Acre
(red clover) is plowed down and no harvest yields are taken

14
Agricultural Lime
15
Final Reports
Using Dolomitic Limestone and Timing of Phosphorus Fertilization to Maintain High Leaf Phosphorus and Magnesium Concentrations in Stockpiled Fescue During the Winter
Dale G. Blevins
PI: Dale G. Blevins, Professor & Kemper Fellow, Division of Plant Sciences
Objective: to maintain high phosphorus (P) and magnesium (Mg) concentrations in tall fescue leaves in
late winter by using dolomitic limestone (Mg source) and determining the correct timing of P
applications. The dolomitic limestone should provide more soil Mg and the (timing) application of half of
the P fertilizer during winter months may boost leaf Mg concentration during these months.
Procedures: An established tall fescue pasture was selected at the Southwest Center near Mt. Vernon,
MO. Soil samples were collected in June, 2008 and analyzed by the University of Missouri Soil Testing
Laboratory. The soil pH levels for this plot area were just below 6.0 and the Bray I P levels were 10
lbs/acre or lower. The Bray 2 levels were also extremely low, and the soil Mg levels were in the medium
range. These soil test results are very typical of tall fescue pastures used in much of the state.
In mid-July 2008, forage was cut and removed from the plot area. Plots were established with the
following dimensions: 10‘ x 25‘ with 5‘ alleys. On July 19, 2008 dolomitic limestone (ENM = 467 &
EMG = 137) was applied to specific plots at a rate of 0 or 2000 lbs/acre. During late August of each
season, forage was harvested and removed from the plot area and in early September, 100 lbs N/acre (as
urea) was applied to all plots. In mid-September of each season, a total of 25 lbs P/acre was applied to the
September P treatment plots and all other P treated plots were treated with 12.5 lbs P/acre, as 0-46-0,
Then in October of each year, the October plots were treated with their remaining 12.5 lbs P/acre, and in
November, December January and February, specific P-treated plots received their remaining 12.5 lbs
P/acre. Starting in October of each season, 20 of the most recently collared leaves from each plot were
harvested monthly. Leaf samples were dried, ground, digested in nitric acid in our microwave digestion
system, diluted, filtered and analyzed for macro- and micronutrient concentrations by ICP. Leaf P, Mg
and Ca concentrations were plotted against the months of harvest for each of the two stockpiling seasons.
Results: Just a reminder that the key treatments in this study involve applying one-half of the P fertilizer
(12.5 lbs/acre) in September and the other half (12.5 lbs/acre) in one of the months of the stockpiling
season. The September treatment received all 25 lbs P/acre in September of each year. The split P
applications in Nov and Dec were best for increasing leaf P concentrations from January through March
(Fig. 1). The split application in other months also increased leaf P concentrations, but not as effectively
as the Dec treatment. In the second season, all P applications greatly increased leaf P concentrations,
although the split application in November and December seemed provide the greatest increases in leaf P
concentrations (Fig. 1). Over the two years, the November and December split P applications were best
for increasing concentrations in both seasons. Interestingly, in the first season leaf P concentrations started
to increase in January, while in the second season leaf P concentrations started to increase in February.
The dolomitic limestone application did not increase leaf P concentrations in any month of the two year
study.
The December split P application was best for increasing leaf Mg concentration in February and
March of the first season (Fig. 2). These are the two months when grass tetany is most common in spring
calving herds in Missouri. All P treatments increased leaf Mg concentrations in each month of the second
season. In the second year, there were slight increases in leaf Mg concentrations with application of the
dolomitic limestone in plots also treated with P. Interestingly, the ―pattern‖ of changes in leaf Mg

16
concentrations showed a continuous decline throughout each of the stockpiling seasons (Fig. 2), unlike P,
which increased from February through April of each season (Fig. 1).
Dolomitic limestone application was not very effective in increasing Ca concentrations of
stockpiled tall fescue leaves in this study (Fig. 3). However, split P applications made from Oct through
Feb were effective in increasing leaf Ca concentrations in late winter of the first season. All P applications
were effective at increasing leaf Ca concentrations in each month of the second season (Fig. 3). All of the
leaf Ca concentrations were about the 0.3% required in the diet of a lactating beef cow during all months
of both seasons. The pattern of leaf Ca concentration changes during the fall, winter and spring resembled
those of P, not Mg. The leaf Ca concentrations were lowest in January of the first season and February of
the second season and then leaf Ca concentrations increased, in general. Application of dolomitic
limestone caused slight increases in leaf Ca concentrations in March and April of each year.
Summary: The design of this experiment was based on results that we observed on a poultry litter
experiment, where we used an equivalent amount of fertilizer applied in three installments to mimic the
slow release of nutrients from litter. A December fertilizer treatment in that experiment increased leaf P in
January and February. Our hypothesis was that December P treatments might also increase leaf Mg
concentrations, based on other research that we have done linking P fertilization with Mg uptake by
plants. Indeed this was the case in the present experiment, where the December treatment with 12.5 lbs
P/acre was best at increasing leaf Mg concentration in February and March of each season. During the
second season, P fertilization was effective in increasing both leaf Mg and Ca concentrations during each
month of the stockpiling season. In putting all of these results together, the macronutrient quality of the
forage should be improved by the Dec application of P.
In summary, P fertilization in December is, in general, best for improving forage P, Mg and Ca
quality of stockpiled tall fescue in late winter months. The addition of P fertilizer increased leaf P, Mg and
Ca concentrations more effectively that lime applications alone.

17
Figure 1. Leaf P concentrations of stockpiled tall fescue following dolomitic limestone application, and
split P fertilization treatments over two seasons. Note that November and December P fertilization split
were best for increasing leaf P concentrations in late winter months.
18
Figure 2. Leaf Mg concentrations of stockpiled tall fescue following dolomitic limestone application, and
split P fertilization treatments over two seasons. Note that the December P split application was best for
increasing leaf Mg concentrations in late winter months during the first season, while all P treatments
increased leaf Mg concentrations during each month of the second season, more so that just adding
dolomitic limestone alone.
19
Figure 3. Leaf Ca concentrations of stockpiled tall fescue following dolomitic limestone application, and
split P fertilization over two seasons. Note that the December P fertilization split was a little better for
increasing leaf Ca concentrations in late winter months during the first season, while all P treatments
produced increased leaf Ca concentrations in the second season.

20
Profitability of P and K Fertilizer With and Without Lime
David Dunn and Gene Stevens
University of Missouri-Delta Research Center
Objective: Measure corn/soybean yield, and profitability of phosphorus and potassium fertilizer
applications as affected by liming on fields with low pH soils. Economics will be calculated for each
fertilization/lime system.
Introduction: Missouri farmers often request information to help convince their landlords that applying
lime will net both parties added profits in a crop share agreement. Some cost share rental agreements call
for fertilizer, but not lime costs to be shared by each party. Producers are reluctant to solely bear the costs
of liming in situations where their rental agreements are for less than three years. For decades, extension
soil scientists have taught that maintaining proper soil pH based on soil test recommendations is necessary
to maximize availability of P and K to crops. Unfortunately, these education programs are primarily
based on liming research studies conducted at least 35 years ago. These studies were largely conducted
on soil testing adequate in P & K. Conversely most P & K studies have been conducted on soils with an
optimal pH level. Also, many of those tests were done in laboratories and greenhouses. The proposed
research project will help demonstrate that more ―bang for the buck‖ can be achieved with P and K
fertilizer in combination with good liming practices.
Research Methods: In 2007 corn and soybean field plots were established on a Tiptonville silt loam soil
located at the University of Missouri Lee Farm at Portageville, MO. The soil pH(s) at this location was 5.3,
the P level was 52 lbs/a, and the K level was 169 lbs/a. The recommended limestone rate for both corn
and soybeans was 1 ½ tons/a. For corn 60 lbs P205 & 90 lbs K2O was recommended, for soybeans 35 lbs
P205 & 120 lbs K2O was recommended. The experimental design was a split plot with crop as the main
plot and fertilizer treatment as the sub plot. Five replications were employed. Three rates of aglime (0, 1,
2 ton/a) and one rate of pelletized lime (200 lb/a) were evaluated. Five rates of P & K (0, 25, 50, 75, &
100% of the recommended rate) were evaluated. These rates were based on the greater of the two crops
(60 lbs P205 & 120 lbs K2O).
Project Accomplishments: The three year average grain yields and net returns to producers for lime and
fertilizer treatments for are presented in Tables 1, 2, & 3. When averaged for all fertilizer treatments, the
2 ton/a lime rate produced the greatest yields for both corn and soybeans. When averaged for all lime
treatments, the 45-90 rate of P & K produced the greatest yields for both corn and soybeans. For both corn
and soybeans the 200 lb/a pelletized lime treatment increased yields relative to the no lime treatment. For
corn the three year average yield were greater than the 1 ton lime rate but less than the 2 ton lime rate.
For soybeans the pel lime treatment three year average yield was equivalent to the 1 ton lime rate but less
than the 2 ton lime rate. When averaged for all fertilizer treatments, the 2 ton lime treatment produced the
greatest returns to producers for both corn and soybeans. When averaged for all lime treatments, the 45-90
rate of P & K produced the greatest returns to producers for corn. When averaged for all lime treatments,
the 15-30 rate of P & K produced the greatest returns to producers for soybeans.
21
Summary
The greatest average yields for both corn and soybeans were obtained with the 2 ton
per acre lime rate. The greatest net returns to producers for both crops were
obtained with the 2 ton per acre lime rate
For corn the greatest yields and net returns to producers were obtained with the 45P-
90K rate of fertilizer.
For soybeans the greatest yields were obtained with the 45P-90K rate. However, the
greatest net returns to producers were obtained with the 15P-30K rate of fertilizer
Table 1. Three year average grain yields, input costs, gross and net returns for lime and fertilizer
treatments for corn and soybeans, Portageville, MO in 2007-2009. # P+K
(lb/a)
Lime
(t/a)
Input
cost**
($/a)
2007 Yield
(bu/a)
2008 Yield
(bu/a)
2009 Yield
(bu/a)
3-year gross
returns*
($/a)
3-year net
returns**
($/a)
Corn Beans Corn Beans Corn Beans Corn Beans Corn Beans
1 0 0 0 132 36 83 21 129 55 1720 1115 1720 1115
2 15-30 0 77 148 47 83 21 161 60 1960 1280 1883 1203
3 30-60 0 153 150 41 95 24 162 58 2035 1225 1882 1072
4 45-90 0 230 175 42 112 28 162 64 2245 1340 2015 1110
5 60-
120
0
306
137
41 136 34 149 57 2110 1320 1804 1014
6 0 1.0 25 158 39 86 22 176 56 2100 1170 2075 1145
7 15-30 1.0 102 145 44 117 30 171 64 2165 1370 2063 1268
8 30-60 1.0 178 151 44 133 33 174 54 2290 1310 2112 1132
9 45-90 1.0 255 162 47 146 37 171 68 2395 1510 2140 1255
10 60-
120
1.0 331
150
53 141 36 174 62 2325 1500 1994 1169
11 0 2.0 50 147 47 153 38 134 63 2170 1475 2120 1425
12 15-30 2.0 127 138 44 158 40 138 66 2170 1490 2043 1363
13 30-60 2.0 203 145 48 172 43 159 64 2380 1545 2177 1342
14 45-90 2.0 280 147 50 182 46 165 62 2470 1574 2190 1294
15 60-
120
2.0 356
132
47 162 41 171 64 2325 1510 1969 1154
16 0 200 lb
pel 33
123
41 126 32 134 52 1915 1240 1882 1207
17 15-30 200 lb
pel 110
151
47 150 38 143 60 2220 1445 2110 1335
18 30-60 200 lb
pel 186
145
42 143 36 158 61 2230 1380 2044 1194
19 45-90 200 lb
pel 263
159
48 151 38 174 59 2420 1445 2157 1182
20 60-
120
200 lb
pel 339
123
39 171 4 185 57 2395 1390 2056 1051
*Based on corn @ $5.00/bu and soybeans @ $10.00/bu
**Based on lime @ $25.00/ton, pelletized lime @ $110.00/ton, P @ $0.50/ lb P2O5 and K @ $0.60/ lb
K2O.

22
Table 2. Three year average corn and soybean yields and net returns for fertilizer treatments averaged for
all lime rates, Portageville, MO in 2007-2009.
P&K Corn Soybeans
3-year
average
yield
(bu/a)
3-year
Net
returns
($/a)
3-year
Net
returns
($/a)
3-year
average
yield
(bu/a)
3-year
Net
returns
($/a)
3-year
Net
returns
($/a)
0 132 1976 1949 42 1250 1223
15-30 142 2129 2025 47 1396 1292
30-60 149 2234 2054 16 1365 1185
45-90 158 2383 2126 49 1467 1210
60-120 153 2289 1956 48 1430 1097
Table 3. Three year average corn and soybean yields and net returns for lime treatments averaged for all
fertilizer rates, Portageville, MO in 2007-2009.
Lime Corn Soybeans
3-year
average
yield
(bu/a)
3-year
Net
returns
($/a)
3-year
Net
returns
($/a)
3-year
average
yield
(bu/a)
3-year
Net
returns
($/a)
3-year
Net
returns
($/a)
0 134 2014 1861 42 1256 1103
1 t 150 2255 2077 46 1372 1194
2 t 154 2303 2100 51 1519 1316
200 lb pel 149 1336 2050 46 1380 1194

23
Progress Reports
Influence of pH on Carryover of Triketone Herbicides in Missouri No-till
Corn and Soybean Rotations Kevin Bradley and Peter Scharf
Missouri Fertilizer and Lime Council
Investigators: Kevin Bradley Peter Scharf
Associate Professor Professor
State Weed Scientist State Soil Fertility Specialist
Division of Plant Sciences, MU Division of Plant Sciences, MU
Accomplishments in 2009:
Based on soil pH levels tested in late winter/early spring, there was no need for additional lime
and iron sulfate applications to be made to the plots in 2009 in order to maintain the desired range
in soil pH levels. The soil pH treatments in this experiment are: 1) high lime, 2) low lime, 3) high
acid (iron sulfate), 4) low acid (iron sulfate), and 5) ‗no amendment‘ (limed just enough to
maintain initial pH).
One-half of the research area was no-till planted into corn while the other half of the research area
was no-till planted into soybeans. Due to poor planting conditions that were experienced
throughout the spring, corn was not able to be planted until May 14th
, approximately 4 weeks
behind normal planting for the Columbia location. The experiments were arranged in a split-plot
design with four replications of four herbicide treatments and five soil amendment treatments/pH
ranges. Soon after corn planting, a preemergence application of Dual II Magnum® (S-
metolachlor) was made to reduce early season weed competition and reduce overall weed
pressure. Dual II Magnum® is also labeled for use in soybean, thus there is no chance of carryover
injury to soybean in 2010 as a result of applications of this herbicide. A Roundup Ready® corn
and soybean hybrid was also utilized in these experiments in order to keep all plots weed-free
throughout the season with applications of glyphosate (Roundup®).
Herbicide treatments evaluated for carryover potential in 2010 were applied on June 17th
to V6
corn that was 30-inches tall. The herbicide treatments applied to each soil amendment treatment
were 1) Callisto® at 3 fluid ounces per acre, 2) Impact
® at 0.75 fluid ounces per acre, 3) Laudis
® at
3 fluid ounces per acre, and 4) an untreated control.
Visual ratings of soybean injury were taken at regular intervals after soybean emergence. Soybean
height was also recorded in each plot to determine the effects of the previous season‘s herbicide
applications on soybean growth.
Corn and soybean were harvested from all plots with a small plot combine and grain yields
determined.
1st Year Herbicide Carryover Results
There was not a significant effect of Impact, Laudis, or Callisto applications in the previous corn
crop on soybean visual injury, height reduction after planting, or soybean yield. This may be at
least partially due to the extremely wet conditions experienced throughout 2008 and 2009.
There was a significant effect of soil pH on corn and soybean yield, and these results are shown in
the table below.
24
Yielda
Treatment Corn Soybean
------------- Bu / A -------------
Low Lime (avg. pHs 6.6) 74.9 ab 53.6 ab
High Lime (avg. pHs 7.1) 83.5 a 54.3 a
Low Acid (avg. pHs 5.0) 78.7 ab 51.9 b
High Acid (avg. pHs 4.3) 73.1 b 47.5 c
No Soil Amendment (avg. pHs 5.9) 75.6 ab 53.2 ab a
Means followed by the same letter are not different, P 0.05.
Objectives for 2010:
All corn plots from 2009 will be rotated into soybeans. A Roundup Ready®
soybean variety will
be no-till planted and early-season soybean stunting and injury in response to the previous corn
herbicide treatments and pH levels will be evaluated visually and by measuring the heights of
soybeans in response to each treatment. All soybean plots will be maintained weed-free
throughout the season and yields determined.
25
Field Calibration of Woodruff, Mehlich and Sikora Buffer Tests for Determining Lime Requirement for Missouri soils
Manjula Nathan, David Dunn, Kelly Nelson, Tim Reinbott, Bruce Burdick
Manjula Nathan, Robert Kallenbach, Division of Plant Sciences, University of Missouri
David Dunn, MU Soil Testing Lab, Delta Center, University of Missouri
Kelly Nelson, Division of Plant Sciences, University of Missouri
Tim Reinbott, Bradford Research and Extension Center, University of Missouri
Bruce Burdick, Hundley Whaley Research and Extension Center, University of Missouri
Objectives:
1. To determine whether the Modified Woodruff Buffer test is accurately predicting the lime requirement for
Missouri soils.
2. To calibrate the Modified Woodruff Buffer, Sikora and Mehlich buffer tests for Missouri soils.
3. To Determine the Lime Recommendations Equations for Sikora Buffer and Mehlich Buffers for Missouri
Soils for the pH rages of 5.5 to 6.0; 6.0 to 6.5 and 6.5 -7.0.
4. Compare the field calibration results with incubation study results in evaluating the buffer tests.
Procedures:
A Field calibration study was established at Bradford, Novelty, Southwest, Delta and Hundley
Whaley University of Missouri Research and Extension Centers. The Bradford, Delta, Novelty
and Hundley Whaley sites were planted with corn-soybean rotations; Southwest center site was
planted with forages. The Delta and Hundley Whaley sites were plowed and the Bradford and
Novelty sites were under No-Till system.
Each experimental field sites received seven lime treatments (0, 250, 500, 1000, 1500, 2000 and
2500 ENM/ac) to cover a wide range from low, recommended, and double the recommended lime
rates with the exception of Southwest Center site (0, 250, 500, 750, 1000, 1500, and 2000
ENM/ac). The liming material used in the study had an ENM of 680. The experiment was laid out
in a randomized complete block design with four replicates. All the plots received University of
Missouri recommended levels of N, P and K based on soil test.
Soil samples were collected at 0-6‖ and 6-12‖ depths to measure top soil and subsoil pHs at the
beginning of the study. Results are presented in Tables 1-5. Soil samples were collected at 45, 90,
and 120 days after lime applications at the 0-6‖ depth. Soil samples were analyzed pHs, and for
buffer pH using Woodruff, Mehlich and Sikora buffers.
The crop yield data was collected at all five sites. The yield data will be correlated with the
response received for lime requirement estimated by the three different buffer tests and will be
compared with the incubation studies results.
Results:
The incubation study was conducted in Missouri by Nathan and Sun (2009), comparing Sikora and
Mehlich buffers to the Woodruff buffer test for Missouri soils had promising results. The Sikora and
Mehlich buffers were found to be well correlated with the Woodruff buffer test suggesting these buffers
could be used as an alternative to Woodruff buffer for Missouri soils. The findings from the lab

26
incubation study led to the field calibration of these buffers with yield response to evaluate these buffer
tests for Missouri soils.
The initial soil pHs, Woodruff, Mehlich, and Sikora Buffer pH values and the yield response to lime
treatments for Hundley Whaley, Delta Center, Novelty, Bradford and Southwest Center are presented in
Tables 1-5. The mean initial soil test values for Hundley Whaley, Delta Center, Novelty, Bradford, and
Southwest Center sites were 5.5, 5.0, 5.3, 5.1 and 5.5 respectively. The initial subsoil pHs values were
measured for all plots (Table 6). The mean subsoil pHs values for the study sites were 5.8, 4.8, 5.1, 4.8
and 5.4 for the Hundley Whaley, Delta Center, Novelty, Bradford and Southwest Center sites
respectively. There was observable response for lime rates in grain yields at the Huntley Whaley, Delta
Center, and Novelty sites (Tables 1-3). The Bradford sites and Southwest Center sites didn‘t show any
clear response to lime (Tables 3 and 4). The very wet spring and excess rain up to early summer at the
Bradford site resulted in poor stands and lower yields. The site selected at Southwest Center had an initial
soil pHs of 5.5 and is probably not low enough to show response to lime in fescue yields. In addition,
since the lime treatments this year were applied at the time of planting and since it takes 3 to 6 months for
the lime to react with the soil, therefore we expect to see better response to lime rates in 2010 and 2011
growing seasons than this year.
Soil samples taken at 0-6‖ depth at 45, 90, and 120 days after lime application and analyzed for pHs,
Woodruff , Mehlich, and Sikora buffer pH levels to study the rate of lime reaction in the soil. Since the
analyses of these samples were just completed only the results are presented in Tables 7 -11. Due to time
restrains in submitting this report, additional analysis on relating the buffer tests to yield response will be
completed.
References:
1. Mehlich, A. 1976. New buffer pH method .for rapid estimation of exchangeable acidity and lime
requirement of soils. Commun. Soil Sci. Plant Anal.7: 637-652
2. Nathan. M. V., Sun, Y. and P. C. Scharf. 2009. Evaluation of Modified Mehlich and Sikora Buffer Methods
as an Alternative to Modified Woodruff Buffer in Determining Lime Requirement for Missouri Soils.
Submitted for publishing in Special Edition of Communications in Soils and Plant Analysis.
3. Nathan, M., Stecker, J., and Y. Sun. 2004. Soil Testing Guide. University of Missouri Soil & Plant Testing
Laboratory Publication. (Electronic Publication)
4. Nathan, M. V., Scharf, P., and Y. Sun. 2006. Evaluation of Mehlich Buffer as an Alternative to the
Woodruff Buffer for Lime Recommendations in Missouri. ASA, SSSA, CSSA Madison, WI.
5. Sikora, F. J. 2006. A buffer that mimics the SMP buffer for determining lime requirement of Soil. SSSAJ
70: 474-486.
6. Woodruff, C. M., 1948. Testing soils for lime requirement by means of a buffer solution and glass
electrodes. Soil Sci. 66: 53-63.

27
Table 1. Initial Soil pHs, Woodruff, Mehlich and Sikora Buffer pH values and the corn grain yield
response to lime treatments at Hundley Whaley Site, 2009
Lime
pHs (1:1 0.01 M
CaCl2)
Woodruff Buffer pH
Mehlich Buffer
pH
Sikora Buffer pH
Yield
(Bu/a)
Rate N Mean STD Mean STD Mean STD Mean STD Mean STD
ENM/ac
0 4 5.8 a 0.1 6.7 a 0.0 6.1 a 0.0 6.7 a 0.1 205 b 22.7
250 4 5.5 bc 0.0 6.6 ab 0.0 6.0 b 0.0 6.6 ab 0.1 221 ab 3.7
500 4 5.6 ab 0.2 6.7 ab 0.1 6.0 ab 0.1 6.7 ab 0.1 227 ab 22.5
1000 4 5.5 bc 0.1 6.6 b 0.1 6.0 b 0.1 6.6 b 0.1 229 ab 18.5
1500 4 5.4 c 0.1 6.6 b 0.0 5.9 b 0.0 6.6 b 0.0 232 a 20.8
2000 4 5.5 bc 0.2 6.6 b 0.1 6.0 b 0.1 6.6 ab 0.1 231 a 18.9
2500 4 5.6 bc 0.1 6.7 ab 0.0 6.0 b 0.0 6.6 ab 0.0 233 a 11.2
Pr>F 0.03 0.11 0.08 0.21 0.30
Table 2. Initial Soil pHs, Woodruff, Mehlich and Sikora Buffer pH values and the Corn grain yield
response to lime treatments at Delta Center Site, 2009
Lime
pHs (1:1 0.01 M
CaCl2)
Woodruff Buffer
pH
Mehlich Buffer
pH
Sikora Buffer
pH
Yield
(Bu/a)
Rate N Mean STD Mean STD Mean STD Mean STD Mean STD
ENM/ac
0 4 5.2 a 0.6 6.6 a 0.2 6.1 a 0.1 6.8 a 0.2 143.0 bc 6.0
250 4 5.2 a 0.1 6.7 a 0.0 6.1 a 0.1 6.9 a 0.1 154.0 ab 13.2
500 4 4.9 a 0.4 6.6 a 0.1 6.1 a 0.1 6.8 a 0.1 159.0 a 6.6
1000 4 5.0 a 0.5 6.6 a 0.1 6.1 a 0.1 6.8 a 0.2 163.0 a 4.9
1500 4 4.9 a 0.3 6.6 a 0.1 6.1 a 0.1 6.8 a 0.1 160.0 a 13.3
2000 4 4.9 a 0.5 6.6 a 0.1 6.0 a 0.2 6.8 a 0.2 163.0 a 13.6
2500 4 5.1 a 0.5 6.6 a 0.1 6.1 a 0.1 6.8 a 0.2 163.0 a 14.1
Pr>F 0.21 0.61 0.69 0.79 0.12

28
Table 3: Initial Soil pHs, Woodruff, Mehlich and Sikora Buffer pH values and the Corn grain yield
response to lime treatments at Novelty Site, 2009
Lime
pHs (1:1 0.01 M
CaCl2)
Woodruff Buffer pH
Mehlich Buffer
pH
Sikora Buffer pH
Yield
(Bu/a)
Rate N Mean STD Mean STD Mean STD Mean STD Mean STD
ENM/ac
0 4 5.3 a 0.2 6.6 a 0.1 6.0 a 0.1 6.6 a 0.1 122 c 0.0
250 4 5.4 a 0.1 6.6 a 0.0 6.0 a 0.1 6.6 a 0.1 136 bc 22.6
500 4 5.4 a 0.2 6.7 a 0.1 6.0 a 0.1 6.6 a 0.1 158 ab 9.2
1000 4 5.3 a 0.1 6.6 a 0.1 6.0 a 0.1 6.6 a 0.1 168 a 4.2
1500 4 5.3 a 0.1 6.6 a 0.1 6.0 a 0.1 6.6 a 0.1 170 a 19.1
2000 4 5.4 a 0.1 6.7 a 0.0 6.0 a 0.0 6.7 a 0.1 149 abc 6.4
2500 4 5.4 a 0.2 6.6 a 0.1 6.0 a 0.1 6.6 a 0.1 137 bc 9.9
Pr>F 0.76 0.55 0.44 0.40 0.05
Table 4: Initial Soil pHs, Woodruff, Mehlich and Sikora Buffer pH values and the corn grain yield
response to lime treatments at Bradford Center Site, 2009
Lime
pHs (1:1 0.01 M
CaCl2)
Woodruff Buffer pH
Mehlich Buffer
pH
Sikora Buffer pH
Yield
(Bu/a)
Rate N Mean STD Mean STD Mean STD Mean STD Mean STD
ENM/ac
0 4 5.1 bc 0.1 6.5 ab 0.0 5.9 ab 0.0 6.6 ab 0.0 90 ab 21.3
250 4 5.0 c 0.1 6.5 b 0.1 5.9 b 0.1 6.5 b 0.1 87 ab 28.1
500 4 5.1 ab 0.1 6.6 a 0.0 5.9 ab 0.0 6.6 a 0.0 90 ab 16.9
1000 4 5.1 abc 0.1 6.5 ab 0.0 5.9 ab 0.0 6.6 ab 0.1 86 ab 18.8
1500 4 5.1 abc 0.1 6.5 ab 0.1 5.9 b 0.1 6.5 ab 0.1 101 a 20.3
2000 4 5.2 a 0.1 6.5 ab 0.0 5.9 a 0.0 6.6 a 0.0 77 ab 15.9
2500 4 5.1 ab 0.1 6.5 ab 0.0 5.9 ab 0.0 6.6 ab 0.0 72 b 4.9
Pr>F 0.11 0.25 0.20 0.23 0.37

29
Table 5: Initial Soil pHs, Woodruff, Mehlich and Sikora Buffer pH values and the forage yield
response to lime treatments at South West Center Site, 2009
Lime
pHs (1:1 0.01 M
CaCl2)
Woodruff Buffer pH
Mehlich Buffer
pH
Sikora Buffer pH
Yield
(Bu/a)
Rate N Mean STD Mean STD Mean STD Mean STD Mean STD
ENM/ac
0 4 5.6 a 0.6 6.7 a 0.1 6.2 0.2 6.8 0.2 2.9 a 0.10
250 4 5.3 a 0.2 6.7 a 0.1 2.6 a 0.12
500 4 5.5 a 0.5 6.8 a 0.2 2.6 a 0.26
750 4 5.5 a 0.3 6.8 a 0.1 2.8 a 0.12
1000 4 5.6 a 0.3 6.8 a 0.1 2.7 a 0.20
1500 4 5.3 a 0.1 6.7 a 0.0 2.8 a 0.35
2000 4 5.6 a 0.4 6.8 a 0.1 2.9 a 0.44
Pr>F 0.79 0.73 0.48
30
Table 6: The Initial Subsoil pHs and Woodruff Buffer pH Data for Hundley Whaley, Delta Center,
Novelty, Bradford and Southwest Center Sites, 2009
Site
Lime Treatments
ENM/ac N Mean STD Woodruff Buffer pH STD
Hundley Whaley 0 4 5.7 a 0.27 6.6 a 0.11
250 4 5.7 a 0.19 6.6 a 0.13
500 4 5.7 a 0.32 6.6 a 0.11
1000 4 5.8 a 0.20 6.7 a 0.11
1500 4 5.9 a 0.31 6.7 a 0.16
2000 4 5.6 a 0.27 6.6 a 0.14
2500 4 5.9 a 0.18 6.7 a 0.04
Pr>F 0.71 0.76
Delta Center 0 4 4.7 a 0.19 6.6 a 0.09
250 4 4.9 a 0.23 6.6 a 0.05
500 4 4.8 a 0.28 6.6 a 0.10
1000 4 4.9 a 0.22 6.6 a 0.07
1500 4 4.7 a 0.15 6.6 a 0.02
2000 4 4.8 a 0.33 6.6 a 0.11
2500 4 4.8 a 0.29 6.6 a 0.08
Pr>F 0.85 0.90
Novelty 0 4 5.2 a 0.29 6.4 a 0.11
250 4 5.0 a 0.16 6.3 a 0.09
500 4 5.2 a 0.32 6.4 a 0.18
1000 4 5.1 a 0.32 6.3 a 0.16
1500 4 5.1 a 0.24 6.4 a 0.11
2000 4 5.2 a 0.30 6.4 a 0.15
2500 4 5.2 a 0.22 6.4 a 0.09
Pr>F 0.87 0.76
Bradford 0 4 4.7 a 0.08 6.3 a 0.10
250 4 4.7 a 0.15 6.3 a 0.10
500 4 4.8 a 0.15 6.3 a 0.02
1000 4 4.8 a 0.21 6.3 a 0.14
1500 4 4.7 a 0.10 6.3 a 0.13
2000 4 4.8 a 0.08 6.4 a 0.08
2500 4 4.8 a 0.14 6.3 a 0.09
Pr>F 0.50 0.92
Southwest Center 0 4 5.4 ab 0.16 6.7 b 0.03
250 4 5.3 b 0.21 6.7 b 0.05
500 4 5.6 a 0.18 6.8 a 0.04
750 4 5.5 ab 0.06 6.8 ab 0.02
1000 4 5.5 ab 0.42 6.8 ab 0.11
1500 4 5.4 ab 0.27 6.7 b 0.06
2000 4 5.4 ab 0.32 6.8 ab 0.07
Pr>F 0.19 0.10
31
Table 7: Soil pHs, Sikora, Mehlich, and Woodruff Buffer pH Values for 45, 90, and 120 days after
lime application at Hundley Whaley Site, 2009
Days Lime Rate
pHs (1:1 0.01 M CaCl2)
Woodruff Buffer pH
Mehlich Buffer pH
Sikora Buffer pH
ENM/ac N Mean STD Mean STD Mean STD Mean STD
45 0 4 5.7 b 0.1 6.6 c 0.1 5.7 b 0.1 6.7 bc 0.1
45 250 4 6.5 b 0.2 6.7 c 0.0 5.7 b 0.1 6.7 c 0.1
45 500 4 6.8 ab 0.1 6.7 abc 0.0 5.8 ab 0.0 6.8 abc 0.1
45 1000 4 5.8 ab 0.2 6.7 abc 0.1 5.8 ab 0.1 6.8 abc 0.1
45 1500 4 5.8 ab 0.2 6.7 bc 0.1 5.8 ab 0.1 6.8 abc 0.1
45 2000 4 6.0 a 0.2 6.7 ab 0.1 5.8 a 0.1 6.8 ab 0.1
45 2500 4 6.0 a 0.3 6.8 a 0.1 5.8 a 0.1 6.8 a 0.1
Pr>F 0.018 0.056 0.096 0.085
90 0 4 5.5 b 0.1 6.7 bc 0.0 6.0 c 0.0 6.8 d 0.0
90 250 4 5.5 b 0.2 6.6 c 0.1 6.1 bc 0.0 6.8 cd 0.0
90 500 4 5.8 a 0.3 6.8 ab 0.1 6.1 ab 0.1 6.9 abc 0.1
90 1000 4 5.7 ab 0.3 6.7 ab 0.1 6.1 abc 0.1 6.8 bcd 0.1
90 1500 4 5.9 a 0.2 6.8 ab 0.1 6.1 ab 0.1 6.9 ab 0.1
90 2000 4 6.0 a 0.3 6.8 a 0.1 6.2 a 0.1 6.9 ab 0.1
90 2500 4 6.0 a 0.1 6.8 a 0.0 6.2 a 0.1 6.9 a 0.1
Pr>F 0.009 0.010 0.031 0.018
180 0 4 5.5 d 0.1 6.6 c 0.0 6.0 c 0.0 6.7 c 0.0
180 250 4 5.6 cd 0.1 6.7 bc 0.0 6.1 bc 0.1 6.8 bc 0.1
180 500 4 5.8 bc 0.2 6.7 b 0.1 6.1 b 0.1 6.8 b 0.1
180 1000 4 5.9 b 0.1 6.7 b 0.1 6.2 ab 0.1 6.9 ab 0.1
180 1500 4 6.2 a 0.2 6.8 a 0.0 6.2 a 0.1 7.0 a 0.1
180 2000 4 6.2 a 0.1 6.8 a 0.0 6.2 a 0.0 7.0 a 0.1
180 2500 4 6.2 a 0.2 6.8 a 0.0 6.2 a 0.1 6.9 a 0.0
Pr>F 0.001 0.001 0.001 0.001
32
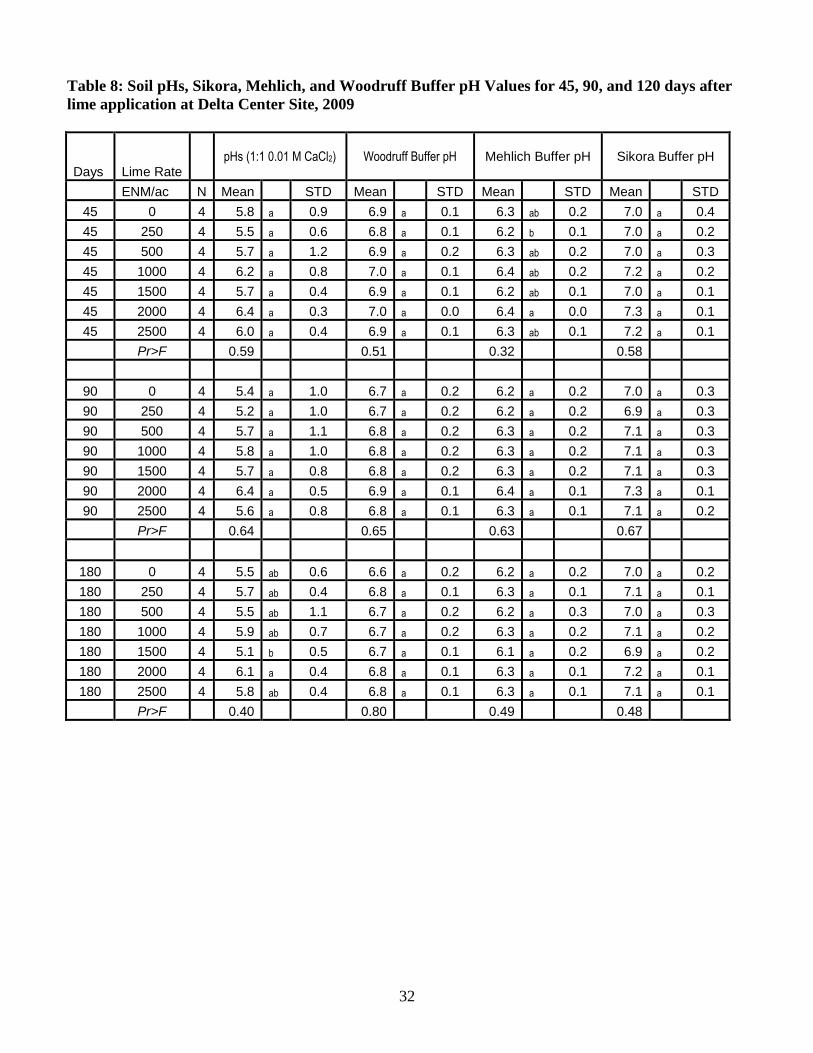
Table 8: Soil pHs, Sikora, Mehlich, and Woodruff Buffer pH Values for 45, 90, and 120 days after
lime application at Delta Center Site, 2009
Days Lime Rate
pHs (1:1 0.01 M CaCl2)
Woodruff Buffer pH
Mehlich Buffer pH
Sikora Buffer pH
ENM/ac N Mean STD Mean STD Mean STD Mean STD
45 0 4 5.8 a 0.9 6.9 a 0.1 6.3 ab 0.2 7.0 a 0.4
45 250 4 5.5 a 0.6 6.8 a 0.1 6.2 b 0.1 7.0 a 0.2
45 500 4 5.7 a 1.2 6.9 a 0.2 6.3 ab 0.2 7.0 a 0.3
45 1000 4 6.2 a 0.8 7.0 a 0.1 6.4 ab 0.2 7.2 a 0.2
45 1500 4 5.7 a 0.4 6.9 a 0.1 6.2 ab 0.1 7.0 a 0.1
45 2000 4 6.4 a 0.3 7.0 a 0.0 6.4 a 0.0 7.3 a 0.1
45 2500 4 6.0 a 0.4 6.9 a 0.1 6.3 ab 0.1 7.2 a 0.1
Pr>F 0.59 0.51 0.32 0.58
90 0 4 5.4 a 1.0 6.7 a 0.2 6.2 a 0.2 7.0 a 0.3
90 250 4 5.2 a 1.0 6.7 a 0.2 6.2 a 0.2 6.9 a 0.3
90 500 4 5.7 a 1.1 6.8 a 0.2 6.3 a 0.2 7.1 a 0.3
90 1000 4 5.8 a 1.0 6.8 a 0.2 6.3 a 0.2 7.1 a 0.3
90 1500 4 5.7 a 0.8 6.8 a 0.2 6.3 a 0.2 7.1 a 0.3
90 2000 4 6.4 a 0.5 6.9 a 0.1 6.4 a 0.1 7.3 a 0.1
90 2500 4 5.6 a 0.8 6.8 a 0.1 6.3 a 0.1 7.1 a 0.2
Pr>F 0.64 0.65 0.63 0.67
180 0 4 5.5 ab 0.6 6.6 a 0.2 6.2 a 0.2 7.0 a 0.2
180 250 4 5.7 ab 0.4 6.8 a 0.1 6.3 a 0.1 7.1 a 0.1
180 500 4 5.5 ab 1.1 6.7 a 0.2 6.2 a 0.3 7.0 a 0.3
180 1000 4 5.9 ab 0.7 6.7 a 0.2 6.3 a 0.2 7.1 a 0.2
180 1500 4 5.1 b 0.5 6.7 a 0.1 6.1 a 0.2 6.9 a 0.2
180 2000 4 6.1 a 0.4 6.8 a 0.1 6.3 a 0.1 7.2 a 0.1
180 2500 4 5.8 ab 0.4 6.8 a 0.1 6.3 a 0.1 7.1 a 0.1
Pr>F 0.40 0.80 0.49 0.48

33
Table 9: Soil pHs, Sikora, Mehlich, and Woodruff Buffer pH Values for 45, 90, and 120 days after
lime application at Novelty Site, 2009
Days Lime Rate
pHs (1:1 0.01 M CaCl2)
Woodruff Buffer pH
Mehlich Buffer pH
Sikora Buffer pH
ENM/ac N Mean STD Mean STD Mean STD Mean STD
45 0 4 5.5 d 0.1 6.7 c 0.0 6.0 b 0.1 6.6 c 0.1
45 250 4 5.8 bc 0.1 6.7 bc 0.0 6.1 b 0.0 6.7 b 0.0
45 500 4 5.6 cd 0.2 6.7 bc 0.1 6.0 b 0.1 6.7 bc 0.1
45 1000 4 5.9 b 0.3 6.7 b 0.1 6.1 b 0.1 6.7 b 0.1
45 1500 4 6.4 a 0.2 6.8 a 0.0 6.2 a 0.1 6.9 a 0.0
45 2000 4 6.4 a 0.1 6.9 a 0.0 6.2 a 0.0 6.9 a 0.0
45 2500 4 6.6 a 0.2 6.9 a 0.1 6.2 a 0.1 6.9 a 0.1
Pr>F 0.001 0.001 0.001 0.001
90 0 4 5.5 e 0.1 6.7 e 0.0 6.1 d 0.0 6.7 e 0.1
90 250 4 5.7 cde 0.2 6.7 cd 0.0 6.2 bc 0.0 6.8 cd 0.0
90 500 4 5.7 de 0.3 6.7 de 0.1 6.1 cd 0.1 6.7 de 0.1
90 1000 4 5.9 cd 0.0 6.8 cd 0.0 6.2 bc 0.0 6.8 bcd 0.0
90 1500 4 6.0 cb 0.3 6.8 bc 0.1 6.2 bc 0.1 6.8 bc 0.1
90 2000 4 6.1 b 0.1 6.8 ab 0.0 6.2 ab 0.0 6.9 ab 0.0
90 2500 4 6.4 a 0.1 6.9 a 0.0 6.2 a 0.0 6.9 a 0.0
Pr>F 0.001 0.001 0.001 0.001
180 0 4 5.6 d 0.1 6.7 d 0.1 6.1 d 0.1 6.7 c 0.1
180 250 4 5.8 cd 0.2 6.7 cd 0.1 6.1 cd 0.1 6.8 bc 0.1
180 500 4 6.0 bc 0.1 6.8 bc 0.0 6.2 bc 0.0 6.8 b 0.1
180 1000 4 6.3 bc 0.2 6.8 ab 0.0 6.2 abc 0.0 6.9 ab 0.0
180 1500 4 6.6 a 0.2 6.9 a 0.1 6.3 a 0.1 7.0 a 0.1
180 2000 4 6.7 a 0.3 6.9 a 0.1 6.3 a 0.1 7.0 a 0.1
180 2500 4 6.6 a 0.3 6.9 a 0.1 6.3 ab 0.1 7.0 a 0.1
Pr>F 0.001 0.001 0.001 0.001
34
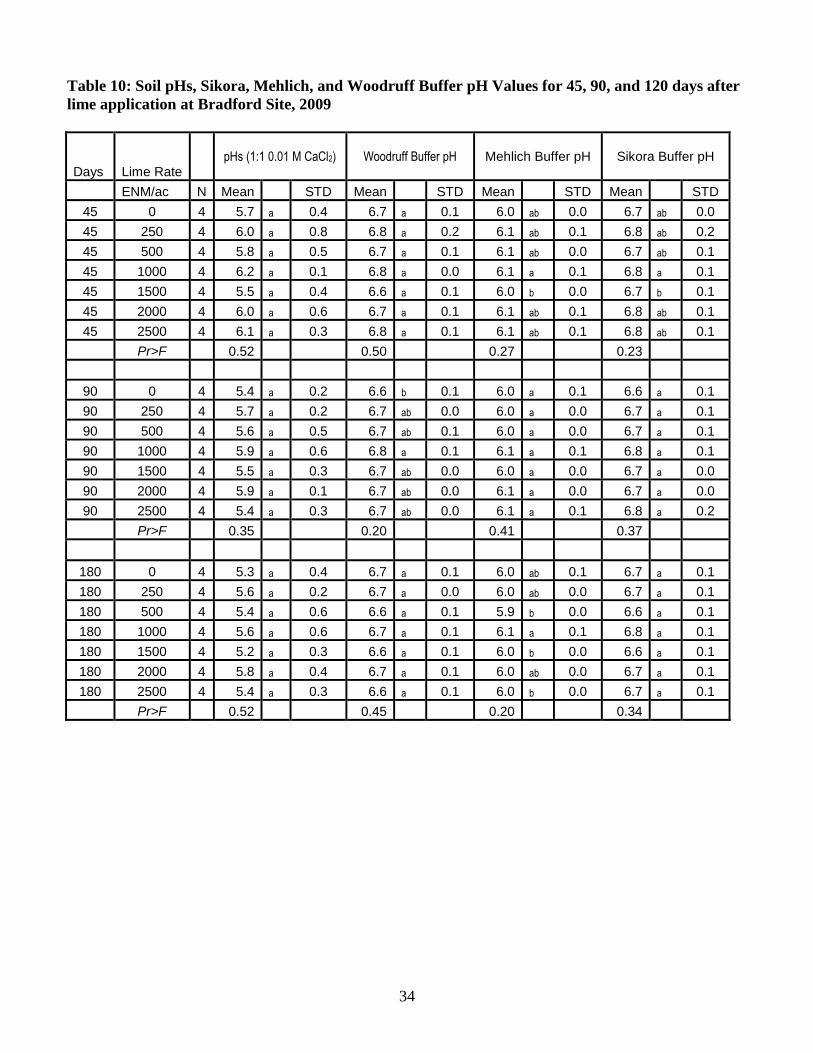
Table 10: Soil pHs, Sikora, Mehlich, and Woodruff Buffer pH Values for 45, 90, and 120 days after
lime application at Bradford Site, 2009
Days Lime Rate
pHs (1:1 0.01 M CaCl2)
Woodruff Buffer pH
Mehlich Buffer pH
Sikora Buffer pH
ENM/ac N Mean STD Mean STD Mean STD Mean STD
45 0 4 5.7 a 0.4 6.7 a 0.1 6.0 ab 0.0 6.7 ab 0.0
45 250 4 6.0 a 0.8 6.8 a 0.2 6.1 ab 0.1 6.8 ab 0.2
45 500 4 5.8 a 0.5 6.7 a 0.1 6.1 ab 0.0 6.7 ab 0.1
45 1000 4 6.2 a 0.1 6.8 a 0.0 6.1 a 0.1 6.8 a 0.1
45 1500 4 5.5 a 0.4 6.6 a 0.1 6.0 b 0.0 6.7 b 0.1
45 2000 4 6.0 a 0.6 6.7 a 0.1 6.1 ab 0.1 6.8 ab 0.1
45 2500 4 6.1 a 0.3 6.8 a 0.1 6.1 ab 0.1 6.8 ab 0.1
Pr>F 0.52 0.50 0.27 0.23
90 0 4 5.4 a 0.2 6.6 b 0.1 6.0 a 0.1 6.6 a 0.1
90 250 4 5.7 a 0.2 6.7 ab 0.0 6.0 a 0.0 6.7 a 0.1
90 500 4 5.6 a 0.5 6.7 ab 0.1 6.0 a 0.0 6.7 a 0.1
90 1000 4 5.9 a 0.6 6.8 a 0.1 6.1 a 0.1 6.8 a 0.1
90 1500 4 5.5 a 0.3 6.7 ab 0.0 6.0 a 0.0 6.7 a 0.0
90 2000 4 5.9 a 0.1 6.7 ab 0.0 6.1 a 0.0 6.7 a 0.0
90 2500 4 5.4 a 0.3 6.7 ab 0.0 6.1 a 0.1 6.8 a 0.2
Pr>F 0.35 0.20 0.41 0.37
180 0 4 5.3 a 0.4 6.7 a 0.1 6.0 ab 0.1 6.7 a 0.1
180 250 4 5.6 a 0.2 6.7 a 0.0 6.0 ab 0.0 6.7 a 0.1
180 500 4 5.4 a 0.6 6.6 a 0.1 5.9 b 0.0 6.6 a 0.1
180 1000 4 5.6 a 0.6 6.7 a 0.1 6.1 a 0.1 6.8 a 0.1
180 1500 4 5.2 a 0.3 6.6 a 0.1 6.0 b 0.0 6.6 a 0.1
180 2000 4 5.8 a 0.4 6.7 a 0.1 6.0 ab 0.0 6.7 a 0.1
180 2500 4 5.4 a 0.3 6.6 a 0.1 6.0 b 0.0 6.7 a 0.1
Pr>F 0.52 0.45 0.20 0.34

35
Table 11: Soil pHs, Sikora, Mehlich, and Woodruff Buffer pH Values for 45, 90, and 120 days after
lime application at Southwest Center Site, 2009
Days Lime Rate
pHs (1:1 0.01 M CaCl2)
Woodruff Buffer pH
Mehlich Buffer pH
Sikora Buffer pH
ENM/ac N Mean STD Mean STD Mean STD Mean STD
45 0 4 5.6 b 0.5 6.7 b 0.1 6.3 a 0.2 6.9 b 0.2
45 250 4 5.7 b 0.4 6.7 b 0.1 6.3 a 0.1 6.9 b 0.1
45 500 4 5.8 b 0.6 6.7 ab 0.1 6.3 a 0.2 7.0 ab 0.2
45 750 4 5.9 ab 0.2 6.8 ab 0.0 6.4 a 0.1 7.0 ab 0.1
45 1000 4 5.9 ab 0.3 6.8 ab 0.0 6.4 a 0.2 7.0 ab 0.0
45 1500 4 6.0 ab 0.3 6.8 ab 0.1 6.3 a 0.0 7.0 ab 0.1
45 2000 4 6.4 a 0.3 6.8 a 0.1 6.5 a 0.1 7.1 a 0.1
Pr>F 0.13 0.22 0.52 0.22
90 0 4 5.5 b 0.5 6.8 b 0.1 6.2 a 0.1 6.9 b 0.2
90 250 4 5.5 b 0.2 6.8 b 0.1 6.2 a 0.1 6.9 b 0.1
90 500 4 5.7 ab 0.6 6.8 ab 0.1 6.3 a 0.1 7.0 ab 0.2
90 750 4 5.7 ab 0.2 6.8 ab 0.0 6.3 a 0.0 7.0 ab 0.0
90 1000 4 5.9 ab 0.3 6.9 ab 0.0 6.3 a 0.1 7.0 ab 0.1
90 1500 4 5.9 ab 0.2 6.9 ab 0.1 6.2 a 0.0 7.0 ab 0.0
90 2000 4 6.2 a 0.3 6.9 a 0.0 6.3 a 0.1 7.1 a 0.1
Pr>F 0.08 0.22 0.53 0.26
180 0 4 5.6 b 0.5 6.8 ab 0.1 6.2 a 0.1 7.0 a 0.2
180 250 4 5.6 b 0.2 6.8 ab 0.0 6.2 a 0.0 7.0 a 0.1
180 500 4 5.8 b 0.6 6.7 b 0.1 6.3 a 0.1 7.0 a 0.2
180 750 4 5.8 b 0.2 6.8 ab 0.0 6.3 a 0.1 7.0 a 0.1
180 1000 4 6.0 ab 0.2 6.8 ab 0.0 6.3 a 0.1 7.1 a 0.1
180 1500 4 6.0 ab 0.2 6.8 ab 0.0 6.3 a 0.0 7.0 a 0.0
180 2000 4 6.4 a 0.3 6.8 a 0.1 6.4 a 0.1 7.1 a 0.1
Pr>F 0.08 0.25 0.51 0.48

36
Plan of work for 2010
March, 2010 Initial soil sampling of all 28 plots at 0-6‖ and 6-12‖ depths to measure
surface and subsoil acidity.
April – May, 2010 Fertilizer applications, and planting.
July – September, 2010 Field observations, measurements and management of experimental plots.
October- November, 2010 Harvesting, yield measurements, end of season soil sampling, soil
analysis.
December, 2009 Statistical analysis, data summary and report writing
This is the second year of the field calibration studies and this study will be continued until 2011. The
time table for 2011 will be the same as 2010. Three years of data will be summarized a manuscript will be
written for be publication in Soil Science Society or Agronomy Journal.
37
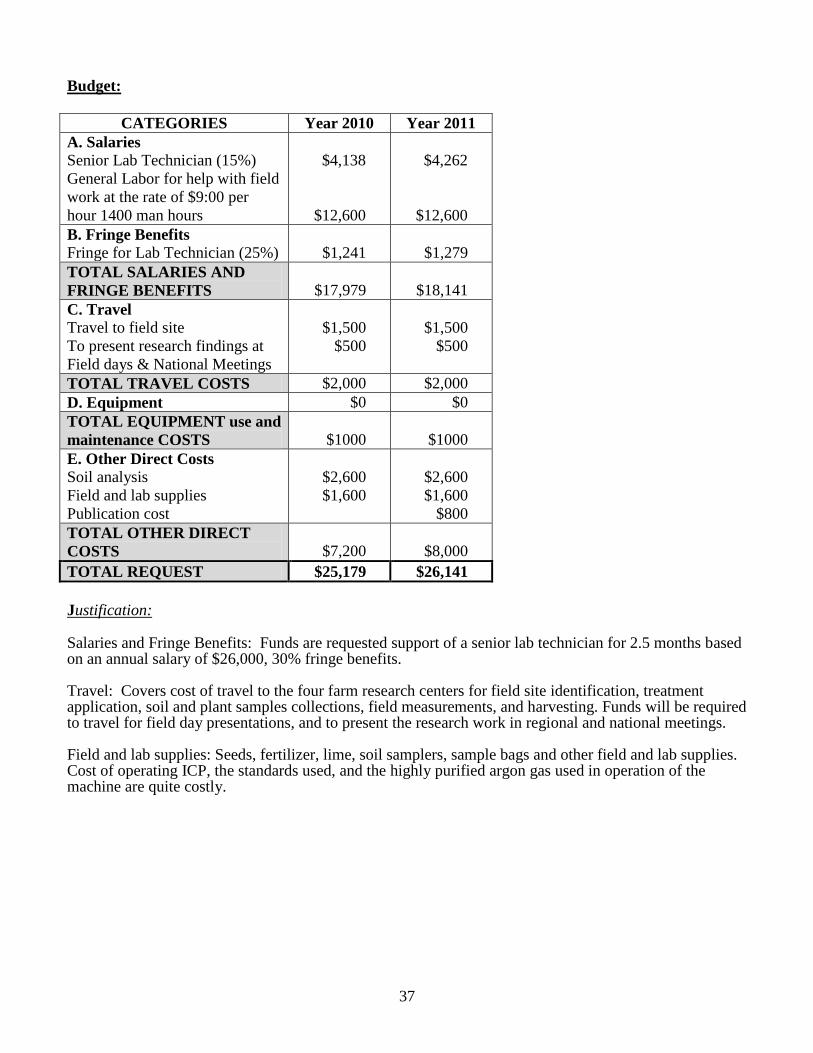
Budget:
CATEGORIES Year 2010 Year 2011
A. Salaries
Senior Lab Technician (15%)
General Labor for help with field
work at the rate of $9:00 per
hour 1400 man hours
$4,138
$12,600
$4,262
$12,600
B. Fringe Benefits
Fringe for Lab Technician (25%)
$1,241
$1,279
TOTAL SALARIES AND
FRINGE BENEFITS
$17,979
$18,141
C. Travel
Travel to field site
To present research findings at
Field days & National Meetings
$1,500
$500
$1,500
$500
TOTAL TRAVEL COSTS $2,000 $2,000
D. Equipment $0 $0
TOTAL EQUIPMENT use and
maintenance COSTS
$1000
$1000
E. Other Direct Costs
Soil analysis
Field and lab supplies
Publication cost
$2,600
$1,600
$2,600
$1,600
$800
TOTAL OTHER DIRECT
COSTS
$7,200
$8,000
TOTAL REQUEST $25,179 $26,141
Justification: Salaries and Fringe Benefits: Funds are requested support of a senior lab technician for 2.5 months based on an annual salary of $26,000, 30% fringe benefits. Travel: Covers cost of travel to the four farm research centers for field site identification, treatment application, soil and plant samples collections, field measurements, and harvesting. Funds will be required to travel for field day presentations, and to present the research work in regional and national meetings. Field and lab supplies: Seeds, fertilizer, lime, soil samplers, sample bags and other field and lab supplies. Cost of operating ICP, the standards used, and the highly purified argon gas used in operation of the machine are quite costly.

38
Nitrogen Management

39
Progress Reports
Utility of Polymer-Coated Urea as a Fall-Applied N Fertilizer Option for Corn and
Wheat Peter Motavalli, Kelly Nelson, and Pat Nash
Peter Motavalli, Dept. of Soil, Environ., and Atmos. Sci., Univ. of Missouri
Kelly Nelson, Div. of Plant Sciences, Univ. of Missouri, Novelty, MO
Pat Nash, Dept. of Soil, Environ., and Atmos. Sci., Univ. of Missouri
INTRODUCTION Management strategies to reduce soil N loss include improved timing of N fertilizer applications,
better use of soil and plant testing procedures to determine N availability, application of nitrification or
urease inhibitors, and use of N fertilizer sources that are suitable for local environmental conditions
(Dinnes et al., 2002). The use of slow-release nitrogen (N) fertilizer for corn and wheat may be a cost-
effective management practice to increase crop performance and allow for a single N fertilizer application
in the fall or early spring.
Prior research has indicated that deep banding of fall-applied polymer coated urea (PCU) may
outyield deep banded urea, broadcast applied PCU, and anhydrous ammonia (Randall, personal
communication). Nitrogen release in Missouri over the winter was less than 30% for fall applied PCU
applications and there was more consistent N release when PCU was deep banded than when surface
applied (Nelson and Motavalli, 2007b). Reduced efficiency of surface applied PCU may be due to
gaseous N losses over the winter months during freeze-thaw events. Deep banding PCU with strip tillage
should improve efficiency and make it a cost-effective alternative to applying anhydrous ammonia.
Wheat research in MO has evaluated application timings (Medeiros et al., 2005) and fall compared
to split applications of PCU (Nelson and Motavalli, 2007a). Applications of PCU later than February
resulted in grain yields less than other N sources (Medeiros et al., 2005). In four years of research, fall-
applied PCU had the greatest N uptake and grain yields when compared to fall-applied urea alone (Nelson
and Motavalli, 2007a). No research has evaluated fall application timings of PCU compared with other N
sources to determine if a single fall application at the time of planting wheat or later had yields similar or
greater than standard applications of ammonium nitrate. A single fall application would save farmers
application cost of a split application in the fall and spring. Spring applications of N on wheat are usually
challenging due to wet conditions and risk of N loss. In addition, research is needed to evaluate the
response of wheat to blends of urea and PCU.
The objectives of this research have been to: 1) evaluate yield response of fall-applied PCU
compared with non-coated urea and anhydrous ammonia with and without N-serve for corn and 2)
evaluate the effect of fall-applied timings of PCU and blends of PCU with non-coated urea (NCU) on
wheat yields when compared to non-coated urea and ammonium nitrate. An additional objective which
was initiated in 2009 was to determine the relative cumulative soil nitrous oxide (N2O) loss with
treatments of different pre-plant N fertilizer sources and fertilizer application/tillage methods. Reducing

40
soil N2O losses may increase N use efficiency and decrease the potential loss of an important greenhouse
gas.
MATERIALS AND METHODS
Research was conducted at the Greenley Research Center near Novelty, MO in 2008 and 2009.
For the corn studies, two field trials with three replications at each trial were established at the Greenley
Research Center in plots 10 by 70 ft. One trial followed soybean residue and the other followed red
clover residue that was frost-seeded into wheat the previous year. Treatments included PCU and non-
coated urea (NCU) at 125 lbs N/acre broadcast surface applied and deep banded using a Yetter® 2984
strip-till system equipped with high residue Maverick® units with a rolling basket and dry fertilizer
application tubes. A Gandy Orbit Air ground drive fertilizer applicator was used to deliver PCU and
NCU for the strip-tilled treatments. Dry fertilizer was placed approximately 8 inches deep in the strip
tilled region. Nitrogen treatments were applied in the fall, early preplant (approximately 1 month before
planting), and prior to planting. A non-treated and standard anhydrous treatment at 125 lbs N/acre was
included as controls. The N application rate was reduced to determine the most efficient N sources.
Soil nitrous oxide N flux was determined periodically during the growing season using a vented
PVC collection chamber (5 inches high and 8 inch inside diameter) based on the GRACEnet standard
protocol recommended by the USDA-Agricultural Research Service (Baker et al., 2003). Head space gas
samples were taken using a 10 ml syringe at 0, 30 and 60 minutes after capping to determine gas flux.
The gas samples were then injected into pre-evacuated 5 mL serum bottles for storage and transport to the
laboratory. Soil temperature was measured in triplicate around each chamber during the gas collection
process with a digital thermometer at the 2 inch depth. Soil samples to a 2 inch depth were also taken in
triplicate within 20 inches from the center of the chamber for determination of gravimetric soil water
content and soil inorganic N (NH4+-N + NO3
--N). Gas samples were analyzed using a gas chromatograph
(GC) (Buck Scientific Inc., East Norwalk, CT, USA) fitted with an electron capture detector (ECD). The
ECD temperature was 300°C, and the standing current was 350 milliamps. The make-up gas was ultra-
high purity dinitrogen. Carrier gas (high purity helium) flow rate (through a 1.8 m Porapak Q column at
50°C) was 18 mL min-1
. The concentration of the sub-sampled gas was determined based on a standard
curve using incremental aliquots of a 10 µL L-1
N2O standard gas (Scott Specialty Gases, Plumsteadville,
PA, USA).
The soybean residue study was planted to ‗DKC63-42‘ at 30,000 seeds/acre on 6 May 2008 and
23 Apr. 2009. In the clover residue study, ‗DKC61-69‘ was planted at 30,000 seeds/acre on 29 May 2008
and 23 Apr. 2009. The planter was equipped with Shark-tooth® residue cleaners used in tandem with a
no-till coulter. The residue cleaners performed well in heavy residue of the no-till plots and provided a
smooth seedbed above in strip-tilled plots. Grain yields were determined and grain collected to evaluate
for starch, protein, and oil concentration. Grain moisture was adjusted to 15% prior to analysis. A gross
margin will be calculated for each treatment to compare relative returns of fall compared with preplant
treatments at the conclusion of the experiment.
For the wheat studies, the research was arranged as a randomized complete block design with five
replications in 10 by 30 ft plots. ‗Pioneer 25R56‘ was no-till drilled following an application of 20-50-
100 on 30 October 2008 at 120 lbs/acre in 7.5 in. rows. PCU release was determined using mesh bags
that were deployed on nine different dates and recovered at subsequent dates, washed in cold water, dried,
weighed, and percent release calculated. Polymer coated urea (PCU, ESN, Agrium), non-coated urea
(NCU, fast release), 75:25 PCU:NCU, and 50:50 PCU:NCU fertilizer treatments were applied at 75 and
100 lbs N/acre on 7 application dates in 2009. Plots were harvested with a small-plot combine. Grain

41
moisture was adjusted to 13% prior to analysis. All data were subjected to analysis of variance and means
separated using Fisher‘s Protected LSD (P=0.05).
RESULTS
The first two years (2008 and 2009) of this three-year field trial had above average rainfall during
the growing seasons resulting in wet soil conditions.. These conditions would also be expected to
promote environmental N loss due to nitrate leaching, lateral flow, and denitrification.
Corn following soybean residue. The soils within the strip-tilled bands appeared to be drier than soil
under no-till management (personal observation). Among the treatments, anhydrous ammonia with and
without N-Serve and deep banded PCU with strip-till at all application dates had the highest corn grain
yields (Fig. 1). Deep banded NCU with strip-till averaged 53 bu/acre higher grain yield compared to
broadcast NCU in no-till over all application dates (Fig. 1). Use of N-Serve with anhydrous ammonia and
the deep banded PCU with strip till had the highest yields among the fall-applied treatments and did not
show any significant difference with yields observed for the same treatments applied in early spring
(March) or pre-plant (April). Corn grain yield was ranked anhydrous ammonia = anhydrous ammonia
plus N-serve = PCU strip-till > NCU strip-till > PCU broadcast > NCU broadcast > untreated strip-till =
untreated no-till.
Corn following clover residue. As was observed with the corn following soybean, corn following clover
had the highest grain yields with treatments of anhydrous ammonia with and without N-Serve and deep
banded PCU with strip-till (Fig. 2). However, the deep banded NCU with strip till did not show as much
of a yield advantage over broadcast NCU under no-till with fall application as compared to the early
spring and pre-plant applications. Corn grain yield when averaged over application timing was ranked
anhydrous ammonia plus N-serve = PCU strip-till = anhydrous ammonia > NCU strip-till > PCU
broadcast > NCU broadcast = untreated strip-till = untreated no-till.
Nitrous oxide loss. Cumulative soil N2O loss ranged from 1.5 to 3.1 % of the fertilizer N applied (Fig. 3).
As expected, cumulative loss with N fertilizer treatments was significantly higher than that of the
untreated plots. Higher losses tended to occur when the N fertilizer was broadcast applied under no-till as
compared to deep banded fertilizer with strip-till. Although the PCU no-till/broadcast treatment appeared
to have higher N2O loss compared to the NCU no-till broadcast treatment, this difference is not
statistically significant, possibly due to the high variation in soil N2O flux measurements among the
replicates of the same treatment.
Wheat. As was observed in the previous cropping year, rainfall was above average in the fall and spring
of 2008 and 2009. Over 50% of PCU applied from October to February was released by 15 June 2009
(Fig. 4). The non-treated check grain yield was 53 bu/acre in 2008 (data not presented) and 30 bu/acre in
2009. There was a significant grain yield to response to all N treatments in 2008 and all but 100% PCU
applied in April, 2009 (data not presented). Grain yields at 100 lbs N/acre averaged 5 bu/a greater than 75
lbs N/acre in 2008 while there was virtually no difference between rates in 2009 when averaged over all
application timings (data not presented).
In 2008, wheat yield was ranked PCU = 75:25 PCU:NCU > 50:50 PCU:NCU > NCU for the
October, November, December, January, February and March application timings (data not presented).
However, the April 14 application timing resulted in grain yield rankings of 50:50 PCU:NCU = NCU >
75:25 PCU:NCU > PCU. Icy conditions at the December application timing and frozen conditions at the
February application timing probably contributed to lower yields for these application timings. In

42
general, there was a rate response to decreasing amounts of PCU for the October, January, and February
application timings.
Head scab, Septoria leaf blotch, and common rust was prevalent in 2009 which reduced overall
grain yields and test weight (data not presented). PCU applied at planting was similar or greater than all
application timings of PCU alone which was related to reduced release later in the season (Fig. 5). A
mixture of PCU with NCU was required at the April application timing in 2009. Fall applications of PCU
or a blend of PCU:NCU at 75:25 had yields similar to or greater than spring applied N in 2008 while a
50:50 blend of PCU:NCU had the most consistent yields in 2009.
SUMMARY
Corn
In wet years, deep banding NCU or PCU under strip tillage has shown more consistent advantages in
crop performance.
Fall application of anhydrous ammonia plus N-Serve and deep banded PCU under strip tillage may
reduce N losses associated with fall N applications and improve crop yields compared to broadcast
PCU and NCU under no-till.
Soil nitrous oxide losses from pre-plant N applications may range as high as 3% of fertilizer N applied
under wet soil conditions as experienced in 2009.
Wheat
Fall applied PCU or as a blend of PCU:NCU in ratios of 50:50 or 75:25 is an option for wheat
production in northeastern Missouri.
PCU applications in Northeast Missouri from mid-March and later should include a greater amount of
NCU in the blend to maintain maximum grain yields based on our results in 2008 and 2009.
Grain yields prior to mid-March were more variable in the NCU treated wheat when compared to PCU
or blends of NCU with PCU.
Timetable: October-December 2009 Prepare treatments, plot preparation, and apply fall application timings for corn
and wheat studies
April-September 2010 Apply preplant N treatments soil sample in the spring and prior to harvest.
September 2010 Harvest
Oct-Dec 2010 Analyze and summarize results for final report.
References: Baker, J. et al. 2003. GRACEnet: Chamber-based trace gas flux measurement protocol. Agricultural
Research Service, U.S. Dept. of Agriculture. Washington, DC.
Dinnes, D.L., D.L. Karlen, D.B. Janes, T.C. Kaspar, J.L. Hatfield, T.S. Colvin, and C.A. Cambardella.
2002. Nitrogen management strategies to reduce nitrate leaching in tile-drained Midwestern soils.
Agron. J. 94:153-171.
Medeiros, J.A.S., P. Scharf, and L. Mueller. 2005. Making urea work in no-till. Abstr. Am. Soc. Agron.
Madison, WI. [non-paginated CD-ROM].
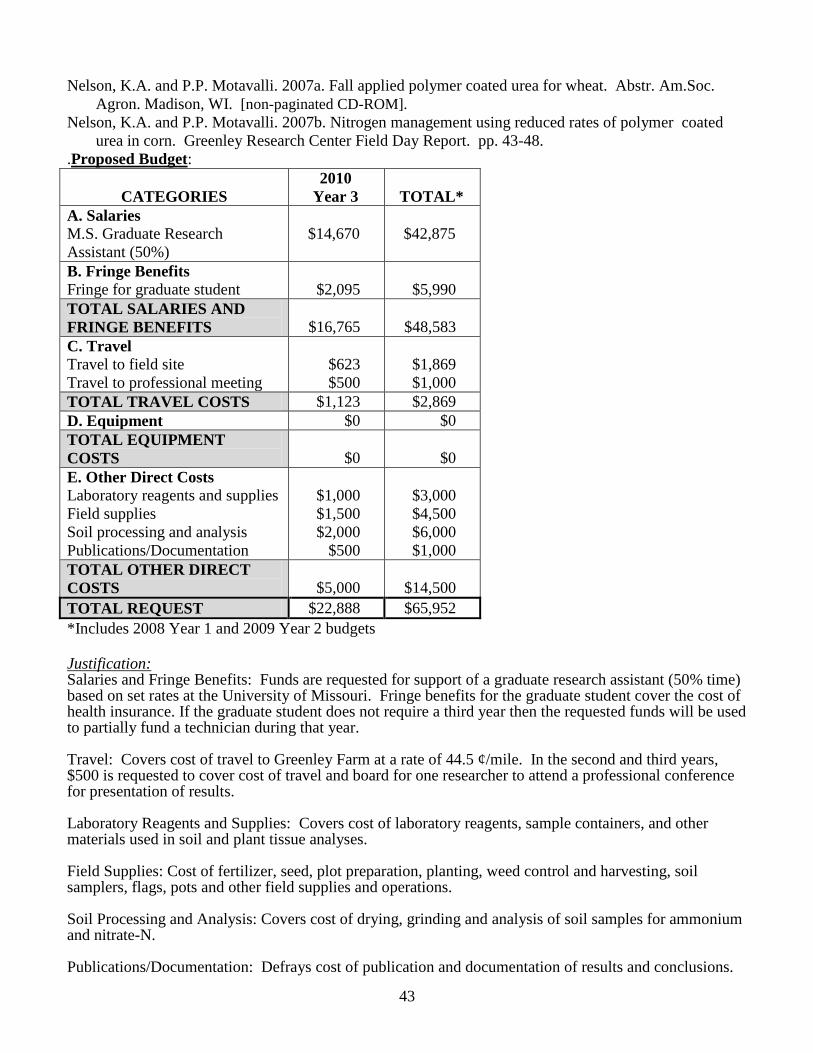
43
Nelson, K.A. and P.P. Motavalli. 2007a. Fall applied polymer coated urea for wheat. Abstr. Am.Soc.
Agron. Madison, WI. [non-paginated CD-ROM].
Nelson, K.A. and P.P. Motavalli. 2007b. Nitrogen management using reduced rates of polymer coated
urea in corn. Greenley Research Center Field Day Report. pp. 43-48.
.Proposed Budget:
CATEGORIES
2010
Year 3
TOTAL*
A. Salaries
M.S. Graduate Research
Assistant (50%)
$14,670
$42,875
B. Fringe Benefits
Fringe for graduate student
$2,095
$5,990
TOTAL SALARIES AND
FRINGE BENEFITS
$16,765
$48,583
C. Travel
Travel to field site
Travel to professional meeting
$623
$500
$1,869
$1,000
TOTAL TRAVEL COSTS $1,123 $2,869
D. Equipment $0 $0
TOTAL EQUIPMENT
COSTS
$0
$0
E. Other Direct Costs
Laboratory reagents and supplies
Field supplies
Soil processing and analysis
Publications/Documentation
$1,000
$1,500
$2,000
$500
$3,000
$4,500
$6,000
$1,000
TOTAL OTHER DIRECT
COSTS
$5,000
$14,500
TOTAL REQUEST $22,888 $65,952
*Includes 2008 Year 1 and 2009 Year 2 budgets
Justification: Salaries and Fringe Benefits: Funds are requested for support of a graduate research assistant (50% time) based on set rates at the University of Missouri. Fringe benefits for the graduate student cover the cost of health insurance. If the graduate student does not require a third year then the requested funds will be used to partially fund a technician during that year. Travel: Covers cost of travel to Greenley Farm at a rate of 44.5 ¢/mile. In the second and third years, $500 is requested to cover cost of travel and board for one researcher to attend a professional conference for presentation of results. Laboratory Reagents and Supplies: Covers cost of laboratory reagents, sample containers, and other materials used in soil and plant tissue analyses. Field Supplies: Cost of fertilizer, seed, plot preparation, planting, weed control and harvesting, soil samplers, flags, pots and other field supplies and operations. Soil Processing and Analysis: Covers cost of drying, grinding and analysis of soil samples for ammonium and nitrate-N. Publications/Documentation: Defrays cost of publication and documentation of results and conclusions.
44
Figure 1. Corn grain yield response to N fertilizer sources applied in the fall, early preplant, and preplant following soybean residue in 2009. LSD (P<0.05) was 39 bu/acre. Figure 2. Corn grain yield response to N fertilizer sources applied in the fall, early preplant, and preplant following clover residue in 2009. LSD (P<0.05) was 31 bu/acre.

45
Figure 3. Cumulative nitrous oxide (N2O-N) gas loss in 2009 due to different preplant N fertilizer sources
and methods of application and tillage in a corn crop following soybean. The proportion of total applied
fertilizer N lost as nitrous oxide over the growing season is indicated next to each treatment.

46
Figure 4. Polymer-coated urea (PCU, ESN) fertilizer release for individual application dates from fall,
2008 to spring, 2009. The LSD (P<0.05) was 9. Figure 5. The effect of polymer- (PCU, ESN) and non-coated (NCU) urea application timings and ratios at 100 lbs N/acre on grain yield in 2009. LSD (p=0.05) was 11 bu/acre.
47
Addressing nitrogen controversies Peter Scharf and Larry Mueller
Peter Scharf and Larry Mueller, University of Missouri, Plant Sciences Division
Objective: The objective of this project is to collect data that will help to address several controversies about nitrogen management, including: 1) How do various nitrogen rate recommendation systems perform? 2) Is foliar N more efficient than soil-applied N, and is Coron more efficient than UAN? 3) Among the range of new N products and N-enhancement products, which are profitable to
use and how do they rank? Accomplishments for 2009:
Three separate small-plot experiments (addressing objectives 1, 2, and 3 listed above) were conducted as planned at Bradford Farm near Columbia. All experiments used corn as the test crop. Unfortunately the foliar N experiment was harvested accidentally by the farm crew as bulk corn. We plan to extend this experiment an additional year (into 2011) to make up for the data lost this year. Results from the other two experiments are reported below.
Nitrogen rate recommendation systems experiment 2009 was, like 2008, a very wet year, especially in May and June. This wet weather apparently caused loss of much of the N applied at planting. By early
August, all of the treatments with preplant nitrogen appeared severely nitrogen-deficient over the entire plant (see photo below). We observed the classic V-shaped nitrogen deficiency burn up the midrib on all plants in these treatments, usually up to the leaf below the ear leaf.
The experiment was planted on April 25 and nitrogen treatments were applied the same day
(broadcast ammonium nitrate). Many producers applied their N earlier than this, and there was a great deal of N deficiency across the state. I estimate that Missouri corn producers lost 110 million bushels due
to N deficiency in 2009. All sidedress nitrogen
treatments had much better leaf color (see photo). In early August these treatments were green right down to their lowest leaves (unlike 2008 when even sidedress plots had deficiency symptoms).
48
Nitrogen timing had a large effect on yield in this experiment. o Plots receiving preplant N had an average yield of 70 bu/acre (see table next page). o Plots receiving sidedress N had an average yield of 168 bu/acre, an advantage of nearly
100 bu/acre. o Part of this advantage is due to the fairly high N rates recommended by all three sidedress
recommendation systems in this wet year. Even so, two sidedress treatments applied less N than the 180 preplant N rate but out-yielded it by 68 or more bushels.
o This large yield advantage to sidedress is in agreement with the appearance of the plants as shown in the photos on the previous page.
After three years, the most profitable systems are the two systems in which N rate is based
on corn color (Crop Circle sensor and Minolta chlorophyll meter). o These systems gave profits $160/acre/year above the profits given by the most profitable
preplant N management system (which was the high N rate). o This is mostly due to the poor yields with preplant N in 2008 and 2009. o They also out-performed sidedress N management based on soil nitrate testing (Iowa
State University interpretations) by about $25/acre/year. - Yield was higher with color-based management than soil-test-based management in the
first two years. Table 1. Nitrogen rates recommended and corn yields produced by eight different recommendation systems in 2009 and 2007-2009.
Nitrogen rate recommendation system
Nitrogen timing
Nitrogen rate(s) 2009
Yield 2009*
3-yr ave Nitrogen rate
3-yr ave Yield
Gross minus N cost (3-
year ave)**
lb N/ac bu/ac lb N/ac bu/ac $/ac
Crop Circle sensor V7† 165, 191, 172, 166,
144, 162‡
166 132 148 513
Chlorophyll meter V7 222 174 162 152 509
Sidedress soil test V7 153 164 115 139 486
High preplant 180 96 180 115 351
Yield goal / MRTN preplant 140 64 137 102 322
Preplant soil test preplant 132 64 140 99 313
Low preplant 100 51 100 92 308
Check ------- 0 28 0 60 241
*2009 yields are different than each other (95% confidence) if they are 14 or more bushels apart. **Used $4/bu corn price, $0.60/lb N price as estimates of average corn & N prices over these 3 years. †Growth stage V7 is about knee high corn.
‡A different N rate was applied in each of 6 replications for this treatment. Average N rate was 167 lb N/acre. It is
feasible to use this sensor to change N rate automaticallly while fertilizing a field, and we felt that this ability would be most accurately reflected by diagnosing N rate for each plot separately.

49
New N products and N-enhancement products experiment
This experiment was designed to test the new N products Calcium Ammonium Nitrate and Nurea, the new N-enhancement products ESN, Nfusion, and Nutrisphere, along with the established N-enhancement product Agrotain. All treatments are dry broadcast N products except for the Nfusion treatment which was mixed with UAN solution and injected.
No-till corn is the test crop. Soybean was the previous crop.
A nitrogen rate of 140 lb N/acre was used for all treatments, applied on April 24, followed by planting on April 25 and replanting on May 21 at 30,300 seeds/acre.
Table 2. Yields with new N sources or N additives compared to standard dry N products.
Nitrogen source 2009 yield*
2008 yield**
2-yr ave yield
ESN 140 124 132
UAN + Nfusion 136 ----*** ----***
Urea + Agrotain 126 107 117
Urea + Nutrisphere 124 104 114
Ammonium nitrate 115 102 108
Calcium ammonium nitrate 108 106 107
Urea 120 93 106
Nurea 122 84 103
Check (0 N) 74 ----*** ----***
*Yields are different than each other (95% confidence) if they are 13 or more bushels apart. **Yields are different than each other (95% confidence) if they are 18 or more bushels apart. ***Not included in 2008 experiment.
Yields were not very good in this experiment considering the lack of drought stress. o Nitrogen timing (leading to N deficiency) was probably the main reason. o Yields for sidedress treatments in the N Recommendation Systems experiment were 24 or
more bushels higher than the best-yielding treatment in this experiment, even though that experiment is corn after corn and this one is corn after soybean.
ESN gave the highest yield for the second year in a row, demonstrating its value in protecting against N loss in the wet conditions that we’ve had in 2008 and 2009. Yield with ESN was statistically better than every other treatment except UAN + Nfusion. This is consistent with other experiments in Missouri where ESN increased yield under wet conditions. ESN is a coated urea product that slowly releases the urea from the capsule.
As noted above, yields with sidedress treatments in the N Systems experiment were

50
considerably better than yields with ESN in this experiment. In 2008, split-applied N with an 80 lb N/acre total rate (30 pre, 50 in-season) out-yielded 140 lb N/acre preplant as ESN. Although these numbers are from separate experiments, they suggest that pre-plant ESN does not perform as well as having some N applied in-season in wet years. ESN appears to be the best N source (except possibly anhydrous ammonia) when applied preplant in a wet year, but its performance is not good enough to avoid the need for in-season N under those conditions.
UAN blended with Nfusion also produced an average yield statistically higher than most other treatments. Nfusion is a slow-release N producet produced by Georgia-Pacific. It is a blend of methylene urea and triazone. This treatment was a 80-20 blend of UAN-Nfusion and did surprisingly well considering that only 20% of the N was in a slow-release form.
Evidence of yield differences between the remaining treatments is limited. Nearly 5 inches of rain fall within a week of treatment application, starting with 2 inches 2 days after treatment application. Thus urea volatilization would not be expected to be a problem. Leaching or denitrification of nitrate-N would be the main expected loss pathway. Only the slow-release N products are intended to prevent or reduce this type of loss.
51
Table 3. Details of experimental procedures for the three experiments in this project.
Operation
Experimental details for:
N rate rec. systems Foliar / in-season N New sources of dry N
Starting condition Previous corn, no-till, 70-75% residue cover
Previous soybean, no-till, 20-30% residue cover
Previous soybean, no-till, 20-30% residue cover
Pre-plant soil sampling
March 31 none none
Weed control: broadcast herbicide application
4/24/2009: Burn down - Graxmoxone 2.0 pts/ac
Residual - Lexar 3.0 qts/ac
Nonionic surfactant – 2 pt /100/gal
Pre-plant broadcast fertilizer treatments
3 fixed rate treatments &
MO pre-plant soil test treatment
4/25/2009
All plots
30 lbs/ac N
Source - Ammonium Nitrate
4/09/2009
All treatments applied pre-plant
4/24/2009
Planting Planted 4/25/2009, replanted 5/21-22/2009
Planter: John Deere 7000 w/finger pickup
Variety: Pioneer 35F44, RR2 Herculex xtra
Seed drop: 30,300, depth: 1.25" - 1.50"
Conditions: Moist
In-season weed control
Roundup 24 oz/ac
6/21/2009
Side-dress Treatment
Applications
July 2 July 1
July 8
none
Harvest November 6 Mistakenly harvested by farm crew, no data taken
November 5

52
Objective for 2010 Repeat these three experiments:
N rate recommendation systems
Foliar vs. soil-applied N
New N products/additives Budget for 2010 Research Specialist time $15,000 Benefits 4,500 Soil sample analysis 200 Field supplies and fuel 800 Total $20,500

53
Nitrogen dynamics of standard and enhanced urea in corn
James H. Houx III and Felix B. Fritschi
INTRODUCTION:
Concerns about illegal uses of anhydrous ammonia and ammonium nitrate may make urea a more suitable
N fertilizer choice in the future. Urea is more concentrated than most N sources and thus may be more
economical to apply. However, urea is subject to volatilization losses that in extreme circumstances can
be as much as 50% (Harrison and Webb, 2001). To combat N losses from urea, manufacturers have
developed additives and specialty N fertilizer products designed to inhibit N losses and prolong the N
release period. These characteristics may reduce leaching and nitrate runoff, and may reduce emissions of
N-containing greenhouse gases. Further, they may offer producers some flexibility in their N
management decisions.
OBJECTIVE:
The overall objective of this project is to evaluate different Urea-N management products on the fate of
fertilizer N and corn yields.
Specifically, we will:
1) Evaluate corn yield response to fertilization with standard urea and enhanced N-urea
(Agrotain, Nutrisphere, and ESN).
2) Examine timing and quantity of corn fertilizer N uptake, fertilizer N use efficiency, and
recovery in the soil base for these product classes using 15
N tracer techniques.
2009 ACCOMPLISHMENTS AND UPDATE:
This year (2009) was the first year of a 3-year project evaluating urea-N management products on
corn yield and nitrogen uptake, nitrogen use efficiency, and recovery of soil nitrogen following
corn harvest.
The following treatments were randomly applied to 20‘ x 100‘ plots and replicated four times at
the Bradford Research and Extension Center. Four, square-meter microplots were embedded in
each plot receiving treatments 2, 3, and 4 in which 15
N-enriched urea at 2% atom excess was
supplanted for standard urea.
Main Treatments: (6 treatments to evaluate product effect on yield)
1) Zero fertilizer N
2) Urea (15
N microplot)
3) Agrotain treated Urea (15
N microplot)
4) PCU (Polymer coated Urea—Duration 75) (15
N microplot)
5) Nutrisphere treated Urea
6) ESN urea
7) 28% UAN (as a growers standard)

54
International Fertilizer Development Corporation (IFDC) in Mussel Shoals, AL manufactured the 15
N urea and we received the material in April 2009. The pellet size was consistent with bagged
urea purchased from MFA.
Pioneer hybrid 33M16 (corn) was no-till planted into good soil conditions on May 20, 2009 and
established a uniform population of approximately 31,600 plants/acre. At this later planting date,
we had no establishment or emergence problems associated with earlier planting dates this
growing season.
The N treatments were broadcast surface-applied (except injected UAN) at a rate equivalent to 150
lbs N/acre the day after planting.
Soil and plant tissue samples were taken periodically in the main plots and 15
N microplots during
the growing season and following harvest—these samples are being processed and analyzed.
Once soil and tissue samples have been analyzed, full-season fertilizer use efficiency, amount of
plant N derived from fertilizer, amount of fertilizer N removed from the field with the grain, and 15
N remaining in the soil will be determined to construct a fertilizer N balance.
2009 PRELIMINARY RESULTS:
NOTE: these data are from one experimental year.
The highest yield (172 bu/ac) resulted from
PCU (Duration-75, Agrium) which was
similar to 155 bu/ac from injected UAN
(Fig. 1).
There were no statistically significant yield
differences between ESN, Agrotain-treated
urea, untreated urea, and Nutrisphere-treated
urea which yielded 139, 138, 129, and 124
bu/ac, respectively (Fig 1). However, yields
from these products were less than that from
PCU.
Yield differences corresponded to differences
in kernel weight (Fig. 2) with PCU
applications resulting in the highest kernel
weight of 36.3 grams/100 kernels and the zero
N fertilizer resulting in the lowest kernel
weight of 27.1 grams/100 kernels.
There were no statistically significant
differences in kernel weight between
Agrotain-treated urea, ESN, Nutrisphere-
treated urea, and untreated urea. These
treatmtents resulted in 100 kernel weights of
32.4, 31.9, 30.8, and 30.5 grams, respectively.
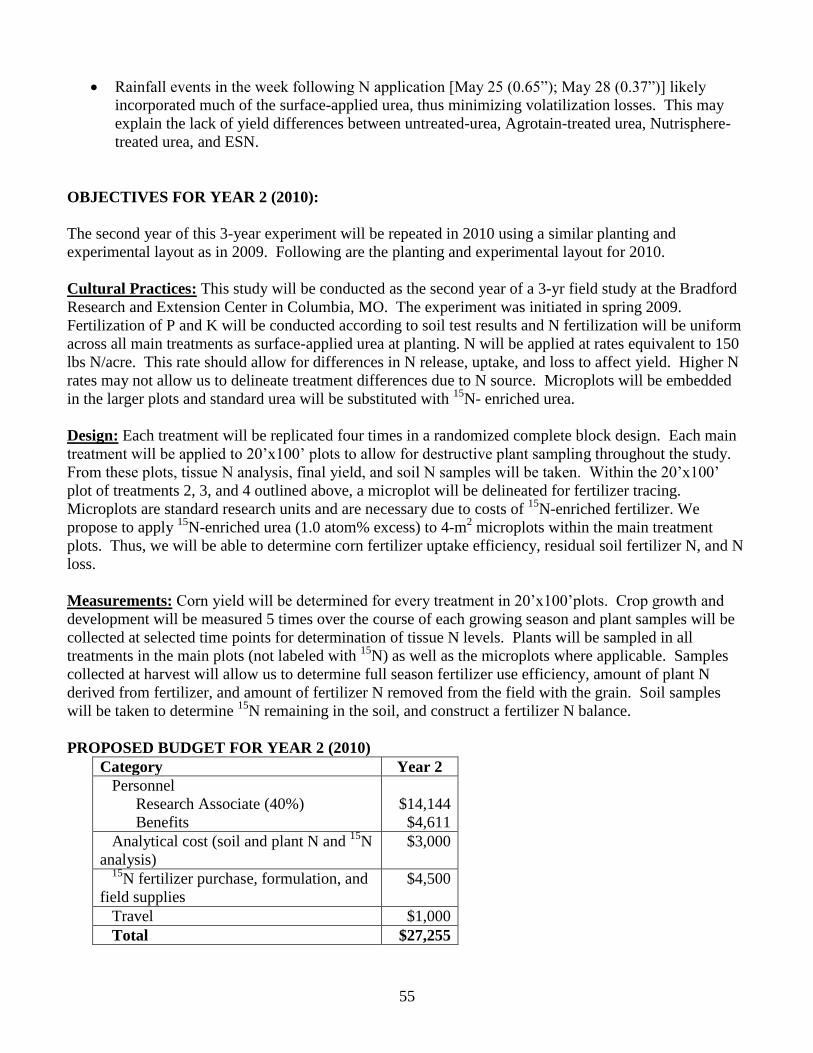
55
Rainfall events in the week following N application [May 25 (0.65‖); May 28 (0.37‖)] likely
incorporated much of the surface-applied urea, thus minimizing volatilization losses. This may
explain the lack of yield differences between untreated-urea, Agrotain-treated urea, Nutrisphere-
treated urea, and ESN.
OBJECTIVES FOR YEAR 2 (2010):
The second year of this 3-year experiment will be repeated in 2010 using a similar planting and
experimental layout as in 2009. Following are the planting and experimental layout for 2010.
Cultural Practices: This study will be conducted as the second year of a 3-yr field study at the Bradford
Research and Extension Center in Columbia, MO. The experiment was initiated in spring 2009.
Fertilization of P and K will be conducted according to soil test results and N fertilization will be uniform
across all main treatments as surface-applied urea at planting. N will be applied at rates equivalent to 150
lbs N/acre. This rate should allow for differences in N release, uptake, and loss to affect yield. Higher N
rates may not allow us to delineate treatment differences due to N source. Microplots will be embedded
in the larger plots and standard urea will be substituted with 15
N- enriched urea.
Design: Each treatment will be replicated four times in a randomized complete block design. Each main
treatment will be applied to 20‘x100‘ plots to allow for destructive plant sampling throughout the study.
From these plots, tissue N analysis, final yield, and soil N samples will be taken. Within the 20‘x100‘
plot of treatments 2, 3, and 4 outlined above, a microplot will be delineated for fertilizer tracing.
Microplots are standard research units and are necessary due to costs of 15
N-enriched fertilizer. We
propose to apply 15
N-enriched urea (1.0 atom% excess) to 4-m2 microplots within the main treatment
plots. Thus, we will be able to determine corn fertilizer uptake efficiency, residual soil fertilizer N, and N
loss.
Measurements: Corn yield will be determined for every treatment in 20‘x100‘plots. Crop growth and
development will be measured 5 times over the course of each growing season and plant samples will be
collected at selected time points for determination of tissue N levels. Plants will be sampled in all
treatments in the main plots (not labeled with 15
N) as well as the microplots where applicable. Samples
collected at harvest will allow us to determine full season fertilizer use efficiency, amount of plant N
derived from fertilizer, and amount of fertilizer N removed from the field with the grain. Soil samples
will be taken to determine 15
N remaining in the soil, and construct a fertilizer N balance.
PROPOSED BUDGET FOR YEAR 2 (2010)
Category Year 2
Personnel
Research Associate (40%)
Benefits
$14,144
$4,611
Analytical cost (soil and plant N and 15
N
analysis)
$3,000
15N fertilizer purchase, formulation, and
field supplies
$4,500
Travel $1,000
Total $27,255

56
Sensor-based sidedressing for cotton
Peter Scharf, Gene Stevens, David Dunn, Luciane Oliveira, and Andrea Jones University of Missouri, Division of Plant Sciences
Collaborator: Earl Vories, USDA-Agricultural Research Service
Objective: Develop reliable sensor interpretations as a basis for on-the-go variable-rate N sidedressing of cotton.
a. Determine sensor model and height that gives the best prediction of sidedress N need. b. Determine the best growth stage for sensor-based sidedressing. c. Develop recommendation equations to convert sensor readings to N rates. d. Test the system in production cotton fields.
Accomplishments for 2009:
Three N rate and timing experiments were carried out to: o Add to the sensor interpretation equations that we have already developed o Help answer the question of whether delaying in-season N to the early flower stage will
reduce yield. o Help answer the question of whether having no N preplant will reduce yield when
fertilizing at mid-square or early flower stages.
Three field-scale demonstrations of variable-rate N based on crop sensors were carried out. o Two with the Greenseeker sensor and one with the Crop Circle sensor. o Results are only available from one of these demonstrations so far. In that field (shown
below), use of sensors produced nearly $50/acre advantage over the producer’s uniform N rate.
2009 cotton demonstration field comparing sensor-based variable-rate N with a constant N rate chosen by the producer (aqua color), both applied at the mid-square growth stage. Sensors reduced N rate by 17 lb N/acre, and increased lint yield by 69 lb/acre, giving a $49 per acre advantage to sensor- based N in this field. Cost of sensors and management time are not included in this estimate. Micronaire and fiber length were greater with sensor- based N rates. We interpret this as being due to delayed maturity with the higher N rates with the constant-rate treatment.
57
Accomplishments 2007-2009 o We showed that Greenseeker, Crop Circle, and Cropscan sensors are all capable of
predicting how much N is needed for in-season application to cotton. All gave predictions of approximately equal accuracy.
o All three sensors performed best at mid-square and early flower (but NOT early square) growth stages from a height of 20 inches above the canopy.
o Recommendation equations that we developed (for 20-inch height only) are: - Crop Circle:
N rate = (178 x relative Vis/NIR) – 156 Or N rate = 573 – (549 x relative NDVI)
- Cropscan: N rate = (266 x relative Vis/NIR) - 245 or N rate = 691 - (673 x relative NDVI)
- Greenseeker: N rate = (122 x relative Vis/NIR) - 95 or N rate = 759 - (732 x relative NDVI)
- Vis = visible wavelength, we used green for Cropscan, yellow for Crop Circle, red for Greenseeker
- NIR = near-infrared wavelength - NDVI = normalized difference vegetative index, calculated from Vis and NIR - relative Vis/NIR = (Vis/NIR to be fertilized)/(Vis/NIR from area with high N rate) - relative NDVI = (NDVI to be fertilized)/(NDVI from area with high N rate) - These equations give N rates in lb N/acre and can be used on-the-go to translate
sensor measurements to N rates. o We discovered that sensor readings on a single cotton plant do not stay the same all day
long. This is a problem because the N rate needed by the plant DOES stay the same all day long. - These problems were worst with the Greenseeker sensor. The company is working to
address this problem. - Plants wetting and drying is one reason for changing sensor values. - Other reasons are not known yet but may be due to either the plant changing (wilting
leaves at mid-day, for example) or due to temperature or light sensitivity of sensors. - The solution to this problem is to frequently re-check the sensor readings from the
high-N reference area. N rates are calculated by comparison to readings from this area. Changes in plant or sensor status during the day will be reflected in the values measured from the high-N reference area.
- We have demonstrated at field scale that frequent re-checking of the high-N reference area can be accomplished by applying the high-N area crosswise to the rows. The applicator will then cross it each time it goes the length of the field. It can be programmed to know the location of the high-N area and to re-measure it each time the applicator crosses it.
- Several producers have tried this approach successfully. - One producer applied crosswise high-N reference strips to all of his fields using an
airplane. This process took only a few hours.
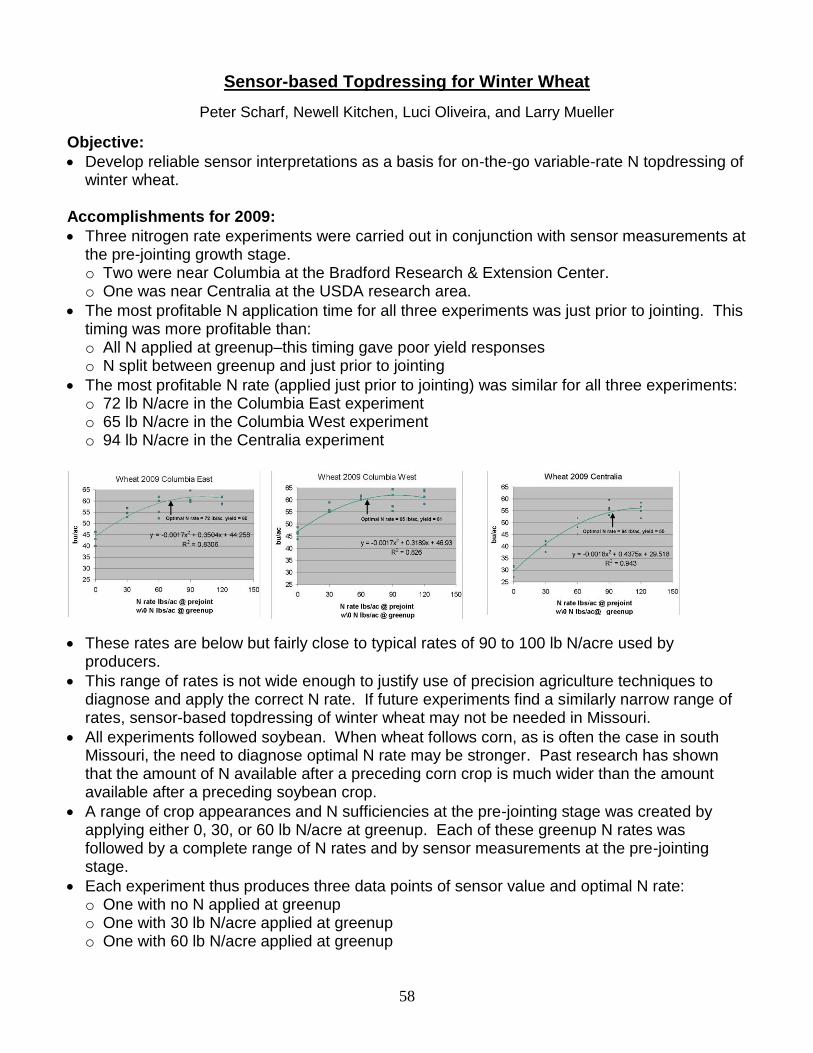
58
Sensor-based Topdressing for Winter Wheat
Peter Scharf, Newell Kitchen, Luci Oliveira, and Larry Mueller
Objective:
Develop reliable sensor interpretations as a basis for on-the-go variable-rate N topdressing of winter wheat.
Accomplishments for 2009:
Three nitrogen rate experiments were carried out in conjunction with sensor measurements at the pre-jointing growth stage. o Two were near Columbia at the Bradford Research & Extension Center. o One was near Centralia at the USDA research area.
The most profitable N application time for all three experiments was just prior to jointing. This timing was more profitable than: o All N applied at greenup–this timing gave poor yield responses o N split between greenup and just prior to jointing
The most profitable N rate (applied just prior to jointing) was similar for all three experiments: o 72 lb N/acre in the Columbia East experiment o 65 lb N/acre in the Columbia West experiment o 94 lb N/acre in the Centralia experiment
These rates are below but fairly close to typical rates of 90 to 100 lb N/acre used by producers.
This range of rates is not wide enough to justify use of precision agriculture techniques to diagnose and apply the correct N rate. If future experiments find a similarly narrow range of rates, sensor-based topdressing of winter wheat may not be needed in Missouri.
All experiments followed soybean. When wheat follows corn, as is often the case in south Missouri, the need to diagnose optimal N rate may be stronger. Past research has shown that the amount of N available after a preceding corn crop is much wider than the amount available after a preceding soybean crop.
A range of crop appearances and N sufficiencies at the pre-jointing stage was created by applying either 0, 30, or 60 lb N/acre at greenup. Each of these greenup N rates was followed by a complete range of N rates and by sensor measurements at the pre-jointing stage.
Each experiment thus produces three data points of sensor value and optimal N rate: o One with no N applied at greenup o One with 30 lb N/acre applied at greenup o One with 60 lb N/acre applied at greenup

59
Columbia experiments only
y = 142x - 160
R2 = 0.71
0
20
40
60
80
100
1 1.2 1.4 1.6 1.8
relative Greenseeker Vis/NIR 40"
op
tim
al
N r
ate
This automatically widens the range of optimal N rates measured at the pre-jointing growth stage.
The relationship between sensor readings and optimal N rates was good for, and consistent between, the two Columbia experiments. o This was true for both sensors (Greenseeker and Crop Circle 210). o It was also true when sensor readings were taken from either 20 inches or 40 inches above
the canopy. o An example is shown in the graph below. o Relative sensor reading is the
sensor reading for the plot to be fertilized divided by the sensor reading taken from the high-N plot at the same time. A value of 1 indicates that the two plots looked the same. The farther this value is above 1, the more difference there is in appearance between the two plots.
Unfortunately the results at the Centralia experiment were not consistent with the Columbia experiments. o The difference between high-N wheat and zero-N wheat at Centralia was small when
readings were taken on April 16-17. o High-N wheat at Centralia at this stage gave measurements that were no better than zero-
N plots in the Columbia experiments measured two weeks earlier. o Both of these observations may have been related to late planting–the Centralia
experiment was not planted until about November 20, while the Columbia experiments were planted on October 11.
o The small difference in sensor measurements and appearance between zero-N and high-N plots on April 16-17 would normally suggest that the soil was supplying a substantial amount of N, allowing the zero-N plots to keep up with the high-N plots. This would be associated with a low need for fertilizer N. - This was not the case, as this experiment actually needed MORE N than the other two
experiments (see graphs on first page of report). o The small difference measured by the sensors on April 16-17 had changed into a large
difference in appearance between zero-N and high-N plots by the time aerial photographs were taken on May 6 (see photo below).
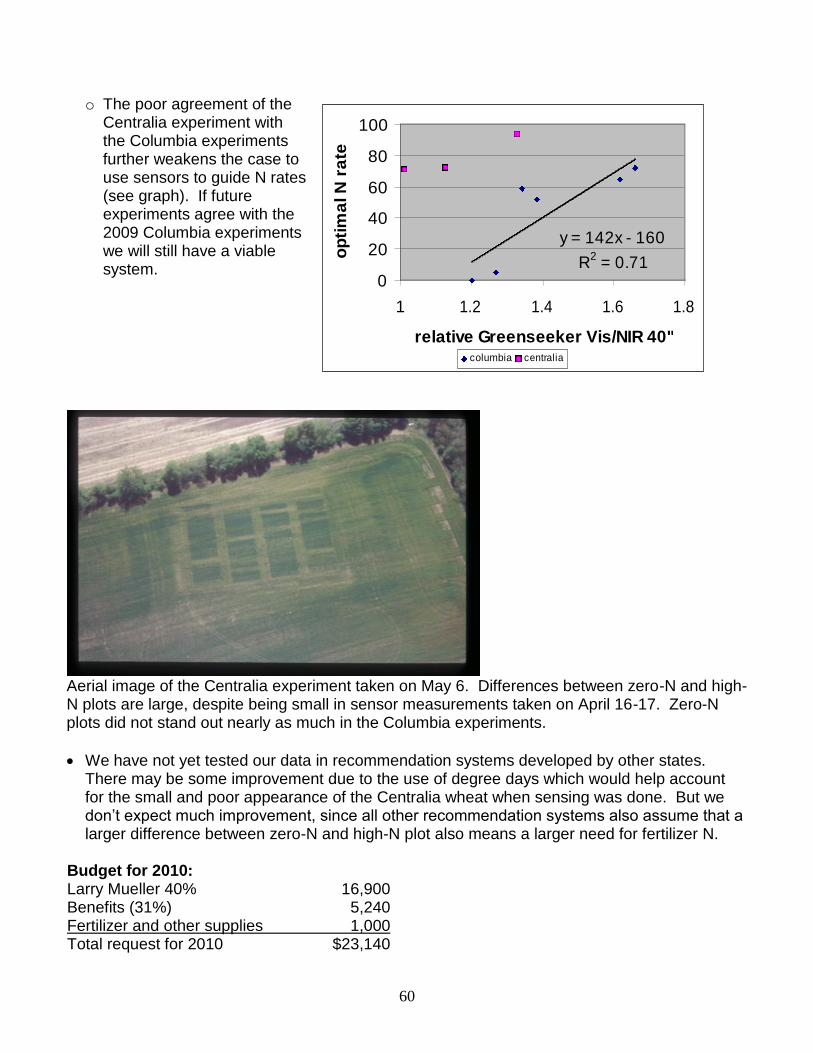
60
y = 142x - 160
R2 = 0.71
0
20
40
60
80
100
1 1.2 1.4 1.6 1.8
relative Greenseeker Vis/NIR 40"o
pti
ma
l N
ra
tecolumbia centralia
o The poor agreement of the
Centralia experiment with the Columbia experiments further weakens the case to use sensors to guide N rates (see graph). If future experiments agree with the 2009 Columbia experiments we will still have a viable system.
We have not yet tested our data in recommendation systems developed by other states. There may be some improvement due to the use of degree days which would help account for the small and poor appearance of the Centralia wheat when sensing was done. But we don’t expect much improvement, since all other recommendation systems also assume that a larger difference between zero-N and high-N plot also means a larger need for fertilizer N.
Budget for 2010: Larry Mueller 40% 16,900 Benefits (31%) 5,240 Fertilizer and other supplies 1,000 Total request for 2010 $23,140
Aerial image of the Centralia experiment taken on May 6. Differences between zero-N and high-N plots are large, despite being small in sensor measurements taken on April 16-17. Zero-N plots did not stand out nearly as much in the Columbia experiments.

61
Miscellaneous Tests

62
Final Reports
Soil Sampling and Fertility Build-up Management
Gene Stevens and David Dunn
University of Missouri (MU) soil test laboratory recommendations for P and K fertilizer are based
on three components: target level, crop removal, and build-up. Target level is the amount of extractable
nutrient found in a soil at which point applying more fertilizer containing the nutrient will probably not
increase crop yields. Crop removal is how much the nutrient is reduced in the soil annually from
harvested forage, grain, or fiber. Build-up is the additional fertilizer needed above crop removal to
increase low- and medium-testing soil P and K to the target fertility levels for crop production.
Soil P and K build-up can be slow or fast depending on the economic situation of the farmer.
Total fertilizer applied in slow and fast build-up programs is about the same amount, but the cost may be
spread out over more years in slow build-up periods. The current soil test recommendation system used
by MU allows growers to select the number of years over which to build-up soils. This decision has a
large effect on the amount of fertilizer that a farmer will purchase and apply in a given year. If a grower
does not select a build-up period, the soil test lab uses an 8-year default build-up time to calculate
fertilizer recommendations.
Research has not been conducted to determine which build-up strategy is the most profitable to
manage crop nutrients in row crop and forage production. Long build-up programs help farmers manage
their financial resources by spreading fertilizer costs over several years. However, growers need
information concerning the magnitude of yield loss that may occur early in an 8-year build-up as
compared to a shorter build-up (1 to 4 years).
The objective of this long-term study is to evaluate the effects of P and K build-up periods on
yields of tall fescue hay, cotton, and soybean and rice in rotation and to validate the build-up equations
used in the MU fertilizer recommendation program.
Materials and Methods
Rice/Soybean Rotation
An experiment was established in 2004 at the Missouri Rice Research Farm at Qulin, Missouri.
Two rice pans were used with soybean and rice rotated between them each year. The experimental design
is a randomized complete block with four replications. Permanent markers were placed to help locate
research plots in following years. In the spring before fertilizer applications are made, composite soil
samples are collected from each plot and analyzed at the MU Delta Center Soil Lab. Yield goals being
used to calculate P and K fertilizer recommendations are 45 bu/acre for soybean and 6075 lb/acre (135
bu) for rice. Standard treatments include an untreated check, 1-year, 4-year, and 8-year buildup fertilizer
programs. Treatments are included to compare using soybean versus rice soil test target levels. Current
MU target soil P buildup for rice is 35 lb Bray-P/acre and soybeans is 45 lb Bray-P/acre. Target
ammonium acetate extractable K is 125+(5XCEC) for rice and 220+(5XCEC) for soybeans. Rice
receives 150 lb N/acre in a 3-way split application program.
Fescue. A field experiment in a non-renovated fescue hay field was begun in 2004 and is currently
nearing the end of an eight-year evaluation. The study location is on a Tonti-Hogcreek complex (Typic
Fragiudult) soil in the Ozark Highlands near Mountain View, Missouri. The experimental design is a
randomized complete block with four replications and permanent markers were installed when the test
was established to help locate research plots in following years. Initial soil test levels in the test area
averaged 8 lb Bray-1 P/acre and 162 lb ammonium acetate-extractable K/acre. Cation exchange capacity
(CEC) was 6.5 meq/100g soil and organic matter content was 1.5%.
63
Each spring before fertilizer applications are made, 0 to 6-inch composite soil samples are
collected from each plot and analyzed for Bray-1 P and ammonium acetate-extractable K at the MU-
Delta Center Soil Laboratory at Portageville, Missouri. Hay yield from each plot is determined by
harvesting forage (typically two or three cuttings per year) using a lawnmower with a bagging attachment.
Forage subsamples are collected from each plot and oven dried to calculate moisture content and analyzed
for N, P, and K content, crude protein, and acid and neutral detergent fiber (ADF and NDF, respectively).
Fertilizer treatments used in the experiment were an untreated check, a nitrogen only check, and 1-
year, 4-year, and 8-year P and K build-up programs (Table 1). The treatments were designed so that at the
end of eight years, the total amount of fertilizer applied to each plot would be close to equal. Triple super
phosphate (0-46-0) and muriate of potash (0-0-60) were used as P & K sources. Each plot except the
untreated check was fertilized with 80 lbs N/acre as ammonium nitrate and ammonium sulfate each year
(50 lb N and 9 lb S/acre in late March, 30 lb N/acre in early September).
Shown below are the equations used at MU to calculate the P and K build-up component of soil test
recommendations.
Build-up P2O5 = 110(Xd 1/2
– Xo 1/2
) Build-up K2O= 75.5(Xd 1/2
– Xo 1/2
)
Years Years
Xd = target soil test level in lb P or K per acre
Xo = observed soil test level in lb P or K per acre
Years = desired time period for build-up
The MU Bray-1 P target for fescue is 40 lb P per acre. Target ammonium acetate-extractable lb
K/acre is 160 + (5 x CEC). The soil CEC of the test field was 6.5 so the calculated K target was 193 lb
K/acre. When farmers submit soil samples to Missouri labs for testing, they are asked to provide a crop
yield goal to be used to calculate additional fertilizer needed to compensate for crop removal. For the test
field at Mountain View, the farmer selected a 2-ton/acre yield goal. Current MU recommendations
estimate fescue hay nutrient removal at 9 lb P2O5 /ton and 34 lb K2O /ton. Thus, the 2-ton yield goal used
for this study resulted in the crop removal fertilizer component in the build-up treatments being 18 lb
P2O5 and 68 lb K2O /year (Table 1).
Cotton
Cotton field experiments were begun in 2007 on a Malden fine sand soil (0.8% organic matter,
3.8 meq/100 g soil cation exchange capacity, CEC) at Clarkton, Missouri and a Dundee silt loam (2.3%
organic matter, 14.7 meq/100g soil CEC) at Wardell, Missouri.
All plots received equal nitrogen rates. Phosphorus (P) fertilizer was applied to all plots at a rate of
30 lb P2O5 per acre. Standard treatments for K include an untreated check and 1 through 8-yr buildup
fertilizer programs. In the first year, buildup treatments of 1 to 8 years were applied at rates of 167, 97,
74, 63, 56, 51, 48, and 45 lb K2O per acre. In 2009, each treatment, excluding the 1-yr and 2-yr buildups,
received K fertilizer based on the years of buildup treatment (3 to 8 years). After each buildup has been
completed, treatments will receive maintenance K applications based on crop removal of K2O. Plots were
mechanically harvested and grab samples were collected to identify crop removal of nitrogen, phosphorus
and potassium.
Results and Discussion
Rice/Soybean Rotation
Initially, we were concerned that using rice target thresholds would decrease soybean yields and that
shorter buildup time would produce higher yields than long buildups but that does not appear to be
happening (Table 2). All of the fertilizer programs produced more rice and soybean yields than the

64
untreated check (N only for rice). But there does not appear to be an yield advantage to bringing up P and
K levels faster than 8 years.
Fescue
Throughout the fertilizer buildup study we have observed a change in fescue density and weed
infestation which was impacted by fertility treatments. In 2009, when the orchardgrass and fescue seed
heads were present in early June, we recorded the amounts in each plot (Table 3). Orchardgrass stands
increased relative to fescue with P and K fertilizer compared to untreated check. Untreated check plots
had the most broomsedge, foxtail, and greasegrass infestations (Table 4). Hay yields were higher with P
and K fertilizer programs than N only and the untreated check.
Cotton
Cotton did not show a consistent response to potassium in 2009. The cool, wet weather in the
spring resulted in late planting dates at both test locations and a cool October delay maturity. We found a
trend towards higher yields with 2 to 5 year buildup programs compared to the untreated check.
Table 1. Annual fertilizer application rates based on soil tests for soil P and K build-up programs
beginning in 2004 (Year 1) in an Ozark Highland hay field near Mountain View, Missouri.
Year 1 Years 2, 3, 4 Years 5, 6, 7, 8
Build-up Program P2O5 K2O P2O5 K2O P2O5 K2O
---------------------------lb/acre----------------------------------
Untreated check 0 0 0 0 0 0
N only 0 0 0 0 0 0
1-year build 404 156 18† 68† 18† 68†
4-year build 115 90 115 90 18† 68†
8-year build 66 79 66 79 66 79
† Only crop removal P and K applied.
65
Table 2. Effect of fertilizer build-up programs on third-year rice and soybean yields on a Crowley silt loam soil at Missouri Rice
Research Farm, Qulin, Missouri.
Planted
Crop
Buildup program 2007 rates 2004 2005 2006 2007 2008 2009 Average
Soil crop target P2O5 K2O Yield
Rice ---lb/acre--- ------------------------bushels/acre------------------------
N only check 0 0 168 142 136 133 122 138 140
1-yr/rice target 41† 38† 192 160 133 192 141 146 161
4-year/rice target 41‡ 38‡ 193 161 136 175 139 149 159
8-year/rice target 45 67 187 159 143 174 136 146 158
1-year/soybean target 41† 38† 172 149 138 189 134 159 157
4-year/soybean target 41‡ 38‡ 170 161 150 188 138 161 161
8-year/soybean target 56 97 165 155 134 190 150 161 159
Soybean Untreated check 0 0 40 39 53 37 33 60 44
1-year/rice target 38† 65 53 47 63 44 17 69 49
4-year/rice target 38‡ 65 53 49 60 45 23 61 49
8-year/rice target 38 65 51 45 62 43 29 62 49
1-year/soybean target 38† 65 58 54 57 49 23 60 50
4-year/soybean target 38‡ 65 51 46 55 44 28 73 50
8-year/soybean target 50 65 51 43 57 48 22 67 48
† Only crop removal P and K was applied to 1-yr buildup treatment after 2004.
‡ Only crop removal P and K was applied to 4-yr buildup treatment in 2008 and 2009.
66
Table 3. Spring estimate of orchardgrass and fescue distribution, soil test levels and dry matter hay yields
from two cuttings in 2009.
Build-up Orchard †
grass
Fescue Soil test results Dry matter yield
Program K P June 6 Nov 20 Total
----% of plot area---- ---lb/acre--- ----------ton/acre------------
Check 13 69 183 16 1.8 2.5 4.2
N only 32 59 126 16 3.1 3.0 6.2
1-year 58 41 173 41 5.1 3.6 8.7
4-year 57 40 172 61 5.0 3.6 8.6
8-year 63 34 191 42 5.3 5.0 10.2
† Cool season grasses were identified by their seed heads on June 6.
Table 4. Plants identified growing in fescue hay plots in September 4, 2009.
Program CoolG† BrmS Foxt GreG Plum Mint HsNt Lesp Forb
------------------------------% of plot area--------------------------------------
Check 46 19 21 6 3 0 1 4 0
N only 81 9 6 1 1 0 1 0 0
1 yr bldup 88 3 0 4 0 0 0 4 0
4 yr bldup 75 0 3 4 5 10 0 0 1
8 yr bldup 86 1 8 3 0 0 1 0 0
† Abbreviations for plants are CoolG=coolseason grasses; BrmS=broomsedge; Foxt=foxtail; GreG=
grease grass; Plum= plum tree; Mint= mint; HsNt= horsenettle; Lesp= lespedeza clover
Table 5. Cotton yields on sandy loam soil at Clarkton, Missouri and on silt loam soil at Wardell, Missouri
with fertilizer K buildup programs in 2009.
Buildup Program Malden fine sandy
loam soil†
Dundee silt loam
soil
---------lb lint/acre---------
Check 804 873
1 year 975 876
2 year 909 969
3 year 784 922
4 year 837 961
5 year 803 1060
6 year 848 837
7 year 927 880
8 year 876 898
† 2009 was the third year for this study. Maintenance K was applied in the 1 year and 2 year program
plots.

67
Switchgrass and Sweet Sorghum Fertilization for Bioenergy Feedstocks
Gene Stevens, Roland Holou, David Dunn, and Allen Wrather
Sweet sorghum was first introduced into the United States in 1857. Issac Hedges called it the
―Northern Sugar Plant‖ because of the high sugar content in the stalks. Sweet sorghum is the same
species (Sorghum bicolor L. Moench) as grain sorghum. Although sweet sorghum is primarily grown to
produce sorghum syrup, it can also be used as a feedstock for biofuel. In favorable environments, sweet
sorghum varieties can grow 14 feet tall and produce 20 to 50 tons of biomass (fresh weight) per acre. It is
more drought tolerant than corn and requires less nitrogen fertilizer. Dr. Morris Bitzer calculated that corn
has an energy efficiency of 1:1.8 while sweet sorghum has an efficiency of 1:8 (personal communication).
An international group called the Sweet Sorghum Ethanol Association was organized in 2007 to promote
sweet sorghum crop management practices and technologies to make ethanol and bio-derivatives.
Sweet sorghum can be grown in most of the continental United States. However, sorghum is less
cold tolerant than corn. Soil temperatures should be above 65o F at planting to achieve good seed
emergence. Fungicide seed treatments can be used to reduce seedling disease infestation. Fortunately,
sorghum plants can often compensate for low plant stands by producing several tillers per plant.
Optimum planting rates vary by region and soils. Generally, target plant population should be 60,000 to
100,000 plants per acre. Fields with irrigation should have higher populations than non-irrigated. Plant
lodging is more likely to occur in high population fields because stalks become smaller in diameter due to
competition.
Most of sweet sorghum models for biofuel production use either gasification or fermentation to
process plant material into biofuel. In Texas, sorghum varieties are being bred to produce high biomass
yields. Sugar in the stalk is not the primary focus. Sorghum biomass is burned by fast pyrolysis to
produce syngas, bio-oil, and charcoal. In this system, the synthetic gas and bio-oil are used for
transportation fuel and the charcoal is applied to fields to improve soil structure. Most of the sweet
sorghum research around the world is focused on traditional sugar fermentation by yeast from the juice.
Sweet sorghum juice contains sucrose, fructose, and glucose which can easily be made into ethanol. To
optimize ethanol yield, a juice extraction rate of at least 50% from the stalks is needed. Extraction
requires a roller mill or diffuser equipment. The bagasse can be used to feed livestock or pelletized to
burn for heat in buildings or to produce electricity. The vinasse, which is a mixture of dead yeast and
plant material after fermentation, can be composted and sold for fertilizer.
Objectives: To determine optimum nitrogen rates, monitor the amount of potassium and phosphorus in
stem and leaves throughout growing season, and develop P and K soil test recommendations for sweet
sorghum and switchgrass.
Procedures: Switchgrass. Beginning in 2007, biomass yield and nutrient content was measured from an
established stand of switchgrass on the Aubrey Wrather Farm located 3 miles east of Portageville. The
switchgrass was planted 10 years ago in strips to provide wind protection from blowing sand for cotton
seedlings. In late November 2007, we found tissue content averaged 0.03% P and 0.12% K in leaves and
0.04 % P and 0.54% K in stems.
At the Wrather Farm, switchgrass biomass was collected from plots in June, July, October, and
November. Tissue subsamples will be separated into leaf and upper and lower stem parts, weighed, oven
dried, and tested for NPKS content. Root balls were dug, washed, and ground for nutrient analyses to
evaluate nutrient remobilization from stems and leaves to roots in the fall.
Sweet Sorghum.
In 2007, an experiment was begun to determine optimum nitrogen fertilizer rates for producing
ethanol from corn and sweet sorghum. Tests were conducted on a Tiptonville silt loam with linear move
irrigation. In 2008 and 2009, we expanded the sites to include a Sharkey clay and Malden fine sandy
68
loam. Atrazine and metolachor gave good grass and broadleaf weed control. Before planting, sweet
sorghum seed was treated with fluxofenin herbicide seed safener to minimize crop injury. Seven N rate
treatments per crop are being used with four replications. Corn rates were 0, 50, 100, 150, 200, 250, and
300 lb N/acre. Sweet sorghum rates were 0, 25, 50, 75, 100, 125, and 150 lb N/acre. Ammonium nitrate
was broadcast applied. Corn plots were harvested with a plot combine and sweet sorghum plots harvested
with a sickle mower. Sugars in the sorghum stalks are being analyzed for sucrose, glucose, and fructose.
Results: The overall goal of the switchgrass research is to determine the best time of the growing season
to harvest the biomass in order to minimize nutrient removal and sustain the system. This experiment was
conducted on a 10-year old switchgrass stand near Portageville, Missouri. Four plots were delimited and
at different time of the year, biomass was harvested within these plots. Using an atomic absorption
spectrometer, nutrient content was determined in the biomass. The maximum feedstock yield was
obtained in October (9.8 tons/acre); while a slight loss of biomass was encountered from October to
November due to the fall of seed and the wind that cut some dried leaves off the plants. Nitrogen
accumulation in the biomass decreased more than four-fold from July to November. The least decrease
was observed with the micronutrients such as Zn, Cu, Mn, and Fe. November was the optimum time to
harvest in order to maximize the yield and minimize nutrient removal. Using conversion factors in the
literature, more than 7500 liters/ha of ethanol could be produced from switchgrass biomass in a
sustainable. Sweet sorghum is an efficient user of nitrogen fertilizer. Following soybean the previous year,
maximum sweet sorghum biomass yields in 2007 and 2008 were achieved in some fields with no
nitrogen. The seed heads on sweet sorghum are located on the top of the stalks. A significant effect of
soil type was found for the fresh and the dried biomass yield of sweet sorghum (P<.0001). However, the
N rate did not significantly affect either the fresh biomass yield (P=0.06) or the dried biomass yield
(P=0.27). A highly significant difference was found among soil types when analyzing the stalk yield
(P<.0001) and N rates (P=0.02). Although sweet sorghum is N efficient, in order to maximize feedstock
yield while using it for biofuel production, great attention needs to be paid to the soil type and N
fertilization. In 2009, the silt loam site followed corn. Sweet sorghum yields on the Sharkey clay and
Tiptonville silt loam increased with N fertilization in 2009 (Table 1). As the plant matures carbohydrates
are translocated from the stalks to the head to make starch in the seeds. To maintain high sugar content in
the stems we removed the seed heads at ―when the seed is in the milk stage. Usually in about 2.5 weeks
sugar content will increase to optimum levels before harvest. Most sorghum syrup farmers remove seed
heads using cutters mounted on high clearance spray equipment. This procedure will not be as important
when hybrid varieties are grown that are male sterile or do not flower at all. To estimate sugar content in
juice, we used a refractometer to make Brix (%) measurements. Handheld light refractometers and battery
powered digital refractometers can be purchased. Be sure to purchase a model that automatically
compensates for temperature. Brix numbers from 14 to 20% would be considered acceptable levels for
harvesting. Obviously, the higher the sugar content in the stalks, the higher the potential ethanol yield.
Sugar contents in sweet sorghum tend to be highest in years with low rainfall and sunny days late in the
season.
69
Table 1. Tons per acre of sweet sorghum biomass produced on Sharkey clay,
Tiptonville silt loam, and Malden fine sandy loam in 2009.
Nitrogen
lb N/acre
Clay Loam Sand
---tons fresh wt/acre---
0 12.5 13.0 16.9
20 18.3 15.2 18.3
40 19.4 16.4 23.7
60 22.9 21.9 21.5
80 25.9 21.0 18.5
100 26.2 21.1 21.8
120 28.7 23.1 19.7
70
Progress Reports
Title: Environmentally Sound High Impact Forage Management Research Based Demonstrations for Increased Livestock Profitability by Increasing Forage Production and Quality
Investigators: Todd Lorenz, Rich Hoormann, Wendy Flatt, Gene Schmitz, Joni Ross, Dustin Vendrely, Randa Doty and Rob Kallenbach
Objectives, including relevance of project to Missouri fertilizer/lime use: Livestock producers and landowners read about basic forage plant, soil fertility, and animal management techniques that can improve pasture eco-systems, carrying capacity and ultimately farm profitability. However, many are not responsive to adopting these current forage management techniques. Many producers have not had access to research plots that demonstrate the short term and long term plant responses to fertility management changes. This project combines multiple demonstrations of University of Missouri research based forage fertility management practices on a strategically selected farmer field location that allows producers to follow changes in pasture eco-system and profitability per acre through on-site demonstrations and field days. Procedure: During the spring of 2007, a 5-acre field was identified and soil tested. Based on soil test results and discussions with Extension Specialists, fertilizer dealers and farmers, eight different fertilizer combinations were applied to field-scale plots containing primarily tall fescue (Table 1). Plot dimensions are 50 feet X 50 feet. Lime was applied as a sub-plot across all treatments. Fertilizer and lime were applied with commercially available fertilizer equipment. The legume fertilizer treatment was further split with red clover and lespedeza being hand seeded in 25 feet X 50 feet plots. A waste lime treatment was added in 2008. Weather has impacted this research project. A late freeze in April 2007 may have reduced first cutting forage yields. 2008 was a very wet year, and yields may be higher than normal expectations due to very favorable moisture supplies throughout the growing season. For the months March through August 2008, 25.55 inches of rainfall were recorded at the research site. This was 8.36 inches more rainfall during 2008 compared to the same months during 2007. 2009 was also an extremely cool and wet year which may have impacted yields and forage quality. Forage was harvested during May, August and October in 2007 and May, August and November in 2008 and 2009 with a mechanical forage harvester. Four replications per treatment were harvested. Harvested forage was weighed and subsamples were taken for nutrient analysis. Harvest area was measured and dry matter yield was calculated. Subsamples were weighed, dried and re-weighed to determine moisture content. Subsamples were then sent to a commercial lab for protein, fiber and mineral analysis.
71
Results – Yield, nutrient analysis, economic analysis and education and outreach: Yield: As expected, full fertility based on University of Missouri soil test results for a yield goal of 3 tons of hay per acre produced the most forage during 2007 and 2008 (Tables 2 and 3). Clearly, increasing fertilizer increased forage yield. The question remains, is the value of forage production and quality offset by the increased cost of the fertilizer? It is interesting to note the yield response of the plots to phosphorus (P) fertilizer in 2008. Our initial soil tests in the spring of 2007 report available P at 6 lbs/acre. When comparing 2008 yields with 2007 yields, the plots that received P fertilizer had yield increases of -162, 4009, 1933, 2472, 2965 and 2079 pounds dry matter per acre. The plots that received no P fertilizer had -814, 840 and 914 pounds dry matter per acre yield increases. The plot that received P fertilizer and had a yield reduction of 162 pounds per acre was the full fertility treatment, however it was the highest yielding treatment for both years. It also appears from the 2008 data, that we are beginning to see yield responses to fertilizer treatments containing blends of N, P and K compared to providing each of these elements alone. Complete data from the 2009 growing season has not yet been received. Yield data from the first two harvests has been summarized. Yield and quality data have not yet been statistically analyzed. Comparison between the three years will be completed once all yield and nutrient analysis data has been received. Nutrient Analysis: Nutrient analysis for protein, fiber and minerals has been completed for 2007, 2008 and the first two harvests for 2009. The 2009 nutrient analysis from the November harvest has not yet been received. In addition to yield, the production of nutrients, especially energy and protein, are important to beef cattle producers. We will further analyze the yield and quality data by estimating animal performance from each fertilizer treatment. Statistical analysis will be completed on mineral concentrations to compare the treatments and possible mineral interactions and correlations. High concentrations of one mineral can negatively impact another, so the affected mineral is “tied up” and cannot be digested and utilized fully. Economic Analysis: Preliminary economic analysis on yield and cost for 2007 are shown in Table 8 and in Table 9 for 2008. However, the economic impacts of forage fertilization involve more than the cost of fertilizer and the yield response. Forage quality and animal performance must also be evaluated. Economic analysis on these issues will be available in upcoming months. It is important for producers to understand that if yield losses occur due to lack of fertilizer application, additional feed resources must be acquired. This can be accomplished by either renting or leasing more acres for hay harvest, purchasing additional hay, protein or energy supplements or reducing livestock numbers to reduce feed needs. Table 5 lists the acres and costs needed to equal the highest yielding treatment. Total costs for the additional acreage are based on our per acre costs for each treatment in our study. A land charge of $28.71 is included in our budgets. The cost of additional hay land may vary from this cost and must be accounted for by each producer.

72
Livestock producers have to supply certain levels of nutrients to their livestock. Many times, it is cheaper to produce these nutrients on the farm rather than purchase them from an outside source. With this in mind, we calculated the total amounts of crude protein (CP) and total digestible nutrients (TDN, a measure of the energy content of a feedstuff) produced by each fertilizer treatment. Then, based on the amount of CP and TDN produced per acre, we calculated the amount and cost of soybean meal needed to meet the highest total CP production and calculated the amount and cost of corn needed to meet the highest total TDN production. The amounts of supplemental feed and the total cost to supply a certain amount of CP and TDN from forage alone or from forage plus supplement is listed in Tables 6 and 7. These calculations show that high nutrient production can be obtained from fertilizer, 100-65-60 in 2007, or from high amounts of red clover, 0-65-60 with red clover in 2008. Based on this data, it is cheaper to produce these nutrients on the farm than to buy both fertilizer and supplemental nutrients in the form of corn or soybean meal. If adequate amounts of red clover cannot be obtained in hay fields, the extremely high fertilizer prices in 2008 indicate it may be cheaper to reduce, but not eliminate, fertilizer applications and buy supplemental nutrients in some instances. Education and Outreach: Two educational workshops were held in our establishment year. On August 30, 2007, approximately 80 people from eight surrounding counties attended the first field day at the plots. Producers learned of the reasoning behind the fertility treatments, data that was being collected, how that data was going to be used and heard some preliminary data that had been obtained from earlier harvests. Our second event was held in mid-November and approximately 30 people attended that event. Additional results were presented along with information about nutrient cycles in forage systems and winter feeding programs for beef cattle. The third educational workshop was held in mid-June 2008. Twenty-five producers from the Montgomery County area toured the site and heard an update on research results. Our fourth workshop was held on August 12, 2009. Eighty-four percent of survey respondents agreed or strongly agreed that greater attention to forage quality is needed in order to be profitable. Sixty-seven percent would like to see more information about variable rate fertilizer technology. Eight-six percent said they would consider attending future Extension field days. Ninety-five percent agreed or strongly agreed that it is important that Extension continues local field days and research plot work. Forty-six percent of those in attendance had attended previous field days at the research site. Of these, 64 percent agreed or strongly agreed that their forage management changed because of attending the field day. Fifty-five percent agreed or strongly agreed that information from the last field day helped them change their pasture fertilization management and cope with high 2008 and 2009 fertilizer prices. The regional specialists involved in the project continue to field questions and hear comments about the plots and the results being obtained there. Results being obtained from this study are highlighted at regional meetings, winter workshops and grazing schools.

73
Producers in central Missouri have readily accepted this multi-disciplinary, local research/education approach. To date, over 200 producers from eight counties have attended four on-site workshops. Extension agronomy specialists present plot data on yield and discuss fertilizer management. Nutrient yield and quality differences between fertility treatments as they apply to beef cattle feeding programs are discussed by Extension livestock specialists. Extension agriculture business specialists highlight the economics of forage production. Producers see the impact of a particular fertilizer program by comparing plots. They learn to incorporate forage quality information into economical beef cattle feeding programs. Producer survey responses include: “You brought up points I hadn’t thought about.” and “You guys always hit the nail on the head.” Summary points from this research/demonstration project to date are:
Aggressive harvest management can lead to high yields and high forage quality.
Producers must decide how to deal with potential reduced yields if the forage fertility program is reduced.
Producers may need to change fertilizer strategies and target apply fertilizer when forage is needed and can be harvested in a timely manner, rather than blanket fertilizer applications over all their acres.
Producers need to consider and compare the costs of supplemental feeds with the cost of fertilizer application to increase tons of hay and pounds of nutrients produced on the farm.
Producers have changed their forage management as a result attending a project field day.
Producers have changed their forage fertilizer practices as a result of this project.
A vast majority of producers attending our field days feel it is important Extension specialists continue doing local research and demonstration projects.
74
Table 1. Plot layout and treatment identification. N only
50-0-0 Synergy 50-30-0
P only 0-30-0
K only 0-0-30
Dealer 50-30-30
Check 0-0-0
Soil Test 100-65-60
Legume 0-65-60
Legume 0-65-60
Waste Lime
Rep 1 No lime
101 201 301 401 501 601 701 801 rcl
901 lesp
111
Rep 1 Lime
102 202 302 402 502 602 702 802 rcl
902 lesp
112
Rep 2 No lime
103 203 303 403 503 603 703 803 rcl
903 lesp
113
Rep 2 Lime
104 204 304 404 504 604 704 804 rcl
904 lesp
114
Rep3 No lime
105 205 305 405 505 605 705 805 lesp
905 rcl
115
Rep 3 Lime
106 206 306 406 506 606 706 806 lesp
906 rcl
116
Rep 4 No lime
107 207 307 407 507 607 707 807 lesp
907 rcl
117
Rep 4 Lime
108 208 308 408 508 608 708 808 lesp
908 rcl
118
rcl= Red Clover, lesp = Lespedeza
Table 2. 2007, 2008 and 2009 Yield Results, lbs dry matter per acre. Treatment May
`07 May `08
May `09
Aug `07
Aug `08
Aug `09
Oct `07
Nov `08
Total `07
Total `08
0-0-0 3097b
960e
3130 3354bc
3936d
3907 752bc
1502cde
7203b
6399e
0-0-30 1950d
920e
3502 3443bc
4404cd
3984 564cd
1547cde
5957cd
6872de
0-30-0 1541d
1279de
5104 3666b
4707bc
4396 333e
1633cd
5541d
7619cd
0-65-60 lesp
3168b
1724cd
4072 2761e
5465a
4246 586cd
1798c
6515bc
8988b
0-65-60 rcl 3092b
3473b
4021 3233cd
5269ab
3897 926b
2518b
7251b
10,945a
100-65-60 6332a
4550a
5437 4421a
4319cd
3839 1239a
2961a
11,992a
11,830a
50-0-0 3086b
2006c
3619 2591e
3745d
3710 500de
1266e
6145cd
7018de
50-30-0 2514c
3037b
4040 2926de
4442cd
4378 352e
1314de
5792cd
8793b
50-30-30 3327b
3095b
4617 3178cd
4151cd
3963 633cd
1825c
7138b
8551bc
Waste lime -- 5010 5580 -- 3810 3739 -- 1819 -- 10,639
Means in columns with different superscripts are different (P<.05) November 2009 harvest data is not included. Statistics on 2009 harvest data have not yet been completed.
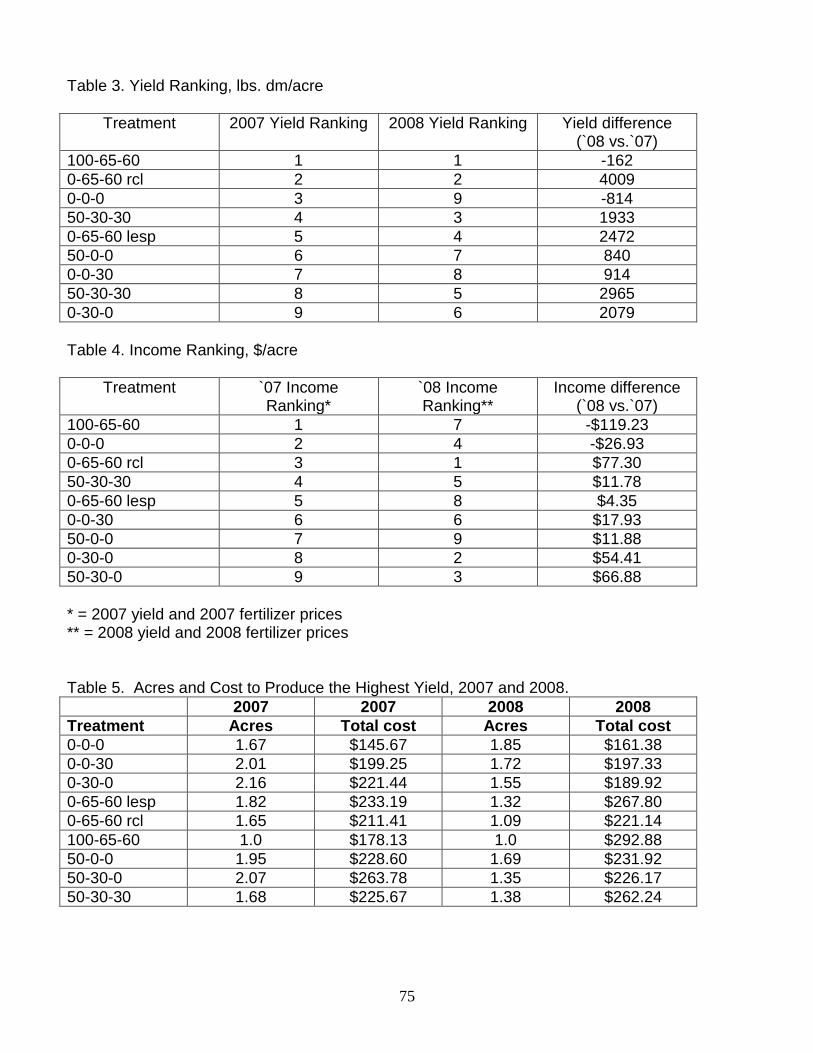
75
Table 3. Yield Ranking, lbs. dm/acre
Treatment 2007 Yield Ranking 2008 Yield Ranking Yield difference (`08 vs.`07)
100-65-60 1 1 -162
0-65-60 rcl 2 2 4009
0-0-0 3 9 -814
50-30-30 4 3 1933
0-65-60 lesp 5 4 2472
50-0-0 6 7 840
0-0-30 7 8 914
50-30-30 8 5 2965
0-30-0 9 6 2079
Table 4. Income Ranking, $/acre
Treatment `07 Income Ranking*
`08 Income Ranking**
Income difference (`08 vs.`07)
100-65-60 1 7 -$119.23
0-0-0 2 4 -$26.93
0-65-60 rcl 3 1 $77.30
50-30-30 4 5 $11.78
0-65-60 lesp 5 8 $4.35
0-0-30 6 6 $17.93
50-0-0 7 9 $11.88
0-30-0 8 2 $54.41
50-30-0 9 3 $66.88
* = 2007 yield and 2007 fertilizer prices ** = 2008 yield and 2008 fertilizer prices Table 5. Acres and Cost to Produce the Highest Yield, 2007 and 2008.
2007 2007 2008 2008
Treatment Acres Total cost Acres Total cost
0-0-0 1.67 $145.67 1.85 $161.38
0-0-30 2.01 $199.25 1.72 $197.33
0-30-0 2.16 $221.44 1.55 $189.92
0-65-60 lesp 1.82 $233.19 1.32 $267.80
0-65-60 rcl 1.65 $211.41 1.09 $221.14
100-65-60 1.0 $178.13 1.0 $292.88
50-0-0 1.95 $228.60 1.69 $231.92
50-30-0 2.07 $263.78 1.35 $226.17
50-30-30 1.68 $225.67 1.38 $262.24
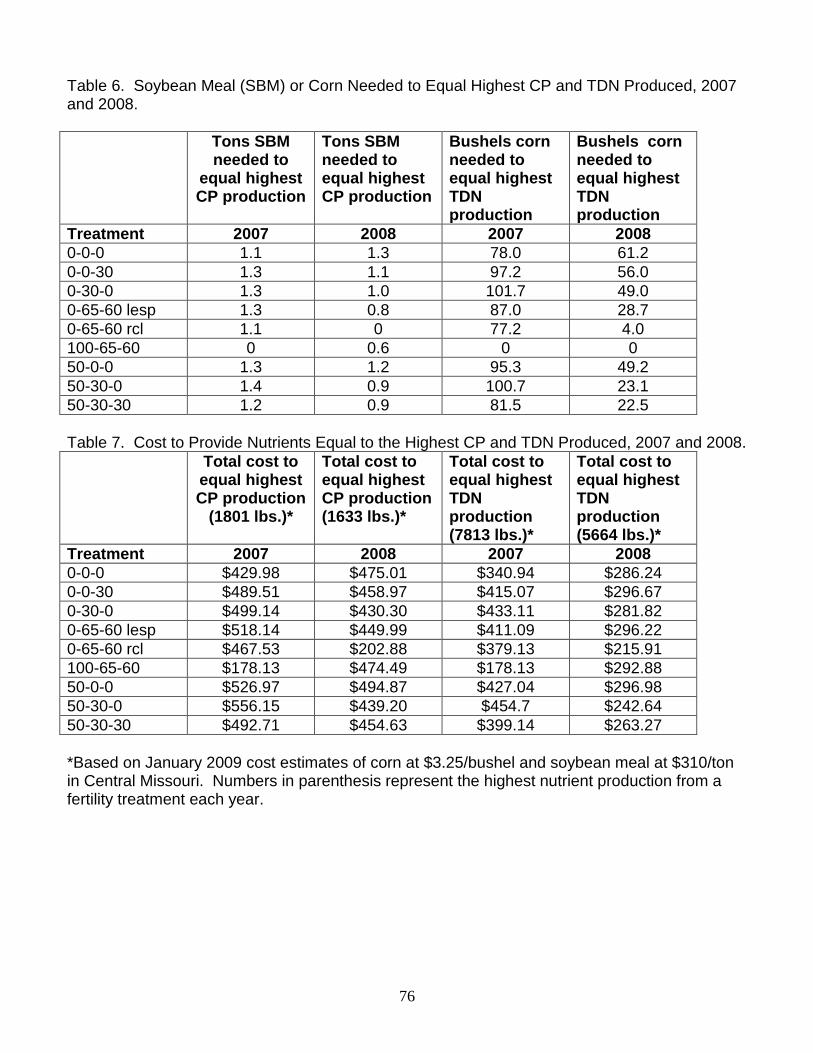
76
Table 6. Soybean Meal (SBM) or Corn Needed to Equal Highest CP and TDN Produced, 2007 and 2008.
Tons SBM needed to
equal highest CP production
Tons SBM needed to equal highest CP production
Bushels corn needed to equal highest TDN production
Bushels corn needed to equal highest TDN production
Treatment 2007 2008 2007 2008
0-0-0 1.1 1.3 78.0 61.2
0-0-30 1.3 1.1 97.2 56.0
0-30-0 1.3 1.0 101.7 49.0
0-65-60 lesp 1.3 0.8 87.0 28.7
0-65-60 rcl 1.1 0 77.2 4.0
100-65-60 0 0.6 0 0
50-0-0 1.3 1.2 95.3 49.2
50-30-0 1.4 0.9 100.7 23.1
50-30-30 1.2 0.9 81.5 22.5
Table 7. Cost to Provide Nutrients Equal to the Highest CP and TDN Produced, 2007 and 2008.
Total cost to equal highest CP production
(1801 lbs.)*
Total cost to equal highest CP production (1633 lbs.)*
Total cost to equal highest TDN production (7813 lbs.)*
Total cost to equal highest TDN production (5664 lbs.)*
Treatment 2007 2008 2007 2008
0-0-0 $429.98 $475.01 $340.94 $286.24
0-0-30 $489.51 $458.97 $415.07 $296.67
0-30-0 $499.14 $430.30 $433.11 $281.82
0-65-60 lesp $518.14 $449.99 $411.09 $296.22
0-65-60 rcl $467.53 $202.88 $379.13 $215.91
100-65-60 $178.13 $474.49 $178.13 $292.88
50-0-0 $526.97 $494.87 $427.04 $296.98
50-30-0 $556.15 $439.20 $454.7 $242.64
50-30-30 $492.71 $454.63 $399.14 $263.27
*Based on January 2009 cost estimates of corn at $3.25/bushel and soybean meal at $310/ton in Central Missouri. Numbers in parenthesis represent the highest nutrient production from a fertility treatment each year.

77
Table 8. 2007 Forage Budget.
N only Synergy P only K only Dealer Check Soil Test Red Clover Lespedeza
50-0-0 50-30-0 0-30-0 0-0-30 50-30-30 0-0-0 100-65-60 0-65-60 0-65-60
Estimated Income/Acre
May yield lbs/acre 3084 2550 1578 1988 3357 3124 6370 3198 3125
August yield lbs/acre 2591 2926 3667 3443 3178 3354 4421 2762 3234
October yield lbs/acre 500 352 334 564 633 752 1239 586 926
Total yield lbs/acre 6175 5828 5578 5994 7168 7230 12030 6546 7285
Income/acre $70.59 per ton $217.94 $205.69 $196.87 $211.57 $253.00 $255.17 $424.58 $231.04 $257.11
Operating costs/acre
N - Urea (46% N) $0.50 25.00 25.00 0.00 0.00 25.00 0.00 50.00 0.00 0.00
P - Phosphate $0.34 0.00 10.20 10.20 0.00 10.20 0.00 22.10 22.10 22.10
K - Potash $0.23 0.00 0.00 0.00 6.90 6.90 0.00 13.80 13.80 13.80
Application charge $5.00/acre 5.00 5.00 5.00 5.00 5.00 0.00 5.00 5.00 5.00
Fertilizer cost/Acre $30.00 $40.20 $15.20 $11.90 $47.10 $0.00 $90.90 $40.90 $40.90
Crop supplies 4.45 4.45 4.45 4.45 4.45 4.45 4.45 4.45 4.45
Custom hire & rental 13.50 13.50 13.50 13.50 13.50 13.50 13.50 13.50 13.50
Machinery fuel 4.94 4.94 4.94 4.94 4.94 4.94 4.94 4.94 4.94
Machinery repairs & maintenance 6.66 6.66 6.66 6.66 6.66 6.66 6.66 6.66 6.66
Operator & hired labor 6.38 6.38 6.38 6.38 6.38 6.38 6.38 6.38 6.38
Operating interest @ 8.75% x 1/2 year 3.79 3.79 3.79 3.79 3.79 3.79 3.79 3.79 3.79
Total Operating Costs/Acre $69.72 $79.92 $54.92 $51.62 $86.82 $39.72 $130.62 $80.62 $80.62
Income Over Operating Cost/Acre $148.22 $125.77 $141.95 $159.95 $166.18 $215.45 $293.96 $150.42 $176.49
Ownership Costs/Acre
Farm business overhead 2.63 2.63 2.63 2.63 2.63 2.63 2.63 2.63 2.63
Machinery overhead 7.86 7.86 7.86 7.86 7.86 7.86 7.86 7.86 7.86
Machinery depreciation 8.31 8.31 8.31 8.31 8.31 8.31 8.31 8.31 8.31
Real estate charge 28.71 28.71 28.71 28.71 28.71 28.71 28.71 28.71 28.71
Total Ownership Cost/Acre $47.51 $47.51 $47.51 $47.51 $47.51 $47.51 $47.51 $47.51 $47.51
Income Over Total Cost/Acre $100.71 $78.26 $94.44 $112.44 $118.67 $167.94 $246.45 $102.91 $128.98
Hay yields and hay price are on a 100% dry matter basis. Hay valued at $70.59 dry matter basis equals $60 per ton as-fed at 85% dry matter.
Prepared by Randa Brunkhorst, MU Extension Agricultural Business Specialist
2007 Forage Budget - Clifton City Forage Plot
78
Table 9. 2008 Forage Budget.
2008 Forage Budget - Clifton City Forage Plot
N only Synergy P only K only Dealer Check Soil Test Red Clover Lespedeza
50-0-0 50-30-0 0-30-0 0-0-30 50-30-
30 0-0-0 100-65-60 0-65-60 0-65-60
Estimated Income/Acre
May yield lbs/acre 2006 3037 1279 920 3095 960 4550 3473 1724
August yield lbs/acre 3745 4440 4707 4404 4098 3936 4319 5269 5465
November yield lbs/acre 1266 1314 1633 1547 1825 1502 2961 2518 1798
Total yield lbs/acre 7017 8791 7619 6871 9018 6398 11830 11260 8987
Income/acre $70.59 per ton $247.67 $310.28 $268.91 $242.51 $318.29 $225.82 $417.54 $397.42 $317.20
Operating costs/acre
N - Urea (46% N) $0.90 45.00 45.00 0.00 0.00 45.00 0.00 90.00 0.00 0.00
P - Phosphate $1.01 0.00 30.30 30.30 0.00 30.30 0.00 65.65 65.65 65.65
K - Potash $0.75 0.00 0.00 0.00 22.50 22.50 0.00 45.00 45.00 45.00
Application charge $5.00/acre 5.00 5.00 5.00 5.00 5.00 0.00 5.00 5.00 5.00
Fertilizer cost/Acre $50.00 $80.30 $35.30 $27.50 $102.80 $0.00 $205.65 $115.65 $115.65
Crop supplies 4.45 4.45 4.45 4.45 4.45 4.45 4.45 4.45 4.45
Custom hire & rental 13.50 13.50 13.50 13.50 13.50 13.50 13.50 13.50 13.50
Machinery fuel 4.94 4.94 4.94 4.94 4.94 4.94 4.94 4.94 4.94
Machinery repairs & maintenance 6.66 6.66 6.66 6.66 6.66 6.66 6.66 6.66 6.66
Operator & hired labor 6.38 6.38 6.38 6.38 6.38 6.38 6.38 6.38 6.38
Operating interest @ 8.75% x 1/2 year 3.79 3.79 3.79 3.79 3.79 3.79 3.79 3.79 3.79
Total Operating Costs/Acre $89.72 $120.02 $75.02 $67.22 $142.52 $39.72 $245.37 $155.37 $155.37
Income Over Operating Cost/Acre $157.95 $190.26 $193.89 $175.29 $175.77 $186.10 $172.17 $242.05 $161.83
Ownership Costs/Acre
Farm business overhead 2.63 2.63 2.63 2.63 2.63 2.63 2.63 2.63 2.63
Machinery overhead 7.86 7.86 7.86 7.86 7.86 7.86 7.86 7.86 7.86
Machinery depreciation 8.31 8.31 8.31 8.31 8.31 8.31 8.31 8.31 8.31
Real estate charge 28.71 28.71 28.71 28.71 28.71 28.71 28.71 28.71 28.71
Total Ownership Cost/Acre $47.51 $47.51 $47.51 $47.51 $47.51 $47.51 $47.51 $47.51 $47.51
Income Over Total Cost/Acre $110.44 $142.75 $146.38 $127.78 $128.26 $138.59 $124.66 $194.54 $114.32
Prepared by Dustin Vendrely, MU Extension Agricultural Business Specialist

79
ENVIRONMENTALLY SOUND HIGH IMPACT FORAGE MANAGEMENT RESEARCH BASED DEMONSTRATIONS FOR INCREASED LIVESTOCK PROFITABILITY BY INCREASING FORAGE PRODUCTION AND QUALITY
Supplemental and Waste Lime overlay Progress Report A low management pasture with high visibility was selected for the demonstration site in 2007. The original forage experiment is a replicated split plot design with lime and no lime on the main plots and treatments to include a control check, soil test recommended fertility, a typical retailer recommended pasture fertility package, 30 lbs P only, and 50 lbs N only. The affects of the “Easter” freeze of 2007 has given us concern about the total yield potential and has reduced our legume stand in our establishment year. The legume portion of the plot area will be over-seeded with legumes again for 2008 in order to simulate ergovaline dilution recommended practices. In addition to improving data quality in our first study, extending this study an additional year will allow us to add this supplemental experiment that will include treatments with Ag lime and various available waste lime products. Generating data by tracking soil pH and plant response (yield and plant composition) of applications of waste lime over time is critical to demonstrating the profitability of applying certified Ag lime materials. Plots will be harvested three times annually to follow annual forage response to management changes and long term economic impact from increased productivity and quality. Forage analysis will be conducted on each of the treatments during each of the harvest to show forage quality variations in a year round forage production system. Statistical analysis of data collected will be performed and compared to other research areas. Field days will be conducted twice annually for the duration of the grant to provide demonstrations of proven research based concepts. These concepts will include but not be limited to: soil testing, liming, fertilizer materials, fertilization timing, grazing heights, extended grazing using legumes, grazing frequency, environmental quality and economic benefit of implementing these practices. 2008 Results
Monthly rainfall totals measured 8.36 inches greater than those recorded for the previous year on this same location. April through August rainfall totals were greater than the 30 year average.
Waste lime was applied on May 7, 2008 to the appropriate plots in this supplemental overlay. Three forage harvests were conducted (May 13, August 5, and November 11). Yearly yield totals reflected an increase of .2 ton/acre in the Agricultural Limestone application when compared to the Waste Lime (10,849 pounds per acre vs. 10,432 pounds per acre respectively). Even with this separation in the year of application, we expect this variation to widen with more reaction time in 2009. 2009 Results
There appears to be no differences in measured parameters in 2008 and for the two harvests in 2009 that we have received quality data. We have not yet run statistical analysis on the data, but treatment means do not show large differences in yield or forage quality parameters that would make us believe there were statistical differences. We did not analyze for trace minerals in 2009. Our lab results from the last harvest in 2009 have not yet been
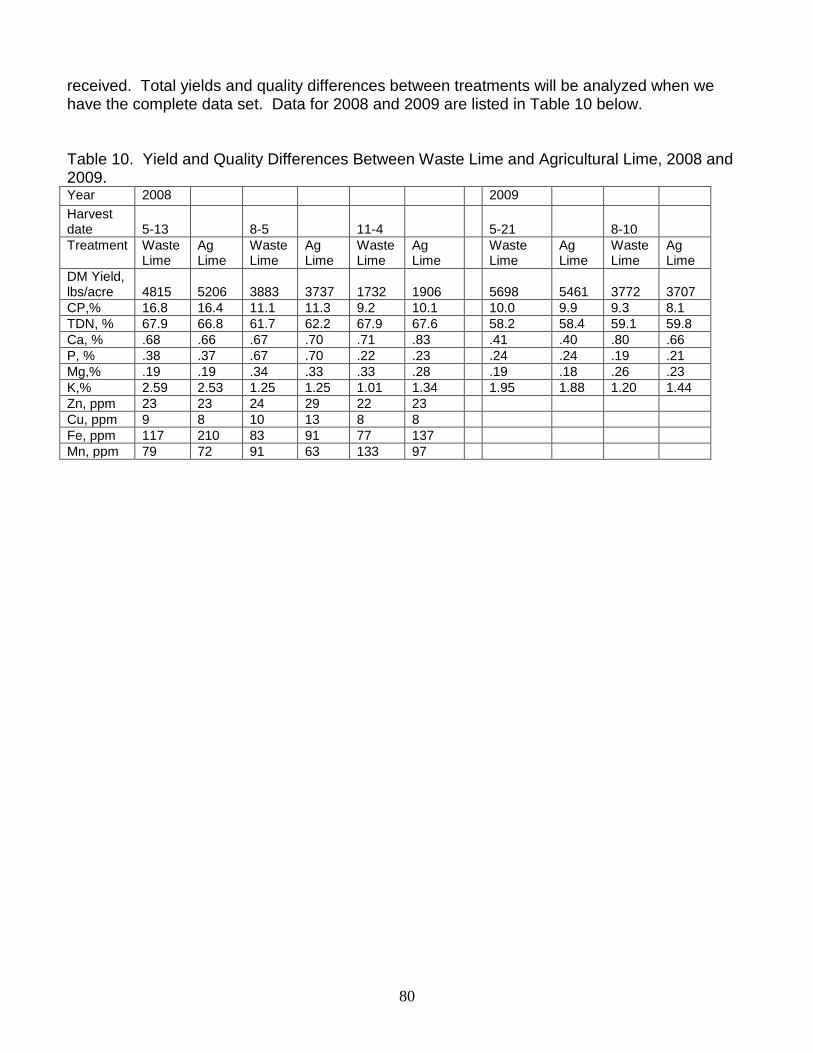
80
received. Total yields and quality differences between treatments will be analyzed when we have the complete data set. Data for 2008 and 2009 are listed in Table 10 below. Table 10. Yield and Quality Differences Between Waste Lime and Agricultural Lime, 2008 and 2009. Year 2008 2009 Harvest date
5-13
8-5
11-4
5-21
8-10
Treatment Waste Lime
Ag Lime
Waste Lime
Ag Lime
Waste Lime
Ag Lime
Waste Lime
Ag Lime
Waste Lime
Ag Lime
DM Yield, lbs/acre
4815
5206
3883
3737
1732
1906
5698
5461
3772
3707
CP,% 16.8 16.4 11.1 11.3 9.2 10.1 10.0 9.9 9.3 8.1
TDN, % 67.9 66.8 61.7 62.2 67.9 67.6 58.2 58.4 59.1 59.8
Ca, % .68 .66 .67 .70 .71 .83 .41 .40 .80 .66
P, % .38 .37 .67 .70 .22 .23 .24 .24 .19 .21
Mg,% .19 .19 .34 .33 .33 .28 .19 .18 .26 .23
K,% 2.59 2.53 1.25 1.25 1.01 1.34 1.95 1.88 1.20 1.44
Zn, ppm 23 23 24 29 22 23
Cu, ppm 9 8 10 13 8 8
Fe, ppm 117 210 83 91 77 137
Mn, ppm 79 72 91 63 133 97
81
Evaluation of Fall Dry Band Application of Phosphorous and Potassium Nutrient Needs for a
Corn/Soybean Rotation
Rich Hoormann, Charles Ellis, Kent Shannon, Peter Scharf
Rich Hoormann, Region Agronomy Specialist, Charles Ellis, Region Natural Resources Engineer,
Kent Shannon, Region Natural Resources Engineer, Peter Scharf, Associate Professor of
Agronomy, University of Missouri Extension
Introduction: Many Missouri farmers find their profit margins being squeezed by increasing cash rental rates and high fertilizer costs. Land owners are not agreeing to share profit risk with renters, which leaves them at a high business risk. Farmers are looking for alternative methods to reduce fertilizer costs and are reading about information from states where fall band fertilizer research has shown that broadcast rates can be reduced while maintaining yields. While fall and sidedress banding systems in the northern Corn Belt have research data there is little Missouri data on the results of such an approach, where a two year fertilizer recommendation is applied to meet the nutrient needs of a corn-soybean rotation. This is routinely applied broadcast with variable rate equipment or with blanket application equipment. Field information under Missouri soils and environment would indicate the value of such an approach by Missouri farmers and wither it could be recommended.
The objectives of this study are to determine: 1) The yield influence of fall 2 year band application of a P205/K20 fertilizer
recommendation for a corn and soybean rotation compared to a fall broadcast application.
2) Evaluate crop stand, vigor and yield results from planting directly over fall banded fertilizer using autosteer technology.
3) Evaluate fall strip tillage influence on corn/bean yield. 4) Evaluate the practicality of this approach by farmers to minimize fertilizer costs,
while maintaining or increasing yields.
Methods and Materials: In fall of 2008 four cooperators were with six with low phosphorus and low potassium test sites were identified. GPS referenced soil samples were taken on test sites for determination of composite sample averages and for use in geospatial statistical analysis of treatment interactions. Composite sample averages were used to determine the broadcast P205/K20 rate. Treatments consist of 4 replications of 0 P205/K20 (control), broadcast rate of soil test recommendation of P205/K20, broadcast rate in a band, and ½ broadcast rate of P205/K20 in a band. Due to the high cost of Phosphorus and Potassium fertilizer in the fall of 2008, a one year application of fertilizer was made for the 2009 corn crop. Yield objective for the 2009 corn crop was 140 bu./ac. Nitrogen applications were: 80 lbs./ac at planting with Urea and 98 lbs./ac. side dressed at V9 with 32%. Plots were sized to accommodate harvest equipment of individual cooperators, with plot size being approximately 0.5 acres.

82
2008 band application was with a 4 strip-till fertilizer bar mounted with a Gandy Orbit-Air box, provided in cooperation Dr. Kelly Nelson and Randy Smoot, Director, of the Greenly Memorial Research Center, Novelty Missouri. Fertilizer bands were on 30” row spacing at 5” depth. The plot application was completed at two of the loess upland sites in 2008. However, delays in crop harvest due to higher than normal precipitation in East Central Missouri prevented putting plots at the remaining four test sites. Site 1 was modified to evaluate a tillage comparison of strip-till and no-till with no phosphorus or potassium fertilizer applied. Below are the two plot layouts.
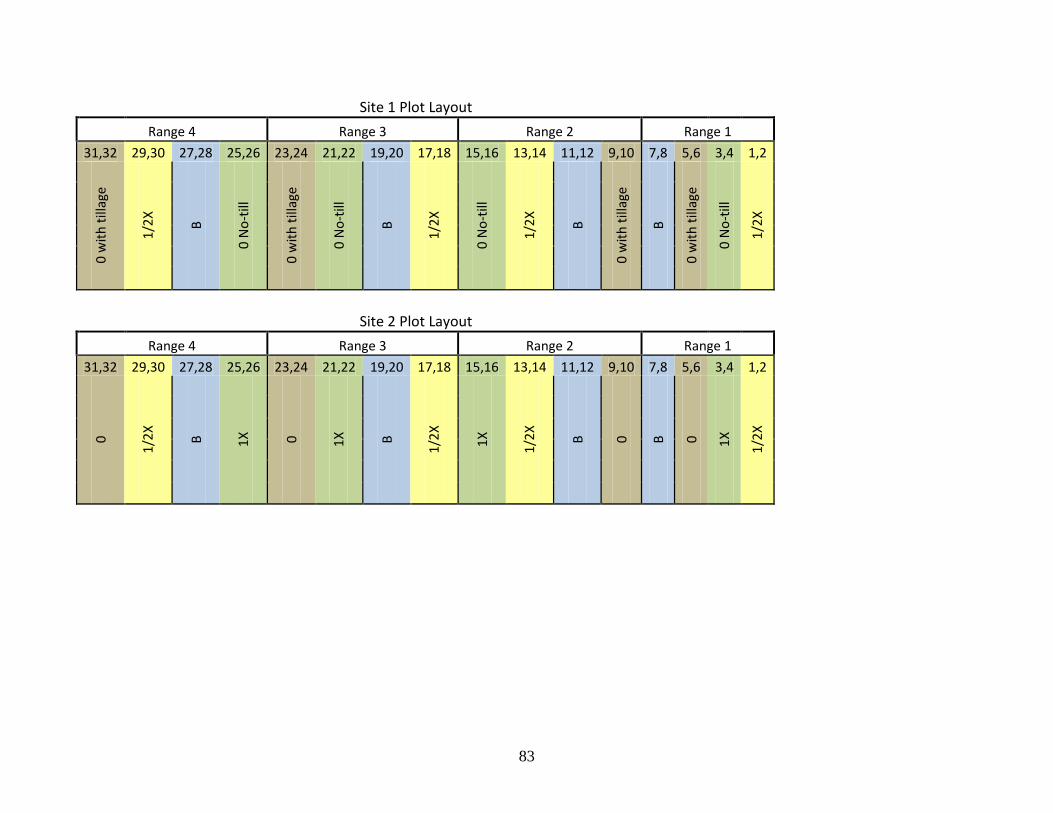
83
Site 1 Plot Layout
Range 4 Range 3 Range 2 Range 1
31,32 29,30 27,28 25,26 23,24 21,22 19,20 17,18 15,16 13,14 11,12 9,10 7,8 5,6 3,4 1,2
0 w
ith
till
age
1/2
X
B
0 N
o-t
ill
0 w
ith
till
age
0 N
o-t
ill
B
1/2
X
0 N
o-t
ill
1/2
X
B
0 w
ith
till
age
B
0 w
ith
till
age
0 N
o-t
ill
1/2
X
Site 2 Plot Layout
Range 4 Range 3 Range 2 Range 1
31,32 29,30 27,28 25,26 23,24 21,22 19,20 17,18 15,16 13,14 11,12 9,10 7,8 5,6 3,4 1,2
0
1/2
X
B
1X
0 1X
B
1/2
X
1X
1/2
X
B
0 B
0 1X
1/2
X
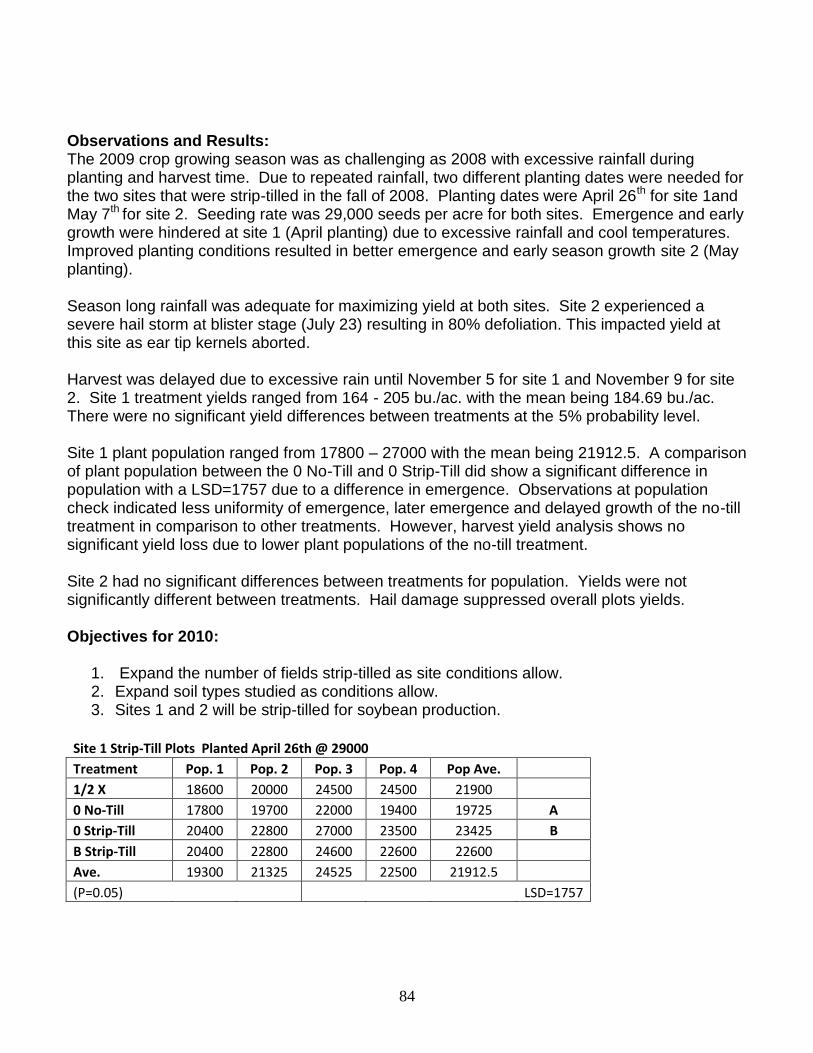
84
Observations and Results: The 2009 crop growing season was as challenging as 2008 with excessive rainfall during planting and harvest time. Due to repeated rainfall, two different planting dates were needed for the two sites that were strip-tilled in the fall of 2008. Planting dates were April 26th for site 1and May 7th for site 2. Seeding rate was 29,000 seeds per acre for both sites. Emergence and early growth were hindered at site 1 (April planting) due to excessive rainfall and cool temperatures. Improved planting conditions resulted in better emergence and early season growth site 2 (May planting). Season long rainfall was adequate for maximizing yield at both sites. Site 2 experienced a severe hail storm at blister stage (July 23) resulting in 80% defoliation. This impacted yield at this site as ear tip kernels aborted. Harvest was delayed due to excessive rain until November 5 for site 1 and November 9 for site 2. Site 1 treatment yields ranged from 164 - 205 bu./ac. with the mean being 184.69 bu./ac. There were no significant yield differences between treatments at the 5% probability level. Site 1 plant population ranged from 17800 – 27000 with the mean being 21912.5. A comparison of plant population between the 0 No-Till and 0 Strip-Till did show a significant difference in population with a LSD=1757 due to a difference in emergence. Observations at population check indicated less uniformity of emergence, later emergence and delayed growth of the no-till treatment in comparison to other treatments. However, harvest yield analysis shows no significant yield loss due to lower plant populations of the no-till treatment. Site 2 had no significant differences between treatments for population. Yields were not significantly different between treatments. Hail damage suppressed overall plots yields. Objectives for 2010:
1. Expand the number of fields strip-tilled as site conditions allow. 2. Expand soil types studied as conditions allow. 3. Sites 1 and 2 will be strip-tilled for soybean production.
Site 1 Strip-Till Plots Planted April 26th @ 29000
Treatment Pop. 1 Pop. 2 Pop. 3 Pop. 4 Pop Ave.
1/2 X 18600 20000 24500 24500 21900
0 No-Till 17800 19700 22000 19400 19725 A
0 Strip-Till 20400 22800 27000 23500 23425 B
B Strip-Till 20400 22800 24600 22600 22600
Ave. 19300 21325 24525 22500 21912.5
(P=0.05) LSD=1757
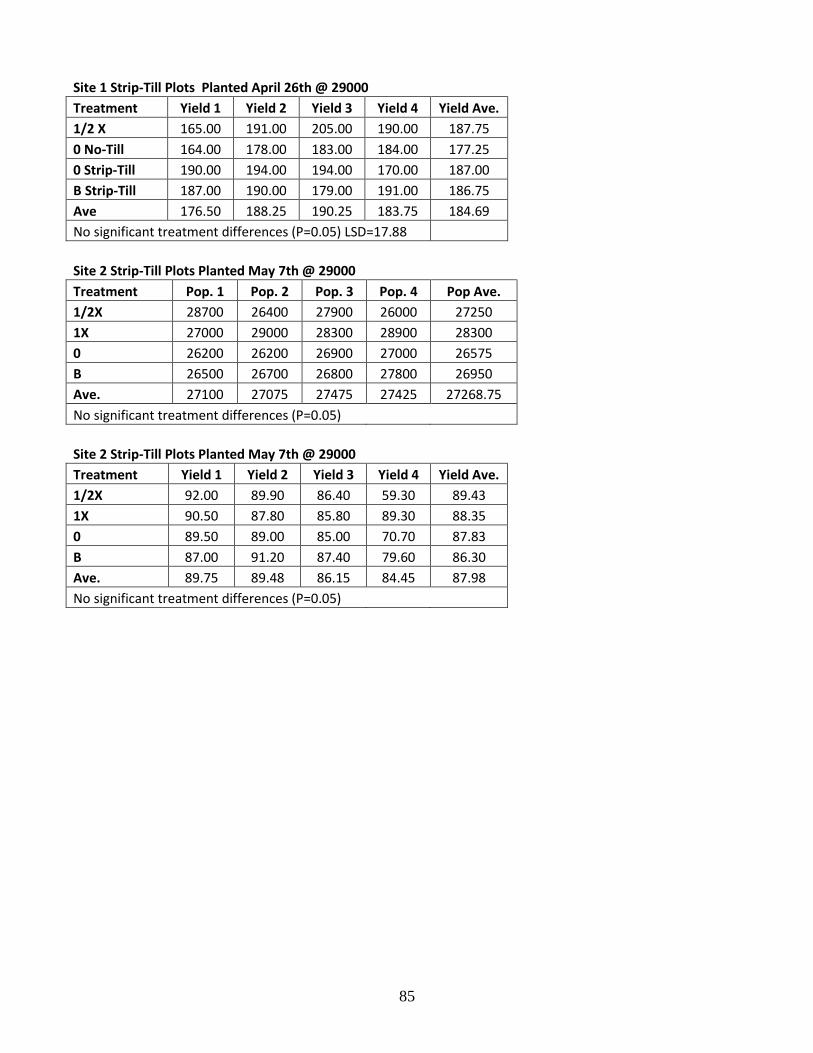
85
Site 1 Strip-Till Plots Planted April 26th @ 29000
Treatment Yield 1 Yield 2 Yield 3 Yield 4 Yield Ave.
1/2 X 165.00 191.00 205.00 190.00 187.75
0 No-Till 164.00 178.00 183.00 184.00 177.25
0 Strip-Till 190.00 194.00 194.00 170.00 187.00
B Strip-Till 187.00 190.00 179.00 191.00 186.75
Ave 176.50 188.25 190.25 183.75 184.69
No significant treatment differences (P=0.05) LSD=17.88
Site 2 Strip-Till Plots Planted May 7th @ 29000
Treatment Pop. 1 Pop. 2 Pop. 3 Pop. 4 Pop Ave.
1/2X 28700 26400 27900 26000 27250
1X 27000 29000 28300 28900 28300
0 26200 26200 26900 27000 26575
B 26500 26700 26800 27800 26950
Ave. 27100 27075 27475 27425 27268.75
No significant treatment differences (P=0.05)
Site 2 Strip-Till Plots Planted May 7th @ 29000
Treatment Yield 1 Yield 2 Yield 3 Yield 4 Yield Ave.
1/2X 92.00 89.90 86.40 59.30 89.43
1X 90.50 87.80 85.80 89.30 88.35
0 89.50 89.00 85.00 70.70 87.83
B 87.00 91.20 87.40 79.60 86.30
Ave. 89.75 89.48 86.15 84.45 87.98
No significant treatment differences (P=0.05)
86
Missouri Fertilizer and Lime Board
2009 First Year (first six months) Report
Optimum Timing of Nitrogen and Phosphorus Applications for Improved Tall Fescue Seed
Production
Dale G. Blevins
Professor & Kemper Fellow
Division of Plant Sciences
University of Missouri
Objective and Relevance – The Problem: Missouri produces large quantities of tall fescue seed, but
average yields are very low. The Hypothesis: Optimal timing of nitrogen (N) and phosphorus (P)
fertilization, along with the stripkill production method, will greatly increase tall fescue seed yields in
Missouri. The Objective: to determine the optimum timing of N and P applications for maximum tall
fescue seed production in Missouri.
Procedures – Several tall fescue sites were identified at the Agronomy Research Center near Columbia in
August 2009. Soil samples were collected from these sites and sent to the University of Missouri Soil
Testing Laboratory. Final site selection was based on the tall fescue stand, the plot area fertilization
history, most importantly a low Bray I P test result (Table 1). In our recent studies, tall fescue seed
production has shown good responses to P treatment. The site selected was along the East edge of
Bradford Farm just North of the East Lake. The Timetable for the steps taken to setup this experiment are
shown in Table 2.
Table 1. 2009 soil test results for the tall fescue area selected
for this study at Bradford Farm.
Sample # pHs OA NA CEC Bray I P K Ca Mg
1 5.9 3.0 2.0 11.8 14 204 3110 428
2 5.6 3.5 3.0 15.1 17 260 3778 549
Table 2. Timetable used to start this tall fescue seed production experiment in 2009.
Late Aug 2009 Identified tall fescue sites at Bradford Farm and collected soil samples
Early Sept – Selected plot area that had low Bray I P level and a good fescue stand
Sept 3 Bushhog was used to mow the fescue
Sept 7 Raked the dried hay off the plot area
Sept 15 Plot areas were measured and flagged (10‘ x 25‘with 5‘ borders, see plot map Fig. 1)
Sept 17 Specific plots were stripkilled by treating with Roundup (2oz/acre) + a surfactant and a blue
tracking dye. Strips were approximately 7.5‖ wide. Dr. Will McClain did the spraying. A blue tracking
dye was added to ensure the width and location of the sprayed areas (See Fig. 2).
Sept 30 Strips were visible, and plots were treated with triple super phosphate or urea-N as shown in Fig.1
with treatments randomly assigned. See treatments listed below.
Oct 2 Photographs of strips were taken (Figs. 3-5)
Dec 18 Plots were treated with their second application of P and N fertilizer

87
Plots were randomly assigned with the following treatments and replications:
N treatment splits: a) 0 lbs N late Sept + 100 lbs N in mid-Dec
b) 50 lbs N late Sept + 50 lbs N in mid-Dec
c) 100 lbs N late Sept + 0 lbs N in mid-Dec
P treatment splits: a) 0 lbs P in late Sept + 50 lbs P in mid-Dec
b) 25 lbs P in late Sept + 25 lbs P in mid-Dec
c) 50 lbs P in late Sept + 0 lbs P in mid-Dec
Production system: Conventional pasture or Stripkill
Replications: Five replications of each treatment
Total plots = 90 (10‘ x 25‘) plots with 5‘ borders
(3 Ntrtmts x 3 Ptrtmts x 2 ProdSystems x 5 reps = 90 plots total)
Ammonium nitrate was used as the N source and triple super phosphate (0-46-0) was used as the P source
(see Sept 30 in Table 2). Seed will be harvested with a plot combine around June 18, 2010.
After combining, seed will be screened to remove any stems and other trash prior to weighing and
moisture determination for final seed yield determination. Total forage fresh weight will be determined at
harvest time and weights of sub-samples will be determined before and after drying for dry weight
determination. This will allow determination of total plant biomass production from each treatment and
calculation of % seed vs % biomass for each plot.
Forage will be removed and treatments will be repeated on the same plots during late August of the
second year. Strips will be re-used (without additional Roundup treatment) for the second year.
Treatments and harvests will be identified to those used during year one.
2010 Budget:
Category Year 2
Salary
Research Assistant (25%) $9,500
Benefits 2,625
Supplies (fertilizer, Roundup, nozzles, gas) 2,000
Travel 750
Total $14,875
88
Figure 1. Fall 2009 tall fescue stripkill experiment plot map for the fertilizer treatment applications in
September 2009 at Bradford Farm.
Figure 2. The blue tracking dye showing the areas sprayed with Roundup in order to kill strips in the tall
fescue in September 2009 at Bradford Farm.
89
Figure 3. Killed strips in tall fescue plots about one month after spraying with Roundup in late September
2009 at Bradford Farm.
Figure 4. Fall 2009 strip kill plots in new study at Bradford Farm.
90
Figure 5. Strip kill plots in the tall fescue seed production study at Bradford Farm in Fall 2009.

91
Foliar Fertilizer and Fungicide Interactions on Corn Kelly Nelson, Peter Motavalli, Gene Stevens, Bruce Burdick, David Dunn, Laura Sweets, and John
Shetley
Kelly Nelson, Div. of Plant Sciences, Univ. of Missouri, Novelty, MO
Peter Motavalli, Dept. of Soil, Environ., and Atmos. Sci., Univ. of Missouri, Columbia, MO
Gene Stevens, Div. of Plant Sciences, Univ. of Missouri, Portageville, MO
Bruce Burdick, Div. of Plant Sciences, Univ. of Missouri, Albany, MO
David Dunn, Div. of Plant Sciences, Univ. of Missouri, Portageville, MO
Laura Sweets, Div. of Plant Sciences, Univ. of Missouri, Columbia, MO
John Shetley, Dept. of Soil, Environ., and Atmos. Sci., Univ. of Missouri, Columbia, MO
INTRODUCTION Corn acreage increased over 25% in Missouri and total acreage in the U.S. increased nearly 10
million acres from 2006 to 2007. High yield corn production systems have integrated fungicide
applications to maximize photosynthetic efficiency of the plant. From 2004 to 2007, median corn yields
for 16 site-years increased over 8 bu/acre when a strobilurin fungicide such as pyraclostrobin (Headline®)
was applied (Nelson and Smoot, 2007). The greatest yield increases due to fungicide applications
occurred in high yield environments.
Fungal infections decrease the area of photosynthetic tissue which reduces the transfer of
assimilates from their source to the ear and diverts assimilates to fungal growth, defense systems, and
increased respiration. Growth stimulation with the strobilurin fungicides has been related to a reduction
in the incidence of disease as well as increased nitrate uptake and assimilation in small grains (Köhle et
al., 2002). Research has shown that pyraclostrobin was important in stimulating nitric oxide, a key
messenger in plants (Conrath et al., 2004). Increased nitrate uptake and assimilation following an
application of a strobilurin fungicide would justify additional fertilizer at the time of application.
Identifying fertilizer sources that synergistically increase yield with a fungicide treatment would provide
opportunities to manage disease, reduce application costs, and provide additional fertilizer when crop
demand is greatest.
Research has established a link between plant nutrition and disease incidence including the disease
suppressing effects of K, Cl, Mn, B, and P (Fixen et al, 2004). Combining a foliar fertilizer with a
fungicide application may reduce application costs, improve disease suppression and nutrient response,
and increase flexibility in managing crop response to environmental conditions during the growing
season. There was a dramatic increase in the use of strobilurin fungicides in corn in 2007; however, no
research has evaluated interactions between fertilizer sources and a fungicide treatment. This research
will help Missouri farmers make informed decisions regarding fungicide-fertilizer interactions and how
these applications affect productivity and profitability. No published research has evaluated interactions
between fungicides and foliar fertilizers on corn. No research has been published on the effects of
fungicide treatments on corn plant nutrient levels in the field.
The objective of this research was to evaluate improvements in yield and monitor nutrient uptake
of a foliar fertilizer-fungicide management system for corn.
MATERIALS AND METHODS
Field research was conducted in 2008 and 2009 under sprinkler irrigation at Novelty (40.035997
N, 92.243783 W) and Albany (40.251282 N, 94.326977 W) while at Portageville (36.427945 N,
89.700234 W) corn was flood irrigated to assess corn response to fungicide-fertilizer treatments in high
yield environments. The soil was a Putnam silt loam (fine, smectitic, mesic Vertic Albaqaulfs), Grundy
silt loam (fine, montmorillonitic, mesic Aquic Argiudolls), and Tiptonville sandy loam (fine-silty, mixed,

92
thermic Typic Argiudolls) at Novelty, Albany, and Portageville, respectively. Field information about the
locations and selected management practices is shown in Table 1.
The study was randomized complete block design with three to five replications. Treatments
consisted of a factorial arrangement of foliar fertilizers combined with and without the fungicide
pyraclostrobin (Headline®
) at 6 oz/acre plus nonionic surfactant at 0.25% v/v applied at VT. Treatments
were applied with a CO2 propelled hand boom at 3 gallons/acre to simulate an aerial application. The
following fertilizer treatments and rates were selected for this research based on previous experience and
locally available foliar fertilizers used on corn in combination with fungicide treatments: 3-18-18-0 (%N-
%P2O5-%K2O-%S) at 2 gal/acre (NA-CHURS/ALPINE Solutions, Marion, OH), 0-0-30-0 at 2 gal/acre
(Double-OK, NA-CHURS/ALPINE Solutions, Marion, OH), potassium thiosulfate (0-0-25-17) at 1
gal/acre (KTS, Tessenderlo Kerley Inc., Phoenix, AZ), potassium thiosulfate plus urea triazone (5-0-20-
13) at 1.5 gal/acre (Trisert K+, Tessenderlo Kerley Inc., Phoenix, AZ), potassium chloride (0-0-62-0) at
2.5 lb/acre (PCS, Potash Corp. of Saskatchewan, Northbrook, IL), 25-0-0-0 controlled release nitrogen as
methylene urea and diurea with less than 0.01% Cl at 3 gal/acre (CoRoN, Helena Chemical Co.,
Collierville, TN), 24-0-1-0.6 slow release N with 0.25% B at 3 gal/acre (Pacer N, Crop Production
Services, Galesburg, IL), 22-0-2-1 with 0.25% B at 1 gal/acre (Task Force Maize, Crop Production
Services, Galesburg, IL), 30-0-0-0 at 1 gal/acre (Nitamin, Georgia-Pacific Chemicals, LLC., Atlanta,
GA), boron at 2 pt/acre (NA-CHURS/ALPINE Solutions, Marion, OH), Mn-chelate at 2 pt/acre (NA-
CHURS/ALPINE Solutions, Marion, OH), Fe-Mo-Mn-B-Zn (0.3%-0.01%-3.2%-0.2%-2.1%) premix at 1
qt/acre (MAX-IN, Winfield Solutions, LLC., St. Paul, MN), and 6-0-0-0 with 10% Ca at 2.5 gal/acre
(Nutri-Cal, CSI Chemical Corp., Bondurant, IA).
Corn injury from 0 (no visual crop injury) to 100% (complete crop death) was evaluated 7 to 14
days after treatment (DAT) based on the combined visual effects of N source on necrosis, chlorosis, and
stunting. The incidence of foliar disease was rated on a scale of 0 (no disease) to 100% (complete
infestation) 28 to 42 DAT. Ear leaf tissue nutrient status of the fungicide-treated and untreated plants was
intensively monitored at each location from the time of application until black layer to build background
information to target synergistic foliar nutrient applications. Analysis of corn ear leaf tissue was
monitored 7 days after application for all treatments. Leaf tissue samples from 2009 are currently being
analyzed.
The center two rows were harvested for yield and moisture converted to 15% prior to analysis.
Grain samples were collected. Grain protein, oil and starch were determined using NIR spectroscopy
from the Portageville and Novelty sites in 2008 and are currently being analyzed for the 2009 sites. Data
were subjected to an analysis of variance and means separated using Fisher‘s Protected LSD at P < 0.01
unless otherwise specified. Data were subjected to an F Max test for homogeneity (Kuehl 1994) and were
combined over site-years when appropriate and main effects were presented in the absence of interactions.
RESULTS
The incidence of disease was less than 5% at Novelty, Portageville, and Albany in 2008 and 2009
(Tables 2 and 3). Data were combined over years for each location since there was a difference in
diseases at each site. Although there was limited disease present at each location, pyraclostrobin did not
affect the incidence of disease at any of the sites (Table 2). In addition, there was no difference in the
incidence of disease among fertilizer treatments (Table 3) even though differences in injury caused by the
fertilizer treatments were detected (Table 5).
The presence of foliar injury was primarily persistent necrosis of leaf tissue caused by fertilizer
treatments. Pyraclostrobin did not affect crop injury when compared to the non-treated control (Table 4).
Injury was less than 10% for all fertilizer treatments at Novelty and Albany (Table 5). Crop injury with 0-
0-30-0 ranged from 4 to 20%. Crop injury was inconsistent and was probably related to the temperature,
time of day, and relative humidity at the time of application.
93
Grain moisture was 0.5% greater with pyraclostrobin treated corn when compared to the non-
treated control at Novelty while there was no difference at Portageville or Albany (Table 4). This may
have been related to the greater moisture content at the time of harvest at Novelty or the difference in
hybrid at Portageville. However, fertilizer treatments did not affect grain moisture at the time of harvest
in 2008 and 2009 (Table 5).
Pyraclostrobin increased grain yield 9 bu/acre at Novelty and Portageville in 2008 and 2009 while
there was a slight increase in oil concentration in 2008 (Table 4). Three of the four site-years were in
continuous corn at these sites which may have contributed to a greater level of inoculum present for
disease; however, no differences in the incidence of disease were detected (Tables 2 and 3). An
application of 30-0-0-0 increased yield 17 bu/acre in 2008 and 2009 while 0-0-25-17 and 5-0-20-13
increased grain protein concentrations in 2008 when compared to the non-treated control at Novelty and
Portageville (Table 5). None of the foliar fertilizer treatments significantly reduced grain yield, but some
should be avoided due to crop injury. Pyraclostrobin had inconsistent effects on leaf tissue nutrient
concentrations in 2008. Differences in N and P (Figure 1), K, Mg, and Cu (data not presented) were
observed depending on the number of days after application. Tissue and grain analysis for 2009 is
currently underway. The effect of fertilizers on nutrient concentration should be more conclusive once
these analyses are completed.
SUMMARY
The incidence of disease was less than 5% at all three locations and the effect of pyraclostrobin on
disease was minimal.
The incidence of disease was not affected by fertilizer treatments.
Pyraclostrobin increased grain moisture 0.5% at Novelty and yield 9 bu/acre when compared to the
non-treated control at Novelty and Portageville.
There was a significant increase in grain yield (17 bu/acre) when 30-0-0-0 was applied to corn at VT
at Novelty and Portageville.
References: Conrath, U., G. Amoroso, H. Köhle, and D.F. Sultemeyer. 2004. Non-invasive online detection of nitric oxide from plants and
other organisms by mass spectroscopy. Plant J. 38:1015-1022.
Fixen, P.E., C.S. Snyder, H.F. Reetz, Jr., T. Yamada, and T. S. Murrell. 2004. Nutrient management of soybeans with the
potential for Asian rust infection. Potash & Phosphate Institute, (PPI), Norcross, GA.
Köhle, H., K. Grossmann, T. Jabs, M. Gerhard, W. Kaiser, J. Glaab, U. Conrath, K. Seehaus, and S. Herms. 2002.
Physiological effects of the strobilurin fungicide F 500 on plants. In Modern Fungicides and Antifungal Compounds III.
(Dehne, H.W., U. Gisi, K.H. Kuck, P.E. Russell, and H. Lyr, eds.). Bonn: Mann GmbH & Co. KG, pp. 61-74.
Marschner, H. 1995. Functions of mineral nutrients: macronutrients. Mineral nutrition of higher plants. pp. 229-312.
Nelson, K.A., P.P. Motavalli, and M.J. Nathan. 2004. The impact of foliar potassium fertilizer source on crop response and
weed control in a no-till ―weed and feed‖ glyphosate-resistant soybean production system. pp. 149-155. Vol. 21.
Proceedings of the 2004 Fluid Forum, Scottsdale, AZ.
Nelson, K.A. and R.L. Smoot. 2007. Effect of Quadris and Headline on corn grain yields in Northeast Missouri. Greenley
Research Center Field Day Report. 30:14-16.
94
Table 1. Field information and selected management practices for Novelty, Portageville, and Albany in
2008 and 2009. Field information and Novelty Portageville Albany
management practices 2008 2009 2008 2009 2008 2009
Previous crop Corn Corn Soybean Corn Soybean Soybean
Replications 5 4 4 4 3 5
Planting date 19 May 7 May 1 May 23 Apr. 21 May 22 May
Fertilizer rate (N-P-K lbs/acre) 230-70-100 230-80-120 160-0-0 180-0-0 160-60-80 225-60-80
Hybrid DK63-42 DK63-42 P33N58 P33N58 DK63-42 DK63-42
Seeding rate (seeds/acre) 35,000 35,000 35,000 35,000 28,000 29,500
Fungicide and foliar fertilizer
application date
23 July 28 July 9-10 July 7 July 16 July 3 Aug.
Air temperature (F) 79 70 76 78 89 88
Relative humidity (%) 50 90 80 72 70 65
Height (inches) 96 72 120 84 120 104
Harvest date 10 Oct. 3 Nov. 22 Sept. 23 Oct. 21 Nov. 30 Nov.
95
Table 2. Incidence of disease at Novelty, Portageville, and Albany 28 to 42 days after treatment in 2008
and 2009. Data were combined over fertilizer treatment and year for each location. Novelty Portageville Albany
Fungicide treatment GLSa
CR NCLB GLS ANTH BSR CS GLS CR
------------------------------------------------- % -----------------------------------------------
Non-treated 1 0.2 0.3 1 2 1 1 1 2
Pyraclostrobinb
1 0.1 0 1 2 1 1 1 2
LSD (P<0.05) NS NS NS NS NS NS NS NS NS aAbbreviations: ANTH, Anthracnose leaf blight (Colletotrichum graminicola); BSR, bacterial stalk rot (Erwinia dissolvens);
CR, common rust (Puccinia sorghi); CS, common smut (Ustilago zeae); GLS, grey leaf spot (Cercospora zeae-maydis); LSD,
least significant difference; NCLB, northern corn leaf blight (Exserohilum turcicum); and NS, non-significant.
bHeadline at 6 oz/acre plus non-ionic surfactant at 0.25% v/v.
Table 3. Incidence of disease at Novelty, Portageville, and Albany 28 to 42 days after treatment in 2008
and 2009. Data were combined over fungicide treatment and year for each location. Novelty Portageville Albany
Fertilizer treatmenta
GLSb
CR NCLB GLS ANTH BSR CS GLS CR
-------------------------------------------------- % ------------------------------------------------
Non-treated 1 0.3 0 1 2 1 1 0 2
3-18-18-0 1 0.1 0 1 2 1 1 0 2
0-0-30-0 1 0.1 0 2 1 1 1 1 2
22-0-2-1, 0.25% B 1 0.1 0 1 2 1 1 1 2
24-0-1-0.6, 0.25% B 1 0 0.1 1 2 1 1 1 3
25-0-0-0, 0.01% Cl 1 0.3 0 1 2 1 1 1 2
0-0-25-17 1 0.2 0 1 2 1 1 1 2
5-0-20-13 1 0.1 0 1 2 1 1 1 2
0-0-62-0 1 0.2 0 1 1 2 1 1 2
30-0-0-0 1 0.1 0 1 2 1 1 1 2
6-0-0-0, 10% Ca 1 0.1 0.1 1 2 1 1 1 2
Boron 1 0.1 0.1 2 2 1 1 1 2
Fe-Mo-Mn-B-Zn 1 0.1 0.1 1 1 1 1 1 2
Mn-chelate 1 0.2 0 1 1 1 1 1 2
LSD (P<0.05) NS NS NS NS NS NS NS NS NS a3-18-18-0 (%N-%P2O5-%K2O-%S) at 2 gal/acre (NA-CHURS/ALPINE Solutions, Marion, OH), 0-0-30-0 at 2 gal/acre
(Double-OK, NA-CHURS/ALPINE Solutions, Marion, OH), potassium thiosulfate (0-0-25-17) at 1 gal/acre (KTS,
Tessenderlo Kerley Inc., Phoenix, AZ), potassium thiosulfate plus urea triazone (5-0-20-13) at 1.5 gal/acre (Trisert K+,
Tessenderlo Kerley Inc., Phoenix, AZ), potassium chloride (0-0-62-0) at 2.5 lb/acre (PCS, Potash Corp. of Saskatchewan,
Northbrook, IL), 25-0-0-0 controlled release nitrogen as methylene urea and diurea with less than 0.01% Cl at 3 gal/acre
(CoRoN, Helena Chemical Co., Collierville, TN), 24-0-1-0.6 slow release N with 0.25% B at 3 gal/acre (Pacer N, Crop
Production Services, Galesburg, IL), 22-0-2-1 with 0.25% B at 1 gal/acre (Task Force Maize, Crop Production Services,
Galesburg, IL), 30-0-0-0 at 1 gal/acre (Nitamin, Georgia-Pacific Chemicals, LLC., Atlanta, GA), boron at 2 pt/acre (NA-
CHURS/ALPINE Solutions, Marion, OH), Mn-chelate at 2 pt/acre (NA-CHURS/ALPINE Solutions, Marion, OH), Fe-Mo-
Mn-B-Zn (0.3%-0.01%-3.2%-0.2%-2.1%) premix at 1 qt/acre (MAX-IN, Winfield Solutions, LLC., St. Paul, MN), and 6-0-0-0
with 10% Ca at 2.5 gal/acre (Nutri-Cal, CSI Chemical Corp., Bondurant, IA). bAbbreviations: ANTH, Anthracnose leaf blight (Colletotrichum graminicola); BSR, bacterial stalk rot (Erwinia dissolvens);
CR, common rust (Puccinia sorghi); CS, common smut (Ustilago zeae); GLS, grey leaf spot (Cercospora zeae-maydis); LSD,
least significant difference; NCLB, northern corn leaf blight (Exserohilum turcicum); and NS, non-significant.
96
Table 4. Corn injury 7 days after treatment, grain moisture, and yield as affected by pyraclostrobin at Novelty, Portageville,
and Albany in 2008 and 2009. Data were combined over fertilizer treatments and site-years in the absence of interactions. Novelty and Portageville
Fungicide Grain moisture 2008 Albany
treatment Injury Novelty Portageville Yield Oil Injury Moisture Yield
% % % Bu/a % % % Bu/a
Non-treated 1 22.6 16.2 170 4.27 0.5 17.9 167
Pyraclostrobina
1 23.1 16.2 179 4.33 0.5 17.9 167
LSD (P < 0.01)b
NS 0.3 NS 6 0.05 NS NS NS aHeadline at 6 oz/acre plus non-ionic surfactant at 0.25% v/v.
bAbbreviations: LSD, least significant difference; Moist., moisture; and NS, non-significant.
Table 5. Corn injury 7 days after treatment, grain protein in 2008, grain moisture, and yield as affected by fertilizer treatments at Novelty,
Portageville, and Albany in 2008 and 2009. Data were combined over fungicide treatments and site-years in the absence of interactions. Injury
Novelty Portageville Novelty and Portageville Albany
Fertilizer treatmenta
2008
2009
2008
2009
Protein
(2008) Moisture Yield
Injury Moisture Yield
---------------- % ---------------- % --- % --- -- Bu/a -- -- % -- -- % -- - Bu/a -
Non-treated 0 0 0 0 7.9 19.7 172 0 17.9 169
3-18-18-0 0 0 0 10 7.9 19.6 176 0 17.9 164
0-0-30-0 7 9 20 10 8.0 19.8 161 4 18.3 168
22-0-2-1, 0.25% B 0 0 0 0 7.9 19.7 175 2 18.1 171
24-0-1-0.6, 0.25% B 0 0 0 0 7.9 20.1 176 0 18.0 171
25-0-0-0, 0.01% Cl 0 0 0 10 7.9 19.5 174 0 18.1 175
0-0-25-17 10 0 0 0 8.1 19.5 173 0 18.0 168
5-0-20-13 9 2 0 10 8.1 19.6 177 0 18.0 163
0-0-62-0 0 2 0 0 8.0 19.7 173 0 17.9 167
30-0-0-0 0 0 0 0 7.9 19.7 189 0 17.7 172
6-0-0-0, 10% Ca 1 0 10 10 7.9 19.8 176 0 17.6 165
Boron 0 0 0 10 7.9 19.9 182 0 17.9 165
Fe-Mo-Mn-B-Zn 0 0 0 0 7.9 19.8 171 0 17.9 158
Mn-chelate 0 1 0 20 7.9 19.6 171 0 17.7 162
LSD (P<0.01)b
1 1 10 NS 0.2 NS 15 1 NS 13 a3-18-18-0 (%N-%P2O5-%K2O-%S) at 2 gal/acre (NA-CHURS/ALPINE Solutions, Marion, OH), 0-0-30-0 at 2 gal/acre (Double-OK, NA-CHURS/ALPINE Solutions,
Marion, OH), potassium thiosulfate (0-0-25-17) at 1 gal/acre (KTS, Tessenderlo Kerley Inc., Phoenix, AZ), potassium thiosulfate plus urea triazone (5-0-20-13) at 1.5
gal/acre (Trisert K+, Tessenderlo Kerley Inc., Phoenix, AZ), potassium chloride (0-0-62-0) at 2.5 lb/acre (PCS, Potash Corp. of Saskatchewan, Northbrook, IL), 25-0-0-
0 controlled release nitrogen as methylene urea and diurea with less than 0.01% Cl at 3 gal/acre (CoRoN, Helena Chemical Co., Collierville, TN), 24-0-1-0.6 slow
release N with 0.25% B at 3 gal/acre (Pacer N, Crop Production Services, Galesburg, IL), 22-0-2-1 with 0.25% B at 1 gal/acre (Task Force Maize, Crop Production
Services, Galesburg, IL), 30-0-0-0 at 1 gal/acre (Nitamin, Georgia-Pacific Chemicals, LLC., Atlanta, GA), boron at 2 pt/acre (NA-CHURS/ALPINE Solutions, Marion,
OH), Mn-chelate at 2 pt/acre (NA-CHURS/ALPINE Solutions, Marion, OH), Fe-Mo-Mn-B-Zn (0.3%-0.01%-3.2%-0.2%-2.1%) premix at 1 qt/acre (MAX-IN, Winfield
Solutions, LLC., St. Paul, MN), and 6-0-0-0 with 10% Ca at 2.5 gal/acre (Nutri-Cal, CSI Chemical Corp., Bondurant, IA). bAbbreviations: LSD, least significant difference; and NS, non-significant.

97
Ear Leaf Nitrogen Ear Leaf Phosphorus
Figure 1. Ear leaf nitrogen (left) and phosphorus (right) concentrations for non-treated and pyraclostrobin
treated plants at Novelty (A), Portageville (B), and Albany (C) in 2008.
98
Nutrient Management in Biofuel Crop Production Tim Reinbott, Manjula Nathan, Kelly Nelson and Robert Kremer
Tim Reinbott, Manjula Nathan, Kelly Nelson of Division of Plant Sciences and Robert Kremer, USDA-
ARS, Department of Soils, Environmental, and Atmospheric Sciences
Objectives:
1. To determine the optimum nutrient management practices for environmentally safe and
economically viable biofuel crop production.
2. To evaluate long-term effects of biofuel crop production on selected chemical, physical and
microbiological properties of crop land
Procedures:
Experimental plots established for research on biofuel crops production and management practices
at Research and Extension Centers near Columbia and Novelty are used in this study. The
experimental design is a 8x3 factorial laid out in a split-plot design with three to four replications.
The main plots consisted of eight bio-fuel cropping systems as listed below:
o Continuous Corn for grain only
o Continuous Corn for grain and stover removal
o Corn-soybean rotation for grain only
o Soybean-corn rotation for grain only
o Sweet Sorghum /Wheat double crop
o Miscanthus
o Switchgrass
o Tall Fescue
The subplots received the following three fertilizer treatments:
1. University of Missouri Fertilizer and lime recommendations with a 4 year P and K
Buildup
2. Fertilizer recommendations based on annual crop removal values with one year P
and K buildup
3. Control- 0 P, 0K
o The following soil chemical, physical and microbiological measurements collected each year.
Initial Soil fertility measurements (pH, NA, P, K, Ca, Mg, OM, CEC)
Organic C and total N measurements
Wet aggregate stability measurements to determine structural changes
Carbon and Nitrogen mineralization using selected soil enzyme assays
End of season soil fertility measurements
Plant measurements:
1. Dry matter production (Treatments 2, 5-8)
2. Grain yield (Treatments 1-4)
3. Nutrient uptake (based on dry matter production and grain yield)

99
Results:
Initial Soil Tests:
The initial soil test results from the Bradford and Greenley sites are provided in Tables 1 and 2. The
fertilizer treatments were calculated based on initial soil tests using the University of Missouri fertilizer
recommendations and nutrient removal values calculated based on yields and nutrient content of grain,
stover and dry matter yields from the previous growing season.
Table 1. Initial soil characteristics at the Bradford site in 2009.
Cropping System pHs (1:1)
NA meq/100g
Bray P 1
lbs/a K
lbs/a Ca lbs/a
Mg lbs/a
CEC meq/100g
OM %
Cont Corn Grain 5.9 1.9 24 121 3599 299 12.3 2.4
Cont.Corn Grain + Stover 5.9 1.9 29 144 3742 310 12.7 2.5
Corn/Soybean Rotation 5.8 1.8 27 116 3588 314 12.2 2.5
Miscanthus 6.0 1.8 31 147 4141 348 13.7 2.6
Soybean/Corn Rotation 6.0 1.5 27 140 3992 326 13.0 2.5
Sweet Sorghum 5.8 2.2 31 147 3567 326 12.6 2.5
Switchgrass 5.9 1.9 38 157 3622 315 12.4 2.7
Tall Fescue 6.2 1.3 34 175 4053 336 13.0 2.6
Table 2. Initial soil characteristics at the Greenley site in 2009.
Cropping System pHs (1:1)
NA meq/100g
Bray P 1
lbs/a K
lbs/a Ca lbs/a
Mg lbs/a
CEC meq/100g
OM %
Cont. Corn grain 5.8 2.8 23 222 4242 402 15.3 3.3
Cont. Corn Grain + Stover 6.3 1.4 34 231 4622 394 14.9 3.5
Corn/Soybean Rotation 6.0 2.4 24 220 4224 383 14.8 3.0
Miscanthus 5.9 2.4 24 236 4196 412 14.9 2.9
Soybean/Corn Rotation 6.0 2.1 30 203 4342 365 14.7 3.2
Sweet Sorghum 6.0 2.3 24 206 4623 422 15.9 3.0
Switchgrass 6.0 2.3 30 271 4274 434 15.2 3.1
Tall Fescue 6.0 2.2 19 213 4160 394 14.5 3.2
Initial Soil Quality Analysis: Total organic carbon (TOC) and total nitrogen (TN) contents for each soil sample were determined by dry
combustion at 900C using a LECO TruSpec CN analyzer. Statistical analyses performed on TOC, TN,
and C:N ratio revealed no significant difference between soils from each cropping system within each
bio-fuel production site at the time the experiment was initiated; however, soils at the Greenley site
appeared to possess about 14% more TOC than the Bradford site (Table 3). The difference in TOC may
reflect past management of crop residues or type of vegetation at the field sites selected for this study.
Total N did not vary between sites as widely as TOC. Generally, TOC ranged from 15.6 to 19.55 g C kg-1
soil (2.68 – 3.4% soil organic matter [SOM]) with a mean content of 17.5 g C kg-1
soil (3.0% SOM) at
Bradford and 18.43 to 22.77 g C kg-1
soil (3.2 – 3.9% SOM) with a mean content of 19.94 g C kg-1
soil
100
(3.4% SOM) at Greenley. The C:N ratios calculated from the TOC and TN values for each cropping
system were within a range of 9.8 to 11.9 for both sites, suggesting that SOM quality is adequate to
facilitate mineralization of organic N that would be readily available for plant uptake.
A wet-sieving method was used to determine stability of soil aggregates (>250 µm diameter) for each soil
sample. The proportion of water-stable aggregates is a reflection of soil structure and is directly related to
water infiltration (porosity), aeration, plant root development, C sequestration, and general microbial
activity. Soil and crop management practices can greatly affect soil aggregation. For the initial soil
sampling, water-stable aggregation appears to be higher for the Bradford site relative to Greenley possible
indicating previous management imposed at each site (Table 4). Bradford site was under long-term
perennial vegetation (pasture), which contributes to development of soil aggregation; the Greenley site
was in a crop-pasture rotation and was subjected to more tillage or cultivation, which destroys
aggregation. Soil microbial activity was assessed by measuring two enzyme activities, dehydrogenase,
which indicates overall microbial activity based on this involvement of this enzyme in the respiration
process, and glucosaminidase, an indicator of N mineralization. Unfortunately, dehydrogenase results for
Greenley are not completed for this report due to technical problems but completion of the follow-up
analyses is in progress. Dehydrogenase activity for Bradford is within a narrow range, not significantly
different among the cropping systems, and reflects a level of activity representative of the Mexico silt
loam soil quality noted in previous studies. Glucosaminidase activity also represented an acceptable level
for good soil quality for this soil, however, soils at the Bradford site exhibited about a 50% higher activity
relative to Greenley. The apparent contrast between sites regarding glucosaminidase activity may reflect
differences in soil management and quality of SOM (i.e., types and amounts of N-containing organic
substances).
In summary, the organic and biological properties measured suggest the plot locations selected for each
site are relatively uniform and changes resulting from response of these properties to bio-fuel crop and
imposed management should be detected within the study timeframe. The initial differences between the
two sites, primarily in soil C content and glucosamindase activity, may require separate analyses for the
sites as the project progresses.

101
Table 3. Total organic carbon, total nitrogen and C:N of soils in bio-fuel cropping systems at study
initiation, spring 2009.
Cropping System Total organic C (g kg-1
soil)
Total N (g kg-1
soil) C:N
Bradford Farm, Boone County
Continuous corn – grain 18.88 2.00 9.83
Continuous corn – grain +
stover
16.98 1.73 9.77
Corn-Soybean – grain 16.58 1.71 9.81
Soybean-Corn – grain
Sweet sorghum-Wheat 15.60 1.59 10.11
Miscanthus 17.75 1.61 10.96
Switchgrass 17.93 1.80 10.03
Indiangrass 16.60 1.58 10.52
Big bluestem 19.55 1.83 10.97
Greenley Research Center, Knox County
Continuous corn – grain 20.93 1.95 10.77
Continuous corn – grain +
stover
22.77 2.02 11.16
Corn-Soybean – grain 19.20 1.72 11.22
Soybean-Corn – grain 18.43 1.70 10.85
Sweet sorghum-Wheat 20.37 1.84 11.07
Miscanthus 18.53 1.69 10.97
Switchgrass 19.53 1.67 11.89
Tall fescue 19.93 1.85 10.82

102
Table 4. Water-stable aggregation and enzyme activity for soils in bio-fuel cropping systems at study
initiation, spring 2009.
Cropping System Water-stable
aggregates (%)
Dehydrogenase1
(µg TPF g-1
soil)
Glucosaminidase3
(µg PNP g-1
soil)
Bradford Farm, Boone County
Continuous corn – grain 25.6 326.5 1072.1
Continuous corn – grain +
stover
30.3 237.9 1095.4
Corn-Soybean – grain 24.3 268.9 1077.6
Soybean-Corn – grain
Sweet sorghum-Wheat 26.2 273.0 1119.8
Miscanthus 25.2 217.9 1066.6
Switchgrass 24.3 235.3 974.2
Indiangrass 20.2 231.1 1061.4
Big bluestem 30.6 284.6 1038.9
Greenley Research Center, Knox County
Continuous corn – grain 15.3 2
660.1
Continuous corn – grain +
stover
21.6 729.8
Corn-Soybean – grain 7.2 733.4
Soybean-Corn – grain 11.5 694.6
Sweet sorghum-Wheat 14.9 717.4
Miscanthus 16.0 651.8
Switchgrass 10.2 705.8
Tall fescue 34.6 754.8 1 Dehydrogenase activity expressed as concentration of product, triphenyl formazam (TPF), formed
during enzyme assay. 2 Results of dehydrogenase assay for Greenley site is incomplete pending completion of validation
analyses. 3 Glucosaminidase activity expressed as concentration of product, p-nitrophenol (PNP), formed during
enzyme assay.
Grain and Biomass Yield: The 2009 growing season was characterized by unusually wet and cool conditions which delayed
planting, maturity, and harvest. Nitrogen loss was also a major factor and was dependent upon source
(anhydrous ammonia at Greenley and urea+agrotain at Bradford) and time of application with dry
fertilizer applied no-till resulting in the greatest losses. Overall grain yields at the Greenley Research
Center were excellent with corn yields over 200 bushels/acre (Table 5a). However, at Bradford wet
conditions resulted in significant nitrogen losses that became evident near tasseling and resulted in much
lower grain yield (Table 6a). At both locations corn grain yield responded to P and K application in the
continuous corn treatments. Soybean yield was lower with P and K treatments at Greenley. However,
these are early treatments and rotation effects which may change over the next few years as P and K soil
levels change and soil quality factors are affected.
Biomass yield varied greatly across species and with the exception of Miscanthus. At both locations
biomass yields of each species was very similar (Table 5 b and 6 b). Miscanthus yield was much lower at
Greenley since this was the first year of establishment. The Miscanthus stand at Bradford is in its second
103
and third year with biomass yields near 8 tons/acre (Table 6b). Although corn grain yield was
significantly reduced at Bradford from nitrogen loss stover yield was very similar to Greenley (Tables 5a
and 6a) indicating that the nitrogen loss occurred later in the growing season and that dry matter yield is
not as sensitive to nitrogen as grain yield. Overall there was little difference in biomass yield in response
to P and K application although with some species such as sweet sorghum there tended to be an increase
in biomass yield with P and K application. Differences in grain and biomass yield due to P and K
application were not expected the first year since initial P and K levels were near optimal. Over time
treatment effects may change as P and K levels either buildup or are depleted. The plant and grain
nutrient analysis is currently underway at this time (mid December 2009), but when nutrient removal is
calculated for each species and treatment a much better understanding of the significance of the P and K
treatments as well as the impact of nutrient removal will be realized.
Summary: Initial soil test and soil quality measurements indicate that the there is little difference between the
treatments and only slight differences between locations. Grain and biomass yield was not greatly
affected by fertilizer treatment the initial yield. However, nutrient analysis of grain and biomass will
indicate if luxury consumption of nutrients is occurring.
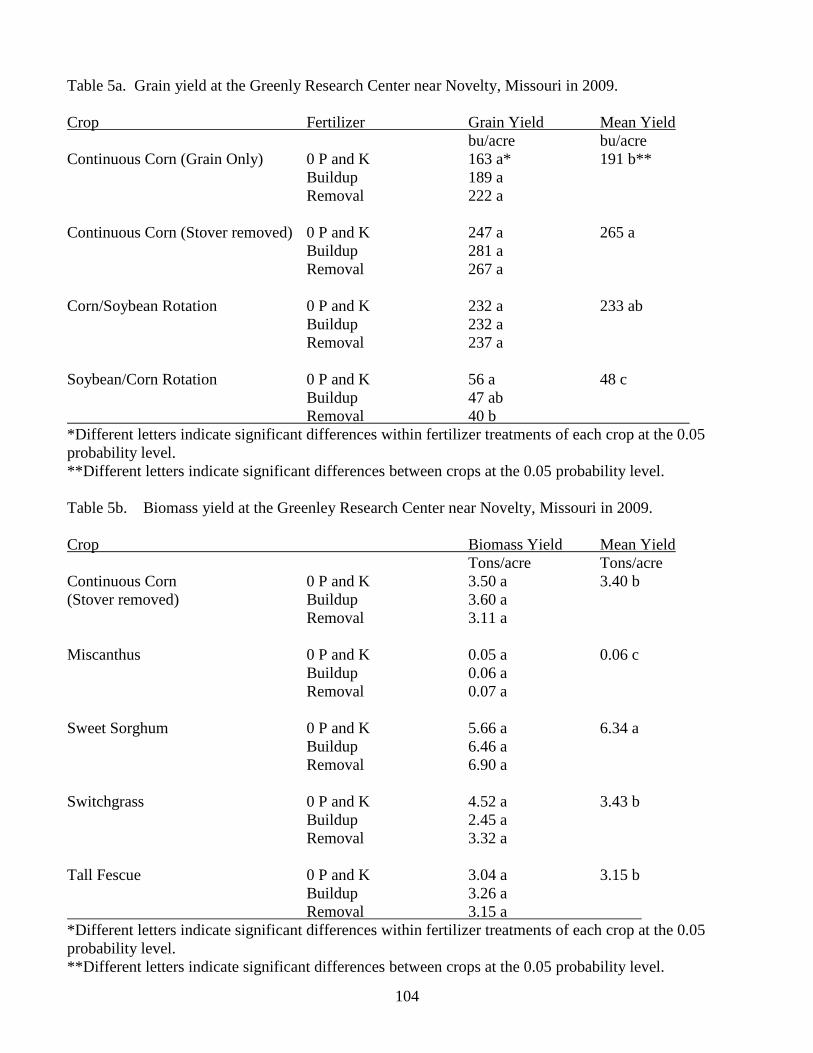
104
Table 5a. Grain yield at the Greenly Research Center near Novelty, Missouri in 2009.
Crop Fertilizer Grain Yield Mean Yield
bu/acre bu/acre
Continuous Corn (Grain Only) 0 P and K 163 a* 191 b**
Buildup 189 a
Removal 222 a
Continuous Corn (Stover removed) 0 P and K 247 a 265 a
Buildup 281 a
Removal 267 a
Corn/Soybean Rotation 0 P and K 232 a 233 ab
Buildup 232 a
Removal 237 a
Soybean/Corn Rotation 0 P and K 56 a 48 c
Buildup 47 ab
Removal 40 b
*Different letters indicate significant differences within fertilizer treatments of each crop at the 0.05
probability level.
**Different letters indicate significant differences between crops at the 0.05 probability level.
Table 5b. Biomass yield at the Greenley Research Center near Novelty, Missouri in 2009.
Crop Biomass Yield Mean Yield
Tons/acre Tons/acre
Continuous Corn 0 P and K 3.50 a 3.40 b
(Stover removed) Buildup 3.60 a
Removal 3.11 a
Miscanthus 0 P and K 0.05 a 0.06 c
Buildup 0.06 a
Removal 0.07 a
Sweet Sorghum 0 P and K 5.66 a 6.34 a
Buildup 6.46 a
Removal 6.90 a
Switchgrass 0 P and K 4.52 a 3.43 b
Buildup 2.45 a
Removal 3.32 a
Tall Fescue 0 P and K 3.04 a 3.15 b
Buildup 3.26 a
Removal 3.15 a
*Different letters indicate significant differences within fertilizer treatments of each crop at the 0.05
probability level.
**Different letters indicate significant differences between crops at the 0.05 probability level.
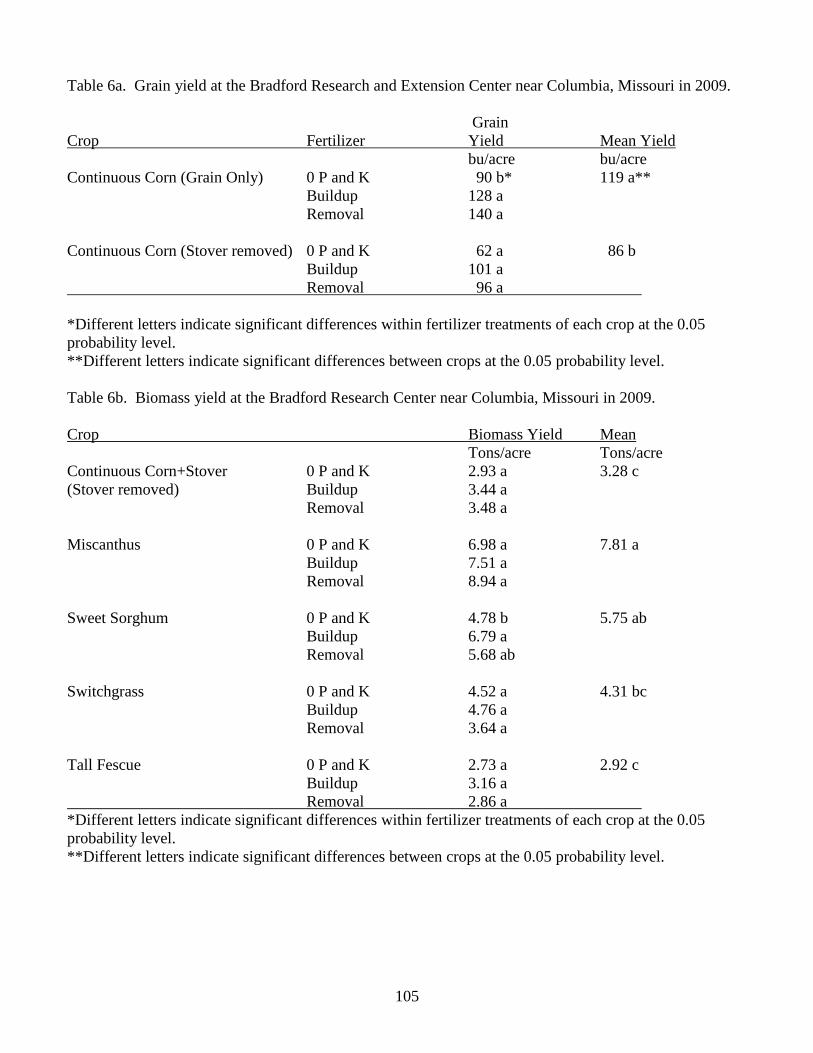
105
Table 6a. Grain yield at the Bradford Research and Extension Center near Columbia, Missouri in 2009.
Grain
Crop Fertilizer Yield Mean Yield
bu/acre bu/acre
Continuous Corn (Grain Only) 0 P and K 90 b* 119 a**
Buildup 128 a
Removal 140 a
Continuous Corn (Stover removed) 0 P and K 62 a 86 b
Buildup 101 a
Removal 96 a
*Different letters indicate significant differences within fertilizer treatments of each crop at the 0.05
probability level.
**Different letters indicate significant differences between crops at the 0.05 probability level.
Table 6b. Biomass yield at the Bradford Research Center near Columbia, Missouri in 2009.
Crop Biomass Yield Mean
Tons/acre Tons/acre
Continuous Corn+Stover 0 P and K 2.93 a 3.28 c
(Stover removed) Buildup 3.44 a
Removal 3.48 a
Miscanthus 0 P and K 6.98 a 7.81 a
Buildup 7.51 a
Removal 8.94 a
Sweet Sorghum 0 P and K 4.78 b 5.75 ab
Buildup 6.79 a
Removal 5.68 ab
Switchgrass 0 P and K 4.52 a 4.31 bc
Buildup 4.76 a
Removal 3.64 a
Tall Fescue 0 P and K 2.73 a 2.92 c
Buildup 3.16 a
Removal 2.86 a
*Different letters indicate significant differences within fertilizer treatments of each crop at the 0.05
probability level.
**Different letters indicate significant differences between crops at the 0.05 probability level.

106
Updating University of Missouri Soil Test Recommendations
John A. Lory
Principal Investigator: John A. Lory
The objectives of this project are to:
o Update and revise University of Missouri Soil Test Recommendations and the supporting publication
―Soil Test Interpretations and Recommendations Handbook.‖
This project supports a 0.5 FTE position for two years to provide support to faculty developing proposals
for changes to MY soil test and fertilizer recommendations. The proposal stated the work of the research
specialist will include performing literature reviews, summarizing data from completed experiments and
editing proposals. The funds were not to be used to undertake new lab or field research.
Ten-Month Accomplishments
Vicki Hubbard was identified as the research specialist to work on the project and started working on the
project in March 2009. She has spent 45% of her time working on the project from March through
December 2009. Funds spent to date supported 35% of her anticipated effort for the two-year project.
During this period her primary contribution has been to complete extensive literature reviews needed as
part of updating the phosphorus and potassium soil test recommendations. These include:
The effect of applied phosphorus on soil test phosphorus and soil phosphorus saturation.
The effect of applied potassium on soil test potassium.
The relationship of soil test phosphorus on phosphorus concentration in runoff.
The nutrient content of wheat grain, rye grain, rice, rice stover, cotton and sugar beets.
She also summarized data and helped develop proposals. These included:
Spatial analysis of subsoil potassium levels in Missouri.
Contributed to the development of the proposal by Peter Scharf for lower critical soil test levels in
fields managed with site-specific management.
Progress towards updated MU soil test and fertilizer recommendations
The following steps have been completed toward updating MU recommendations:
Proposed update to the lime recommendations chapter. The chapter does not change the basic
approach used for determining lime recommendations but does implement a new rating system that
uses that identifies the desired soil pH as the ―optimum‖ soil test level. The text was extensively
modified to improve readability and clarity.
Proposed update to the magnesium recommendations chapter. The proposed chapter does not change
how magnesium ratings are calculated but does change how they are interpreted. Magnesium soil
tests will be rated ―low‖, ―optimum‖ or ―high‖. Also, application of magnesium will only be
recommended through the application of dolomitic limestone. The text was extensively modified to
improve readability and clarity.
Approved change to ratings categories for soil test results. The new rating system will classify soil
test results for phosphorus, potassium and pH as ―very low‖, ―low‖, ―optimum‖, ―high‖ and ―very
high‖.
107
Progress on developing nutrient removal values for row and harvested forage crops that are supported
by references. A draft MU guide has been developed on this topic to meet the needs of the Missouri
Nutrient Management Technical Standard for Concentrated Animal Feeding Operations.
Initial work on an extensive revision of forage fertilizer recommendation system. An initial step was
to develop a proposal to expand the list of forages by separating warm season grasses into multiple
categories. The new categories reflect differences among warm-season grasses in responsiveness to
fertilizer.
Proposal submitted to the Soil Fertility Working Group for approval by Peter Scharf to lower the
critical values for phosphorus and potassium for fields using site-specific management. The proposal
is currently under consideration.
Soon after this project was initiated in March John Lory, the P.I., had an unanticipated family situation
that significantly reduced the time he could commit to this and other projects in 2009. This did not affect
the amount of work Vicki Hubbard could complete collecting information to support proposed changes
although it is why she applied 45% instead of 50% of her time to the project over the first 10 months of
the project. It did result in less progress in developing proposals for changes and coordinating their
review in 2009 than was initially anticipated. This will not be an issue in the ~14 months of funding
remaining on this project.
Year-Two (plus) Objectives
1. Approve new lime and magnesium recommendations chapter for the MU Soil Test Interpretations and
Recommendations Handbook.
2. Approve changes to the equation used to calculate soil test build rates for phosphorus and potassium.
3. Approve changes to the critical values used for phosphorus and potassium for row and forage crops.
This may include different critical values for fields managed using site-specific management. This
will include critical values for the new warm-season grass forage categories.
4. Develop and approve proposal for update to row crop nitrogen recommendations.
5. Develop and approve proposal for update to forage nitrogen recommendations.
6. Complete update of MU Soil Test Interpretations and Recommendations Handbook based on
approved changes.
7. Develop a list of priority research projects for further improvements to MU soil test and fertilizer
recommendations.
This will complete an overhaul of the MU soil test and fertilizer recommendations. Upon completion of
the project arrangements will need to be made to implement the approved changes in the software used by
the Missouri Soil Testing Laboratory to generate soil test reports from the lab on their web page.
Proposed Budget
Salaries: $24,838
Benefits: $7,103
Total: $31,821
This budget reflects the approximate remaining funds for the project as of January 1, 2010. It will provide
funding for ~0.5 FTE of Vicki Hubbard‘s salary for a period of ~14 months completing the two-year
project. This budget is consistent with the initial budget and the start date of March 1, 2009 for this
project.
108
How Does Kip Grow 150+ bu/acre Soybeans? Is K+ a Key?
2009: Second Year Report
Tim Reinbott, Felix Fritschi, and Dale Blevins
Tim Reinbott, Felix Fritschi, Dale Blevins, Univ. of Missouri-Columbia
Objective:
The overall objective of this proposal is to evaluate the importance of key management practices
employed by Kip Cullers in achieving record soybean yields. Specific objectives include (i) comparisons
between the application of N, P, and K nutrients as mineral fertilizer and as poultry litter; (ii)
quantification of foliar K application on yield and leaf K concentrations; (iii) determine the effect of foliar
micronutrient application on yield; and (iv) evaluate the effects of intensive and moderate irrigation
frequency.
Procedures:
The study was conducted in the same field on the same plots with the same treatments used last year at the
Bradford Research and Extension Center near Columbia, MO. Control fertilization treatments were based
on soil test results and yield goal according to Univ. of Missouri recommendations. Prior to planting,
poultry litter and mineral fertilizer were applied at two rates: a high rate based on 9 tons/A of poultry litter
(2.0-1.4-1.6) and a low rate based on yield goal based fertilization. Final application of the high rate of
poultry litter and mineral fertilizer was 360-252-288 and the low rate was 36-25-29. Poultry litter and
mineral fertilizer were incorporated into the top soil by a single pass with a disc and soybeans (cv. Pioneer
94Y01) were planted in 15‖ rows at 200,000 seeds/acre. Drip irrigation was installed for the high-
frequency irrigation treatments and deployed as needed over the course of the growing season.
Applications of foliar K were conducted as splits of 9 lbs/A. The application of supplemental soil applied
K (36 lbs/A; equivalent to the sum of the eight foliar applications of K) was conducted on the same day as
the second foliar K application. Data collection conducted over the course of the season included root
sampling for analyses of nodulation, biomass samples, leaf-let samples, samples for plant mapping, and
seed harvest.
End-of-season rains in this wet growing season caused the mid-November (late) harvest. The third poultry
litter application will be made in December at the same high rate of 9 tons/A, and low rate based on yield
goal. The entire field will then be disked.
2009 Project Timeline
Poultry Litter Spread 11/25/2008
Soil Sample Collection 11/25/2008
Mineral Fertilizer Application 5/20-21/2009
Planting Date 5/22
Irrigation Initiated 5/22
Foliar Applications of NaNO3 & KNO3
(8 total)
8/5,14,24,30 &
9/14,21
Soil Applied KCl 8/14
Data Collection
Nodule Collection 8/17-20
R5 Biomass Collection 9/25
Plant Fractionation Collection 10/14
Harvest 11/8-11

109
2009 Results
Treatment Legend
Irrigation Additional water on timed intervals
No Irrigation No additional Water
Poultry High 9 tons/A
Inorganic High Nutrient match to the ―poultry high‖ rate
Poultry Low Based on nutrient recommendation for 70 bu/A yield goal
Inorganic Low Based on nutrient recommendation for 70 bu/A yield goal
KNO3 Foliar applied 36 lbs/A K+
NaNO3 Foliar applied NO3 match to KNO3 application
KCl Soil applied 36 lbs/A K+
Control No additional foliar or soil applications
Figure 1. Soybean root
nodule count results
produced by irrigation or no
irrigation; poultry litter or
equivalent fertilizer.

110
Despite the rainy growing season, irrigation treatments had a positive effect on nodulation characteristics
in both years (Figs. 1 &2). Note that the trends are similar for the two years (Figs. 1 & 2). These results
appear to be consistent with those that we observed n Kip Cullers soybean fields, where he applies small
quantities of irrigation water daily. This may one of his most important techniques.
Yields were about 15 bu/acre higher in 2009 than in 2008, in general (Fig. 3). The three highest yielding
treatments were low fertility treatments: the yield goal-based irrigation poultry litter treatment and both
inorganic fertilization treatments. We currently have no explanation for why these treatments produced
the highest yields.
Figure 2. Soybean root
nodule weight results
produced by irrigation or no
irrigation; poultry litter or
equivalent fertilizer.
Figure 3. Soybean yield
results following fertility
strategies, with and without
irrigation.
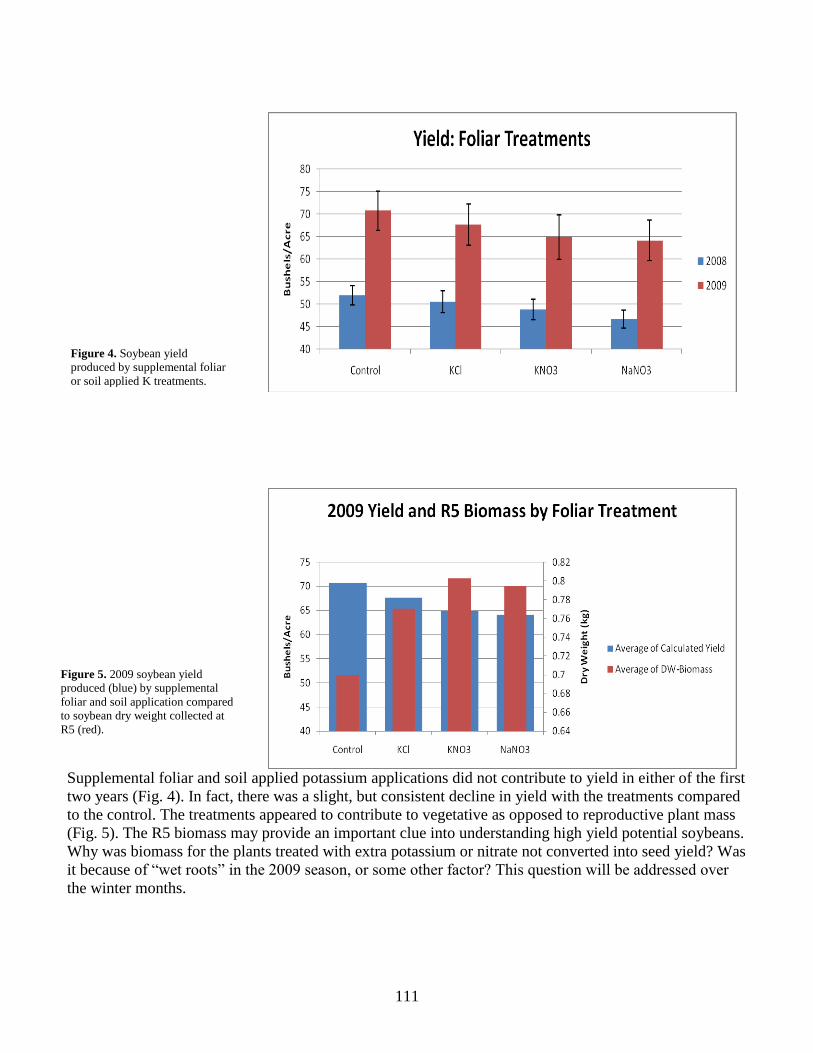
111
Supplemental foliar and soil applied potassium applications did not contribute to yield in either of the first
two years (Fig. 4). In fact, there was a slight, but consistent decline in yield with the treatments compared
to the control. The treatments appeared to contribute to vegetative as opposed to reproductive plant mass
(Fig. 5). The R5 biomass may provide an important clue into understanding high yield potential soybeans.
Why was biomass for the plants treated with extra potassium or nitrate not converted into seed yield? Was
it because of ―wet roots‖ in the 2009 season, or some other factor? This question will be addressed over
the winter months.
Figure 5. 2009 soybean yield
produced (blue) by supplemental
foliar and soil application compared
to soybean dry weight collected at
R5 (red).
Figure 4. Soybean yield
produced by supplemental foliar
or soil applied K treatments.
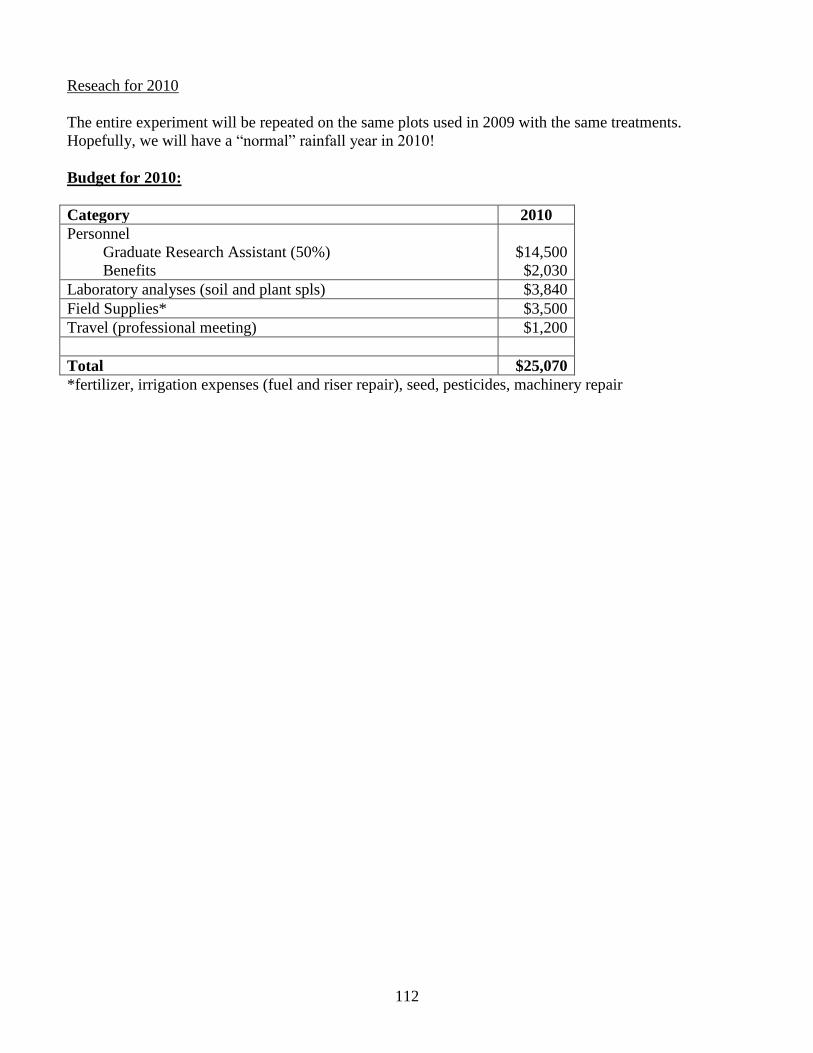
112
Reseach for 2010
The entire experiment will be repeated on the same plots used in 2009 with the same treatments.
Hopefully, we will have a ―normal‖ rainfall year in 2010!
Budget for 2010:
Category 2010
Personnel
Graduate Research Assistant (50%)
Benefits
$14,500
$2,030
Laboratory analyses (soil and plant spls) $3,840
Field Supplies* $3,500
Travel (professional meeting) $1,200
Total $25,070
*fertilizer, irrigation expenses (fuel and riser repair), seed, pesticides, machinery repair
Fertilizer/Ag Lime Control Service Non-Profit
University of Missouri-Columbia U.S. Postage
Columbia, MO 65211-8080 PAID
University of Missouri
Address Service Requested
Also Available on the Web at:
http://aes.missouri.edu/pfcs/research
Related Documents