Mississippi and Transportation Mississippi's infrastructure supports businesses by supporting transportation: Within the State Into the State From the State Through the State

Mississippi and Transportation
Dec 31, 2015
Mississippi and Transportation. Mississippi's infrastructure supports businesses by supporting transportation: Within the State Into the State From the State Through the State. Total Freight Transportation in Mississippi - 2008. Tons (in millions). Dollars (in millions). - PowerPoint PPT Presentation
Welcome message from author
This document is posted to help you gain knowledge. Please leave a comment to let me know what you think about it! Share it to your friends and learn new things together.
Transcript

Mississippi and TransportationMississippi's infrastructure supports
businesses by supporting transportation:Within the StateInto the StateFrom the StateThrough the State

Tons (in millions) Dollars (in millions)
17535%
21943%
11222%
Within State From State Into State
41,78745%
45,80949%
5,7686%
Within State From State Into State
Source: Freight Analysis Framework, FWHA
Total Freight Transportation in Mississippi - 2008

Source: Freight Analysis Framework, FWHA
17535%
21943%
11222%
Within State From State Into State
Total Freight Transportation in Mississippi (in Millions of Tons)

41,78745%
45,80949%
5,7686%
Within State From State Into State
Total Freight Transportation in Mississippi (in Millions of Dollars)
Source: Freight Analysis Framework, FWHA

Tons (in millions) Dollars (in millions)
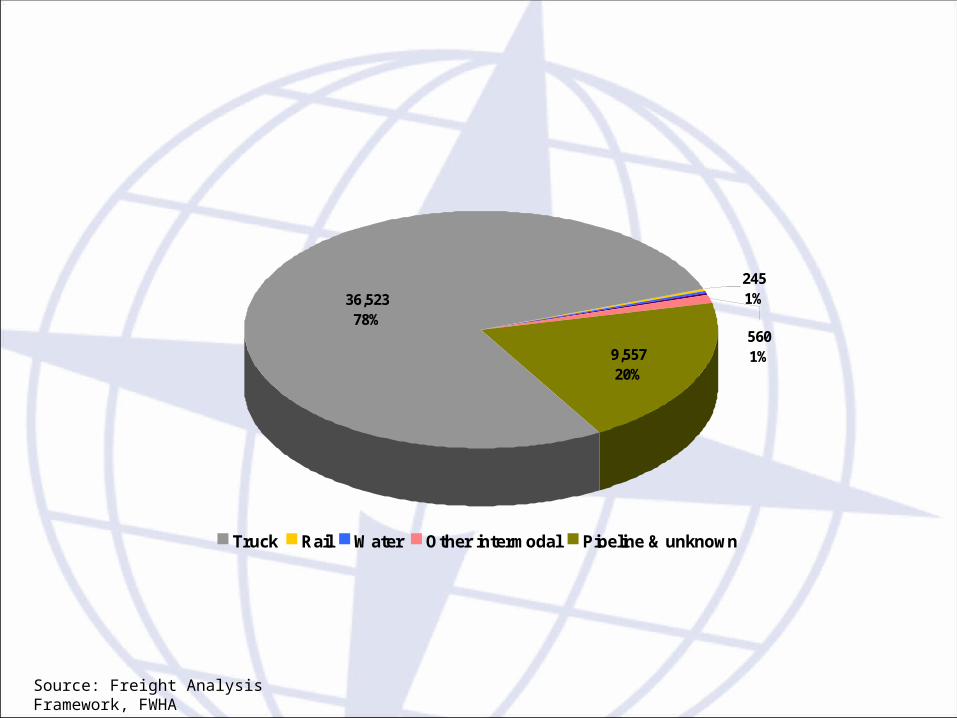
2451%
5601%9,557
20%
36,52378%
Truck RailWater Other intermodalPipeline & unknown
11%
11%
8172%
2926%
Truck Rail Water Pipeline & unknown
Source: Freight Analysis Framework, FWHA
Total Freight Transportation within Mississippi by Mode-2008

11%
11%
8172%
2926%
Truck Rail Water Pipeline & unknown
2008 Modal Flows within Mississippi (in Millions of Tons)
Source: Freight Analysis Framework, FWHA
2451%
5601%9,557
20%
36,52378%
Truck Rail Water Other intermodal Pipeline & unknown
2008 Modal Flows within Mississippi (in Millions of Dollars)
Source: Freight Analysis Framework, FWHA

Tons (in millions) Dollars (in millions)
85%
74%
5129%
10762%
Truck RailWater Truck and railPipeline & unknown
89,77964% 1,418
1%
44,81932%
4,0933%
Truck RailWater Other intermodalPipeline & unknown
Total Freight Transportation from Mississippi by Mode-2008

85%
74%
5129%
10762%
Truck Rail Water Truck and rail Pipeline & unknown
2008 Modal Flows from Mississippi (in Millions of Tons)
Source: Freight Analysis Framework, FWHA

89,77964% 1,418
1%
44,81932%
4,0933%
Truck Rail Water Other intermodal Pipeline & unknown
2008 Modal Flows from Mississippi (in Millions of Dollars)
Source: Freight Analysis Framework, FWHA

Tons (in millions) Dollars (in millions)
5023%
14968%
168%
Truck RailWater Other intermodalPipeline & unknown
4,5114%
4,9914% 61,210
49%
53,62943%
Truck RailWater Other intermodalPipeline & unknown
Source: Freight Analysis Framework, FWHA
Total Freight Transportation into Mississippi by Mode-2008

5023%
14968%
168%
Truck Rail Water Other intermodal Pipeline & unknown
2008 Modal Flows into Mississippi (in Millions of Tons)
Source: Freight Analysis Framework, FWHA

4,5114%
4,9914% 61,210
49%
53,62943%
Truck Rail Water Other intermodal Pipeline & unknown
2008 Modal Flows into Mississippi (in Millions of Dollars)
Source: Freight Analysis Framework, FWHA

Tons (in millions) Dollars (in millions)
10 2%
88 17%
59 12%
39 8%
202 40%
108 21%
Louisiana Alabama TennesseeArkansas Middle East Other
16,056 5%
21,382 7%
42,468 14%
43,428 14%
47,972 15%
142,206 45%
Louisiana Tennessee AlabamaArkansas Texas Other
Source: Freight Analysis Framework, FWHA
2008 Mississippi Trade Partners

10 2%
88 17%
59 12%
39 8%
202 40%
108 21%
Louisiana Alabama Tennessee Arkansas Middle East Other
Mississippi Trade Partners (in Millions of Tons)
Source: Freight Analysis Framework, FWHA

16,056 5%
21,382 7%
42,468 14%
43,428 14%
47,972 15%
142,206 45%
Louisiana Tennessee Alabama Arkansas Texas Other
Mississippi Trade Partners (in Millions of Dollars)
Source: Freight Analysis Framework, FWHA

Tons (in millions) Dollars (in millions)
1422%
1929%
914%
1015%
1220%
Logs Crude petroleumGasoline Nat. gas & other petro. prods.Cereal grains
3,65719%
3,08616%
2,37612%
4,36723%
5,76830%
Mixed freight MachineryGasoline Nat. gas & other petro. prods.Electronics
Source: Freight Analysis Framework, FWHA
2008 Top Commodities within Mississippi

1422%
1929%
914%
1015%
1220%
Logs Crude petroleumGasoline Nat. gas & other petro. prods.Cereal grains
2008 Top Commodities within Mississippi (in Millions of Tons)
Source: Freight Analysis Framework, FWHA

3,65719%
3,08616%
2,37612%
4,36723%
5,76830%
Mixed freight MachineryGasoline Nat. gas & other petro. prods.Electronics
2008 Top Commodities within Mississippi (in Millions of Dollars)
Source: Freight Analysis Framework, FWHA

Tons (in millions) Dollars (in millions)
10,17112%
9,28011%
9,05910%
16,67919%
41,78748%
Nat. gas & other petro. prods. Textiles/leatherMixed freight ElectronicsMachinery
65%
53%
53%
86%
10883%
Nat. gas & other petro. prods. Wood prods.Gasoline Other ag prods.Basic chemicals
Source: Freight Analysis Framework, FWHA
2008 Top Commodities from Mississippi

65%
53%
53%
86%
10883%
Nat. gas & other petro. prods. Wood prods.Gasoline Other ag prods.Basic chemicals
2008 Top Commodities from Mississippi (in Millions of Tons)
Source: Freight Analysis Framework, FWHA

10,17112%
9,28011%
9,05910%
16,67919%
41,78748%
Nat. gas & other petro. prods. Textiles/leatherMixed freight ElectronicsMachinery
2008 Top Commodities from Mississippi (in Millions of Dollars)
Source: Freight Analysis Framework, FWHA

Tons (in millions) Dollars (in millions)
2113%
85%
85%
53%
12374%
Nat. gas & other petro. prods. Crude petroleumCoal GasolineGravel
9,25013%
6,4529%
6,3639%
5,6628%
45,80961%
Nat. gas & other petro. prods. MachineryMotorized vehicles Mixed freightTextiles/leather
2008 Top Commodities into Mississippi

2113%
85%
85%
53%
12374%
Nat. gas & other petro. prods. Crude petroleumCoal GasolineGravel
2008 Top Commodities into Mississippi (in Millions of Tons)
Source: Freight Analysis Framework, FWHA

9,25013%
6,4529%
6,3639%
5,6628%
45,80961%
Nat. gas & other petro. prods. MachineryMotorized vehicles Mixed freightTextiles/leather
2008 Top Commodities into Mississippi (in Millions of Dollars)
Source: Freight Analysis Framework, FWHA

Source: Freight Analysis Framework, FWHA
Mississippi - Transportation Forecast by Mode (2008 - 2035)Shipments by Weight (Tons)
0
50
100
150
200
250
300
350
400
450
2008 2035 2008 2035 2008 2035
(In Millions)
Truck Rail WaterAir, air and truck Truck and rail Other intermodalPipeline and unknown
Within State From State To State

Source: Freight Analysis Framework, FWHA
Mississippi - Transportation Forecast by Mode (2008 - 2035)Shipments by Value
$0
$50,000
$100,000
$150,000
$200,000
$250,000
$300,000
2008 2035 2008 2035 2008 2035
($ Millions)
Truck Rail WaterAir, air and truck Truck and rail Other intermodalPipeline and unknown
Within State From State To State
Related Documents