1 Mission Control Objectives To Support the Watlow teams (Value Streams & Functions) in achieving their strategic intent. To provide clear strategic direction and alignment throughout Watlow To provide clear strategic direction and alignment throughout Watlow To assure the achievement of the company's long term strategy. To support executive level governance and internal process controls. To guide the on going application of the Watlow Way for strategic change h e a t e r s | s e n s o r s | c o n t r o l l e r s To guide the on‐going application of the Watlow Way for strategic change. To disseminate related institutional learning throughout Watlow. To take timely action to resolve systemic issues & problems that impede the company's teams. Definitions • True North St t D l t SD P – People : Engaged, Enabled and Purposeful Q – Quality: Defect Free D – Delivery: On Demand C – Cost: Waste Free G – Growth: Best Value to the Customer • Strategy Deployment – SD – Converting strategy to action and flowing it down into the organization – Business strategy and lean transformation are linked through STRATEGY DEPLOYMENT • Box Score – Holistic Method of keeping score – PQDC (True North); Capacity; Financials • Bowling Chart % of Time Spent Executive VSL PTL Floor Strategy Deployment Breakthrough (Kaizen) Daily Improvement True North Strategic Change SD h e a t e r s | s e n s o r s | c o n t r o l l e r s Bowling Chart – Quick view of progress toward strategy deployment goals • TPOC – Process used to manage our transformation and insure that we are executing our “transformation the right way” • Recipe Card – Standardized work

Welcome message from author
This document is posted to help you gain knowledge. Please leave a comment to let me know what you think about it! Share it to your friends and learn new things together.
Transcript
1
Mission Control Objectives
To Support the Watlow teams (Value Streams & Functions) in achieving their strategic intent.
To provide clear strategic direction and alignment throughout WatlowTo provide clear strategic direction and alignment throughout Watlow
To assure the achievement of the company's long term strategy.
To support executive level governance and internal process controls.
To guide the on going application of the WatlowWay for strategic change
h e a t e r s | s e n s o r s | c o n t r o l l e r s
To guide the on‐going application of the Watlow Way for strategic change.
To disseminate related institutional learning throughout Watlow.
To take timely action to resolve systemic issues & problems that impede the company's teams.
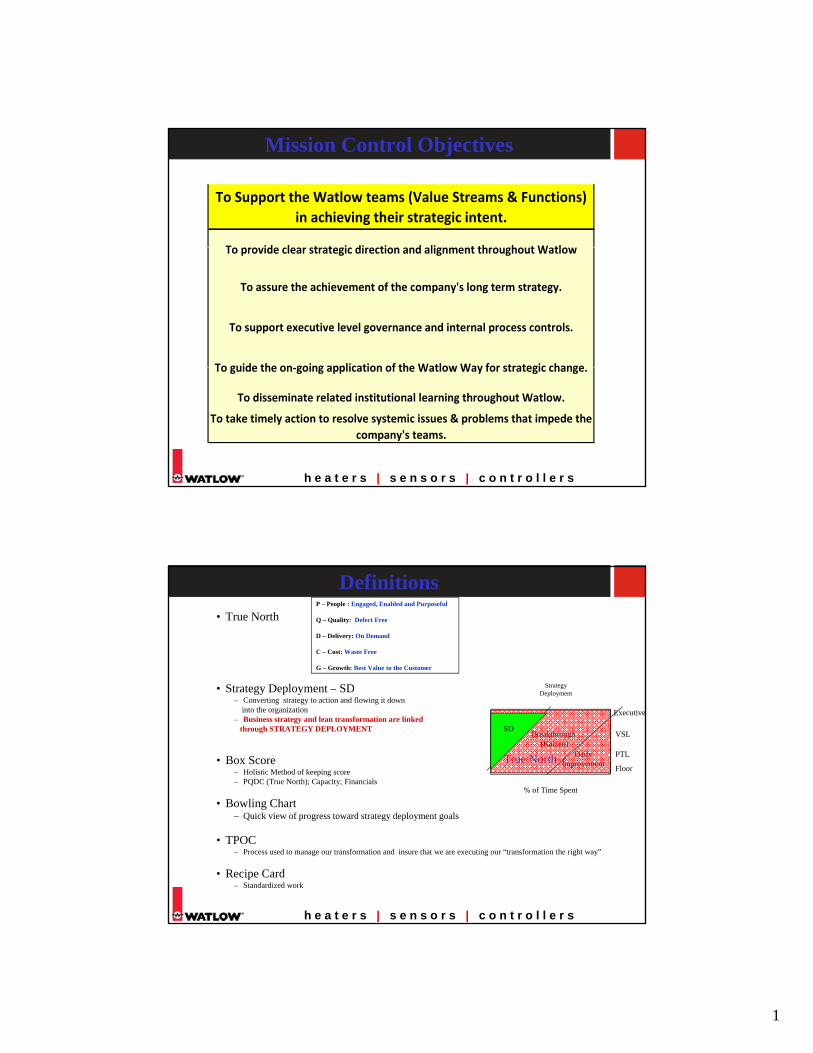
Definitions• True North
St t D l t SD
P – People : Engaged, Enabled and Purposeful
Q – Quality: Defect Free
D – Delivery: On Demand
C – Cost: Waste Free
G – Growth: Best Value to the Customer
Strategy• Strategy Deployment – SD– Converting strategy to action and flowing it down
into the organization– Business strategy and lean transformation are linked
through STRATEGY DEPLOYMENT
• Box Score – Holistic Method of keeping score– PQDC (True North); Capacity; Financials
• Bowling Chart% of Time Spent
Executive
VSL
PTL
Floor
StrategyDeployment
Breakthrough (Kaizen)
DailyImprovementTrue North
StrategicChangeSD
h e a t e r s | s e n s o r s | c o n t r o l l e r s
Bowling Chart– Quick view of progress toward strategy deployment goals
• TPOC– Process used to manage our transformation and insure that we are executing our “transformation the right way”
• Recipe Card– Standardized work
2
Lean As A System
h e a t e r s | s e n s o r s | c o n t r o l l e r s
Mission Control Philosophy
ListeningPost
Plan Do Check Act
Enterprise Mission Control Visual Board
1 2 543
Enterprise Mission Control Visual Board
PLAN Section Philosophy:Defines a standard process for running regular review of Enterprise progressDrives effective alignment of focus (vital few) across the enterprise by clarifying Enterprise direction.Integrates action for Spaces,
DO Section Philosophy:Provides a convenient location to find and review current information and progress toward completion of any mission level project.Primary focus of the “DO” section is not to manage the project but to;
Check Key Points/Philosophy• Confirm adherence to True North and Enterprise strategy• Check True North metrics, sales, Operations and financial results Across LOB’s and Enterprise•Validate and confirm systemicand Enterprise level issueshindering LOB performance
ACT Key Points/Philosophy:Address systemic, big and external issuesAddress ENTERPRISE processes and policiesManage strategy and
t k
h e a t e r s | s e n s o r s | c o n t r o l l e r s
g p ,Lines of Business, and Functions in a consistent direction. Makes linkages visual.Provides an “At-a-Glance” picture of the Enterprise Strategic PlansEmbodies a PDCA cycle for breakthrough, kaizen & daily improvements
project but to;Communicate what we are learning that can benefit many across the enterprise.Highlight situations where support, resources are neededProvides a visual “At-a-Glance” picture of current status of the A3.
hindering LOB performance• Check Lean KPI’s – are wemeeting expectations
emergent work as new information becomes availableCapture and reflect ENTERPRISE learning’s
3
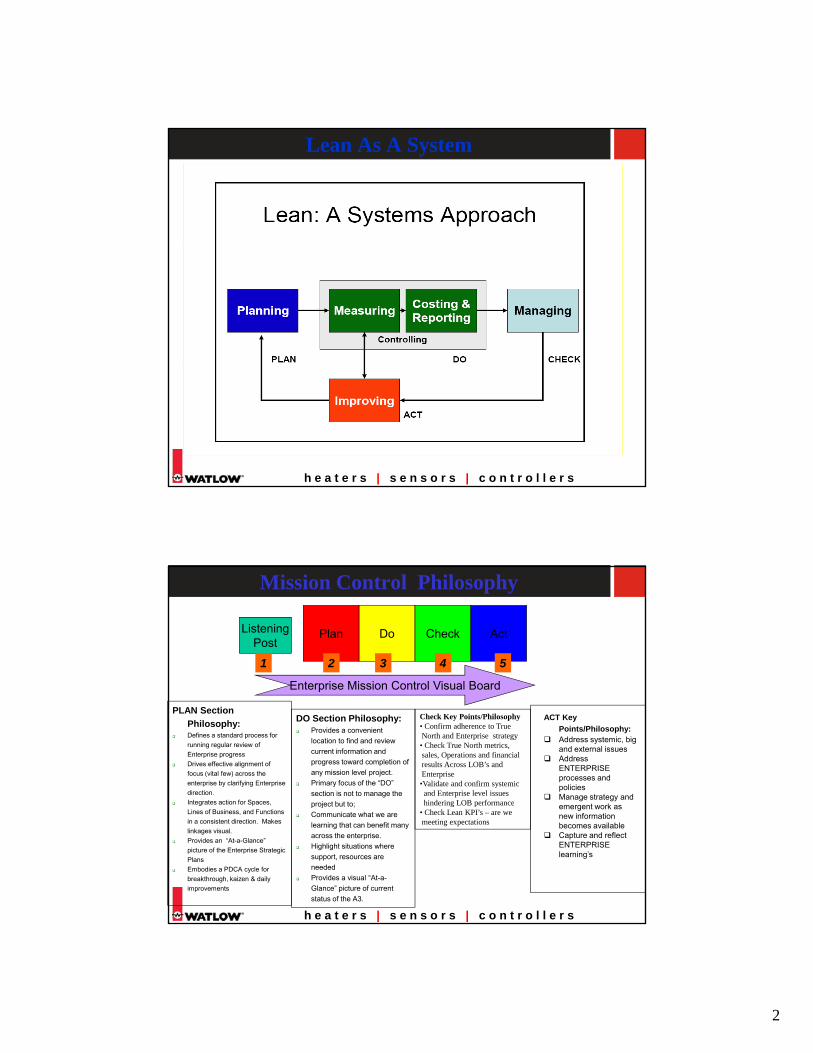
Listening Post
Internal IssuesFunnel Trends
External Issues Human Capital Issues
Market UpdatesLegal/Legislative Issues
h e a t e r s | s e n s o r s | c o n t r o l l e r s
Economic Trends
Competitive Updates
Market Updates
Customer Updates
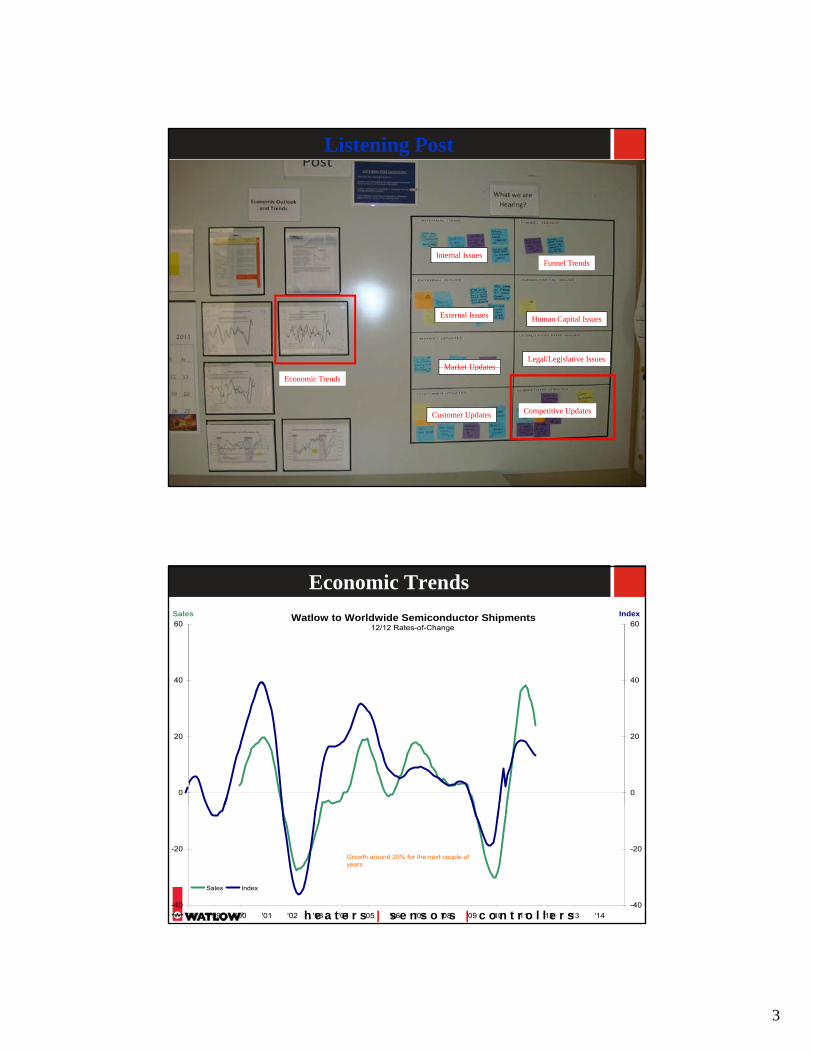
Economic Trends
12/12 Rates-of-Change
40
60Sales
40
60IndexWatlow to Worldwide Semiconductor Shipments
0
20
0
20
h e a t e r s | s e n s o r s | c o n t r o l l e r s-40
-20
'98 '99 '00 '01 '02 '03 '04 '05 '06 '07 '08 '09 '10 '11 '12 '13 '14-40
-20
Sales Index
Growth around 20% for the next couple of years.
4
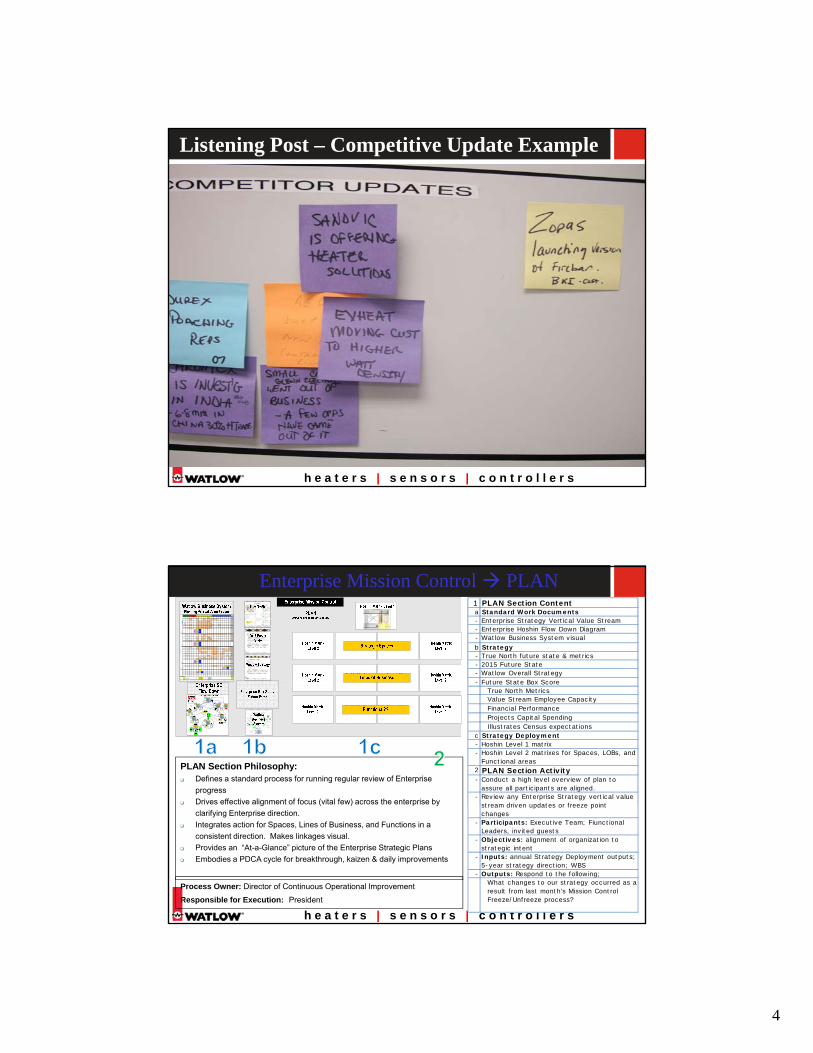
Listening Post – Competitive Update Example
h e a t e r s | s e n s o r s | c o n t r o l l e r s
T ask Numb er Co mpl ete Date Owne r CE O (re prese nts the B OD) P res id en t GM & S p ace L ea ders De man d Creation
S ale sDem and Cre ation
Marke tin gDema nd Crea tio n
T ech no log yGlob al Op era tio ns
Con tro l le r
CFO (repre sen ts Fin anc e, COI , T ax , Leg al , T rea sure r)
HR (re pre sen ts HS &E) Qu al i ty & S C IT Con su ltan t Di recto r o f COI MARCOM Va lu e S tre am
Le ade rsBus in es s Un i t
Co ntro llers P rod uc t Ma nag ers S ta nda rdi zed W ork
1-1 E ls alaym eh E nte rprise P ortfol io As ses sme nt
Deve lo p En te rpris e S pa ce Mod el
1-2 P hi l l ip sE nterp rise S tra tegy
Refle ction a nd Refresh
S trate gy Depl oym ent X-Ma tri x - L ef t si de &
B reak th roug h Goal s. P P T St rateg y
El eme nts Su mmary S li de
1-3 E ls alaym ehEn terp ris e Bo xs co re
F ina ncials Reflec tio n an d Refresh
B oxs core; De vel op p ro ces s fo r
T rue North Dia lo gue
1-4 S . De slog eE n te rprise Bo xsc ore Tru e North Reflec tio n
a nd Re fre shB ox score
1-5 S . De slog eW atlow Wa y
Reflection and Refres h
Wa tl ow Way A 3 Inco rp orate W at lo w B usi ne ss Sy stem
1-6 S . De slog eE n te rprise W atch
Me trics Ev alua te a nd Refres h
S trate gy Depl oym ent X-Ma tri x
Aug us t 17 L aMa ntia E n te rprise S trateg y De vleop me nt Re view
De vel op p ro ces s fo r tas k
P hase 1 Freeze Point
In pu t: W atlo w Way , E n te rprise Bo x Sc ore , S p ace L ea rning , P o rtfo lio Ass ess men t
Loc k: Lev el 1 (5 ) y ea r s trate gie s; True North Metric s &
Targe ts; Ente rpris e Boxs core ;
(5) ye ar s trae gic s: UnLoc k:Dra ma tic new lea rnings or ev ents that ha s s igifica nt
impa ct to W atlow's EVA fore ca st
Out put: Left Side of X-Box ; Ente rprise Box s core ; Strategic Targets 5 ye ar goals; Mis sion A3; True North; Learnings (W ha t we lea rned? W hat do we need to lea rn?)
2-1 Las t W eek of Februa ry & August Phillips
Ente rprise VSA
V S A Rece ip e Ca rd Dev elo p Rece ip e Ca rd
fo r E VS A
2-2 (2 ) wee ks a fte r comple tion of EVSA Phillips A3 Completion
A3 Re cei pe Card . De fi ne Mi ss ion A3 (pe opl e, purpo se,
proc ess )
2-3 (1) week after A3 c ompletion Els alaym eh
Boxsc ore Financial Flow Down for LOB's
and Spa ces
De vel op p ro ces s fo r tas k
2-4 (1) week after A3 c ompletion S. De sloge
Boxsc ore True North Flow Down for LOB's
and Spac esDe vel op p ro ces s fo r
tas k
Se pte mbe r 1 7 LaMa ntiaLev el 1 Strategy
Deploym ent, A3 's , Boxsc ore Flow Re view
De vel op p ro ces s fo r tas k
P hase 2 Freeze Point
Input: Strategy Re fre sh, Space Lea de rs: Approved Space Plan to W in; Ke y proces s nee ds .
Lock : (1 ) Ye ar Box sc ore , Ta rget (5)
y ea r Box sc ore Un-Loc k: Catc hba ll
Proc es s
Out put: 6-12 month Strategic A3's; Metrics ; Spa ce a nd LOB Boundries; Le arnings ; Com pleted Le vel 1 X-Box ; Complete d Ente rprise Box Score Flow-down: Fina nc ia l Vision & Minimums; True North
3-1 (3) wee ks after Se pte mbe r 1 7 Schloe mann Sp ace Pl ans (Pl an-
to _Win )
Deve lop catchb al l proc ess .
De vel op Res ource Li nka ge Map fo r
S pa ce, LOB , Reg ion
3-2 Phillips Stra tegic Ma rketing Pla n Refresh
3-3 (2) week s after Ta sk 3 -1 Schloe mann LO B P lan s (P roduc t Pl an- to-Win )
De vel op L OB Pl an Conten t (e.g. Mktg vs
LCM P lan v s Fo otprin t. Upd ate P ro duc t P la n
Co ntent (e.g. P rod uct , Tec hno lo gy and L CM
3-4 (1) week a fte r Tas k 3 -3 Merrym an Regiona l Pla ns Deve lop : DC P l an Fo rma t
3-5 (1) week a fte r Tas k 3 -4 Smith Func tional Pla n De vel op : F unc ti on al P lan F orma t
3-6 (1) week a fte r Tas k 3 -5 Els alaym eh Forec ast , F inancial, Capita l Roll-up
De vel op: Integra te Bo xsco re, Ca pita l &
V SM
3-7 (1) week before Nove mber 1 Phillips Collection of
Portfolio Conflic ts , Gaps or Jump Balls
Deve lop : P roce ss
3-8 Nove mber 1 LaMa ntia Dema nd Crea tion, LOB, & Spa ce Pla n Catch Ba ll
Eve nt
P hase 3 Freeze Point
Input: Unre solv ed Portfolio J ump Ba lls , Product Plans, Lev el 2 Strategy Deployme nt X-M atrix , Portfolio Pla n, All Output Pla ns , Fina ncia l Roll-ups
Lock: Le ve l 2 SD & Exe cutiona l Pla ns UnLoc k: Catchball Proces s
Out put: Lev el II Box sc ore, Le vel II SD, Miss ion A3's, Re gional D.C. Pla ns, Resourc e Plan, Approve d Product Plan, Func tiona l Pla ns , Capita l Pla n,
Dec ember 17 Va lue Stre am Le ader Va lue Stre am Pla n Rev ie w
P hase 4 Freeze Point
Loc k: Lev el 3 SD & Exec utional Plans
Un-Loc k: Ca tchball Proce ss
Out put: Le vel III Boxsc ore , Le ve l III SD, Miss ion A3's, Res ource Plan, Capita l Plan
Monthly Miss ion Control Chec k & Act Review
De ve lop, Deploy , De liv e r the
Strate gy
Completion Da te: Completion of
Cy cle; Boxs core at ev ery le ve l
SupportCore TeamCus to mers
Boundry Sta tem ent: Sy ste m of Proce s se s to de ve lop, de ploy, and de liv er the
stra tegy - s equence and tim ing.
Purpos e of Re vie w: Alignm ent and Link age to Strate gy , Ris k Ma na gem ent,
Le arnings , Ne ed to Le arn, Enter pris e Portfolio Impac t, Ca pac ity & Contstra ints Ma na gem ent, Re vie w is Form al, Go/No-
Go, Chec k lis t for nex t s tep nee ds
Purpose of Loc k & Un-Loc k: 'G o' and 'Loc k ' a re in ta nde m, 'Un-loc k' sta nds
alone a nd oc curs afte r 'Go & Lock .' Pr ov ide s gov e rna nce a nd direc tion.
Esta blishe s Comm itm ent. Addres s es dra ma tic new le arnings a nd new
e ve nts that impac t Wa tlow's EVA Fore c as t.
Deve
lop
Phas
e
Plan
Pha
se
Do -
Chec
k - A
ct
C
AT
CHB
AL
L
P or tfol io d ecis ion s o cc urri ng i n th is r egi on d uri ng 2 011 Ho sh in D ep loy men t (n ot i dea l)
C :\ D oc ume nt s an d S et tin g s\ rh os te \My D
9
● 6 ● ●● 5 ● ● ●● 4 ● ●● 3 ● ●● 2 ● ●● 1 ● ● ● ● ●
● 1 Es tablish Ins piring Vis ion Sta tem e nt
● 2
● 3 Pe ople : Engage d, Ena ble d, Purpos e ful Surv ey : Incre a se in Surv e y Res ults
● 4 (% Improve me nt TBD)
5 Q ua lity : De fec t Fr ee Cus tom e r Es ca pes : 5 0% Reduction in PPM
6 On De m and
7 Cos t: Was te Fre e Inv entor y: 25 % Re duc tion in Day s Of Supply
8 Pr oductivity : 1 2% Improve me nt in Sa les /FTE
○ 9 G row th: Bes t Value To The Custome r Rev enue: $3 47 Million
sR es erved. The S imp ler Bu sin ess S yste m ® 11. 0
Re dep loy F re ed U p R es ources t o Su ppo rt De lca re d Spa ce and T arget ed C ust ome rs
De fi ne , De pl oy and B asel in e th e W at lo w Org ani zat io n De velo pmen t Sy ste m
Le adtime s: 2 5% Reduction in OED
VP of
Hum
an R
esou
rces
100%
of N
ew P
rodu
cts u
sing
the
Lean
NPD
Wor
kboo
k
Sem
i Lea
der -
Gilm
ore
De live ry:
2011 Level 1 Hoshin Planning
De vel op and I mpl emen t t he Wat l ow Le an N PD Syst em
Est ab li sh MDI (model ) S pac e & St rat egi c Val ue S trea ms T hat fl ow Cus to mer-t o-C ust ome r (produ ct & i nf ormat io n)
De vel op Pro of of Co ncep ts (P OC ) w hi ch al ig n to E nt erpr ise R oa dmap & B reakt hrou gh So lu ti on R even ue goa l
Gro w t o $500 M by ach iev ing #1 o r #2 l ead ershi p posi ti on i n ta rg et ed spa ces
$15 0M re venu e from new break th ro ugh so lut i ons
Cre ate c apac it y to grow b y u sin g Wat lo w Bu sin ess S yste m (W BS ) t o achi eve 1 2% annu al prod uct iv it y i mprove ment
Al l pe opl e achi eve d L evel 4 by bei ng eng age d in t hei r pe rsona l deve lo pment
Imp
rove
Hum
an
De
velo
pme
nt I
ndex
for
all L
eade
rsh
ip a
nd
Tec
hni
cal T
eam
s to
L
evel
2 b
y 2
012
Est
abl
ish
Lean
NPD
ca
pabi
lity
and
reso
urce
s to
ex
ecut
e to
En
terp
rise
Ro
adm
ap
Pos
ition
bus
ines
s to
hit
$3
75M
in 2
012
Inc
rea
se E
nte
rpis
e p
rod
uctiv
ity
from
$13
8K/F
TE
to $
155K
/Equ
ival
ent T
eam
Me
mb
er
Po sit io n Spa ces t o dou ble reve nue b y 2 012
RESOURCES
Proc
ess
Lead
er
Lead
ershi
p Ba
selin
e Es
tablis
hed
For T
he R
emain
der o
f Org
aniza
tion
Lou
Stein
haus
er
Food
Lead
er
VP of
Mar
ketin
g
Stev
e Rh
oads
Dies
el Le
ader
Indir
ect H
eadc
ount
Neu
tral
Tru e No rth Visio n
LOB
GM's
ET P
ilot T
o Mov
e U
p One
Lev
el fro
m B
asel
ine
Prod
uctiv
ity in
creas
e to
$155
K/E
quiv
alent
Tea
m M
embe
r
Com
miss
ioned
proj
ects
& ba
se b
usin
ess
at: S
emi $
40M
to $9
2M,
Dies
el $1
9M to
$33
M, P
roce
ss $2
7M o
$40M
, Foo
d $
30M
to $4
0M
by 20
12
$108
M of
PO
C an
nual
pote
ntial
reve
nue
for 2
013
Tru e North Metr ics
Improv ement I ni ti at i ves
5 year S t ra teg ic I ni t it at ive s
1- year B re akt hroug h
Ob jec ti ves
P rimary S econ dary
Me asures and t arget s
WHAT
How Far
How
How Much & When
Reg istered User:Subst it uted Semi Phr asing of ' what '
R egi stered U ser:Ad ded ' by 2 012'
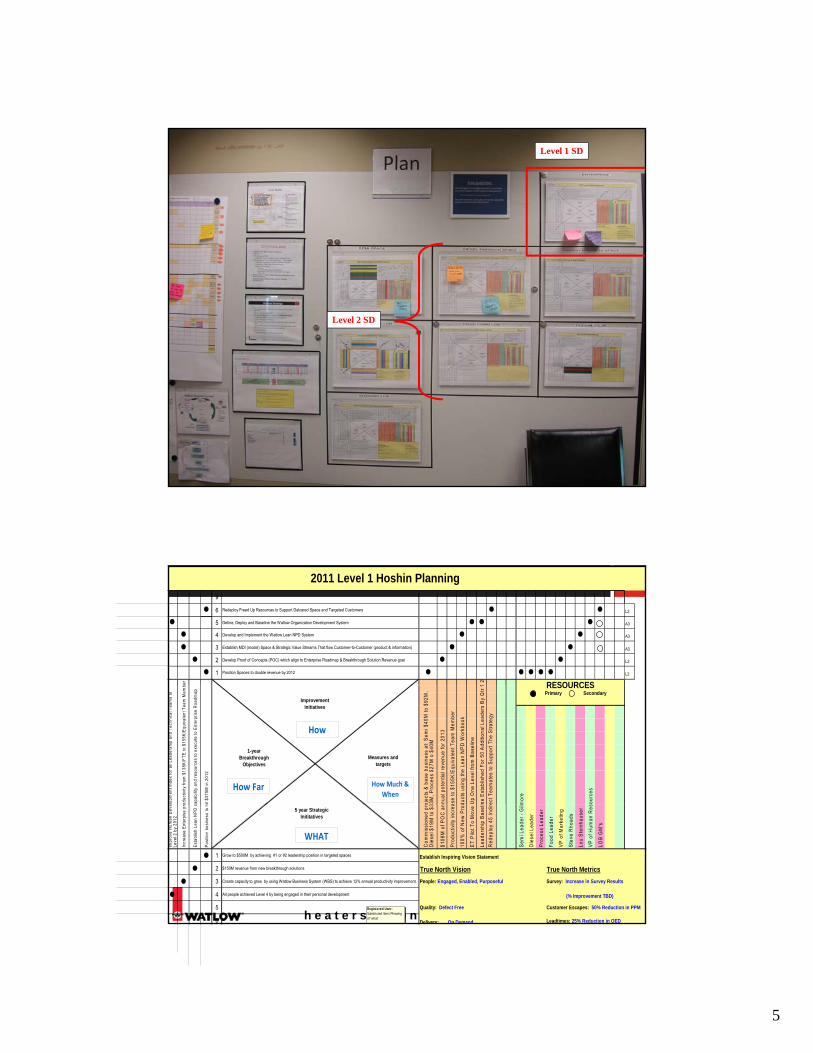
Enterprise Mission Control PLAN1 PLAN Section Content a Standard Work Documents- Enterprise Strategy Vertical Value Stream- Enterprise Hoshin Flow Down Diagram- Watlow Business System visualb Strategy- True North future state & metrics- 2015 Future State- Watlow Overall Strategy- Future State Box Score
True North MetricsValue Stream Employee CapacityFinancial PerformanceProjects Capital SpendingIllustrates Census expectations
c Strategy Deployment- Hoshin Level 1 matrix- Hoshin Level 2 matrixes for Spaces, LOBs, and
Functional areas2 PLAN Section Activity- Conduct a high level overview of plan to
assure all participants are aligned.- Review any Enterprise Strategy vertical value
stream driven updates or freeze point
PLAN Section Philosophy:Defines a standard process for running regular review of Enterprise progressDrives effective alignment of focus (vital few) across the enterprise by
h e a t e r s | s e n s o r s | c o n t r o l l e r s
stream driven updates or freeze point changes
- Participants: Executive Team; Fiunctional Leaders, invited guests
- Objectives: alignment of organization to strategic intent
- Inputs: annual Strategy Deployment outputs; 5-year strategy direction; WBS
- Outputs: Respond to the following;What changes to our strategy occurred as a result from last month’s Mission Control Freeze/Unfreeze process?
g ( ) p yclarifying Enterprise direction.Integrates action for Spaces, Lines of Business, and Functions in a consistent direction. Makes linkages visual.Provides an “At-a-Glance” picture of the Enterprise Strategic PlansEmbodies a PDCA cycle for breakthrough, kaizen & daily improvements
Process Owner: Director of Continuous Operational Improvement
Responsible for Execution: President
5
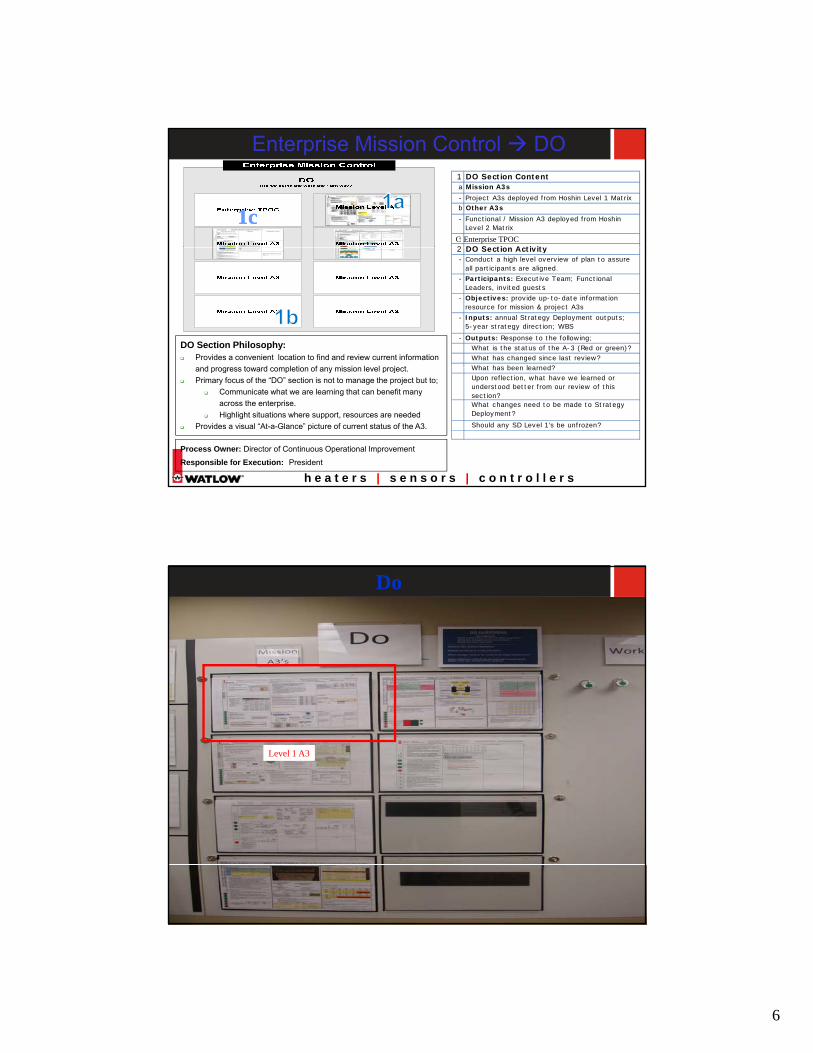
Level 1 SD
Level 2 SD
h e a t e r s | s e n s o r s | c o n t r o l l e r s
9
● 6 ● ● L2
● 5 ● ● ● A3
● 4 ● ● A3
● 3 ● ● A3
● 2 ● ● L2
● 1 ● ● ● ● ● L2
2011 Level 1 Hoshin Planning
Develop and Implement the Watlow Lean NPD System
Establish MDI (model) Space & Strategic Value Streams That flow Customer-to-Customer (product & information)
Develop Proof of Concepts (POC) which align to Enterprise Roadmap & Breakthrough Solution Revenue goal
Redeploy Freed Up Resources to Support Delcared Space and Targeted Customers
Define, Deploy and Baseline the Watlow Organization Development System
er
Position Spaces to double revenue by 2012
RESOURCES 20
mor
e
ect T
eam
ates
to S
uppo
rt Th
e S
trate
gy
elop
men
t Ind
ex fo
r all
Lead
ersh
ip a
nd T
echn
ical
Tea
ms
to
capa
bilit
y an
d re
sour
ces
to e
xecu
te to
Ent
erpr
ise
Roa
dmap
hit $
375M
in 2
012
oduc
tivity
from
$13
8K/F
TE to
$15
5K/E
quiv
alen
t Tea
m M
emb RESOURCES
ine
Est
ablis
hed
For 5
0 A
dditi
onal
Lea
ders
By
Qtr
1
Up
One
Lev
el fr
om B
asel
ine
ase
to $
155K
/Equ
ival
ent T
eam
Mem
ber
ojec
ts &
bas
e bu
sine
ss a
t: S
emi $
40M
to $
92M
, 33
M, P
roce
ss $
27M
o $
40M
nnua
l pot
entia
l rev
enue
for 2
013
sour
ces
duct
s us
ing
the
Lean
NP
D W
orkb
ook
Improvement Initiatives
1-year Breakthrough
Objectives
Primary Secondary
Measures and targets
How Far
How
How Much & When
h e a t e r s | s e n s o r s | c o n t r o l l e r s
● 1 Establish Inspiring Vision Statement
● 2
● 3 People: Engaged, Enabled, Purposeful Survey: Increase in Survey Results
● 4 (% Improvement TBD)
5 Quality: Defect Free Customer Escapes: 50% Reduction in PPM
6 On DemandDelivery: Leadtimes: 25% Reduction in OED
Sem
i Lea
der -
Gilm
Die
sel L
eade
r
Red
eplo
y 45
Indi
r
Grow to $500M by achieving #1 or #2 leadership position in targeted spaces
$150M revenue from new breakthrough solutions
Create capacity to grow by using Watlow Business System (WBS) to achieve 12% annual productivity improvement
All people achieved Level 4 by being engaged in their personal development
Impr
ove
Hum
an D
eve
Leve
l 2 b
y 20
12
Esta
blis
h Le
an N
PD
c
Posi
tion
busi
ness
to h
Incr
ease
Ent
erpi
se p
r
Pro
cess
Lea
der
Lead
ersh
ip B
asel
i
Lou
Ste
inha
user
Food
Lea
der
VP
of M
arke
ting
Ste
ve R
hoad
s
True North Vision
LOB
GM
's
ET
Pilo
t To
Mov
e
Pro
duct
ivity
incr
e a
Com
mis
sion
ed p
roD
iese
l $19
M to
$3
$108
M o
f PO
C a
n
True North Metrics
VP
of H
uman
Res
100%
of N
ew P
rod
5 year Strategic Inititatives
WHAT
Registered User:Substituted Semi Phrasing of 'what'
6
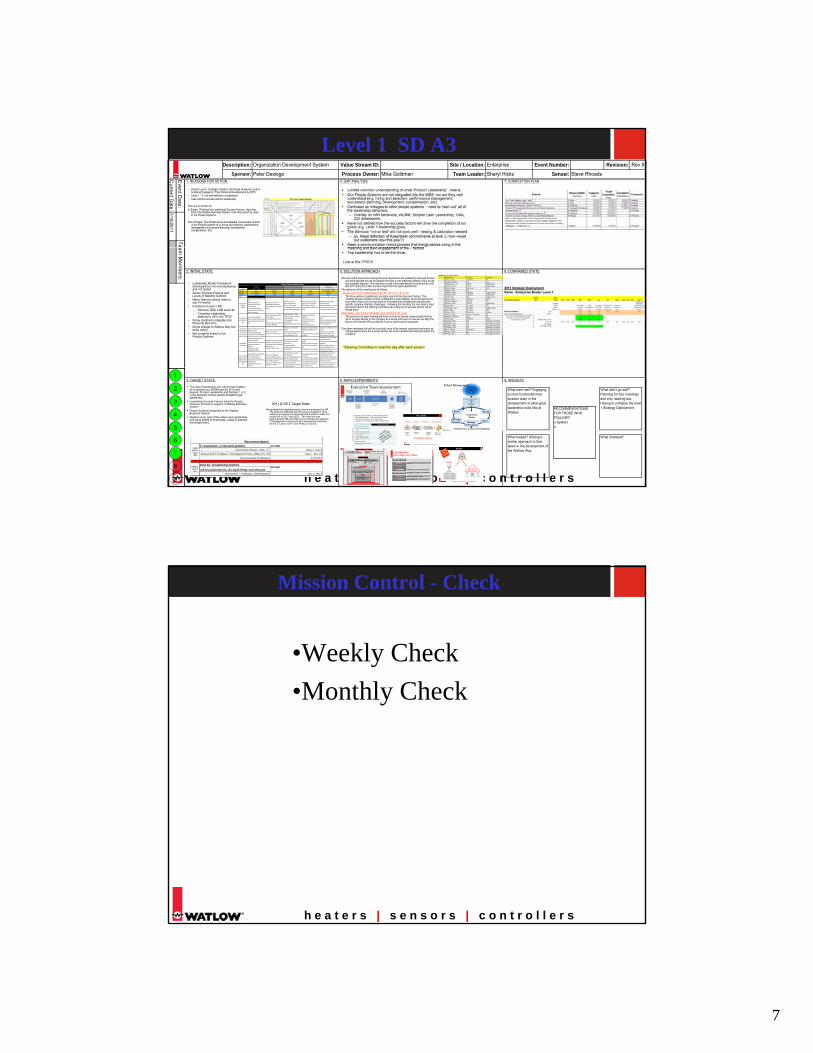
Enterprise Mission Control DO1 DO Section Content a Mission A3s
- Project A3s deployed from Hoshin Level 1 Matrixb Other A3s
- Functional / Mission A3 deployed from Hoshin Level 2 Matrix
-
2 DO Section ActivityEnterprise TPOCC
1c1c2 DO Section Activity- Conduct a high level overview of plan to assure
all participants are aligned.
- Participants: Executive Team; Functional Leaders, invited guests
- Objectives: provide up-to-date information resource for mission & project A3s
- Inputs: annual Strategy Deployment outputs; 5-year strategy direction; WBS
- Outputs: Response to the following;What is the status of the A-3 (Red or green)?What has changed since last review? What has been learned?
DO Section Philosophy:Provides a convenient location to find and review current information and progress to ard completion of an mission le el project
h e a t e r s | s e n s o r s | c o n t r o l l e r s
What has been learned?Upon reflection, what have we learned or understood better from our review of this section?What changes need to be made to Strategy Deployment?
Should any SD Level 1’s be unfrozen?
and progress toward completion of any mission level project.Primary focus of the “DO” section is not to manage the project but to;
Communicate what we are learning that can benefit many across the enterprise.Highlight situations where support, resources are needed
Provides a visual “At-a-Glance” picture of current status of the A3.
Process Owner: Director of Continuous Operational Improvement
Responsible for Execution: President
Do
Level 1 A3
h e a t e r s | s e n s o r s | c o n t r o l l e r s
7
Level 1 SD A3 1: REASONS FOR ACTION 4: GAP ANALYSIS 7: COMPLETION PLAN
Description: Organization Development System
Sponsor: Peter Desloge
Site / Location:
Team Leader:
TeE
vent Date:
Value Stream ID:
Process Owner: Mike Goldman
Rev 8Revision:Steve Rhoads
7/18/2011C
urrent Date:
Enterprise
Sheryl Hicks Sensei:
Event Number:
• Hoshin Level 1 Strategic Initiative: All People Achieved Level 4 by Being Engaged in Their Personal Development by 2015
• Level 1 – 5 not well defined or understood• Lean cannot succeed without Leadership
This is a 12 month A3In Scope: Refining the Leadership Success Factors, How they
link to the Watlow Business System, How they would be used in the People Systems
Out of Scope: The infrastructure and detailed components of eachof the People systems (e.g. hiring and selection, performance management, succession planning, development, compensation, etc)
Look at Site TPOCS
2: INITIAL STATE 5: SOLUTION APPROACH 8: CONFIRMED STATE
*Steering Committee to meet the day after each session
am M
embers:
Competitive CollaborativeCriteria Focus is on self Focus is on others (systemic)
Frequency Rarely Sometimes Usually Mostly Consistently/Second NatureMotivation Extrinsic/Forced Accepting Believing Excited IntrinsicCapability Limited Aware Capable Improving ExcelsLevel 1 2 3 4 5
Coach, Teach, Mentor & Support
*Develops others when instructed to do so*Directs & assigns work*Command & control style*"Checks the box"*Limited understanding and command of tools and processes used for development
*Coaches for improvement*Understands the importance*Has rudiments of a development system
*Coaches for success*Actively develops others*Focus is on direct reports*Demonstrates an ability to ready others for additional responsibility
*Seeks out coaching moments*Enjoys the success of others*Proven ability to thoroughly develop people at multiple levels of the org
*Routinely coaches & teaches; formal and informal*Sees the development of others as indicative of personal success*Is sought out by others as a mentor
Go to Gemba to actively listen &
learn
*Goes to Gemba when told*Relies on reports (paper/computer)*Asks wrong questions (why is this red?)
*Knows where Gemba is (where value is created)*Understands the value of "go & see"*Recognizes the need to learn more*Focuses on KPI board
*Actively does work in Gemba*People in Gemba see value from his/her participation*Actively engages in problem- solving activities*Understands what questions not to ask
*Discipline & standard work established*Enjoys learning in Gemba*Understands "customer to customer" flow*Asks the right questions
*Constantly goes to where value is created*Driven to learn and improve daily*Captures and shares knowledge across the organization
Uses data to simplify/prioritize
to create & increase value
*Uses A3 tool when told to (rarely)*Relies on intuition*Uses data to justify position*Limited use of A3 thinking (PDCA)
*A3 tool used for obvious situations*Perceives A3 as a "tool"*Can fill out the boxes on an A3
*Regularly uses data to inform decisions*Uses PDCA thinking to add value*Able to assist others with the creation/refinement of an A3
*Engages teams with A3 thinking*Effectively translates data into value*Recognizes/uses the A3 to capture knowledge
*Consistently & effectively uses A3 thinking*Expects others to use PDCA to logically convert data to value*Uses and re-uses knowledge
Keeps/Meets Commitments
*Results are inconsistent and unsustainable; no plan*Meets commitments out of fear of consequences; urgency is situational*Delivers results without consideration of others
*Inconsistent results; has a plan but rationalizes missed commitments*Emphasizes control of information (need to know)*Unwilling to "pull the andon"
*Has a plan and works to meet it*Proactively informs others of variation to plan*Accepts responsibility*Executes plan without factoring in new information
*Adapts plan as new knowledge is availableWilling to pull andon as required; seeks input of others to problem-solve*Develops solid counter-measures
*Consistently meets commitments with sustainable results*Wants to be known as dependable and reliableEffectively executes plan; has proactive contingency actions*Holds self accountable to support the commitments of others
Actively uses the Watlow Business System (WBS) and the Watlow
Way
*Unfamiliar with the processes and flow of the WBS; relies on conventional planning tools*Standard work is implemented as a compliance effort*Uses WBS processes when convenient
*Utilizes some WBS tools/ processes to plan/execute work*Sees the flow and interconnections between WBS componentsCan utilize many WBS tools with assistance or facilitation
*Uses WBS tools/ processes to plan/execute work*Sees the the linkage between the WBS and sustainable results*Expects the use of WBS by team members but utilization is inconsistent; ability to coach others on utilization is limited
*Personal standard work is driven by the WBS*Sees the WBS as the only way to learn and improve self and others*Team members understand and use the WBS but are not able to coach others in its use
*The WBS is used as the way to plan and execute all work*All team members understand the WBS and seek out opportunities to mentor others in its use*The leader is able to improve and mature the WBS as required to meet customer expectations
Watlow Leadership Maturity Model• Leadership Model Framework developed but not encompassing and not tested
• Seven Success Factors and Levels of Maturity Defined
• Need “learn by doing” tests to see if it works
• Included in Level 1 SD– Semicon SD2, LOB Level 2s– Columbia Leadership
seeking to roll it into TPOC• Some starting to integrate into
Personal Dev A3’s• Direct linkage to Watlow Way but
lacks clarity• Not currently linked to the
People Systems
We have spent some time scoping the work required for the Leadership Success Factors and have decided we can accomplish the work in two meetings instead of four as we had originally planned. We may have to add a third meeting but it would not be until late 2011/early 2012 after we have input from the rapid experiments.
The dates we will be meeting are as follows:Tuesday April 5th and Wednesday April 6th from 8-5 in St. Louis• The focus will be on gathering core team input into the Success Factors. This
meeting will also include a review of Watlow’s 5-year strategy, as we will ask for the core team’s input into the best ways to link leadership development activities with specific company strategic challenges. Following this meeting, the core team’s input will be fed back to the steering committee and a final set of success factors will be locked down.
Wednesday, June 1st and Thursday, June 2nd 8-5 in St. Louis• The second core team meeting will focus on how we should communicate the final
set of success factors to the company as a whole and input on how we can align the factors with discrete HR procedures, such as performance appraisals.
Core team members role will be to provide voice of the internal customers and serve as change agents when the success factors are communicated and deployed within the company.
h e a t e r s | s e n s o r s | c o n t r o l l e r s
3: TARGET STATE: 6: RAPID EXPERIMENTS 9: INSIGHTS
2011 & 2012 Target State:
What went well? Engaging a cross functional/cross location team in the development of what good leadership looks like at Watlow
What helped? Utlizing a similar approach to that taken in the development of the Watlow Way
What didn't go well? Planning for four meetings and only needing two. Having to unfreeze the level 1 Strategy Deployment.
What hindered?
RECOMMENDATIONS FOR THOSE WHO FOLLOW!!o System o
1
2
3
4
5
6
7
8
9
p
Success Factor`Coach, Teach, Mentor & Support
Develops, supports and works through teams
Go to Gemba to actively listen & learn
Uses data to simplify/prioritize to create & increase value
Actively uses the Watlow Business System (WBS) and the Watlow Way
Keeps/Meets Commitments
Creates a compelling case for the future state
Maturity/Development
CONTENT
NEEDS TO BE
CALIBRATED
AND TESTED
SUC
CES
S FA
CTO
RS
“Leadership Success Factors” vs Leadership Maturity Model 1. Resonates with leaders – what I need to do to succeed!2. Focus on the “factors” not on the “level X” label3. Supportive of…not redundant with Watlow Way Behaviors
We reviewed the implementation time line proposed by HR. The time line reflected the HR group’s evaluation of its capacity to assess and develop formal leaders under the project A3 in 2011 and 2012. The time line was approved and HR and CMA will coordinate the selection of assessment instruments and development activities for the ET pilot in 2011 and Phase 2 in 2012.
The type of leadership and culture that enables us to achieve our $500M goal by 2015 and beyond, Product Leadership and Number 1 or 2 in the declared market spaces (breakthrough objectives)Leadership Success Factors linked to People, Purpose, Process in support of Watlow Business SystemPeople Systems integrated to the Watlow Business System Model is vivid, part of the culture and sustainable and value added to employees. (need to address this longer term)
Business Goals, Tactics, & Metrics
Organization Structure
RecruitRetain
Select
CompetencyModel
Develop/Promote
Talent Review & Succession Planning
Talent Management
Manage Performance
LEADERSHIP SUCCESS FACTORS
h e a t e r s | s e n s o r s | c o n t r o l l e r s
The Linkage
How we work
together?
People + Purpose + Process
How we get there?
What we need to get
there?
The Watlow Journey
Where is our destination?
= Performance
h e a t e r s | s e n s o r s | c o n t r o l l e r s
People
TBD
Mission Control - Check
•Weekly CheckM thl Ch k•Monthly Check
h e a t e r s | s e n s o r s | c o n t r o l l e r s
8
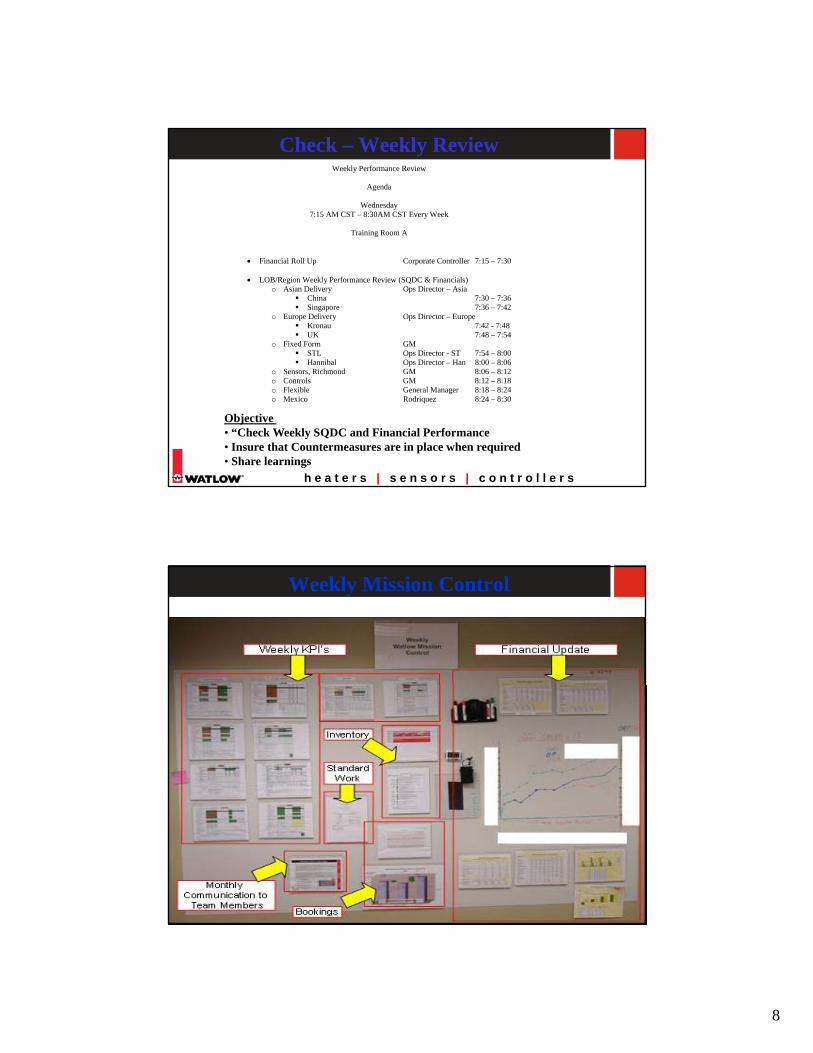
Check – Weekly ReviewWeekly Performance Review
Agenda
Wednesday
7:15 AM CST – 8:30AM CST Every Week
Training Room A
• Financial Roll Up Corporate Controller 7:15 – 7:30
• LOB/Region Weekly Performance Review (SQDC & Financials) o Asian Delivery Ops Director – Asia
China 7:30 – 7:36 Singapore 7:36 – 7:42
o Europe Delivery Ops Director – Europe Kronau 7:42 - 7:48 UK 7:48 – 7:54
o Fixed Form GM STL Ops Director - ST 7:54 – 8:00 Hannibal Ops Director – Han 8:00 – 8:06
h e a t e r s | s e n s o r s | c o n t r o l l e r s
o Sensors, Richmond GM 8:06 – 8:12o Controls GM 8:12 – 8:18 o Flexible General Manager 8:18 – 8:24 o Mexico Rodriquez 8:24 – 8:30
Staff Meeting 8:45– 10:00am (may end earlier depending on the need) Safety Update 8:45 am Dryden Calendar 8:55 am LaMantia Info Sharing 9:15 am All (by LOB) Topic (if needed) 9:30am All PAC (if needed) 9:45 am LaMantia
Objective • “Check Weekly SQDC and Financial Performance• Insure that Countermeasures are in place when required• Share learnings
Weekly Mission Control
h e a t e r s | s e n s o r s | c o n t r o l l e r s
9
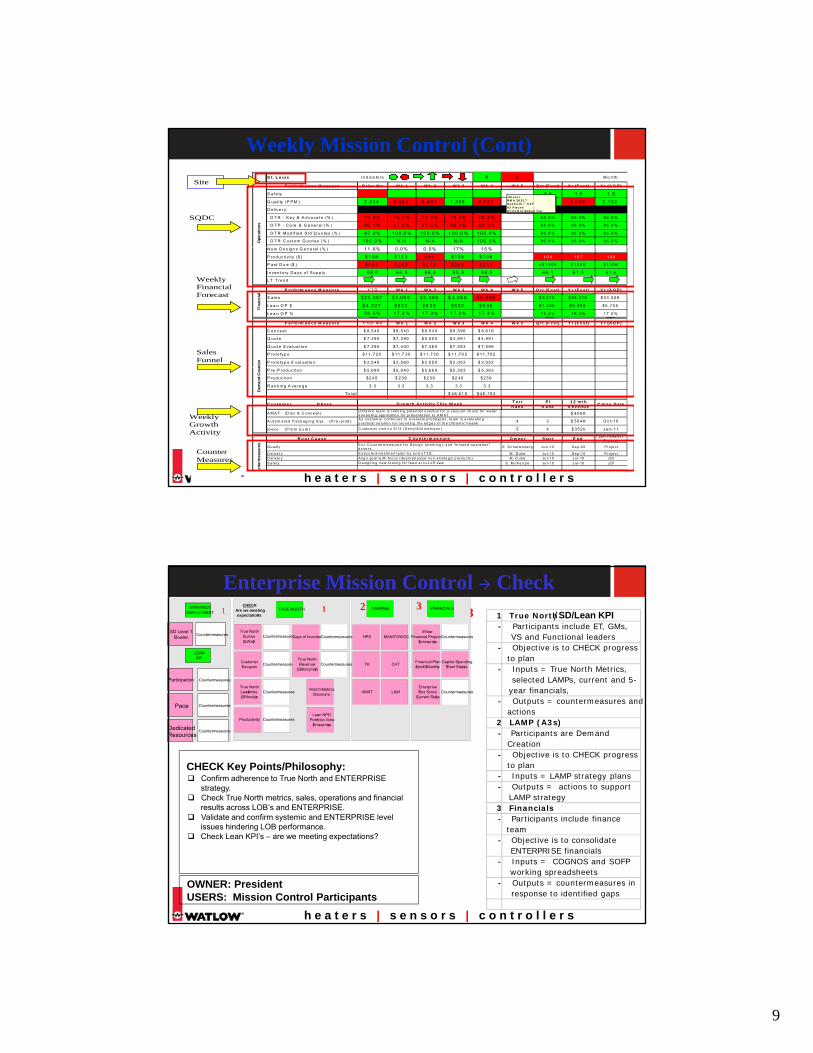
Weekly Mission Control (Cont) S t. L o ui s I n d ica to rs X X M o n th :
P e r fo rm a n c e M e a s u re P r io r M o W k 1 W k 2 W k 3 W k 4 W k 5 Q t r (F c s t) Y r (F c s t) Y r (A O P )
S a f e ty 2 .5 1 .8 1 . 8
Q u a l i ty (P P M ) 2 , 6 3 4 3 ,4 4 4 5 ,4 6 1 1 ,3 9 8 3 ,7 3 7 2 ,5 0 0 3 ,0 0 0 2 ,1 8 2D e l ive r y :
O T R - K e y & A d vo ca t e (% ) 7 8 .9 % 7 5 .7 % 7 7 .5 % 7 9 .0 % 7 6 . 4 % 8 5 . 0 % 9 2 . 0 % 9 2 .0 %
O T P - C o re & G e n e r a l (% ) 9 0 .1 % 8 7 .2 % 8 9 .5 % 9 0 .3 % 8 0 . 3 % 9 4 . 0 % 9 5 . 0 % 9 5 .0 %
O T R M o d if ie d S td Q u o te s (% ) 9 7 .0 % 1 0 0 .0 % 1 0 0 .0 % 1 0 0 .0 % 1 0 0 .0 % 9 5 . 0 % 9 5 . 0 % 9 5 .0 %
O T R C u st o m Q u o t e s (% ) 1 0 0 .0 % N /A N / A N /A 1 0 0 .0 % 9 5 . 0 % 9 5 . 0 % 9 5 .0 %
N D i G l ( % ) 1 1 6 % 0 0 % 0 0 % 1 7 % 1 5 %
Ope
ratio
ns
sch e e r i:R M A 38 51 7G ood ri ch / C A T43 P ie c esU n it s N ot B a ke d O ut
Site
SQDC
N e w D e s ig n s G e n e ra l ( % ) 1 1 .6 % 0 .0 % 0 . 0 % 1 7 % 1 5 %
P ro d u c tiv i t y ( $ ) $ 1 0 8 $ 1 2 3 $ 9 4 $ 1 0 8 $ 1 0 6 1 0 4 1 0 7 1 0 9
P a st D u e ($ ) $ 5 4 4 $ 2 8 9 $ 2 4 3 $ 2 8 3 $ 2 5 1 < $ 1 5 0 K $ 1 0 0 K $ 1 0 0 K
I n ve n t o ry D a ys o f S u p p ly 6 8 .0 6 4 .5 6 6 .4 6 5 .6 6 6 .9 6 6 .1 6 1 .5 6 7 . 8
L T T re n d
P e r fo rm a n c e M e a s u re Y T D W k 1 W k 2 W k 3 W k 4 W k 5 Q t r (F c s t) Y r (F c s t) Y r (A O P )
S a le s $ 2 3 ,5 6 7 $ 3 ,0 6 6 $ 3 , 0 6 6 $ 3 ,0 6 6 $ 3 , 0 4 8 $ 9 ,3 1 5 $ 3 8 , 3 1 6 $ 3 3 ,5 2 6
L e a n O P $ $ 4 , 8 2 7 $ 5 3 0 $ 5 3 0 $ 5 3 0 $ 5 3 0 $ 1 ,4 3 5 $ 6 , 9 9 8 $ 5 , 7 0 5
L e a n O P % 2 0 .5 % 1 7 .3 % 1 7 .3 % 1 7 .3 % 1 7 . 4 % 1 5 . 4 % 1 8 . 3 % 1 7 .0 %
P e r fo rm a n c e M e a s u re P rio r M o W k 1 W k 2 W k 3 W k 4 W k 5 Q t r (F c s t) Y r (F c s t) Y r (A O P )
C o n ce p t $ 8 ,5 4 0 $ 8 ,5 4 0 $ 8 ,5 4 0 $ 8 , 5 9 6 $ 8 ,6 1 6
Q u o t e $ 7 ,3 9 0 $ 7 ,3 9 0 $ 5 ,0 5 0 $ 4 , 9 9 1 $ 4 ,9 9 1
Q u o t e E va lu a t io n $ 7 ,3 9 0 $ 7 ,4 0 0 $ 7 ,3 8 0 $ 7 , 5 8 3 $ 7 ,5 9 6
P ro to typ e $ 1 1 , 7 2 0 $ 1 1 ,7 3 0 $ 1 1 , 7 3 0 $ 1 1 ,7 0 2 $ 1 1 ,7 0 2
P ro to typ e E va lu a t io n $ 2 ,5 4 0 $ 2 ,5 6 0 $ 2 ,0 5 0 $ 2 , 0 5 2 $ 2 ,0 5 2
Fina
ncia
lat
ion
Weekly Financial Forecast
Sales Funnel
h e a t e r s | s e n s o r s | c o n t r o l l e r s
P re -P ro d u c tio n $ 5 ,0 9 0 $ 5 ,0 4 0 $ 5 ,6 6 0 $ 5 , 3 9 3 $ 5 ,3 6 3
P ro d u c tio n $ 2 4 0 $ 2 3 9 $ 2 3 9 $ 2 4 0 $ 2 3 9
R a n k in g A ve ra g e 3 . 3 3 .3 3 . 3 3 .3 3 . 3
To ta l $ 4 8 ,8 1 6 $ 4 8 ,7 9 3
C u s to m e r P ha s e T e rrR a n k
P lR a nk
1 2 m t h R e v e nu e C lo s e D a te
A M A T (D is c & C onc e pt ) $ 4 0 0 K
A u t om a t ed P ac k ag ing S ys (P re -prod ) 4 3 $ 5 0 4 K O c t-1 0
Ip ec o (P ro to E v a l ) 5 4 $ 3 5 2 k Ja n - 1 1
R o o t C a u s e O w ne r S ta r t E nd J D I / E ve n t / P ro je c t
Q u a lity E . S c h el le n be rg Ju n -1 0 S e p -2 0 P r oje ct
D el ive r y M . Du ke Ju l- 1 0 S e p -1 0 P r oje ctD el ive r y M . D u ke Ju l- 1 0 J u l- 10 J D I S a fe ty S . M cK e n zie Ju l- 1 0 J u l- 10 J D I
A l ig n go a l w ith fo cu s ( de e m p h a size n o n -s tra te g ic p ro d u cts )D e s ig n in g n e w to o lin g fo r fe e d a t c u t-o f f sa w
unte
rmea
sure
s
C ou n te rm e a s ureE s t. C o u n ter m e a su re s f or De s ig n (m a rk in g ), a n d "m i sse d o p e ra t io n " d r ive r s .E x e cu te d i ve stm e n t p la n b y e n d o f 3 Q .
Dem
and
Cre
a
C u sto m e r v i s it o n 9 /13 (S e lvy /S ch lo e m a n n )
G ro w th A c tiv it y T hi s W e e k
U ltr a m ic te a m is r e f in in g p ote n t ia l s ol u ti o n fo r a va cu u m ch u ck fo r wa fe r a n n e a lin g a pp l ica tio n fo r p r es e nta t io n to A M ATA s cu sto m e r c on t in u e s to e va lu a te p r o totyp e s, te a m is e va lu a tin g p r a ct ica l so lu tio n fo r r ou n d in g th e e d g e s o f th e U ltr a m ic h e a ter
Weekly Growth Activity
Counter Measures
Enterprise Mission Control Check1 2 31 32 1 True North
- Participants include ET, GMs, VS and Functional leaders
- Objective is to CHECK progress to plan
- Inputs = True North Metrics, selected LAMPs, current and 5-
CHECKAre we meeting expectations?
True NorthSurvey(S. Wall)
TRUE NORTH
Countermeasures
CustomerEscapes Countermeasures
Days of InventoryCountermeasures
True NorthRevenue
(C. Merryman)Countermeasures
LAMP (A3s)
HPS MANITOWOC
TK CAT
5 Year Financial Projection
(Enterprise)Countermeasures
Financial Plan(Next 12 Months)
Capital Spending(Plant Status)
FINANCIALSSTRATEGYDEPLOYMENT
SD Level 1Bowler
Participation
LEANKPI
Countermeasures
Countermeasures
/ SD/Lean KPI11 2 3
CHECK Key Points/Philosophy:Confirm adherence to True North and ENTERPRISE strategy.Check True North metrics, sales, operations and financial
lt LOB’ d ENTERPRISE
year financials, - Outputs = countermeasures and
actions2 LAMP (A3s)- Participants are Demand
Creation- Objective is to CHECK progress
to plan- Inputs = LAMP strategy plans- Outputs = actions to support
LAMP strategy
True NorthLead-times(S. Rhodes)
Countermeasures
Productivity CountermeasuresLean NPD
Portfolio View(Enterprise)
AMAT LAMWatch MetricsBoxscore
EnterpriseBox Score
(Current State)Countermeasures
Pace
Dedicated Resources
Countermeasures
Countermeasures
h e a t e r s | s e n s o r s | c o n t r o l l e r s
results across LOB’s and ENTERPRISE.Validate and confirm systemic and ENTERPRISE level issues hindering LOB performance.Check Lean KPI’s – are we meeting expectations?
3 Financials- Participants include finance
team- Objective is to consolidate
ENTERPRISE financials- Inputs = COGNOS and SOFP
working spreadsheets- Outputs = countermeasures in
response to identified gapsOWNER: PresidentUSERS: Mission Control Participants
10
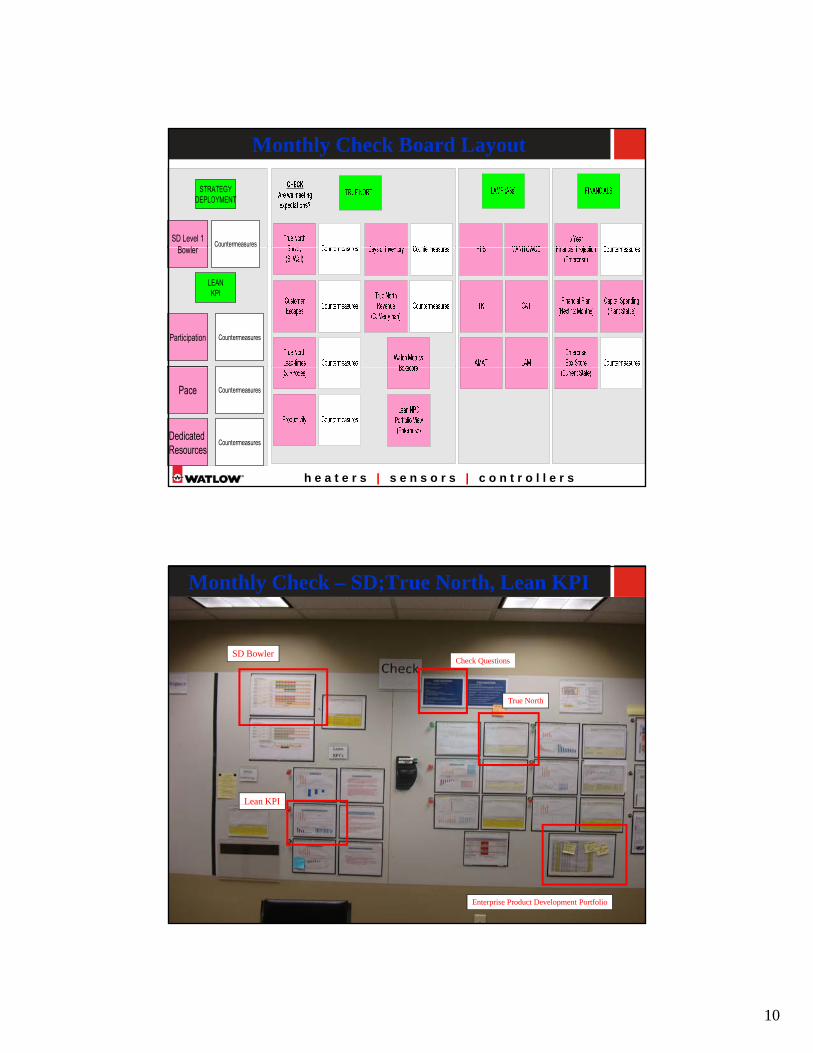
Monthly Check Board Layout
STRATEGYDEPLOYMENT
SD Level 1B l
CountermeasuresBowler
Participation
LEANKPI
Countermeasures
h e a t e r s | s e n s o r s | c o n t r o l l e r s
Pace
Dedicated Resources
Countermeasures
Countermeasures
Monthly Check – SD;True North, Lean KPI
SD BowlerCheck Questions
Lean KPI
True North
h e a t e r s | s e n s o r s | c o n t r o l l e r sEnterprise Product Development Portfolio
11
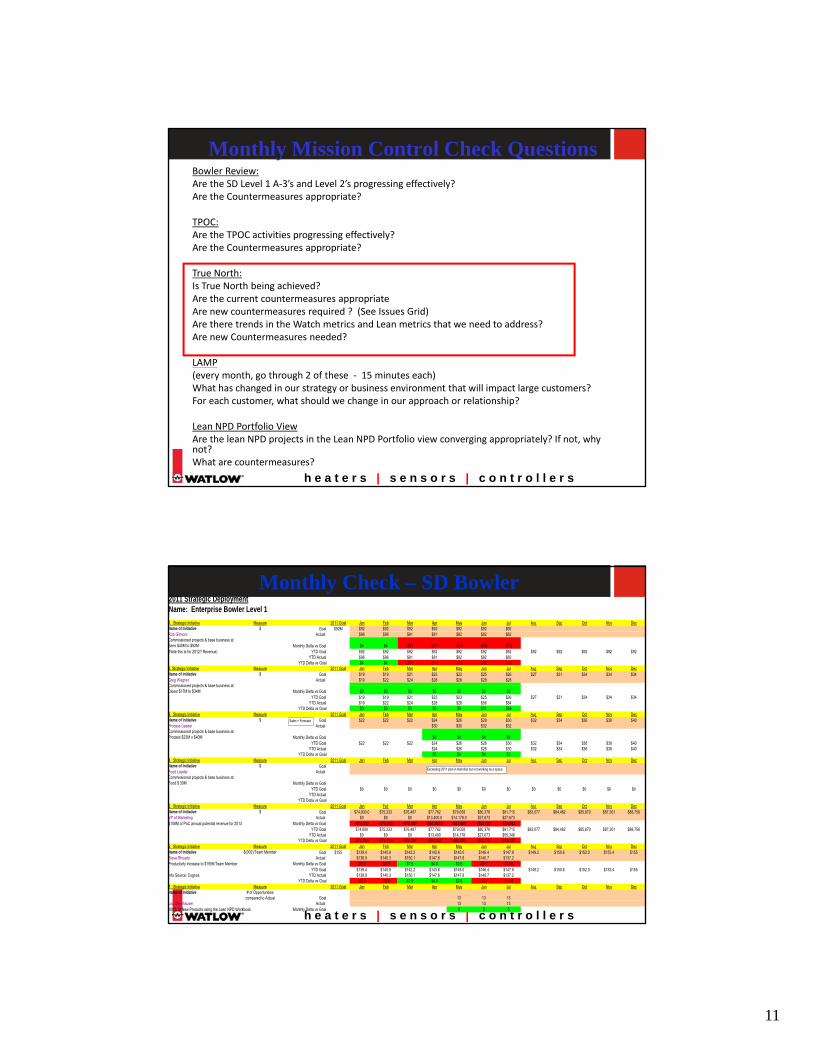
Monthly Mission Control Check QuestionsBowler Review:Are the SD Level 1 A‐3’s and Level 2’s progressing effectively?Are the Countermeasures appropriate?
TPOC:Are the TPOC activities progressing effectively?Are the Countermeasures appropriate?Are the Countermeasures appropriate?
True North:Is True North being achieved?Are the current countermeasures appropriateAre new countermeasures required ? (See Issues Grid)Are there trends in the Watch metrics and Lean metrics that we need to address?Are new Countermeasures needed?
LAMP
h e a t e r s | s e n s o r s | c o n t r o l l e r s
(every month, go through 2 of these ‐ 15 minutes each)What has changed in our strategy or business environment that will impact large customers?For each customer, what should we change in our approach or relationship?
Lean NPD Portfolio ViewAre the lean NPD projects in the Lean NPD Portfolio view converging appropriately? If not, why not?What are countermeasures?
Monthly Check – SD Bowler2011 Strategic DeploymentName: Enterprise Bowler Level 1 1. Strategic Initiative Measure 2011 Goal Jan Feb Mar Apr May Jun Jul Aug Sep Oct Nov DecName of Initiative $ Goal $92M $92 $92 $92 $92 $92 $92 $92Rob Gilmore Actual $96 $96 $81 $81 $82 $82 $82Commissioned projects & base business at: Semi $40M to $92M Monthly Delta vs Goal $4 $4 -$11 -$11 -$10 -$10 -$10(Note this is for 2012? Revenue) YTD Goal $92 $92 $92 $92 $92 $92 $92 $92 $92 $92 $92 $92
YTD Actual $96 $96 $81 $81 $82 $82 $82YTD Delta vs Goal $4 $4 -$11 -$11 -$10 -$10 -$10
2. Strategic Initiative Measure 2011 Goal Jan Feb Mar Apr May Jun Jul Aug Sep Oct Nov DecName of Initiative $ Goal $19 $19 $21 $23 $23 $25 $26 $27 $31 $34 $34 $34Greg Wagner Actual $19 $22 $24 $28 $28 $28 $28Commissioned projects & base business at:Commissioned projects & base business at: Diesel $17M to $34M Monthly Delta vs Goal $0 $3 $3 $5 $5 $3 $2
YTD Goal $19 $19 $21 $23 $23 $25 $26 $27 $31 $34 $34 $34YTD Actual $19 $22 $24 $28 $28 $56 $84
YTD Delta vs Goal $0 $3 $3 $5 $5 $31 $583. Strategic Initiative Measure 2011 Goal Jan Feb Mar Apr May Jun Jul Aug Sep Oct Nov DecName of Initiative $ Goal $22 $22 $22 $24 $26 $28 $30 $32 $34 $36 $38 $40Process Leader Actual $30 $30 $32 $32Commissioned projects & base business at: Process $22M o $40M Monthly Delta vs Goal $6 $4 $4 $2
YTD Goal $22 $22 $22 $24 $26 $28 $30 $32 $34 $36 $38 $40YTD Actual $24 $26 $28 $30 $32 $34 $36 $38 $40
YTD Delta vs Goal $6 $4 $4 $24. Strategic Initiative Measure 2011 Goal Jan Feb Mar Apr May Jun Jul Aug Sep Oct Nov DecName of Initiative $ GoalFood Leader Actual Commissioned projects & base business at: Food $ 30M Monthly Delta vs Goal
YTD Goal $0 $0 $0 $0 $0 $0 $0 $0 $0 $0 $0 $0YTD Actual
YTD Delta vs Goal5 St t i I iti ti M 2011 G l J F b M A M J J l A S O t N D
Exceeding 2011 plan in Hannibal but not working as a space
Sales + Forecast
h e a t e r s | s e n s o r s | c o n t r o l l e r s
5. Strategic Initiative Measure 2011 Goal Jan Feb Mar Apr May Jun Jul Aug Sep Oct Nov DecName of Initiative $ Goal $74,000.0 $75,233 $76,487 $77,762 $79,058 $80,376 $81,715 $83,077 $84,462 $85,870 $87,301 $88,756VP of Marketing Actual $0 $0 $0 $13,400.0 $14,178.0 $27,673 $27,673$108M of PoC annual potential revenue for 2013 Monthly Delta vs Goal -$74,000 -$75,233 -$76,487 -$64,362.0 -$64,880 -$52,703 -$54,042
YTD Goal $74,000 $75,233 $76,487 $77,762 $79,058 $80,376 $81,715 $83,077 $84,462 $85,870 $87,301 $88,756YTD Actual $0 $0 $0 $13,400 $14,178 $27,673 $55,346
YTD Delta vs Goal -$74,000 -$75,233 -$76,487 -$64,362 -$64,880 -$52,703 -$26,3706. Strategic Initiative Measure 2011 Goal Jan Feb Mar Apr May Jun Jul Aug Sep Oct Nov DecName of Initiative $(000)/Team Member Goal $155 $139.4 $140.8 $142.2 $143.6 $145.0 $146.4 $147.8 $149.2 $150.6 $152.0 $153.4 $155Steve Rhoads Actual $138.9 $140.3 $150.1 $147.6 $147.8 $140.7 $137.2Productivity increase to $155K/Team Member Monthly Delta vs Goal -$0.5 -$0.5 $7.9 $4.0 $2.8 -$5.7 -$10.6
YTD Goal $139.4 $140.8 $142.2 $143.6 $145.0 $146.4 $147.8 $149.2 $150.6 $152.0 $153.4 $155Info Source: Cognos YTD Actual $138.9 $140.3 $150.1 $147.6 $147.8 $140.7 $137.2
YTD Delta vs Goal -$0.5 -$0.5 $7.9 $4.0 $2.8 -$5.7 -$10.67. Strategic Initiative Measure 2011 Goal Jan Feb Mar Apr May Jun Jul Aug Sep Oct Nov DecName of Initiative # of Opportunities
compared to Actual Goal 13 13 13Lou Steinhauser Actual 13 13 13100% of New Products using the Lean NPD Workbook Monthly Delta vs Goal 0 0 0
12
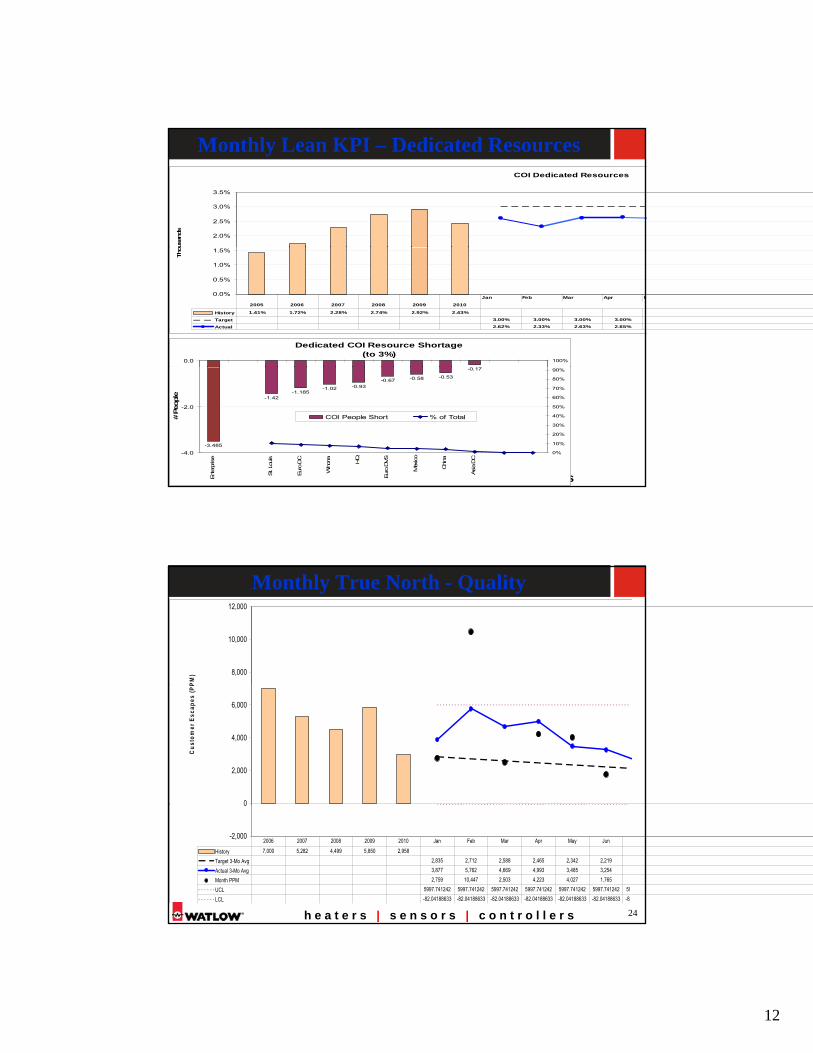
Monthly Lean KPI – Dedicated ResourcesCOI Dedicated Resources
2.0%
2.5%
3.0%
3.5%
ousa
nds
0.0%
0.5%
1.0%
1.5%
Tho
History 1.41% 1.72% 2.28% 2.74% 2.92% 2.43%
Target 3.00% 3.00% 3.00% 3.00%
Actual 2.62% 2.33% 2.63% 2.65%
Jan Feb Mar Apr M
2005 2006 2007 2008 2009 2010
Dedicated COI Resource Shortage (to 3%)
0 1
0.0 100%
h e a t e r s | s e n s o r s | c o n t r o l l e r s
-3.485
-1.42-1.185
-1.02 -0.93-0.67 -0.58 -0.53
-0.17
-4.0
-2.0
Ent
erpr
ise
St.
Louis
Eur
o DC
Winon
a
HQ
Eur
o DVS
Mex
ico
China
Asia
DC
# Pe
ople
0%
10%
20%
30%
40%
50%
60%
70%
80%
90%
COI People Short % of Total
Monthly True North - Quality
8,000
10,000
12,000
PM)
0
2,000
4,000
6,000
Cus
tom
er E
scap
es (P
P
h e a t e r s | s e n s o r s | c o n t r o l l e r s 24
Takeaway Summary
-2,000
0
History 7,000 5,282 4,499 5,850 2,958
Target 3-Mo Avg 2,835 2,712 2,588 2,465 2,342 2,219
Actual 3-Mo Avg 3,877 5,762 4,669 4,993 3,485 3,254
Month PPM 2,759 10,447 2,503 4,223 4,027 1,765
UCL 5997.741242 5997.741242 5997.741242 5997.741242 5997.741242 5997.741242 59
LCL -82.04188633 -82.04188633 -82.04188633 -82.04188633 -82.04188633 -82.04188633 -82
2006 2007 2008 2009 2010 Jan Feb Mar Apr May Jun
13
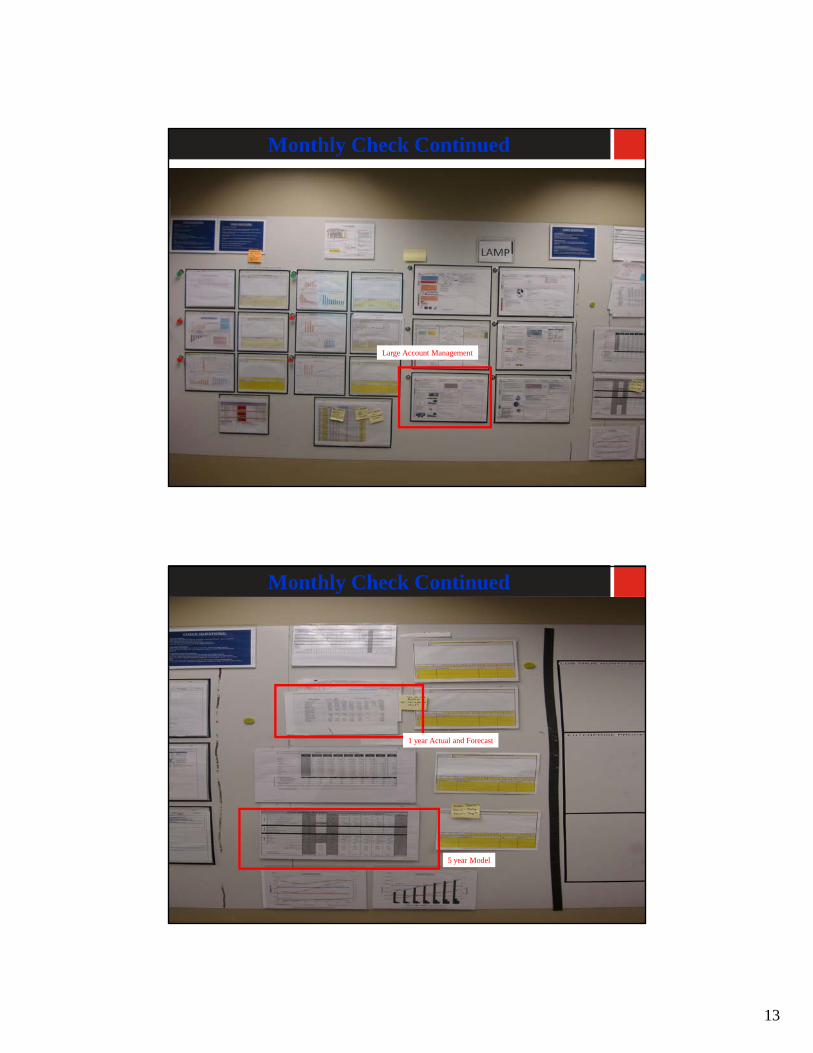
Monthly Check Continued
Large Account Management
h e a t e r s | s e n s o r s | c o n t r o l l e r s
Monthly Check Continued
1 year Actual and Forecast
h e a t e r s | s e n s o r s | c o n t r o l l e r s
5 year Model
14
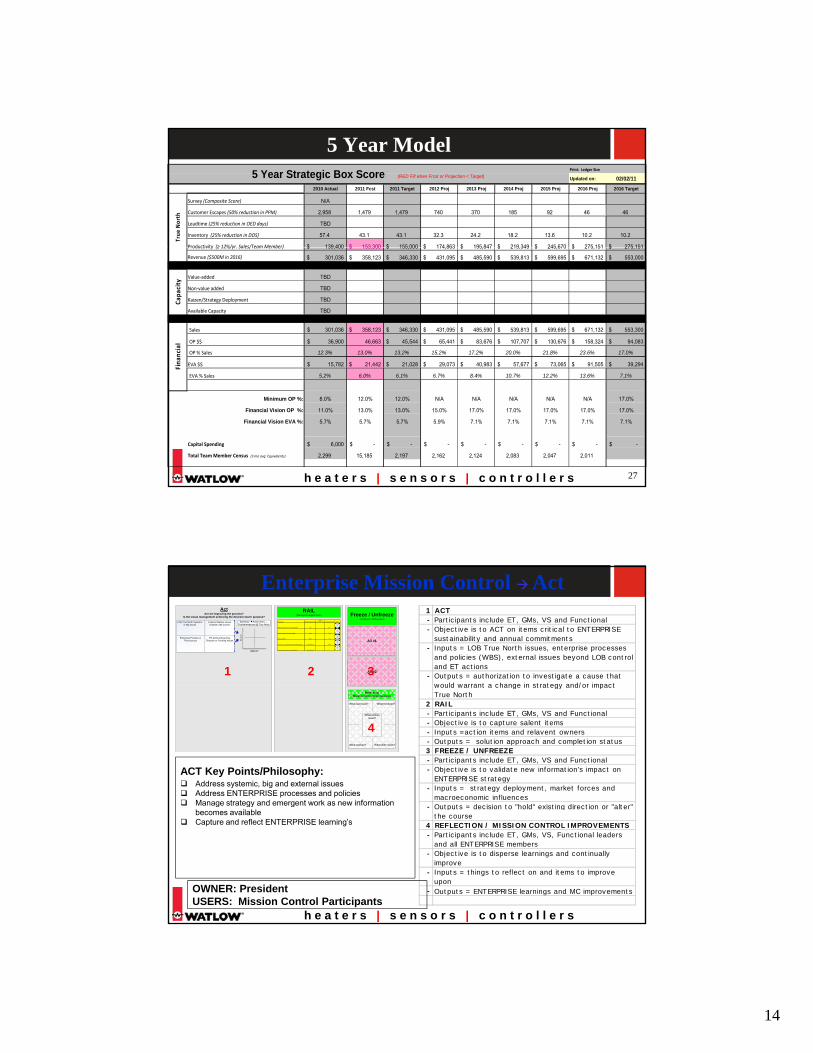
5 Year ModelPrint: Ledger Size
Updated on: 02/02/11
2010 Actual 2011 Fcst 2011 Target 2012 Proj 2013 Proj 2014 Proj 2015 Proj 2016 Proj 2016 Target
Survey (Composite Score) N/A
Customer Escapes (50% reduction in PPM) 2,958 1,479 1,479 740 370 185 92 46 46
Leadtime (25% reduction in OED days) TBD
Inventory (25% reduction in DOS) 57.4 43.1 43.1 32.3 24.2 18.2 13.6 10.2 10.2
Productivity (≥ 12%/yr Sales/Team Member) 139 400$ 153 300$ 155 000$ 174 863$ 195 847$ 219 349$ 245 670$ 275 151$ 275 151$
True
North
5 Year Strategic Box Score (RED Fill when Frcst or Projection < Target)
Productivity (≥ 12%/yr. Sales/Team Member) 139,400$ 153,300$ 155,000$ 174,863$ 195,847$ 219,349$ 245,670$ 275,151$ 275,151$
Revenue ($500M in 2016) 301,036$ 358,123$ 346,330$ 431,095$ 485,590$ 539,813$ 599,695$ 671,132$ 553,000$
Value‐added TBD
Non‐value added TBD
Kaizen/Strategy Deployment TBD
Available Capacity TBD
Sales 301,036$ 358,123$ 346,330$ 431,095$ 485,590$ 539,813$ 599,695$ 671,132$ 553,300$
OP $$ 36,900$ 46,663 45,544$ 65,441$ 83,676$ 107,707$ 130,676$ 158,324$ 94,083$
OP % Sales 12.3% 13.0% 13.2% 15.2% 17.2% 20.0% 21.8% 23.6% 17.0%
EVA $$ 15,782$ 21,442$ 21,028$ 29,073$ 40,983$ 57,677$ 73,065$ 91,505$ 39,294$
Capa
city
Fina
ncial
h e a t e r s | s e n s o r s | c o n t r o l l e r s 27
EVA % Sales 5.2% 6.0% 6.1% 6.7% 8.4% 10.7% 12.2% 13.6% 7.1%
Minimum OP %: 8.0% 12.0% 12.0% N/A N/A N/A N/A N/A 17.0%
Financial Vision OP %: 11.0% 13.0% 13.0% 15.0% 17.0% 17.0% 17.0% 17.0% 17.0%
Financial Vision EVA %: 5.7% 5.7% 5.7% 5.9% 7.1% 7.1% 7.1% 7.1% 7.1%
Capital Spending 6,000$ -$ -$ -$ -$ -$ -$ -$ -$
Total Team Member Census (3 mo avg Equivalents) 2,299 15,185 2,197 2,162 2,124 2,083 2,047 2,011
F
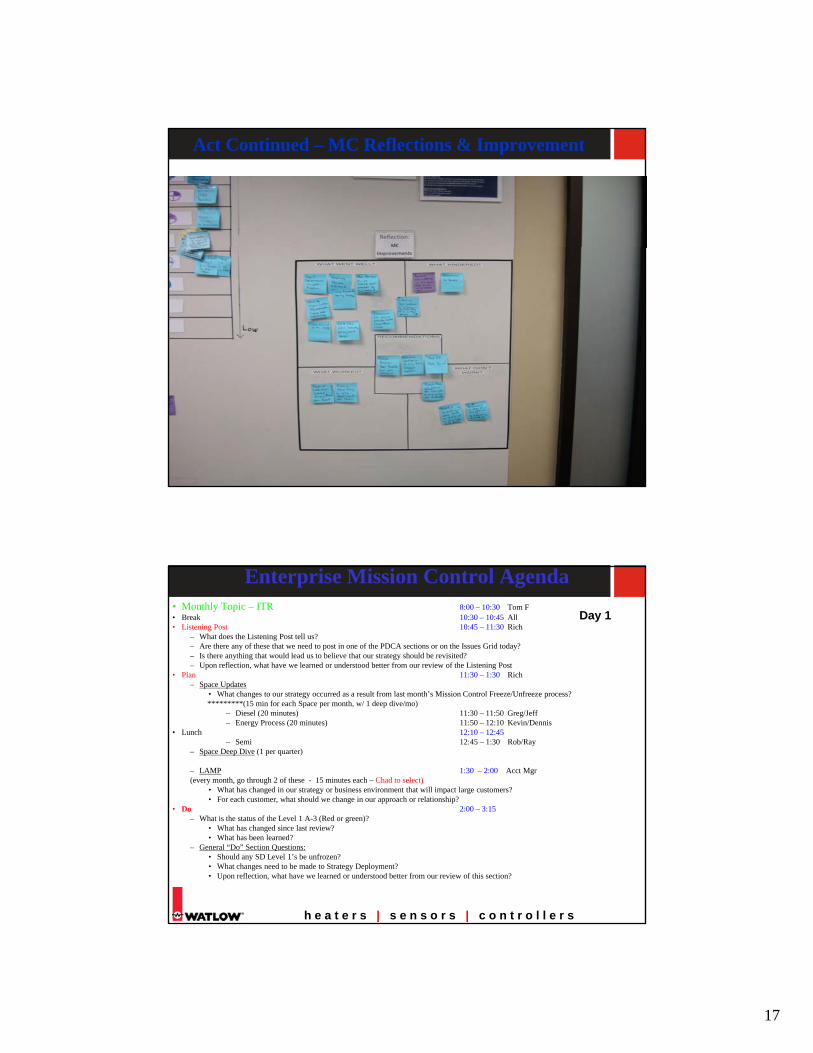
Freeze / Unfreeze(“Unfreeze” A3 Required)
A3 #1
A3 #2
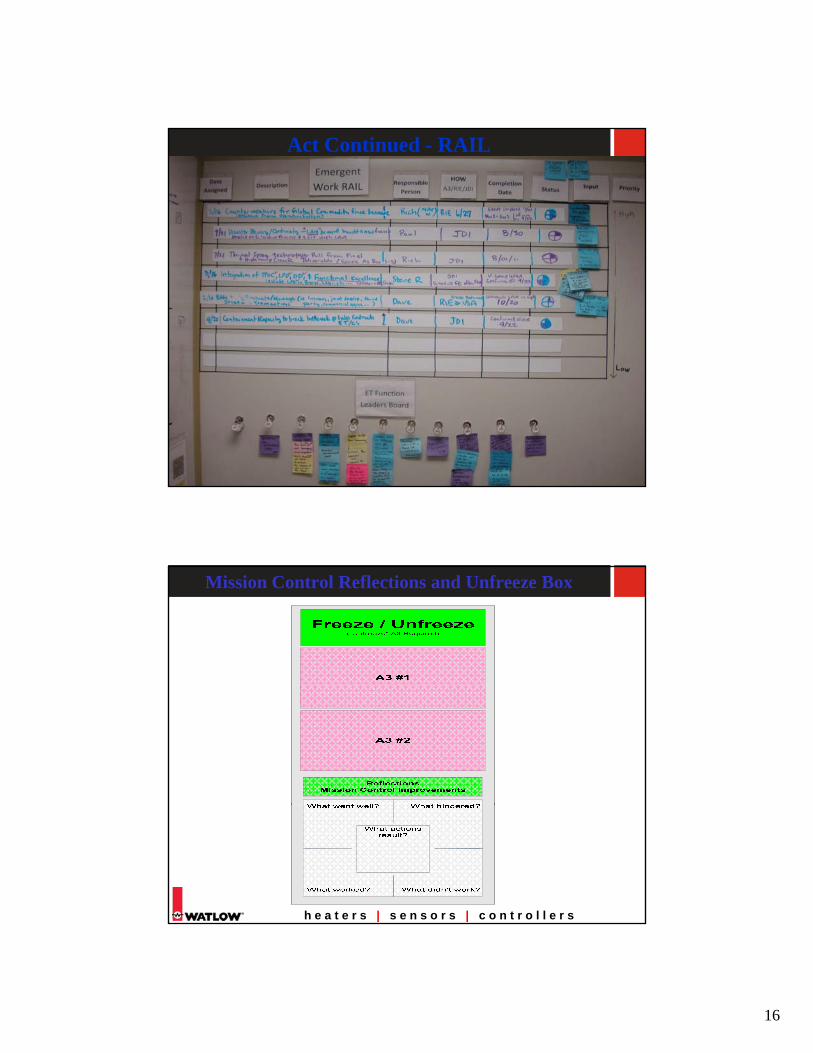
RAIL(Manage Emergent Work)
ActAre we improving the process?
Is the visual management achieving the desired result / purpose?
LOB True North Systemic or Big Issues
External Watlow Issues Outside LOB Control
Enterprise Process or Policy Issues
ET Actions Requiring Direction or Creating Issues
Summary Action Items Countermeasures @ True North
IMPACT
LOE
Action Item Responsible PersonHow
A3 / Event / JDI) Completion Date Status
Network sign-off card - new grad leadership Ray 2/15
Ongoing closed-loop forecast updates Chad 2/16
Enterprise SOFP Rihbe 1/19
Contracts - how to handle customer directed suppliers Chad / Dave M 2/16
Functional excellence vs. location TPOCs Tom / Steve R
Enterprise Mission Control Act
1 32
1 ACT- Participants include ET, GMs, VS and Functional - Objective is to ACT on items critical to ENTERPRISE
sustainability and annual commitments- Inputs = LOB True North issues, enterprise processes
and policies (WBS), external issues beyond LOB control and ET actions
- Outputs = authorization to investigate a cause that would warrant a change in strategy and/or impact
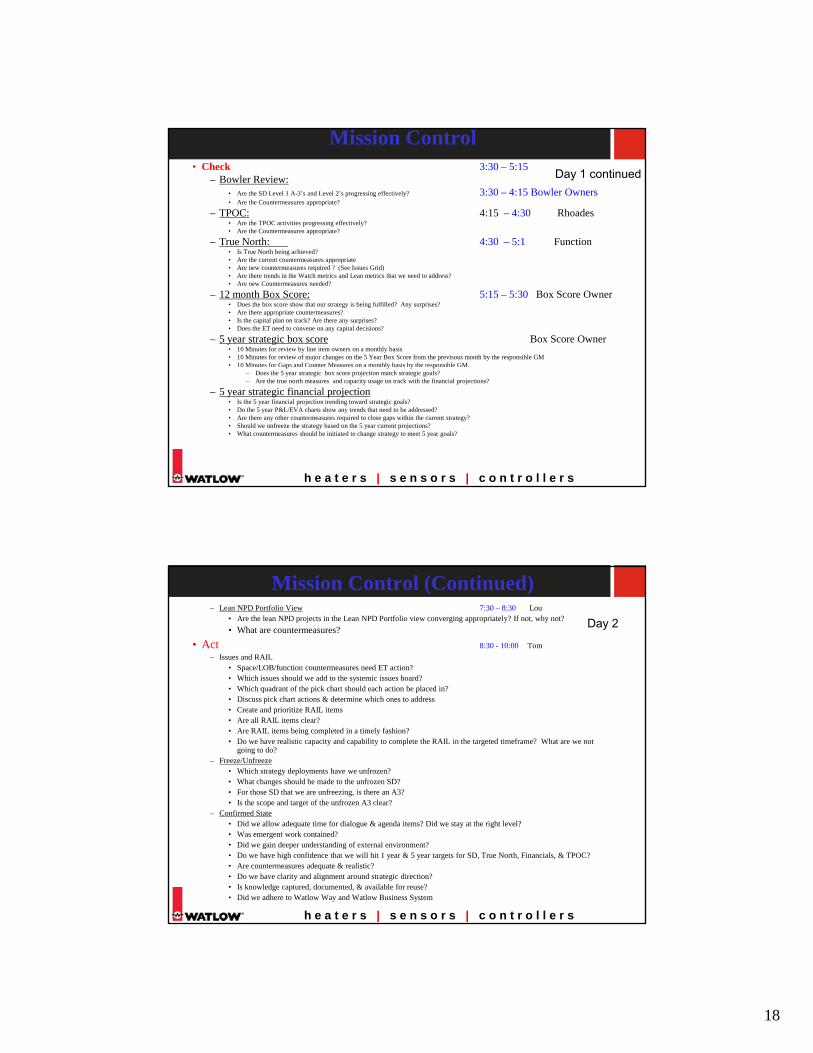
ReflectionsMission Control Improvements
What went well? What hindered?
What worked? What didn’t work?
What actionsresult?
ACT Key Points/Philosophy:Address systemic, big and external issuesAddress ENTERPRISE processes and policiesManage strategy and emergent work as new information
would warrant a change in strategy and/or impact True North
2 RAIL- Participants include ET, GMs, VS and Functional - Objective is to capture salent items- Inputs =action items and relavent owners- Outputs = solution approach and completion status3 FREEZE / UNFREEZE- Participants include ET, GMs, VS and Functional - Objective is to validate new information's impact on
ENTERPRISE strategy- Inputs = strategy deployment, market forces and
macroeconomic influencesO t t d i i t "h ld" i ti di ti " lt "
4
h e a t e r s | s e n s o r s | c o n t r o l l e r s
Manage strategy and emergent work as new information becomes availableCapture and reflect ENTERPRISE learning’s
- Outputs = decision to "hold" existing direction or "alter" the course
4 REFLECTION / MISSION CONTROL IMPROVEMENTS- Participants include ET, GMs, VS, Functional leaders
and all ENTERPRISE members- Objective is to disperse learnings and continually
improve- Inputs = things to reflect on and items to improve
upon- Outputs = ENTERPRISE learnings and MC improvementsOWNER: President
USERS: Mission Control Participants
15
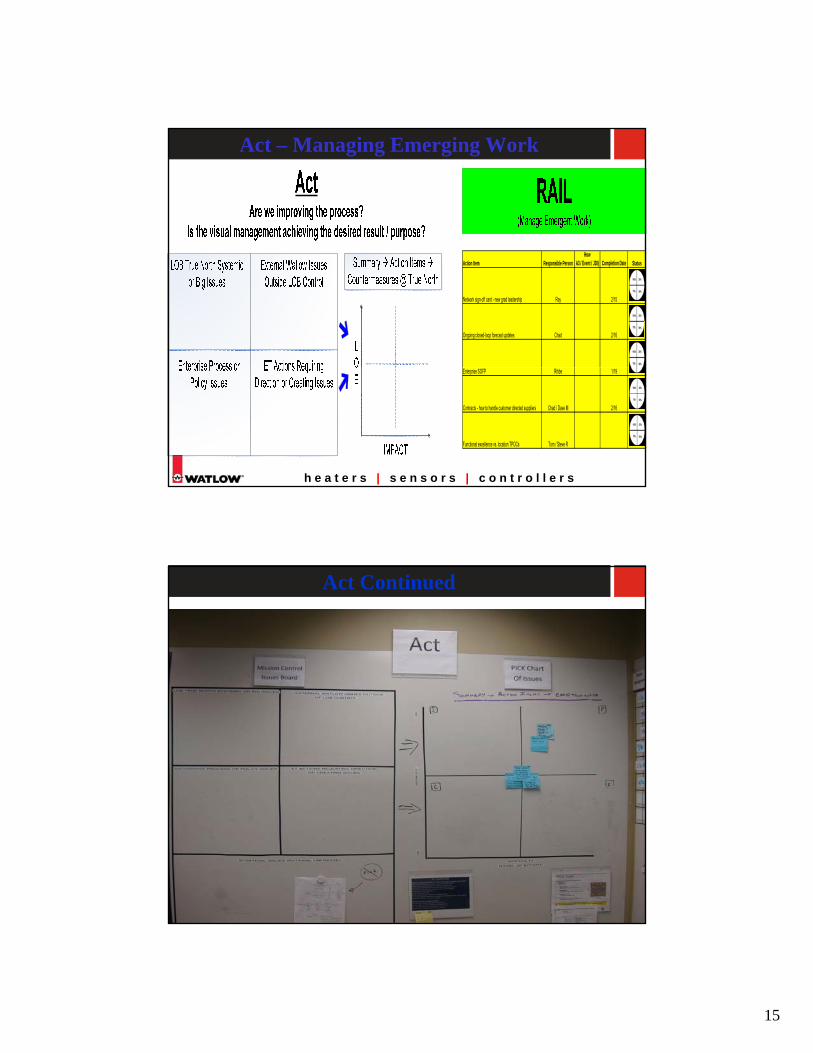
Act – Managing Emerging Work
Action Item Responsible PersonHow
A3 / Event / JDI) Completion Date Status
Network sign-off card - new grad leadership Ray 2/15
Ongoing closed-loop forecast updates Chad 2/16
h e a t e r s | s e n s o r s | c o n t r o l l e r s
Enterprise SOFP Rihbe 1/19
Contracts - how to handle customer directed suppliers Chad / Dave M 2/16
Functional excellence vs. location TPOCs Tom / Steve R
Act Continued
h e a t e r s | s e n s o r s | c o n t r o l l e r s
16
Act Continued - RAIL
h e a t e r s | s e n s o r s | c o n t r o l l e r s
Mission Control Reflections and Unfreeze Box
h e a t e r s | s e n s o r s | c o n t r o l l e r s
17
Act Continued – MC Reflections & Improvement
h e a t e r s | s e n s o r s | c o n t r o l l e r s
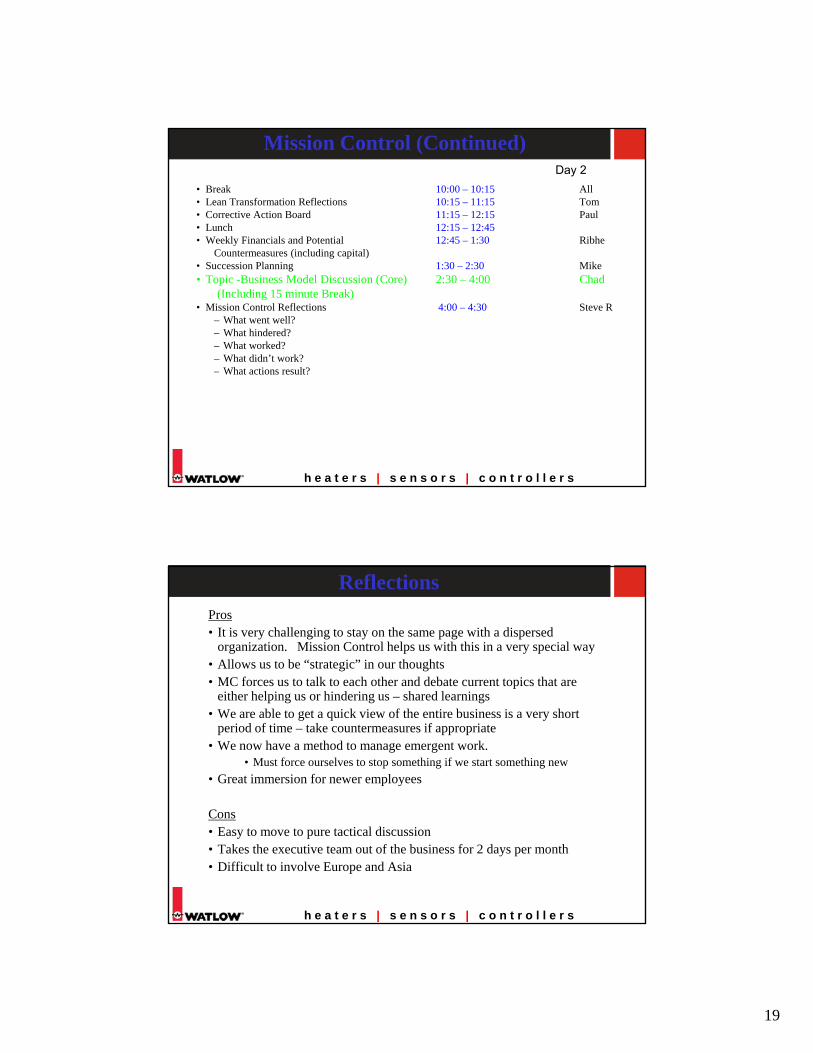
Enterprise Mission Control Agenda• Monthly Topic – ITR 8:00 – 10:30 Tom F• Break 10:30 – 10:45 All• Listening Post 10:45 – 11:30 Rich
– What does the Listening Post tell us?– Are there any of these that we need to post in one of the PDCA sections or on the Issues Grid today?– Is there anything that would lead us to believe that our strategy should be revisited?– Upon reflection, what have we learned or understood better from our review of the Listening Post
• Plan 11:30 – 1:30 Rich– Space Updates
Day 1
– Space Updates• What changes to our strategy occurred as a result from last month’s Mission Control Freeze/Unfreeze process?*********(15 min for each Space per month, w/ 1 deep dive/mo)
– Diesel (20 minutes) 11:30 – 11:50 Greg/Jeff– Energy Process (20 minutes) 11:50 – 12:10 Kevin/Dennis
• Lunch 12:10 – 12:45– Semi 12:45 – 1:30 Rob/Ray
– Space Deep Dive (1 per quarter)
– LAMP 1:30 – 2:00 Acct Mgr(every month, go through 2 of these - 15 minutes each – Chad to select)
• What has changed in our strategy or business environment that will impact large customers?• For each customer, what should we change in our approach or relationship?
h e a t e r s | s e n s o r s | c o n t r o l l e r s
• Do 2:00 – 3:15– What is the status of the Level 1 A-3 (Red or green)?
• What has changed since last review?• What has been learned?
– General “Do” Section Questions:• Should any SD Level 1’s be unfrozen?• What changes need to be made to Strategy Deployment?• Upon reflection, what have we learned or understood better from our review of this section?
18
Mission Control• Check 3:30 – 5:15
– Bowler Review:• Are the SD Level 1 A-3’s and Level 2’s progressing effectively? 3:30 – 4:15 Bowler Owners• Are the Countermeasures appropriate?
– TPOC: 4:15 – 4:30 Rhoades• Are the TPOC activities progressing effectively?• Are the Countermeasures appropriate?
– True North: 4:30 – 5:1 Function
Day 1 continued
• Is True North being achieved?• Are the current countermeasures appropriate• Are new countermeasures required ? (See Issues Grid)• Are there trends in the Watch metrics and Lean metrics that we need to address?• Are new Countermeasures needed?
– 12 month Box Score: 5:15 – 5:30 Box Score Owner• Does the box score show that our strategy is being fulfilled? Any surprises?• Are there appropriate countermeasures?• Is the capital plan on track? Are there any surprises?• Does the ET need to convene on any capital decisions?
– 5 year strategic box score Box Score Owner• 10 Minutes for review by line item owners on a monthly basis• 10 Minutes for review of major changes on the 5 Year Box Score from the previsous month by the responsible GM• 10 Minutes for Gaps and Counter Measures on a monthly basis by the responsible GM.
h e a t e r s | s e n s o r s | c o n t r o l l e r s
p y y p– Does the 5 year strategic box score projection match strategic goals?– Are the true north measures and capacity usage on track with the financial projections?
– 5 year strategic financial projection• Is the 5 year financial projection trending toward strategic goals?• Do the 5 year P&L/EVA charts show any trends that need to be addressed?• Are there any other countermeasures required to close gaps within the current strategy?• Should we unfreeze the strategy based on the 5 year current projections?• What countermeasures should be initiated to change strategy to meet 5 year goals?
Mission Control (Continued)– Lean NPD Portfolio View 7:30 – 8:30 Lou
• Are the lean NPD projects in the Lean NPD Portfolio view converging appropriately? If not, why not?• What are countermeasures?
• Act 8:30 - 10:00 Tom– Issues and RAIL
• Space/LOB/function countermeasures need ET action?• Which issues should we add to the systemic issues board?
Day 2
• Which quadrant of the pick chart should each action be placed in?• Discuss pick chart actions & determine which ones to address• Create and prioritize RAIL items• Are all RAIL items clear?• Are RAIL items being completed in a timely fashion?• Do we have realistic capacity and capability to complete the RAIL in the targeted timeframe? What are we not
going to do?– Freeze/Unfreeze
• Which strategy deployments have we unfrozen?• What changes should be made to the unfrozen SD?• For those SD that we are unfreezing, is there an A3?• Is the scope and target of the unfrozen A3 clear?
h e a t e r s | s e n s o r s | c o n t r o l l e r s
Is the scope and target of the unfrozen A3 clear?– Confirmed State
• Did we allow adequate time for dialogue & agenda items? Did we stay at the right level?• Was emergent work contained?• Did we gain deeper understanding of external environment?• Do we have high confidence that we will hit 1 year & 5 year targets for SD, True North, Financials, & TPOC?• Are countermeasures adequate & realistic?• Do we have clarity and alignment around strategic direction?• Is knowledge captured, documented, & available for reuse?• Did we adhere to Watlow Way and Watlow Business System
19
Mission Control (Continued)
• Break 10:00 – 10:15 All• Lean Transformation Reflections 10:15 – 11:15 Tom• Corrective Action Board 11:15 – 12:15 Paul• Lunch 12:15 – 12:45• Weekly Financials and Potential 12:45 – 1:30 Ribhe
Day 2
Countermeasures (including capital)• Succession Planning 1:30 – 2:30 Mike• Topic -Business Model Discussion (Core) 2:30 – 4:00 Chad
(Including 15 minute Break)• Mission Control Reflections 4:00 – 4:30 Steve R
– What went well?– What hindered?– What worked?– What didn’t work?
h i l ?
h e a t e r s | s e n s o r s | c o n t r o l l e r s
– What actions result?
ReflectionsPros• It is very challenging to stay on the same page with a dispersed
organization. Mission Control helps us with this in a very special way• Allows us to be “strategic” in our thoughts • MC forces us to talk to each other and debate current topics that areMC forces us to talk to each other and debate current topics that are
either helping us or hindering us – shared learnings• We are able to get a quick view of the entire business is a very short
period of time – take countermeasures if appropriate• We now have a method to manage emergent work.
• Must force ourselves to stop something if we start something new• Great immersion for newer employees
h e a t e r s | s e n s o r s | c o n t r o l l e r s
Cons• Easy to move to pure tactical discussion• Takes the executive team out of the business for 2 days per month• Difficult to involve Europe and Asia
Related Documents