Next Presentation: An Easy Route to a Missing Data Report with ODS+PROC FREQ+A Data Step Presenter: Mike Zdeb Mike is an assistant professor in the epidemiology & biostatistics department at the U@Albany School of Public Health in Rensselaer, NY. He's been a SAS user for 20+ years and has presented papers at SUGI, SAS Global Forums, NESUG, and numerous local user groups. Mike has written a SAS Press book, Mapping Made Easy Using SAS, and has been a reviewer for a number of SAS Press books.

Welcome message from author
This document is posted to help you gain knowledge. Please leave a comment to let me know what you think about it! Share it to your friends and learn new things together.
Transcript
Next Presentation: An Easy Route to a Missing Data Report with ODS+PROC FREQ+A Data Step
Presenter: Mike Zdeb
Mike is an assistant professor in the epidemiology &biostatistics department at the U@Albany School ofPublic Health in Rensselaer, NY. He's been a SAS user for20+ years and has presented papers at SUGI, SAS GlobalForums, NESUG, and numerous local user groups. Mikehas written a SAS Press book, Mapping Made EasyUsing SAS, and has been a reviewer for a number of SASPress books.

2
INTRODUCTION
# ONE OF FIRST STEPS IN DATA ANALYSIS ... A DECISIONON HOW TO HANDLE MISSING VALUES
DELETE OBSERVATIONS WITH EXCESS MISSING DATA
DELETE VARIABLES WITH EXCESS MISSING DATA
SUBSTITUTE IMPUTED VALUES FOR MISSING VALUES
TAKE NO ACTION AT ALL IF THE AMOUNT OF MISSING DATA ISINSIGNIFICANT AND NOT LIKELY TO AFFECT THE ANALYSIS
3
# DECISION FACILITATED BY KNOWING THE AMOUNTOF MISSING DATA
# USE AN ODS OUTPUT STATEMENT, PROC FREQ, ANDSOME DATA STEP PROGRAMMING
PRODUCE A MISSING DATA REPORT SHOWING THEPERCENTAGE OF MISSING DATA FOR EACH VARIABLE IN ADATA SET
IDENTIFY AND DROP ALL VARIABLES/OBSERVATIONS WITHEITHER ALL OR A HIGH PERCENTAGE OF MISSING VALUES

4
MAKE SOME DATA FOR EXAMPLES
# USE SASHELP.CLASS ...
* EXAMPLE 1;data class;set sashelp.class;if ranuni(987) le .5;if ranuni(987) le .2 then call missing(weight);if ranuni(987) le .1 then call missing(sex, age);run;

5
REVIEW
# PROC FREQ DEFAULT
proc freq data=class;run;
# TABLES OF ALL VARIABLES
# COUNTS (NO PERCENTAGES) OF MISSING DATA
6
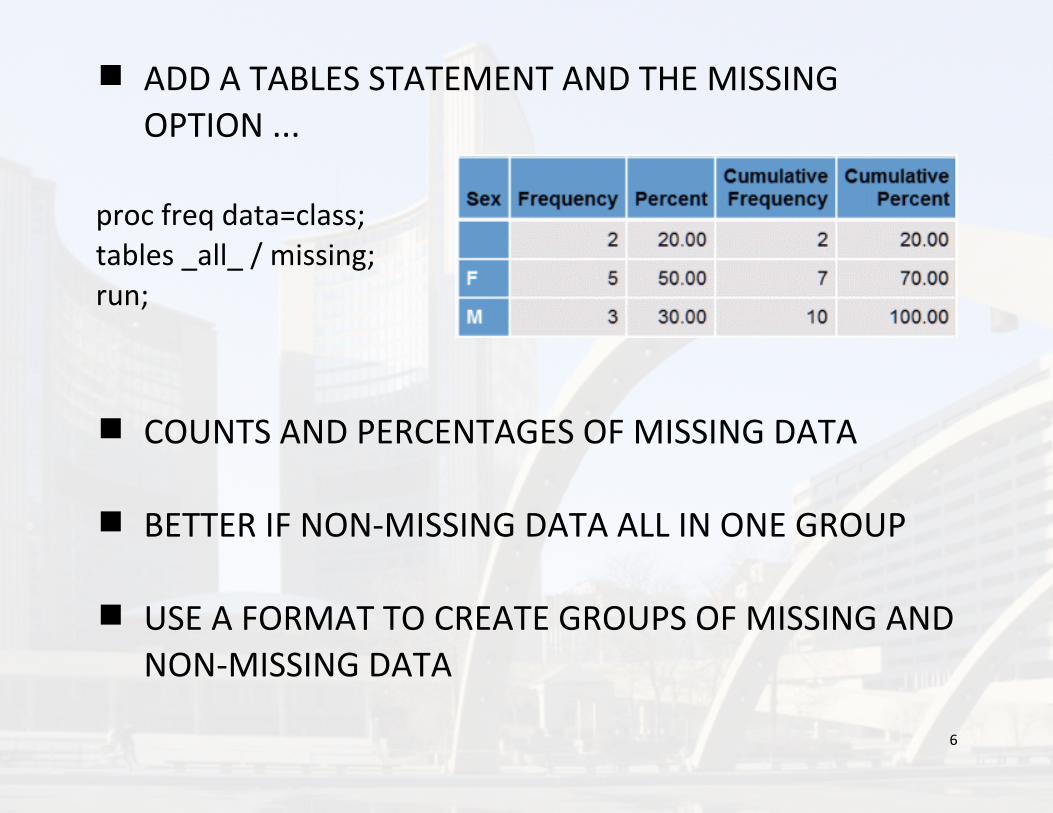
# ADD A TABLES STATEMENT AND THE MISSINGOPTION ...
proc freq data=class;tables _all_ / missing;run;
# COUNTS AND PERCENTAGES OF MISSING DATA
# BETTER IF NON‐MISSING DATA ALL IN ONE GROUP
# USE A FORMAT TO CREATE GROUPS OF MISSING ANDNON‐MISSING DATA
7
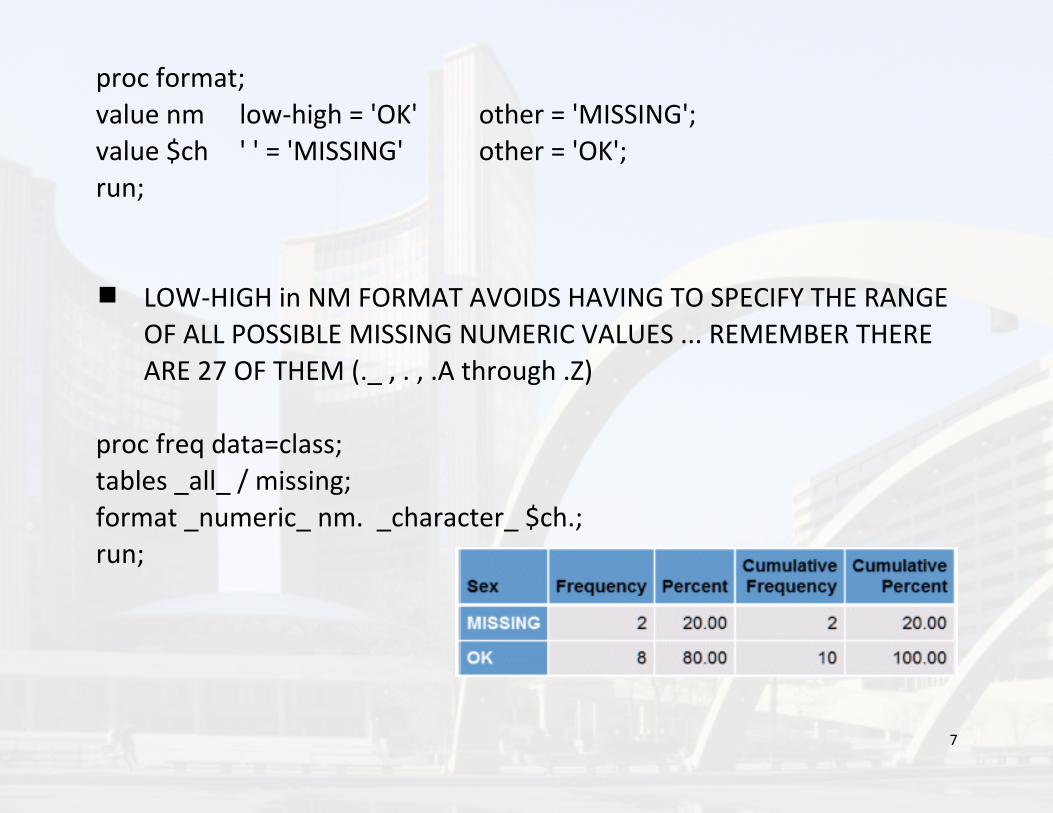
proc format;value nm low‐high = 'OK' other = 'MISSING';value $ch ' ' = 'MISSING' other = 'OK';run;
# LOW‐HIGH in NM FORMAT AVOIDS HAVING TO SPECIFY THE RANGEOF ALL POSSIBLE MISSING NUMERIC VALUES ... REMEMBER THEREARE 27 OF THEM (._ , . , .A through .Z)
proc freq data=class;tables _all_ / missing;format _numeric_ nm. _character_ $ch.;run;

8
# OK FOR A DATA SET WITH ONLY FEW VARIABLES
# WRITE RESULTS TO A DATA SET ...FORMATTED
proc freq data=class;tables _all_ / noprint missing out=tables;format _numeric_ nm. _character_ $ch.;run;
UNFORMATTED# DOES NOT WORK ... ONLY THE
LAST VARIABLE IS IN THE OUTPUTDATA SET (WEIGHT)
9
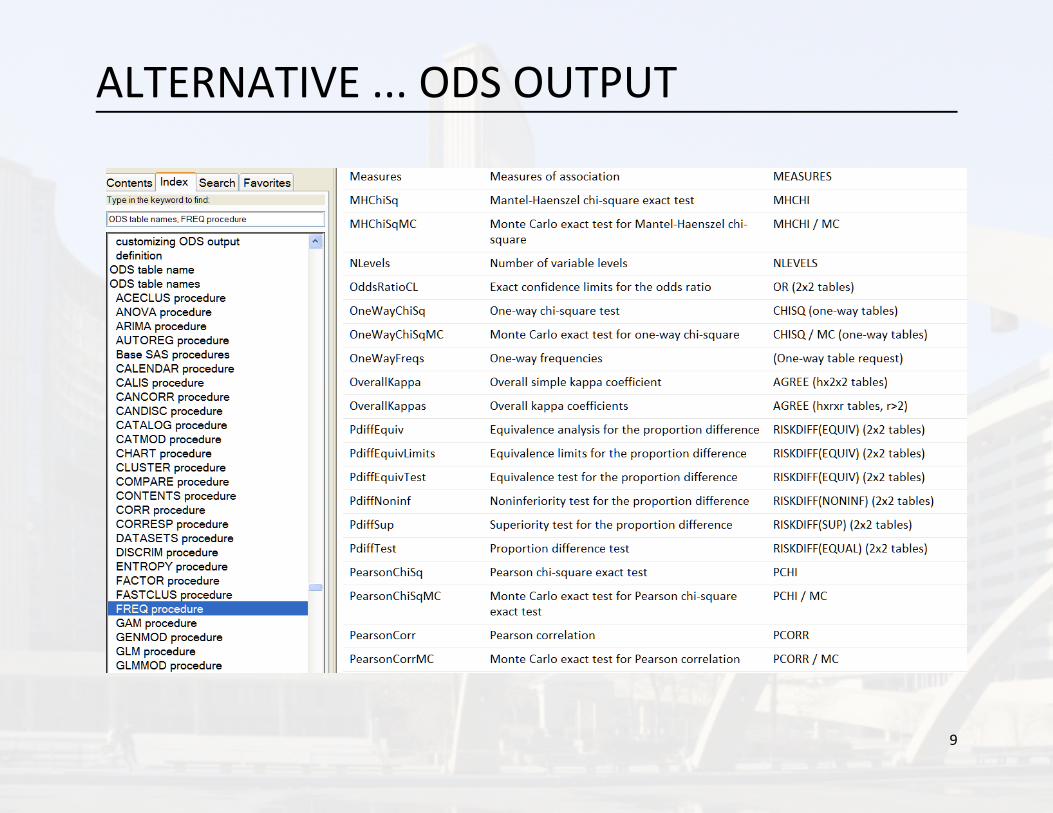
ALTERNATIVE ... ODS OUTPUT

10
CREATE DATA SET ... TABLES
proc format;value nm low‐high = '1' other = '0';value $ch ' ' = '0' other = '1';run;
ods listing close;ods output onewayfreqs=tables;
proc freq data=class;tables _all_ / missing;format _numeric_ nm. _character_ $ch.;run;
ods output close;ods listing;

11
# TABLE OF ALL VARIABLES
# "F_" VARIABLES HAVE FORMATTED VALUES (0, 1)

12
# CHANGE ODS OUTPUT STATEMENT ...
ods output onewayfreqs=tables (keep=table frequency percent f_:);

13
ADD A DATA STEP
data report;length var $32; do until (last.table);
set tables; by table notsorted;
array names(*) f_: ; select (names(_n_)); when ('0') do; miss = frequency; p_miss = percent); end; when ('1') do; ok = frequency; p_ok = percent; end;
end;end;

14
miss + 0; /* change missing values to zero */pmiss + 0;ok + 0;p_ok + 0;var = scan(table,‐1);
format miss ok comma7. p_: 5.1 ;label miss = 'N_MISSING'
ok = 'N_OK'p_miss = '%_MISSING'p_ok = '%_OK'var = 'VARIABLE';
keep var miss ok p_: ; run;
15
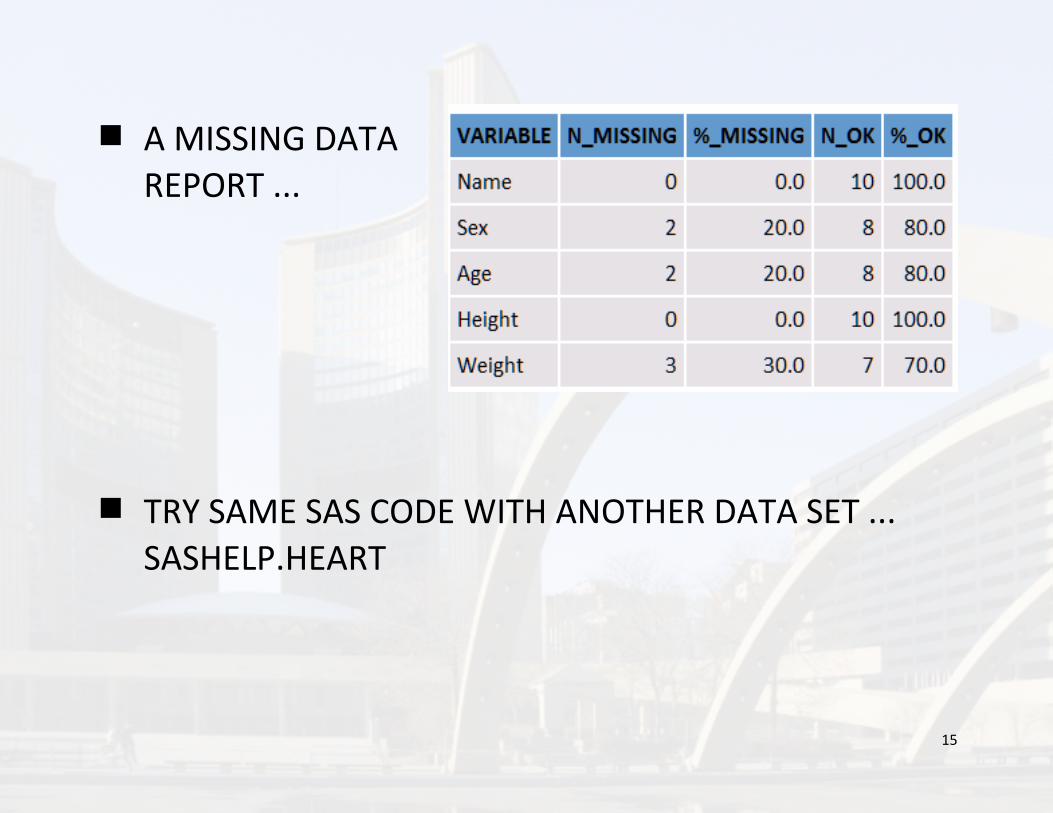
# A MISSING DATAREPORT ...
# TRY SAME SAS CODE WITH ANOTHER DATA SET ...SASHELP.HEART

16
# THE SAS CODE IS"GENERIC"
# THE ONLY CHANGE ISTHE NAME OF THEDATA SET

17
ADD VARIABLE LABELS
# CHANGE THE LENGTH STATEMENT AT THE TOP OFTHE DATA STEP ...
length var $32 label $100;
# ADD A STATEMENT ...
var = scan(table,‐1);* new statement;label = vlabelx(var);keep var label miss ok p_: ;

18
19
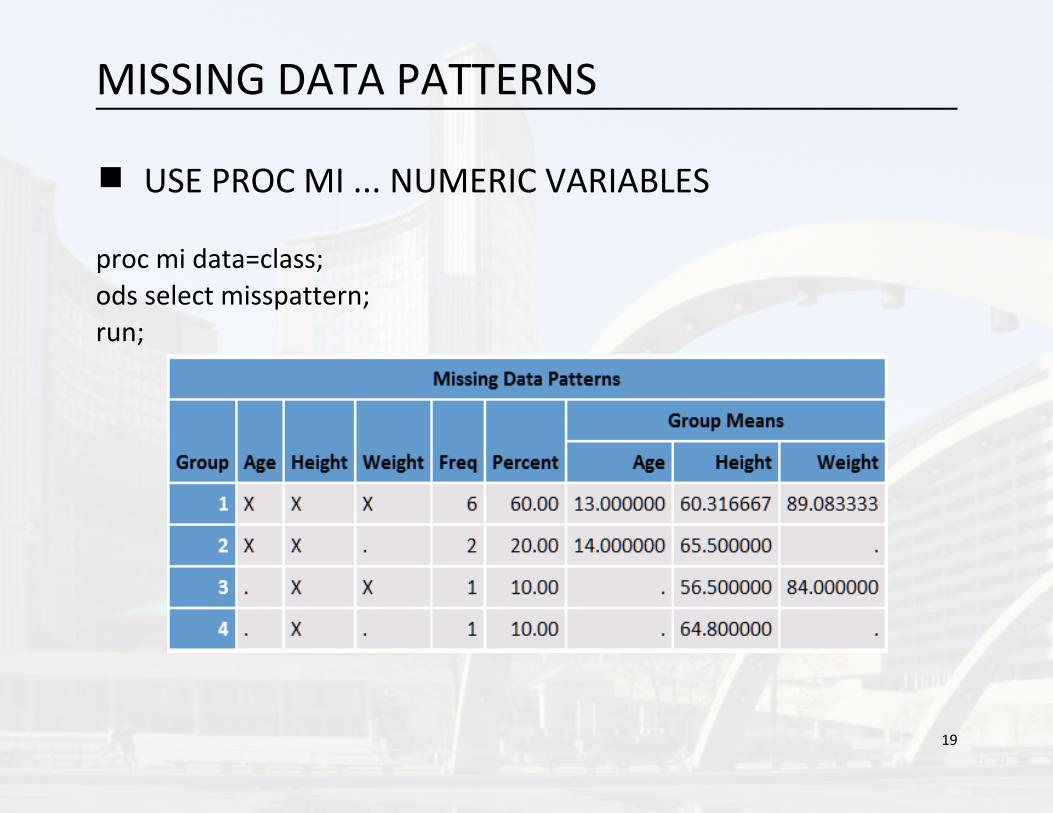
MISSING DATA PATTERNS
# USE PROC MI ... NUMERIC VARIABLES
proc mi data=class;ods select misspattern;run;

20
# USE PROC FREQ WITH A LIST OPTION ... ALL VARS
proc format;value nm low‐high = 'X' other = '.'; value $ch ' ' = '.' other = 'X';run;
proc freq data=class;table Name*Sex*Age*Height*Weight / list missing nocum;format _numeric_ nm. _character_ $ch.;run;
21
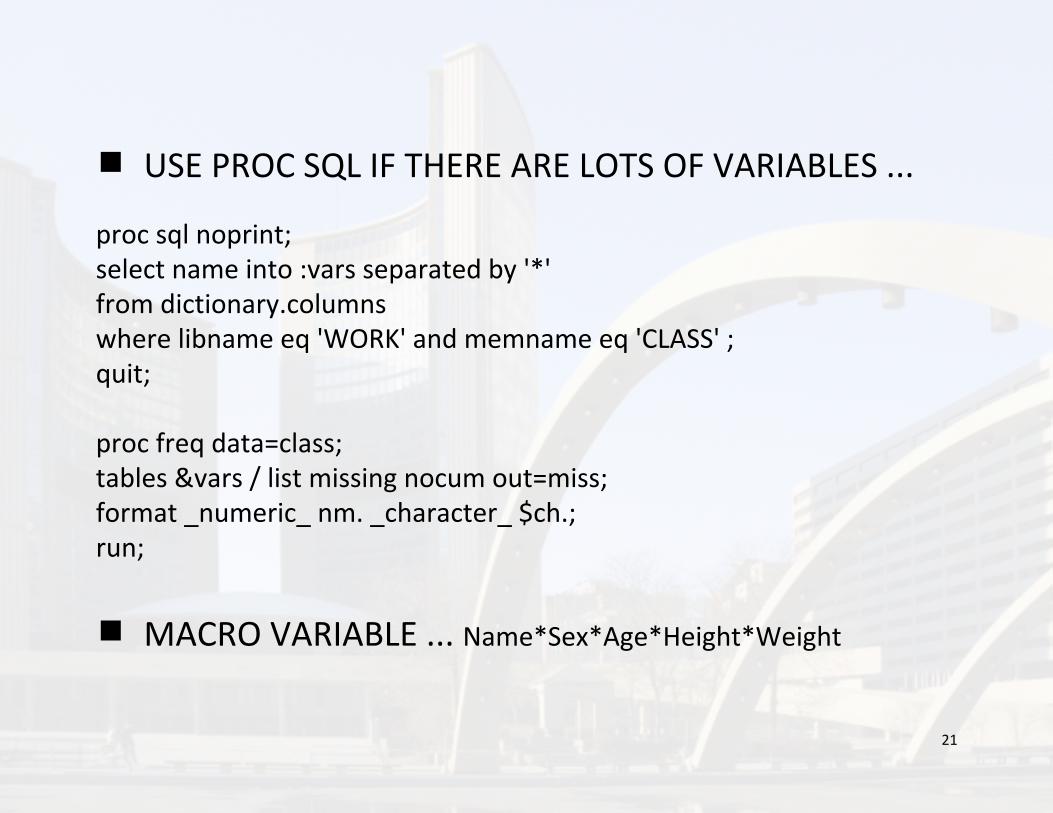
# USE PROC SQL IF THERE ARE LOTS OF VARIABLES ...
proc sql noprint;select name into :vars separated by '*'from dictionary.columnswhere libname eq 'WORK' and memname eq 'CLASS' ;quit;
proc freq data=class;tables &vars / list missing nocum out=miss;format _numeric_ nm. _character_ $ch.;run;
# MACRO VARIABLE ... Name*Sex*Age*Height*Weight
22
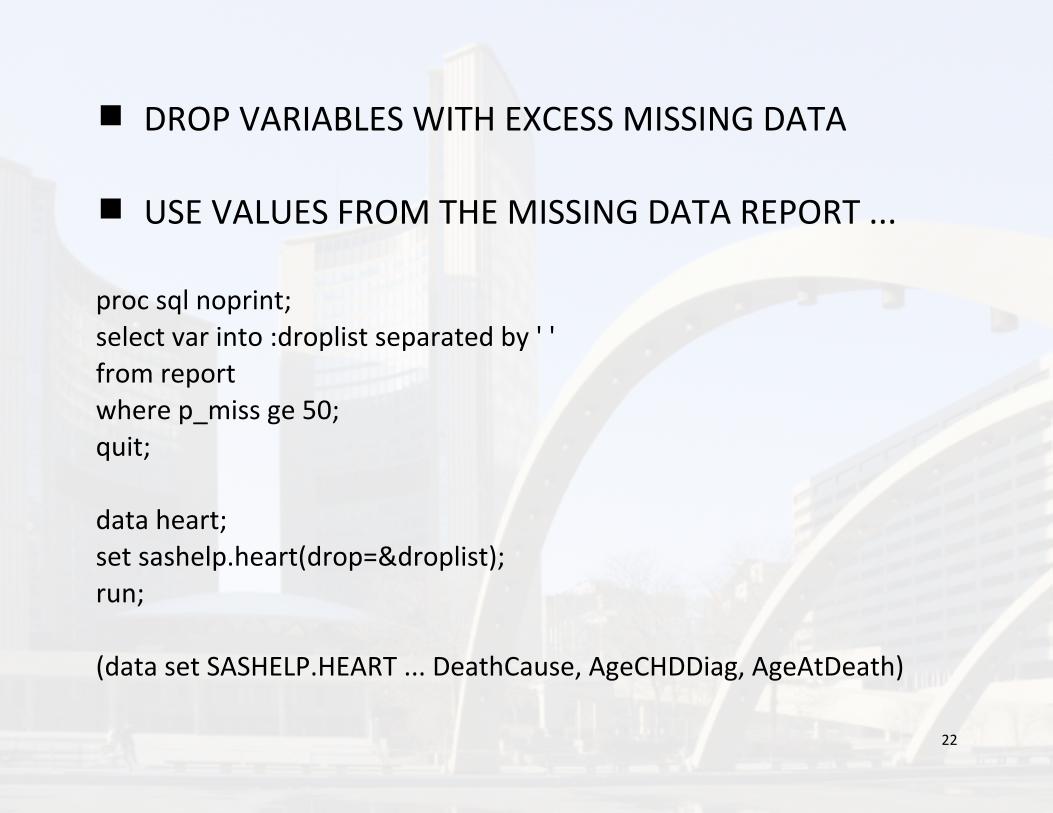
# DROP VARIABLES WITH EXCESS MISSING DATA
# USE VALUES FROM THE MISSING DATA REPORT ...
proc sql noprint;select var into :droplist separated by ' 'from report where p_miss ge 50;quit;
data heart;set sashelp.heart(drop=&droplist);run;
(data set SASHELP.HEART ... DeathCause, AgeCHDDiag, AgeAtDeath)
23
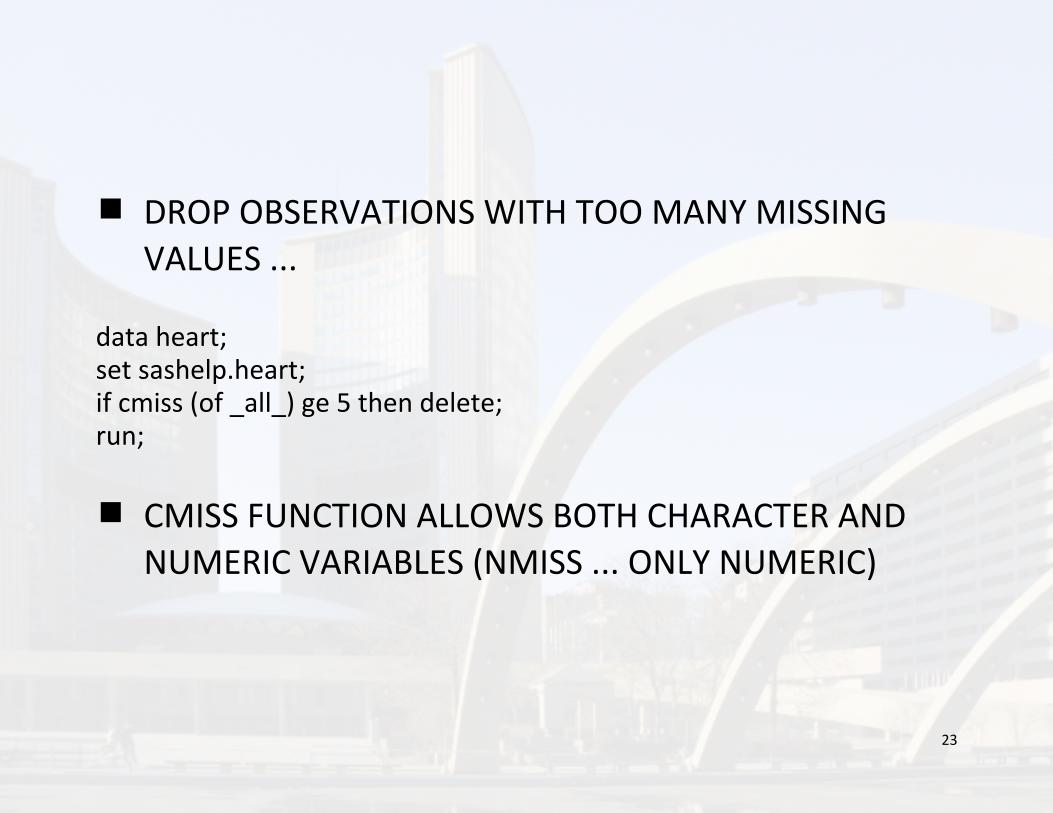
# DROP OBSERVATIONS WITH TOO MANY MISSINGVALUES ...
data heart;set sashelp.heart;if cmiss (of _all_) ge 5 then delete;run;
# CMISS FUNCTION ALLOWS BOTH CHARACTER ANDNUMERIC VARIABLES (NMISS ... ONLY NUMERIC)
24
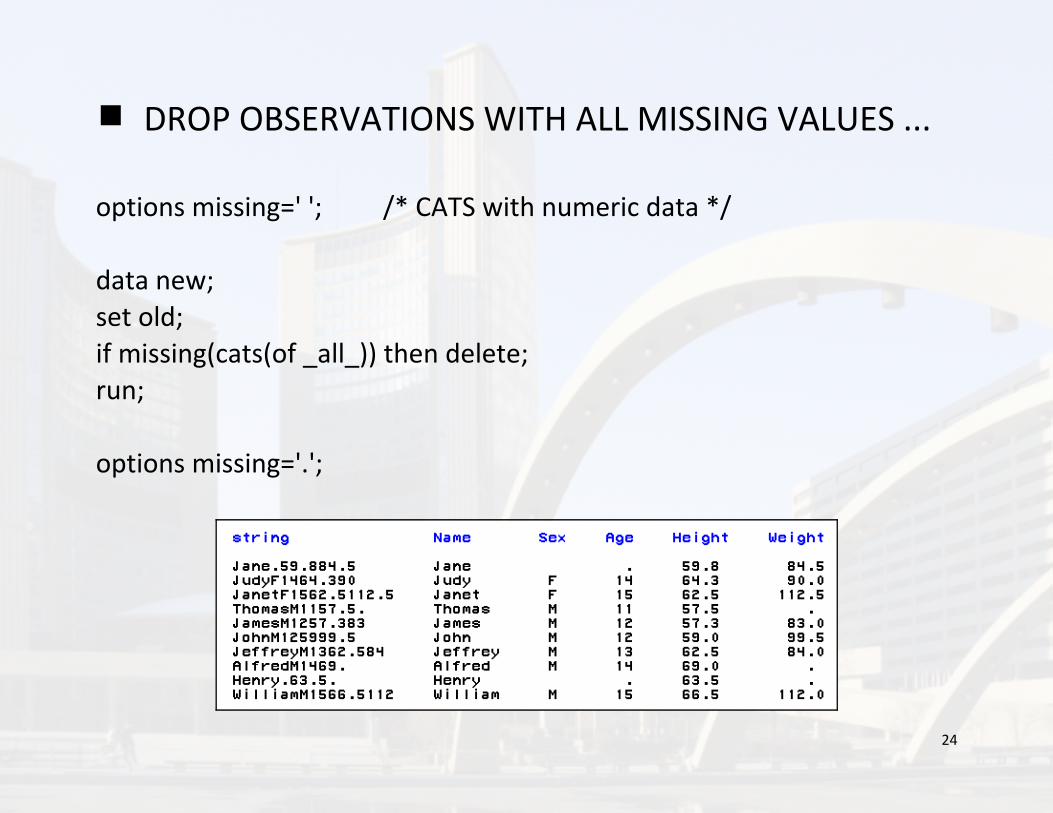
# DROP OBSERVATIONS WITH ALL MISSING VALUES ...
options missing=' '; /* CATS with numeric data */
data new;set old;if missing(cats(of _all_)) then delete;run;
options missing='.';
25
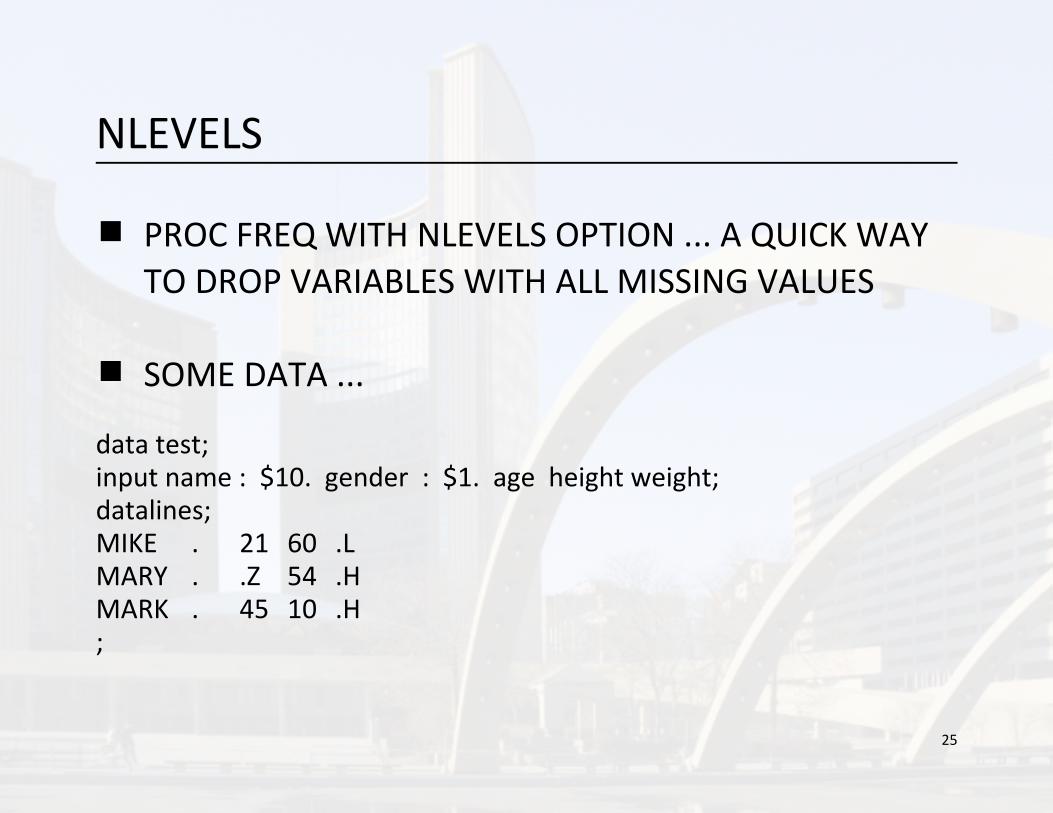
NLEVELS
# PROC FREQ WITH NLEVELS OPTION ... A QUICK WAYTO DROP VARIABLES WITH ALL MISSING VALUES
# SOME DATA ...
data test;input name : $10. gender : $1. age height weight;datalines;MIKE . 21 60 .LMARY . .Z 54 .HMARK . 45 10 .H;
26
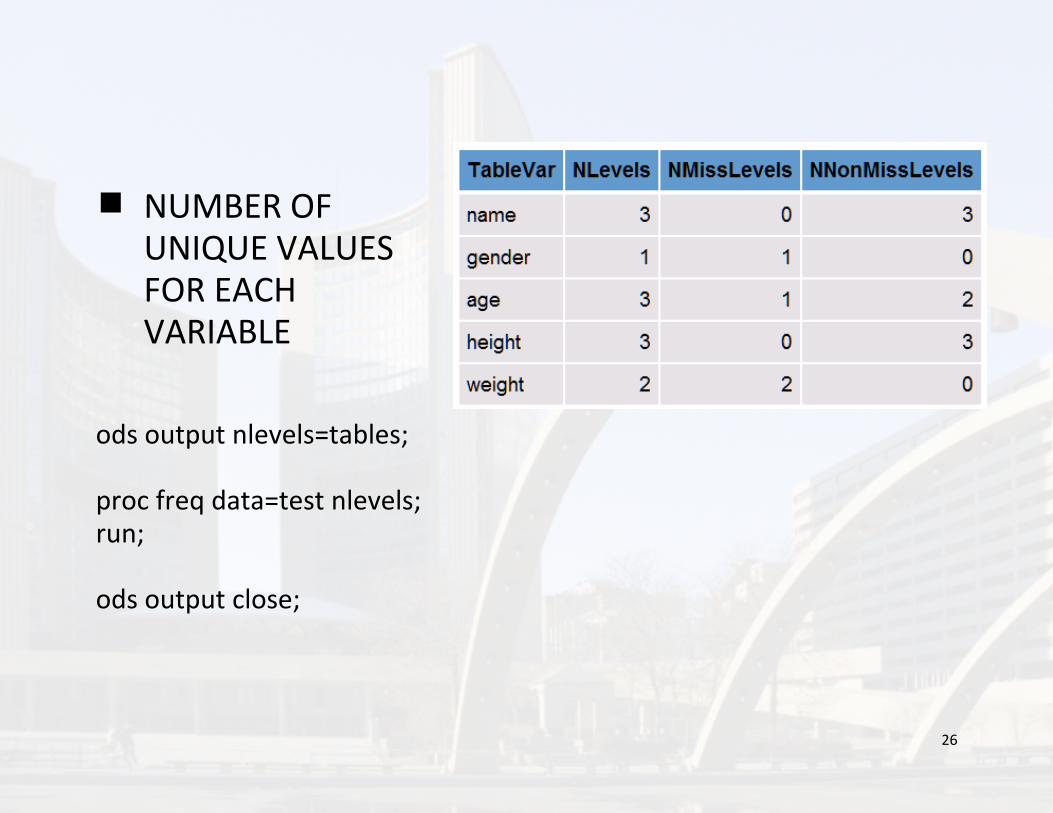
# NUMBER OFUNIQUE VALUESFOR EACHVARIABLE
ods output nlevels=tables;
proc freq data=test nlevels;run;
ods output close;
27
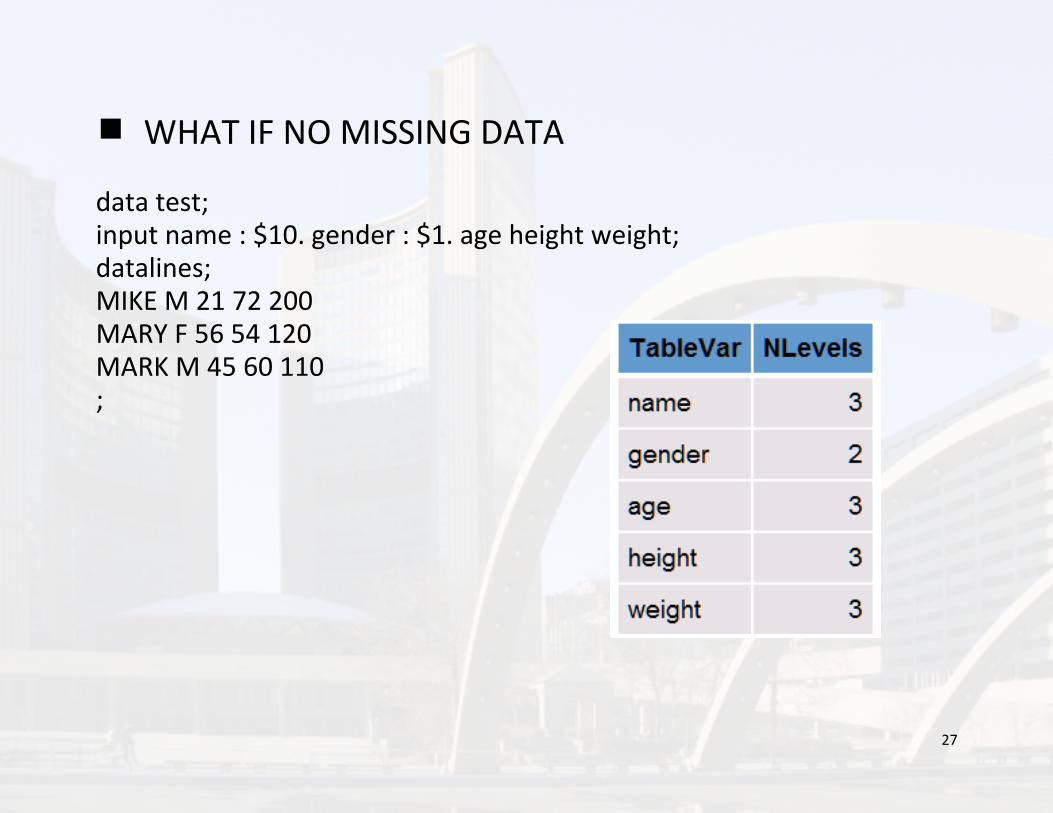
# WHAT IF NO MISSING DATA
data test;input name : $10. gender : $1. age height weight;datalines;MIKE M 21 72 200MARY F 56 54 120MARK M 45 60 110;
28
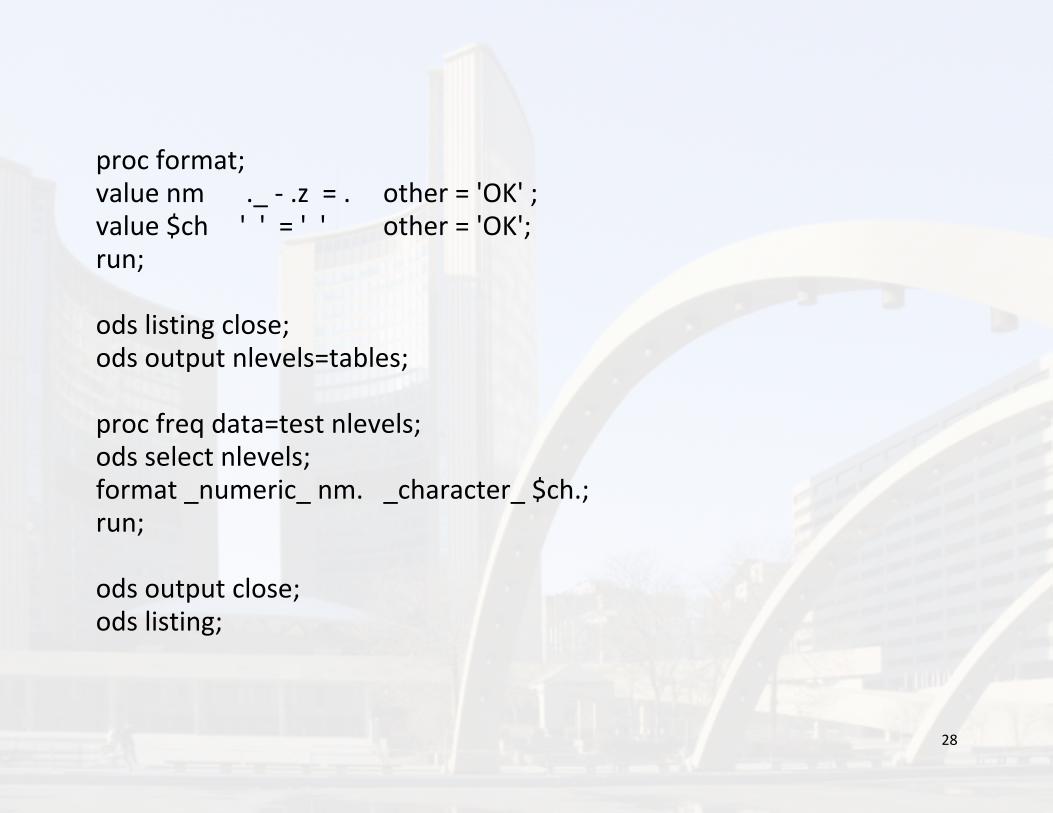
proc format; value nm ._ ‐ .z = . other = 'OK' ;value $ch ' ' = ' ' other = 'OK';run;
ods listing close; ods output nlevels=tables;
proc freq data=test nlevels; ods select nlevels;format _numeric_ nm. _character_ $ch.;run;
ods output close; ods listing;

29
data tables; retain nnonmisslevels ‐1; set tables; run;
proc sql noprint; select tablevar into :droplist separated by ' 'from tableswhere nnonmisslevels eq 0;quit;
data new;set test (drop=&droplist); run;

30
REPLACE NUMERIC MISSING WITH 0
data test;input name : $10. gender : $1. age height weight;datalines;MIKE . 21 60 .LMARY . .Z 54 .HMARK . 45 10 .H;
data test;set test;array nm(*) _numeric_;do _n_ = 1 to dim(nm); nm(_n_) + 0;end;run;

31
# THERE IS A SHORTER WAY
proc stdize data=test out=new reponly missing=0;run;
# CAN USE SAME NAME FOR OUT= ... WITH ALL VALUESMISSING YOU GET A WARNING IN THE LOG THAT HASNOTHING TO WITH THE VALUE REPLACEMENT

32
# WHAT VALUES WERE REPLACED
data test;input name : $10. gender : $1. age height weight;datalines;MIKE . 21 60 .LMARY . 0 . .HMARK . 45 10 0;
proc format;value fix low‐high='0' other='1';run;

33
filename nosee dummy;
data test;file nosee;set test;put (_numeric_) (fix.) @;missing = _file_;put;run;
proc stdize data=test out=new reponly missing=0;run;

34
CONTACT INFORMATION
www.albany.edu/~msz03www.sascommunity.org/wiki/User:Msz03
518 402 6479
Related Documents