May 19, 2000 / Vol. 49 / No. 19 U.S. DEPARTMENT OF HEALTH & HUMAN SERVICES Misdiagnoses of Tuberculosis Resulting From Laboratory Cross-Contamination of Mycobacterium Tuberculosis Cultures — New Jersey, 1998 A diagnosis of tuberculosis (TB) is rarely disputed if Mycobacterium tuberculosis is isolated from a clinical specimen; however, specimen contamination may occur (1–3 ). Identification of TB strain patterns through molecular typing or DNA fingerprinting is a recent advancement in TB laboratory techniques (3–7 ). CDC’s National Tuberculosis Genotyping and Surveillance Network (NTGSN) performs DNA fingerprinting on TB iso- lates to determine the frequency of clustering among M. tuberculosis strains in project surveillance sites. In November 1998, NTGSN detected 11 isolates from previously re- ported TB cases among persons in New Jersey whose DNA fingerprints matched the avirulent laboratory M. tuberculosis control strain H37Ra. H37Ra does not cause active TB in humans, but it has been reported as a source of cross-contamination (8 ). In collabo- ration with the New Jersey Department of Health and Senior Services, CDC investi- gated H37Ra as a possible cause of TB disease and/or TB misdiagnoses caused by laboratory cross-contamination in the 11 case-patients. This report describes findings from two of the 11 cases and summarizes the results of this investigation, which indicate that TB was misdiagnosed and demonstrate the value of DNA fingerprinting to identify occurrences of cross-contamination of patient specimens. Case Findings Case 1. In October 1998, a 44-year-old woman with multiple sclerosis and no known exposure to a person with active TB had TB diagnosed on the basis of a positive culture result. Cerebrospinal fluid revealed no signs of infection, but the culture grew M. tuber- culosis at 7 weeks. Her chest radiograph was normal, and a tuberculin skin test (TST) was not documented. Anti-TB therapy was not initiated because no development or progression of symptoms consistent with TB occurred. The cerebrospinal fluid was retested in the same laboratory (7 weeks after the original specimen was obtained) and revealed a stain with 1+ acid-fast bacilli (AFB). The patient was started on anti-TB medications. The culture for the second specimen was negative for TB. This patient had received 4 months of anti-TB treatment at the time of the investigation. Case 2. A 58-year-old woman with a history of reactive airway disease and angioedema was taken to a local emergency department with shortness of breath and cough. Her chest radiograph was normal, and a TST was not documented. A sputum specimen obtained at that time was AFB smear-negative, but M. tuberculosis culture 413 Misdiagnoses of Tuberculosis Resulting From Laboratory Cross-Contamination 416 Cause-Specific Adult Mortality: Evidence From Community-Based Surveillance — Selected Sites, Tanzania, 1992–1998 420 Prevalence of Leisure-Time and Occupational Physical Activity Among Employed Adults — U.S. 424 Notices to Readers

Welcome message from author
This document is posted to help you gain knowledge. Please leave a comment to let me know what you think about it! Share it to your friends and learn new things together.
Transcript

May 19, 2000 / Vol. 49 / No. 19
U.S. DEPARTMENT OF HEALTH & HUMAN SERVICES
Misdiagnoses of Tuberculosis Resulting From LaboratoryCross-Contamination of Mycobacterium Tuberculosis Cultures —
New Jersey, 1998
A diagnosis of tuberculosis (TB) is rarely disputed if Mycobacterium tuberculosis isisolated from a clinical specimen; however, specimen contamination may occur (1–3 ).Identification of TB strain patterns through molecular typing or DNA fingerprinting is arecent advancement in TB laboratory techniques (3–7 ). CDC’s National TuberculosisGenotyping and Surveillance Network (NTGSN) performs DNA fingerprinting on TB iso-lates to determine the frequency of clustering among M. tuberculosis strains in projectsurveillance sites. In November 1998, NTGSN detected 11 isolates from previously re-ported TB cases among persons in New Jersey whose DNA fingerprints matched theavirulent laboratory M. tuberculosis control strain H37Ra. H37Ra does not cause activeTB in humans, but it has been reported as a source of cross-contamination (8 ). In collabo-ration with the New Jersey Department of Health and Senior Services, CDC investi-gated H37Ra as a possible cause of TB disease and/or TB misdiagnoses caused bylaboratory cross-contamination in the 11 case-patients. This report describes findingsfrom two of the 11 cases and summarizes the results of this investigation, which indicatethat TB was misdiagnosed and demonstrate the value of DNA fingerprinting to identifyoccurrences of cross-contamination of patient specimens.
Case Findings
Case 1. In October 1998, a 44-year-old woman with multiple sclerosis and no knownexposure to a person with active TB had TB diagnosed on the basis of a positive cultureresult. Cerebrospinal fluid revealed no signs of infection, but the culture grew M. tuber-culosis at 7 weeks. Her chest radiograph was normal, and a tuberculin skin test (TST)was not documented. Anti-TB therapy was not initiated because no development orprogression of symptoms consistent with TB occurred. The cerebrospinal fluid wasretested in the same laboratory (7 weeks after the original specimen was obtained) andrevealed a stain with 1+ acid-fast bacilli (AFB). The patient was started on anti-TBmedications. The culture for the second specimen was negative for TB. This patient hadreceived 4 months of anti-TB treatment at the time of the investigation.
Case 2. A 58-year-old woman with a history of reactive airway disease andangioedema was taken to a local emergency department with shortness of breath andcough. Her chest radiograph was normal, and a TST was not documented. A sputumspecimen obtained at that time was AFB smear-negative, but M. tuberculosis culture
413 Misdiagnoses of TuberculosisResulting From LaboratoryCross-Contamination
416 Cause-Specific Adult Mortality:Evidence From Community-BasedSurveillance — Selected Sites,Tanzania, 1992–1998
420 Prevalence of Leisure-Time andOccupational Physical Activity AmongEmployed Adults — U.S.
424 Notices to Readers
414 MMWR May 19, 2000
Cross-Contamination of Mycobacterium Tuberculosis — Continued
was positive at 6 weeks. Although the patient had recovered after treatment for acuteasthma, she was started on anti-TB treatment. Treatment was discontinued after 2 weekswhen health-care providers determined her illness was not TB.
Summary Findings
A list of the 11 case-patients with an isolate with a fingerprint matching H37Ra wascompiled, and information on the origin of each case-specimen was obtained. Investiga-tors reviewed hospital, clinic, and health department records for each case-patient toestablish the clinical events leading to TB diagnosis. Investigators visited the laboratorieswhere the 11 specimens were processed to interview laboratory personnel about speci-men processing techniques and to review laboratory logs for mycobacterial specimentesting.
The 11 case-patients had TB diagnosed and reported during 1996–1998. Mean age ofpatients was 60 years (range: 36–81 years); eight were women, and three were humanimmunodeficiency virus (HIV)-positive. Eight cases were classified as pulmonary andthree as extrapulmonary. Seven patients had abnormal chest radiograph findings, andtwo had documented positive TSTs. All case-patients received partial or full-coursetherapy for TB; treatment durations ranged from 2 weeks to 6 months. Seven patientshad contact investigations performed; four of the 32 contacts identified were tested andtreated for latent TB infection. Each case met at least one criterion for suspectedlaboratory cross-contamination with M. tuberculosis*. In addition, each of the eight pul-monary patients had clinical courses suggestive of an illness other than TB (i.e., bacterialpneumonia [four], reactive airways disease [two], interstitial lung disease [one], andcongestive heart failure [one]).
The laboratory investigation revealed that the 11 specimens were processed duringFebruary 1996–October 1998 at four laboratories in New Jersey (three hospital labora-tories and one commercial laboratory). Each of the laboratories either used the strainH37Ra or participated in laboratory proficiency testing using H37Ra; however, labora-tory logs did not include the specific times when H37Ra was handled on the same day asany of the 11 specimens. In addition, personnel at the laboratories could not recall in-stances when the control strain may have been mishandled. The average number ofspecimens collected for AFB culture per patient was four (range: two to 12). All culture-positive patient specimens were smear-negative. Mean number of days to M. tuberculo-sis growth for patient specimens was 38 (range: 17–54 days).Reported by: K Shilkret, Z Liu, F Santos, M Dillon, ME Schulman, New Jersey Dept of Health andSenior Svcs. B Kreiswirth, P Bifani, S Moghazeh, B Mathema, Public Health Research Institute–TB Center, New York, New York. Surveillance and Epidemiology Br, Div of Tuberculosis Elimina-tion, National Center for HIV, STD, and TB Prevention; and an EIS Officer, CDC.
Editorial Note: These misdiagnosed cases of TB illustrate the need for heightenedawareness of laboratory cross-contamination with M. tuberculosis. Clinicians and healthdepartment personnel did not suspect laboratory cross-contamination in these 11 cases;therefore, this oversight would not have been detected without the use of DNA
*Suspected laboratory cross-contamination with M. tuberculosis may include at least one ofthe following: 1) patient’s clinical course is inconsistent with TB; 2) single positiveM. tuberculosis culture with no AFB seen in any specimen; 3) culture-positive specimenfrom a different patient processed or handled on the same day has an identical DNAfingerprint, and no epidemiologic connections exist between patients; 4) laboratory controlstrain has an identical fingerprint; and 5) time to growth detection is >30 days.

Vol. 49 / No. 19 MMWR 415
Cross-Contamination of Mycobacterium Tuberculosis — Continued
fingerprinting through NTGSN. The putative source of cross-contamination for the11 cases, H37Ra, is a laboratory control strain that is used weekly in some laboratoriesfor routine drug susceptibility testing. H37Ra also is distributed to mycobacteriologylaboratories as part of a biyearly proficiency testing required by the Clinical LaboratoryImprovement Amendments (9 ). The control strains for proficiency testing often areprocessed simultaneously with patient specimens, but many laboratories do not documentconsistently specific times when proficiency testing is conducted. As a result, it is difficultto prove that the control strain is the source of cross-contamination in a specific case. Inaddition, several opportunities exist for specimen carryover, spillage, or inadvertentcontamination during specimen processing, but these occurrences are difficult to discoverretrospectively. Given these obstacles in discovering cross-contamination, NTGSN hasestablished criteria for suspected laboratory cross-contamination of TB (CDC, unpublisheddata, 1998).
Reliance on clinical judgment and the presence of corroborating clinical signs andsymptoms play pivotal roles in interpreting laboratory data. Systemic symptoms of fe-ver, loss of appetite, weight loss, weakness, night sweats, and malaise are common butnot specific for TB. Other signs and symptoms vary according to the site involved. Inpulmonary TB, prolonged cough with or without sputum production, and ensuing pulmo-nary inflammation and necrosis are manifest. Chest radiograph findings of adenopathy,lung infiltrates, and pleural reaction are important correlates in the diagnosis, but thesefindings may be due to illnesses other than TB, particularly in the presence of HIV. Thesescenarios often create clinical dilemmas when initial laboratory data support a TB diag-nosis. A positive TST is evidence for TB, but the positive predictive value depends on thecut-off value used to determine a positive test and the prevalence of TB infection in thepopulation (10 ). In the appropriate clinical setting, the presence of a positive AFB smearshould raise suspicion for TB; however, a positive smear with a concomitant inconsistentclinical history may represent the presence of H37Ra, a nontuberculous organism, suchas Mycobacterium avium complex, or environmental contamination with a ubiquitousacid-fast species such as Mycobacterium gordonae. H37Ra and nontuberculous organ-isms are indistinguishable from pathogenic strains of M. tuberculosis on a laboratorysmear.
For some patients, signs, symptoms, and test results are lacking or conflicting, asillustrated by the case-patients described in this report. If discrepancies exist amongclinical and laboratory data, and at least one criterion for laboratory cross-contaminationis met, an investigation should ensue to determine whether the patient has a potential TBexposure, whether specimens from the laboratory strain or other TB patients were pro-cessed simultaneously with the specimen in question, and whether performance of DNAfingerprinting is appropriate. To identify occurrences and sources of cross-contamina-tion, it also is important for mycobacteriology laboratories to determine the DNA finger-print pattern of the M. tuberculosis control strain used in their respective laboratories.
The patients described in this report received unnecessary treatment for TB andmore than half had a contact investigation initiated. Recognition by health-care profes-sionals and laboratorians of the potential for laboratory cross-contamination with M.tuberculosis should help avert erroneous TB diagnoses and avoid unnecessary treat-ment and associated toxicity. In addition, this awareness assists TB-control programs inavoiding unnecessary patient care costs and futile contact investigations and helps main-tain accurate TB case reporting.
416 MMWR May 19, 2000
Cross-Contamination of Mycobacterium Tuberculosis — Continued
References1. Maurer S, Kreiswirth B, Burns J, et al. Mycobacterium tuberculosis specimen contamina-
tion revisited: the role of laboratory environmental control in a pseudo-outbreak. InfectControl Hosp Epid 1998;19:101–5.
2. Dunlap N, Harris R, Benjamin W, et al. Laboratory contamination of Mycobacterium tuber-culosis cultures. Am J Respir Crit Care Med 1995;152:1702–4.
3. Braden C, Templeton G, Stead W, et al. Retrospective detection of laboratory cross-contamination of Mycobacterium tuberculosis cultures with the use of DNA fingerprintanalysis. Clin Infect Dis 1997;24:35–40.
4. Small P, Hopewell P, Singh S, et al. The epidemiology of tuberculosis in San Francisco: apopulation-based study using conventional and molecular methods. N Engl J Med1994;330:1703–9.
5. Alland D, Kalkut G, Moss A, et al. Transmission of tuberculosis in New York City: ananalysis by DNA fingerprinting and conventional epidemiologic methods. N Engl J Med1994;330:1710–6.
6. French A, Welbel S, Dietrich S, et al. Use of DNA fingerprinting to assess tuberculosisinfection control. Ann Intern Med 1998;129:856–61.
7. Braden C, Templeton G, Cave M, et al. Interpretation of restriction length polymorphismanalysis of Mycobacterium tuberculosis isolates from a state with a large rural popula-tion. J Infect Dis 1997;175:1446–528.
8. Burman W, Stone B, Reves R, et al. The incidence of false-positive cultures for Mycobac-terium tuberculosis. Am J Respir Crit Care Med 1997;155:321–6.
9. CDC. Laboratory practices for diagnosis of tuberculosis—United States, 1994. MMWR1995;44:586–9.
10. American Thoracic Society. Diagnostic standards and classification of tuberculosis inadults and children. Am J Respir Crit Care Med 2000;161:1376–95.
Cause-Specific Adult Mortality:Evidence From Community-Based Surveillance —
Selected Sites, Tanzania, 1992–1998
Mortality data are a standard information resource to guide public health action.Because Tanzania did not have a representative mortality surveillance system, in 1992the Adult Morbidity and Mortality Project (AMMP)* was established by the MuhimbiliUniversity College of Health Sciences, the Ministry of Health of Tanzania (MOH), and theUniversity of Newcastle upon Tyne, United Kingdom. The purpose of the surveillancesystem is to provide cause-specific death rates among adults in three areas of Tanzaniaand to link community-based mortality surveillance to evidence-based planning for healthcare. This report describes the results of AMMP surveillance during 1992–1998, whichindicated that human immunodeficiency virus infection/acquired immunodeficiency syn-drome (HIV/AIDS) was the leading cause of death reported by decedents’ relatives andcaretakers for adults of both sexes in all study areas, and suggests that a range of othercauses of death exist across the three surveillance sites.
The AMMP surveillance project was conducted in a low-income and in a middle-income section of the city of Dar es Salaam, which is part of a region ranked by the
*AMMP is a project of the Ministry of Health of Tanzania, is funded by the Department forInternational Development, United Kingdom, and is implemented in partnership with theUniversity of Newcastle upon Tyne, United Kingdom.

Vol. 49 / No. 19 MMWR 417
Mortality in Tanzania — Continued
Tanzanian government among the 50% most deprived in Tanzania (i.e., Morogoro RuralDistrict in Morogoro Region), and in part of a region ranked as one of the 15% leastdeprived (i.e., Hai District in Kilimanjaro Region) (1 ). These areas were selected to com-pare urban with rural conditions and high-income with low-income conditions. Populationdenominators were determined by semi-annual census rounds in Dar es Salaam andannual census rounds in Morogoro Rural and Hai. Mortality monitoring was conductedby trained volunteers who reported deaths to a team of supervisors. Supervisors thenconducted “verbal autopsy” interviews with the decedents’ relatives and caretakers todetermine the cause of death (2 ). Family and caretakers were used as sources to deter-mine cause of death because up to 80% of deaths occur outside health facilities and mostdeaths are not medically certified (3 ). The interviews usually occurred within a month ofa supervisor’s receipt of the death report (4 ). The completed interview forms were codedby three physicians using the International Classification of Diseases and Related HealthProblems, 10th Revision (3–5 ).
During 1992–1998, 10,517 persons aged 15–59 years died in the three locations; acause of death was assigned by AMMP in 95% of cases. Death rates per 100,000 popu-lation were calculated for persons aged 15–59 years and for men and women by studyarea. Cause-specific death rates were calculated for persons aged 15–59, 15–29, 30–44,and 45–59 years, by sex, and by study area; probability of death by age 60 years at age15 years was calculated by sex and study area. Death rates were standardized to WorldHealth Organization standard populations (6 ). The probability of death by age 60 years atage 15 years was 45% for women and 42% for men in Dar es Salaam, 43% for womenand 51% for men in Morogoro Rural, and 26% for women and 37% for men in Hai.
In addition to indicating 6-year total death rates and death rates from the 10 leadingcauses of death for men and women (Table 1), the data reflected large variations incause-specific death by sex and geographic area and are ranked according to an age-adjusted death rate for each district; no causes of death were excluded from ranking.HIV/AIDS, tuberculosis (TB), malaria, and diarrhea were major causes of death. HIV/AIDSand TB were particularly high in Dar es Salaam, especially among women aged 15–29years (325 and 62 per 100,000, respectively) and men aged 30–59 years (1199 and 426,respectively). The HIV/AIDS death rate was 608 among men aged 30–44 years in Dar esSalaam, and the TB death rate was 232. HIV/AIDS was the leading cause of death amongpersons of both sexes aged 15–59 years; the rate ranged from 246 among men inMorogoro Rural to 534 among women in Dar es Salaam. However, stroke and TB deathrates were 3.0 and 6.7 times higher, respectively, among women in Dar es Salaam thanamong women in the other areas, and anemia death rates in Morogoro Rural were 3.0times higher than in the other districts. In Morogoro Rural, the rate of maternal mortalitywas 114, with a maternal mortality ratio of 1183 per 100,000 live births, more than eighttimes the official regional estimate (AMMP, unpublished data, 2000). Among men, ma-laria, acute diarrheal disease, and anemia death rates were 3.0, 4.3, and 21.7 timeshigher, respectively, in Morogoro Rural than in the other two districts. Stroke and cancerdeath rates for both sexes were higher in Dar es Salaam and Hai than in Morogoro Rural.Among men, injury was a substantial cause of death, and injury rates for both sexeswere higher in rural than urban areas.Reported by: PW Setel, PhD, N Unwin, MFPHM, KGMM Alberti, DPhil, Univ of Newcastle uponTyne, Newcastle upon Tyne, United Kingdom. Y Hemed, MBChB, Ministry of Health, AdultMorbidity and Mortality Project Team. Adult Morbidity and Mortality Project Team, Dar esSalaam, Tanzania.

41
8M
MW
RM
ay
19
, 20
00
Mo
rtality in Tan
zania —
Co
ntin
ued
TABLE 1. Cause-specific death rates* for 10 leading causes of death among persons aged 15–59 years†, by sex —selected sites, Tanzania, 1992–1998
15–29 30–44 45–59 TotalDar es Morogoro Dar es Morogoro Dar es Morogoro Dar es Morogoro
Sex/Cause of death Salaam Rural Hai Salaam Rural Hai Salaam Rural Hai Salaam Rural Hai
Women
HIV/AIDS 325 397 173 882 625 486 454 186 120 534 428 264Acute febrile illness§ 45 144 60 88 167 64 95 193 44 69 162 58Maternal 97 157 53 76 122 39 7 8 5 72 114 38Acute diarrheal disease¶ 38 81 13 55 157 27 67 252 63 49 141 28Pulmonary tuberculosis 62 35 8 146 101 18 147 71 32 107 64 16Cancer 10 14 15 85 59 67 149 107 169 63 48 64Injuries (intended/unintended) 29 35 45 29 60 57 55 49 59 34 46 52Stroke 8 1 6 32 28 23 218 62 49 59 22 20Anemia 7 35 4 13 84 3 15 158 4 11 77 4Pneumonia 10 22 5 16 43 7 38 77 28 18 40 10No. deaths 556 810 529 566 836 694 191 531 366 1314 2177 1589
All cause death rate 775 1024 483 1764 1663 930 1949 1520 851 1342 1336 705
Men
HIV/AIDS 154 106 95 608 451 517 591 243 273 390 246 268Injuries (intended/unintended) 108 177 140 122 207 236 172 214 222 126 194 188Acute febrile illness§ 45 129 67 103 273 109 112 414 146 78 233 96Pulmonary tuberculosis 56 50 18 194 196 70 232 299 68 137 148 45Acute diarrheal disease¶ 30 127 23 34 165 51 82 325 78 42 179 43Liver disease 3 11 14 15 67 53 31 92 173 12 45 59Stroke 4 4 4 36 42 20 194 85 96 53 33 27Cancer 8 8 8 23 13 61 131 40 170 38 16 58Pneumonia 8 24 7 13 61 19 51 101 50 18 52 19Acute abdominal problem 6 22 7 10 51 10 55 121 13 17 51 9No. deaths 367 810 440 582 836 815 343 531 628 1292 2262 1883
All cause death rate 547 818 843 1451 1892 1346 2191 2697 1641 1171 1545 997
* Per 100,000 population.† Age adjusted to World Health Organization standard population (6 ).§ Includes malaria.¶ Includes cholera.

Vol. 49 / No. 19 MMWR 419
Mortality in Tanzania — Continued
Editorial Note: AMMP is being developed as a prototype of a routine mortality datacollection system to be integrated into the local health system of Tanzania. The datafrom the selected districts show that substantial variation in overall and cause-specificdeaths exist in conditions of extreme poverty relative to other countries. In 1997, Tanzaniahad the third lowest gross national product per capita in the world (7 ). In 1990, estimatesof the probability of death at age 15 years by age 60 years in sub-Saharan Africa were39% for men and approximately 30% for women (8 ). On the basis of data in this report,the probability of death is considerably higher for the three study areas; the data alsoshow that in these areas important differences exist by sex and geography. Infectiousdiseases predominated in Dar es Salaam and Morogoro Rural, and noninfectious diseaseand injury rates were greater in Hai than in Dar es Salaam and Morogoro Rural.
In addition, the data reflect age-specific patterns of HIV/AIDS and the need for HIVprevention intervention and improved home care for persons with HIV/AIDS. Malariaand diarrhea also should be public health priorities, as should noninfectious diseases thatrepresented major causes of death, particularly stroke, cancer, and diabetes for thepopulations residing in Dar es Salaam and Hai. Stroke death rates among persons aged45–60 years in Dar es Salaam are several times higher than rates in the United Kingdomor North America (8 ).
The results of this study are subject to at least three limitations. First, because thestudy population has had little to moderate formal education, age reporting may beinaccurate, especially among older age groups. Second, the exact cause of death maynot have been known (3 ), particularly for conditions such as anemia, septicemia, geni-tourinary disorders, and some cancers. Third, an unknown amount of overlap may existamong HIV/AIDS, TB, chronic diarrhea, and other causes of death.
The high mortality reported from these three areas highlights the need to establishadult health as a priority in Tanzania. For many of the important causes of death, effectiveand inexpensive preventive or treatment measures are available, including condoms,insecticide-treated bednets, oral rehydration therapy for acute diarrhea, treatment forhypertension, directly observed therapy for TB, improved nutrition, and access to cleanwater. MOH has used these data to design a National Essential Health Package, a mini-mum standard of care that all districts in Tanzania will be expected to provide by 2010.References1. United Republic of Tanzania. Poverty and welfare monitoring indicators. Dar es Salaam,
Tanzania: United Republic of Tanzania, Office of the Vice President, November 1999.2. Chandramohan, D, Maude GH, Rodrigues LC, Hayes RJ. Verbal autopsies for adult deaths:
issues in their development and validation. Int J Epidemiol 1994;23:213–22.3. Ministry of Health, Adult Morbidity and Mortality Project. The policy implications of adult
morbidity and mortality: end of phase 1 report. Dar es Salaam, Tanzania: United Republic ofTanzania, 1997.
4. Kitange HM, Machibya H, Black J, et al. Outlook for survivors of childhood in sub-SaharanAfrica: adult mortality in Tanzania. British Medical Journal 1996;312:216–20.
5. World Health Organization. International classification of diseases and related health prob-lems, 10th revision. Geneva, Switzerland: World Health Organization, 1993.
6. World Health Organization. World health statistics annual. Geneva, Switzerland: WorldHealth Organization, 1994.
7. World Bank. World development report 1997: the state in a changing world. New York:World Bank/Oxford University Press, 1997.
8. Murray CJL, Lopez AD. The global burden of disease: global burden of disease and injury.Boston, Massachusetts: Harvard School of Public Health, 1996.

420 MMWR May 19, 2000
Prevalence of Leisure-Time and Occupational Physical Activity AmongEmployed Adults — United States, 1990
Regular physical activity and high levels of physical fitness offer numerous healthbenefits, such as reduced risk for cardiovascular disease, diabetes, obesity, some can-cers, and musculoskeletal conditions (1 ). National rates for participation in leisure-timephysical activity are consistently low for women, older adults, persons with low educa-tional attainment, and racial/ethnic minorities (2 ). Public health recommendations forpromoting physical activity emphasize moderate-intensity activities, building on recom-mendations for vigorous exercise to improve fitness (3,4 ). To determine the prevalenceof leisure-time and occupational physical activity, data were analyzed for employedadults aged �18 years in the 1990 National Health Interview Survey (NHIS). This reportsummarizes the results of the survey, which indicate that approximately half of adultswho reported no physical activity during leisure time also reported that they performedat least 1 hour per day of hard physical activity at work.
The survey used a probability sample of the U.S. civilian, noninstitutionalized popula-tion aged �18 years (5 ); 20,766 persons responded to the survey. Respondents wereasked to identify the frequency and duration of their participation in 24 sports and condi-tioning activities during the 2 weeks preceding the survey, and to list the number of hoursper day they spent doing hard physical work on the job (2 ).
Leisure-time physical activities were scored by the intensity (i.e., metabolic equiva-lents [METs]), frequency, and duration of effort. METs for each leisure-time physicalactivity were based on the Compendium of Physical Activities (6 ). Respondents werecategorized as 1) sedentary (no leisure-time activity), 2) irregularly active (not meetingpublic health recommendations), 3) moderately active (meeting the current public healthrecommendation)*, or 4) vigorously active (meeting the fitness recommendation)†. Hardphysical activity at work was categorized as no hard labor, 1–4 hours per day, and�5 hours per day. Prevalence of activity was calculated by age, sex, race/ethnicity, andeducation level using SUDAAN to adjust for the complex sampling frame.
Approximately one third of adults reported an adequate level of leisure-time physicalactivity: 31.5% were moderately active, and 4.6% were vigorously active (Table 1). Menwere more active than women at both the moderate and vigorous level. At the moderatelevel, whites were more active than Hispanics. The prevalence of both moderate andvigorous activity increased with education level and decreased with age (Table 1).
More than half (56.4%) of adults reported doing no hard physical activity during theworkday; however, 20% reported 1–4 hours per day, and 23.6% reported �5 hours ofhard occupational activity. Occupational activity was highest for persons who had<12 years of education, and was higher for blacks and Hispanics than whites. Occupa-tional exertion decreased with increased education level and age (Table 2).
The prevalence of hard occupational activity differed by level of leisure-time physicalactivity (Figure 1). Half (51.3%) of the respondents classified as sedentary in leisure timereported at least 1 hour of hard occupational activity per day. The prevalence of hardoccupational activity was lower among persons classified as irregularly (42.0%), moder-ately (40.7%), or vigorously (36.8%) active during leisure time.Reported by: Physical Activity and Health Br, Div of Nutrition and Physical Activity, and Cardio-vascular Health Br, Div of Adult and Community Health, National Center for Chronic DiseasePrevention and Health Promotion, CDC.
*Three or more METs, �30 minutes accumulated total, �5 days per week. .† More than six METs, �20 minutes continuous session, �3 days per week.

Vo
l. 49
/N
o. 1
9M
MW
R4
21
TABLE 1. Percentage of employed adults reporting levels of leisure-time physical activity*, by selectedcharacteristics — United States, National Health Interview Survey, 1990
Sedentary Irregular Moderate VigorousCharacteristic No. % (95% CI†) % (95% CI) % (95% CI) % (95% CI)
Sex
Women 10,460 26.2 (24.7–27.7) 41.6 (40.5–42.7) 29.6 (28.5–30.9) 2.5 ( 2.1–2.9)Men 10,306 22.5 (20.9–24.1) 38.3 (37.6–39.4) 33.0 (31.7–34.3) 6.2 ( 5.7–6.7)
Race/Ethnicity
White 16,077 22.3 (20.9–23.7) 40.8 (40.0–41.6) 32.3 (31.2–33.4) 4.5 ( 4.1–4.9)Black 2,543 28.8 (25.9–31.7) 37.0 (34.5–39.5) 30.3 (28.2–32.4) 4.0 ( 3.1–4.9)Hispanic 1,510 33.9 (30.4–37.4) 34.4 (31.4–37.4) 26.6 (23.3–29.9) 5.0 ( 3.5–6.5)Other§ 636 29.1 (24.0–34.2) 37.2 (33.2–41.2) 27.9 (23.3–32.5) 5.8 ( 4.0–7.6)
Education level
<High school 2,548 39.4 (36.5–42.3) 35.0 (32.4–37.6) 23.1 (20.9–25.3) 2.5 ( 1.7–3.2)High school graduate 8,056 26.9 (25.2–28.6) 40.8 (39.5–42.1) 29.4 (27.9–30.9) 2.9 ( 2.4–3.4)>High school 10,162 17.7 (16.5–18.9) 40.3 (39.3–41.3) 35.5 (34.2–36.8) 6.5 ( 5.9–7.0)
Age group (yrs)
18–24 2,681 19.3 (17.3–21.3) 36.2 (34.1–38.3) 35.8 (33.4–38.2) 8.7 (7.4–10.0)25–44 2,181 23.2 (21.7–24.7) 40.5 (39.5–41.5) 32.0 (30.9–33.1) 4.3 ( 3.9–4.7)45–64 5,189 28.0 (26.1–29.9) 40.9 (39.3–42.5) 28.1 (26.5–29.7) 2.9 ( 2.4–3.4)�65 715 33.9 (30.1–37.7) 35.6 (31.7–39.5) 28.8 (24.7–32.9) 1.7 ( 0.8–2.7)
Total 20,766 24.1 (22.7–25.5) 39.8 (39.2–40.8) 31.5 (30.5–32.5) 4.6 ( 4.2–4.9)
* Sedentary=no leisure-time activity; irregular=not meeting public health recommendations; moderate=three or more metabolic equiva-lents (METs), �30 minutes accumulated total, �5 days per week; vigorous=more than six METs, �20 minutes continuous session,�3 days per week.
† Confidence interval.§ Numbers for other racial/ethnic groups were too small for meaningful analysis.
Leisure-Tim
e and
Occu
patio
nal P
hysical A
ctivity — C
on
tinu
ed

42
2M
MW
RM
ay
19
, 20
00
Leisure-Tim
e and
Occu
patio
nal P
hysical A
ctivity — C
on
tinu
edTABLE 2. Percentage of employed adults reporting hard occupational activity, by selected characteristics — UnitedStates, National Health Interview Survey, 1990
Hours per day
0 1–4 �5
Characteristic No. % (95% CI*) % (95% CI) % (95% CI)
Sex
Women 10,460 65.0 (63.7–66.3) 18.0 (16.9–19.0) 17.0 (16.0–18.0)Men 10,306 49.4 (48.1–50.8) 21.6 (20.6–22.5) 29.0 (27.7–30.3)
Race/Ethnicity
White 16,077 58.1 (56.9–59.2) 20.0 (19.2–20.8) 21.9 (20.9–22.9)Black 2,543 49.5 (46.8–52.2) 20.4 (18.1–22.7) 30.1 (27.6–32.7)Hispanic 1,510 47.6 (44.1–51.2) 19.3 (16.4–22.2) 33.0 (30.1–36.0)Other† 636 59.4 (53.6–65.1) 18.9 (15.6–22.2) 21.7 (17.4–26.0)
Education level
<High school 2,548 32.0 (30.0–34.0) 20.5 (18.6–22.5) 47.5 (45.3–49.7)High school graduate 8,056 47.4 (45.9–48.9) 23.1 (22.0–24.3) 29.5 (28.0–30.9)>High school 10,162 70.5 (69.3–71.6) 17.2 (16.2–18.2) 12.4 (11.6–13.2)
Age group (yrs)
18–24 2,681 50.0 (47.7–52.3) 22.1 (20.4–23.9) 27.9 (25.6–30.1)25–44 12,181 56.4 (55.1–57.7) 20.1 (19.1–21.0) 23.5 (22.4–24.6)45–64 5,189 59.4 (57.7–61.1) 18.3 (17.1–19.4) 22.3 (20.8–23.8)�65 715 62.3 (61.9–62.7) 20.8 (17.1–24.4) 16.9 (13.7–20.2)
Total 20,766 56.4 (55.3–57.0) 20.0 (19.2–20.7) 23.6 (22.6–24.6)
* Confidence interval.† Numbers for other racial/ethnic groups were too small for meaningful analysis.

Vol. 49 / No. 19 MMWR 423
Leisure-Time and Occupational Physical Activity — Continued
FIGURE 1. Percentage of respondents reporting hard occupational activity (hours perday), by levels of leisure-time physical activity* — United States, National HealthInterview Survey, 1990
Editorial Note: The findings in this report indicate that during leisure time approximatelytwo thirds (63.9%) of employed adults in the United States do not meet currentrecommendations for participation in moderate or vigorous physical activity. The NHISfindings were consistent with previous reports that indicate women, older adults, personswith <12 years of education, or members of racial/ethnic minorities are most likely to beinactive during leisure time (7 ). However, other opportunities exist for obtainingrecommended amounts of physical activity, such as activities involved in commuting toand from work and those associated with certain occupations or maintaining a home.
Although the findings in this report suggest that adults may participate in physicalactivity at work, the frequency, intensity, and type of activity are not available from theNHIS data. Assessing activity patterns limited to leisure-time activity may underesti-mate the proportion of persons who obtain the recommended level of physical activity.Many persons from groups that are sedentary in their leisure time may be getting suffi-cient occupational physical activity to derive health benefits.
The findings in this report are subject to at least four limitations. First, estimates arebased on self-reported activity and may be overestimates. Second, recall of the 24 typesof leisure-time physical activity may have resulted in underreporting if seasonal or ir-regular activities were not performed during the 2-week recall period. Third, this studydoes not provide information on other sources of physical activity, such as transportationor housework, which may be disproportionately higher in certain population groups,such as women and racial/ethnic minorities. Finally, questions about occupational physi-cal activity have not been asked since the 1990 NHIS, and the level of physical activityduring work may have changed during the past decade.
* Sedentary=no leisure-time activity; irregular=not meeting public health recommendations;moderate=three or more metabolic equivalents (METs), �30 minutes accumulated total,�5 days per week; vigorous=more than six METs, �20 minutes continuous session, �3 daysper week.
0
20
40
60
80
100
Sedentary Irregular Moderate Vigorous
None1–4 hours³5 hours
424 MMWR May 19, 2000
Leisure-Time and Occupational Physical Activity — Continued
CDC and the American College of Sports Medicine recommend that every U.S. adultaccumulate 30 minutes or more of moderate-intensity physical activity on most, prefer-ably all, days of the week (3 ). In 1990, only one third of employed adults met this recom-mendation or the recommendation for vigorous activity during leisure time. One of thenational health objectives for 2000 was to reduce to no more than 15% the proportion ofpersons who engage in no leisure-time physical activity (objective 1.5) (8 ).
Systems that collect information on physical activity should be expanded to includeadditional activities. Because of the demonstrated health benefits of moderate-intensityphysical activity, surveillance systems should be designed to assess activities such asoccupational, childcare, and transportation for future monitoring of health-related physi-cal activity.References1. Bouchard C, Stevens T, Shephard RJ. Proceedings from the 1992 International Conference
on Physical Activity, Fitness and Health. Champaign, Illinois: Human Kinetics Publisher,1994.
2. Piani A, Schoenborn D. Health promotion and disease prevention: United States, 1990.Hyattsville, Maryland: US Department of Health and Human Services, Public Health Service,CDC, National Center for Health Statistics, 1993;10:185.
3. Pate RR, Pratt M, Blair SN, et al. Physical activity and public health: a recommendation fromthe Centers for Disease Control and Prevention and the American College of Sports Medi-cine. JAMA 1995;273:402–7.
4. American College of Sports Medicine. Position stand on the recommended quantity andquality of exercise for developing and maintaining cardiorespiratory and muscular fitnessin healthy adults. Med Sci Sports Exerc 1990;22:265–74.
5. National Center for Health Statistics, Massey JT, Moore TF, Parsons VL, et al. Design andestimation for the National Health Interview Survey, 1985–1994. Hyattsville, Maryland: USDepartment of Health and Human Services, Public Health Service, CDC, 1989; DHHS publi-cation no. (PHS)89-1384. (Vital and health statistics; series 2, no. 110).
6. Ainsworth BE, Haskell WL, Leon AS, et al. Compendium of physical activities: classificationof energy costs of human physical activities. Med Sci Sports Exerc 1993;25:71–80.
7. Jones DA, Ainsworth BE, Croft JB, et al. Moderate leisure-time physical activity: who ismeeting the public health recommendations? A national cross-sectional study. Arch FamMed 1998;7:285–9.
8. Public Health Service. Healthy people 2000: national health promotion and disease preven-tion objectives—full report, with commentary. Washington, DC: US Department of Healthand Human Services, Public Health Service, 1991; DHHS publication no. (PHS)91-50212.
Notice to Readers
Revision of Acute Hepatitis Panel
Current Procedural Terminology (CPT) codes are standardized codes developed andmaintained by the American Medical Association (AMA) for the classification and report-ing of medical services. The Health Care Financing Administration (HCFA) requires theuse of these codes for reporting services to Medicare and Medicaid for reimbursement.On January 1, 1998, the components of the test panel for acute viral hepatitis (CPT#80059)were changed to exclude the tests for IgM antibody to hepatitis A virus (IgM anti-HAV)and IgM antibody to hepatitis B core antigen (IgM anti-HBc), the tests that specificallyidentify recent infection with hepatitis A virus (HAV) and hepatitis B virus (HBV).

Vol. 49 / No. 19 MMWR 425
Effective January 1, 2000 (CPT 2000), the acute hepatitis panel has been revised(CPT#80074) to re-include the tests for IgM anti-HAV and IgM anti-HBc. This revisedpanel, which also includes tests for hepatitis B surface antigen (HBsAg) and antibody tohepatitis C virus (anti-HCV), should be used to diagnose any patient presenting with signsand/or symptoms of acute viral hepatitis. Additional information on CPT codes is avail-able at the AMA World-Wide Web site, http://www.ama-assn.org/med-sci/cpt/coding.htm.*
*References to sites of non-CDC organizations on the World-Wide Web are provided as aservice to MMWR readers and do not constitute or imply endorsement of these organizationsor their programs by CDC or the U.S. Department of Health and Human Services. CDC is notresponsible for the content of pages found at these sites.
Notice to Readers
New Web-Based Training on Hepatitis C for Health Professionals
On May 15, 2000, CDC posted on its World-Wide Web site an interactive web-basedtraining program titled “Hepatitis C: What Clinicians and Other Health ProfessionalsNeed to Know.” The program is at http://www.cdc.gov/hepatitis.
This program provides users with up-to-date information on the epidemiology, diag-nosis, and management of hepatitis C virus (HCV) infection and HCV-related chronicdisease. Users also can test their knowledge of the material through study questions atthe end of each section and case studies at the end of the program. Continuing medicaland nursing education credits are available free from CDC on completion of the training.The American Academy of Family Physicians also will grant the academy’s educationcredits on completion of training and filing with the academy.
Notices to Readers — Continued

426 MMWR May 19, 2000

Vol. 49 / No. 19 MMWR 427
FIGURE I. Selected notifiable disease reports, United States, comparison ofprovisional 4-week totals ending May 13, 2000, with historical data
*Ratio of current 4-week total to mean of 15 4-week totals (from previous, comparable, andsubsequent 4-week periods for the past 5 years). The point where the hatched area beginsis based on the mean and two standard deviations of these 4-week totals.
TABLE I. Summary of provisional cases of selected notifiable diseases,United States, cumulative, week ending May 13, 2000 (19th Week)
Cum. 2000 Cum. 2000
Anthrax - HIV infection, pediatric*§ 85Brucellosis* 15 Plague 2Cholera - Poliomyelitis, paralytic -Congenital rubella syndrome 4 Psittacosis* 5Cyclosporiasis* 6 Rabies, human -Diphtheria - Rocky Mountain spotted fever (RMSF) 44Encephalitis: California serogroup viral* 2 Streptococcal disease, invasive, group A 1,158
eastern equine* - Streptococcal toxic-shock syndrome* 41St. Louis* - Syphilis, congenital¶ 38western equine* - Tetanus 7
Ehrlichiosis human granulocytic (HGE)* 23 Toxic-shock syndrome 49human monocytic (HME)* 4 Trichinosis 4
Hansen disease (leprosy)* 14 Typhoid fever 99Hantavirus pulmonary syndrome*† 3 Yellow fever -Hemolytic uremic syndrome, postdiarrheal* 31
-:No reported cases. *Not notifiable in all states. † Updated weekly from reports to the Division of Viral and Rickettsial Diseases, National Center for Infectious Diseases (NCID). § Updated monthly from reports to the Division of HIV/AIDS Prevention — Surveillance and Epidemiology, National Center for HIV,
STD, and TB Prevention (NCHSTP). Last update April 30, 2000. ¶ Updated from reports to the Division of STD Prevention, NCHSTP.
Meningococcal Infections
DISEASE DECREASE INCREASECASES CURREN
4 WEEKS
Ratio (Log Scale)*
Beyond Historical Limits
4210.50.25
548
388
81
27
7
134
19
267
26
Hepatitis A
Hepatitis B
Hepatitis C; Non-A, Non-B
Legionellosis
Measles, Total
Mumps
Pertussis
Rubella

428 MMWR May 19, 2000
TABLE II. Provisional cases of selected notifiable diseases, United States,weeks ending May 13, 2000, and May 15, 1999 (19th Week)
Cum. Cum. Cum. Cum. Cum. Cum. Cum. Cum. Cum. Cum.2000§ 1999 2000 1999 2000 1999 2000 1999 2000 1999
AIDS Chlamydia† Cryptosporidiosis NETSS PHLIS
Reporting Area
Escherichia coli O157:H7*
UNITED STATES 13,355 14,726 198,586 241,711 397 580 535 446 318 378
NEW ENGLAND 802 759 7,964 7,665 19 29 54 67 41 66Maine 14 15 481 253 5 3 3 4 3 -N.H. 11 24 373 380 2 4 5 5 4 8Vt. 2 5 198 187 8 5 2 6 2 1Mass. 535 481 3,736 3,318 2 14 22 33 15 30R.I. 34 52 855 833 2 - - 3 - 5Conn. 206 182 2,321 2,694 - 3 22 16 17 22
MID. ATLANTIC 3,280 3,596 11,702 28,589 38 130 65 31 47 18Upstate N.Y. 186 402 N N 28 37 61 24 40 2N.Y. City 1,943 1,895 2,188 13,718 5 77 3 2 - -N.J. 703 752 1,865 4,616 1 8 1 5 2 16Pa. 448 547 7,649 10,255 4 8 N N 5 -
E.N. CENTRAL 1,310 1,103 32,535 37,647 80 101 96 82 26 63Ohio 194 185 7,910 11,188 18 16 19 32 9 19Ind. 100 146 4,425 4,342 6 8 18 14 9 10Ill. 809 504 9,184 10,300 4 16 28 22 - 16Mich. 153 213 8,535 7,936 12 14 14 14 4 12Wis. 54 55 2,481 3,881 40 47 17 N 4 6
W.N. CENTRAL 299 286 12,069 13,944 28 33 91 82 64 80Minn. 55 45 2,224 2,829 4 13 18 19 30 23Iowa 26 37 1,576 1,511 7 7 18 9 4 3Mo. 139 105 4,510 5,094 8 4 36 8 16 9N. Dak. - 4 61 327 2 2 6 3 4 2S. Dak. 3 11 641 615 3 2 2 3 2 5Nebr. 20 24 1,049 1,357 2 4 4 33 5 38Kans. 56 60 2,008 2,211 2 1 7 7 3 -
S. ATLANTIC 3,641 4,078 41,422 51,231 83 106 48 50 24 35Del. 65 50 1,092 1,052 2 - - 3 - -Md. 392 466 4,269 4,885 5 6 8 3 1 -D.C. 264 159 1,108 N - 4 - - U UVa. 278 226 5,297 5,326 3 6 10 14 9 12W. Va. 21 24 450 761 - - 2 1 2 1N.C. 195 268 7,440 8,219 7 1 8 9 2 10S.C. 294 401 3,431 7,620 - - 2 5 - 3Ga. 357 583 7,016 12,329 50 67 5 3 5 UFla. 1,775 1,901 11,319 11,039 16 22 13 12 5 9
E.S. CENTRAL 639 631 18,122 16,452 16 5 28 30 21 19Ky. 80 104 2,883 2,804 - 1 10 8 8 6Tenn. 287 283 5,281 5,241 3 2 11 11 11 7Ala. 169 111 5,947 3,808 8 1 1 6 - 5Miss. 103 133 4,011 4,599 5 1 6 5 2 1
W.S. CENTRAL 1,128 1,545 31,353 32,424 12 41 21 22 35 23Ark. 69 56 1,978 2,018 1 - 4 5 3 3La. 232 161 6,753 5,256 - 18 - 3 8 3Okla. 65 47 2,945 3,037 2 1 5 4 3 4Tex. 762 1,281 19,677 22,113 9 22 12 10 21 13
MOUNTAIN 477 535 10,434 12,258 31 28 52 33 20 25Mont. 6 4 571 509 3 2 8 2 - -Idaho 9 8 584 657 3 2 7 1 - 3Wyo. 2 3 284 286 2 - 3 2 2 3Colo. 99 102 1,198 2,463 9 4 17 13 7 5N. Mex. 50 18 1,207 1,722 1 11 2 2 1 1Ariz. 165 270 4,634 4,704 3 7 13 6 9 4Utah 52 54 949 756 8 N 1 6 1 7Nev. 94 76 1,007 1,161 2 2 1 1 - 2
PACIFIC 1,779 2,193 32,985 41,501 90 107 80 49 40 49Wash. 202 115 4,556 4,503 N N 14 12 22 19Oreg. 47 50 1,799 2,284 3 10 12 12 13 12Calif. 1,476 1,989 25,064 32,828 87 97 49 24 - 17Alaska 5 6 897 723 - - 1 - - -Hawaii 49 33 669 1,163 - - 4 1 5 1
Guam 13 1 - 176 - - N N U UP.R. 284 494 142 U - - 2 8 U UV.I. 18 13 - U - U - U U UAmer. Samoa - - - U - U - U U UC.N.M.I. - - - U - U - U U U
N: Not notifiable. U: Unavailable. -: No reported cases. C.N.M.I.: Commonwealth of Northern Mariana Islands.* Individual cases can be reported through both the National Electronic Telecommunications System for Surveillance (NETSS) and the Public
Health Laboratory Information System (PHLIS).† Chlamydia refers to genital infections caused by C. trachomatis. Totals reported to the Division of STD Prevention, NCHSTP.§ Updated monthly from reports to the Division of HIV/AIDS Prevention — Surveillance and Epidemiology, National Center for HIV, STD, and
TB Prevention. Last update April 30, 2000.

Vol. 49 / No. 19 MMWR 429
Hepatitis C; LymeGonorrhea Non-A, Non-B Legionellosis Disease
Cum. Cum. Cum. Cum. Cum. Cum. Cum. Cum.2000 1999 2000 1999 2000 1999 2000 1999Reporting Area
UNITED STATES 104,930 127,388 927 1,348 229 312 1,169 1,734
NEW ENGLAND 2,177 2,447 21 7 15 21 195 371Maine 29 19 - 1 2 3 - 1N.H. 34 23 - - 2 2 18 -Vt. 20 22 3 2 - 3 1 -Mass. 970 961 18 1 8 5 83 98R.I. 223 218 - 3 - 2 - 10Conn. 901 1,204 - - 3 6 93 262
MID. ATLANTIC 7,786 15,138 21 50 43 82 748 960Upstate N.Y. 2,197 2,106 21 24 20 23 347 347N.Y. City 824 5,686 - - - 10 4 29N.J. 1,037 2,671 - - - 6 - 144Pa. 3,728 4,675 - 26 23 43 397 440
E.N. CENTRAL 20,052 22,836 91 776 62 95 12 77Ohio 4,577 6,005 3 - 30 28 11 13Ind. 2,020 2,394 1 - 13 8 - 3Ill. 6,329 7,297 5 19 4 12 1 2Mich. 5,811 5,606 82 260 10 28 - 1Wis. 1,315 1,534 - 497 5 19 U 58
W.N. CENTRAL 5,162 5,742 214 54 15 15 44 34Minn. 873 1,057 1 - 1 1 11 8Iowa 351 348 1 - 3 5 1 3Mo. 2,657 2,752 197 51 8 6 9 16N. Dak. 4 33 - - - - - 1S. Dak. 92 55 - - 1 1 - -Nebr. 349 612 1 3 - 2 - 2Kans. 836 885 14 - 2 - 23 4
S. ATLANTIC 30,496 38,042 38 75 47 34 134 203Del. 604 634 - - 4 2 11 11Md. 2,907 4,579 5 21 13 4 93 153D.C. 805 2,435 - - - - - 1Va. 3,678 3,501 1 7 3 8 13 9W. Va. 118 236 3 11 N N 4 4N.C. 6,271 7,092 10 18 6 7 4 22S.C. 3,879 3,979 - 12 2 6 - 2Ga. 4,462 7,812 - 1 2 - - -Fla. 7,772 7,774 19 5 17 7 9 1
E.S. CENTRAL 12,811 12,728 139 100 6 15 1 23Ky. 1,177 1,243 16 5 4 7 - 2Tenn. 4,019 4,018 32 37 1 6 1 8Ala. 4,456 3,527 6 1 1 2 - 6Miss. 3,159 3,940 85 57 - - - 7
W.S. CENTRAL 16,354 18,215 260 154 4 1 1 5Ark. 1,065 945 3 9 - - - -La. 4,735 4,514 162 108 2 1 1 3Okla. 1,284 1,564 2 3 1 - - 2Tex. 9,270 11,192 93 34 1 - - -
MOUNTAIN 3,588 3,357 81 77 15 22 - 4Mont. 14 17 1 4 - - - -Idaho 26 33 - 4 1 - - -Wyo. 25 10 50 29 1 - - 1Colo. 1,204 782 12 11 7 2 - -N. Mex. 263 295 5 12 1 1 - 1Ariz. 1,535 1,694 10 13 2 3 - -Utah 102 80 - 2 3 10 - 1Nev. 419 446 3 2 - 6 - 1
PACIFIC 6,504 8,883 62 55 22 27 34 57Wash. 800 802 8 5 8 7 - 1Oreg. 216 333 15 6 N N 2 3Calif. 5,295 7,458 39 44 14 19 32 53Alaska 110 131 - - - 1 - -Hawaii 83 159 - - - - N N
Guam - 26 - - - - - -P.R. 170 141 1 - - - N NV.I. - U - U - U - UAmer. Samoa - U - U - U - UC.N.M.I. - U - U - U - U
N: Not notifiable. U: Unavailable. - : No reported cases.
TABLE II. (Cont’d) Provisional cases of selected notifiable diseases, United States,weeks ending May 13, 2000, and May 15, 1999 (19th Week)

430 MMWR May 19, 2000
Malaria Rabies, Animal NETSS PHLIS
Cum. Cum. Cum. Cum. Cum. Cum. Cum. Cum.2000 1999 2000 1999 2000 1999 2000 1999Reporting Area
Salmonellosis*
UNITED STATES 311 402 1,748 2,038 8,499 9,312 5,388 8,431
NEW ENGLAND 8 16 230 321 555 541 517 558Maine 1 1 57 58 43 38 25 25N.H. - - 3 18 40 26 39 26Vt. 2 1 15 52 40 21 42 24Mass. 3 6 77 72 314 316 288 314R.I. - - 5 35 24 29 26 43Conn. 2 8 73 86 94 111 97 126
MID. ATLANTIC 44 120 341 376 1,032 1,302 987 1,000Upstate N.Y. 19 27 241 253 292 279 291 303N.Y. City 15 55 U U 252 370 401 385N.J. 4 27 56 74 242 320 124 291Pa. 6 11 44 49 246 333 171 21
E.N. CENTRAL 31 48 13 19 1,197 1,413 649 1,252Ohio 4 8 3 6 302 281 204 241Ind. 2 7 - - 153 118 129 116Ill. 13 21 - - 388 442 1 461Mich. 10 8 10 13 219 300 228 289Wis. 2 4 - - 135 272 87 145
W.N. CENTRAL 14 14 185 270 465 581 482 651Minn. 4 2 28 36 46 161 154 211Iowa - 4 27 44 70 61 25 55Mo. 1 7 5 10 192 185 167 220N. Dak. 2 - 52 54 14 9 18 20S. Dak. - - 40 80 25 23 24 30Nebr. 1 - - 1 36 57 37 45Kans. 6 1 33 45 82 85 57 70
S. ATLANTIC 86 92 737 734 1,620 1,685 961 1,487Del. 2 - 13 20 29 38 30 46Md. 33 30 147 161 227 223 211 253D.C. 2 8 - - 1 34 U UVa. 18 19 197 173 195 205 160 172W. Va. - 1 45 42 43 29 33 28N.C. 9 8 145 161 241 302 155 305S.C. 1 - 49 56 133 96 84 104Ga. 2 7 91 61 283 297 282 410Fla. 19 19 50 60 468 461 6 169
E.S. CENTRAL 12 8 68 98 438 507 293 340Ky. 2 2 10 20 92 114 55 83Tenn. 3 3 39 32 113 129 131 133Ala. 6 3 19 46 148 151 91 108Miss. 1 - - - 85 113 16 16
W.S. CENTRAL 4 11 28 43 694 882 594 681Ark. 1 2 - - 92 93 22 73La. 2 7 - - 59 125 79 132Okla. 1 1 28 43 87 98 63 68Tex. - 1 - - 456 566 430 408
MOUNTAIN 18 16 69 66 890 827 559 778Mont. 1 2 23 23 34 16 - 1Idaho - 1 - - 45 29 - 35Wyo. - - 22 25 18 9 3 11Colo. 10 5 - 1 266 271 231 276N. Mex. - 2 4 - 65 95 50 98Ariz. 2 4 19 17 245 231 176 180Utah 3 1 1 - 133 112 99 124Nev. 2 1 - - 84 64 - 53
PACIFIC 94 77 77 111 1,608 1,574 346 1,684Wash. 7 5 - - 135 130 157 239Oreg. 19 9 - 1 114 126 128 165Calif. 66 58 63 105 1,272 1,204 - 1,180Alaska - - 14 5 23 12 8 7Hawaii 2 5 - - 64 102 53 93
Guam - - - - - 20 U UP.R. - - 16 34 24 158 U UV.I. - U - U - U U UAmer. Samoa - U - U - U U UC.N.M.I. - U - U - U U U
N: Not notifiable. U: Unavailable. -: No reported cases.*Individual cases can be reported through both the National Electronic Telecommunications System for Surveillance (NETSS) and the Public Health Laboratory Information System (PHLIS).
TABLE II. (Cont’d) Provisional cases of selected notifiable diseases, United States,weeks ending May 13, 2000, and May 15, 1999 (19th Week)
Vol. 49 / No. 19 MMWR 431
TABLE II. (Cont’d) Provisional cases of selected notifiable diseases, United States,weeks ending May 13, 2000, and May 15, 1999 (19th Week)
SyphilisNETSS PHLIS (Primary & Secondary) Tuberculosis
Cum. Cum. Cum. Cum. Cum. Cum. Cum. Cum.2000 1999 2000 1999 2000 1999 2000 1999†Reporting Area
Shigellosis*
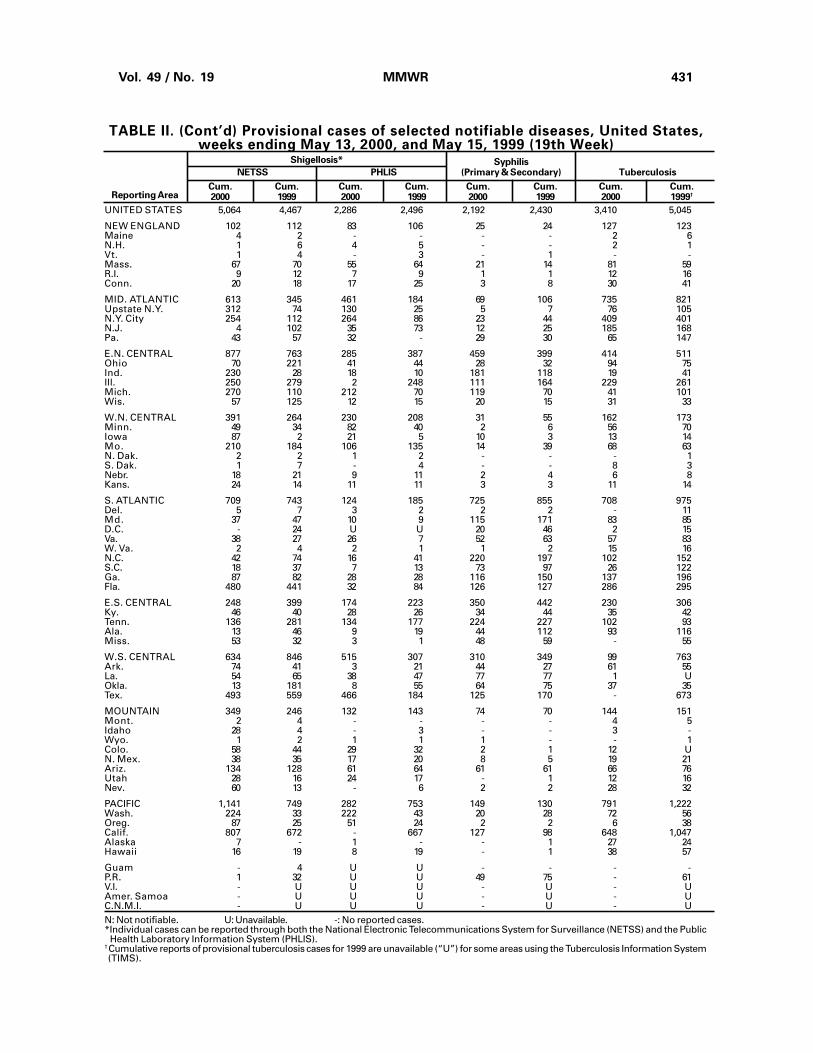
UNITED STATES 5,064 4,467 2,286 2,496 2,192 2,430 3,410 5,045
NEW ENGLAND 102 112 83 106 25 24 127 123Maine 4 2 - - - - 2 6N.H. 1 6 4 5 - - 2 1Vt. 1 4 - 3 - 1 - -Mass. 67 70 55 64 21 14 81 59R.I. 9 12 7 9 1 1 12 16Conn. 20 18 17 25 3 8 30 41
MID. ATLANTIC 613 345 461 184 69 106 735 821Upstate N.Y. 312 74 130 25 5 7 76 105N.Y. City 254 112 264 86 23 44 409 401N.J. 4 102 35 73 12 25 185 168Pa. 43 57 32 - 29 30 65 147
E.N. CENTRAL 877 763 285 387 459 399 414 511Ohio 70 221 41 44 28 32 94 75Ind. 230 28 18 10 181 118 19 41Ill. 250 279 2 248 111 164 229 261Mich. 270 110 212 70 119 70 41 101Wis. 57 125 12 15 20 15 31 33
W.N. CENTRAL 391 264 230 208 31 55 162 173Minn. 49 34 82 40 2 6 56 70Iowa 87 2 21 5 10 3 13 14Mo. 210 184 106 135 14 39 68 63N. Dak. 2 2 1 2 - - - 1S. Dak. 1 7 - 4 - - 8 3Nebr. 18 21 9 11 2 4 6 8Kans. 24 14 11 11 3 3 11 14
S. ATLANTIC 709 743 124 185 725 855 708 975Del. 5 7 3 2 2 2 - 11Md. 37 47 10 9 115 171 83 85D.C. - 24 U U 20 46 2 15Va. 38 27 26 7 52 63 57 83W. Va. 2 4 2 1 1 2 15 16N.C. 42 74 16 41 220 197 102 152S.C. 18 37 7 13 73 97 26 122Ga. 87 82 28 28 116 150 137 196Fla. 480 441 32 84 126 127 286 295
E.S. CENTRAL 248 399 174 223 350 442 230 306Ky. 46 40 28 26 34 44 35 42Tenn. 136 281 134 177 224 227 102 93Ala. 13 46 9 19 44 112 93 116Miss. 53 32 3 1 48 59 - 55
W.S. CENTRAL 634 846 515 307 310 349 99 763Ark. 74 41 3 21 44 27 61 55La. 54 65 38 47 77 77 1 UOkla. 13 181 8 55 64 75 37 35Tex. 493 559 466 184 125 170 - 673
MOUNTAIN 349 246 132 143 74 70 144 151Mont. 2 4 - - - - 4 5Idaho 28 4 - 3 - - 3 -Wyo. 1 2 1 1 1 - - 1Colo. 58 44 29 32 2 1 12 UN. Mex. 38 35 17 20 8 5 19 21Ariz. 134 128 61 64 61 61 66 76Utah 28 16 24 17 - 1 12 16Nev. 60 13 - 6 2 2 28 32
PACIFIC 1,141 749 282 753 149 130 791 1,222Wash. 224 33 222 43 20 28 72 56Oreg. 87 25 51 24 2 2 6 38Calif. 807 672 - 667 127 98 648 1,047Alaska 7 - 1 - - 1 27 24Hawaii 16 19 8 19 - 1 38 57
Guam - 4 U U - - - -P.R. 1 32 U U 49 75 - 61V.I. - U U U - U - UAmer. Samoa - U U U - U - UC.N.M.I. - U U U - U - UN: Not notifiable. U: Unavailable. -: No reported cases.*Individual cases can be reported through both the National Electronic Telecommunications System for Surveillance (NETSS) and the Public Health Laboratory Information System (PHLIS).
†Cumulative reports of provisional tuberculosis cases for 1999 are unavailable (“U”) for some areas using the Tuberculosis Information System(TIMS).

432 MMWR May 19, 2000
TABLE III. Provisional cases of selected notifiable diseases preventableby vaccination, United States, weeks ending May 13, 2000,
and May 15, 1999 (19th Week)
A B Indigenous Imported* Total
Cum. Cum. Cum. Cum. Cum. Cum. Cum. Cum. Cum. Cum.2000† 1999 2000 1999 2000 1999 2000 2000 2000 2000 2000 1999Reporting Area
Hepatitis (Viral), By TypeH. influenzae,Invasive
UNITED STATES 437 471 4,057 6,888 1,843 2,360 - 12 - 4 16 50
NEW ENGLAND 31 35 93 78 17 55 - - - - - 9Maine 1 3 6 2 3 - - - - - - -N.H. 6 6 11 7 8 4 - - - - - 1Vt. 2 4 3 1 3 1 - - - - - -Mass. 15 15 39 25 3 24 - - - - - 6R.I. 1 - 1 7 - 10 - - - - - -Conn. 6 7 33 36 - 16 - - - - - 2
MID. ATLANTIC 61 71 170 444 185 343 - - - - - 2Upstate N.Y. 29 29 84 91 41 73 - - - - - 2N.Y. City 13 23 86 116 144 114 - - - - - -N.J. 15 18 - 57 - 39 - - - - - -Pa. 4 1 - 180 - 117 - - - - - -
E.N. CENTRAL 57 72 519 1,317 232 205 - 3 - - 3 1Ohio 26 25 122 301 37 38 - 2 - - 2 -Ind. 8 11 20 47 20 10 - - - - - 1Ill. 19 29 183 256 38 - - - - - - -Mich. 4 7 181 674 136 140 - 1 - - 1 -Wis. - - 13 39 1 17 - - - - - -
W.N. CENTRAL 16 22 437 292 164 105 - 1 - - 1 -Minn. 7 12 49 21 7 13 - - - - - -Iowa - 1 39 61 19 19 - - - - - -Mo. 4 2 246 167 112 61 - - - - - -N. Dak. 1 - - 1 2 - - - - - - -S. Dak. - 1 - 8 - - - - - - - -Nebr. 1 3 11 27 9 10 U - U - - -Kans. 3 3 92 7 15 2 - 1 - - 1 -
S. ATLANTIC 125 102 489 581 402 354 - - - - - 4Del. - - - 2 - - - - - - - -Md. 26 30 63 127 40 76 - - - - - -D.C. - 2 2 30 6 10 U - U - - -Va. 24 10 54 51 54 39 - - - - - 3W. Va. 3 2 35 7 2 10 - - - - - -N.C. 10 19 82 49 109 83 - - - - - -S.C. 6 2 14 10 3 35 - - - - - -Ga. 37 25 58 174 54 40 - - - - - -Fla. 19 12 181 131 134 61 - - - - - 1
E.S. CENTRAL 23 35 135 169 109 174 - - - - - 2Ky. 9 5 18 32 30 12 - - - - - 2Tenn. 11 17 21 73 28 76 - - - - - -Ala. 3 11 25 31 17 44 - - - - - -Miss. - 2 71 33 34 42 - - - - - -
W.S. CENTRAL 26 33 738 1,764 121 376 - - - - - 3Ark. - 1 73 17 35 26 - - - - - -La. 6 9 26 62 45 72 - - - - - -Okla. 19 21 125 217 36 46 - - - - - -Tex. 1 2 514 1,468 5 232 - - - - - 3
MOUNTAIN 53 50 338 603 161 222 - 8 - 1 9 -Mont. - 1 1 9 3 10 - - - - - -Idaho 2 1 13 21 4 12 - - - - - -Wyo. - 1 6 3 - 2 - - - - - -Colo. 11 6 65 103 34 36 - 1 - 1 2 -N. Mex. 10 10 32 20 37 78 - - - - - -Ariz. 25 26 175 374 61 50 - - - - - -Utah 4 4 21 23 5 10 - 3 - - 3 -Nev. 1 1 25 50 17 24 - 4 - - 4 -
PACIFIC 45 51 1,138 1,640 452 526 - - - 3 3 29Wash. 3 1 105 98 22 21 - - - - - 5Oreg. 13 18 91 108 36 46 - - - - - 10Calif. 15 27 937 1,424 386 447 - - - 3 3 14Alaska 1 4 5 4 3 7 - - - - - -Hawaii 13 1 - 6 5 5 - - - - - -
Guam - - - 2 - 2 U - U - - 1P.R. - 1 40 110 24 105 - - - - - -V.I. - U - U - U U - U - - UAmer. Samoa - U - U - U U - U - - UC.N.M.I. - U - U - U U - U - - UN: Not notifiable. U: Unavailable. - : No reported cases.*For imported measles, cases include only those resulting from importation from other countries.†Of 99 cases among children aged <5 years, serotype was reported for 42 and of those, 9 were type b.
Measles (Rubeola)
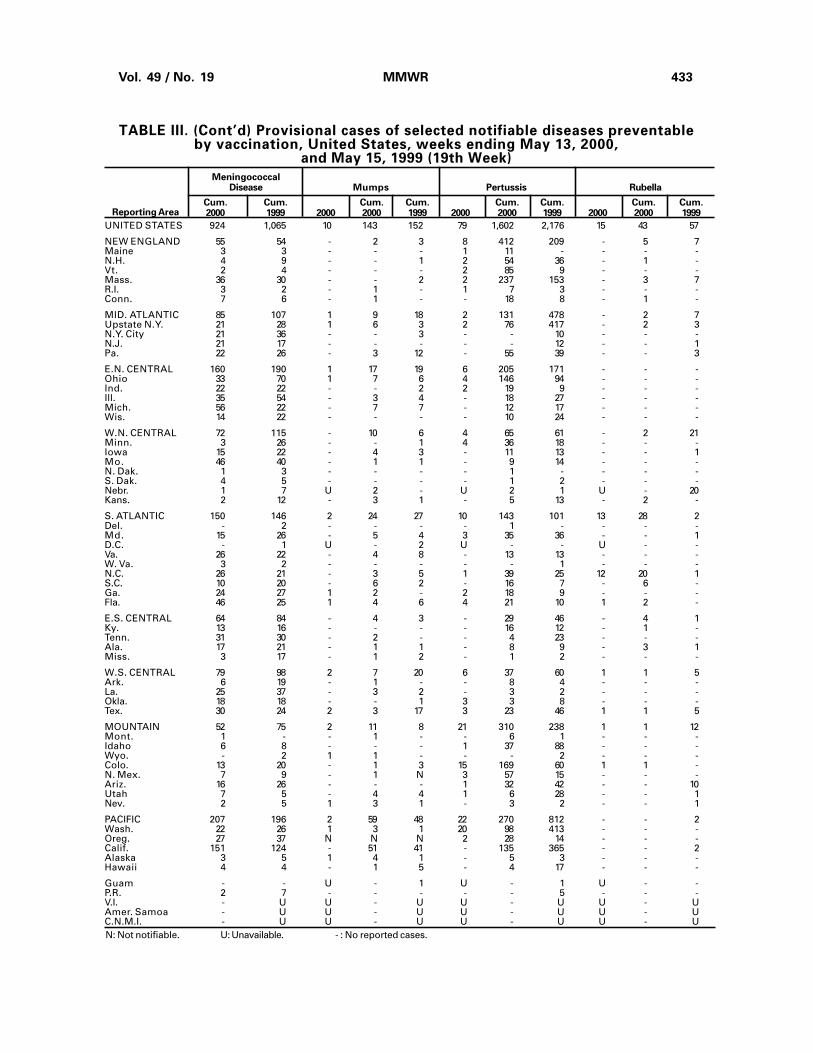
Vol. 49 / No. 19 MMWR 433
MeningococcalDisease Mumps Pertussis Rubella
Cum. Cum. Cum. Cum. Cum. Cum. Cum. Cum.2000 1999 2000 2000 1999 2000 2000 1999 2000 2000 1999Reporting Area
TABLE III. (Cont’d) Provisional cases of selected notifiable diseases preventableby vaccination, United States, weeks ending May 13, 2000,
and May 15, 1999 (19th Week)
UNITED STATES 924 1,065 10 143 152 79 1,602 2,176 15 43 57
NEW ENGLAND 55 54 - 2 3 8 412 209 - 5 7Maine 3 3 - - - 1 11 - - - -N.H. 4 9 - - 1 2 54 36 - 1 -Vt. 2 4 - - - 2 85 9 - - -Mass. 36 30 - - 2 2 237 153 - 3 7R.I. 3 2 - 1 - 1 7 3 - - -Conn. 7 6 - 1 - - 18 8 - 1 -
MID. ATLANTIC 85 107 1 9 18 2 131 478 - 2 7Upstate N.Y. 21 28 1 6 3 2 76 417 - 2 3N.Y. City 21 36 - - 3 - - 10 - - -N.J. 21 17 - - - - - 12 - - 1Pa. 22 26 - 3 12 - 55 39 - - 3
E.N. CENTRAL 160 190 1 17 19 6 205 171 - - -Ohio 33 70 1 7 6 4 146 94 - - -Ind. 22 22 - - 2 2 19 9 - - -Ill. 35 54 - 3 4 - 18 27 - - -Mich. 56 22 - 7 7 - 12 17 - - -Wis. 14 22 - - - - 10 24 - - -
W.N. CENTRAL 72 115 - 10 6 4 65 61 - 2 21Minn. 3 26 - - 1 4 36 18 - - -Iowa 15 22 - 4 3 - 11 13 - - 1Mo. 46 40 - 1 1 - 9 14 - - -N. Dak. 1 3 - - - - 1 - - - -S. Dak. 4 5 - - - - 1 2 - - -Nebr. 1 7 U 2 - U 2 1 U - 20Kans. 2 12 - 3 1 - 5 13 - 2 -
S. ATLANTIC 150 146 2 24 27 10 143 101 13 28 2Del. - 2 - - - - 1 - - - -Md. 15 26 - 5 4 3 35 36 - - 1D.C. - 1 U - 2 U - - U - -Va. 26 22 - 4 8 - 13 13 - - -W. Va. 3 2 - - - - - 1 - - -N.C. 26 21 - 3 5 1 39 25 12 20 1S.C. 10 20 - 6 2 - 16 7 - 6 -Ga. 24 27 1 2 - 2 18 9 - - -Fla. 46 25 1 4 6 4 21 10 1 2 -
E.S. CENTRAL 64 84 - 4 3 - 29 46 - 4 1Ky. 13 16 - - - - 16 12 - 1 -Tenn. 31 30 - 2 - - 4 23 - - -Ala. 17 21 - 1 1 - 8 9 - 3 1Miss. 3 17 - 1 2 - 1 2 - - -
W.S. CENTRAL 79 98 2 7 20 6 37 60 1 1 5Ark. 6 19 - 1 - - 8 4 - - -La. 25 37 - 3 2 - 3 2 - - -Okla. 18 18 - - 1 3 3 8 - - -Tex. 30 24 2 3 17 3 23 46 1 1 5
MOUNTAIN 52 75 2 11 8 21 310 238 1 1 12Mont. 1 - - 1 - - 6 1 - - -Idaho 6 8 - - - 1 37 88 - - -Wyo. - 2 1 1 - - - 2 - - -Colo. 13 20 - 1 3 15 169 60 1 1 -N. Mex. 7 9 - 1 N 3 57 15 - - -Ariz. 16 26 - - - 1 32 42 - - 10Utah 7 5 - 4 4 1 6 28 - - 1Nev. 2 5 1 3 1 - 3 2 - - 1
PACIFIC 207 196 2 59 48 22 270 812 - - 2Wash. 22 26 1 3 1 20 98 413 - - -Oreg. 27 37 N N N 2 28 14 - - -Calif. 151 124 - 51 41 - 135 365 - - 2Alaska 3 5 1 4 1 - 5 3 - - -Hawaii 4 4 - 1 5 - 4 17 - - -
Guam - - U - 1 U - 1 U - -P.R. 2 7 - - - - - 5 - - -V.I. - U U - U U - U U - UAmer. Samoa - U U - U U - U U - UC.N.M.I. - U U - U U - U U - UN: Not notifiable. U: Unavailable. - : No reported cases.

434 MMWR May 19, 2000
TABLE IV. Deaths in 122 U.S. cities,* week endingMay 13, 2000 (19th Week)
�65 45-64 25-44 1-24 <1Reporting Area
All Causes, By Age (Years)
AllAges
P&I†
Total� � � � ��65 45-64 25-44 1-24 <1
Reporting Area
All Causes, By Age (Years)
AllAges
P&I†
Total
NEW ENGLAND 598 432 103 40 13 10 58Boston, Mass. 168 106 41 11 3 7 25Bridgeport, Conn. 47 31 12 4 - - -Cambridge, Mass. 9 6 2 1 - - -Fall River, Mass. 27 23 3 - - 1 3Hartford, Conn. 42 28 8 3 2 1 6Lowell, Mass. 23 18 1 4 - - 2Lynn, Mass. 12 11 1 - - - -New Bedford, Mass. 31 26 3 1 1 - 3New Haven, Conn. 47 27 12 7 1 - 5Providence, R.I. 64 54 5 1 4 - 1Somerville, Mass. 6 3 1 2 - - -Springfield, Mass. 38 31 4 2 1 - 2Waterbury, Conn. 33 26 4 2 - 1 2Worcester, Mass. 51 42 6 2 1 - 9
MID. ATLANTIC 2,280 1,620 432 173 26 28 127Albany, N.Y. 55 40 10 4 - 1 4Allentown, Pa. U U U U U U UBuffalo, N.Y. 77 60 12 4 - 1 14Camden, N.J. 39 27 6 4 1 1 5Elizabeth, N.J. 16 12 3 1 - - -Erie, Pa.§ 37 28 8 1 - - 3Jersey City, N.J. 50 35 11 4 - - -New York City, N.Y. 1,195 836 241 92 11 14 53Newark, N.J. 67 34 18 8 4 3 3Paterson, N.J. 14 7 2 2 1 2 -Philadelphia, Pa. 362 264 65 25 3 5 19Pittsburgh, Pa.§ 54 33 13 5 3 - 3Reading, Pa. 30 24 4 1 1 - 1Rochester, N.Y. 145 114 20 9 2 - 12Schenectady, N.Y. 20 14 5 1 - - 2Scranton, Pa.§ 24 21 1 1 - 1 2Syracuse, N.Y. 62 46 9 7 - - 5Trenton, N.J. 20 15 3 2 - - 1Utica, N.Y. 13 10 1 2 - - -Yonkers, N.Y. U U U U U U U
E.N. CENTRAL 2,064 1,443 379 142 43 57 141Akron, Ohio 54 37 8 4 2 3 5Canton, Ohio 30 24 6 - - - 3Chicago, Ill. 398 256 80 43 8 11 39Cincinnati, Ohio 109 83 18 3 2 3 10Cleveland, Ohio 132 95 16 16 4 1 5Columbus, Ohio 184 131 33 12 1 7 12Dayton, Ohio 117 85 22 6 3 1 15Detroit, Mich. 204 119 58 16 3 8 11Evansville, Ind. 50 33 13 2 1 1 3Fort Wayne, Ind. 62 43 9 4 2 4 4Gary, Ind. 29 15 11 1 1 1 2Grand Rapids, Mich. 46 31 7 2 1 5 3Indianapolis, Ind. 212 144 40 16 9 3 6Lansing, Mich. 42 32 7 1 1 1 5Milwaukee, Wis. 129 101 20 4 1 3 3Peoria, Ill. 46 38 3 2 - 3 2Rockford, Ill. 48 36 10 2 - - 2South Bend, Ind. 29 24 2 - 3 - 1Toledo, Ohio 105 84 11 7 1 2 7Youngstown, Ohio 38 32 5 1 - - 3
W.N. CENTRAL 769 559 131 41 24 14 54Des Moines, Iowa 61 44 14 - - 3 7Duluth, Minn. U U U U U U UKansas City, Kans. 43 31 7 4 1 - 5Kansas City, Mo. 80 55 18 4 3 - 3Lincoln, Nebr. 35 28 4 1 2 - 2Minneapolis, Minn. 181 136 29 11 4 1 15Omaha, Nebr. 75 52 14 4 3 2 6St. Louis, Mo. 95 64 16 5 5 5 -St. Paul, Minn. 96 78 11 5 2 - 9Wichita, Kans. 103 71 18 7 4 3 7
S. ATLANTIC 1,136 722 236 113 33 32 75Atlanta, Ga. U U U U U U UBaltimore, Md. 238 152 48 30 6 2 15Charlotte, N.C. 109 73 19 7 3 7 8Jacksonville, Fla. 139 91 22 15 7 4 6Miami, Fla. 103 56 25 16 2 4 3Norfolk, Va. 58 38 12 5 2 1 3Richmond, Va. 63 33 16 8 3 3 5Savannah, Ga. 70 48 13 4 3 2 11St. Petersburg, Fla. 52 39 8 4 - 1 6Tampa, Fla. 180 122 36 12 4 6 13Washington, D.C. 104 62 25 12 3 2 5Wilmington, Del. 20 8 12 - - - -
E.S. CENTRAL 851 570 167 76 21 15 76Birmingham, Ala. 162 116 28 13 - 3 14Chattanooga, Tenn. 72 34 17 14 7 - 4Knoxville, Tenn. 93 71 12 7 1 2 4Lexington, Ky. 62 45 14 2 1 - 9Memphis, Tenn. 228 150 49 16 7 6 15Mobile, Ala. 55 34 13 5 1 2 6Montgomery, Ala. 43 33 7 2 - 1 8Nashville, Tenn. 136 87 27 17 4 1 16
W.S. CENTRAL 1,401 885 294 114 60 47 92Austin, Tex. 60 37 12 9 - 1 2Baton Rouge, La. 40 27 10 2 1 - 1Corpus Christi, Tex. 39 26 7 2 - 4 4Dallas, Tex. 164 96 35 20 5 8 6El Paso, Tex. 114 81 18 6 6 3 6Ft. Worth, Tex. 124 77 29 10 3 5 10Houston, Tex. 325 203 81 18 12 11 23Little Rock, Ark. 62 38 12 7 3 2 3New Orleans, La. 79 42 5 10 20 2 -San Antonio, Tex. 210 130 47 22 6 5 22Shreveport, La. 52 33 12 3 2 2 8Tulsa, Okla. 132 95 26 5 2 4 7
MOUNTAIN 900 599 168 82 24 27 64Albuquerque, N.M. 89 61 15 8 2 3 7Boise, Idaho 49 33 10 3 1 2 4Colo. Springs, Colo. 57 47 5 3 1 1 2Denver, Colo. U U U U U U ULas Vegas, Nev. 209 119 50 30 4 6 19Ogden, Utah 30 23 5 1 1 - 3Phoenix, Ariz. 191 126 33 19 5 8 16Pueblo, Colo. 26 19 6 1 - - -Salt Lake City, Utah 115 67 26 10 6 6 10Tucson, Ariz. 134 104 18 7 4 1 3
PACIFIC 1,003 736 163 71 16 16 94Berkeley, Calif. 19 12 3 4 - - 3Fresno, Calif. 111 83 19 9 - - 10Glendale, Calif. U U U U U U UHonolulu, Hawaii 64 38 19 5 - 2 3Long Beach, Calif. 80 61 12 5 1 1 9Los Angeles, Calif. U U U U U U UPasadena, Calif. 23 16 3 3 1 - 5Portland, Oreg. 104 76 18 5 3 2 8Sacramento, Calif. 150 116 19 9 5 1 16San Diego, Calif. 169 127 18 16 2 6 11San Francisco, Calif. U U U U U U USan Jose, Calif. U U U U U U USanta Cruz, Calif. 27 19 6 2 - - 3Seattle, Wash. 122 84 23 9 2 4 17Spokane, Wash. 55 45 8 2 - - 6Tacoma, Wash. 79 59 15 2 2 - 3
TOTAL 11,002¶ 7,566 2,073 852 260 246 781
U: Unavailable. -:No reported cases.*Mortality data in this table are voluntarily reported from 122 cities in the United States, most of which have populations of �100,000. A deathis reported by the place of its occurrence and by the week that the death certificate was filed. Fetal deaths are not included.
†Pneumonia and influenza.§Because of changes in reporting methods in this Pennsylvania city, these numbers are partial counts for the current week. Complete countswill be available in 4 to 6 weeks.
¶Total includes unknown ages.

Vol. 49 / No. 19 MMWR 435
Contributors to the Production of the MMWR (Weekly)Weekly Notifiable Disease Morbidity Data and 122 Cities Mortality Data
Samuel L. Groseclose, D.V.M., M.P.H.
State Support Team CDC Operations TeamRobert Fagan Carol M. KnowlesJose Aponte Deborah A. AdamsPaul Gangarosa, M.P.H. Willie J. AndersonGerald Jones Patsy A. HallDavid Nitschke Pearl SharpCarol A. Worsham Kathryn Snavely
InformaticsT. Demetri Vacalis, Ph.D.
Michele D. Renshaw Erica R. Shaver

The Morbidity and Mortality Weekly Report (MMWR) Series is prepared by the Centers for Disease Control andPrevention (CDC) and is available free of charge in electronic format and on a paid subscription basis for papercopy. To receive an electronic copy on Friday of each week, send an e-mail message to [email protected] body content should read SUBscribe mmwr-toc. Electronic copy also is available from CDC’s World-Wide Webserver at http://www.cdc.gov/ or from CDC’s file transfer protocol server at ftp.cdc.gov. To subscribe for papercopy, contact Superintendent of Documents, U.S. Government Printing Office, Washington, DC 20402; telephone(202) 512-1800.
Data in the weekly MMWR are provisional, based on weekly reports to CDC by state health departments. Thereporting week concludes at close of business on Friday; compiled data on a national basis are officially releasedto the public on the following Friday. Address inquiries about the MMWR Series, including material to beconsidered for publication, to: Editor, MMWR Series, Mailstop C-08, CDC, 1600 Clifton Rd., N.E., Atlanta, GA30333; telephone (888) 232-3228.
All material in the MMWR Series is in the public domain and may be used and reprinted without permission;citation as to source, however, is appreciated.
IU.S. Government Printing Office: 2000-533-206/28011 Region IV
Director, Centers for DiseaseControl and Prevention
Jeffrey P. Koplan, M.D., M.P.H.
Acting Deputy Director for Scienceand Public Health, Centers forDisease Control and Prevention
Walter W. Williams, M.D., M.P.H.
Acting Director,Epidemiology Program Office
Barbara R. Holloway, M.P.H.
Editor, MMWR SeriesJohn W. Ward, M.D.
Acting Managing Editor,MMWR (Weekly)
Caran R. Wilbanks
Writers-Editors,MMWR (Weekly)
Jill CraneDavid C. JohnsonTeresa F. Rutledge
Desktop PublishingLynda G. CupellMorie M. HigginsBeverly J. Holland
436 MMWR May 19, 2000
Related Documents