1 IDENTIFICATION OF STRUCTURE-ACTIVITY RELATIONSHIPS IN MOLYBDENUM AND IRON- CONTAINING ZEOLITES USED IN METHANE DEHYDROAROMATISATION AND NOX REDUCTION Miren Agote Arán Department of Chemistry University College London Supervisor: Professor Andrew M. Beale Thesis submitted for the degree of Doctor of Philosophy 2018

Welcome message from author
This document is posted to help you gain knowledge. Please leave a comment to let me know what you think about it! Share it to your friends and learn new things together.
Transcript

1
IDENTIFICATION OF STRUCTURE-ACTIVITY
RELATIONSHIPS IN MOLYBDENUM AND IRON-
CONTAINING ZEOLITES USED IN METHANE
DEHYDROAROMATISATION AND NOX REDUCTION
Miren Agote Arán
Department of Chemistry
University College London
Supervisor: Professor Andrew M. Beale
Thesis submitted for the degree of Doctor of Philosophy
2018

2
Declaration
I, Miren Agote, confirm that the work presented in this thesis is my own except as
specified in the text and acknowledgements.
…………………………………………………………………………………

3
This work is dedicated to Mari Cruz Fernandez

4
Abstract
In order to design an optimal catalyst, it is important to correlate different chemical
species with their activity. This thesis is focused on structure-activity relationship studies
of M/zeolite catalysts (where M = Mo or Fe) for methane dehydroaromatisation (MDA)
and selective catalytic reduction with ammonia (NH3-SCR).
MDA is of great industrial interest as it converts methane directly into light
hydrocarbons and aromatics - precursors for the chemical industry. Mo-containing
medium pore H-ZSM-5 zeolite is a promising catalyst; nonetheless, the rapid material
deactivation compromises its commercialisation.
In order to shed light on the MDA catalyst working mechanism, the evolution of
Mo species in Mo/H-ZSM-5 has been investigated by means of synchrotron-based X-ray
absorption/diffraction techniques under operando and in situ conditions. The results
reveal that in contact with methane, initial tetrahedral Mo-oxo species attached to the
zeolite are fully carburised to MoxCy which show to be highly active for MDA. Evidences
of detachment of MoxCy from the zeolite and subsequent sintering bring new insights
regarding catalyst deactivation.
The effect of zeolite acidity and topology on MDA has been also investigated by
comparing the performance of catalysts based on Silicalite-1 (a pure siliceous analogue
of the H-ZSM-5 presenting no Brønsted acidity) and small pore H-SSZ-13. These studies
reveal that Brønsted acidity is not necessary for the aromatisation to occur and puts the
traditionally accepted bifunctional mechanism into question. Mo/H-SSZ-13 presented
different product distribution due to the shape selectivity of small pores towards lighter
hydrocarbons.
Finally, NH3-SCR is a process used to reduce NOx into N2 and H2O; among others,
Fe/zeolites present good catalytic performance. High energy resolution fluorescence
detected X-ray absorption and X-ray emission spectroscopic experiments under in situ
standard NH3-SCR conditions were performed to determine that octahedral isolated
species on Fe/H-ZSM-5 showed greater activity.

5
Statement of impact
If commercialised, routes for the direct valorisation of methane such as MDA could
contribute in the future supply of precursors for the chemical industry (i.e. light olefins
and aromatics). The industrial and financial impact of developing such routes in the UK
could be immense. UK is one of the world’s top global producers of chemicals
contributing with £15.2 bn per year to the UK economy and comprises an annual business
investment of £4 bn. Furthermore, implementation of MDA could potentially result in
positive environmental impact; methane is a potent greenhouse gas and the collection of
methane for its valorisation could help reduce these emissions.
Although much work has been focused on developing catalysts for MDA, the
materials investigated so far rapidly deactivate due to accumulation of carbonaceous
deposits during reaction; hence the design of more stable catalysts is essential. The
investigations carried out in this project provide further insight into the nature of active
species for MDA reaction over Mo-based catalysts and the results give a picture of the
potentials and limitations of Mo/zeolites for MDA. This enables to propose new
directions towards the design of a stable catalyst.
It must be mentioned that the present PhD has been one of the first Johnson Matthey
sponsored project to be based in the Research Complex at Harwell Campus. The
proximity between Harwell Campus and Johnson Matthey Technology Centre has
facilitated to connect resources from both sites. Thus, through this project advanced X-
ray spectroscopic characterisation studies carried out in Diamond Light Source in Harwell
Campus were readily combined with Johnson Matthey catalytic and characterisation
resources. The company has in turn benefited by gaining knowledge about X-ray
characterisation techniques available at Diamond Light Source and their application for
catalysis research.
Furthermore, during the course of this PhD research other facilities based in
Harwell Campus have also been explored. Thus, the catalysts prepared during the project
have been further characterised in collaboration with the Central Laser Facility. These
collaborations developed in new joint Johnson Matthey-UCL-Harwell Campus PhD
programs where the materials here prepared for MDA studies have been used by new
students working on Fluorescence Lifetime Imaging Microscopy or Kerr-Gated Raman
spectroscopy.

6
Acknowledgments
I must express my profound gratitude to my supervisors, Prof. Andrew Beale and
Dr. Anna Kroner as well as to Dr. Inés Lezcano González who provided me with the
motivation, support and knowledge needed during the PhD project. Their willingness to
give me time so generously is much appreciated and their guidance has been most
valuable during the research and writing of this thesis.
I would like to thank Johnson Matthey for sponsoring the PhD and for the input
given to the project. I am indebted to Andrew Smith and Paul Collier in Johnson Matthey
for the opportunities given since I first arrived as a master´s student full of enthusiasm
and rather poor in English language. Thanks to Maria Elena Rivas for both, scientific
discussions and friendship and also to Nikolas Grosjean for helping out with the beloved
reactor during my visits to Johnson Matthey Technology Centre. My acknowledgements
for the analytical department in Johnson Matthey, in particular to Martha Briceno,
Jonathan Bradley and Nathan Barrow for performing microscopy and NMR
characterisations.
David Wragg and Wojciech Sławiński are kindly acknowledged for the Rietveld
refinement and difference Fourier analysis of the high-resolution powder diffraction data
on Mo/H-ZSM-5. Ian Silverwood is also credited for analysing the quasielastic neutron
scattering data on Mo/zeolites.
My thanks to June Callison without whom our labs in the Research Complex at
Harwell would probably collapse. I am also grateful for the assistance received from
Hiten Patel and Gavin Stenning at Diamond and ISIS neutron source with XRD
instruments.
Huge thanks to all PhD and Postdocs in CatHub and Prof. Beale’s group. They have
been the best companion for sleepless beamtime (and Friday) nights and an inexhaustible
supply of coffee and Jaffa Cakes throughout these years. I would like to also thank friends
Marta and Laia with whom I shared Marlborough road, X34, car lifts, dancing and the
thesis writing.
Finally, I must acknowledge my family for their continuous support, specially (as
always) mum. And of course, my most sincere thanks to Vlad, for all that curry.

7
List of publications
Work carried out during this PhD program has been published, or is under review
for publication in the following papers:
- Agote-Arán, M., Lezcano-González, I., Kroner, A.B., Beale A.M., “Determination of
Molybdenum Species Evolution during Non-Oxidative Dehydroaromatization of
Methane and its Implications for Catalytic Performance”. ChemCatChem, 2018, 10,
1–9.
- Silverwood, I., Agote-Arán, M., González-Lezcano, I., Kroner, A.B., Beale, A.M.,
“QENS Study of Methane Diffusion in Mo/H-ZSM-5 used for the Methane
Dehydroaromatisation Reaction”. AIP Conference Proceedings, 2018, 1969, 030002.
- Agote-Arán, M., Lezcano-González, Greenaway, A.G., Shusaku H., Díaz-Moreno, S.,
Kroner, A.B., Beale, A.M., “Operando HERFD-XANES/XES Studies Reveal
Differences in the Activity of Fe-species in MFI and CHA Structures for the Standard
Selective Catalytic Reduction of NO with NH3”. Applied Catalysis A: General, 2019,
50, 283-291.
- Agote-Arán, M., Lezcano-González, I., Kroner, A.B, Beale, A.M., “Mo/MFI for the
methane dehydroaromatization: on the role of the Brønsted acid sites.” In
preparation for ChemCatChem.

8
List of abbreviations - BAS
- BET
- BSE
- CCD
- DFT
- DRS
- EDA
- EDX
- EPR
- EXAFS
- FID
- FT
- GC
- GHSV
- HERFD-XAS
- HRPD
- ICP-OES
- IR
- MAS
- MDA
- MS
- NH3-TPD
- PAHs
- SDA
- SEI
- SEM
- SS-NMR
- TCD
- TEM
- TEOS
- TGA
- TMAdaOH
- TPAOH
- UV-Vis
- XANES
- XAS
- XES
- XPS
- XRD
Brønsted acid sites
Brunauer-Emmett-Teller
Back-scattered electron
Couple of charged device
Differential Functional Theory
Diffuse reflectance spectroscopy
Ethylene diamine
Energy Dispersive X-Ray Analysis
Electron paramagnetic resonance
Extended X-ray absorption fine structure
Flame ionisation detector
Fourier transform
Gas chromatography
Gas hour space velocity
High energy resolution fluorescence detected X-ray absorption
High resolution powder diffraction
Inductively coupled plasma optical emission spectroscopy
Infrared
Magic angle spinning
Methane dehydroaromatisation
Mass spectrometry
Ammonia Temperature programmed desorption
Polycyclic aromatic hydrocarbons
Structure directing agent
Secondary electron image
Scanning electron microscopy
Solid state nuclear magnetic resonance
Thermo conductivity detector
Transmission electron microscopy
Tetraethyl orthosilicate
Thermo gravimetric analysis
Trimethyl-1-adamantamonium hydroxide
Tetrapropylammonium hydroxide
Ultraviolet- Visible
X-ray absorption near edge spectra
X-ray absorption
X-ray emission spectroscopy
X-ray photoelectron spectroscopy
X-ray diffraction

9
Table of Content
Abstract…………………………………………………………………………...4
Statement of impacts……………………………………………………………..5
Aknowledgments………………………………………………………………… 6
List of publications……………………………………………………………….7
List of abbreviations……………………………………………………………...8
1. Introduction………………………………………………………………… 13
1.1 Brief introduction to catalysis…………………………………………………….………..…13
1.2 Zeolites in heterogeneous catalysis…………………………………………………………..15
1.3 Metal-zeolites for methane dehydroaromatisation…………………………………………...18
1.3.1 Actual scenario in methane upgrading: interests and challenges…......…………. 18
1.3.2 Overview on methane dehydroaromatisation………………………………….…20
1.3.3 Understanding Mo/H-ZSM-5 catalyst: mechanism and deactivation …………….23
1.4 NH3-SCR technology for automotive industry……………………………….....…….……...30
1.4.1 General overview in NH3-SCR…………………………………………………...30
1.4.2 Catalytic materials for NH3-SCR…………………………………………………31
1.5 Research aim…………………………………………………………………………………32
1.6 References…………………………………………………………………………………....33
2. Methodology ………………………………………………………………….41
2.1 Sample characterisation ...…………………………………………………………….……...41
2.1.1 Powder X-ray diffraction…………….………………………………….……..…41
2.1.2 UV-Vis diffuse reflectance spectroscopy……………………...………….………43
2.1.3 Fourier transform infrared spectroscopy………………………..…………..…….45
2.1.4 Raman spectroscopy ………………………………………………………...........47
2.1.5 Solid state nuclear magnetic resonance……………………….………………......50
2.1.6 Electron microscopy ...…………………………………………………………...52
2.1.7 Gas physisorption analysis…………………………..……………………………54
2.1.8 Temperature programmed desorption of ammonia……………………………….57
2.1.9 Thermogravimetric analysis ……………………………………………………...58
2.1.10 Inductively coupled plasma optical emission spectroscoscpy…………………..59
2.2 Synchrotron-based spectroscopic techniques………………………………………………...59
2.2.1 X-ray absorption spectroscopy …....……..……………………………………….59
2.2.2 X-ray emission spectroscopy…………………..…………………………………67
2.3 Catalytic testing……………………...……………………………………………………….72
3.4 References……………………………………………………………………………………76

10
3. Study of the Nature and Location of Mo Active Sites in Mo/H-ZSM-5
Catalyst during Methane Dehydroaromatisation…………………...……..79
3.1 Introduction…………………………………………………………..………………………79
3.2 Materials and methods ……………………………………………………………….……...83
3.2.1 Catalyst synthesis and characterisation…………………………………………...82
3.2.2. X-ray absorption estudies es under operando MDA conditions ……….…….….85
3.2.3 In situ high resolution powder diffraction…...……………………………………86
3.3. Results and discussion……………………………………………………………………….87
3.3.1 Catalyst characterisation………………………………………………………….87
3.3.2 Operando X-rau absorption studies…….…………………………………….......92
3.3.3 In situ high resolution powder diffraction……………………………...………..105
3.4 Summary and conclusions…………………………………………………………………..110
3.5 References………………………..…………………………………………………………111
4. Study of the Role of the Acid Sites on Mo/zeolites for Methane
Dehydroaromatisation…………...………………………………………...... 117
4.1 Introduction…………………………………………………………………………………117
4.2 Materials and methods……………………………………………………………………... 121
4.2.1 Synthesis……………………………………………………………………...…121
4.2.2 Characterisation methods………………………………………………………..122
4.2.3 X-ray absorption spectroscopy ………………………………………………….124
4.2.4 Catalytic activity measurements………………………………….......................125
4.3 Results and discussion………………………………………………………….…………...126
4.3.1 Catalyst characterisation results…………………………………………………126
4.3.2 X-ray absorption spectroscopy during in situ calcination……………………....137
4.3.3 Methane dehydroaromatisation over Mo/MFI…………………………………..143
4.4 Summary and conclusions…………………………………………………………………..159
4.5 References…………………………………………………………………………………..160
5. Study of the Zeolite Topology in Mo/zeolites for Methane
Dehydroaromatisation………………………………………………………. 167
5.1 Introduction…………………………………………………………………………………167
5.2 Materials and methods ……………………………………………………………………...172
5.2.1 Synthesis………………………………………………………………………...172
5.2.2 Characterisation methods......................................................................................173
5.2.3 Catalytic activity measurements……………………………………...................175
5.2.4 Synchrotron studies ……………………………………………………………..175
5.2.5 Quasi elastic neutron scattering studies………………........................................176
5.3 Results and discussion………………………………………………………………………177
5.3.1 Synthesis results……………..…………………………………………………..177

11
5.3.2 Methane dehydroaromatisation over Mo/H-SSZ-13: evaluation of activity,
deactivation and evolution of Mo
species……………………………………….184
5.3.3 Further studies on Mo/H-SS-13 system………………………………………....104
5.4 Summary and conclusions…………………………………………………………………..213
5.5 References…………………………………………………..………………………………214
6. Structure-Activity Studies in Fe/zeolites for Methane Dehydroaromatisation
and Selective Catalytic Reduction of NO with NH3……......…………………219
6.1 Introduction…………………………………………………………………………………219
6.2 Materials and methods …………………………………………………………..………….225
6.2.1 Synthesis………………………………………………………………………...225
6.2.2 Characterisation methods………………………………………………………..227
6.2.3 Fe/S1-T catalysts for methane dehydroaromatisation…………………………...227
6.2.4 Fe/zeolites for selective catalyticreduction of NO with NH3…………………….228
6.3 Results and discussion……………………………………………………………………....230
6.3.1 Fe/S1-T catalysts for MDA……………………………………………………...230
6.3.2 Fe/zeolites for NH3-SCR, an in situ study……………………………………….238
6.4 Summary and conclusions…………………………………………………………………..257
6.5 References…………..………………………………………………………………………259
7. Conclusions and Future Work…………………..…………………………..265
7.1 Conclusions………………………………………………………………………………....265
7.2 Future work………………………………………………………………………………....268
Appendix.………………...……………………………………………………....271

12

13
Chapter 1
Introduction
This chapter provides a general overview of the field of catalysis highlighting the
aspects of zeolite materials as heterogeneous catalysts. The main focus of this thesis
research is the study of metal-containing zeolites for the methane dehydroaromatisation,
hence, the state of the art in this reaction is presented in more detail. Zeolite-based
catalysts applied for selective catalytic reduction of toxic NOx with NH3 is also studied
in the course of the project and is thereby also described here. Finally, the research aim
and the outline of the thesis are defined in the end of the chapter.
1.1 Brief introduction to catalysis
A catalyst is a material which increases the rate of a chemical reaction, by providing
an alternate reaction pathway lowering the activation energy of the reaction.1 An
important feature of a catalyst is that it accelerates reactions without itself being
consumed, hence only small amounts are required to increase the rate of reaction.
Although many of the traditional processes for fermentation of wine or
manufacture of soap from fats involved unconscious application of catalysts, the term
“catalysis” was first coined by the Swedish chemist Berzelius in 18352 to refer to a series
of observations in reaction rate increase made by other chemists. Later studies on reaction
rate carried out by Michael Faraday, J.H. van’t Hoff, Svante Arrhenius, and Wilhelm
Ostwald, constituted key steps for developing catalysis science.3,4
The deliberate use of catalysts in industrial processes was first undertaken in 1831
by the British chemist P. Phillips who patented the use of platinum to catalyse the
oxidation of sulphur dioxide to sulphur trioxide with air.5 Nowadays, catalysis is
fundamental to many industrial processes such as the production of polymers,
pharmaceuticals and fine chemicals while it is also used for emission control systems for

14
reducing engine toxic release. In fact, it is estimated that 90 % of all chemical processes
today rely on catalysis6 and that it contributes to ~ 35 % of the world’s gross domestic
products.4
Catalytic materials can be broadly classified as heterogeneous or homogeneous.
Heterogeneous catalysis is termed when the catalyst and the reactants are in different
phases; most commonly a solid catalyst with gaseous or liquid reactants. In homogeneous
catalysis, the reactants and the catalyst are both in the same phase, usually contained
within a single liquid phase. Thus, homogeneous processes allow a very high degree of
interaction between catalyst and reactant molecules resulting in high conversion and
selectivities. Heterogeneous catalysts are usually less active and selective, but they offer
advantages compared to homogeneous ones: they present better thermal stability and
catalyst recovery is easy and cheap. Most of industrial catalysts today are indeed based
in heterogeneous processes.
A typical heterogeneous catalyst contains an active phase and a support phase
acting as the carrier where the active compound is affixed. The active phase is often a
transition metal complex while there is a large variety of compounds that can be used as
the support, among them are Al2O3, SiO2, TiO2, CeO2 as well as zeolite crystals. Zeolites
have become one of the most important materials in heterogeneous catalysis; they act as
stable, large surface area support for active metals, while the zeolite itself can also act as
the active phase for a second catalytic function.
Since the development of zeolite synthesis procedures by Union Carbide in the
1930s, zeolites have undergone an immense industrial impact.7 Today, they have a large
variety of applications as catalysts including fine chemical synthesis, petrochemistry, and
environmental protection. A reflection of this impact is that the global market for
synthetic zeolites is estimated to reach $ 20 bn by 2025.8
The success of these materials relay on the fact that they are environmentally benign
and present good thermal and hydrothermal stability for catalytic applications. Besides,
their topological and chemical structures bring them unique properties. Zeolites present
well-defined microporous structure with pore sizes in the range of molecular dimensions
resulting in: large surface area, high gas adsorption capacity, the possibility to act as
molecular sieve or direct the reaction selectivity, ion exchange capacity, and the
possibility to modulate zeolite acidic properties.

15
1.2 Zeolites in heterogeneous catalysis
Zeolites are crystalline microporous aluminosilicates with open 3D framework
structures built of SiO4 and AlO4 tetrahedra. These tetrahedra link to each other by their
corners sharing all the oxygen atoms. This can result in a rich variety of structures9
containing linked cages, cavities or channels. These cavities comprise few angstroms
diameters and are big enough to allow small molecules to enter.10
At present, there are 206 unique zeolite frameworks identified, and over 40 naturally
occurring zeolite frameworks known. Depending on their pore size the zeolites are
classified as large (12 tetrahedra (T) ring and 6-8 Å diameter), medium (10T ring, 4.5-6
Å) and small pore (8T ring or less, 3-4.5 Å) zeolites. Figure 1-1 illustrates the basic
building units that define zeolite topology.
Figure 1-1. Schematics of zeolite structure; going from connection of basic SiO4 and AlO4- tetrahedra (left)
to 3D porous structure (right) by the combination of building units.
Another interesting feature of zeolites is that their aluminosilicate framework is
negatively charged due to the presence of trivalent Al in tetrahedral coordination.
Consequently, the framework attracts positive cations (such as Na+, K+, H+, Ca2+, Mg2+,
etc.) that reside in cages to compensate the negative charge. When H+ is the compensating
cation of the AlO4- tetrahedra this proton acts as a Brønsted acid site. Thus, the acidity of
a zeolite can be optimised by adjusting the synthesis to a specific framework Si/Al ratio.
Furthermore, as the cations are rather loosely held they can readily be exchanged for

16
others in a contact solution. This allows the synthesis of metal/zeolites with high metal
dispersion.
The artificial preparation of zeolites requires a slow crystallisation of a silica-
alumina source generally by hydrothermal treatment.11 Hydrothermal synthesis of zeolites
is usually carried out in closed autoclaves, where an aqueous gel comprising silicon and
aluminium precursors, structure directing agents, and sources of other elements are treated
at high temperature (up to 180 °C) and pressure (P > 1 bar).
Most commonly zeolite syntheses are performed in a highly basic medium (pH
values ~ 11 to 14) in order to facilitate the dissolution of silicon precursors. The OH-
anions (from alkaline and organic structure directing agent hydroxides) act as a
mineraliser during the zeolite synthesis aiding the solubilisation of Si and Al precursors.
Fluoride anions are alternative mineralisers that can also facilitate zeolite synthesis.12 The
structure directing agents (SDA), have the role of guiding the formation of a particular
zeolite structure. Most widely used SDAs are organic molecules containing one or two
quaternary ammonium groups. During hydrothermal synthesis, the crystal framework is
formed around these organic molecules, so the SDA shape controls the size of zeolite
channels or cavities defining the type of zeolite framework synthesised.
Furthermore, zeolite post-synthetic treatments allow the modification of a given
crystal topology to acquire desirable framework compositions and other properties.12
Zeolite treatments in acid or basic media are used to extract Al or Si from the framework
and thus obtain high silica framework or to generate silanol defects in the crystal. These
treatments can be also used to prepare zeolites with hierarchical pore structure with
enhanced mass transport and diffusion within the crystal.13
Addition of transition metals with catalytic properties is also often performed as
zeolite post-treatment procedure by the so-called ion exchange synthesis. In liquid ion
exchange process, the zeolite is suspended in an aqueous solution of a soluble salt
containing the desired active metal cation. This is carried out preferably at elevated
temperatures and under stirring to enhance mass transfer. The charge compensation
cations of the zeolite (generally, H+, Na+, NH4+) are then exchanged with the metal cation
in the solution. Ion exchange in solid state can also be carried out; in this method the
zeolite (typically in H+ form) and a precursor containing the ingoing metal cation are

17
intimately mixed and heated. Incipient wetness impregnation, is also a commonly used
method for the preparation of M/zeolite catalysts. In this synthesis, the active metal
precursor is dissolved in an aqueous or organic solution. The solution is then added to the
zeolite containing the same pore volume as the volume of the solution added. Capillary
action draws the solution inside the pores and subsequent calcination removes volatile
compounds of the mixture depositing the metal on the zeolite surface and interacting with
BAS.
A heterogeneous catalytic process involves a sequence of elementary steps, such as
adsorption of reactant on the catalytic surface, the surface diffusion of reactants, chemical
rearrangement of the adsorbed reaction intermediate and desorption of the products.
Hence, the structure of the catalyst, in terms of physical, textural and morphological
properties as well as the nature of active transition metals species (i.e. oxidation state,
coordination, monomeric vs clusters) can strongly affect each of these steps. The
possibility to synthetically tune the zeolite topology, its acidity and the nature of active
metals using the methods described above, permits the optimisation of M/zeolite
structures for their use as catalysts for specific chemical reactions.
Many types of zeolites have found catalytic application in oil refining and
petrochemistry industries due to the activity of zeolite Brønsted acid sites associated to
framework Al. These sites can catalyse hydrocarbon transformations, such as cracking,
isomerisation, alkylation, and aromatisation reactions. The combination of acid site
strength with the pore size in these applications has allowed to exploit the shape-
selectivity in zeolites. This consists on adjusting the selectivity to specific products based
on space constrains provided by the zeolite pore size.14 A good example of shape-
selectivity applied for an industrial process is the conversion of methanol to hydrocarbons
in which the product distribution is to a great extent predictable based on the pore size of
the zeolite used. Thus, small-pore zeolites are more selective to light olefins, while
medium- and large-pore zeolites give larger hydrocarbons.14
M/zeolite catalysts are extensively investigated for their use in emerging
applications such as the valorisation of methane to higher value chemicals.15 Natural gas
appears as an attractive alternative for fossil fuels due to its abundant supply and its high
H/C ratio.16 One of the direct routes for methane upgrading is the non-oxidative methane
dehydroaromatisation reaction (MDA). Mo-containing zeolites, mainly ZSM-5 but also

18
MCM-22, have been widely studied as the catalysts for MDA.17,18 Nonetheless, the rapid
catalyst deactivation is a handicap for the commercialisation of this route. Most of the
work of this thesis is focused on the investigation of Mo/zeolite structural properties for
MDA activity; thus, a detailed overview regarding the scope, mechanism and catalytic
materials in MDA is given in the following section.
Another important area of application of zeolite catalysts is the emission control
technology. In diesel engine systems, zeolites can act as effective diesel oxidation
catalysts helping to reduce hydrocarbon emissions.19 Metal-exchanged zeolites are also
used in catalytic converters for decreasing the emission of toxic nitrogen oxides (NOx).
In this process NOx is reduced selectively by selective reduction to inert N2 and H2O. The
hydrocarbons present in the exhaust fumes (HC-SCR)20 or ammonia injected purposely
(NH3-SCR)21 can be used as the NOx reducing agents. Fe and Cu exchanged zeolites have
been widely studied for SCR application22,23 while different zeolites such as H-ZSM-5,
mordenite, ferrierite and zeolite beta have been used as the support.22 In the last decade,
small pore zeolites with CHA structure have become the most common support for NH3-
SCR catalysts in vehicle engine applications providing high conversions and exceptional
hydrothermal stability.21 As part of the research in this thesis is focused on the study of
M/zeolites for NH3-SCR in vehicles, this application is further reviewed in Section 1.4.
1.3 Metal-zeolites for methane dehydroaromatisation
1.3.1 Actual scenario in methane upgrading: interests and challenges
Fossil fuels are nowadays the principal raw material for the production of
commodity chemicals. However, crude oil is naturally formed far too slowly to be
replaced at the rate at which it is being extracted; the world’s natural oil supply is fixed
and the capacity to maintain and grow global supply is attracting increasing concern.
Aromatics and especially light olefins, which are typically obtained through
naphtha cracking, provide the basic building blocks for the complex molecules that
comprise polymers, detergents, medicines, pesticides, etc. Biomass has been considered
as an alternative raw material, however several issues exist with exploiting biomass
regarding deforestation, the need of large harvesting area and the ethical concern of using

19
arable land for energetic purposes taking into account the difficulties in providing food
to an increasing population.24
Methane gas could be a promising alternative to oil to provide platform chemicals.
Methane is abundant petrochemical resource; it is found as shale gas reserves along the
world, in Siberia in conventional wells and as methane clathrate trapped in ice in the
surrounding oceans and tundra. The development of hydraulic fracturing technology has
significantly increased the recoverable reserves and supplies of natural gas especially in
the US,25 an example of this is that the US is projected to become a net natural gas
exporter by 2035.26 Alternatively, methane can be obtained by coal gasification or even
from renewable sources. Biogas which is primarily CH4 and CO2 can be produced from
raw materials such as agricultural waste, manure, municipal waste, plant material,
sewage, green waste or food waste.27 Proposals also exist for the CH4 production by
transforming captured CO2.28
Nonetheless, methane activation is not a facile case and the conversion of methane
into value-added chemicals is one of the most challenging subjects to be studied in
heterogeneous catalysis.15 This is because methane is thermodynamically a very stable
molecule with four strong C–H bonds (435 kJ/mol), it offers no functional group,
magnetic moments or polar distributions to participate in reactions. Consequently, there
is only one methane to hydrocarbons route currently industrialised. This commercial route
consists of a multiple-step process where methane is first converted to syngas (CO + H2)
at elevated temperature (> 700 °C) and subsequently, syngas is used to make various
hydrocarbons or alcohols by means of different catalytic processes.29 Due to the presence
of multiple steps this process is energy intensive and economically expensive. Therefore,
direct conversion of methane into platform chemicals is an important goal to reduce costs
and energy consumption. The catalytic systems for the direct transformation of methane
into higher value chemicals are still in research stage and can be classified as oxidative
or non-oxidative processes. The oxidative processes, such as partial oxidation of methane
to methanol and formaldehyde or oxidative coupling of methane to ethylene, are
thermodynamically favourable. However, transformations of methane to water and
carbon dioxide are even more favourable and in the presence of oxygen, the hydrocarbon
products are oxidised to carbon dioxide and water, decreasing the selectivity at high
methane conversions.17

20
The non-oxidative methane process transforms methane directly into hydrocarbons
and hydrogen in oxygen-free conditions.30 Although with lower methane conversions,
this route results in higher selectivity to desired hydrocarbons compared with the
oxidative processes.
The different possible routes for the valorisation of methane into higher value chemicals are
summarised in
Figure 1-2.
Figure 1-2. Schematics of the existing indirect and direct routes for obtaining precursors for the
chemical industry.
1.3.2 Overview on methane dehydroaromatisation
The non-oxidative methane to hydrocarbons reaction is also known as methane
dehydroaromatisation (MDA) because aromatics (specially benzene as well as
naphthalene and toluene) are the mayor reaction products. As shown in Table 1-1, MDA
is an endothermic process not favourable thermodynamically at low temperatures;
however, considerable conversions (~ 15 %) can be obtained above 700 °C with high
selectivity to aromatics (up to 80 %).17

21
Table 1-1. Standard enthalpies and Gibbs free energies of the reactions involved in the MDA process.
Reaction ΔHr° (kJ.mol-1) ΔGr° (kJ.mol-1)
6CH4 ↔ C6H6 + 9H2 +532 +330
2CH4 ↔ C2H6 + H2 +65 +70
2CH4 ↔ C2H4 + 2H2 +202 +170
3CH4 ↔ C3H8 + 2H2 +121 +128
3CH4 ↔ C3H6 + 3H2 +245 +215
In the MDA route methane is the only reactant and the most widely used catalyst is
the Mo exchanged H-ZSM-5 zeolite. Typical reaction conditions used are: methane as
sole reactant diluted in inert gas, temperatures of > 700 °C and atmospheric pressure. The
major obstacle for the commercialisation of this reaction is the high selectivity towards
carbon deposits. The carbon deposit formation rate has been reported to increase during
reaction31 resulting in catalyst deactivation by pore blocking. The time required for the
catalyst to lose its activity can vary between 4 to 16 hours depending on the reaction
conditions and catalyst characteristics.32,33
Most publications cite three different stages for this reaction:
1) Induction period: occurring in the initial 5-45 min of reaction. In the induction
period there is no aromatic formation and combustion products (i.e. CO, H2O and CO2)
and H2, are formed instead. It is accepted that in this stage the Mo6+ oxides are reduced
forming MoCx or MoOxCy species which are the active species for MDA.16,30
2) Aromatisation stage: once the active molybdenum species are formed after the
induction period the evolution of combustion products ceases and light hydrocarbons
(mainly ethylene) and aromatics productions is observed.
3) Deactivation: during the aromatisation, catalyst activity gradually decreases and
it has been reported that selectivity to aromatic products decreases while carbon
deposition rate increases.31 The accumulation of carbon deposits in the catalyst is
considered the main cause of the rapid material deactivation.

22
The non-oxidative methane to hydrocarbons transformation using metal Mo/H-
ZSM-5 as the catalyst was first reported by Wang et al. in 1993.34 Since this first discovery
researchers have worked to investigate the activity of different metal exchanged
zeolites.17,35 Studied transition metals include Zn, W, Re, Cu, Mn, Ni, Cr, V, Fe, Pt, Pd
and Ga; among them Mo shows a most promising performance. Nonetheless, the lack of
systematic initial studies regarding the catalyst preparation, and reaction conditions made
it difficult to reliably compare the performance of these materials.17 Weckhuysen et al.35
paid more attention to the preparation, metal loading, and zeolite acidity using Mo, Fe, V,
W and Cr metals on H-ZSM-5 support. In their detailed studies on the conversion of
methane to benzene they found Mo to be the most active metal and that the activity
decreases in the following order: Mo > W > Fe > V > Cr.
Methane activation in MDA has also been studied for Mo-based catalysts supported
on different zeolites. Zhang et al.36 reported the following trend for methane aromatisation
activity for Mo/zeolites: H-ZSM-11 > H-ZSM-5 > H-ZSM-8 > H-β > H-MCM-41 > H-
SAPO-34 ≈ H-MOR ≈ H-X ≈ H-Y > H-SAPO-5 ≈ H-SAPO-11. They suggested that the
use of medium pore zeolites with pore diameter close to the dynamic diameter of the
benzene molecule is beneficial for MDA reaction as they provide shape selectivity to
aromatic products. Due to the good performance and its commercial availability, H-ZSM-
5 is being the most widely investigated support for MDA.
Although studied in less extent, H-MCM-22 also deserves a special mention. This
topology37,38 possesses a unique pore architecture with two independent pore systems (a
smaller 10 ring 2D system and a larger 12-ring super cage system interconnected by 10
ring windows). It has been proposed that the slower deactivation observed in MCM-22
compared to H-ZSM-5 is due to the presence of supercages in the structure which afford
a higher coke accommodation.38
Non-zeolite supports such as SiO2 and TiO2 have been also studied but little or no
MDA activity was reported for these catalysts.39 A recent publication however, reported
promising performance on Fe supported on amorphous SiO2 to convert methane directly
into hydrocarbons and aromatics.40 The catalyst in question, termed as Fe@SiO2 (0.5 wt.
%), is reported to contain single iron atoms embedded within the silica matrix. This
material showed methane conversion rates of up to 48.1 % at 1100 °C and reaction
products were limited to hydrocarbons (mainly ethylene, benzene and naphthalene).

23
Interestingly, no carbon deposition was reported and the catalyst activity remained stable
for 60 h. Their hypothesis is that the catalyst efficiency is due to the high activity of
coordinatively unsaturated iron sites; the isolated nature of this sites prevents C-C
coupling and hence carbon deposit formation.
1.3.3 Understanding Mo/H-ZSM-5 catalyst: mechanism and deactivation
1.3.3.1 Location and nature of Mo sites on the Mo/H-ZSM-5
Due to its good performance, ion exchanged Mo/H-ZSM-5 has been the most
studied catalyst for MDA. In order to understand its working mechanism, it is crucial to
study the nature and location of Mo species. Mo/H-ZSM-5 zeolites are generally prepared
by impregnation (using (NH4)6Mo7O24 as the precursor) or by solid state ion exchange
(with MoO3 precursor). In both cases calcination in air leads to the formation of MoO3
that can enter into the zeolite pore channels via surface and gas phase transport. Many
papers are devoted to investigate the state and location of the molybdenum inside the
zeolite matrix, but no consensus has been reached yet. This uncertainty is related to the
fact that Mo location and speciation depends on many factors such as metal loading,41
calcination temperature and time,42 Si/Al ratio,43 or the crystal size44 of the zeolite.
- Location and nature of Mo species after calcination:
Iglesia et al. investigated the Mo species in detail for 1-6 wt. % Mo/H-ZSM-5
catalysts using X-ray absorption spectroscopy, 27Al nuclear magnetic resonance (NMR),
Raman spectroscopy as well as temperature programmed oxidation and reduction (TPO
and TPR).45–47 According to their results during calcination MoOx species are initially
distributed over the external surface of the zeolite. After 500 °C MoO3 starts migrating
into the zeolite channels where ion exchange occurs at the Brønsted acid sites. They
proposed that [MoO2(OH)+], dinuclear [Mo2O52+] and mononuclear [MoO2
2+] species are
formed upon calcination. It was claimed that during the induction period dinuclear
[Mo2O52+] lead to the formation of MoCx clusters (0.6-1 nm) which they considered to be
the active species. The strongest evidence for dimers was obtained from X-ray absorption
spectroscopy data using MoMg2O7 reference compounds which contain dimeric Mo in
the structure.47 They reported that during reaction Mo/H-ZSM-5 gradually evolves to
Mo2O72- dimer resembling MgMo2O7 with two of the O atoms located in the zeolite
framework.

24
Alternatively, Bao et al. reported different conclusions.48 They characterised 8 wt.
% Mo/H-ZSM-5 sample by means of powder XRD structural analysis. They suggested
that after calcination Mo species are dispersed not only in the internal surface but also on
the external surface of the zeolite. These species were described as [Mo5O126+] inside the
channels and Mo oxides in the external surface. They hypothesised that both types of Mo
species are converted to a mixture of MoOxCy, Mo2C and [Mo5OxCyn+] during the first
stage of the MDA reaction. According to this research, [Mo5OxCyn+] units located inside
the ZSM-5 channels are the species with high capacity for benzene activation.
Ma et al.49 and Liu et al.50,51 reported to have found polynuclear Mo species located
in the external surface of the support; MoO3 (octahedral) or MoOx (square-pyramidal) and
also Mo species associated with Al ions were found inside zeolite channels. They
concluded that during the induction period, external Mo species undergo formation of
Mo2C while those in the zeolite channels are partially reduced to MoOx.
In 2015, Wachs et al.52 carried out a study to identify the MoOx anchoring sites by
combining quantum chemical calculations using density functional theory (DFT) with
multiple spectroscopic techniques. They propose that initial metal species consist of
isolated tetrahedral Mo oxides anchored on Al or Si sites in the zeolite internal surface.
More recent research carried out by Gascon et al.53 correlated the Mo speciation
present in calcined Mo/H-ZSM-5 with the metal loading, Si/Al ratio and framework Al
distribution. They propose a systematic way to manipulate the configuration of Mo (i.e.
location, geometry or isolation). Interestingly, they report that the catalytic behaviour is
unaffected by the initial configuration of MoOx species.
- Location and nature of Mo species during the MDA reaction:
Debate is ongoing regarding the nature and location of active species responsible
for MDA as fully carburised MoCx and partially carburised MoOxCy have been reported
to be the active centres. It is accepted that initial molybdenum oxide species present after
calcination undergo reduction and carburisation under methane in non-oxidative
conditions. Nagai et al.54 report three different forms of Mo-carbides in the carburised
Mo/H-ZSM-5: α-Mo2C1-x, β-Mo2C and µ-Mo3C2. They also suggest µ-Mo3C2 to be less
active to aromatics as methane was transformed to pyrolytic carbon. Studies with ultra-
high field solid state 95Mo NMR spectroscopy have been also used to investigate the active

25
sites of Mo/H-ZSM-5 suggesting that fully carburised Mo species play this role during
the MDA.
Zaikovskii et al.55,56 drew more distinct conclusions about the Mo species. Using
high-resolution transmission electron microscopy (HRTEM), dual-energy X-ray
absorptiometry (EDXA) and electron paramagnetic resonance (EPR) techniques they
reported that methane is activated on oxidised molybdenum clusters inside the zeolite
channels. Mo2C particles were found in the external surfaces which were deactivated in
the early stages of the reaction due to carbon deposition.
Bao et al.48 supported that [Mo5OxCyn+] units located inside the ZSM-5 channels
are the species with high capacity for benzene activation while operando XES studies
carried out previously by our group57 suggested that MoCxOy species are present during
the induction period, these are active for C2Hx/C3Hx formation. Further carburisation
leads to MoCx which are the active species responsible for aromatics formation.
The most recent work regarding this long-lasting debate has been published by
Hensen et al.58 who reported that full carburisation of Mo is not required to observe
aromatisation. They proposed that Mo-carbide\ species are merely spectators on the
external surface whilst Mo-species inside the pores and not carbidic in nature are the
active species. They also suggested confined carbon species to have an important catalytic
role in MDA.
1.3.3.2 Reaction mechanism
A bi-functional mechanism is most widely accepted for the non-oxidative methane
to hydrocarbons reaction over Mo/H-ZSM-5 catalyst. This mechanism comprises the
activation of methane in the Mo sites followed by hydrogen release and formation of
surface CHx species. Then, the products of their dimerisation (mainly ethylene) are
subjected to aromatisation on the Brønsted acid sites of the zeolite yielding benzene and
other aromatic molecules.
Regarding the activation of methane in Mo species, different mechanisms have
been proposed in the literature. These comprise:

26
> Methane activation via formation of CH3· radicals,32 these radicals then
dehydrogenate to form ethylene which is further aromatised to benzene in the
zeolite BAS.
> Methane activation via heterolytic splitting and the formation of Mo-carbene
intermediate;59 This carbene-like intermediate is then dimerised to form
ethylene. Ethylene is further oligomerised on the Brønsted sites to form
aromatics. Recently, Xing et al.60 and Zhou et al.61 carried out density
functional theory studies and proposed a detailed mechanism where Mo-carbide
is first hydrogenated to Mo-carbene (Mo=CH2) intermediate. Mo=CH2
polarises and activates methane forming two methyl groups which undergo C-
C coupling by H2 elimination and forming ethylene. A schematics of the
proposed mechanism on monomeric Mo species is shown in Figure 1-3.
Figure 1-3. Schematic example of reaction pathway for the methane coupling to ethylene proposed by Zhou
et al.61 Figure adapted from reference 61.
The essential role of zeolite BAS for MDA was proposed on the basis that Mo-
based catalysts prepared using non acidic supports showed low or no selectivity to
aromatics.39,62–64 Kinetic studies have been carried on Mo/zeolites in order to propose
models for the aromatisation process by the BAS.65,66 These involve oligomerisation of
ethylene intermediate into benzene and other polycyclic aromatic hydrocarbons occurring
via acid catalysed reactions grouped into: chemisorption, desorption, oligomerisation, -
scission, hydride transfer, protolytic dehydrogenation and hydrogenation, protolysis,
alkylation and dealkylation of toluene and naphthalene.
Nonetheless, titration studies by Tessonier et al. on Mo/H-ZSM-5 with different
Si/Al67 showed that enhanced activity in acidic zeolites was mainly because they provide

27
more anchoring points for a better Mo dispersion. They suggested that very few acid sites
(down to 0.18 mmol/g-1) must be enough to perform aromatisation of all the ethylene
formed in the Mo active sites.
Recently, a monofunctional mechanism is also being considered on account of
methane aromatisation achieved by Fe@SiO2 catalysts with no BAS.40 Furthermore,
although with low conversion and yields, MDA activity results have been also published
for Mo supported on Silicalite-1, the pure siliceous analogue of the H-ZSM-5 zeolite.68
In addition to the widely studied roles of Mo species and BAS, it has also been
pointed out by some authors that carbon deposits may also play an active part in the
reaction mechanism.69,70 In line, hydrocarbon pool type mechanism has also been
proposed in which benzene is derived from secondary reactions of confined polyaromatic
carbon species.71
1.3.3.2 Deactivation and regeneration
Several causes have been attributed to the rapid catalyst deactivation, these include:
1) accumulation of carbon deposits that block the access of reactants to the active sites,
2) dealumination of the zeolitic framework and loss of Brønsted acid sites, and 3)
sintering of the active molybdenum sites and loss of active surface to undergo reaction.
It has been commonly reported that coke deposition during reaction is the main
contributing factor for the catalyst deactivation. The concentration of carbon deposits
increases with the reaction time72 and with the temperature;73 besides, the coke formation
rate seems also to increase with increasing reaction time.31 In spite of the great effort
dedicated to the study of carbon deposition during MDA, different research groups have
drawn contradictory conclusions.
In early studies, two types of carbon deposits were proposed in basis of 13C cross
polarisation magic angle spinning NMR experiments carried out for reacted Mo/H-ZSM-
5. One located near the Brønsted acid sites and the other on the Mo active centres.70 Later
on, different techniques such as X-ray photoelectron spectroscopy (XPS)62 or temperature
programmed techniques72 suggested the presence of at least three types of carbon
deposits: coke associated to molybdenum active sites, carbidic C as a component of Mo-
carbide, and pre-graphitic or aromatic type coke deposited in the acid sites.

28
Liu et al.74 characterised carbon deposits by means of several techniques including
XPS, thermo gravimetric analysis (TGA), differential thermal analysis (DTA) and
HRTEM. They observed that sp2/sp3 ratio of the coke increases with time-on-stream and
they suggested that polyaromatic-type carbon deposits are the main cause of catalyst
deactivation. Shu et al.62 who investigated the O 1s binding energy in XPS spectra of both
fresh and used catalysts proposed that coke formation occurs mainly on molybdenum sites
present on the external surface of ZSM-5. They suggest that deactivation of the catalyst
occurs mainly due to the coverage of Mo sites responsible for methane activation. Honda
et al.75 however, came into different conclusions when studying a physical mixture of
Mo2C/α-Al2O3 and H-ZSM-5. After reaction they separated and characterised the two
components of the mixture and TGA results suggested that coke accumulation occurred
mainly on H-ZSM-5. Furthermore, they showed that a deactivated Mo/H-ZSM-5 catalyst
can exhibit high activity for MDA when fresh H-ZSM-5 is added. Zheng et al.76 proposed
that in addition to deactivation due to carbon deposition and pore blockage, the loss of
activity in Mo/H-ZSM-5 is to a large extent also due to the extraction of aluminium from
the zeolitic framework and the subsequent loss of the support acidity.
A recent publication by Hensen et al.31 described a detailed study on the
deactivation of Mo/H-ZSM-5 catalysts using XPS, Raman spectroscopy, TGA and TEM
characterisation techniques. They attributed catalyst deactivation to the formation of a
polyaromatic hard coke layer at the external zeolite surface which blocks the micropores
and, hence the accessibility to the Brønsted acid sites inside the pores. They also proposed
that the formation of the carbon layer separates the Mo2C particles from the zeolite surface
promoting the sintering of the highly dispersed MoCx particles at the external surface.
They deduced that methane conversion rate also decreases as a result of the decreasing
MoCx dispersion. Figure 1-4 shows a schematic representation of this hypothesis.
XRD and Fluorescence lifetime image studies by I. Lezcano et al. suggest
dealumination during reaction is minimal and that deactivation is due to carbon deposition
which occurs in the zeolite outer surface.57

29
Figure 1-4. Schematic representation of the state of Mo/H-ZSM-5 during its life as an MDA catalyst
proposed by Hensen et al. 31 Figures represent: a) calcined Mo/H-ZSM-5 and b) Mo/H-ZSM-5 in the early
stage of MDA reaction and c) Mo/H-ZSM-5 after hours of reaction. Figure adapted from reference 31.
Many researchers have focused their studies on catalyst regeneration procedures.
Engineering approaches include the design of reactor configurations to remove the coke
deposited in the catalyst by the use of different feed gases.17,18 By means of oxidative
regeneration at 520-600 °C for example, the catalyst activity can be easily regained;
however, several reaction–regeneration cycles show progressive catalytic deactivation in
each cycle as well as the gradual loss of MoO3 by sublimation. Reduced Mo sublimation
could be achieved by a regeneration procedure based on optimised O2 pulses studied by
Hensen et al.77 The addition of hydrogen or oxidants (e.g. CO2) as well as C2–C4
alkanes/alkenes to the methane feed can also improve catalyst longevity.18
Membrane reactors to remove H2 during MDA reaction and thus enhance CH4
conversion have attracted increasing attention.78–81 Initial studies revealed significant
increase in the conversion; however, faster catalyst deactivation was observed. Recently,
the integration of an electrochemical membrane exhibiting both proton and oxide ion
conductivity into an MDA reactor has demonstrated to give high aromatic yields and
improved catalyst stability by reducing coke production rate by a factor of 6. These effects
originate from the simultaneous extraction of hydrogen and distributed injection of oxide
ions along the reactor length.82
Despite all these advances, deactivation by carbon deposit accumulation cannot be
completely suppressed in MDA and it is still the main handicap for the commercialisation
of this methane valorisation route.
1.4 NH3-SCR technology for automotive industry
1.4.1 General overview in NH3-SCR
Nitrogen oxides (NO and NO2) are one of the major sources of air pollution
produced from engines during fossil fuels combustion processes. NOx is formed by the

30
oxidation of atmospheric nitrogen or organic nitrogen present in fuel83 and it can
contribute up to 75 % of the total NOx emissions of road traffic.84
Many efforts have been focused on the abatement of these emissions. While NOx
from gasoline is efficiently reduced by means of a three-way catalyst, this technology
cannot be applied in diesel engines because they operate under oxygen excess. An
alternative technology that has been successfully applied for such engines is the selective
catalytic reduction with ammonia (NH3-SCR) to give N2 and H2O. In this reaction the
stoichiometric dosage of ammonia is sufficient for total NOx conversion. NH3-SCR has
been applied to control emission of stationary diesel engines since the early 1970s and
currently this technology is widely used in Japan, Europe and the United States.85 In the
last decade NH3-SCR has been successfully applied to the automotive industry and due
to increasingly stringent legislations in NOx emissions,86 most of the heavy-duty engine
manufacturers have chosen to implement this technology.
In NH3-SCR for vehicle applications, urea is typically used as a storage compound
due to its lower toxicity (see scheme in Figure 1-5). When dosing the urea to the exhaust
gas (at 750-900 °C) which contains water, it is readily decomposed to NH3:87,88
NH2-CO-NH2 → NH3 + HNCO Equation 1-1
HNCO + H2O → NH3 + CO2 Equation 1-2
Diesel engines produce NOx mainly in the form of nitrogen monoxide (NO) while
only a minor fraction comprises nitrogen dioxide (NO2).83 Hence, the basic SCR reaction,
also known as “standard SCR”, is as follows:
4NH3 + 4NO + O2 → 4N2 + 6H2O Equation 1-3
When the feed gas contains a 1:1 mixture of NO2 and NO, SCR reaction is faster
and is denoted as “fast SCR” (Equation 1-4). If the NO2:NO > 1:1, an SCR reaction with
pure NO2 also takes place (Equation 1-5):83
4NH3 + 2NO + 2NO2 → 4N2 + 6H2O Equation 1-4
4NH3 + 3NO2 → 3.5N2 + 6H2O Equation 1-5

31
Figure 1-5. Scheme of a NH3-SCR exhaust gas treatment unit in vehicles.
With rising reaction temperature, and therefore the oxidation activity, undesired
N2O side product can be formed and the selectivity to N2 is decreased. The reactions that
could potentially lead to the formation of N2O are the following:
2NH3 + 2NO2 → N2O + N2 + 3H2O Equation 1-6
3NH3 + 4NO2 → 3.5N2O + 4.5H2O Equation 1-7
2NH3 + 2O2 → N2O + 3H2O Equation 1-8
4NH3 + 4NO2 + O2 → 4N2O + 6H2O Equation 1-9
4NH3 + 4NO+ 3O2 → 4N2O + 6H2O Equation 1-10
1.4.2 Catalytic materials for NH3-SCR
The catalysts studied initially for NH3-SCR in automotive industry were based on
TiO2-supported V2O5. These materials were indeed applied since 2005 for diesel vehicles
in Europe.21 Nonetheless, many concerns arose with the use of V2O5/TiO2 due to its
undesired activity for SO2 oxidation to SO3, the low activity/selectivity ratio, and a high
degree of toxicity and volatility (> 650 °C) of the vanadia compounds. Thus, different
research groups carried on investigating new catalysts for NOx abatement, among them
Mn-based catalysts or metal oxides supported on activated carbon have been studied.89
An initial work on SCR over Cu/ZSM-5 catalysts in 1986 by Iwamoto et al.90 motivated
the investigation of metal/zeolites as the catalyst for NOx reduction. Since then metal
exchanged zeolites have received much attention due to their good catalytic performance.
Fe and Cu exhibit the most promising activities while studies using different zeolites
showed enhanced durability for zeolite beta as the support.22,91,92

32
In recent years, Fe or Cu-containing chabazite zeolite (with CHA crystal structure)
have been developed by BASF and Johnson-Matthey Inc. These small pore based
catalysts were first commercialised for NH3-SCR technology in 2010 and they are now
the most used catalysts for NOx emission control abatement in vehicles.21
The NOx reduction mechanism over Cu- and Fe- based zeolites is still under debate
and constitutes a main focus of study for many research groups. Up to date, no consensus
has been reached regarding the nature of active metal centres as monomeric, dimeric as
well as clusters have been reported as most active species.89 Furthermore, despite
extensive investigations, the implication of NO2 in the mechanism, or the catalytic
functionality of zeolite BAS are not well understood.21,83,89
1.5 Research aim
As shown in the literature review above there are still many unresolved questions
regarding the methane to aromatics reaction mechanism over Mo/H-ZSM-5. The nature
and location of Mo active sites, the role of BAS, and the deactivation pathways are still
under debate. Besides, MDA process is far from being commercialised as rapid catalyst
deactivation is still a mayor challenge to overcome.
The main aim of the research carried out in this thesis is to shed some light into the
nature of active species and deactivation mechanism by studying the structure-activity
relationship of Mo/zeolite catalysts for MDA reaction. Thus, Chapter 3 focuses on the
investigation of the nature and location of active Mo species in Mo/H-ZSM-5. The role
of the zeolite Brønsted acidity is studied in Chapter 4 by comparing the widely studied
Mo/H-ZSM-5 with a series of Mo-based catalysts using non-acidic supports. Work is also
carried out to study the effect of zeolite topology in the MDA product distribution; thus,
Chapter 5 gathers the results obtained using small pore zeolite with CHA structure as the
support for Mo. Finally, in views of the promising results reported recently using
Fe@SiO2 for MDA, preliminary research has also been performed to study Fe/Silicalite-
1 as the catalyst. Structure-activity relationship studies of Fe/zeolites have been also
extended to investigate the nature of active centres in NH3-SCR reaction. The iron-based
catalytic investigations will be described in Chapter 6.

33
The work presented in this thesis comprises a multidisciplinary approach where
catalyst synthesis, characterisation and activity testing of metal/zeolite materials is carried
out. The results are then combined with synchrotron-based X-ray spectroscopic studies
to gain detailed insight regarding the structure of Mo or Fe centres. Some of the
synchrotron based spectroscopic investigations have been carried out in operando where
the X-ray spectra is collected under catalyst working conditions. This allows to couple
the structural information on the metal species with their catalytic activity providing
insight on the nature of active species as well as on the catalyst working mechanism.
1.6 References
1 I. Chorkendorff and J. . Niemantsverdriet, Concepts of modern catalysis and
kinetics, WILEY-VCH, Weinheim, Second Edi., 2007.
2 B. Lindström and L. J. Pettersson, CATTECH, 2003, 7, 130–138.
3 A. J. B. Robertson, Platin. Met. Rev., 1975, 19, 64–69.
4 F. Zaera, Catal. Letters, 2012, 142, 501–516.
5 M. B. Hocking, Handbook of chemical technology and pollution control,
Academic Press, San Diego, 1998.
6 U. Hanefeld and L. Lefferts, Catalysis: an integrated textbook for students, Wiley-
CVH, Weinheim, 2018.
7 B. Yilmaz and U. Müller, Top. Catal., 2009, 52, 888–895.
8 Global Synthetic Zeolites Market Analysis & Trends - Industry Forecast to
2025, https://www.researchandmarkets.com/research/bzm6sz/global_synthetic,
(accessed 17 April 2018).
9 Weblet Importer, http://europe.iza-structure.org/IZA-SC/ftc_table.php, (accessed
17 April 2018).
10 R. F. Lobo, in Handbook of Zeolites Science and Technology, 2003, pp. 80–113.
11 D. E. Akporiaye, I. M. Dahl, A. Karlsson and R. Wendelbo, Angew. Chemie Int.
Ed., 1998, 37, 609–611.

34
12 C. Martínez and A. Corma, Coord. Chem. Rev., 2011, 255, 1558–1580.
13 J. Perez-Ramırez, C. H. Christensen, K. Egeblad, C. H. Christensen and J. C.
Groen, Chem. Soc. Rev., 2008, 37, 2530–2542.
14 S. Teketel, L. F. Lundegaard, W. Skistad, S. M. Chavan, U. Olsbye, K. P. Lillerud,
P. Beato and S. Svelle, J. Catal., 2015, 327, 22–32.
15 P. Schwach, X. Pan and X. Bao, Chem. Rev., 2017, 117, 8497–8520.
16 P. Tang, Q. Zhu, Z. Wu and D. Ma, Energy Environ. Sci., 2014, 7, 2580–2591.
17 S. Ma, X. Guo, L. Zhao, S. Scott and X. Bao, J. Energy Chem., 2013, 22, 1–20.
18 J. J. Spivey and G. Hutchings, Chem. Soc. Rev., 2014, 43, 792–803.
19 B. Moden, J. M. Donohue, W. E. Cormier and H.-X. Li, Top. Catal., 2010, 53,
1367–1373.
20 R. Mrad, A. Aissat, R. Cousin, D. Courcot and S. Siffert, Appl. Catal. A Gen.,
2015, 504, 542–548.
21 A. M. Beale, F. Gao, I. Lezcano-Gonzalez, C. H. F. Peden and J. Szanyi, Chem.
Soc. Rev. Chem. Soc. Rev, 2015, 44, 7371–7405.
22 B. Coq, M. Mauvezin, G. Delahay, J.-B. Butet and S. Kieger, Appl. Catal. B
Environ., 2000, 27, 193–198.
23 J. H. Kwak, D. Tran, S. D. Burton, J. Szanyi, J. H. Lee and C. H. F. Peden, J.
Catal., 2012, 287, 203–209.
24 F. Mafakheri and F. Nasiri, Energy Policy, 2014, 67, 116–126.
25 R. A. Kerr, Science, 2010, 328, 1624–1626.
26 U.S. Energy Information Administration (EIA) - Annual Energy Outlook 2016,
https://www.eia.gov/outlooks/archive/aeo16/MT_naturalgas.cfm#natgasprod_exp
, (accessed 17 April 2018).
27 D. E. Holmes and J. A. Smith, in Advances in applied microbiology, 2016, vol. 97,
pp. 1–61.
28 J. P. Stempien, M. Ni, Q. Sun and S. H. Chan, Energy, 2015, 82, 714–721.

35
29 P. Tang, Q. Zhu, Z. Wu and D. Ma, Energy Environ. Sci., 2014, 7, 2580.
30 Z. R. Ismagilov, E. V. Matus and L. T. Tsikoza, Energy Environ. Sci., 2008, 1,
526–541.
31 C. H. L. Tempelman and E. J. M. Hensen, Appl. Catal. B Environ., 2015, 176–177,
731–739.
32 L. Chen, L. Lin, Z. Xu, X. Li and T. Zhang, J. Catal., 1995, 157, 190–200.
33 D. Wang, J. H. Lunsford and M. P. Rosynek, 1997, 169, 347–358.
34 L. Wang, L. Tao, M. Xie, G. Xu, J. Huang and Y. Xu, Catal. Letters, 1993, 21,
35–41.
35 B. M. Weckhuysen, D. Wang, M. P. Rosynek and J. H. Lunsford, J. Catal., 1998,
175, 347–351.
36 C.-L. Zhang, S. Li, Y. Yuan, W.-X. Zhang, T.-H. Wu and L.-W. Lin, Catal. Letters,
1998, 56, 207–213.
37 Y. Shu and M. Ichikawa, Catal. Today, 2001, 71, 55–67.
38 D. Ma, Y. Shu, X. Han, X. Liu, Y. Xu and X. Bao, J. Phys. Chem., 2001, 105,
1786–1793.
39 D. Ma, Y. Shu, M. Cheng, Y. Xu and X. Bao, J. Catal., 2000, 194, 105–114.
40 X. Guo, G. Fang, G. Li, H. Ma, H. Fan, L. Yu, C. Ma, X. Wu, D. Deng, M. Wei,
D. Tan, R. Si, S. Zhang, J. Li, L. Sun, Z. Tang, X. Pan and X. Bao, Science, 2014,
344, 616–9.
41 Y. Xu, S. Liu, L. Wang, M. Xie and X. Guo, Catal. Letters, 1995, 30, 135–149.
42 Y. Xu, Y. Shu, S. Liu, J. Huang and X. Guo, Catal. Letters, 1995, 35, 233–243.
43 J.-P. Tessonnier, B. Louis, S. Rigolet, M. J. Ledoux and C. Pham-Huu, Appl. Catal.
A Gen., 2008, 336, 79–88.
44 W. P. Zhang, D. Ma, X. W. Han, X. M. Liu, X. H. Bao, X. W. Guo and X. S. Wang,
J. Catal., 1999, 188, 393–402.
45 R. W. Borry, Y. H. Kim, A. Huffsmith, J. a. Reimer and E. Iglesia, J. Phys. Chem.

36
B, 1999, 103, 5787–5796.
46 W. Ding, S. Li, G. D. Meitzner and E. Iglesia, J. Phys. Chem. B, 2001, 105, 506–
513.
47 W. Li, G. D. Meitzner, R. W. Borry and E. Iglesia, J. Catal., 2000, 191, 373–383.
48 B. Li, S. Li, N. Li, H. Chen, W. Zhang, X. Bao and B. Lin, Microporous
Mesoporous Mater., 2006, 88, 244–253.
49 D. Ma, X. Han, D. Zhou, Z. Yan, R. Fu, Y. Xu, X. Bao, H. Hu and S. C. F. Au-
Yeung, Chem. - A Eur. J., 2002, 8, 4557–4561.
50 H. Liu, W. Shen, X. Bao and Y. Xu, Appl. Catal. A Gen., 2005, 295, 79–88.
51 H. Liu, X. Bao and Y. Xu, J. Catal., 2006, 239, 441–450.
52 J. Gao, Y. Zheng, J.-M. Jehng, Y. Tang, I. E. Wachs and S. G. Podkolzin, Science
(80-. )., 2015, 348, 686–690.
53 I. Vollmer, G. Li, I. Yarulina, N. Kosinov, E. J. Hensen, K. Houben, D. Mance, M.
Baldus, J. Gascon and F. Kapteijn, Catal. Sci. Technol., 2018, 8, 916–922.
54 M. Nagai, T. Nishibayashi and S. Omi, Appl. Catal. A Gen., 2003, 253, 101–112.
55 E. V. Matus, I. Z. Ismagilov, O. B. Sukhova, V. I. Zaikovskii, L. T. Tsikoza, Z. R.
Ismagilov and J. A. Moulijn, Ind. Eng. Chem. Res., 2007, 46, 4063–4074.
56 V. I. Zaikovskii, A. V Vosmerikov, V. F. Anufrienko, L. L. Korobitsyna, E. G.
Kodenev, G. V Echevskii, N. T. Vasenin, S. P. Zhuravkov, E. V Matus, Z. R.
Ismagilov and V. N. Parmon, Kinet. Catal. Nauk. /Interperiodica, 2006, 47, 23–
1584.
57 I. Lezcano-González, R. Oord, M. Rovezzi, P. Glatzel, S. W. Botchway, B. M.
Weckhuysen and A. M. Beale, Angew. Chemie - Int. Ed., 2016, 55, 5215–5219.
58 N. Kosinov, S. G. A. Wijpekma, E. Uslamin, R. Rohling, J. A. G. F. Coumans, B.
Mezari, A. Parastaev, S. A. Poryvaev, V. M. Fedin, A. P. Evgeny and J. M. E.
Hensen, Angew. Support. Inf., 2017, 27, 278–278.
59 Y. Xu and L. Lin, Appl. Catal. A Gen., 1999, 188, 53–67.

37
60 S. Xing, D. Zhou, L. Cao and X. Li, Chinese J. Catal., 2010, 31, 415–422.
61 D. Zhou, S. Zuo and S. Xing, J. Phys. Chem., 2012, 116, 4060–4070.
62 J. Shu, A. Adnot and B. P. A. Grandjean, Ind. Eng. Chem. Reseacrh, 1999, 38,
3860–3867.
63 A. Sarıog, A. Mer, T. Savaçı, A. Aye, E.-E. Ae, V. Thu, H. Ae, G. Sapaly, A.
Younès and B. Taârit, Catal. Letters, 2007, 118, 123–128.
64 F. Solymosi, J. Cserényi, A. Szöke, T. Bánsági and A. Oszkó, J. Catal., 1997, 165,
150–161.
65 C. Karakaya, H. Zhu and R. J. Kee, Chem. Eng. Sci., 2014, 123, 474–486.
66 K. S. Wong, J. W. Thybaut, E. Tangstad, M. W. Stöcker and G. B. Marin,
Microporous Mesoporous Mater., 2012, 164, 302–312.
67 J. P. Tessonnier, B. Louis, S. Rigolet, M. J. Ledoux and C. Pham-Huu, Appl. Catal.
A Gen., 2008, 336, 79–88.
68 N. Kosinov, F. J. A. G. Coumans, E. A. Uslamin, A. S. G. Wijpkema, B. Mezari
and E. J. M. Hensen, ACS Catal., 2017, 7, 520–529.
69 B. M. Weckhuysen, M. P. Rosynek and J. H. Lunsford, Catal. Letters, 1998, 52,
31–36.
70 H. Jiang, L. Wang, W. Cui and Y. Xu, Catal. Letters, 1999, 57, 95–102.
71 N. Kosinov, A. Wijpkema, E. Uslamin, R. Rohling, F. Coumans, B. Mezari, A.
Parastaev, A. Poryvaev, M. Fedin, E. Pidko and E. Hensen, Angew. Chemie, 2018,
57, 1016–1020.
72 D. Ma, D. Wang, L. Su, Y. Shu, Y. Xu and X. Bao, J. Catal., 2002, 208, 260–269.
73 F. Solymosi, A. Erd6helyi and A. Sz6ke, Catal. Letters, 1995, 32, 43–53.
74 B. S. Liu, L. Jiang, H. Sun and C. T. Au, Appl. Surf. Sci., 2007, 253, 5092–5100.
75 K. Honda, X. Chen and Z.-G. Zhang, Catal. Commun., 2004, 5, 557–561.
76 H. Zheng, D. Ma, X. Liu, W. Zhang, X. Han, Y. Xu and X. Bao, Catal. Letters,
2006, 111, 111–114.

38
77 N. Kosinov, F. J. A. G. Coumans, E. Uslamin, F. Kapteijn and E. J. M. Hensen,
Angew. Chemie - Int. Ed., 2016, 55, 15086–15090.
78 L. Li, R. W. Borry and E. Iglesia, Chem. Eng. Sci., 2002, 57, 4595–4604.
79 A. K. Kinage, R. Ohnishi and M. Ichikawa, Catal. Letters, 2003, 88, 199–202.
80 Maria C. Iliuta, B. P. A. Grandjean and F. Larachi, Ind. Eng. Chem. Res., 2002,
42, 323–330.
81 F. Larachi, H. Oudghiri-Hassani, M. C. Iliuta, B. P. A. Grandjean and P. H.
Mcbreen, Catal. Letters, 2002, 84, 183–192.
82 S. H. Morejudo, R. Zanón, S. Escolástico, I. Yuste-Tirados, H. Malerød-Fjeld, P.
K. Vestre, W. G. Coors, A. Martínez, T. Norby, J. M. Serra and C. Kjølseth,
Science (80-. )., 2016, 353, 563–566.
83 S. Brandenberger, A. Tissler, R. Althoff and O. Kröcher, Catal. Rev., 2008, 50,
492–531.
84 H. Peace, B. Owen and D. W. Raper, Sci. Total Environ., 2004, 334–335, 347–
357.
85 J. L. Sorrels, D. D. Randall, K. S. Schaffner and C. R. Fry, Selective Catalytic
Reduction, 2016.
86 European Commission - PRESS RELEASES - Press release - EU action to curb
air pollution by cars: Questions and Answers, http://europa.eu/rapid/press-
release_MEMO-17-2821_en.htm, (accessed 17 May 2018).
87 M. Koebel, M. Elsener and G. Madia, in SAE Technical Papers, 2001-01-3625.
88 M. Koebel, M. Elsener and M. Kleemann, Catal. Today, 2000, 59, 335–345.
89 J. Li, H. Chang, L. Ma, J. Hao and R. T. Yang, Catal. Today, 2011, 175, 147–156.
90 M. Iwamoto, H. Furukawa, Y. Mine, F. Uemura, S.-I. Mikuriya and S. Kagawa, J.
Chem. Soc. Chem. Commun., 1986, 0, 1272–1273.
91 A. Mette, F. Ae, S. Mert, J. Due-Hansen, R. Fehrmann, A. Claus and H.
Christensen, Catal. Letters, 2009, 130, 1–8.

39
92 C. H. F. Peden, J. H. Kwak, S. D. Burton, R. G. Tonkyn, D. H. Kim, J.-H. Lee, H.-
W. Jen, G. Cavataio, Y. Cheng and C. K. Lambert, Catal. Today, 2012, 184, 245–
251.

40

41
Chapter 2
Methodology
This chapter details the main characterisation techniques employed in this thesis.
These include: 1) standard techniques such as, gas physisorption, XRD, ICP, FTIR, UV-
Vis, Raman, Electron microscopy, TGA, SS-NMR and NH3-TPD; and 2) advanced
synchrotron-based XAS and XES techniques, which have been in part carried out under
operando or in situ conditions. An overview regarding theoretical and practical aspects
of each technique is provided in this chapter. The reaction testing setup used is also
described here.
The catalyst syntheses carried out as well as catalyst testing conditions are specific
for each experimental chapter and are not included here. Instead, they will be described
in the beginning of each experimental section. This is also the case for particular studies
(i.e. high resolution powder diffraction, and quasyelastic neutron scattering) performed
in collaboration with other researchers.
2.1 Sample characterisation
2.1.1 Powder X-ray diffraction:
Powder X-ray diffraction (PDXRD) is a widely used characterisation technique that
provides structural information of crystalline materials such as crystal phase, size, shape,
lattice parameters and interatomic distances. It is based on the diffraction phenomena
usually observed when a wave encounters an obstacle or a slit that is comparable in size
to its wavelength.
Crystalline materials are formed of arrays of atoms with long range order. The
interatomic distances are comparable to X-ray wavelengths causing incident X-rays to
diffract as a result of constructive and destructive interferences of the light leaving the
sample. This diffraction can be explained with the Bragg model presented in Figure 2-1a.

42
In this model the incoming X-rays are scattered secularly from each atomic plane; for a
given incident angle θ, the path difference between X-rays scattered from adjacent planes
is correlated to interplanar distance d and the angle θ. Constructive interference will occur
when the X-ray path-length difference is an integer multiple n of the X-ray wavelength λ
satisfying the so-called Bragg equation, Equation 2-1a.
nλ=2dsinθ Equation 2-1
a) b)
Figure 2-1. a) Representation of Bragg diffraction model and b) diffractometer instrumentation
schematics.
PDXRD experiments are carried out using diffractometers typically with Bragg-
Brentano geometry where an X-ray generating tube and X-ray detector are assembled on
a moving goniometer. The sample to be analysed is placed in the centre, (see Figure 2-2b).
During the measurements electrons are ejected from a tungsten filament in the X-ray tube
by applying a voltage. The electrons are bombarded into a metal target (i.e. Cu, Mo or
Co) and eject inner shell electrons of the metal. Electrons in the outer shells then fill the
electron hole in the inner shell, losing energy by emitting X-ray photons of characteristic
energy and wavelength; the X-ray beam generated is collimated towards the sample. For
the collection of XRD pattern, the sample and detector are rotated on the goniometer
while the intensity of the reflected X-rays is recorded at increasing θ angles. When the
geometry of the incident X-rays colliding with the sample satisfies the Bragg law,
constructive interference occurs, and a peak is detected using a photon counting detector.
A plot of peak intensity related to the incident X-ray angle can be thus obtained. The
positions of these reflections give information regarding the inter-layer spacings of atoms
in the crystal structure. Peak intensities can also provide quantitative information about
how much X-ray scattering is contributing to a given reflection.
43
PDXRD measurements
PDXRD has been used in this thesis to verify the crystal phase and purity of the
synthesised zeolites. Evolution of MoO3 crystallites during catalyst calcination has also
been followed by diffraction.
Diffraction patterns were recorded at Harwell campus using a Rigaku SmartLab X-
ray diffractometer fitted with a hemispherical analyser at ISIS neutron source facility, as
well as in a Bruker AXS D8 diffractometer located in Diamond Light Source. The
measurements were performed using Cu Kα radiation source (λ = 1.5406 Å) with a
voltage of 40 kV, and a current of 30 mA. Approximately 0.5 g of powder were loaded
into sample holders, the samples were then flattened using a glass microscope cover slip
to give a flat and uniform surface. The patterns obtained were compared to a reference
library (inorganic crystal structure database database, ICSD) to identify the crystal
phases.
2.1.2 UV-Vis diffuse reflectance spectroscopy:
The ultraviolet (UV) region falls in the range between 190 to 380 nm and the visible
(VIS) region between 380 to 750 nm of the electromagnetic spectrum. Radiation in these
ranges interacts with matter causing electronic transitions of valence electrons in the
outermost orbitals. As valence electrons are the ones directly involved in the formation
of chemical bonds and ions, UV-Vis absorption spectra can provide essential information
regarding electronic structure, oxidation state, type of ligands present, and coordination.
In the case of transition metal complexes - which most often constitute the active centres
in heterogeneous catalysts - UV-vis spectra originate from electronic d-d transitions as
well as from charge transfer transitions. The formers occur when electrons in d orbitals
are excited to other d orbital of higher energy; the charge transfer bands occur when
electrons are transferred from metal orbital to ligand orbitals or vice versa.
UV-Vis absorption measurements in gas or liquid phase are usually conducted in
transmission mode; however, for the characterisation of solid or powder samples diffuse
reflectance spectroscopy (DRS) technique is more common.1 Diffuse reflectance occurs
when light incident on solid surfaces is scattered at many angles rather than in just one
angle (Figure 2-2a). When light enters the sample, it is scattered due to internal reflection
from the surfaces of small powder grains or particles that constitute the sample; some of

44
this scattered light reaches back of the solid surface and exits the sample in random
directions. UV-Vis absorption by the sample during this scattering process results in a
reflected spectrum similar to the transmission spectrum. However, the internally reflected
light can travel a range of path distances before it leaves the sample and hence the
absorption intensity observed in DRS can differ from transmission experiments. For a
reliable quantitative analysis the DRS spectra can be transformed by the so–called
Kubelka-Munk function (Equation 2-2) which correlates the reflectance from a solid
sample surface with the absorption and scattering coefficients.1
Equation 2-2
Where S and K are the so called Kubelka-Munk scattering and absorption
coefficients, respectively, and R is the reflection factor of the sample surface.
UV-Vis spectrometers equipped to measure diffuse reflectance are based on the use
of an integrated sphere coated with a perfectly reflecting material (i.e. MgO and BaSO4).
As represented in Figure 2-2b, the spectra collection is performed by placing the sample
in the sphere in front of the incident light window. In this arrangement the diffuse
reflected light from the sample is concentrated on the detector using the sphere. The
detected light intensity becomes the reflectance (relative reflectance) with respect to the
reflectance of a reference standard white board which is taken to be 100 %.
a)
b)
Figure 2-2. Schematics of a) the light diffuse reflectance phenomena by solid surface and b) example of
the beam geometry in an integrated sphere for DRS measurements.

45
UV-Vis DRS measurements
Diffuse reflectance data was collected in an UV-2600 Shimadzu spectrometer,
using a light spot of 2 mm. Around 0.2 g of sample was pressed into a sample holder and
the sample surface was then smoothed. The reflectance data was acquired from 200 to
800 nm which was transformed into absorbance versus wavelength by applying the
Kubelka-Munk equation. BaSO4 was used as the white standard to remove background.
2.1.3 Fourier-transform infrared spectroscopy:
Infrared absorption spectroscopy (IR) has become a widely used characterisation
technique due to the affordable cost of IR spectrometers, the relatively easy sample
preparation and the fast spectra collection. This technique exploits the fact that molecules
absorb IR radiation that are characteristic of molecular vibrations frequencies,
particularly of functional groups.
Molecules can vibrate by several different vibrational modes classified as bending,
stretching, rocking, wagging or twisting modes; this accounts for the multiple peaks
observed in the IR spectra of a given compound. In order to be IR active, selection rules
state that vibrations within a molecule must cause a net change in the molecular dipole
moment. Absorption occurs when the frequency of the incoming radiation matches that
of the vibrational frequency of the molecule. The absorption energies observed depend
on the type of vibration mode, molecular symmetry, masses of the atoms contributing to
vibration, and the associated vibronic coupling. Thus, each molecule has its own unique
IR absorption fingerprint and on obtaining the spectra, this can be compared to a library
database allowing identification of the functional groups present.
A range of IR spectrometers are available and Fourier-transform infrared (FTIR)
spectrometer in transmission mode is one of the most commonly used instruments. FTIR
operating principle is based on the use of Michelson interferometer and Fourier-transform
to convert the recorded interferogram signal into wavelength. In an FTIR spectrometer,
light from a polychromatic infrared source, is directed to a beam splitter which divides
the light into two equally intense branches: one led to a moving mirror and the other to a
static mirror (see schematics in Figure 2-3a). Upon reflecting in the mirrors, the beams
recombine back in the splitter, and a fraction of the recombined light is directed to the
sample where the transmitted light then reaches the detector.

46
The moving mirror continuously oscillates back and forth and generates a periodical
variation in the optical path difference between the two branches. Thus, the recombination
of them results in a beam with varying light intensity due to constructive and destructive
interferences arising from the path differences. Detection of the beam intensity results in
a sinusoidal signal in spatial domain (difference in path distance in mm) known as the
interferogram. This interferogram can be then converted by Fourier-transformation into
frequency domain (IR spectrum is usually presented as function of wavenumber in cm-1).
Finally, by comparison of IR spectrum intensity transmitted through the sample with one
of a reference light, IR absorption in % is obtained as a function of wavenumber.
Figure 2-3. Simplified representation of FTIR spectrometer operating mechanism.
FTIR measurements
In this project, FTIR measurements were carried out to detect zeolite hydroxyl
functional groups that consist of silanol defects or Brønsted acid sites. Measurements
were carried out in a Nicolet iS10 spectrometer and data was collected in the hydroxyl
stretching region of the FTIR spectra, typically between 3800 and 3200 cm-1. Prior to
each measurement the empty sample chamber was flushed out with He and a background
spectrum was collected. Then, samples were pressed into self-supporting wafers with a

47
density ~ 10 mg/cm2 and placed in the sample chamber. The wafers were dried prior to
the measurement by heating them up to 285 °C for 3 h under 70 ml/min He flow. After
dehydration, the sample was cooled down to 150 °C under dry He for IR spectra
collection.
2.1.4 Raman spectroscopy:
Raman spectroscopy can give information regarding vibrational, rotational and
other low frequency transitions in molecules; however, it is most widely used as a
vibrational spectroscopic technique. It relies on the inelastic scattering of monochromatic
light (typically from a laser) in the visible, near infrared, or near ultraviolet range.
When monochromatic light impinges into a molecule in a ground vibrational energy
state the incident photons can excite electrons into a transient “virtual” state. Most of the
electrons decay back to the initial vibrational level emitting radiation with the same
energy as the incident photons. This is the elastic scattering phenomenon known as
Rayleigh scattering.
A small fraction of the electrons (0.001 %) however, decay to a different
vibrational level and therefore emit radiation with different energy to the incident
photons; the radiation can be of lower (Stokes) or higher (anti-Stokes) energy. This
inelastic scattering phenomena is the so-called Raman scattering. The energy difference
between the incident photon and the inelastic scattered light – known as Raman shift and
usually given as wavenumbers (cm-1) – probes the vibrational energies of the molecule
under study. A schematics diagram of the energy transition during Raleigh, Raman and
IR absorption phenomena is shown in Figure 2-4a.
Although via different optical phenomenon, Raman gives similar structural
information as IR absorption spectroscopy discussed previously: it also shows molecule
vibration modes giving fingerprint spectra which allows the identification of functional
groups. While only vibration modes which induce changes in dipole moment are active
in IR, vibration modes will be Raman active if they induce changes in polarisability.
Raman inelastic scattering is based on the interaction between the sample electron cloud
and the electrical field of the monochromatic light. This interaction induces a dipole
moment within the molecule and the intensity of the Raman scattering is proportional to

48
this polarisability change. Therefore, transitions that might not be active in IR can be seen
by Raman spectroscopy and they are thus used as complementary techniques.
a) b)
Figure 2-4. a) Vibrational energy-level diagram showing the states involved in Raman scattering
phenomenon; b) instrument schematics for Raman spectrometer equipped with Kerr gate (Figure 2-4b
adapted from reference 2.
A common problem in Raman spectroscopy is the concurrent strong fluorescence
background arising from certain samples which swamps the weaker (106-108 times)
Raman signal.2 This is especially the case when studying zeolite-based catalysts;
impurities present in zeolites give rise to strong fluorescence. In addition, light
hydrocarbons often present in reacted catalysts also produce fluorescence which
compromises the experiments. In order to overcome this problem the Raman spectra
collected during this thesis was performed using a spectrometer equipped with a Kerr gate
which consists of a temporal gate (in picosecond time-domain) able to filter out the
fluorescence on basis of its longer lifetime.3 In a Kerr gated spectrometer a nonlinear Kerr
medium is positioned between two crossed polarisers (see Figure 2-4b). The interaction
of the Kerr medium with a laser pulse induces a transient anisotropy due to the optical
Kerr effect which causes a 90° rotation of the incident polarised light. Hence, during
measurements the sample under study is excited by laser pulses which are synchronised
with laser pulses for inducing anisotropy in the Kerr medium. After passing the first
polariser, Raman light from the sample is rotated by the Kerr medium and can pass

49
through the second polariser. The fluorescence however, having a longer lifetime, is not
synchronised with the Kerr laser pulse and it is blocked by the polariser.
A case example of fluorescence suppression by Kerr gate is presented in Figure 2-5.
Spectra for 4 wt. % Mo/H-ZSM-5 using a 400 nm laser pulse exhibits strong fluorescence
that saturates the detector (black line); while the spectra collection using the Kerr gate
suppresses the fluorescence signal revealing bands at Raman shifts of 600 - 100 cm-1
which corresponds to Mo-O vibrational modes (red line).
Figure 2-5. Example of a zeolite-based catalyst (4 wt. % Mo/H-ZSM-5) Raman spectra collected with
and without the use of the Kerr gate.
Kerr-gate Raman measurements
The measurements were carried out in the Central Laser Facility at Harwell Campus
using the ULTRA time-resolved spectrometer.4 Samples (~ 50 mg) placed in quartz
window holders were excited with 400 nm laser whilst 800 nm laser was used to activate
a CS2 Kerr gate. The samples were rastered continuously along the x and y axes to avoid
long exposure of same sample spot to the beam and thus minimise possible sample
damage. Prior to the experiments toluene spectra were collected for detector calibration.

50
2.1.5 Solid state nuclear magnetic resonance:
Nuclear magnetic resonance (NMR) consists on the observation of local magnetic
fields around atomic nuclei. It is used to characterise functional groups and their
connectivities. Developed in 1940s, NMR was initially used on liquid samples; in the
following decade the technique was optimised for its application on solid materials (SS-
NMR). The technique is based on the interaction of nuclear spin with an external magnetic
field, B0. A nucleus with spin ½ for example has two possible spin states: +1/2 and -1/2.
With an external magnetic field, the energy of these states separates and the extent of
separation depends on the strength of the external magnetic field (see Figure 2-6a).
Due to averaging of anisotropic interactions by rapid molecular motion, liquid
NMR spectra consist of a series of very sharp transitions. In solid samples however, due
to anisotropic interactions the spectral features are very broad.
There are three main interactions contributing to this line broadening in solid-state
NMR spectra. 1) Dipole-dipole interactions which are the interactions through the space
between the observed nucleus and the neighbouring ones. Dipole-dipole interaction with
protons is the dominant line-broadening factor in 1H, and 29Si NMR spectra for zeolite
characterisation. 2) Chemical shift anisotropy is due to the spatial dependency of the
nuclear shielding and is determined by the electron distribution symmetry around the
nucleus. 3) Quadrupolar interactions occurs for nuclei with spin > 1/2 (i.e. 27Al); it arises
from the interaction of the nuclear electric quadrupole moment with the electric field
gradient produced by a nonspherical charge distribution around the nucleus.
Several methods have been developed to achieve the line narrowing of solid
material spectrum. In this thesis, dipolar decoupling, magic angle spinning, and cross
polarisation pulse sequence are used. Dipolar decoupling removes the heteronuclear
interaction by irradiating resonance frequency of the nucleus that produces the dipolar
broadening (usually 1H) while observing the nucleus under study (i.e. 29Si). Cross
polarisation sequence is used to increase the sensitivity of a nonabundant nucleus (i.e.
29Si) by dipolarly coupling it with an abundant one (i.e. 1H). Magic angle spinning (MAS
NMR) is a routinely applied technique in which the powder in a special container (rotor)
rotates in the manner that the axis of rotation is inclined by an 54.7° angle with respect to
the direction of the magnetic field. Thus, the dipole-dipole interactions and chemical shift
anisotropy are averaged to zero and the NMR spectrum features are narrowed.

51
For the characterisation of the samples synthesised in this research 29Si and 27Al
MAS NMR were carried out. 29Si MAS NMR spectra of zeolites can give a maximum of
five peaks, which correspond to the five possible distributions of silicon and aluminium
atoms around the SiO4 tetrahedral units: Si(4Al), Si(3Al)(Si), Si(2Al)(2Si), Si(1Al)(3Si),
and Si(0Al)(4Si). From the chemical shifts and peak intensities, the types and relative
population of the distinct Si(nAl)(4-nSi) units in a zeolite can be determined. 27Al MAS
NMR is simpler than the 29Si MAS NMR as according to the Lowenstein’s rule Al–O–
Al linkages are forbidden and Al(4Si) is the only species on the framework. This gives a
single narrow line in the spectra with a chemical shift of ~ 60 ppm. Non-framework
aluminium in zeolites, which has octahedral AlO6 coordination, gives rise to signals at
about 0 ppm. The relative proportions of framework and non-framework Al in zeolites
can be directly determined from the intensities of the signals at about 60 and 0 ppm.
a)
b)
Figure 2-6. a) Representation of the splitting of ms nuclei spin states induced by an external magnetic field
B0 and b) schematics of NMR spectrometer instrument operating mechanism.
SS-NMR measurements
Data acquisition was carried out by the analytical department in Johnson Matthey
Technology Centre. Spectra were acquired at a static magnetic field strength of 9:4T
(ν0(1H) = 400:16 MHz) on a Bruker Avance III console using either a widebore Bruker
4mm BB/1H WVT MAS probe (27Al) or a widebore Bruker 7mm BB/1H WVT MAS
probe (29Si) and TopSpin 3.1 software. For 27Al, the probe was tuned to 104.27 MHz and
the spectra referenced to YAG at 0.0 ppm. For 29Si, the probe was tuned to 79.49 MHz
and the spectra referenced to kaolinite at -91.2 ppm. For 27Al, samples were stored
overnight in a humid environment, for 29Si, samples were dried overnight at 110 °C.

52
Following the appropriate pretreatment, powdered samples were packed into zirconia
MAS rotors with Kel-F caps, with before and after weighings providing the sample mass.
The rotors were spun using room-temperature purified compressed air.
2.1.6 Electron microscopy:
2.1.6.1 Scanning electron microscopy
In scanning electron microscopy (SEM) images are generated by scanning the
surface of a sample with a focused beam of electrons. Upon interaction with the beam,
the sample emits electrons producing signals that can be analysed to extract information
regarding composition and surface topology. The incident electron beam is scanned in
a raster scan pattern, and the beam position is correlated with the detected signal to
construct the image.5
In a scanning electron microscope, the samples are placed in high vacuum chambers
to prevent the interaction of electrons with gas molecules. The electron beam (0.2 to 40
keV) is generated using an electron gun usually composed of a tungsten filament cathode.
The electrons are then focused by condenser lenses to a 0.4 - 5 nm spot. The beam passes
through scanning coils which deflect the beam in the x and y axes to perform rastering
scans over a rectangular area of the sample surface. When the electron beam interacts
with the sample, scattering, absorption and emission phenomena occur within a depth of
100 nm to 5 µm into the surface.
The most common imaging mode is the so called secondary electron imaging (SEI).
This mode measures the low energy (< 50 eV) electrons that are ejected from the inner
electronic shell of the specimen atoms (inelastic scattering). Due to their low energy, these
electrons originate within a few nanometres from the sample surface; therefore, SEI mode
produces high-resolution (down to 1 nm) images of a sample surface.
Another commonly used imaging mode is the back-scattered electron (BSE)
detection. Back-scattered electrons are high energy electrons that are reflected or back-
scattered out of the specimen by elastic scattering. These electrons originate within a
few micrometres from the sample surface. Since heavy elements backscatter electrons
more strongly than light elements, they appear brighter in the image. BSE mode is
therefore used to detect contrast between areas with different chemical compositions.

53
2.1.6.2 Transmission electron microscope
Transmission electron microscopy (TEM) also uses an electron beam generated by
an electron gun. The electrons are accelerated to 200 keV and the resulting beam is
focussed by a set of electromagnetic lenses. In TEM, instead of scanning the sample
surface the beam is transmitted through the sample to form an image.6 The specimen is
most often a thin section with thickness below 100 nm; when passing through the sample,
the electrons of the beam interact with the sample resulting in electron absorption or
scattering. Differences in sample composition or thickness lead to a different degree of
interaction creating contrast in TEM images. The images are then magnified
and focused onto a fluorescent screen or a photographic film. The microscope is also
fitted with a charged-couple device (CCD) camera that converts the electron intensity into
a digital image.
Compared to light microscopes in transmission mode, TEM provides a much better
resolution down to nanometre scale and allows the observation of metal nanoparticles or
crystal lattices. This is due to the differences in wavelength of light and electrons. In
optical microscope the light wavelength is of 400-700 nm limiting the resolution to this
range. In case of electrons we have to take into account that the electrons behave as both
particle and wave as described by Broglie equation:
𝜆 = ℎ
𝜌 Equation 2-3
where 𝜆 is the wavelength, h is the Plank constant and 𝜌 is the particle momentum (𝜌 =
mass x velocity). This allows to achieve nanometric resolution by adjusting the electron
velocity between 100 and 300 keV.
2.1.6.3 Energy-dispersive X-ray spectroscopy (EDS)
EDS is used for the chemical analysis of a sample and it is usually an integrated
feature of SEM or TEM microscopes.
The incident electron beam excites the sample by ejecting electrons form inner shell
orbitals of the atoms. An electron from a higher energy shell then fills the hole created by
the ejected electron resulting in the emission of X-rays. The energy and intensity of this
emission can be measured by an energy-dispersive spectrometer. As the energies of the

54
X-rays are characteristic of each element in the periodic table, EDS provide elemental
composition of the sample under study.
2.1.1.4 Microscopy measurements
Microscopy images were taken at Johnson Matthey Technology Centre (Sonning
Common) by one of their scientists. The SEM analysis was done using a Zeiss ultra 55
Field emission electron microscope equipped with in-lens secondary electron and
backscattered detectors. Samples were dusted directly onto SEM stubs. Compositional
analysis with EDS detector and low-resolution general imaging were carried out with
accelerating voltage of 20 kV, 30-60 micron aperture and 7-8mm working distance. High-
resolution images were also taken with low accelerating voltage of 1.6 kV, 20-30 micron
aperture and 2-3 mm working distance.
The samples were also examined in the JEM 2800 Transmission Electron
Microscope. The powders were ground between two glass slides and dusted onto a holey
carbon coated Cu TEM grid. The instrumental conditions used were: Voltage 200 kV and
aperture 70 and 40 µm. Bright-field imaging mode was done using CCD high
magnification. Lattice resolution imaging mode was carried out using CCD Dark-field
(Z-contrast) imaging in scanning mode using an off-axis annular detector. The secondary
electron signal was acquired simultaneously with the other TEM images providing
topological information of the sample. EDS compositional analysis was performed by X-
ray emission detection in the scanning mode.
2.1.7 Gas physisorption analysis:
The surface area, pore volume and pore size of zeolite-based catalysts often exhibit
a key role in the catalytic activity by determining the number of active sites, the diffusion
rates of reactants/products, and the carbon deposition. A common method used to
characterise the porosity of a sample is via adsorption and desorption of a gas molecule
as a function of its partial pressure at isothermal conditions. Often N2 is used as the
adsorbate molecule while performing the adsorption and desorption at the temperature of
liquid N2 (i.e. 77 K).7 Thus the measurements result in an isotherm plot where the amount
of gas adsorbed (in volume) is presented against the partial pressure. The shape of such

55
isotherm contains information regarding the pore volume, size and shape as well as the
surface area of a material. Figure 2-7 below gathers examples of different types of
isotherms corresponding to materials with different porosity.
a) b) c)
Figure 2-7. Examples of most common types of adsorption isotherms: a) Type I is typical of microporous
materials such as zeolites, as they present high adsorption at low pressures due to micropore filling
phenomena (the knee pointed out by the blue arrow indicates the stage where the micropores have been
filled out). b) Type II are typical of non-porous or macroporous materials where unrestricted monolayer-
multilayer adsorption can occur (the knee in the isotherm corresponds to the stage at which one monolayer
coverage is complete). And c) Type IV isotherms are typical of mesoporous materials which present a
hysteresis loop associated with the occurrence of pore condensation of the adsorbate. Figure adapted from
reference 9.
The surface area is usually calculated by applying the Brunauer-Emmett-Teller
(BET) equation (Equation 2-4) to the results obtained in the isotherm plot. The equation
is derived assuming an absorption mechanism through formation of monolayers and it
correlates the partial pressure of the adsorbate in gas phase (P/P0), the total weight of
adsorbate on the sample (W), and the weight of one monolayer of adsorbate covering the
sample surface (Wm):8
1
𝑊 (𝑃0
𝑃 − 1)=
1
𝑊𝑚𝐶+
𝐶 − 1
𝑊𝑚𝐶 (
𝑃
𝑃0)
Equation 2-4
C is a constant related to the adsorption energy of the first monolayer; its value is an
indication of the strength of the adsorbent-adsorbate interactions.
The calculation of a surface area requires a linear plot of 1/[W(P0/P)–1] against
P/P0. This allows the determination of Wm from the slope and the intercept values
obtained from the linear plot. Knowing the weight of a monolayer and the adsorbate
molecule dimensions (e.g. N2 cross section is 16.2 Å2) the surface area can be easily

56
inferred. For most solids, a linear plot for the BET equation is restricted to a limited region
of the adsorption isotherm, usually in the P/P0 range of 0.05 to 0.35 using N2 as the
adsorbate. For micropore materials such as zeolites however, this linear region is shifted
to relative pressures below 0.1.
It is important to point out that the application of the BET equation in microporous
samples is not technically correct as in these materials micropore filling phenomenom
predominates.9 Such narrow pores exhibit a strong interaction between opposite surfaces
of the pore and adsorbate molecules are attracted and trapped forming not monolayers but
lumps of molecules with an entropic state similar to a liquid. As BET theory assumes
adsorption mechanism through monolayer formation the surface values obtained for
microporous materials do not have a physical meaning or represent real surface areas.
Applying the BET equation to microporous materials results in reproducible values and
they have been long reported in the literature. In this thesis the BET results are given as
they serve as guidance for comparing our samples with previous publications.
The micropore volume of a sample can be also calculated using the so-called V-t
method. This method is based on the comparison of adsorption isotherms of a porous
sample with a nonporous material of similar chemical composition and surface
character.10 A t-plot is a graphical representation of the adsorbate volume on the
physisorbed (Vads), versus the adsorbed layer thickness (t). For non-porous samples, the
sample and reference isotherm give similar t-plots with a straight line passing close to the
origin (see Figure 2-8). Vertical deviation from the straight line occurs if mesopores are
present while horizontal deviations reveal presence of micropores. The micropore volume
is obtained from a straight line extrapolated to a positive intercept on the ordinate.
Figure 2-8. t-Plots of nonporous, mesoporous and microporous solids. Figure adapted from reference 9

57
N2 physisorption measurements
Measurements were performed at 77.3 K on a Quadrasorb EVO QDS-30 instrument
placed in the Research Complex at Harwell Campus. Around 150 mg of sample were
outgassed at 350 °C overnight under high vacuum. After the degassing, N2 sorption
measurements were carried out at the temperature of liquid nitrogen (77 K). The BET
values were obtained using the data points at relative pressures between 0.0006 and 0.01.
The micropore volume was calculated from the t-plot curve using the thickness range
between 3.5 and 5.4 Å.
2.1.8 Temperature programmed desorption of ammonia:
Temperature programmed desorption of ammonia (NH3-TPD) is a classic method
for characterising the acidity in zeolite materials. The technique is usually carried out
using a packed bed reactor. During the measurements the sample is first saturated with
NH3, followed by a linear temperature ramping under inert gas flow to desorb the NH3
adsorbed on the sample surface. The NH3 concentration in the effluent is detected by an
online thermal conductivity detector or mass spectroscopy.11 Desorption temperatures can
be used to study the strength of zeolite acid sites and to calculate heats of adsorption.
NH3-TPD measurements
Temperature desorption studies were performed in an AutoChem II 2920
micromeritics instrument equipped with a moisture trap and a thermo-conductivity
detector. For the analysis ~ 100 mg of sample were placed in the flow reactor plugged
between quartz wool. First, sample preactivation was carried out by flowing pure N2 and
heating up to 550 °C for 30 min (5 °C/min) to remove water or other adsorbed molecules.
The reactor was then cooled down to 100 °C for ammonia absorption which was run by
flowing 1 % NH3/N2 until saturation (~ 1 h). Next, pure N2 was flowed for 2 h to remove
any excess of ammonia on the sample. Finally, ammonia desorption was carried out by
increasing the temperature up to 1100 °C with a ramp of 5-10 °C/min. All the signals
were normalised to the sample mass.

58
2.1.9 Thermogravimetric analysis:
Thermogravimetric analysis (TGA) allows to study the variation of the sample mass
with increasing temperature under a controlled atmosphere. The technique is based on the
use of a very sensitive balance to detect material mass loss or gain. This allows to follow
processes such as desorption, reduction, combustion and degradation (resulting in mass
loss), or wetting, oxidation and adsorption (resulting in mass gain). The results are plotted
as sample weight versus temperature. The derivative of this plot – differential
thermogravimetry – allows for a better definition of mass variations giving insight into
kinetics of the process involved during the temperature treatment.12
A thermogravimetric analyser consists of a relatively simple setup presented in
Figure 2-9. It comprises a crucible (usually made of Pt) for placing the sample. It also
contains a mobile furnace which encloses the crucible and sample. The furnace needs a
very accurate temperature control with a large homogeneity zone and a gas inlet-outlet
system to allow controlled sample atmosphere for the experiment. The balance is the most
important element of the instrument. A symmetric balance system is typically used where
the Pt crucible containing the sample is set up against an empty crucible.
Figure 2-9. Schematic representation of a thermogravimetric analyser.
TGA measurements
Thermogravimetric analysis performed in this research was carried out to evaluate
the content of water or carbon deposits in M/zeolite catalysts. The measurements were
carried out in a TA Q50 instrument in the Research Complex at Harwell. All samples (~
20 mg) were mounted in Pt crucibles and heated up to 950 °C using a ramp of 5 °C/min
under an air flow of 60 mL/min and held at 950 °C for 5 min.
crucible with sample
empty crucible
furnace gas inlet
gas outlet
symmetric balance system

59
2.1.10 Chemical analysis by inductively coupled plasma optical emission
spectroscopy:
Chemical analysis by inductively coupled plasma optical emission spectroscopy
(ICP-OES) is a multielemental analysis technique that uses the emission spectra of a
sample to identify and quantify the elements present. For the analysis, samples are
introduced as aerosols into a plasma, typically an Ar plasma produced in a quartz torch.
The plasma desolvates, ionises, and excites the sample which results in fluorescence. The
constituent elements can be then identified by their characteristic emission lines. The
emission intensity is used for elemental quantification and allows for the trace level
chemical analysis.
ICP-OES measurements were carried out by the analytical department in Johnson
Matthey Technology Centre (Sonning Common). The samples were first leached by
placing them in a Pt crucible together with Li2B4O7 and heating up to 1000 ˚C for half an
hour. The crucible was then cooled down and transferred to a plastic beaker with ultra-
high purity water and nitric acid until the sample was fully leached off the crucible. The
resulting solution was analysed by ICP-OES using a Perkin Elmer Optical Emission
Spectrometer Optima 3300 RL. Instrument working conditions were: plasma power of
1300 watts, argon plasma flow of 15 L/min, auxiliary argon flow of 1.5 L/min, nebuliser
argon flow of 0.80 L/min, pump speed of 1.5 mL/min.
2.2 Synchrotron-based spectroscopic techniques
2.2.1 X-ray absorption spectroscopy:
Introduction
X-ray absorption spectroscopy (XAS) is an element specific analytic technique
which probes the transitions from core electronic states of an atom to the excited
electronic states and the continuum. It is used for determining the local geometric and
electronic structure of matter.13 In the field of catalysis, XAS is a powerful tool for
elucidating the nature and evolution of active species.
The experiments require an intense and tuneable source of X-rays; therefore XAS
measurements are usually performed in synchrotron radiation sources and the history and
development of this technique has occurred in parallel to that of synchrotrons.14

60
When the incident X-ray has energy equal to the binding energy of a core electron
of a given element, absorption of the radiation occurs. This results in the ejection of the
core electron to an excited state and the formation of a core hole. The attenuation of X-
ray intensity is proportional to the absorption characteristics of the material, the sample
path length of the radiation and the incident intensity as shown in Equation 2-5. After
integration over dx the Beer Lambert equation, Equation 2-6, can be obtained:
ΔI = - µ(E)I0dx Equation 2-5
I = I0e-µEx Equation 2-6
where µ(E) is the absorption coefficient function of the photon energy, dx is the path
length and I0 incident X-ray intensity.
The X-ray absorption experiments are carried out by scanning the incident X-ray
energy. The absorption spectra exhibit a continuous intensity decrease with increasing
incident X-ray energy but when the incoming photons reach an energy sufficient to excite
an electron from a deeper core level of an element, a sharp rise in the absorption
coefficient occurs. This rise is known as the absorption edge and the energy of incident
X-ray at which the edge occurs is known as Eedge. The absorption edges are named
according to their associated electronic transitions. Thus, edges corresponding to
transitions from the first shell orbitals are named K-edges, transitions from the second
shell are known as L-edges, from third shell are denoted as M-edge and so on.
At the Eedge the core electrons are excited to a vacant orbital; the kinetic energy (Ek)
of the excited electron at the absorption edge is known as E0 or inner potential. For any
energy above Eedge, the core electron is excited to the continuum resulting in a
photoelectron with kinetic energy given by Equation 2-7:
Ek = ℎ𝑣 - Ebinding Equation 2-7
where ℎ is the Plank’s constant, 𝑣 the frequency of the photoelectron and Ebinding is the
minimum energy required for ejecting a core electron.

61
The photoelectron can be described as a spherical wave function with wave vector,
k, as shown in Equation 2-8. The photoelectron outgoing from an atom backscatters off
the neighbouring atoms; both the ongoing and backscattered waves interfere with each
other and the resulting final wave function (𝛷𝑗(𝑘)) is a sum of both (Equation 2-9).15
𝑘 = √(8π2𝑚𝑒
ℎ2)(ℎ𝑣 − 𝐸0) Equation 2-8
𝛷𝑗(𝑘) = 𝛷𝑜𝑢𝑡𝑔𝑜𝑖𝑛𝑔 + 𝛷𝑏𝑎𝑐𝑘𝑠𝑐𝑎𝑡𝑡𝑒𝑟𝑒𝑑 Equation 2-9
where 𝑚𝑒 is the electron mass.
The interference between the two waves can be constructive or destructive and
determines the variation in the total absorption coefficient. This variation causes the
characteristic oscillations above the absorption edge in the XAS spectra known as X-ray
absorption fine structure.
Thus, an XAS spectrum is typically divided into two regions: 1) the region that lies
within the first 30 eV of the edge position is usually referred as X-ray Absorption Near
Edge Structure (XANES), and 2) the spectral region beyond 50 eV above the absorption
edge including the fine structure which is termed as Extended X-ray Absorption Fine
Structure (EXAFS).
Both spectral regions give complementary information; XANES is sensitive to the
coordination chemistry and formal oxidation state of the absorbing atom whereas EXAFS
can be used to determine the distance, coordination number and the nature of the
absorber´s nearest neighbouring atoms. Example of X-ray absorption spectrum is shown
in Figure 2-10 together with a schematic representation of the X-ray adsorption and
photoelectron scattering phenomena.

62
Figure 2-10. XAS spectrum of Mo2C at the Mo-K edge where the edge position, XANES and EXAFS
spectral regions are indicated. Above the spectra schematic representations of the fundamentals of X-ray
absorption phenomena are depicted. These include the ejection of a core electron upon the adsorption of X-
rays (top left) and the scattering the photoelectron as a spherical wave (top right). The out-going wave is
depicted in solid blue circles and the scattered in dashed ones.
X-ray Absorption Near Edge Structure
The absorption edge for a given element arises due to electronic transitions from
the core level to higher unfilled or partially filled orbitals. These electronic transitions
have to obey the dipole selection rule: changes in the orbital quantum number (l) has to
be ±1 (i.e. s→p, or p→d).16 Thus, the edge absorption and XANES features will be
strongly related to the availability of final states and therefore to the electronic structure
of the element under study.
Transition metal oxides have unfilled 3d electrons near the Fermi level and a filled
3p band. A 1s→3d electronic transition is dipole forbidden (Δl = 2), nevertheless the
transition is allowed in case of strong hybridisation of the metal 3d levels with the oxygen
2p; this results in a well-defined peak below the main adsorption edge which is known as
a pre-edge peak.16 The pd hybridisation is markedly affected by the coordination
environment. Hence, the features and intensity of the pre-edge peak give insights
regarding the coordination symmetry of the absorbing atom.

63
The empty energy levels above the Fermi level in a compound are also sensitive to
the atomic valence. This allows for the determination of the oxidation state through
analysis of the absorption edge position.
Furthermore, XANES spectra can be used as fingerprint to identify the phases
present in the sample provided that spectra of relevant reference compounds are also
acquired or available. Quantitative analysis of different species is possible by linear
combination analysis of known reference spectra or by principal component analysis.
As discussed later, the EXAFS region, arising mainly from single scattering effects,
can be theoretically predicted and modelled through computational methods to refine the
structural information of the absorbing atom. This is not however, the case for the
XANES region. The near-edge features are governed by multiple scattering effects where
the photoelectron is scattered several times by different neighbouring atoms before
returning to the absorbing atom. Multiple scattering effects are sensitive to small
variations in structure and in principle, it should be possible to use XANES for the
determination of an element’s local environment. Although there has been progress in the
theoretical interpretation of XANES spectra, this only has been implemented for small
organic molecules.17–20 For the study of more complicated systems the agreement
between calculated and measured spectra remains relatively poor for a successful
structural refinement.
Extended X-ray Absorption Fine Structure
As explained earlier in this section, X-ray Absorption Fine Structure spectrum
arises from the interference of the ongoing and the backscattered photoelectron. This
interference pattern is dependent on the number, distance and nature of the scattering
atoms. Thus, the EXAFS contains information regarding the local structure of the
absorbing atom that can be obtained by theoretical methods.
To extract the structural information from the EXAFS a mathematical expression
is used which relates the photoelectron scattering effect with the structural parameters. A
theoretical EXAFS is then modelled and fitted to the real spectra for the refinement of
these parameters.

64
For the derivation this mathematical expression, the EXAFS is given as a function
of wave vector, 𝜒(𝑘) defined as the normalised part of the absorption coefficient μ.
𝜒(𝑘) = (μ – μ0)/μ0 Equation 2-10
Where μ is the observed absorption coefficient, and μ0 is the absorption observed in
the absence of neighbour atoms and scattering effects (i.e. smooth background function
representing the absorption of an isolated atom).
The simplest and most used EXAFS equation Equation 2-11 was derived by Stern,
Sayers, and Lytle21 and is based on the single-scattering plane wave approximation.
𝜒(𝑘) = 𝑆02 ∑
𝑁𝑗𝐴𝑗
𝑟𝑖2
𝑗
𝑒(−
2𝑟𝑗
𝜆)𝑒(−2𝜎𝑗
2𝑘2) 𝑠𝑖𝑛[2𝑘𝑟𝑗 + 2𝛷𝑗(𝑘)] Equation 2-11
where 𝑆02 is the so-called amplitude reduction factor, λ is the photoelectron mean-
free path, the sum over i runs over the different coordination shells around the absorbing
atom, 𝐴𝑗(k) is the backscattering amplitude function of the scattering atom, 𝛷𝑗(k) is the
phase function of the couple absorber/scatterer (Equation 2-9), Ni is the coordination
number, ri is the interatomic distance and σi is the Debye-Waller factor that quantifies the
disorder of each i shell.13
In this approximation the photoelectron is viewed as a plane wave and it assumes
that the atomic radii is much smaller than the inter-atomic distances. Therefore, the
equation is valid only for k values above 3. This derivation also assumes that single
scattering effects dominate (i.e. the photoelectron is only scattered once before returning
to the absorbing atom).
Aj(k) and ϕj(k) functions in Equation 2-11 are tabulated or calculated ab initio by
data processing software. Alternatively, they could be measured independently on model
compounds. Then the structural parameters Nj, rj and 𝜎𝑗2, can be determined in a least-
squares approach where the difference between the experimental and the modelled
function is minimised using least squares regression along the sampled experimental
points.22 The minimisation routine can be done either in k-space, or in R-space, working
on the Fourier-transform (FT) function. The FT of the EXAFS functions, used since early

65
1970,23 separates the contributions of the different coordination shells in the R-space by
transforming the data from frequency domain into a space domain.
The maximum number (𝑛𝑖𝑛𝑑) of independent parameters that can be analysed by
fitting of the EXAFS equation is defined as:
𝑛𝑖𝑛𝑑 = 2 +2𝛥𝑘𝛥𝑅
𝜋 Equation 2-12
where Δk is the examined k-space range and ΔR the R-space range containing the
optimised shells.
XAS data acquisition
X-ray absorption spectroscopy experiments were performed at B18 beamline at
Diamond Light Source24 in Harwell, United Kingdom which operates with an electron
energy of 3 GeV and a ring current of 300 mA. A fast scanning Si (1 1 1) double crystal
monochromator was used to tune the energy range de desired element K-edge XAFS
measurements.
The spectra acquired in transmission mode was carried out by three ion chambers
measuring: the incident intensity (I0), the intensity of the beam after passing through the
sample (It) and the intensity of the beam after passing through a metal foil (Iref). The metal
foil corresponds to the same element as being measured and It was used as reference for
calibration of the data. In transmission mode the number of x-ray photons absorbed by
core electrons to create a photoelectron and a core-hole is counted.
Diluted samples were detected in fluorescence mode. In this mode, fluorescence
radiation (If) from the sample (released when an electron in the upper level fills the core-
hole) was measured using a 9 element germanium detector placed at 90° relative to the
X-ray beam path.
Part of the XAS studies were carried out in operando by simultaneously collecting
XAS and MS data for a working catalyst. The setup used for this studies was developed
by A. Kroner et al.25 and it consists on the use of quartz capillaries as a micro-reactor.
Samples are plugged in the capillary and fixed with quartz wool. The setup also comprises
a gas delivery system for the micro-reactor which includes switching valves and mass
flow controllers to adjust the reactant flow over the catalyst bed. The gas outlet was

66
connected to an online mass spectrometer (OmniStar GSD 320O1) by heated lines. A hot
air source is used to control the sample temperature up to 780 ºC while the micro-reactor
is located on a motorised stage which can be remotely adjusted to place the catalyst bed
on the X-ray beam path. As an example, Figure 2-11 below depicts the experimental setup
for the operando XAS measurement in transition mode.
Figure 2-11. Schematic representation of the measurement carried out in transmission mode using three
ionisation chambers for the detection of Io, It and Iref. The setup used for the operando experiments is also
depicted including the gass delivery system (i.e. pressurised gas cylinders, switching valves and mass flow
controllers), a micro-reactor, and an online mass spectrometer. A picture of the microreactor and gas blower
for sample temperature controll used during the experiments is included in the top right corner.
Data analysis
Analysis of the collected data was performed using Demeter IFEFFIT software
package (Athena and Artemis).23,26 The XAS spectra were first exported into Athena for
removal of the background by fitting pre- and post-edge lines of the spectra and the
normalisation of the edge jump intensity. The edge positions (E0) were determined from
the maximum of the first derivative (after the pre-edge peak if present). Calibrations were
carried out by assigning the first inflexion point (maximum of the derivative) of the metal
foil spectra to 20000.0 eV and correcting for the E0 offset on the sample spectra. For iron
samples the Fe foil first inflection point was calibrated to 7112.0 eV.
The EXAFS was isolated by removing the contributions of the free atom absorption
in the post edge which was done by applying a spline function. A Fourier transform of

67
the EXAFS was also performed to get radial distribution function which reflects the
distance of the neighbouring atom.
For the refinement of EXAFS parameters, the data processed in Athena was
exported into Artemis. The EXAFS data were fitted by refining the coordination number
(N), interatomic distance (r), the Debye Waller factor (σ2) and the shift in energy (E0). All
the fittings were carried out using the quick first shell fit tool applied to fit atoms in
coordination shell up to 3 Å. Specific description of the XAS experiments and data
analysis for the different catalysts studied in this thesis is given at the beginning of each
experimental chapter.
2.2.2 X-ray emission spectroscopy:
X-ray emission spectroscopy (XES) provides useful information regarding the
electronic structure as well as the ligand environment of a given element. During X-ray
emission experiments the sample is first excited with X-rays of sufficient energy to eject
core electrons of the element of interest. This results in a transition to an excited state (i.e.
to an empty electronic state of higher energy or continuum) and in the formation of a core
hole. This core hole has a short lifetime (n ~ 10-15 s); it decays immediately and the core
hole is filled with an electron from an outer shell. The decay is accompanied by the
emission of fluorescence X-ray photon which is detected and analysed.27,28
Non-resonant XES
In a typical XES experiment, the element to be studied is excited to the continuum
using energy above the element’s absorption edge, this is known as the non-resonant X-
ray emission spectroscopy (NXES).29 Such experiments do not require a tuneable X-ray
source, actually, non-resonant XES has been performed with X-ray tubes long before
synchrotron radiation became available.
If the electron is ejected from the 1s orbital or K shell the resulting fluorescence is
named K emission line. XES studies usually focus on the observation of changes in the
K emission spectra to gain information about the chemical environment of the absorbing
atom. Historically the emission lines were sub-classified as etc. (i.e. K, k, K)
depending on their intensity (being the most intense line). It is worth pointing out that

68
this classification uses traditional nomenclature that does not describe or categorise
fluorescence in terms of the nature of electronic transitions.
For catalyst characterisation, XES spectroscopy is used to study the properties of
the active species responsible for active centres which are often transition metals. Figure
2-12a schematises the one electron diagram for the K emission lines for a fist row
transition metal such as iron. Note that various emission lines are depicted in the figure
for same orbital transitions. Thus, two spectral lines with different energy, K1,3 and K’,
are observed for 3p →1s electronic transition whilst transitions from the valence level to
1s also result in two emission lines known as K2,5 and K’’. This is because orbital levels
present a fine structure resulting from two main effects: 1) spin-orbital interactions
corresponding to the interaction of the electron spin with its own orbital momentum, and
2) spin-spin interactions corresponding to interactions between electrons either within the
valence shell or between a core electron and the valence electrons. The spin-orbital and
spin-spin interactions are of great importance in the XES analysis as they make emission
lines sensitive to the valence shell electron configuration.
Transitions from valence level to 1s (K2,5 and K’’) are called valence-to-core
(vtc) transitions. Valence electrons reflect the configurations of electron orbitals that
participate in the chemical bonds and hence, the energy of these transitions provide direct
information on the electronic structure and local coordination. In particular, the position
of K’’ peak (so-called cross-over line) provides insight regarding the ligand type and
distance.
Transitions form 2p and 3p orbitals to 1s (K1,2, K1,3 and K’) are known as core-
to-core transitions (ctc).27 These orbitals do not participate in chemical bonding but they
show certain chemical sensitivity due to the electron–electron interactions with the
valence electrons. Hence, although indirectly, they also provide structural information.
The interaction of the 2p shell with the valence electrons is weaker than of the 3p and
therefore K1,3 and K' present stronger chemical sensitivity than K1,2. They are
particularly sensitive to the valence spin and the oxidation states of transition metals. The
shift of the K1,3 peak can also be used as a measure of the oxidation state and it also
seems to be affected by the ionicity of metal-ligand bond.

69
It is important however, to bear in mind the typical intensity of these emission lines.
1s and 2p orbitals are in close proximity and therefore an overlap exists between these
orbitals. Thus, K1,2 are the most intense emission lines. The lower interaction of 3p
orbital with the 1s translates in K1,3 and K' being approximately eight times weaker
than K1,2. Measuring K’’ is often challenging as it is usually three orders of magnitude
less intense29 that the other bands.
a) b)
Figure 2-12. One electron level diagram (a) and total energy level diagram (b) for non-resonant K
emission processes in a 3d transition metal.
Resonant XES and high energy resolution fluorescence detected XANES
When the incident energy is tuned - using a synchrotron radiation source - close to
the absorption edge, the resulting fluorescence is denoted as resonant X-ray emission
spectroscopy (RXES). The shape of fluorescence peaks detected in this mode show strong
dependence to the incident energy.30
In 1976 Eisenberger et al.31 proved that measuring the intensity of a given emission
line across the absorption edge resulted in an X-ray absorption spectrum with increased
resolution and sharper features in the XANES region. This technique is known as high
energy resolution fluorescence detected X-ray absorption spectroscopy (HERFD-XAS).
The sharpened features occur as the result of decreased spectral lifetime broadening when
measuring in this mode. As explained earlier, the XANES features are dependent on
orbital hybridation, symmetry and coordination of the absorbing atom. Hence, a better

70
definition in the features around the absorption edge can help to elucidate important
structural information.
For better understanding of RXES it is convenient to represent the absorption and
emission phenomena in a total energy diagram like the one presented in Figure 2-12b. In
this diagram the RXES process is separated in three stages: 1) the initial ground state (Eg),
2) an intermediate state after the absorption but prior to the fluorescence decay (En) and
a final state after the emission occurs (Ef). The emission has lower energy than the
incident X-ray, the difference between the incident and emitted energy ( - in Figure
2-12b) is usually referred to as the energy transfer.
The resonant X-ray emission intensity is described by the Kramers-Heisenberg
equation, Equation 2-13, and it is a function of the incident and emitted energies ( and
) as well as the energy of the initial, intermediate and final states (Eg, En and Ef) of the
electronic configurations:
𝐹𝐾𝐻 (, 𝜔) = ∑ ∑|⟨𝑓|Ô′|𝑛⟩|
2|⟨𝑛|Ô|𝑔⟩|
2
(𝐸𝑛 − 𝐸𝑔 − )2
−𝑛
2
4𝑛𝑓
𝑥
𝑓
2𝜋
(𝐸𝑓 − 𝐸𝑔 + − 𝜔))2 +𝑓
2
4
Equation 2-13
n and f are the terms that define the Lorentzian line shapes detected for the
incident energy and the energy transfer respectively; they represent the core-hole lifetime
broadening of the intermediate and final states.
In a typical RXES experiment the incident energy is scanned across the absorption
edge and the energy and intensity of resulting fluorescence is analysed. RXES results c.a.
be given in a 2D plane graphs where incident energy is presented versus the energy
transfer; the intensity is pictured as line plots. Figure 2-13a shows a model RXES plot
where the lifetime broadenings (n, f) become visible extending perpendicular to each
other. Scanning the incident energy but detecting a fixed fluorescence energy result in a
diagonal cut through the RXES plane which is equivalent to an XAS spectrum. Moving
through the RXES plane it is possible to find the smallest line broadening position for the
diagonal cut (represented as black dashed arrow in Figure 2-13a). Fixing the fluorescence
energy detection for such position (with a narrow energy bandwidth), the collected XAS
spectrum will have a lifetime broadening smaller than n, and f, and the features in the
XANES will be sharpened. This is the basis of the improved resolution in HERFD-XAS.

71
Figure 2-13b compares a conventional absorption XANES spectra (dashed line) with
HERFD-XAS (solid lines) for a model compound. The latter shows more intense and
sharper pre-edge features which can facilitate structural interpretation.
Figure 2-13. a) RIXS plane for a model system with the incident energy plotted versus the energy transfer
(final state energy) with lifetime broadenings Γn and Γf are indicated with solid arrows, the diagonal cut
is represented with a dashed arrow. b) Constant emission energy scan (diagonal cut through RIXS plane
or HERFD-XANES) compared to an absorption spectrum. Figure adapted from reference 30.
XES and HERFD-XANES data acquisition
XES/HERFD-XANES measurements were carried out in Diamond Light Source in
the scanning branch of the I20 beamline.32 The experimental setup in this beamline
consists of a set of spherically curved focusing analyser crystals in Rowland geometry
respect to the sample and the detector as shown in Figure 2-14. The incident X-ray beam
tuned using a Si (1 1 1) Scanning Four Bounce monochromator crystal is directed to the
sample with a beam size of ~ 400 x 400 µm FWHM. The analysers comprise tree Si (5 3
1) curved crystals which are positioned perpendicular to the incident X-ray beam; in this
mode each emitted X-ray impinges on the analyser surface under the same Bragg angle.
The fluorescence energy is scanned by changing the Bragg angles of all analysers
simultaneously and the X-ray intensity is measured by the detector.
In situ spectroscopy HERFD-XANES/XES measurements were carried out for
Fe/zeolites catalysts for ammonia selective catalytic reduction (NH3-SCR). The setup for
performing the catalytic reactions in the beamline was similar to the one previously
described in the operando XAS section (Section 2.2.1.). For the experiments Ø = 1.5 mm,
borosilicate capillaries were used as the flow reactor and the catalyst bed was heated using
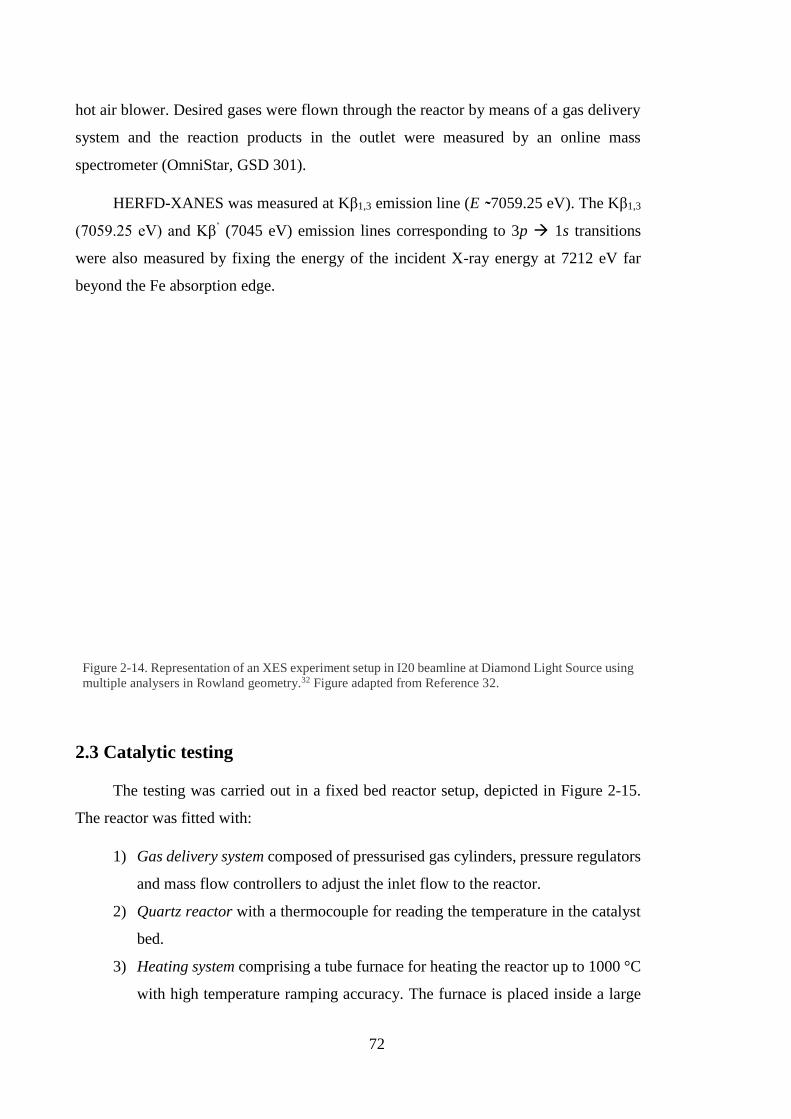
72
hot air blower. Desired gases were flown through the reactor by means of a gas delivery
system and the reaction products in the outlet were measured by an online mass
spectrometer (OmniStar, GSD 301).
HERFD-XANES was measured at Kβ1,3 emission line (E 7059.25 eV). The Kβ1,3
(7059.25 eV) and Kβ’ (7045 eV) emission lines corresponding to 3p → 1s transitions
were also measured by fixing the energy of the incident X-ray energy at 7212 eV far
beyond the Fe absorption edge.
Figure 2-14. Representation of an XES experiment setup in I20 beamline at Diamond Light Source using
multiple analysers in Rowland geometry.32 Figure adapted from Reference 32.
2.3 Catalytic testing
The testing was carried out in a fixed bed reactor setup, depicted in Figure 2-15.
The reactor was fitted with:
1) Gas delivery system composed of pressurised gas cylinders, pressure regulators
and mass flow controllers to adjust the inlet flow to the reactor.
2) Quartz reactor with a thermocouple for reading the temperature in the catalyst
bed.
3) Heating system comprising a tube furnace for heating the reactor up to 1000 °C
with high temperature ramping accuracy. The furnace is placed inside a large

73
oven with a constant temperature of 150 °C; this allows the preheating of gas
before it reaches the reactor. The lines from the reactor outlet to the gas
detection systems were heated at 200 °C using heated lines or hoses to prevent
condensation of hydrocarbons products in the lines.
4) Reaction product detection system. The outlet gas composition was monitored
with a mass spectrometer to obtain qualitative time resolved data. Gas
chromatograph was also connected for some of the reactions to get quantitative
conversion and selectivity information.
Figure 2-15. Schematic diagram of the reactor setup used for catalytic testing.
2.3.1 Mass spectrometer:
Mass spectrometry (MS) is a widely used technique for studying the composition
of a sample either in gas, liquid or solid phase. In a mass spectrometer, the sample is first
ionised often by bombarding it with electrons generated in a hot wire filament. The
resulting ions - typically single positive charges - are accelerated and subjected to electric
or magnetic field inducing their deflection. The degree of deflection depends on their
characteristic mass and charge (i.e. ions with higher net charge and less mass deflect
more). Thus, the ions can be separated in a spectrum according to their mass/charge ratio.
Finally, the ions strike the detector which generates ion current that can be amplified and

74
recorded. The generated current is proportional to the number of ions arriving to the
detector.
In this project two different MS were used an OmniStar GSD 320O1instrument and
a portable EcoSys-P spectrometer. Both contain a sampling capillary that can be directly
connected to the reactor outlet gas flow for the continuous measurement of its gas
composition. These spectrometers also contain a turbomolecular pump for keeping ultra-
high vacuum (< 10-7 mbar) in the ionisation chamber, a quadruple mass spectrometer for
the separation of ions according to mass/charge ratios (mass range = 200 atomic mass
units), and a dual Faraday/Electron multiplier detector.
2.3.2 Gas chromatography:
Gas chromatography (GC) is used for separating different gaseous compounds
present in a reaction mixture. Usually, a known volume of sample is injected into a
separation column using an inert gas flow as the carrier. Inside the column, the different
components of the sample elute at different speeds depending on their affinity to the
stationary phase packed inside the column. This leads to separation of sample constituents
which will come out from the column at different times.
For optimisation of the separation process the columns are placed inside ovens so
temperature can be controlled and programmed. Other parameters that can be adjusted
are the pressure of the flowing gas and the packing material chosen for the columns.
After separation and elution from the column, the constituents of the sample are
directed to a detector. The signal obtained from the detector is proportional to the
concentration of the individual constituents. Thus, calibration of the detectors response
using a known gas composition allows for the quantitative analysis of a sample
composition.
Two types of detectors are common in gas chromatography:
1) A flame ionisation detector (FID) which works via detection of ions formed
during the combustion of organic compounds in a hydrogen flame. The ions are
generated between two electrodes with a difference of potential of a few
hundred volts. As a result, the ions produced in the flame generate a current that
can be recorded. The intensity of the current is directly proportional to the
number of ions present in the detector allowing for their quantification.

75
2) A thermoconductivity detector (TCD) consists of an electrically heated filament
in a temperature-controlled cell. When only the carrier gas is passing though the
filaments there is a stable heat flow from the filament to the detector body.
When a component of the sample elutes from the column, the thermal
conductivity of the column effluent changes, the filament heats up and changes
resistance. This resistance change is sensed producing a measurable voltage
change.
In this setup, Varian CP-3800 gas chromatograph was connected to the reactor
outlet to perform periodical sampling every 30-40 min. This allowed to evaluate the
conversion and product selectivities at different stages of reaction.
As schematised in Figure 2-15, this instrument was equipped with two separate
sampling loops of 1000 µL, and with three 10-port valves to direct the gas flow into the
different columns. During the injections, the content of the first loop was directed into
three columns connected in series: a Molsieve13 column for separation of light gases
(CO, H2, Ar, CO2) and two Hayesep columns (Q and T) for separating light olefins (i.e.
ethylene, ethane, propylene). These columns were in turn connected to a TCD detector.
The second sampling loop was connected to a Praplot Q column to separate aromatic
compounds. From this column, the samples eluted unto a TCD and FID detectors
connected in series.
He and Ar were used as the carried gas, the port valves were kept at 130 °C to avoid
condensation of hydrocarbon products being analysed.
2.3.3 Catalyst activity tests:
The catalytic testing was carried out by introducing sieved catalysts (150-425 µm
sieved fractions) into tubular quartz rectors. The internal diameters of the rectors were 0.4
- 0.7 mm. The samples were fixed in the isothermal zone of the oven using quartz wool
and the flow adjusted to obtain a desired gas hour space velocity (GHSV). The detailed
reaction procedures followed for the different reactions studied is specified at the
beginning of each chapter.
Calculation of conversion and selectivities for MDA reaction tests was carried out
by analysing the GC response. Nitrogen was used as the internal standard to account for
the changes in flow in the reactor outlet. Total molar flows at the reactor outlet and inlet

76
were calculated using equations 2-14 and 2-15 assuming reaction pressures of 1 atm.
Molar flows for CH4 and reaction products were obtained with equations 2-16 and 2-17.
Methane conversion (XCH4) and selectivity to each product (Si) were calculated using
equations 2-18 and 2-19.
FT-inlet (mol/min) =𝐹𝑇−𝑖𝑛𝑙𝑒𝑡(𝑚𝐿/𝑚𝑖𝑛)
𝑅∗𝑇 Equation 2-14
FT-outlet (mol/min) =𝐹𝑁2−𝑖𝑛𝑙𝑒𝑡(𝑚𝐿/𝑚𝑖𝑛)/𝑁2𝑐𝑜𝑛𝑐.
𝑅∗𝑇 Equation 2-15
FCH4-inlet (mol/min) =𝐹𝐶𝐻4−𝑖𝑛𝑙𝑒𝑡(𝑚𝐿/𝑚𝑖𝑛).
𝑅∗𝑇 Equation 2-16
Fi-outlet (mol/min) =(𝐹𝑖(𝑚𝐿/𝑚𝑖𝑛)∗𝑖𝑐𝑜𝑛𝑐).
𝑅∗𝑇 Equation 2-17
XCH4 (%) = 100 ∗𝐹𝐶𝐻4−𝑖𝑛𝑙𝑒𝑡 − 𝐹𝐶𝐻4−𝑜𝑢𝑡𝑙𝑒𝑡.
𝐹𝐶𝐻4−𝑜𝑢𝑡𝑙𝑒𝑡 Equation 2-18
Si (%) =𝐹𝑖−𝑜𝑢𝑡𝑙𝑒𝑡 (𝑚𝑜𝑙/𝑚𝑖𝑛).
((𝐹𝐶𝐻4−𝑖𝑛𝑙𝑒𝑡(𝑚𝑜𝑙/𝑚𝑖𝑛)−𝐹𝐶𝐻4−𝑜𝑢𝑡𝑙𝑒𝑡(𝑚𝑜𝑙/𝑚𝑖𝑛))/𝑆𝑡𝑜𝑖𝑐ℎ𝑖𝑜𝑚𝑒𝑡𝑟𝑦−𝑖) Equation 2-19
Symbols:
R = constant 82.057 (mL.atm.K-1.mol-1).
T = temperature (K) at the GC injection loop.
FT-inlet = total flow at the reactor inlet.
FT-outlet = total flow at the reactor outlet.
Fi-outlet = flow of product i at the outlet.
N2conc = N2 concentration at the reactor outlet measured by GC.
Stoichiometry-i = CH4 stoichiometry in its conversion towards 1 mol of product i.
3.4 References
1 J. Klaas, G. Schulz-Ekloff and N. I. Jaeger, J. Phys. Chem. B, 1997, 101, 1305–
1311.
2 D. Wei, S. Chen and Q. Liu, Appl. Spectrosc. Rev., 2015, 50, 387–406.
3 P. Matousek, M. Towrie, C. Ma, W. M. Kwok, D. Phillips, W. T. Toner and A. W.
Parker, J. Raman Spectrosc., 2001, 32, 983–988.
4 CLF Ultra, https://www.clf.stfc.ac.uk/Pages/Ultra.aspx, (accessed 23 December

77
2017).
5 W. Zhou, R. P. Apkarian and Z. L. Wang, in Microvascular Corrosion Casting in
Scanning Electron Microscopy, ed. S. H. Aharinejad, Springer-Verlag, Wien,
1992, pp. 44–84.
6 D. B. Williams and C. B. Carter, Transmission Electron Microscopy: A Textbook
for Materials Science, Springer US, Boston, MA, 2009.
7 S. Matthias Thommes, K. A. Cychosz, R. my Guillet-Nicolas, J. Garcí a-Martí nez
and M. Thommes, Chem. Soc. Rev. Chem. Soc. Rev, 2017, 46, 389–414.
8 S. Brunauer, P. H. Emmet and T. Edward, J. Am. Chem. Soc., 1938, 60, 309–319.
9 M. Thommes, K. Kaneko, A. V Neimark, J. P. Olivier, F. Rodriguez-Reinoso, J.
Rouquerol and K. S. W. Sing, Pure Appl. Chem, 2015, 87, 1051–1069.
10 S. Storck, H. Bretinger and W. F. Maier, Appl. Catal. A Gen., 1998, 174, 137–146.
11 W. E. Farneth and R. J. Gorte, Chem. Rev., 1995, 61, 615–635.
12 A. Mekki-Berrada and A. Auroux, in Characterization of Solid Materials and
Heterogeneous Catalysts, eds. M. Che and J. C. Vedrine, Wiley-VCH Verlag
GmbH & Co. KGaA, 2012, pp. 757–761.
13 D. C. Koningsberger, B. L. Mojet, G. E. Van Dorssen and D. E. Ramaker, Top.
Catal., 2000, 10, 143–155.
14 A. Mottana and A. Marcelli, Hist. Mech. Mach. Sci., 2015, 27, 275–301.
15 J. J. Rehr, Rev. Mod. Phys., 2000, 72, 621–654.
16 M. Newville, Rev. Mineral. Geochemistry, 2014, 78, 33–74.
17 P. D’Angelo, M. Benfatto, S. Della Longa and N. V. Pavel, Phys. Rev. B - Condens.
Matter Mater. Phys., 2002, 66, 642091–642097.
18 M. Benfatto and S. Della Longa, J. Synchrotron Radiat., 2001, 8, 1087–1094.
19 R. Golnak, J. Xiao, K. Atak, J. S. Stevens, A. Gainar, S. L. M. Schroeder and E. F.
Aziz, Phys. Chem. Chem. Phys. Phys. Chem. Chem. Phys, 2900, 17, 29000–29006.
20 A. Gainar, J. S. Stevens, C. Jaye, D. A. Fischer and S. L. M. Schroeder, J. Phys.

78
Chem. B, 2015, 119, 14373–14381.
21 F. W. Lytle, D. E. Sayers and E. A. Stern, Phys. Rev. B, 1975, 11, 4825–4835.
22 S. Bordiga, E. Groppo, G. Agostini, J. A. Van Bokhoven and C. Lamberti, Chem.
Rev., 2013, 113, 1736–1850.
23 M. Newville, J. Synchrotron Radiat., 2001, 8, 322.
24 A. J. Dent, G. Cibin, S. Ramos, A. D. Smith, S. M. Scott, L. Varandas, M. R.
Pearson, N. A. Krumpa, C. P. Jones and P. E. Robbins, J. Phys. Conf. Ser., 2009,
190, 012039
25 A. B. Kroner, K. M. H. Mohammed, M. Gilbert, G. Duller, L. Cahill, P. Leicester,
R. Woolliscroft and E. J. Shotton, AIP Conf. Proc., 2016, 1741, 030014.
26 B. Ravel and M. Newville, J. Synchrotron Radiat., 2005, 12, 537–541.
27 E. Gallo and P. Glatzel, Adv. Mater., 2014, 26, 7730–7746.
28 P. Glatzel, R. Alonso-Mori and D. Sokaras, in X-Ray Absorption and X-Ray
Emission Spectroscopy Theory and Applications, eds. J. A. Van Bokhoven and C.
Lamberti, John Wiley & Sons, Ltd, First Edit., 2016, pp. 125–153.
29 U. Bergmann and P. Glatzel, Photosyth Res, 2009, 102, 255–266.
30 P. Glatzel, M. Sikora and M. Fernández-García, Eur. Phys. J. Spec. Top., 2009,
169, 207–214.
31 P. Eisenberger, P. M. Platzman and H. Winick, Phys. Rev. Lett., 1976, 36, 623–
626.
32 I20- Scanning - Diamond Light Source,
http://www.diamond.ac.uk/Beamlines/Spectroscopy/I20/XAS_XES_Branchline.
html, (accessed 24 February 2018).

79
Chapter 3
Study of the Nature and Location of Mo Active
Sites in Mo/H-ZSM-5 Catalyst during Methane
Dehydroaromatisation
Methane dehydroaromatisation (MDA) is a promising reaction to upgrade methane
directly into aromatics and light hydrocarbons. The most widely studied catalyst for this
reaction is Mo-containing medium pore H-ZSM-5 zeolite but the rapid deactivation of
the material compromises the commercialisation of this system. There is industrial
interest to develop new catalytic formulations with enhanced durability, therefore it is
necessary to gain knowledge concerning the nature of the active centres as well as the
causes of material deactivation.
In this chapter, the structure and location of Mo species have been studied for 4 wt.
% Mo/H-ZSM-5 catalyst by means of synchrotron-based characterisation techniques. X-
ray absorption spectroscopy (XAS) was collected under operando MDA to study the
evolution of Mo species under reaction conditions. The location of Mo in the zeolite was
investigated using high resolution powder diffraction (HRPD) with Rietveld refinement
and difference Fourier analysis. The results bring further understanding regarding the
nature of active Mo sites responsible for methane activation while the observed sintering
and migration of these species give new experimental evidence concerning the catalyst
deactivation mechanism.
3.1 Introduction
Due to the increasing availability of cheap natural gas from fracking and coal
gasification processes, methane has received growing attention as an alternative feedstock
80
to oil for transformation into platform chemicals (i.e. hydrocarbons and aromatics).1–3
Alternatively, methane could also be obtained by coal gasification or from renewable
sources (i.e. organic waste, manure, plant material or sewage).4
Methane dehydroaromatisation (MDA) is a promising route for the valorisation of
CH4 into higher value chemicals as it converts methane directly into aromatics and light
hydrocarbons giving H2 as co-product. The most promising catalyst for the reaction is
Mo/H-ZSM-5, usually prepared by ion exchange. It is generally accepted that methane
activation takes place on the Mo sites leading to the formation of C2 and C3 hydrocarbon
intermediates, mainly ethylene. Subsequently, these intermediates react on the Brønsted
acid sites (BAS) and are transformed into aromatics, via a bifunctional mechanism
involving the assistance of Mo species.5,6 The pore dimensions of the H-ZSM-5 zeolite
are believed to provide shape selectivity promoting benzene formation with up to 80 %
selectivity.7
Even if Mo/H-ZSM-5 presents promising performance, its commercialisation is
compromised by the rapid deactivation under MDA conditions. The accumulation of
carbonaceous deposits during reaction certainly decreases the catalyst activity and thus
there have been many studies focused on solving this problem.5,7 These studies include:
1) the optimisation of catalyst formulation investigating different supports or active
metals,8–11; 2) the design of reactor configurations to regenerate the carbon-containing
catalyst by the use of pulses of O2,12–14 or by the addition of hydrogen or oxidants as well
as C2–C4 alkanes/alkenes to the methane feed,6,15–17 and 3) the integration of an ion-
conducting membrane into the reactor exhibiting both proton and oxide ion
conductivity.18 In spite of the encouraging advances in these studies, the catalyst
deactivation by carbon deposition is far for being overcome. Better understanding on
reaction/deactivation mechanism is needed to move forward in the design of a stable
MDA system.
Many research groups have investigated Mo speciation present after calcination and
during methane exposure.19–23 But up until now, there is no consensus about the location
and nature of the active species, and their impact in the MDA activity or product
distribution is not well understood.22,24–26
During catalyst synthesis, the Mo precursor disperses on the zeolite giving Mo-oxo
species anchored on the Brønsted acid sites by replacing the acidic hydrogen. Iglesia et

81
al. propose that these Mo-oxo species consist of (Mo2O5)2+ dimers in the internal surface
of the zeolite (Scheme 3-1a).16,19,20,24,27 Their strongest evidence for dimers was obtained
from X-ray absorption data using MoMg2O7 reference compounds which contain dimeric
Mo in the structure.20 There is an alternative opinion based on spectroscopic and density
functional theory (DFT) studies claiming that (MoO2)2+ or (MoO2)(OH)+ monomers
anchor on the Brønsted acid sites in the zeolite channels (Scheme 3-1b).23,25,28
Furthermore, a dependence on the Si/Al ratio has been pointed out; i.e. via a monomer
bridging two acid sites at low Si/Al ratio, and via a dimer at higher Si/Al ratio.22,25 As a
result of XRD phase analyses, (Mo5O12)6+ species have been also proposed (Scheme
3-1c).21
a) Dimeric
(Mo2O5)2+
b) Monomeric
(MoO2)2+ (MoO2)2+ (MoO2)(OH)+
c) Polymeric
(Mo5O12)6+
Scheme 3-1. Different models of Mo species found in the literature for calcined Mo/H-ZSM-5 catalyst.
Regarding the location of Mo species, theoretical studies on Mo/H-ZSM-5 suggest
Mo anchors to specific sites in the zeolite zigzag intersections.23 Other groups claim the
presence of Mo on the external surface of the zeolite either as polynuclear species29–32 or
as isolated Mo-oxo species attached to silicon sites depending on the Mo loading.23
It is accepted that the Mo-oxo centres present after calcination are carburised under
methane flow at 700 °C and both MoCxOy and MoCx species have been reported as the
active site in MDA. Debate is also ongoing regarding monomeric or clusters nature of
these species or their location.21,26,33–36 Recent X-ray absorption studies on reacted
samples support fully carburised molybdenum as the species present during the
aromatisation of methane.24 It has been suggested that these MoCx species are unstable;
DFT and quantum mechanical calculations performed by Wachs et al. suggested that
clusters with a C/Mo ratio > 1.5 are more stable on the outer surface of the zeolite than
in the channels, and thus, more likely to migrate.37 Hensen et al. showed microscopic

82
evidence of molybdenum carbide particle growth on H-ZSM-5 crystal surfaces during 10
h of reaction.24
Recently, combined high energy resolution fluorescence detected X-ray absorption
spectroscopy (HERFD-XAS) and X-ray emission spectroscopy (XES) studies were
carried out under operando MDA conditions.38 XES can distinguish between C and O
ligands39,40 surrounding the Mo ion and evidenced the gradual replacement of O by C in
Mo-oxo species during early stages of MDA reaction. This allowed to propose structures
for the MoCxOy species in the induction period as well as the presence of MoCx species
at longer reaction times (Scheme 3-2). Partially carburised MoCxOy intermediates showed
selectivity to combustion products (i.e. CO, CO2, and H2O) as well as to light
hydrocarbons (C2-C3) whereas MoCx were selective species to aromatics.
Scheme 3-2. Schematics of Mo evolution proposed based on the results from combined XES and
HERFD-XANES measurements under operando MDA for Mo/H-ZSM-5 catalyst.38
Synchrotron-based operando X-ray techniques are a powerful tool for the
investigation of the structure-activity relationships in catalysis. The aim of the work
presented in this chapter is to further study the Mo species evolution under MDA reaction
conditions to gain understanding regarding the impact that structure and location of active
species have on catalyst performance during reaction. Thus, operando X-ray absorption
(XAS) as well as in situ high resolution powder X-ray diffraction (HRPD) measurements
were carried out on 4 wt. % Mo/H-ZSM-5 (Si/Al = 15) prepared by solid-state ion
exchange. This catalyst was chosen in light of the fact that many publications exists for
this material. 19,20,24,41 4 wt. % Mo loading has been reported to have a good metal
dispersion favouring monomeric Mo species22,25 while providing good XAS signal-to-
noise ratio in transmission mode.
XAS data collected was of sufficient quality for obtaining detailed insight into the
evolving Mo species and to correlate these structures with the catalytic performance. The
near edge spectra (XANES) revealed changes in the oxidation state and Mo symmetry

83
while the extended fine structure (EXAFS) enabled resolving the Mo structures. Rietveld
refinement of the HRPD data and the accompanying Fourier difference analysis allowed
to locate the metal on the zeolite channels as well as the degree of occupancy. Thorough
characterisation of calcined and reacted catalysts (i.e. Raman, UV-vis, FTIR, TGA, XRD,
HN3-TPD, microscopy and N2 physisorption) was also carried out to further support the
findings. This combined approach enabled to better understand the correlation between
structure and function and get insight into the catalyst deactivation mechanism.
3.2 Materials and methods
3.2.1 Catalyst synthesis and characterisation
ZSM-5 zeolite (Si/Al = 15) was supplied by Zeolyst International in the ammonium
form (CBV3024E). The proton form of the zeolite (H-ZSM-5) was obtained by
calcination at 550 ºC.
H-ZSM-5 and MoO3 (Sigma, 99.95 %) powders where manually grinded in an
agate mortar for 0.5 h. The characterisation presented in section 3.3.1 correspond to ex
situ calcined and MDA reacted samples. The calcination and reaction of MoO3 and H-
ZSM-5 physical mixture was carried out as follows. 0.6 g of sample (150-425 µm particle
size) were placed in a quartz reactor tube and plugged with quartz wool. The catalyst was
first calcined under 20 % O2/He flow and heated up to 700 °C at 5 °C/min and held for
30 min. After flushing the lines with inert gas, methane dehydroaromatisation was carried
out for 90 min by switching to CH4/Ar (1:1) flow. The total gas flow used for both
processes, calcination and MDA reaction, was 30 mL/min (gas hour space velocity
(GHSV) = 750 h-1).
In the results discussion (Section 3.3), the MoO3 and H-ZSM-5 physical mixture is
referred to as the as-prepared catalyst. The catalyst after calcination is denoted as Mo/H-
ZSM-5 while the reacted catalyst is named according their MDA reaction time (i.e. 7 min,
90 min).
X-ray diffraction (XRD) patterns of Mo/H-ZSM-5 samples were recorded using a
Rigaku SmartLab X-Ray Diffractometer fitted with a hemispherical analyser.
Approximately 0.5 g of sample were loaded into an aluminium sample holder and the
measurements were performed using Cu Kα radiation source (λ = 1.5406 Å) with a

84
voltage of 40 kV, and a current of 30 mA. The sample patterns obtained were compared
to diffractograms in the ICSD database for the identification of crystal phases present.
UV-Vis spectroscopy reflectance measurements were carried out in an UV-2600
Shimadzu spectrometer, using a light spot of 2 mm. ~ 0.2 g of sample was pressed into a
plastic sample holder and the reflectance was acquired from 200 to 800 nm. Reflectance
was transformed into absorbance by applying the Kubelka-Munk equation.42 BaSO4 was
used as white standard to act as background.
Elemental analysis of the samples was carried out by the analytical department in
Johnson Matthey Technology Centre. The samples were leached with by heating to 1000
˚C with lithium tetraborate followed by nitric acid treatment. The resulting solution was
analysed by inductively coupled plasma optical emission spectroscopy (ICP-OES) using
a Perkin Elmer Optical Emission Spectrometer Optima 3300 RL. The plasma power was
1300 watts, argon plasma flow of 15 L/min, auxiliary argon flow of 1.5 L/min, nebuliser
argon flow 0.80 L/min, and pump speed of 1.5 mL/min.
Surface characterisation of the zeolites was performed by nitrogen physisorption
measured at 77.3 K on a Quadrasorb EVO QDS-30 instrument. Around 150 mg of sample
were outgassed at 350 °C overnight under high vacuum prior to the sorption. The
Brunauer–Emmett–Teller (BET) equation was used to calculate the specific surface area
in the pressure range p/p0 = 0.0006−0.01. The micropore volume was calculated from the
t-plot curve using the thickness range between 3.5 and 5.4 Å.
Thermogravimetric analysis (TGA) measurements were carried out in a TA Q50
instrument. All samples (~ 20 mg) were heated up to 950 °C using a ramp of 5 °C/min
under the air flow of 60 mL/min and they were held at 950 °C for 5 min.
Fourier-transform infrared (FTIR) spectra were recorded on a Nicolet iS10
spectrometer. Samples were pressed into self-supporting wafers (ca. 10 mg/cm2). The
samples were dried prior to measurement by heating them up to 285 °C for 3 h under 70
ml/min He flow. After dehydration, the samples were cooled down to 150 °C under dry
He for the spectra collection.
Temperature programmed desorption of ammonia (NH3-TPD) measurements
were performed in an AutoChem II 2920 micromeritics instrument equipped with a
moisture trap and a thermo-conductivity detector. Samples were first preactivated by

85
flowing pure N2 and heating up to 550 °C for 30 min (5 °C/min). The reactor was then
cooled down to 100 °C for ammonia absorption which was run by flowing 1 %
NH3/N2 until saturation (~ 1 h). Next, pure N2 was flowed for 2 h to remove any excess
of ammonia on the sample. Finally, ammonia desorption was carried out by increasing
temperature up to 1100 °C with a ramp of 10 °C/min. All the signals were normalised to
the sample mass.
Transmission electron microscopy measurements were performed by the
analytical department at Johnson Matthey Technology Centre using the JEM 2800
(Scanning) microscope. Voltage was 200 kV and the aperture was 70 and 40 µm.
Secondary electron signal was acquired providing topological information of the sample.
Dark-field imaging in scanning mode was carried out using CCD detector and an off-axis
annular detector.
3.2.2 XAS studies under operando MDA conditions
X-ray absorption (XAS) studies were performed at B18 beamline at Diamond Light
Source43 in Harwell Campus, United Kingdom. The electron energy of the storage ring
was 3 GeV and the ring current was 300 mA. A monochromatic beam was obtained by
using a fast scanning Si (1 1 1) double crystal monochromator. Mo K-edge XAFS spectra
(in the range of 19,797 to 21,000 eV) were collected in transmission mode where the X-
ray beam intensity was detected by three ion chambers measuring: the incident intensity
(I0), the intensity of the beam after passing through the sample (It) and the intensity of the
beam after passing through a Mo foil (Iref). The dimensions of the X-ray beam at the
sample position was ca. 1 × 1 mm2.
For the operando MDA experiments, 40 mg of the as-prepared catalyst (sieve
fractions: 0.425-0.150 mm) was placed in a 3 mm diameter quartz capillary. Thus,
simultaneous to the XAFS data acquisition, catalytic data were recorded using an online
mass spectrometer (OmniStar GSD 320O1) connected to the capillary outlet. The reactor
outlet was connected to the MS by heated lines at 200 ºC to avoid condensation of
aromatic products. The sample was first calcined at 700 ºC for 30 min (20 % O2 in He)
by means of a hot air blower using a heating ramp of 5 ºC/min. After calcination the
sample was cooled down in Ar flow for acquisition of spectra at room temperature. The
sample was heated for a second time up to700 ºC and held for 30 min (20 % O2 in He, 5

86
ºC/min temperature ramp). After flushing with Ar for 15 min to remove O2 from the lines,
the flowing gas was switched to a CH4/Ar mixture (1:1) and the MDA reaction was
carried out at 700 ºC for 90 min (GHSV = 3000 h-1).
Mo2C, FeMoO4 and MoO3 references were purchased from Sigma Aldrich (purity
> 99.5 %). The XAS spectra were collected on references in pellet form (300 mg sample
in 1.3 mm diameter pellet) at room temperature. Samples were first diluted with cellulose
aiming at an adsorption edge step µx = ~ 1 (where µ is the atomic absorption coefficient
in cm-1 and x is the thickness in cm).
XAS data processing and analysis was performed using the Demeter software
package. The EXAFS fitting was performed by means of the quick first shell fit tool.44 In
case of the calcined and ~ 90 min reacted catalyst, 4 scans were merged to obtain better
data quality for the fittings. Due to fast spectral changes during the induction period of
the reaction the analysis of 2, 7, and 8 min of reaction correspond to fits to a single EXAFS
scan. For the analysis the amplitude reduction factor parameter was set to 0.91, the value
was obtained by fitting the Mo foil reference to crystallographic data form ICSD database.
The coordination number values were chosen taking into account the models proposed in
the literature and ICSD crystallographic data. All the rest of the parameters presented
were fitted. Typical k-range values over which the data were fitted spanned 3 to 11 Å-1
whereas the R range from values from 1 to 3.2 Å were used. All the Fourier transformed
EXAFS data presented corresponds to phase corrected plots on the shortest Mo-O
scattering path.
3.2.3 In situ high resolution powder diffraction
High resolution X-ray powder diffraction (HRPD) data were collected at BM01A
beam line of the ESRF (the Swiss-Norwegian beamline). The diffractometer is based on
a Huber goniometer with a Pilatus 2M detector. X-rays with a wavelength of 0.69811 Å
were used, selected by 2 Rh coated mirrors and a silicon (1 1 1) double crystal
monochromator. The beamline setup is described in detail elsewhere.45 Data were
collected at a sample to detector distance of 260 mm - calibrated using NIST SRM660b
lanthanum hexaboride - and a 2-θ range of 2 to 48.5 ° was used in the Rietveld analysis.
Samples of as-prepared Mo/H-ZSM-5 were packed between plugs of quartz wool in 0.5
mm diametre quartz capillaries and mounted in a Norby-type flow cell.46 The samples

87
were calcined at a temperature of 600 °C with a heating rate of 6 ºC/min and held for 8 h
before cooling down to room temperature. A hot air blower was used to heat the sample
and calcination was done under 10 mL/min flow of 50 % oxygen in helium (GHSV = 750
h-1). Data were collected throughout the process with a data collection time of 10 s per
frame and converted to 1-D powder patterns using Fit2D47,48 and the SNBL scaling
software.49 Data on ex situ reacted sample was also collected; the reaction was carried out
at 700 °C for 90 min, using CH4/Ar (1:1) flow (GHSV = 1500 h-1)
Rietveld and difference Fourier analysis was carried out by researchers in INGAP
Centre for Research Based Innovation (University of Oslo) with the program TOPAS50
and taking the initial zeolite structure model for the framework from crystallographic
database. After refinement of the framework model to obtain reasonable lattice
parameters, difference Fourier maps were used to locate the Mo atoms. The scaling factor
was obtained using the high angle data which are not significantly affected by adsorption
of molecules in a zeolite framework.51 This was fixed for determination of the difference
maps using the whole powder pattern. In the final Rietveld refinements all framework
atom positions were refined without restrains along with isotropic thermal parameters for
the silicon and oxygen atoms, background, peak broadening, scale factor, lattice
parameters, zero point correction and occupancies for the non-framework atoms.
3.3 Results and discussion
3.3.1 Catalyst characterisation
Chemical analysis and N2 physisorption:
The results for chemical analysis and textural properties of the as-prepared, calcined
and reacted catalyst are presented in Table 3-1. The Mo content of the sample before and
after calcination is ~ 3.8 wt. % indicating negligible Mo mass loss due to MoO3
sublimation during the 30 min of calcination at 700 ºC. The introduction of Mo into the
H-ZSM-5 upon calcination and solid-state ion exchange leads to a 16.5 % decrease in the
BET area while the micropore volume shrinks 18.7 %. The decrease in micropore volume
after 90 min of MDA can be attributed to the presence of carbon deposits accumulated
during the reaction that fill or cover the zeolite pores.

88
Table 3-1. Textural and physicochemical properties of the zeolite materials studied.
Sample Expected Mo
content (wt. %)
Mo content
(wt. %)
SBET
(m2/g)
Vmicro
(cm3/g)
H-ZSM-5 - - 412 0.15
MoO3 + H-ZSM-5 4 3.72 385 0.15
Mo/H-ZSM-5 calcined 4 3.80 344 0.12
Mo/H-ZSM-5 90min reacted / / 326 0.11
Powder X-ray diffraction:
The XRD patterns of MoO3 + H-ZSM-5 physical mixture, calcined Mo/H-ZSM-5
and parent H-ZSM-5 zeolite are shown in Figure 3-1a.
10 15 20 25 30 35 40
**
*
*
*
Diffr
acte
d X
-ray inte
nsity (
a.u
.)
2 Theta (deg)
H-ZSM-5
MoO3 + H-ZSM-5
Mo/H-ZSM-5
*
* MoO3
a)
6 8 10 12 14 16 18 20 22 24
Diffr
acte
d X
-ra
y in
ten
sity (
a.u
.)
2 Theta (deg)
H-ZSM-5
Mo/H-ZSM-5b)
Figure 3-1. a) XRD patterns for H-ZSM-5, MoO3 + H-ZSM-5 physical mixture and calcined 4 wt. % Mo/H-
ZSM-5 showing the disappearance of MoO3 reflection upon calcination; and b) comparison of H-ZSM-5 and
Mo/H-ZSM-5 showing the absence of shift in or broadening in the reflections.
The as-prepared sample exhibits reflections of both MoO3 and the zeolite. The
peaks at 2 ° values of 12.78, 25.7, 27.35, 38.60 and 39.00 which correspond to the (200),
(201), (210) and (600) reflections of MoO3 crystals completely disappear in the calcined
sample. This suggests that calcination leads to the dispersion of MoO3 to undergo solid
state ion exchange with the Brønsted acid sites of the zeolite.29,52 No obvious shift in
reflection position or reflection broadening is seen to occur (Figure 3-1b) indicating that

89
the zeolite structure was maintained upon calcination without being notably affected by
zeolite de-alumination or the presence of molybdenum.
Fourier-transform infrared spectroscopy:
Interaction of Mo with the zeolite was also studied by inspection of the hydroxyl
region of the Fourier transform infrared spectroscopy (FTIR) spectra shown in Figure 3-2.
Bands around 3742 cm-1 correspond to silanol groups, absorption around 3605 cm-1 is
attributed to bridging hydroxyl group also denoted as Brønsted acid sites and the band at
~ 3658 cm-1 is due to OH on extra framework alumina-like species.53 The spectra of H-
ZSM-5 and as-prepared catalyst show no significant differences. For the calcined Mo/H-
ZSM-5, the intensity of all the bands decrease indicating that when diffusing into pores
upon calcination, Mo is attached to the zeolite by interaction with the hydroxyls groups.
Attending to the relative intensities of the hydroxyl bands, the intensity decrease is more
pronounced for the BAS and silanol defects suggesting Mo interacts preferentially with
these sites.
3800 3750 3700 3650 3600 3550 3500 3450
3605
3658
Absorb
ance (
a.u
.)
Wavenumber (cm-1
)
H-ZSM-5
MoO3+ H-ZSM-5
Mo/H-ZSM-5 calc.
3742
Figure 3-2. FTIR spectra for H-ZSM-5, MoO3 + H-ZSM-5 physical mixture and calcined 4 wt. %
Mo/H-ZSM-5.

90
UV-Vis spectroscopy:
UV-vis bands (Figure 3-3b) were observed between 200 to 400 nm, absorption in
this region is typically attributed to ligand to metal charge transfer transitions (i.e. O2- →
Mo6+).54 The as-prepared sample containing MoO3 crystallites presents a maximum of
the charge transfer band around 252 nm with shoulders visible at 287 and 347 nm similar
to previous publications on octahedral interconnected Mo centres.55,56 The calcined
sample shows a narrower absorption region with its maximum at lower wavelengths of
228 nm.
A wide range of interpretations can be found in the literature for UV-vis bands for
supported Mo oxides and there is significant overlap of the spectral regions reported by
different groups. Tetrahedrally coordinated isolated species have been assigned in a range
of 220 to 295 nm,57 octahedrally coordinated Mo6+ species in the region of 270 to 330
nm,55 and connected Mo oxide centres at wavelength above 250 nm.28
The absorption intensity at low wavelengths of 228 nm in the calcined sample
compared to the physical mixture (absorption > 252 nm) suggests that isolated tetrahedra
Mo6+ species are formed upon calcination; nevertheless, a better understanding of Mo
local environment is obtained through XAS studies discussed later in the chapter.
200 300 400
0.1
0.2
0.3
0.4
200 300 400
0
2
4
6
8
10
228
252
347
Ku
be
lka
Mu
nk
(a.u
.)
Wavelength (nm)
MoO3 + H-ZSM-5
287
Wavelength (nm)
Mo/H-ZSM-5
Figure 3-3. UV-Vis spectra for as-prepared and calcined 4 wt. % Mo/H-ZSM-5.

91
Thermo-gravimetric analysis:
The TGA results for the catalyst at different preparation stages as well as for the
catalyst reacted for 90 min are shown in Table 3-2. The presence of acid sites in zeolites
brings them hydrophilic character and they usually present physisorbed water; the weight
loss at temperatures below 250 °C is attributed to desorption of water. The weight loss
between 350 and 600 °C is caused by the burning-off of the carbon deposits present in
the reacted sample.
The mass of adsorbed water decreases 16 % from the parent zeolite to the calcined
Mo/H-ZSM-5. This decrease is probably due to the presence of ion exchanged Mo in the
pores which reduce the number of BAS. The reacted sample presents 3.8 wt. % of the
coke accumulated during the 90 minutes of MDA. The adsorbed water content in this
sample is even lower (56 % decrease from parent zeolite), probably as a consequence of
the presence of carbon deposits blocking the pores and reducing the micropore volume.
Table 3-2. Mass loss of 4 wt. % Mo/H-ZSM-5 catalysts determined by TGA.
Sample Mass loss (wt. %)
T < 250 °C
Mass loss (wt. %)
350 < T < 500 °C
H-ZSM-5 6.4 /
MoO3 + H-ZSM-5 6.1 /
Mo/H-ZSM-5 calcined 5.4 /
Mo/H-ZSM-5 90min MDA 2.8 3.8
From the characterisation results discussed above we can conclude that the initial
MoO3 crystallites in the as-prepared sample sublimate into the zeolite pores upon
calcination where they interact with the zeolite BAS as well as with silanol groups giving
highly dispersed Mo species. The zeolite structure does not appear to be affected by the
ion exchange process. The TGA analysis carried out for the 90 min reacted sample
suggests that 3.8 % of carbon deposits accumulate during reaction which partially block
or cover the zeolite pores resulting in a decrease of the zeolite micropore volume
available.

92
3.3.2 Operando XAS studies
To get insight into the type of Mo species formed during MDA reaction, operando
time-resolved XAS measurements were performed on Mo/H-ZSM-5 catalyst. X-ray
absorption spectra were continuously collected during: 1) calcination of the as-prepared
sample heating up to 700 °C in air (20 % O2/He, 5 ˚C/min ramp), and 2) MDA reaction
(700 °C, 50 % CH4/Ar). In this section, results of Mo K-edge X-ray Absorption Near
Edge Structure spectra (XANES) as well as the analysis of the Extended X-ray
Absorption Fine Structure (EXAFS) on Mo/H-ZSM-5 are presented.
3.4.2.1 Study of the calcination step
Figure 3-4a shows the Mo K-edge XANES spectra collected during the
calcination of the as-prepared catalyst. The spectrum of the sample at low temperatures
corresponds to crystalline MoO3 containing Mo6+ species in octahedral coordination. The
absorption edge ~ 20015 eV (taken as the energy at half-step height) is attributed to
dipole-allowed 1s → 5p transition. A pre-edge peak corresponding to 1s → 4d transition
is present at 20005 eV. The s → d transitions are dipole forbidden but may become
allowed due to a d/p orbital mixing. More intense pre-edge peaks are observed in non-
centrosymmetric structures due to the p-d orbital hybridisation occurring in these
arrangements.20 In case of MoO3, distortion form perfect octahedral geometries result in
the appearance of the weak pre-edge peak.
The evolution of Mo structure at increasing calcination temperatures is
comparable to previous studies.20 As shown in Figure 3-4a, the XANES spectra do not
change significantly up to 600 °C indicating that local structure of Mo is not altered. The
pre-edge intensity increase > 600 °C suggests change in molybdenum symmetry from
octahedral to possibly tetrahedral.58 In addition, the post-edge region above 600 °C loses
its features resulting in a broad peak that could indicate dispersion of Mo into isolated
species. In agreement, no MoO3 crystallites were detected by XRD (Figure 3-1a), while
FTIR (Figure 3-2a) suggests the anchoring of Mo to the zeolite through interaction with
BAS and other hydroxyl groups.
The phase corrected Fourier transform of the extended fine structure (FT-EXAFS)
are shown in Figure 3-4b and give insight into distances to the absorber’s neighbouring
atoms. At low temperatures the sample presents FT features of MoO3.20,59 The distorted

93
octahedral MoO6 units in MoO3 structure are known to contain a set of different Mo-O
bond distances: two short bonds of ~ 1.7 Å, two medium of ~ 1.95 Å and two longer bond
of ~ 2.3 Å.60 The scattering form near neighbour O results in two resolved peaks in the
FT-EXFS with maxima around 1.5 and 2.2 Å. The third peak observed, between 3 and 4
Å, arises from scattering from neighbour Mo atoms in agreement with reported Mo-Mo
bond distance of c.a. 3.5 Å.61
Figure 3-4. a) Mo K-edge XANES and b) Mo K-edge FT-EXAFS of 4 wt. % Mo/H-ZSM-5 during
calcination while heating to 700 °C (5 °C /min, 20 % O2/He, GHSV = 3000 h-1).
20000 20020 20040 20060 20080
0.0
0.2
0.4
0.6
0.8
1.0
1.2
Norm
alis
ed x
(E)
Energy (eV)
RT
100 oC
200 oC
300 oC
400 oC
550 oC
600 oC
650 oC
700 oC
a)
1.0 1.5 2.0 2.5 3.0 3.5 4.0 4.5
0.0
0.2
0.4
0.6
0.8
(R
) (A
-3)
Radial distance (Å)
RT
100 oC
200 oC
300 oC
400 oC
550 oC
600 oC
625 oC
650 oC
700 oC
b)

94
Although the peak positions remain unchanged during the thermal treatment up to
600 °C, the intensity of the peaks show gradual decrease. This decrease, which is more
pronounced at higher radial distances, can be attributed to the increasing atom vibration
due to thermal effects which smear out the EXAFS oscillations affecting the signal
intensity in the Fourier transform. At temperatures > 600 °C, significant changes occur in
the spectra. The peak ~ 3-4 Å disappears suggesting decrease of Mo coordination in the
second shell due to the formation of isolated Mo-oxo species. In addition, the ~ 2.2 Å
peak intensity decreases while the peak at 1.5 Å increases indicating the species formed
upon calcination have greater contribution of short Mo-O bonds distances.
Figure 3-5 compares the room temperature spectra of the calcined Mo/H-ZSM-5
with the Fe2(MoO4)3 reference containing isolated MoO4 tetrahedra and FeO6 octahedra
connected through corners by two-coordinated oxygen atoms.62 The resemblance of both
XANES spectra (Figure 3-5a) indicate tetrahedral-like structure for the ion exchanged
molybdenum. Regarding the nature of this Mo-oxo species present after calcination, both
monomers and dimers have been contradictorily reported in the literature and no
consensus has been reached regarding the structure of the Mo species after
calcination.20,23 Given that both type of species contain tetrahedrally-coordinated Mo
centres, we cannot readily conclude from our XANES spectra whether they are
monomers, dimers or a mixture of both. Comparing our XANES results to the ones
obtained by Ressler et al.28 for monomeric Na2MoO4 and dimeric Na2Mo2O7 references
we suggest we mostly have monomeric species in the calcined sample.
20000 20050 20100 20150
No
rma
lise
d x
(E)
Energy (eV)
Mo/H-ZSM-5
Fe2(MoO4)3
a)
1 2 3
0.0
0.5
1.0
1.5
2.0
(R
) (A
-3)
Radial distance (Å)
Mo/H-ZSM-5
Fe2(MoO
4)3
b)
Figure 3-5. Room temperature Mo-K edge XAS spectra for calcined 4 wt. % Mo/H-ZSM-5 and Fe2(MO4)3
reference: a) XANES spectra, and b) FT-EXAFS (phase corrected) spectra, vertical black lines mark the
maximum of the peak.

95
The FTs of the calcined sample (room temperature) and Fe2(MoO4)3 are shown in
Figure 3-5b. Fe2(MO4)3 comprises four O atoms at average distance of 1.76 Å. Mo/H-
ZSM-5 exhibits a less intense peak than the reference, fewer neighbours could be the
cause of the lower intensity in the FT however, nonetheless XANES features indicate
tetrahedral coordination for both samples. The intensity decrease in this case is more
probably due to static disorder in the sample (i.e. presence of oxygens coordinated at
different distances). A slight shift in the position of the peak to lower radial distances is
observed (maximum of the peaks marked with a black line in Figure 3-5b). This is
consistent with the presence of shorter terminal Mo=O bonds in the calcined sample as
previously proposed for Mo species anchored in the zeolite framework (see Scheme 3-1
in section 3.2).
In summary, the study of the calcination process in air indicates that ion exchange of
MoO3 with the zeolite requires temperatures > 600 °C. The thermal treatment leads to the
formation of isolated tetrahedral molybdenum species, possibly as monomeric species.
These would be anchored to the zeolite framework through two bridging Mo-O and with
two terminal Mo=O double bonds as proposed in previous investigations.19,38
3.4.2.1 Mo evolution during methane dehydroaromatisation
The Mo-oxo species present after calcination evolve in contact with methane at 700
°C forming the active species for the dehydroaromatisation reaction. The operando XAS
experiments discussed in this section allow us to follow the Mo evolution and to correlate
the nature of different Mo species with their activity in methane activation.
Figure 3-6 shows the Mo K-edge XANES spectra and the mass spectrometry (MS)
results collected simultaneously during reaction. For easier discussion of the data we
divide the course of the methane dehydroaromatisation reaction (MDA) into three main
stages: 1) induction period corresponding to the first minutes of the reaction 2) production
of aromatics which occurs immediately after the induction period once the Mo has been
carburised, and 3) catalyst deactivation where CH4 conversion and aromatic product
formation drops gradually.
A maximum in CH4 consumption is observed by MS at short reaction times,
typical for the induction period in which carburisation/reduction of Mo-oxo species
occurs. As expected, mass traces of CO, H2O and CO2 are also detected (see Figure 3-6b),

96
resulting from the removal of oxygen atoms during the carburisation process. The
formation of H2 during the induction period indicates ongoing dehydrogenation which
could result in the formation of C2/C3 intermediates as well as carbon deposits. Research
groups investigating MDA do not generally report detection of light hydrocarbons during
the induction period.5,24,63 Nevertheless, traces of C2H4 on the catalyst surface have been
observed by NMR64 while detection of light hydrocarbons during the induction period
was reported by Lezcano et al.38 In our mass spectrometry results, signals for C2Hx and
C3Hx (m/z = 27 and 25) are observed during the induction period. The level of these
masses however, is comparable to the ones obtained for the blank measurement. Thus,
these signals are attributed to a secondary effect of high CH4 concentration in the MS
ionisation chamber. Alternatively, the detection could be due to traces of impurities
coming from the methane cylinder used in the experiments. The blank measurements are
included in the appendix where Figure A3-1 compares mass trends for CH4 (m/z = 15),
H2 (m/z = 2), and C2/C3 (m/z = 25 and 27) collected during the induction period with the
blank.
Above 8 min minutes of CH4 exposure the aromatisation stage commences. C2Hx and
C3Hx production is observed along with the formation of increasing amounts of aromatics
(i.e. benzene and minor amounts of toluene with m/z of 78 and 91 respectively). Longer
reaction times lead to the catalyst deactivation evidenced by a decrease in CH4
consumption. After reaching a maximum upon 15 min of reaction, the mass traces of
benzene and H2 steadily decrease, indicating deactivation. In contrast, C2Hx and C3Hx
(i.e. mainly ethylene, see Figure 3-6a) production constantly increase, in agreement with
previous reports.19,65–67
Figure 3-6c shows the evolution of near-edge spectra (XANES) during the
different stages of the MDA. Immediately after the CH4 exposure, a gradual decrease in
the pre-edge intensity and an absorption energy shift to lower energies are observed. This
is attributed to the formation of partially-reduced MoCxOy species during the initial stages
of the carburisation process. After 7 min, a more pronounced edge shift occurs, suggesting
that Mo reduction is practically complete upon 8 min marking the end of the induction
period. This observation coincides with the MS data recorded during the reaction showing
a maximum CH4 consumption around 8 min of reaction.

97
0 10 20 30 40 50 60 70 80 90
Induction
periodM
ass S
igna
l (a
.u.)
Reaction time (min)
CH4 (m/z=15) (/1000)
C2Hx (m/z=25)
C2Hx+C3Hx (m/z=27)
C6H6 (m/z=78)
C7H8 (m/z=91)
a) Aromatisation and gradual deactivation
8 min
0 10 20 30 40 50 60 70 80 90
Ma
ss S
ign
al (a
.u.)
Reaction time (min)
H2 (m/z=2)
CH4 (m/z=15)/1000
H2O (m/z=18)
CO/C3Hx/C3H8/CO2 (m/z=28)
CO2/C3H8 (m/z=44)
b)
Induction
period
Aromatisation and gradual deactivation
8 min
20000 20020 20040 200600.0
0.2
0.4
0.6
0.8
1.0
2min
3min
7min
8min
12min
17min
28min
48min
92min
No
rma
lise
d x
(E
)
Energy (eV)
c)
Figure 3-6. MS and XANES data collected during the MDA reaction (T = 700 °C; CH4/Ar = 1; GHSV =
3000 h-1) on 4 wt. % Mo/H-ZSM-5. a) Mass traces of CH4 and products formed during the aromatisation
stage; b) mass traces of CH4 and products formed during the induction period and c) Mo K-edge XANES
spectra acquired at different reaction times.
The reduction of Mo species during MDA is studied in detail by correlating Mo K-
edge energies (edge position at half-step height) with the integer metal oxidation state. A
linear fit obtained in previous synchrotron studies38 with MoO, MoO3 and Mo2C
references is used for the determination of Mo oxidation states of the catalyst. Figure 3-7
shows the linear regression whilst Table 3-3 summarises the values of Mo oxidation state
and edge position at different reaction times. The oxidation state values resulting from

98
the analysis are similar to previous publication.38 The initial Mo+6 in the calcined sample
is reduced to a mixture of Mo+5 and Mo+4 species during the induction period, consistent
with the formation of MoCxOy centres. At reaction times above 8 minutes, the Mo species
appear reduced to Mo+2. It is worth mentioning that slight but constant changes in the
edge position occurred until the end of the reaction, consistent with previous observations
suggesting that carburised Mo species sinter during reaction.
2 3 4 5 6
20008
20010
20012
20014
Edg
e p
ositio
n (
eV
)
Formal oxidation state
As-preparedCalcined
2 min3 min
7 min
8 min
92 min
Figure 3-7. Evolution of Mo oxidation state during activation and MDA reaction (T = 700 °C; CH4/Ar
= 1; GHSV = 3000 h-1) on 4 wt. % Mo/H-ZSM-5.
Table 3-3. Oxidation state and Mo K-edge energies (E0) of 4 wt. % Mo/H-ZSM-5 during calcination
and MDA reaction (T = 700 °C; CH4/Ar = 1; GHSV = 3000 h-1).
Sample Oxidation State Edge Energy (keV)
MoO3+ H-ZSM-5 as-prepared 5.9 20014.6
Mo/H-ZSM-5 calcined 5.8 20014.2
Mo/H-ZSM-5 2 min MDA 4.6 20012.1
Mo/H-ZSM-5 3 min MDA 4.5 20011.9
Mo/H-ZSM-5 7 min MDA 4.1 20011.2
Mo/H-ZSM-5 8 min MDA 2.3 20007.8
Mo/H-ZSM-5 92 min MDA 2.0 20007.3

99
Further insight into the structure of the evolving Mo species is given by the radial
distribution functions of the X-ray absorption fine structure (FT-EXAFS) spectra. The
FT-EXAFS at different stages of reaction (i.e. after calcination, during the induction
period and subsequent aromatics formation) are plotted in Figure 3-8. As the experiment
was carried out under dynamic conditions, it is not possible to unambiguously correlate
one Mo environment with a particular spectrum. However, what is clear from Figure 3-8
is that the distinctive peaks in the FTs evolve under reaction conditions. The evolution of
these peaks together with the oxidation states obtained by XANES serve as a guidance
for the fitting of models to the real EXAFS data and the subsequent refinement of
structure parameters. The parameters obtained by the spectral fitting are shown in Table
3-4 and correlate well with previously proposed Mo evolution; the experimental and
simulated spectra are plotted in Figure 3-9.
To discuss the EXAFS analysis and fittings procedure we start refining the structure
of tetrahedral monomeric Mo6+ species proposed in the calcined catalyst. The FT-EXAFS
for calcined Mo/H-ZSM-5 shown in Figure 3-8 present a broad peak; its fitting can be
approximated to a Mo6+ environment possessing Td symmetry (i.e. coordinated to 4
oxygens at ~ 1.78 Å similar to those previously reported for Mo in reference
compounds).68 However, in order to achieve a charge neutral Mo6+ species in ZSM-5 it
is necessary to consider a structure in which two terminal Mo=O bonds at ~ 1.69 Å and
two Mo-O bonds at ~ 1.85 Å (attached to the zeolite framework). Although the k-range
over which the EXAFS data are fitted is too low to resolve two contributions from the
same type of scatterer, the two-shell refinement produced a sensible and stable fit (i.e. the
two O shells do not converge to a single Mo-O distance).
Further evidence for the validity of this approach can be seen when comparing the
FT from the calcined sample with the Fe2(MoO4)3 reference discussed earlier in Figure
3-5b, a shorter Mo-O radial distribution component is present in the zeolite sample which
is not present in the oxide reference.

100
Figure 3-8. FT-EXAFS of the spectra recorded during the first 90 minutes of MDA reaction (50 %
CH4/Ar, 700 °C, GHSV = 3000 h-1) for 4 wt. % Mo/H-ZSM-5.
Data recorded during the early stages of MDA (i.e. 2 – 7 min.) reveal a reduction
in the FT intensities and the evolution of two distinct peaks (Figure 3-8). The shorter of
the two components corresponds to Mo=O whereas the longer distance corresponds well
(based on bond length) to the presence of Mo-C species.
Using XANES-derived oxidation state information to limit the coordination state
of the Mo species it is possible to propose that when Mo comes into contact with methane
and after two minutes of reaction the number of short Mo=O terminal bonds decreases
i.e. are replaced by longer Mo-C bonds. We note however, that in order to obtain a good
fit to the data it is necessary to include 2 Mo-O(framework) contributions at 1.85 Å
although they are not obviously present on direct inspection of the FTs. Nonetheless, their
inclusion in the simulation leads to an improvement in the fit even when taking into
account the inclusion of extra fitting parameters;69 the comparatively large values for
the Mo-O contribution is due to destructive interference.
With increasing reaction times (3 and 7 minutes) in the induction period, the peak
at longer radial distances (Mo-C) gradually increases at expense of the short distance peak
0 1 2 3 4
-0.2
0.0
0.2
0.4
0.6
0.8
1.0
1.2
1.4|
(R)|
(A
-3)
Radial distance (Å)
Calcined
.
2 min
3 min
7 min
8 min
21 min
90 min

101
(Mo=O). Interestingly it is this relative change in the respective contributions for Mo=O
and Mo-C that also accounts for the apparent shift of the Mo-C peak in the FT to lower
R values. This implies that reduction and carburisation of Mo commences by replacement
of terminal oxygens by carbon forming new Mo-C bonds.
3 4 5 6 7 8 9 10
-1.0
-0.5
0.0
0.5
1.0
k2
(k) (A
-2)
Wavenumber (Å-1)
Calcined
Fit
a)
0 1 2 3 40
1
2
3
4
5
6Mo=O
(R
) (A
-3)
Radial distance (Å)
Calcined
Fit
b) Mo--O
4 6 8 10
-0.3
-0.2
-0.1
0.0
0.1
0.2
0.3
0.4
k2
(k) (A
-2)
Wavenumber (Å-1)
2 min
Fit
c)
0 1 2 3 40.0
0.5
1.0
1.5
2.0
Mo=O
(R
) (A
-3)
Radial distance (Å)
2 min
Fit
d) Mo C

102
4 6 8 10
-0.4
-0.2
0.0
0.2
0.4
k2
(k) (A
-2)
Wavenumber (Å-1)
7 min
Fit
e)
0 1 2 3 40.0
0.5
1.0
1.5
2.0
2.5
3.0
(R
) (A
-3)
Radial distance (Å)
7 min
Fit
f)
Mo=O
Mo C
4 6 8 10
-0.4
-0.3
-0.2
-0.1
0.0
0.1
0.2
0.3
0.4
k2
(k) (A
-2)
Wavenumber (Å-1)
8 min
Fit
a)
0 1 2 3 40.0
0.1
0.2
0.3
(R
) (A
-3)
Radial distance (Å)
8 min
Fit
h)
Mo-Mo
Mo C
4 6 8 10
-0.4
-0.2
0.0
0.2
0.4
k2
(k) (A
-2)
Wavenumber (Å-1)
90 min
Fit
g)
0 1 2 3 40.0
0.1
0.2
0.3
(R
) (A
-3)
Radial distance (Å)
90 min
Fit
j)
Mo-Mo
Mo C
Figure 3-9. Mo K-edge EXAFS and FT-EXAFS fit plots for Mo/H-ZSM-5 spectra acquired after calcination
(a and b); at 2 min under CH4 (c and d), at 7 min under CH4 (e and f) and after > 7 min under CH4 (g to j).
Black line: experimental; red dots: simulation.

103
Table 3-4. EXAFS fitting parameters for Mo/H-ZSM-5 during calcination, induction period and
aromatisation stages (T = 700 °C). Fitting Parameters: So2 (amplitude reduction factor) = 0.91, Fit Range:
3<k<12, 1<R<4, 16 independent. Where CN = co-ordination number, R = bond distance (Å) of the
Absorber-Scatterer, σ2 = mean squared disorder term (sometimes referred to as the Debye Waller factor),
Ef = Eo, RFactor = a statistic of the fit, which is a way of visualizing how the misfit is distributed over the
fitting range.
Sample/
Oxidation state Shell CN R (Å) σ2 (Å2) E0
RFactor
(%)
Calcined
+ 5.8
Mo=O
Mo-O
2.0
2.0
1.69
1.85
0.0032 (+/-0.0017)
0.0020 (+/-0.0015)
2.756
(+/-1.330) 2.1
2 min
+ 4.6
Mo=O
Mo-O
Mo-C
0.6
2.0
1.4
1.69
1.85
2.10
0.0086 (+/- 0.0045)
0.0274 (+/-0.0057)
0.0021 (+/-0.0019)
0.858
(+/-1.861) 4.5
7 min
+ 4.1
Mo=O
Mo-O
Mo-C
0.2
1.8
2.0
1.69
1.85
2.10
0.0018 (+/-0.0081)
0.0237 (-/+0.0095)
0.0018 (+/-0.0018)
-3.621
(+/-2.589) 4.1
8 min
+ 2.3
Mo-C
Mo-Mo
3.0
1.63 (+/-0.44)
2.08
2.95
0.0137 (+/-0.0025)
0.0126
-7.571
(+/- 2.243) 5.8
90 min
+ 2.0
Mo-C
Mo-Mo
3.0
2.50 (+/-0.35)
2.08
2.95
0.0102 (+/-0.0016)
0.0126
-7.706
(+/- 1.280) 3.0
Above 8 min, the formal oxidation state of Mo is ~ +2 and the spectra resemble
closely the Mo2C reference (see comparison of EXAFS in Figure 3-10). This suggests
that also the bonds with framework oxygens have been replaced by carbon bonds, forming
fully carburized Mo species. Furthermore, the presence of a new peak at ~ 3.3 Å in the
FT evidences the presence of heavy scatterers in the second shell, revealing the formation
of short-range ordered MoxCx clusters (Mo-Mo distance of ~ 2.95 Å) from the initial
isolated species. The CNs obtained from the fits indicate that on face value (i.e. not
considering that the coordination numbers (CN) in EXAFS have an error associated with
them typically between 10 – 20 %), Mo1.6C3 clusters are formed at 8 min of reaction. We
note that at this point the induction period is complete and aromatic formation begins,
evidencing that these clusters are the catalytically important species for the aromatisation

104
step. With further time on stream, a continuous intensity increase of the FT 3.3 Å peak is
also observed during MDA (bottom spectra in Figure 3-8). Accordingly, Mo CN
increased from 1.6 to 2.5 in 90 min, pointing to a cluster growth by sintering during the
course of reaction. This effect can be attributed to detachment of MoxCy from the zeolite
framework making them susceptible to sinter.
3 4 5 6 7 8 9 10 11
-20
-16
-12
-8
-4
0
4
8
12
16
k3.χ
(k)
(Å-3)
k (Å-1)
Mo2O
90 min
a)
0 1 2 3 4
0
2
4
6
8
10
(R
) (A
-4)
Radial distance (Å)
Mo2C
90 min
b)
Figure 3-10. Mo K-edge EXAFS and FT-EXAFS for Mo2C and Mo/H-ZSM-5 reacted for 90 min. (a and b).
And FT-EXAFS spectra for Mo/H-ZSM-5 reacted for 10 and 90 min (c).
To summarise the XAS discussion above, Figure 3-11 depicts the proposed Mo
species at different stages of the reaction including the refined bond distances and
oxidation states. The figure represents the gradual carburisation of initial Mo-oxo species
(staring by replacement of terminal oxygens) to Mo-carbides where immediate sintering
results in formation of clusters. Note that the hydrogens have been excluded from the
drawing to simplify the figure. Also, two Al atoms have been depicted near Mo anchoring
site to represent a neutral charge situation, in reality the location and distribution is
unknown and probably heterogeneous.

105
Figure 3-11. Schematic representation of the proposed Mo species during MDA including the EXAFS
refinement results: a) Calcined sample with Mo-oxo species attached to the zeolite; b) species in the
induction period corresponding to monomeric Mo-oxo species in oxydation state 5; c) species in
induction period coresponding to MoOxCy in oxydation state 4; and d) MoxCy clusters in the aromatisation
stage. The bond length for Mo-O, Mo=O, Mo-C and Mo-Mo type of bonds is indicated in each figure.
The colour code for the atoms is shown on the right.
3.3.3 In situ high resolution powder diffraction
Location of the Mo species was further investigated by HRPD. Measurements were
performed during in situ calcination (50 % O2/He; 6 ºC.min-1 to 600 ºC, held for 8 h) of
the as-prepared catalyst as well as of the ex situ MDA reacted sample (50 % CH4/Ar;
GHSV = 750 h-1, 700 ºC, held for 90 min).
Table 3-5 gathers the Rietveld refinement details whilst Figure 3-12 shows the
observed, calculated, and their difference patterns obtained from the refinement. The
experimental parameters and goodness-of-fit factors, coordinates, and selected bond
distances can be found in Tables A3.1 to A3.4 in the appendix. The refined values of the
unit cell parameters denote an orthorhombic structure and the framework refinement
resulted in reasonable T-O bond length values, varying in the range of 1.52–1.80 Å, and
T–O–T angles between 143° and 172°.21

106
Table 3-5. Rietveld refinement details carried out with TOPAS V5 program for calcined (in situ) and
reacted (ex situ) 4 wt. % Mo/H-ZSM-5.
Parameter Calcined sample (in situ) Reacted sample (ex situ)
Wavelength (Å) 0.6981 0.6981
Crystal System Orthorhombic Orthorhombic
Space Group Pnma Pnma
Temperature 600 °C Room temp. (~ 22 °C)
a, b, c (Å), volume (Å3) 20.0876 (6), 19.9352 (5),
13.4068 (4), 5368.8(3)
20.1258(4), 19.9411(5),
13.4161(3), 5384.3(2)
Rwp, Rp, Rexp 1.615, 2.261, 0.213 1.898, 1.801, 0.206
Rwp, Rp, Rexp - background 6.195, 4.663, 0.818 7.333, 3.704, 0.794
R Bragg 2.171 1.53871825
GooF 7.572 9.23330832
Parameters 136 139
Restraints 54 54
Constraints 0 0
Number of Data Points 2721 2721
a)
b)
Figure 3-12. Rietveld plot for the diffraction for 4 wt. % Mo/H-ZSM-5: a) in situ calcined and b) ex situ
reacted. The quality of fit at high angles are shown in the insets.
Figure 3-13 presents the location of Mo determined by Difference Fourier mapping.
For the catalyst calcined above 590 ⁰C a large amount of electron density is located next
to a particular framework position (designated as Si(Al)6), close to the wall of the straight

107
channel (Figure 3-13a) and near the channel intersection. The structure diagram
illustrating the different T sites of the zeolite and the Mo location near Si(Al)6 site is
shown in Figure A3-2 in the appendix. The brightness of this electron density cloud is
consistent with a high Z element and is assigned to Mo-containing species. The Mo-O
average distances resulted from the refinement were 1.30(5) and 1.57(5) Å. These
distances are unphysically short showing the limitations of this technique for accurately
resolving bond length. More reliable values for distance to neighbouring atoms were
obtained from the EXAFS analysis described in the previous section.
Our PD data on reacted Mo/H-ZSM-5 shows that Mo occupancy at Si(Al)6 position
drastically decreases (i.e. ̴ 70 %, see tables A3-1 and A3-2 in the appendix) for the spent
catalyst, evidencing that a significant fraction of Mo migrated to the outer shell of the
crystals during the first 90 min of the MDA reaction. Additionally, the Fourier map on
the reacted sample (Figure 3-13b) weaker electron density clouds are observed at the
centre of both straight and sinusoidal channels, probably corresponding to carbon deposits
formed during reaction.
a)
b)
Figure 3-13. Difference Fourier mapping images for 4 wt. % Mo/H-ZSM-5 (viewed along the b-axis): a)
the in situ calcined sample and b) sample reacted ex situ for 90 min.
The results go in line with the detachment and subsequent sintering of Mo active
species suggested by EXAFS. The delocalised weak electron density observed could
correspond to carbon deposits accumulated in the pores during 90 min reaction as

108
observed by TGA and N2 physisorption studies of the reacted samples (see Table 3-1 and
3-2 in section 3.3.1).
The migration of MoxCy clusters to the zeolite outer surface is a key finding in our
understanding of the catalyst deactivation as this would presumably limit any influence
of the zeolite pore on the selectivity. The absence of geometric constraints at the outer
surface will favour the formation of bulkier hydrocarbon enhancing the carbon deposit
formation and accelerating the catalyst deactivation. MDA activity reports indicate that
carbon deposit formation rate increases with time on stream whilst selectivity to aromatics
decreases.70 Thus the results here presented suggest that Mo/H-ZSM-5 catalyst
deactivation mechanism boils down to the migration of active species to the zeolite outer
surface due to the detachment of fully carburised molybdenum from the zeolite..
Further evidences for detachment of molybdenum species at 90 min of reaction is
observed by NH3-TPD. The peak at high temperatures (> 300 °C) in Figure 3-14,
correspond to NH3 desorption from zeolite strong Brønsted or Lewis acid sites.21,71,72 The
peak at lower temperatures is due to desorption from weaker acid sites; different groups
attribute the weak acidity to Lewis sites,73 silanol defects74 or NH4+ ions75 (formed by
adsorption of NH3 in BAS). The high temperature desorption peak present in the parent
zeolite practically disappears in the calcined Mo/H-ZSM-5. This is expected for ion
exchanged Mo/H-ZSM-5 where Mo interacts with the bridging hydroxyl groups (as seen
by FTIR in Figure 3-2). Compared to the calcined Mo/H-ZSM-5, the 90 min reacted
catalyst shows an increased desorption of NH3 above 300 °C. This indicates partial
recovery of BAS probably due to Mo detachment from the zeolite.
TEM images in Figure 3-15 verify the formation of Mo clusters on the zeolite outer
surface. Compared to calcined sample, the reacted catalyst seems to present rougher
surface topology observed in the secondary electron image. Heavier elements such as
molybdenum backscatter more efficiently and appear brighter than lighter elements (i.e.
Si, Al, O) in a backscattered electron image. Unlike the calcined samples, the dark field
image for reacted Mo/H-ZSM-5 shows a large number of bright spots corresponding to
Mo-rich particles which must arise due to sintering during MDA reaction.

109
200 300 400 500
Mo/H-ZSM-5 90 min
Mo/H-ZSM-5 calcined
H-ZSM-5
TC
D s
ign
al (a
.u.)
Temperature (oC)
Figure 3-14. NH3-TPD results for parent H-ZSM-5, calcined Mo/H-ZSM-5 and 90 min MDA reacted
Mo/H-ZSM-5 (4 wt. % Mo).
a) Mo/H-ZSM-5 calcined b) Mo/H-ZSM-5 90 min reacted
Figure 3-15. TEM images for 4 wt. % Mo/H-ZSM-5 catalyst: a) after calcination and b) after 90 min
reaction. Secondary electron images are shown on top and dark field electron images in the bottom.

110
3.4 Summary and conclusions
Mo species on 4 wt. % Mo/H-ZSM-5 catalyst for MDA were thoroughly
investigated using a range of characterisation methods and by means of synchrotron-
based X-ray absorption and diffraction techniques. This study brings new insights into
the nature and location of Mo species at each stage of the reaction process and enables to
draw conclusions regarding the structure-activity relationships and the causes of catalyst
deactivation. To aid discussing the key conclusions of this chapter, the proposed
structures and location for the evolving Mo species are represented in Figure 3-16.
In summary then, XRD, XAS and FTIR techniques suggests that MoO3 precursor
diffuses into the zeolite pores during calcination in air leading to the ion exchange. HRPD
measurements during in situ calcination indicate that Mo anchors in a specific location of
the zeolite, in the straight channels near the channel intersection (denoted here as Si(Al)6).
FT-EXAFS and spectra fitting suggests that calcination results in the formation of
monomeric Mo-oxo species with two terminal oxygens connected by double bonds and
anchored to the zeolite through two bridging oxygens (Figure 3-16a).
Mo evolution results during the MDA studied by operando XAS, are consistent
with previous emission studies on Mo/H-ZSM-5. In contact with methane, during the first
7 min of the reaction the initial Mo-oxo species are reduced into partially carburised
MoOxCy intermediate species. Changes in FT-EXAFS suggest the carburisation
commences by replacing terminal O by C (Figure 3-16b). The reaction product analysis
carried out by MS indicate that in this stage CO, CO2 and H2O are formed.
Above 8 min Mo is fully carburised and it detaches from the zeolite forming MoxCy
clusters, evidenced by the presence of heavy scatterers in the second shell (Figure 3-16c).
These species are the active sites for MDA activity and aromatics formation. Gradual
growth of MoxCy clusters in the course of 90 min of reaction was observed by EXAFS
(i.e. increase of neighbouring Mo coordination number). Eventually, MoxCy migrate to
zeolite outer surface as observed by the decrease in Mo occupancy in Si(Al)6 sites and
by TEM. This migration would imply the loss of shape selectivity to benzene and increase
of carbon deposit formation triggering fast catalyst deactivation.
The results obtained in this study suggest that the unavoidable migration of active
MoxCy plays an important role in material deactivation. Accordingly, this study calls for
a careful re-evaluation of synthesis strategies, with a change in focus towards stabilising

111
Mo carbides in a shape selective environment. Several approaches can be investigated for
encapsulation of clusters within porous materials.76 While migration in linear channels
(i.e. H-ZSM-5) is facile, the use of zeolite topologies with relatively large cages may be
advantageous; clusters could be stabilised in the cages and migration prevented as long
as the particle exceeds the diameter of the cage window. The synthesis of metal
nanoparticles coated within zeolite films forming such as yolk/core–shell type
architectures could also be investigated.76 Alternatively, the use of different or secondary
metals as the active species in MDA (i.e. Fe)10 or the addition of else promotors to the
catalyst that could lead to less mobile active species.
Figure 3-16. Schematic representation of Mo species evolution during MDA reaction on Mo/H-ZSM-5
catalyst as determined by operando XAS studies. The image shows the phase corrected FT-EXAFS spectra,
the corresponding Mo species proposed, and the reaction products are pictured for the a) calcined sample,
b) sample during the first 1-7 min of reaction (induction period) and c) sample between 8 to 90 min of
reaction (aromatisation stage).
3.5 References
1 J. N. Armor, J. Energy Chem., 2013, 22, 21–26.
2 R. A. Kerr, Science (80-. )., 2010, 328, 1624–1626.
3 Q. Wang, X. Chen, A. N. Jha and H. Rogers, Renew. Sustain. Energy Rev., 2014,
30, 1–28.
4 D. E. Holmes and J. A. Smith, in Advances in applied microbiology, 2016, vol. 97,

112
pp. 1–61.
5 S. Ma, X. Guo, L. Zhao, S. Scott and X. Bao, J. Energy Chem., 2013, 22, 1–20.
6 J. J. Spivey and G. Hutchings, Chem. Soc. Rev., 2014, 43, 792–803.
7 Z. R. Ismagilov, E. V. Matus and L. T. Tsikoza, Energy Environ. Sci., 2008, 1,
526.
8 L. Wang, L. Tao, M. Xie, G. Xu, J. Huang and Y. Xu, Catal. Letters, 1993, 21,
35–41.
9 C.-L. Zhang, S. Li, Y. Yuan, W.-X. Zhang, T.-H. Wu and L.-W. Lin, Catal. Letters,
1998, 56, 207–213.
10 X. Guo, G. Fang, G. Li, H. Ma, H. Fan, L. Yu, C. Ma, X. Wu, D. Deng, M. Wei,
D. Tan, R. Si, S. Zhang, J. Li, L. Sun, Z. Tang, X. Pan and X. Bao, Science, 2014,
344, 616–9.
11 D. Ma, Y. Shu, X. Han, X. Liu, Y. Xu and X. Bao, J. Phys. Chem., 2001, 105,
1786–1793.
12 N. Kosinov, F. J. A. G. Coumans, G. Li, E. Uslamin, B. Mezari, A. S. G.
Wijpkema, E. A. Pidko and E. J. M. Hensen, J. Catal., 2017, 346, 125–133.
13 N. Kosinov, F. J. A. G. Coumans, E. Uslamin, F. Kapteijn and E. J. M. Hensen,
Angew. Chemie Int. Ed., 2016, 55, 15086–15090.
14 M. T. Portilla, F. J. Llopis and C. Martínez, Catal. Sci. Technol, 2015, 5, 3806–
3821.
15 H. S. Lacheen and E. Iglesia, Phys. Chem. Chem. Physiscs, 2005, 7, 538–547.
16 Y. H. Kim, R. W. Borry and E. Iglesia, Microporous Mesoporous Mater., 2000,
35–36, 495–509.
17 H. Ma, R. Kojima, R. Ohnishi and M. Ichikawa, Appl. Catal. A Gen., 2004, 275,
183–187.
18 S. H. Morejudo, R. Zanón, S. Escolástico, I. Yuste-Tirados, H. Malerød-Fjeld, P.
K. Vestre, W. G. Coors, A. Martínez, T. Norby, J. M. Serra and C. Kjølseth,
Science, 2016, 353, 563–566.
19 R. W. Borry, Y. H. Kim, A. Huffsmith, J. a. Reimer and E. Iglesia, J. Phys. Chem.
B, 1999, 103, 5787–5796.
20 W. Li, G. D. Meitzner, R. W. Borry and E. Iglesia, J. Catal., 2000, 191, 373–383.
21 B. Li, S. Li, N. Li, H. Chen, W. Zhang, X. Bao and B. Lin, Microporous
Mesoporous Mater., 2006, 88, 244–253.
22 J. P. Tessonnier, B. Louis, S. Rigolet, M. J. Ledoux and C. Pham-Huu, Appl. Catal.
A Gen., 2008, 336, 79–88.
23 J. Gao, Y. Zheng, J.-M. Jehng, Y. Tang, I. E. Wachs and S. G. Podkolzin, Science,
2015, 348, 686–690.
24 W. Ding, S. Li, G. D. Meitzner and E. Iglesia, J. Phys. Chem. B, 2001, 105, 506–
513.

113
25 J. P. Tessonnier, B. Louis, S. Walspurger, J. Sommer, M. J. Ledoux and C. Pham-
Huu, J. Phys. Chem. B, 2006, 110, 10390–10395.
26 V. I. Zaikovskii, A. V Vosmerikov, V. F. Anufrienko, L. L. Korobitsyna, E. G.
Kodenev, G. V Echevskii, N. T. Vasenin, S. P. Zhuravkov, E. V Matus, Z. R.
Ismagilov and V. N. Parmon, Kinet. Catal. Nauk. /Interperiodica, 2006, 47, 23–
1584.
27 W. Ding, G. D. Meitzner and E. Iglesia, J. Catal., 2002, 206, 14–22.
28 J. P. Thielemann, T. Ressler, A. Walter, G. Tzolova-Müller and C. Hess, Appl.
Catal. A Gen., 2011, 399, 28–34.
29 D. Ma, Y. Shu, X. Bao and Y. Xu, J. Catal., 2000, 189, 314–325.
30 H. Liu, W. Shen, X. Bao and Y. Xu, Appl. Catal. A Gen., 2005, 295, 79–88.
31 H. Liu, X. Bao and Y. Xu, J. Catal., 2006, 239, 441–450.
32 H. Liu, W. Shen, X. Bao and Y. Xu, J. Mol. Catal. A Chem., 2006, 244, 229–236.
33 M. Nagai, T. Nishibayashi and S. Omi, Appl. Catal. A Gen., 2003, 253, 101–112.
34 H. Zheng, D. Ma, X. Bao, Z. H. Jian, H. K. Ja, Y. Wang and C. H. F. Peden, J. Am.
Chem. Soc., 2008, 130, 3722–3723.
35 E. V. Matus, I. Z. Ismagilov, O. B. Sukhova, V. I. Zaikovskii, L. T. Tsikoza, Z. R.
Ismagilov and J. A. Moulijn, Ind. Eng. Chem. Res., 2007, 46, 4063–4074.
36 B. X. Zhou Danhong, Ma Ding, Liu Xianchun, J. Mol. Catal. A Chem., 2001, 168,
225–232.
37 J. Gao, Y. Zheng, G. B. Fitzgerald, J. de Joannis, Y. Tang, I. E. Wachs and S. G.
Podkolzin, J. Phys. Chem. C, 2014, 118, 4670–4679.
38 I. Lezcano-González, R. Oord, M. Rovezzi, P. Glatzel, S. W. Botchway, B. M.
Weckhuysen and A. M. Beale, Angew. Chemie - Int. Ed., 2016, 55, 5215–5219.
39 V. A. Safonov, L. N. Vykhodtseva, Y. M. Polukarov, O. V Safonova, G.
Smolentsev, M. Sikora and S. G. Eeckhout, J. Phys. Chem., 2006, 110, 23192–
23196.
40 C. J. Doonan, L. Zhang, C. G. Young, S. J. George, A. Deb, U. Bergmann, G. N.
George and S. P. Cramer, Inorg. C., 2005, 44, 2579–2581.
41 C. H. L. Tempelman, V. O. de Rodrigues, E. R. H. van Eck, P. C. M. M. Magusin
and E. J. M. Hensen, Microporous Mesoporous Mater., 2015, 203, 259–273.
42 J. Klaas, G. Schulz-Ekloff and N. I. Jaeger, J. Phys. Chem. B, 1997, 101, 1305–
1311.
43 A. J. Dent, G. Cibin, S. Ramos, A. D. Smith, S. M. Scott, L. Varandas, M. R.
Pearson, N. A. Krumpa, C. P. Jones and P. E. Robbins, J. Phys. Conf. Ser., 2009,
190, 012039
44 B. Ravel and M. Newville, J. Synchrotron Radiat., 2005, 12, 537–541.
45 BM01-ESRF,

114
http://www.esrf.eu/UsersAndScience/Experiments/CRG/BM01/bm01-a,
(accessed 17 April 2018).
46 P. Norby, Mater. Sci. Forum, 1996, 228, 147–152.
47 http://pubs.acs.org/doi/pdf/10.1021/acs.jpcc.5b06875, (accessed 17 April 2018).
48 A. P. Hammersley, S. O. Svensson, M. Hanfland, A. N. Fitch and D. Hausermann,
High Press. Res., 1996, 14, 235–248.
49mmhttp://www.esrf.eu/home/UsersAndScience/Experiments/CRG/BM01/bm01/imag
e.htm/snbl-tool-box.html, (accessed 17 April 2018).
50 A. A. Coelho, TOPAS V4.1, Bruker AXS, 2006.
51 L. B. McCusker, R. B. Von Dreele, D. E. Cox, D. Louër, P. Scardi and IUCr, J.
Appl. Crystallogr., 1999, 32, 36–50.
52 D. Wang, J. H. Lunsford and M. P. Rosynek, 1997, 358, 347–358.
53 H. G. Karge and J. Weitkamp, Molecular sieves: science and technology, Springer-
Verlag, 1998.
54 R. Kumar Rana and B. Viswanathan, Catal. Letters, 1998, 52, 25–29.
55 M. Fournier, C. Louis, M. Che, P. Chaquin and D. Masure, J. Catal., 1989, 119,
400–414.
56 J. P. Thielemann, T. Ressler, A. Walter, G. Tzolova-Müller, C. Hess, Appl. Catal.
A Gen., 2011, 399, 28–34.
57 G. N. Asmolov and O. V. Krylov, Kinetics and Catalysis, 1970, 11, 847-852.
58 S. E. Shadle, B. Hedman, K. Hodgson and E. I. Solomon, Inorg. Chem., 1994, 33,
4235–4244.
59 C. Brookes, P. P. Wells, G. Cibin, N. Dimitratos, W. Jones, D. J. Morgan and M.
Bowker, ACS Catal., 2014, 4, 243–250.
60 M. G. O’Brien, A. M. Beale, S. D. M. Jacques, T. Buslaps, V. Honkimaki and B.
M. Weckhuysen, J. Phys. Chem. C, 2009, 113, 4890–4897.
61 H. Negishi, S. Negishi, Y. Kuroiwa, N. Sato and S. Aoyagi, Phys. Rev. B, 2004,
69, 064111.
62 M. H. Rapposch, J. B. Anderson and E. Kostiner, Inorg. Chem, 1980, 19, 3531–
3539.
63 D. Ma, Y. Shu, M. Cheng, Y. Xu and X. Bao, J. Catal., 2000, 194, 105–114.
64 J. Yang, D. Ma, F. Deng, Q. Luo, M. Zhang, X. Bao and C. Ye, Chem. Commun.,
2002, 0, 3046–3047.
65 C. H. L. Tempelman, X. Zhu and E. J. M. Hensen, Chinese J. Catal., 2015, 36,
829–837.
66 S. Liu, L. Wang, R. Ohnishi and M. Ichikawa, J. Catal., 1999, 181, 175–188.

115
67 F. Solymosi, J. Cserényi, A. Szöke, T. Bánsági and A. Oszkó, J. Catal., 1997, 165,
150–161.
68 G. Plazenet, E. Payen, J. Lynch and B. Rebours, J. Phys. Chem. B, 2002, 106,
7013–7028.
69 D. C. Koningsberger, B. L. Mojet, G. E. Van Dorssen and D. E. Ramaker, Top.
Catal., 2000, 10, 143–155.
70 C. H. L. Tempelman and E. J. M. Hensen, Appl. Catal. B Environ., 2015, 176–177,
731–739.
71 N. R. Meshram, S. G. Hegde and S. B. Kulkarni, Zeolites, 1986, 6, 434–438.
72 H. Itoh, C. Hidalgo, T. Hattori, M. Niwa and Y. Murakami, J. Catal., 1984, 85,
521–526.
73 H. C. Karge and V. Dondud, J. Phys. Chem. Clays Clay Min. Nat., 1990, 9423,
165–112.
74 J.-P. Tessonnier, B. Louis, S. Rigolet, M. J. Ledoux and C. Pham-Huu, Appl. Catal.
A Gen., 2008, 336, 79–88.
75 F. Lónyi and J. Valyon, Microporous Mesoporous Mater., 2001, 47, 293–301.
76 D. Farrusseng and A. Tuel, New J. Chem. New J. Chem, 2016, 40, 3933–3949.

116

117
Chapter 4
Study of the Role of the Acid Sites on Mo/zeolites
for Methane Dehydroaromatisation
Methane dehydroaromatisation reaction over Mo/zeolite catalysts has been
traditionally accepted to be a bifunctional catalyst with Mo taking part in methane
activation forming C2/C3 hydrocarbons, and zeolite Brønsted acid sites (BAS) being
responsible for aromatisation of C2/C3 intermediates. Recent publications however have
put this mechanism into question, and a single site mechanism is also being considered.
This chapter studies the acidic, structural and activity properties of two catalysts
consisting of 4 wt. % Mo supported on microporous materials with MFI structure. One
sample was prepared with H-ZSM-5 zeolite with Si/Al = 15 as the support (containing
BAS), and the second one with Silicalite-1 which is the purely siliceous analogue and has
no strong acid sites.
The results bring new insight about the role of BAS and Mo species on the catalyst
performance.
4.1 Introduction
It has been widely accepted that methane dehydroaromatisation over Mo/H-ZSM-
5 catalysts occurs via a bifunctional mechanism consisting of two different active sites.1–
5 In this mechanism molybdenum species constitute the sites responsible for methane
activation forming C2Hy and C3Hy intermediates, mainly ethylene, as well as H2. The
second active site is the zeolite’s Brønsted acid site (BAS) which transforms ethylene and
other light hydrocarbon intermediates into aromatic products and H2.

118
Scheme 4-1. Representation of the bifunctional mechanism for methane dehydroaromatisation reaction
over Mo/zeolite catalysts.
This mechanism (represented in Scheme 4-1) was proposed on the basis of several
activity studies carried out on Mo-based catalysts prepared using non zeolitic supports -
such as SiO2 and TiO26 – or using Cs, Ca or Na exchanged zeolites with no remaining
BAS. These materials showed low or no selectivity to aromatics7,8 while the catalysts
with acidic zeolites gave 100-300 times more benzene yield.9 Mo2C and H-ZSM-5 alone
also were shown to be poorly active.10 In addition, Wang et al.11 stated that H-ZSM-5
without Mo converted C2H4 at 700 °C giving no induction period but resulting in
hydrocarbon product distribution similar to those obtained with CH4 over Mo/H-ZSM-5.
They stated aromatisation occurs entirely on the Brønsted acidic sites of the zeolite.
Kinetic studies have been carried on Mo/zeolites in order to propose an ‘elementary
steps-based’ model for the aromatisation by BAS.5,12 The suggested model is shown in
Scheme 4-2 and it involves ethylene oligomerisation into benzene and other polycyclic
aromatic hydrocarbons occurring via acid catalysed reactions grouped into:
chemisorption, desorption, oligomerisation, -scission, hydride transfer, protolytic
dehydrogenation and hydrogenation, protolysis, alkylation and dealkylation of toluene
and naphthalene.
It has also been reported that the increasing amount of Al in zeolites - and therefore
of BAS - results in a proportional increase of the aromatisation in MDA which was
attributed to higher performance in the oligomerisation of C2/C3 intermediaries.13
Nevertheless, Tessonier et al. studied Mo/H-ZSM-5 with different Si/Al ratios and Mo
loadings and came up with different conclusions.14 The titration experiments, performed
by Tessonier, for quantification of remaining BAS after Mo exchange revealed that
regardless of the amount of acid sites left (studied in a range from 1.05 to 0.18 mmol/g-1)
the catalysts had comparable yield to aromatics. They deduced that the enhanced activity
in low Si/Al zeolites was mainly because BAS provide more anchoring points for a better
dispersion of Mo leading to the formation of highly active isolated Mo species. They

119
proposed that very few acid sites (down to 0.18 mmol/g-1) must be enough to perform
aromatisation of all the ethylene formed in the Mo active sites.
Scheme 4-2. Proposed elementary step mechanism model for methane aromatisation over Mo/zeolites.12
Figure adapted from Reference 12.
Recently, a monofunctional mechanism has come under consideration on account
of methane aromatisation achieved by catalysts in absence of BAS. Guo et al. synthesised
Fe@SiO2 material stating that isolated iron atoms where embedded and stabilised in the
matrix of amorphous SiO2.15 They reported MDA activity and high yields to benzene at
1000 °C. MDA activity results have been also published for Mo-contining Silicalite-1,
the pure siliceous analogue of the H-ZSM-5 zeolite.16 Although with low conversion and
yields, the benzene production by Mo/Silicalite-1 revealed that Brønsted acid sites are not
essential for the aromatisation of methane.
From the discussion above it is implied that the speciation of Mo may have a more
major role in catalyst selectivity than what was traditionally postulated. The extensive
research carried out to investigate the effect of various supports do not include a thorough
characterisation to account for differences in metal speciation. Therefore, the aim of the
work presented in this chapter is to shed more light onto the role of BAS as well as on the
impact of Mo speciation on catalyst performance. This is carried out by studying the
acidic, structural and catalytic properties of 4 wt. % Mo/Silicalite-1 sample - with no
Brønsted acidity - in comparison with the widely reported 4 wt. % Mo/H-ZSM-5 catalyst
with a silicon to aluminium ratio of 15.

120
As mentioned previously, Silicalite-1 is the pure silica analogue of the H-ZSM-5
zeolite. These zeolites present MFI framework structure composed of straight channels
cross-linked by zig-zag channels. These are defined by 10-membered rings pore
diameters of ~ 5.5 x 5.1 Å and ~ 5.6 x 5.3 for straight and zig-zag channels respectively.
The channel dimensions concur to the benzene kinetic diameter (5.85 Å) providing shape
selectivity to this product.17 In spite of their structural homology, the absence of
framework aluminium results in different physicochemical properties of Silicalite-1. Pure
siliceous zeolites present no Brønsted acidity and besides they generally show better
thermal stability,18 a property most advantageous for MDA reaction which occurs at >
650 °C.2
A widely used synthetic method in the preparation of M/zeolite catalysts –
including Mo/H-ZSM-5 for MDA – is the ion exchange method in which the charge
compensating cations (i.e. H+, NH3+, Na+) close to Al tetrahedra are exchanged with the
element of interest resulting in dispersed and isolated active metal ions inside the zeolite
pores. The absence of exchangeable cations in Silicalite-1 compromise the dispersion of
metal into the zeolite pores. In order to promote the formation of isolated molybdenum
centres for these investigations a defective Silicalite-1 was synthesised.
a)
b)
Scheme 4-3. a) Representation of silanol defect in the internal zeolite surface, and b) example for Mo
grafting on silanol nest.19 Figure b adapted from reference 19.

121
The first reported Silicalite-1 synthesis comprised significant concentrations of Na
and Al impurities which act as mineralising agents resulting in perfect crystals possessing
a monoclinic structure.20 Later synthesis carried out in the absence of these impurities
resulted in small orthorhombic crystals containing a high amount of internal defects due
to silicon vacancies;21,22 these are known as ‘silanol defects’. Representation of these OH
groups, is shown in Scheme 4-3 and can be classified as terminal, geminal, vicinal or
bridged silanols. Bridged defects which connect forming rings are also called silanol
nests. These nests generate nanocavities in the crystal structure and can be used to graft
heteroatoms as shown in the example represented on Scheme 4-3b.19,22 Furthermore, the
number of nest defects can be increased by the extraction of Si from the framework upon
zeolite post-treatment in basic media.23 After Si extraction, metal ions can be incorporated
into these vacancies in the so called de-metalation–metalation synthesis approach.24 The
metal loading, the precursors used as well as metalation strategy (i.e. gas phase, solid state
or liquid phase metalation) are important variables that affect the final metal speciation.
Thus, the focus of this work is to synthesise and characterise a highly defective
Silicalite-1 with increased number silanol-nest type of defects induced via a basic post-
treatment. These defects facilitate to prepare a Mo/Silicalite-1 catalysts with isolated Mo
species analogous to the ones present in 4 wt. % Mo/H-ZSM-5 with Si/Al = 15. The
acidic, structural and catalytic properties of these materials are then compared to better
understand the role of BAS and Mo structures in MDA activity and catalyst deactivation.
4.2 Materials and methods
4.2.1 Synthesis
ZSM-5 zeolite with MFI structure (Si/Al = 15) was purchased from Zeolyst
(CBV3024E) in its ammonium form. The proton form was obtained by calcination in
static air at 550 °C for 6 hours using a temperature ramp of 2 °C/min.
The pure silica analogue of the ZSM-5 zeolite, also known as Silicalite-1, was
prepared by hydrothermal synthesis as described in Lobo et al.25 using
tetrapropylammonium hydroxide (TPAOH) as the structure directing agent. The
following stoichiometry was used: 10 SiO2 : 2.15 TPAOH : 300 H2O. This composition
was obtained by mixing 5.384 g of TPAOH (40 % in water, Merk) and 22.636 g of

122
distilled water in a polypropylene beaker. Then, 10.204 g of tetraethylorthosilicate
(TEOS, 99 %, Sigma Aldrich) were added drop-wise while vigorously stirring the
mixture. The reactants were stirred at room temperature until enough ethanol and water
had been evaporated to fulfil the above stoichiometry. The solution was then placed in a
Teflon-lined stainless steel Parr autoclave and heated at 130 °C for 5 or 16 h in a static
oven. The resulting product was washed by centrifugation until the pH was < 8. After
drying overnight at 60 °C the zeolite was calcined at 550 °C at 2 °C/min for 12 h. The
resulting defective Silicalite-1 obtained will be referred as S1.
In order to generate silanol nests in the structure a basic treatment of the Silicalite-
1 was carried out following the procedure reported by Wang et al.23 In an autoclave,
ethylenediamine (EDA) and Silicalite-1 in 2:1 mass ratio were heated at 175 °C for 3 h.
The resulting zeolite was again washed by centrifugation (pH < 8) and dried and calcined
at 550 °C at 2 °C/min for 12 h. The Silicalite-1 after this posttreatment will be referred as
S1-T.
Mo-containing MFI zeolite catalysts (4wt. % Mo) were prepared by mixing MoO3
(Sigma Aldrich, 99.95 %) with the zeolites (H-ZSM-5, S1 or S1-T) in an agate mortar for
0.5 h. The samples were then calcined in air at 700 °C for 30 min using a temperature
ramp of 5 °C/min. The calcined samples will be denoted as Mo/H-ZSM-5, Mo/S1 and
Mo/S1-T in accordance to the support used.
For the catalytic studies presented in section 4.3.3.1, 4 wt. % Mo/SiO2 samples were
also prepared using two different SiO2 supports: a low surface area SiO2 (5 m2/g, particle
size 0.5-10 µm, Sigma Aldrich) and a fumed silica with high surface area (200 m2/g,
particle size 0.2-0.3 µm, Sigma Aldrich). These catalysts were prepared in the same
manner as Mo/MFI zeolites and they are denoted as Mo/SiO2-L and Mo/SiO2-H for 5
m2/g and 200 m2/g surface area supports respectively.
4.2.2 Characterisation methods
X-ray diffraction (XRD) patterns were recorded using a Rigaku SmartLab X-Ray
Diffractometer fitted with a hemispherical analyser. The measurements were performed
using Cu Kα radiation source (λ = 1.5406 Å) with a voltage of 40 kV, and a current of 30
mA. The patterns obtained were compared to crystallographic data in the reference library
(ICSD database).

123
UV-Vis spectroscopy reflectance measurements were carried out in an UV-2600
Shimadzu spectrometer, using a light spot of 2 mm. The reflectance data was acquired
from 200 to 800 nm which was transformed into absorbance versus wavelength by
applying the Kubelka-Munk equation.26 BaSO4 was used as white standard to remove
background.
Elemental analysis of the catalysts was carried out by inductively coupled plasma
optical emission spectroscopy (ICP-OES) using a Perkin Elmer Optical Emission
Spectrometer Optima 3300 RL. These measurements were performed by the analytical
department in Johnson Matthey Technology Centre (Sonning Common).
Nitrogen physisorption measurements were performed at 77.3 K on a Quadrasorb
EVO QDS-30 instrument. Around 150 mg of sample was outgassed at 623 K overnight
under high vacuum prior to the sorption measurements. The Brunauer–Emmett–Teller
(BET) equation was used to calculate the specific surface area in the pressure range p/p0
= 0.0006−0.01. The micropore volume was calculated from the t-plot curve using the
thickness range between 3.5 and 5.4 Å.
Thermogravimetric analysis of the reacted catalysts was carried out to quantify
the mass of carbon deposits. The measurements were carried out in a TA Q50 instrument,
all samples were heated up to 950 °C using a temperature ramp of 5 °C/min under an air
flow of 60 mL/min and held at 950 °C for 5 min.
Fourier-transform infrared spectroscopy spectra were recorded in a Nicolet iS10
spectrometer. Samples were pressed into self-supporting wafers with a density of ca. 10
mg/cm2. The wafers were dried prior the measurements by heating them up to 285 °C for
3 h under 70 ml/min He flow. After dehydration, the sample was cooled down to 150 °C
under dry He for the spectra collection.
Electron microscopy images were taken by the analytical department in Jonson
Matthey Technology Centre. Scanning electron microscopy analysis was done using a
Zeiss ultra 55 Field emission electron microscope. Compositional analysis and low-
resolution general imaging were carried out with accelerating voltage of 20 kV, 30-60
micron aperture and 7-8mm working distance. High-resolution were also taken with an
accelerating voltage of 1.6 kV, 20-30 micron aperture and 2-3 mm working distance. The
samples were also examined in the JEM 2800 (Scanning). Transmission electron
microscopy measurements were performed at Johnson Matthey Technology Centre.

124
Voltage was 200 kV and the aperture was 70 and 40 µm. Bright-field imaging mode was
done using CCD high magnification, lattice resolution imaging mode was carried out
using CCD Dark-field (Z-contrast) imaging in scanning mode using an off-axis annular
detector. The secondary electron signal was acquired simultaneously with the other TEM
images providing topological information of the sample. Compositional analysis was
performed by X-ray emission detection in the scanning mode.
Kerr-gated Raman spectroscopy measurements were carried out in the Ultra setup
in the Central Laster Facility. To study the nature of carbonaceous deposits on reacted
catalysts. The measurements were carried out using 400 nm laser to excite the sample and
800 nm laser power to activate the CS2 Kerr gate. Toluene impregnated H-ZSM-5 was
used for calibration of detected signals.
Temperature programmed desorption of ammonia measurements were
performed in an AutoChem II 2920 micromeritics instrument equipped with a moisture
trap and a thermo-conductivity detector. Samples were first preactivated by flowing pure
N2 and heating up to 550 °C for 30 min (5 °C/min). The reactor was then cooled down to
100 °C for ammonia absorption which was run by flowing 1 % NH3/N2 until saturation
(~ 1 h). Next, pure N2 was flowed for 2 h to remove any excess of ammonia on the sample.
Finally, ammonia desorption was carried out by increasing temperature up to 1100 °C
with a ramp of 10 °C/min. All the signals were normalised to the sample mass.
4.2.3 X-ray absorption spectroscopy
XAS studies were performed on B18 beamline at Diamond Light Source at Harwell
Campus, United Kingdom.27 The synchrotron electron energy was 3 GeV and the ring
current was 300 mA. A fast scanning Si (1 1 1) double crystal monochromator was used
to tune the energy range. Mo K-edge XAFS measurements (in the range of 19,797 to
21,000 eV) were recorded in transmission mode using ion chamber detectors. The
acquisition of each spectrum took ~ 60 s, with a Mo foil placed between It and Iref. The X-
ray beam size at the sample position was around 1 × 1 mm2.
XAS was collected during in situ catalyst calcination using the set up developed by
Diamond Light Source.28 For the experiments, 40 mg of the as-prepared catalyst (sieve
fractions: 0.425-0.150 mm) were placed within a 3 mm diameter quartz capillary and

125
calcined at 700 ºC for 30 min (20 % O2 in He) while XAS spectra was continually
collected (every ca. 65 seconds).
XAS data processing and analysis was performed using the Demeter software
package.29 For the spectral fittings, the amplitude was set to 0.91, the value was obtained
by fitting the Mo foil reference to crystallographic data form ICSD database.
Coordination numbers were set to the values presented and the Mo=O distance was set to
1.69 according to previous analysis in Chapter 3 as well as reported literature values.30 K
rage values used were between 3 and 11 whereas R range was 1 to 3 were used. All the
Fourier transformed (FT) EXAFS data presented corresponds to phase corrected plots.
4.2.4 Catalytic activity measurements
The catalyst qualitative activity screening described in section 4.3.3.1 was carried
out by introducing 0.6 g of sieved catalyst (150-425 µm sieved fractions) into a tubular
quartz rector. The internal diameter of the rector was 0.7 mm and catalyst bed length was
3 cm. The sample was fixed in the isothermal zone of the oven by quartz wool. A total
gas flow of 30 mL/min was fed by means of mass flow controllers which results in a gas
hour space velocity (GHSV) of 1500 h-1.
The as-prepared physical mixtures (MoO3 + support grinded in a mortar) were first
activated under 20 % O2/He flow by heating up to 700 °C for 30 min using a temperature
ramp of 5 °C/min. After flowing pure Ar for 30 min to flush the O2 from the lines,
methane dehydroaromatisation was started by switching to a 50 % CH4/Ar flow. Products
were analysed by online mass spectrometer (OmniStar GSD 320O1). All the MS data
presented were normalised to the Ar signal.
Long catalytic tests of 10 h and quantitative product analysis were carried out under
the same reaction protocol and GHSV as described for the qualitative short tests. 50 %
CH4/N2 was used as the feed for MDA and reaction products were analysed by online
mass spectrometer (EcoSys-P portable spectrometer) as well as by an online gas
chromatograph (Varian CP-3800) equipped with 3 columns: Molsieve13 to separate light
gases, Hayesep Q to separate light olefins and Rtx-1 for column to separate aromatics.
The first two columns were connected to a thermal conductivity detector (TCD) and last
one to a TCD and flame ionisation detectors. Helium was used as the carried gas for the
chromatograph and nitrogen was used as the internal standard to calculate the total flow

126
in the outlet. Total molar flows at the reactor outlet and inlet were calculated as described
in the methodology chapter (Chapter 2, section 2.3.), further details regarding reaction
setup and condition can be also found in this section.
To follow the deactivation process, Mo/MFI samples were collected after different
reaction times (7 min, 90 min, 10 h and 30 h) cooling down the reactor rapidly under Ar
flow. The resulting samples are denoted by adding the reaction time after the sample code.
For example, the 4 wt. % Mo/H-ZMS-5 sample reacted with methane for 90 min will be
named as Mo/H-ZSM-5(90min).
4.3 Results and discussion
4.3.1 Catalyst characterisation results
This section discusses the physicochemical properties of 4 wt. % Mo/MFI catalysts
synthesised using pure siliceous MFI zeolites (S1 and S1-T) as the zeolite support. The
results are compared to 4 wt. % Mo/H-ZSM-5 (Si/Al = 15) sample as benchmark material
whose activity and properties have been widely reported. A full picture is needed to draw
conclusions on the catalyst activity and the role of the acid sites. Therefore, the aim of
this detailed characterisation is not only to verify the different acidic properties of both
MFI supports used, but also to fully understand differences in other characteristics (i.e.
surface area, Mo speciation, zeolite crystal size) that can lead to variations in the catalyst
performance. The careful characterisation will allow to evaluate whether the reaction
mechanism in the literature (mono or bi-functional) has been properly considered.
Ammonia temperature programmed desorption (NH3-TPD):
Determination of acidic properties where studied by NH3-TPD. As shown in
Figure 4-1, H-ZSM-5 with Si/Al=15 exhibits its typical desorption profile with two peaks
at 210 and 400 °C. Desorption at 400 °C has been assigned to NH3 adsorbed on strong
Brønsted or Lewis acid sites generating NH4+ ions.31–33 Assignment of the peak at 210 °C
has been controversial, many authors attribute this lower temperature peak to NH3
desorption from silanol defects31,34–36 as well as from weak Lewis acid sites.37,38 However,
it has been pointed out that the NH4+ ions formed on BAS in turn constitute weak acid
sites were ammonia can also be adsorbed. Recent studies attribute the peak at 210 °C to

127
release of ammonia weakly adsorbed on these NH4+ sites.39
S1 and S1-T zeolites have no BAS but they do contain a range of silanol defects
(seen by FTIR, Figure 4-3). The absence of NH3 desorption peaks on these supports
suggests the low temperature peak in H-ZSM-5 probably does not correspond to silanols
and may be attributed to weak Lewis acid sites or ammonia desorption form NH4+ ions.
100 200 300 400 500
186 oC
400 oC
Mo/S1-T
S1
H-ZSM-5
Mo/H-ZSM-5
S1-T
TC
D s
igna
l (a
.u.)
Temperature (oC)
210 oC
Figure 4-1. NH3-TPD profiles obtained for the parent zeolites (H-ZSM-5, S1 and S1-T), and 4 wt. %
Mo/MFI (MFI = H-ZSM-5 and S1-T) catalysts after calcination.
Both peak areas decrease in the calcined 4 wt. % Mo/H-ZSM-5 catalyst; in fact, the
peak at 400 °C almost disappears. This points out that, upon calcination of MoO3 and H-
ZSM-5 physical mixture, the Mo migrates into the zeolite channels and ion exchanges by
interacting with the bridging hydroxyl groups. In addition to the intensity decrease, the
shape of the low temperature peak changes: the maximum of desorption is shifted to 186
°C and a new shoulder appears with desorption between 200 and 300 °C. The desorption
between 200 and 300 °C indicates the appearance of medium strength acid sites which
are probably correlated to extra framework aluminium species generated during the
calcination.36 The peak at 186 °C is also present in Mo/S1-T sample and thus it is
attributed to the acidic properties of molybdenum oxide acting as Lewis acid sites.32
Mo/S1-T does not show any additional desorption peaks. These results suggest that apart

128
from the Lewis acidity related to Mo oxides, the Mo/Silicalite-1 catalysts show
insignificant acidic properties compared with the conventional Mo/H-ZSM-5 material.
Physicochemical properties:
Textural properties of parent zeolites and Mo/MFI catalysts are presented in Table
4-1. The Mo content of the calcined catalysts is also included. The value of BET surface
areas obtained for the commercial H-ZSM-5 was 412 m2/g which sits within the expected
range for an MFI structure zeolites.40 The Silicalites synthesised present higher surface
areas of 490 and 452 m2/g for S1 and S1-T respectively; this suggests higher crystallinity
of the Silicalite-1 samples which is also observed by X-ray diffraction discussed later in
this section. The values also indicate that the basic treatment on S1 to extract Si atoms
and generate silanol nests, leads to a slight decrease of the surface area. The physisorption
measurements were reproducible giving errors of ~ 2 %; nevertheless, the postreatment
should be repeated in future to verify the reproducibility of the obtained areas between
different batches.
For all three supports, thermal treatment of MoO3 + zeolite physical mixtures results
in a significant and comparable decrease of micropore volume (13-16 %). This points out
that in the absence of Brønsted acid sites molybdenum also disperses and diffuses inside
the pores upon calcination.
N2 physisorption isotherms are shown in Figure 4-2. All samples show type I
isotherm with high adsorption at low pressures due to micropore filling phenomena. This
type of isotherm is typical for microporous materials. Unlike Silicalites, H-ZSM-5
exhibits a small hysteresis branch which was not affected by the presence of Mo on calcined
Mo/H-ZSM-5. The observed hysteresis could correspond to cavitation-induced evaporation
from H-ZSM-5 inter-particle voids which is consistent with the crystal agglomerates
observed by SEM (discussed later in this section).
Non-defective Silicalite-1 crystals are usually monoclinic and present a distinctive
step in the isotherm region at 0.2 > P/Po > 0.3 which has been attributed to a phase
transition from monoclinic to orthorhombic during the measurement.41,42 The absence of
such step in S1 and S1-T indicates that both supports contain enough defective sites
leading to stabilisation of the orthorhombic phase (observed also by XRD). The addition
of Mo to the supports decreased the micropore volume but did not show significant
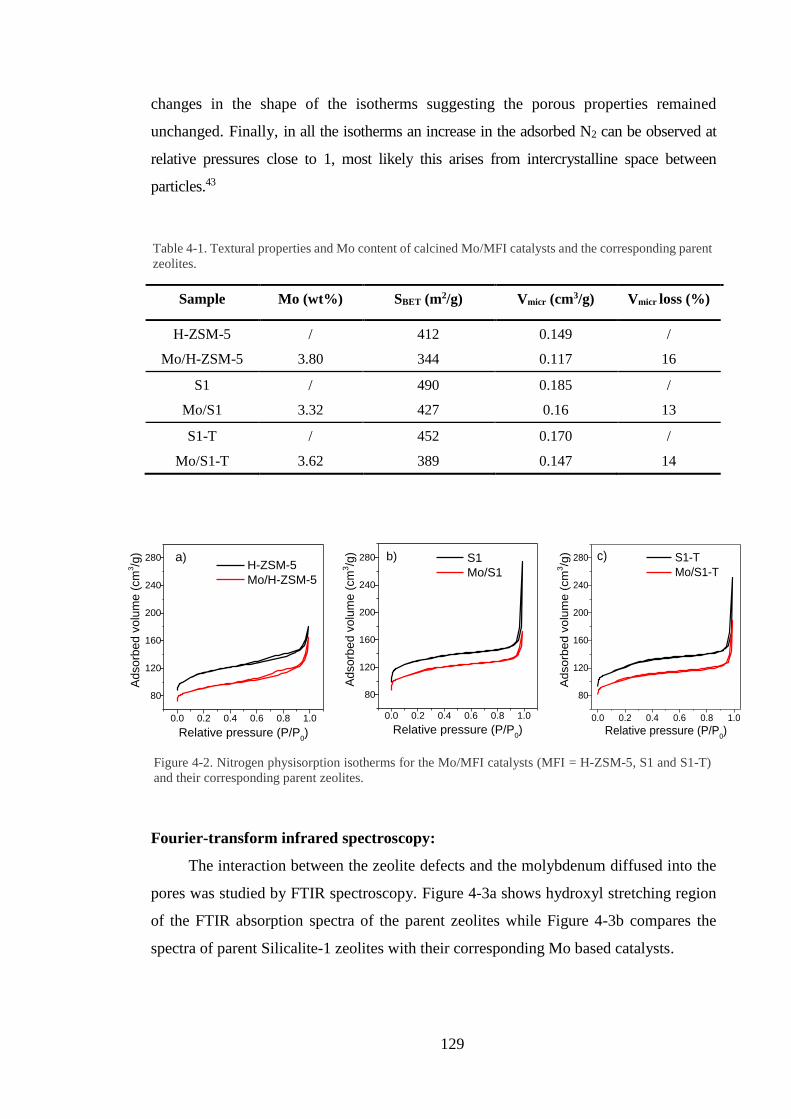
129
changes in the shape of the isotherms suggesting the porous properties remained
unchanged. Finally, in all the isotherms an increase in the adsorbed N2 can be observed at
relative pressures close to 1, most likely this arises from intercrystalline space between
particles.43
Table 4-1. Textural properties and Mo content of calcined Mo/MFI catalysts and the corresponding parent
zeolites.
Sample Mo (wt%) SBET (m2/g) Vmicr (cm3/g) Vmicr loss (%)
H-ZSM-5 / 412 0.149 /
Mo/H-ZSM-5 3.80 344 0.117 16
S1 / 490 0.185 /
Mo/S1 3.32 427 0.16 13
S1-T / 452 0.170 /
Mo/S1-T 3.62 389 0.147 14
0.0 0.2 0.4 0.6 0.8 1.0
80
120
160
200
240
280
Ad
so
rbe
d v
olu
me
(cm
3/g
)
Relative pressure (P/P0)
H-ZSM-5
Mo/H-ZSM-5
a)
0.0 0.2 0.4 0.6 0.8 1.0
80
120
160
200
240
280
Adsorb
ed
vo
lum
e (
cm
3/g
)
Relative pressure (P/P0)
S1
Mo/S1
b)
0.0 0.2 0.4 0.6 0.8 1.0
80
120
160
200
240
280A
dsorb
ed v
olu
me (
cm
3/g
)
Relative pressure (P/P0)
S1-T
Mo/S1-T
c)
Figure 4-2. Nitrogen physisorption isotherms for the Mo/MFI catalysts (MFI = H-ZSM-5, S1 and S1-T)
and their corresponding parent zeolites.
Fourier-transform infrared spectroscopy:
The interaction between the zeolite defects and the molybdenum diffused into the
pores was studied by FTIR spectroscopy. Figure 4-3a shows hydroxyl stretching region
of the FTIR absorption spectra of the parent zeolites while Figure 4-3b compares the
spectra of parent Silicalite-1 zeolites with their corresponding Mo based catalysts.

130
Bands around 3606 cm-1 and 3658 cm-1 were only observed in the H-ZSM-5 zeolite
and are attributed to bridging hydroxyl groups (BAS) and terminal –OH on extra
framework monomeric alumina species respectively.44,45 The rest of the bands correspond
to silanol defects which can be classified as: isolated silanols, vicinal silanols involved in
H-bonded chains or rings (nests) of variable lengths, and terminal silanols. The absorption
wavenumbers of these defects are subject to variation depending on the location (internal
or external surface of the zeolite) or the length of H-bonded chains. There is extensive
literature on the interpretation and assignment of the bands.19,21,22,42,46
3800 3700 3600 3500 3400 3300 3200
3606
3658
3688
3723
Absorb
ance (
a.u
.)
Wavenumber (cm-1)
H-ZSM-5
S1
S1-T
3741
a)
3720 3600 3480 3360 3240
37433688
Ab
so
rba
nce
(a
.u.)
Wavenumber (cm-1)
S1-T
Mo/S1-T
S1
Mo/S1
b)
3723
Figure 4-3. OH region of the FTIR spectra for a) parent zeolites and b) Silicalite-1 vs Mo/Silicalite-1
catalysts.
Absorption at 3741 and 3723 cm-1 can be assigned to isolated silanols on the
external surface of the zeolites and terminal silanols respectively whereas the band at
3688 cm-1 can be attributed to vicinal silanols. The broad band between 3600 and 3400
cm-1 is due to the presence of hydrogen bonded silanol nests generated by the extraction
of framework Si. The spectral features in Figure 4-3a reveal that S1 already contains a
large number of defects including silanol nests prior to the treatment with base.
Nonetheless, after treatment the relative intensity of bands at 3688 and ~ 3500 cm-1
increase proving the generation of more H-bond chain and nest type defects. The intensity
of these bands decreases considerably after thermal treatment of MoO3 with the Silicalite-
1 zeolites implying interaction of the metal with silanol defects.

131
X-day diffraction:
Figure 4-4a compares the XRD results obtained for the three parent zeolites: H-
ZSM-5, S1, S1-T. All the diffractograms show a single crystalline phase corresponding
to the MFI structure with the highest intensity reflections at 2 θ° of 7.935, 8.890, 14.773,
23.077 and 23.961 which correspond to the (011), (200), (031), (051) and (033)
reflections respectively.47 The lower intensity of commercial H-ZSM-5 suggests smaller
crystalline domains for this zeolite. A slight shift of the reflections to lower 2 ° values
is observed in the commercial zeolite, this shift being more pronounced at higher angles.
This is rationalised by the presence of Al in the H-ZSM-5 framework and has been well
described in the literature.48 The bond length in [AlO4]- tetrahedra is larger (~ 1.74 Å)
than for [SiO4] (~ 1.64 Å), consequently Al3+-containing zeolites present increased
interplanar spacing in the crystal which translates as a shift of the reflections to lower 2
° values.
Silicalite-1 can adopt two possible crystalline symmetries: monoclinic and
orthorhombic.21 The presence of a single peak at 2 θ = 24.4° (zoomed pattern section in
Figure 4-4a) indicates an orthorhombic structure for both, S1 and S1-T, which is the
favoured phase for defective Silicalites.22,42
XRD patterns of Mo/Silicalite-1 samples before and after calcination are shown in
Figure 4-4b. The as-prepared catalysts present reflections of the zeolite and also of the
MoO3 precursor with peaks at 2 ϴ° angles of 12.774, 25.697 and 38.970 corresponding
to (020), (040) and (060) reflections. These peaks corresponding to MoO3 completely
vanish in the calcined samples which was also observed for Mo/H-ZSM-5 in the previous
chapter where Mo appeared to ion exchange upon thermal treatment. The results obtained
with Silicalite-1 supports indicate that in spite of the absence of Brønsted acid sites MoO3
it is readily dispersed on the zeolite.

132
Figure 4-4. XRD patterns collected for a) parent H-ZSM-5, S1 and S1-T zeolites and b) Mo/Silicalite-1 catalysts
before and after calcination.

133
Electron microscopy:
High resolution SEM images were taken using low accelerating voltage of 1.6 kV for
a detailed observation of surface morphology. Figure 4-5a and b show the images acquired
for H-ZSM-5 and S1-T in secondary electron detection mode. Low magnification pictures
are shown in order to get a representative overview of the particles. In the images taken for
the commercial zeolite only a few crystals show the coffin-like shape typical of H-ZSM-5;
the crystals are about 200 nm long and 50 nm wide. Overall, this sample comprised an
agglomeration of crystals of a range of sizes with not well defined shape. In agreement with
the XRD patterns, SEM images of Silicalite-1 show high crystallinity with nanocrystals of
very homogeneous size and shape (~ 250 nm dimeter and 120 nm wide). Crystal dimensions,
were not altered by the EDA hydrothermal treatment, SEM pictures comparing S1 and S1-T
are shown in Figure A4-1 of the appendix.
Figure 4-5c-d show the secondary electron images of the Mo/zeolites after calcination
at 700 °C. In agreement with previous XRD results (see characterisation in Chapter 3), the
calcination step lead to a considerable damage of the H-ZSM-5 crystals where the coffin-like
shapes are no longer appreciable and particles appear with pinholes and other defects. It is
known that the thermal stability of zeolites increases for increasing Si/Al ratios and that
purely siliceous zeolites present high temperature stability.18,49,50 Consistently, no visible
defects are observed on the S1-T support after calcination with MoO3 while XRD show a
minimal decrease in diffracted X-ray intensity.
To get insight into Mo distribution on the zeolite crystals, the same images were
collected on backscattered electron imaging mode (Figure 4-5e-f). Heavier elements such as
molybdenum backscatter more efficiently and appear brighter than lighter elements (i.e. Si,
Al, O) in a backscattered electron image. Thus, differences in contrast illustrate very well
areas with higher Mo concentration. The images show brighter regions distributed all over
the zeolites suggesting Mo dispersion was heterogeneous. These spots are more visible in
Mo/S1-T suggesting poorer dispersion on the pure silica zeolite support.

134
a) b)
c) d)
e) f)
Figure 4-5. High resolution SEM images (accelerating voltage 1.6 kV) corresponding to: H-ZSM-5 (a), S1-
T (b), Mo/H-ZSM-5 (c) and Mo/S1-T (d) imaged by secondary electron detection. And Mo/H-ZSM-5 (e)
and Mo/S1-T (f) imaged by backscattered electrons.
H-ZSM-5 200 nm
Mo/H-ZSM-5 200 nm Mo/S1-T 200 nm
Mo/H-ZSM-5 200 nm Mo/S1-T 200 nm
S1-T 200 nm
240 n
m
240 nm
50 nm

135
Figure 4-6. High magnification lattice resolution TEM images (top), dark-field TEM image (middle) and
EDX maps (bottom) for a) 4 wt. % Mo/H-ZSM-5 and b) 4 wt. % Mo/S1-T after calcination.
a) b)
10 nm
10 nm
10 nm
100 nm 100 nm
Si K O K
Mo K
Si K Al K
Mo K
20 nm

136
A closer look at the particles was carried out by transmission electron microscopy.
Figure 4-6a-b present the high magnification resolution images of Mo/H-ZSM-5 and
Mo/S1-T respectively. Zeolite lattice planes on Mo/H-ZSM-5 could be clearly observed
whereas the presence of pores and defects are also recognisable. By XRD and N2-
physisorption Mo/S1-T showed to be highly crystalline and porous material, nevertheless
the zeolite lattice planes were not discernible in this catalyst. This could be due to the
crystal thickness and orientation effects as well as due to zeolite damage induced by the
beam that reduces the visualisation of the crystallographic planes.
Figure 4-6c-d show the dark-field image together with compositional maps of the
same image carried out by X-ray emission detection in the scanning mode. The resulting
pictures suggest that Mo is distributed across the zeolite particles; in case of the S1-T Mo
concentration was higher in regions where particles were touching or overlapping
suggesting Mo deposition - at least partially - on the crystal surface.
UV-VIS absorption spectroscopy:
UV-vis spectra of the Mo/zeolites were measured in order to gain insight regarding
the differences in Mo speciation. As seen Figure 4-7 all the absorption bands appear in
the ligand to metal charge transfer region (O2- → Mo6+).51 Routinely, bands from 250 to
280 nm are assigned to tetrahedral isolated Mo oxide centres whilst absorption from 300
to 330 nm are attributed to octahedral geometry.52 However, as discussed in Chapter 3,
different interpretations of the bands can be found in the literature with significant overlap
in the assignments: isolated tetrahedra from 230 to 295 nm, isolated octahedra from 270
to 330 nm,52 and connected Mo oxide centres at > 250 nm.52–54
All catalysts show bands corresponding to similar Mo speciation although the
population of these species exhibit some differences between the samples. In the spectra
collected for Mo/H-ZSM-5 the maximum of absorption appears at 228 nm suggesting the
presence of isolated tetrahedra. In case of Mo/Silicalite-1 catalysts the UV-Vis absorption
results in a broader band which implies the presence of a range of Mo local structures. In
addition, a shift to higher wavelengths (240 to 260 nm) is detected, this region is attributed
to isolated tetrahedral as well as to interconnected Mo species. The shoulder present at
310 nm is attributed to octahedral isolated species by some reports.

137
250 300 350 400 450
0
2
4
6
8
10
12
245
228
254
Kubelk
a M
unk (
a.u
.)
Wavelength (nm)
Mo/H-ZSM-5
Mo/S1
Mo/S1-T
310
Figure 4-7. UV-Vis spectra of calcined Mo/H-ZSM-5, Mo/S1 and Mo/S1-T (4 wt. % Mo).
Considering the controversy in the literature regarding band assignments, it is hard
to draw definite conclusions on Mo structure on the basis of UV-Vis analysis only.
Besides, results discussed in the XAS section below reveal that the Mo environment and
coordination of ex situ characterised samples differs from the measurements taken in situ.
This suggests that exposure of samples to air after calcination leads to changes of the Mo
local structure and that ex situ spectroscopic studies should be interpreted with caution.
A more complete discussion on Mo local environment is described through XAS
results in the following section.
4.3.2 X-ray absorption spectroscopy during in situ calcination
X-ray absorption can provide valuable information regarding coordination,
oxidation state and nature of the neighbouring atoms.
Figure 4-8 shows the Mo K-edge XANES spectra of MoO3 and Fe2(MoO4)3
references as well as the calcined Mo/MFI catalysts measured both ex situ and after in
situ calcination in air (700 °C for 30 min with 5 °C/min rate). All samples show Mo K-
edge (1s → 5p transition) around 20015 eV (taken as the energy at half-step height) which
is consistent with Mo in oxidation state of 6+. Nevertheless, the spectral features of in

138
situ and ex situ measured materials differ considerably demonstrating the importance of
performing experiments under real catalyst working conditions for a reliable analysis of
the nature of the active Mo structures.
Catalysts measured ex situ resemble MoO3 reference with octahedral coordination
whereas in situ calcined samples present higher pre-edge intensity (1s → 4d transition).
They also exhibit featureless post-edge similar to Fe2(MoO4)3 reference which is
comprised by isolated tetrahedral Mo units55 (see Chapter 3 for detailed discussion). The
water adsorption on Mo centres has been reported to be the cause of evolution from a 4-
fold coordination to a 6-fold Mo coordination when exposing Mo/zeolites to air.56
This is of significance as some authors have drawn structural conclusion from ex situ data
without reporting the degree of sample dehydration.57
20000 20040 20080 20120
-0.4
0.0
0.4
0.8
1.2
1.6
2.0
2.4
Mo/H-ZSM-5 ex situ
Mo/S1-T ex situ
MoO3
Fe2(MoO4)3
Norm
alis
ed xm
(E)
Energy (eV)
Mo/H-ZSM-5 in situ
Mo/S1-T in situ
Figure 4-8. Mo K-edge XANES spectra for: MoO3, Fe2(MoO4)3, in situ calcined Mo/MFI catalysts (spectra
collected at 700 ℃) and ex situ calcined Mo/MFI samples.
The in situ calcined Mo/S1-T and Mo/H-ZSM-5 (middle two spectra in Figure 4-8)
present similar XANES featureless post-edge. This implies that despite the absence of
Brønsted acid sites, Mo disperses well on S1-T forming isolated species. The dispersion
may occur as a result of grafting of the metal to the zeolite through interaction with silanol
defects as suggested by FTIR data. Studies carried out using hydroxylated silica, reveal

139
that Mo grafting through the silanols can give a range of possible Mo-oxo species (such
as isolated monografted monomers,58 digrafted monomers,59–61 dimers62 etc). However,
at high temperatures or under dehydrated condition, isolated (O=)2Mo(-O-Si)2 digrafted
centres - schematised in Scheme 4-3b – are reported to be predominantly present.61,63
These species are analogous to the ion exchanged Mo-oxo centres described for Mo/H-
ZSM-5 in Chapter 3 with two terminal Mo=O double bonds and two Mo-O bonds
bridging to the zeolite.
For a better evaluation of the Mo dispersion process, the XAS data collected during
the calcination of the as-prepared Mo/S1-T is shown in Figure 4-9. Observing the
evolution of XANES in (Figure 4-9a) the post-edge becomes gradually smoother with
increasing temperature up to 600 °C. Further temperature increase leads to more sudden
changes in the spectra. The post-edge above 600 °C adopts the featureless shape
suggesting that Mo commences to lose long range order at this temperature. Pre-edge
intensity also increases in line with a change from octahedral to tetrahedral symmetry (see
inset in Figure 4-9a). This indicates that Mo diffusion to the zeolite pores and anchoring
to the silanol defects commences above 600 °C; this is similar temperature response as
observed during Mo ion exchange on H-ZSM-5 in Chapter 3.
Matching conclusions can be inferred from the FT-EXAFS shown in Figure 4-9b.
The two intense peaks at radial distance below 3 Å observed prior the calcination (at 25
°C) correspond to near neighbour O atoms in MoO3 precursor containing MoO6
octahedral units. The peak around 3.5 Å corresponds to Mo neighbours in the second
shell. During calcination, from 25 to 600 °C the intensity of all these peaks gradually
decreases as a result of the increasing thermal disorder which leads to the damping of the
EXAFS. As expected, this decrease is more pronounced for atoms at longer radial
distances. In this temperature range, there are no shifts in the position of the peaks
suggesting the Mo local structure is not altered. From 600 to 700 °C however, significant
changes arise in the FT-EXAFS, the peak at lowest radial distances shifts suggesting
formation of shorter Mo-O bonds. This goes in line with grafted Mo-oxo species which
contain terminal Mo=O. The peak with maxima ~ 2 Å also moves to shorter bond
distances, this peak probably corresponds to O atoms bridging to the zeolite. Importantly,
above 600 °C the peak at radial distances > 3 Å disappears suggesting loss of Mo in the
second shell and the formation of monomeric species.

140
Figure 4-9. Mo K-edge XAS data collected during in situ calcination of 4 wt. % Mo/S1-T. a) XANES
spectra, b) phase corrected FT-EXAFS.

141
Note that Figure 4-9b also includes the FT-EXAFS for the spectra collected after
calcination once the sample cooled down to room temperature. This confirms that the
absence of neighbour Mo peak is real and not an effect of the high temperatures used
during calcination.
It is interesting to note here that in Mo/S1-T, the two Mo-O distances (i.e. terminal
Mo=O and bridging Mo-O bonds to the zeolite) result in two well resolved peaks in the
FT-EXAFS. This is not the case of Mo/H-ZSM-5 sample discussed in Chapter 3 which
as shown Figure 4-10 exhibits a single broad peak instead). This could be explained by
the degree of interaction between Mo and framework oxygen atoms. While BAS in H-
ZSM-5 are strong acid sites associated to framework AlO4-, silanols defects in S1-T
constitute weaker anchoring sites for the Mo. This could result in longer Mo-O distances
for the bridging oxygens in Mo/S1-T and consequently in a better resolution of Mo=O
and Mo-O scattering peaks in the FT-EXAFS.
1 2 3 4
-1.0
-0.5
0.0
0.5
1.0
1.5
2.0
2.5
3.0
MoO3
Fe2(MoO
4)
3
(R
) (A
-3)
Radial distance (Å)
Mo/H-ZSM-5
Mo/S1-T
Figure 4-10. a) Mo K-edge FT-EXAFS for Mo/S1-T and Mo/H-ZSM-5 samples at room temperature
after in situ calcination. FT-EXAFS for MoO3 and Fe2(MoO4)3 references is also included.
In order to refine these two bond distances, quick first shell fit of the EXAFS spectra
was carried out. As data taken at high temperatures is of less quality, the analysis was
performed for the spectra collected at room temperature after the in situ calcination. The
best fists were obtained by setting both paths to coordination number 2 which goes in line

142
with (O=)2Mo(-O-Si)2 species. Table 4-2 presents the parameters refined for Mo/S1-T
and Mo/H-ZSM-5, the experimental and simulated spectra are plotted together in
Figure 4-11. The results suggest similar Mo=O bond distances for both samples
while the Mo-O distance is considerably longer on the pure siliceous zeolite (2.31 Å in
Mo/S1-T and 1.80 Å in Mo/H-ZSM-5).
Table 4-2. EXAFS fitting parameters for calcined Mo/S1-T and Mo/H-ZSM-5: So2 = 0.91, Fit Range: 3
< k < 12, 1 < R < 3. Where CN = co-ordination number, R = bond length of the Absorber-Scatterer, σ2 =
Mean squared disorder term (sometimes referred to as the Debye Waller factor), Eo = Energy shift, RFactor
= A statistic of the fit, which is a way of visualising how the misfit is distributed over the fitting range.
Sample/
Oxidation state Shell CN R (Å) σ2 (Å2) E0
RFactor
(%)
Mo/S1-T Mo=O
Mo-O
2.0
2.0
1.69
2.31 (+/-0.03)
0.0046 (+/- 0.0012)
0.0079 (+/-0.0030)
-11.93
(+/-2.03) 3.5
Mo/H-ZSM-5 Mo=O
Mo-O
2.0
2.0
1.69
1.80 (+/-0.04)
0.0059 (+/-0.0043)
0.0041 (+/-0.0016)
-0.15
(+/-2.61) 3.2
It must be pointed out that there are probably additional Mo species to (O=)2Mo(-
O-Si)2 present in Mo/S1-T. The heterogeneity of silanol defects observed by FTIR (i.e.
vicinal, terminal and nest) will for sure lead to variations in Mo anchoring modes.62
Nonetheless, the analysis above gives valuable information regarding the structure of Mo
on S1-support suggesting the presence of two distinct type of bonds and giving insight
into their distances.
SEM images shown previously revealed some poorly dispersed Mo remains in the
S1-T surface after calcination. The lower pre-edge intensity in the XANES spectra of
Mo/S1-T compared to Mo/H-ZSM-5 also seem to suggest higher centrosymmetry for Mo
structures which could be arising from presence of MoO3 precursor with octahedral
MoO6. Nevertheless, the featureless post-edge in XANES spectra and the absence of Mo-
Mo peak in FT-EXAFS suggest that most of the metal is well dispersed into monomeric
species and MoO3 must have minimal contribution in the spectral features.

143
4 5 6 7 8 9 10
-0.4
0.0
0.4
0.8k
2
(k) (A
-2)
Wavenumber (Å-1)
MoS1-T
Fit
a)
1 2 3 4
0.0
0.2
0.4
0.6
(R
) (A
-3)
Radial distance (Å)
Mo/S1-T
Fit
b)
4 5 6 7 8 9 10
-0.8
-0.4
0.0
0.4
0.8
k2
(k) (A
-2)
Wavenumber (Å-1)
Mo/H-ZSM-5
Fit
b)
1 2 3 4
0.0
0.2
0.4
0.6
0.8
1.0
(R
) (A
-3)
Radial distance (Å)
Mo/H-ZSM-5
Fit
d)
Figure 4-11. Fitting results for Mo K-edge EXAFS and FT-XAFS (phase corrected) for Mo/MFI catalysts
at room temperature after in situ calcination. Black line: experimental; red dots: simulation.
4.3.3 Methane dehydroaromatisation over Mo/MFI
4.3.3.1 Qualitative study of Mo/MFI and Mo/SiO2 catalysts
Mass spectrometry results:
MDA activity of Mo/MFI catalysts was first evaluated for short methane
dehydroaromatisation reactions. These tests were carried out for 90 min at 700 °C under
50 % CH4/Ar flow (GHSV of 1500 h-1) after in situ calcination of the MoO3 + MFI
physical mixtures. Figure 4-12a-b present the mass traces of CH4 as well as the reaction
products obtained for Mo/H-ZSM-5 and Mo/S1-T respectively. All MS data presented
are normalised to the Ar signal and the logarithmic scale is used for better visualisation
of all mass trends on one plot. A blank measurement of the inlet gas was also taken, the
signal intensities obtained in this blank experiment are presented in the appendix (Figure
A4-2). It is worth noting that the blank data showed signals corresponding to m/z of 25
and 27 related to C2/C3 molecules which are also MDA reaction products. These signals

144
can be attributed to a secondary effect of high CH4 concentration in the MS ionisation
chamber, or to the presence of traces of impurities coming from the methane cylinder.
a)
b)
Figure 4-12. MS data collected for 4 wt. % Mo/MFI catalysts using a) H-ZSM-5 and b) S1-T as the
supports.
MDA reaction product trends observed are similar to the ones obtained during
operando XAS studies discussed previously in Chapter 3. Both Mo/MFI samples show
0 20 40 60 80 100
1E-5
1E-4
1E-3
0.01
0.1
1
Ion C
urr
en
t (A
)
Time (min)
H2 (m/z=2)
CH4 (m/z=15)
H2O (m/z=18)
C2Hx (m/z=25)
C2Hx/C3Hx (m/z=27)
CO/CO2
C3H
8/C
3H
x(m/z=28)
CO2/C
3H
8 (m/z=44)
C6H
6 (m/z=78)
C7H
8 (m/z=91)
CH4
H2
H2O
C6H
6 CO
2
CO
C7H8
C2Hx
C2Hx + C3Hx
0 20 40 60 80 100
1E-6
1E-5
1E-4
1E-3
0.01
0.1
1
H2 (m/z=2)
CH4 (m/z=15)
H2O (m/z=18)
C2Hx (m/z=25)
C2Hx/C3Hx (m/z=27)
CO/CO2
C3H
8/C
3H
x(m/z=28)
CO2/C
3H
8 (m/z=44)
C6H
6 (m/z=78)
C7H
8 (m/z=91)
Ion C
urr
ent (A
)
Time (min)
CH4
H2
H2O
C6H
6
CO2
CO
C7H8
C2Hx
C2Hx + C3Hx

145
an induction period of ~ 7 min in which combustion products are formed (CO2, CO and
H2O). Formation of H2 indicates methane dehydrogenation to C2/C3 intermediates or
carbon deposits also occur during this early stage of reaction. Mass traces corresponding
to C2 and C3 molecules (m/z = 25 and 27) were observed during the induction period but
as the detected levels did not exceed the ones from the blank measurement we cannot
infer whether light hydrocarbons are formed during the induction period (see Figure A4-
3 in the appendix). After 7 min, combustion product formation ceases and aromatics
(C6H6 and C6H7), C2/C3 molecules and H2 formation is observed in both catalysts.
The signal for aromatics was stable over 90 min of MDA for Mo/H-ZSM-5 while
H2 decreased slightly suggesting slow catalyst deactivation. For Mo/S1-T these signals
decreased steadily after 20 min of reaction indicating a faster catalyst deactivation. C2/C3
seemed to gradually increase for both samples in agreement with previously published
data.10,57,64,65 Based on these results, an initial observation can be made that BAS are not
essential for MDA implying that Mo species can play a major role in
dehydroaromatisation of C2/C3 intermediates.
In order to get further confirmation of the role of Mo species in aromatisation MoO3
+ SiO2 physical mixtures were also studied using two types of SiO2 support: a low surface
area one with 5 m2/g (Mo/SiO2-L) and fumed SiO2 with 200 m2/g (Mo/SiO2-H). The
second support presented sufficient surface area to potentially host fully dispersed 4 wt.
% Mo.
As shown in Figure 4-13a XRD characterisation of calcined Mo/SiO2-H show a
broad band around 20 2° corresponding to amorphous SiO2. Mo/SiO2-L presents
diffraction peaks corresponding to -quartz phase with main reflection at 2 ° values of
20.9577, 26.6902 and 36.6475 corresponding to (100), (101) and (110) crystallographic
planes respectively. None of the calcined Mo/SiO2 show reflections for MoO3 (most
intense ones expected at 2 θ° angles of 12.774, 25.697 and 38.970). This again indicates
loss of MoO3 crystallinity and metal dispersion on both silica supports upon calcination.

146
10 15 20 25 30 35 40
Diffr
acte
d X
-ray inte
nsity (
a.u
.)
2 Theta (deg)
Mo/SiO2-L
Mo/SiO2-H
a)
250 300 350 400 4500
4
8
12
16
245228
254
Inte
nsity (
a.u
.)
Wavelength (nm)
Mo/SiO2-L
Mo/SiO2-H
310
b)
Figure 4-13. Characterisation results for Mo/SiO2-H and Mo/SiO2-L after calcination in air (700 °C, 5 °C/min
ramp, 30 min): a) XRD and b) UV-Vis absorption spectroscopy.
UV-Vis absorption spectra (Figure 4-13b) shows a broad absorption band for
Mo/SiO2-L suggesting the presence of a large number of MoO3 clusters while Mo/SiO2-
L results in a band with much lower intensity. This suggests a lower Mo content in the
sample probably as a result of MoO3 sublimation during the calcination process. In fact,
the chemical analysis of the catalysts carried out before and after calcination revealed that
while Mo content in Mo/SiO2–H remained constant around 3.6 wt. % upon calcination,
the Mo content Mo/SiO2-L decreases nearly 50 % (from 3.9 to 2.0 wt. % Mo) upon
calcination.
MDA reaction results of these samples are shown in Figure 4-14a-b. In line with
previous publications in silica based Mo catalysts, Mo/SiO2-L shows limited activity.6
After a long period of inactivity (40 min) H2 and C2/C3 evolution is observed, followed
by combustion products (at 60 min) typical for the induction period of the MDA. Then
aromatisation is observed but the mass traces show very low intensity and the activity
decreases very sharply. In contrast, Mo/SiO2-H give mass trends very similar to
Mo/zeolites. It presents an induction period of around 10 min; although with decreased
signal intensity, stable aromatic production is observed for the remaining 80 min under
CH4.

147
a)
b)
Figure 4-14. MS data collected for 4 wt. % Mo catalysts using a) SiO2-L and b) SiO2-H as the supports.
For a better comparison of the activity between the different catalysts, the recorded
m/z intensities at the point of maximum benzene production is shown in Figure 4-15
together with the values obtained for the blank measurements. The normalised intensity
is also plotted in logarithmic scale in this figure. As expected, Mo/H-ZSM-5 shows
highest activity followed by Mo/S1-T, Mo/SiO2-H and finally by Mo/SiO2-L with lowest
activity.
0 20 40 60 80 100
1E-5
1E-4
1E-3
0.01
0.1
1
H2 (m/z=2)
CH4 (m/z=15)
H2O (m/z=18)
C2Hx (m/z=25)
C2Hx/C3Hx (m/z=27)
CO/CO2
C3H
8/C
3H
x(m/z=28)
CO2/C
3H
8 (m/z=44)
C6H
6 (m/z=78)
C7H
8 (m/z=91)
Ion C
urr
en
t (A
)
Time (min)
H2O
C6H
6
CO2
CO
C7H
8
C2H
x
C3H
8
C2H
x + C
3H
x
CH4
H2
0 20 40 60 80 100 120 140 160
1E-5
1E-4
1E-3
0.01
0.1
1
H2 (m/z=2)
CH4 (m/z=15)
H2O (m/z=18)
C2Hx (m/z=25)
C2Hx/C3Hx (m/z=27)
CO/CO2
C3H
8/C
3H
x(m/z=28)
CO2/C
3H
8 (m/z=44)
C6H
6 (m/z=78)
C7H
8 (m/z=91)
Ion C
urr
ent (A
)
Time (min)
CH4
H2
H2O
C6H
6
CO2
C2H
x
C3H
8
C2H
x + C
3H
x
C7H
8
CO

148
1E-5
1E-4
0.001
0.01
0.1
1
10
m/z = 27
C2Hx/C3Hx
m/z = 78
C6H6
m/z = 25
C2Hx
m/z = 2
H2
No
rmalis
ed
inte
nsi
ty (
a.u
.) Mo/H-ZSM-5
Mo/S1-T
Mo/SiO2-H
Mo/SiO2-L
Blank
m/z = 15
CH4
Figure 4-15. MS signal intensities for methane and reaction products at the maximum activity of Mo/H-
ZSM-5, Mo/S1-T, Mo/SiO2-H and Mo/SiO2-L catalysts.
Thermo-gravimetric analysis of reacted samples:
Thermo-gravimetric analysis was carried out to characterise the carbonaceous
deposits on the 90 min reacted catalysts. The recorded profiles are shown in Figure 4-16a
together with the wt. % values corresponding to total carbon deposits.
The weight loss observed at temperatures below 200 °C is due to desorption of
water physisorbed on the catalysts surface when samples are exposed to air after reaction.
As expected, non-porous SiO2-based catalysts with a comparatively low surface area and
lower hydrophilic properties show no mass loss due to water desorption. Mo/S1-T in
contrast shows increased mass loss below 200 °C due to its higher micropore volume to
host H2O molecules and the affinity to water of the silanol defects present. The highest
mass loss due to water desorption is however observed for Mo/H-ZSM-5. This sample –
like Mo/S1-T – also presents high micropore volume, but the presence of BAS with strong
affinity to water makes the material the most hydrophilic of the four.
A slight weight increase was observed in all samples at 320–380 °C which is
attributed to the reaction between oxygen and Mo-carbides,66,67 this was particularly
evident in Mo/SiO2 samples.

149
Mass loss between 350 and 600 °C is caused by the burning-off of the carbon
deposits. Mo/SiO2-L presented lowest degree of carbon deposition which is consistent
with its limited activity in MDA. For the other three samples the total coke deposition
showed the following trend: Mo/H-ZSM-5 (3 wt. %) < Mo/S1-T (5.4 wt. %) < Mo/SiO2-
H (10.2 wt. %).
Figure 4-16b shows the derivative of TGA curves (weight loss rate) in the carbon
combustion temperature ranges. Derivative curves provide better visualisation of burning
of temperatures for further analysis of the deposited coke. The profiles shown present
two defined peaks, a more intense one between 350 and 480 °C and a less intense broad
peak between 450 and 600 °C.
Authors investigating Mo/H-ZSM-5 deactivation during MDA4,66,67 assigned the
low temperature combustion peak to burning off of soft coke which is thought to be
amorphous in nature and likely formed in the proximity of Mo-carbide particles. The
peaks at higher temperatures have been attributed to hard coke mainly comprised of
polyaromatic hydrocarbons formed by reactions of olefins on BAS located at the external
surface of the zeolite. The temperature values reported for the position of these two peaks
in the derivative curves show significant variation across different publications.4,65–67 This
is probably due to the fact that combustion temperature is not only dependent on the
nature of carbonaceous species but also on many other variables such as the location, the
size of carbon deposit particles or their proximity to metal oxides (including MoO3) which
are known to catalyse carbon combustion reactions.67,68
From the data in Figure 4-16b we can observe that the peak at higher temperatures
(~ 500 °C) is present regardless the support’s acidity, and thus its assignment to coke
associated to BAS is ruled out. Taking into account the similarity of our data to TGA
profiles reported on MoO3 + activated carbon physical mixtures,67 it seems likely that this
second peak results from proximity effect between the Mo and carbon deposits rather
than from the presence of different carbonaceous species. Regarding the peak at lower
temperatures, Mo/H-ZSM-5 shows a significant shift to higher temperatures. This could
be related to a more acidic nature of carbon deposits on this catalysts which are reported
to be more stable.66

150
100 200 300 400 500 600 700
85
90
95
100
0
2
4
6
8
10
12
0.2%3%
10.2%Mo/S1-T
Mo/SiO2-L
Mo/H-ZSM-5
Carb
on c
onte
nt (w
t%)
Mo/SiO2-H
5.4%
We
igh
t (%
)
Temperature (oC)
Mo/H-ZSM-5
Mo/S1-T
Mo/SiO2-H
Mo/SiO2-L
a)
200 300 400 500 600
0.00
0.05
0.10
0.15
0.20
0.25
High
temperature
peak
We
igh
t lo
ss r
ate
(m
g/o
C)
Temperature (oC)
Mo/SiO2-H
Mo/S1-T
Mo/H-ZSM-5
Mo/SiO2-L
b) Low
temperature
peak
Figure 4-16. Derivative TGA profiles and wt. % of coke (a) and weight loss derivative curves (b) for Mo/MFI
and Mo/SiO2 catalysts reacted for 90 min at 700 °C, GHSV = 1500 h-1.
Kerr-gated Raman spectroscopy of the reacted samples:
The carbon deposits on spent catalysts were further studied by Kerr-gated Raman
spectroscopy. Mo/SiO2-L which was barely active and showed negligible carbon
deposition by TGA is excluded from this analysis. Figure 4-17 shows the first order
Raman bands collected for Mo/H-ZSM-5, Mo/Si-T and Mo/SiO2-H. All the spectra
present two distinct bands typical for carbon compounds. The band around 1360 cm-1 is

151
denoted as D1 (disorder) band and it is ascribed to in-plane breathing vibrations of sp2-
bonded carbon (rings). The D1 band is usually attributed to amorphous carbon, carbon
nanoparticles or defects in graphitic type deposits.69 The second band is known as the G
(graphitic) band, it usually appears at 1580 cm-1 and corresponds to in-plane stretching
vibrations of pairs of sp2 C atoms. This band is observed in graphitic-type carbon as a
result of lattice vibrations.69–71 In all three samples presented in Figure 4-17 these bands
are shifted to higher wavenumbers (1611 cm-1). This shift has been reported to be due to
a contribution from a second D2 band (1620 cm-1) attributed to edges of graphitic
crystallites.71,72 Thus, the observed shift suggests the presence of very small carbon
crystallites with large surface/bulk ratio and therefore a high number of edges.71,73 A weak
shoulder can be also observed at 1200 cm-1, this Raman shift has been named as a D4
band and it is ascribed to either sp2−sp3 bonds or C−C and C=C stretching vibrations of
polyenes.74
1000 1200 1400 1600 1800 2000
0
300
600
900
1200
1500
1800
2100
2400
2700
D1/G = 0.80
D1/G = 0.61
D4 band
G (and D2) band
Mo/S1-T
Mo/SiO2-H
Ine
nsity (
a.u
.)
Raman shift (cm-1)
Mo/H-ZSM-5
D1 band
D1/G = 0.52
Figure 4-17. Kerr-gated Raman spectra for Mo/H-ZSM-5, Mo/S1-T and Mo/SiO2-H catalysts reacted at
700 °C for 90 min (GHSV = 1500 h-1).
The ratio of D1 and G(D2) bands intensities gives insight regarding the degree of
order in the carbon structure;69,71 increasing I(D)/I(G) indicates increasing structural
disorder. The degree of disorder follows the same trend of Mo/H-ZSM-5 < Mo/S1-T <
Mo/SiO2-H.

152
In summary, the Raman studies confirm the formation of significant amounts of
disordered graphitic carbon or small graphite crystallites in the spent samples with lower
degree of disorder on Mo/H-ZSM-5.
4.3.3.2 Mo/MFI stability study
Mass spectrometry and gas chromatography results:
The stability of Mo/MFI catalysts was studied by performing MDA reaction for a
period of 10 h while the mass of carbon deposits obtained at different reaction times were
quantified by TGA. Catalytic activity results obtained by online mass spectrometry are
presented in Figure 4-18 below. In agreement with previous publications the methane
conversion rate and benzene formation gradually decreased over 10 h under CH4 flow for
Mo/H-ZSM-5.64,75,76 Formation of H2 also decreases constantly. In case of Mo/S1-T the
H2 and aromatic detection decreases steeply within the first four hours indicating faster
deactivation of the catalysts.
a)
0 2 4 6 8 10
1E-4
1E-3
0.01
0.1
1
Mass S
ignal (a
.u.)
Time (h)
H2 (m/z=2)
CH4 (m/z=15)
C2Hx (m/z=25)
C2Hx + C3Hx (m/z=27)
CO/CO2
C3H8/C3Hx (m/z=28)
CO2/C3H8 (m/z=44)
C6H6 (m/z=78)
C7H10 (m/z=91)
a)
H2
C3H
8/C
3H
x
CH4
C2H
x + C
3H
x
C2H
x
C6H
6
C3H
8
C7H
10

153
b)
Figure 4-18. MS profiles of CH4 and reaction products for a) 4 wt. % Mo/H-ZSM-5 and b) 4 wt. %
Mo/S1-T under methane dehydroaromatisation reaction (50 % CH4/Ar, 1500 h-1, 700 °C).
Figure 4-19 presents the conversion and product selectivity values obtained by GC.
As shown in Figure 4-19a methane conversion steadily decreases from 14 to 5 % for
Mo/H-ZSM-5; the initial conversion for Mo/S1-T was much lower, around 5 %, and
decreased to 1.5 % in the first 5 hours when stabilised.
Selectivity to ethylene (Figure 4-19c) is comparable for both samples and increases
from 1 to around 11 % over the course of the reaction. These trends suggested that catalyst
deactivation occurs by decreasing in ethylene aromatisation performance.
Benzene selectivity values recorded for Mo/H-ZSM-5 (Figure 4-19b) commence
with 37 %, a maximum of selectivity is reached around 2 h of reaction and is then
followed by a steady decrease down to 17 %. In case of Mo/S1-T the selectivity to C6H6
was much lower and went from 13 % at the beginning of the reaction to 0 % within 4 h
of reaction. This indicates Mo/S1-T must be more selective towards carbon deposit
formation which goes in agreement with TGA results obtained for short reaction times
(Figure 4-16a).
0 2 4 6 8 10 12
1E-4
1E-3
0.01
0.1
1
H2 (m/z=2)
CH4 (m/z=15)
C2Hx (m/z=25)
C2Hx + C3Hx (m/z=27)
CO/CO2
C3H8/C3Hx(m/z=28)
CO2/C3H8 (m/z=44)
C6H6 (m/z=78)
C7H10 (m/z=91)
Mass S
ignal (a
.u.)
Time (h)
b)
H2
C3H
8/C
3H
x
CH4
C2H
x + C
3H
x
C2H
x
C6H
6
C3H
8
C7H
10

154
It must be pointed out that although CH4 conversion and ethylene selectivities are
comparable to previous publications, the values obtained for C6H6 are lower than
expected (usually reported initial C6H6 selectivities being 45-80 % on 4 % Mo/H-ZSM-5
under similar reaction conditions). Besides, other aromatics (i.e. toluene and naphthalene)
also expected as MDA reaction products are not detected by the GC. Furthermore, the
mass balance does not close with the wt. % of carbon values obtained by TGA. All this
suggest that despite keeping reactor lines at 200 °C aromatic products partially condense
on their way to the GC.
From the catalytic data, we can conclude that both catalysts can undergo
aromatisation but Mo/H-ZSM-5 is a more active and stable catalyst showing lower
selectivity towards carbon deposits. Having similar ethylene selectivities, the increased
methane transformation into carbon deposits for Mo/S1-T could be attributed to Mo being
attached less strongly to silanol defects in S1-T than to BAS in H-ZSM-5. A more rapid
sintering of Mo-carbide species and their migration to outer surface would lead to the loss
of shape selectivity to aromatics provided by the MFI pore structure. The lower CH4
conversion on Mo/Silicalite-1 could be attributed to both phenomena: a rapid initial
deactivation due to increased carbon deposit formation, and to the molybdenum sintering
and loss of active Mo-carbide surface.
0 1 2 3 4 5 6 7 8 9
2
4
6
8
10
12
14
16
CH
4 c
onvers
ion (
%)
Time on stream (h)
Mo/H-ZSM-5
Mo/S1-T
a)
0 1 2 3 4 5 6 7 8 9
0
5
10
15
20
25
30
35
40
45
Benzene s
ele
ctivity (
%)
Time on stream (h)
Mo/H-ZSM-5
Mo/S1-Tb)
0 2 4 6 8 10
0
2
4
6
8
10
12
14
Ethane Mo/H-ZSM-5
Ethane Mo/S1-T
Sele
ctivity to C
2/C
3 (
%)
Time on setram (h)
Ethylene Mo/H-ZSM-5
Ethylene Mo/S1-Tc)
Figure 4-19. a) CH4 conversion, b) C6H6 selectivity and c) C2/C3 selectivity values obtained for MDA
reaction for 4 wt. % Mo/MFI catalysts (700 °C, GHSV = 1500 h-1).

155
N2 physisorption and thermo-gravimetric analysis of catalyst reacted at different
reaction times:
Table 4-3 gathers the textural properties and the carbon content measured by TGA
for the catalysts after different reaction times. In both cases physiosorbed water content
decreases while carbon content increases. The carbon content in Mo/S1-T was always
higher than for Mo/H-ZSM-5 throughout the whole MDA process studies.
The values of surface area and micropore volume indicate a slight increase for the
samples reacted for 7 and 25 minutes (~ 5 % increase from 0 to 25 min). This increase,
which has also been observed by other groups,4 can be explained by the Mo species
vacating zeolite pores in agreement with the mechanism proposed in Chapter 3. In the
early stages of reaction, oxygen ligands of the Mo-oxo species present after calcination
are replaced by carbon leading to a fully carburised Mo-carbide species that are no longer
attached to the framework and hence they migrate to the zeolite outer surface. At longer
reaction times (90 min to 10 h) the micropore volume decreases due to the larger
deposition of coke on the zeolite.
Table 4-3. N2 physisorption results and carbon content for 4 wt. % Mo/MFI catalysts after different MDA
reaction times.
Sample
TGA-H2O
>250 °C
(wt. %)
TGA-Carbon
350-600 °C
(wt. %)
SBET
(m2/g)
Vmicr
(cm3/g)
H-ZSM-5 6.5 / 412 0.149
Mo/H-ZSM-5(0min) 6.1 / 344 0.117
Mo/H-ZSM-5(7min) 5.7 0.4 351 0.122
Mo/H-ZSM-5(25min) 6.4 0.9 360 0.125
Mo/H-ZSM-5(90min) 3.4 3.0 326 0.112
Mo/H-ZSM-5(10h) 3.1 6.3 280 0.094
Mo/H-ZSM-5(30h) 2.6 10.8 153 0.055
S1-T 3.7 / 452 0.170
Mo/S1-T(0min) 2.6 / 389 0.136
Mo/S1-T(7min) 3.1 0.5 409 0.144
Mo/S1-T(90min) 1.5 5.4 333 0.118
Mo/S1-T(10h) 1.2 7.4 302 0.107

156
The derivative of the TGA curves at different reaction times for Mo/H-ZSM-5 and
Mo/S1-T are presented in Figure 4-20a and 4-20b respectively. The results show a gradual
shift to higher combustion temperatures with increasing MDA reaction time for both
samples. Knowing that the burning off temperature is dependent on the size of deposited
carbon particles; the observed shift can be attributed to the growth coke layers or particles
on the catalyst surface.
300 350 400 450 500 550 600 650 700 750
0.00
0.05
0.10 b)
We
igh
t lo
ss r
ate
(m
g/o
C)
Temperature (oC)
7 min
90 min
10 h
Mo/ST-1
300 350 400 450 500 550 600 650 700 750
0.00
0.05
0.10
Mo/H-ZSM-5
30 h
10 h
90 min
25 min
7 min
Weig
ht lo
ss r
ate
(m
g/o
C)
Temperature (oC)
a)
Figure 4-20. TGA results for Mo/H-ZSM-5 (a) and Mo/S1-T (b) reacted with methane for different
reaction times. (50 % CH4/inert, 700 °C, GHSV = 1500 h-1).
Early Mo sintering and migration during MDA for Mo/H-ZSM-5 was proven by
operando XAS and XRD studied described in Chapter 3. High resolution SEM images of
the reacted Mo/S1-T samples evidence the sintering process also occurs in this catalyst.

157
Figure 4-21 shows the images taken for the catalyst reacted for 7 min, 90 min and 10 h -
the secondary electron images are shown on the left and the backscattered images on the
right. Mo backscatters electrons more strongly and in the backscattered image it will
appear brighter than the rest of components present in the sample (i.e. Si, C, Al and O are
lighter elements). As this analysis was done using low accelerating voltage of 1.6 eV, the
Mo distribution observed corresponds to the outermost surface of the samples.
Figure 4-21. High resolution SEM images (accelerating voltage 1.6 eV) for Mo/S1-T catalysts after 7
min (a), 90 min (b), and 10 h (c) of MDA reaction (50 % CH4/N2, 700 °C, 1500 h-1). Left: secondary
electron image; right: backscattered electron image.
200 nm
200 nm
a)
200 nm 200 nm
200 nm
200 nm 200 nm
b)
c)

158
The images indicate that very few bright spots are present in the 7 min reacted
catalyst (Figure 4-21a) suggesting lower degree of sintering at this stage of MDA. The 90
min reacted sample (Figure 4-21b) presents increased amount of Mo particles with ~ 20
nm diameters indicating Mo. In the 10 h reacted sample (Figure 4-21c), the amount of
Mo particles clearly increases and all zeolite crystals show sintered metal on the surface.
a)
b)
Figure 4-22. TEM image and the corresponding EDX elemental maps for Mo/S1-T after 10 h of MDA
reaction.

159
TEM images on Mo/S1-T reacted for 10 h reveal that sintered Mo rich particles are
around 10-25 nm; smaller particles of ca. 2 nm are also visible across S1-T zeolite (Figure
4-22a). As expected, the EDX elemental maps in Figure 4-22b show an even distribution
of Si and O in the zeolite crystals. They also evidence that Mo rich particles on the zeolite
surface are composed of Mo and C which is consistent with Mo2C formation observed by
XAS. Carbon element map shows more intense signal in the periphery of S1-T particles
suggesting higher C concentration on the zeolite surface than inside pores. This goes in
agreement with previous studies by Lezcano-González et al.75
4.4 Summary and conclusions
Defective Silicalite-1 was successfully synthesised with a particle size comparable
to the commercial ZSM-5 used in previous studies (Chapter 3). Basic treatment using
ethylenediamine increased the number of silanol-nest defects by the extraction of Si from
the framework. Calcination of Silicalite-1 and MoO3 physical mixture (~ 4 wt. % Mo)
resulted in molybdenum dispersion and migration into the zeolite pores. FTIR studies
suggested that this dispersion is driven by the interaction of the metal with silanol type
defects. XAS studies for in situ calcination of the as-prepared Mo/S1-T suggested MoO3
evolution into isolated tetrahedral Mo-oxo species above 600 °C. These species seem to
be analogue to the ones obtained for Mo/H-ZSM-5 with two terminal Mo=O and two
bridging Mo-O groups attached to the zeolite framework. Longer Mo-O distances to the
framework oxygens on S1-T allude to weaker interaction of Mo with the silanols than
with the BAS in H-ZSM-5.
Methane dehydroaromatisation activity of Mo/H-ZSM-5 and Mo/S1-T was
compared with Mo supported on amorphous SiO2 with different surface areas. The results
indicated that presence of BAS is not essential for the formation of benzene as
molybdenum carbide itself seems to promote aromatisation. This opens the possibility to
optimise an MDA catalyst based on non-acidic zeolites, such supports are usually more
hydrothermally stable and would allow to increase reaction temperature for better CH4
conversions. Quantification and analysis of carbon deposits formed using different
supports highlighted the key role on Mo dispersion and the zeolite pore size to provide
selectivity to aromatics. The rapid deactivation of Mo/S1-T could be explained by the

160
instability of molybdenum active species in purely siliceous zeolite and its faster sintering
and migration.
The analysis carried out for Mo/MFI samples reacted for different times evidenced
the migration of molybdenum from pores to the outer surface at early stages of reaction.
The growth of carbon deposits with increasing reaction times was also followed by N2
physisorption and TGA while TEM-EDX maps suggest higher C concentration in the
zeolite outer surface.
Hence, the main conclusions of this chapter can be summarised saying that
aromatisation is not exclusive of BAS and that higher activity obtained with acidic
zeolites may be partially due to a better initial stabilisation of molybdenum active species
inside zeolite pores which provide shape selectivity. A connected conclusion - which goes
in line with the results in Chapter 3 - is that the ultimate cause of material deactivation
mechanism is the Mo sintering and migration to zeolite outer surface leading to increased
selectivity to carbon deposits.
Promising engineering solutions are under study to remove carbon deposits through
catalyst regeneration cycles by periodically adding O2 or H2 to the reaction feed or by
using membrane reactors.77–82 Nevertheless, this approach treats the symptom rather than
the cause, and so far, coke build up and eventual deactivation cannot be fully suppressed
by these methods. Hence, work should also be focused on new catalyst formulations with
the aim of stabilising molybdenum carbide species. Alternatively, given that molybdenum
carbide species demonstrated high tendency for sintering, different active metals may be
more promising for MDA. Preliminary studies using iron as the active species have been
carried out during this PhD research and the results are included in Chapter 6.
4.5 References
1 S. Ma, X. Guo, L. Zhao, S. Scott and X. Bao, J. Energy Chem., 2013, 22, 1–20.
2 Z. R. Ismagilov, E. V. Matus and L. T. Tsikoza, Energy Environ. Sci., 2008, 1,
526-541.
3 Y. Xu, Y. Shu, S. Liu, J. Huang and X. Guo, Catal. Letters, 1995, 35, 233–243.
4 C. H. L. Tempelman and E. J. M. Hensen, Appl. Catal. B Environ., 2015, 176–177,

161
731–739.
5 C. Karakaya, H. Zhu and R. J. Kee, Chem. Eng. Sci., 2014, 123, 474–486.
6 D. Ma, Y. Shu, M. Cheng, Y. Xu and X. Bao, J. Catal., 2000, 194, 105–114.
7 J. Shu, A. Adnot and B. P. A. Grandjean, Ind. Eng. Chem. Reseacrh, 1999, 38,
3860–3867.
8 A. Sarıog, A. Mer, T. Savaçı, A. Aye, E.-E. Ae, V. Thu, H. Ae, G. Sapaly, A.
Younès and B. Taârit, Catal. Letters, 2007, 118, 123–128.
9 S. Liu, L. Wang, R. Ohnishi and M. Ichikawa, J. Catal., 1999, 181, 175–188.
10 F. Solymosi, J. Cserényi, A. Szöke, T. Bánsági and A. Oszkó, J. Catal., 1997, 165,
150–161.
11 D. Wang, J. H. Lunsford and M. P. Rosynek, Top. Catal., 1996, 3, 289–297.
12 K. S. Wong, J. W. Thybaut, E. Tangstad, M. W. Stöcker and G. B. Marin,
Microporous Mesoporous Mater., 2012, 164, 302–312.
13 M. Marczewski, H. Marczewska and K. Mazowiecka, React. Kinet. Catal. Lett,
1995, 54, 81–86.
14 J. P. Tessonnier, B. Louis, S. Rigolet, M. J. Ledoux and C. Pham-Huu, Appl. Catal.
A Gen., 2008, 336, 79–88.
15 X. Guo, G. Fang, G. Li, H. Ma, H. Fan, L. Yu, C. Ma, X. Wu, D. Deng, M. Wei,
D. Tan, R. Si, S. Zhang, J. Li, L. Sun, Z. Tang, X. Pan and X. Bao, Science, 2014,
344, 616-619.
16 N. Kosinov, F. J. A. G. Coumans, E. A. Uslamin, A. S. G. Wijpkema, B. Mezari
and E. J. M. Hensen, ACS Catal., 2017, 7, 520–529.
17 C.-L. Zhang, S. Li, Y. Yuan, W.-X. Zhang, T.-H. Wu and L.-W. Lin, Catal. Letters,
1998, 56, 207–213.
18 R. F. Lobo, in Handbook of Zeolites Science and Technology, 2003, pp. 80–113.
19 M. Masteri-Farahani, F. Farzaneh and M. Ghandi, J. Mol. Catal. A Chem., 2003,
192, 103–111.

162
20 E. M. Flanigen, J. M. Bennett, R. W. Grose, J. P. Cohen, R. L. Patton, R. M.
Kirchner and J. V. Smith, Nature, 1978, 271, 512–516.
21 A. Zecchina, S. Bordiga, G. Spoto, L. Marchese, G. Petrini, G. Leofanti and M.
Padovan, J. Phys. Chem., 1992, 96, 4985–4990.
22 S. Bordiga, I. Roggero, P. Ugliengo, A. Zecchina, V. Bolis, G. Artioli, R. Buzzoni,
G. Marra, F. Rivetti, G. Spanò and C. Lamberti, J. Chem. Soc. Dalt. Trans, 2000,
21, 3921–3929.
23 Y. Bu, Y. Wang, Y. Zhang, L. Wanga, Z. Mi, W. Wub, E. Min and S. Fu, Catal.
Commun., 2007, 8, 16–20.
24 P. Y. Dapsens, C. Mondelli and J. Pé Rez-Ramí Rez, Chem. Soc. Rev. Chem. Soc.
Rev, 2015, 44, 7015–7430.
25 D. D. Kragten, J. M. Fedeyko, K. R. Sawant, J. D. Rimer, D. G. Vlachos, R. F.
Lobo and M. Tsapatsis, J. Phys. Chem. B, 2003, 107, 10006–10016.
26 J. Klaas, G. Schulz-Ekloff and N. I. Jaeger, J. Phys. Chem. B, 1997, 101, 1305–
1311.
27 A. J. Dent, G. Cibin, S. Ramos, A. D. Smith, S. M. Scott, L. Varandas, M. R.
Pearson, N. A. Krumpa, C. P. Jones and P. E. Robbins, J. Phys. Conf. Ser., 2009,
190, 012039
28 A. B. Kroner, K. M. H. Mohammed, M. Gilbert, G. Duller, L. Cahill, P. Leicester,
R. Woolliscroft and E. J. Shotton, AIP Conf. Proc., 2016, 1741, 030014.
29 B. Ravel and M. Newville, J. Synchrotron Radiat., 2005, 12, 537–541.
30 W. Li, G. D. Meitzner, R. W. Borry and E. Iglesia, J. Catal., 2000, 191, 373–383.
31 N. R. Meshram, S. G. Hegde and S. B. Kulkarni, Zeolites, 1986, 6, 434–438.
32 B. Li, S. Li, N. Li, H. Chen, W. Zhang, X. Bao and B. Lin, Microporous
Mesoporous Mater., 2006, 88, 244–253.
33 H. Itoh, C. Hidalgo, T. Hattori, M. Niwa and Y. Murakami, J. Catal., 1984, 85,
521–526.
34 N.-Y. Topsøe, K. Pedersen and E. G. Derouane, J. Catal., 1981, 70, 41–52.

163
35 B. M. Lok, B. K. Marcus and C. L. Angell, Zeolites, 1986, 6, 185–194.
36 J.-P. Tessonnier, B. Louis, S. Rigolet, M. J. Ledoux and C. Pham-Huu, Appl. Catal.
A Gen., 2008, 336, 79–88.
37 H. C. Karge and V. Dondud, J. Phys. Chem. Clays Clay Min. Nat., 1990, 9423,
165–112.
38 N. R. Meshram, S. G. Hegde and S. B. Kulkarni, Zeolites, 1986, 6, 434–438.
39 F. Lónyi and J. Valyon, Microporous Mesoporous Mater., 2001, 47, 293–301.
40 ZSM-5 | Zeolyst International, http://www.zeolyst.com/our-products/standard-
zeolite-powders/zsm-5.html, (accessed 1 November 2017).
41 E. García-Pérez, J. B. Parra, C. O. Ania, D. Dubbeldam, T. J. H. Vlugt, J. M.
Castillo, P. J. Merkling and S. Calero, J. Phys. Chem. C, 2008, 112, 9976–9979.
42 G. P. Heitmann, G. Dahlhoff and W. F. Holderich, Journal of Catalysis, 1999, 186,
12-19.
43 Y. Gao, B. Zheng, G. Wu, F. Ma and C. Liu, RSC Adv., 2016, 6, 83581–83588.
44 H. G. Karge and J. Weitkamp, Molecular sieves: science and technology, Springer-
Verlag, 1998.
45 L. F. Isernia, Mater. Res., 2013, 16, 792–802.
46 C. Flego and L. Dalloro, Microporous Mesoporous Mater., 2003, 60, 263–271.
47 www.Iza-Structure.org, (accessed 24 February 2018).
48 J. Ruiz-Martínez, A. M. Beale, U. Deka, M. G. O’Brien, P. D. Quinn, J. F. W.
Mosselmans and B. M. Weckhuysen, Angew. Chemie Int. Ed., 2013, 52, 5983–
5987.
49 B. Jha and D. N. Singh, Fly Ash Zeolites, Springer Science+Business Media
Singapore, 2016, vol. 78.
50 M. Moliner, C. Martínez and A. Corma, Chem. Mater., 2014, 26, 246–258.
51 R. Kumar Rana and B. Viswanathan, Catal. Letters, 1998, 52, 25–29.
52 M. Fournier, C. Louis, M. Che, P. Chaquin and D. Masure, J. Catal., 1989, 119,

164
400–414.
53 G. N. Asmolov and O. V. Krylov, Kinetics and Catalysis, 970, 11, 847-852.
54 J. P. Thielemann, T. Ressler, A. Walter, G. Tzolova-Müller and C. Hess, Appl.
Catal. A Gen., 2011, 399, 28–34.
55 S. E. Shadle, B. Hedman, K. Hodgson and E. I. Solomon, Inorg. Chem., 1994, 33,
4235–4244.
56 M. Rentería, A. Traverse, O. A. Anunziata, E. J. Lede, L. Pierella and F. G.
Requejo, J. Synchrotron Radiat., 2001, 8, 631–633.
57 S. Liu, L. Wang, R. Ohnishi and M. Ichikawa, J. Catal., 1999, 181, 175–188.
58 C. Louis, M. Che and M. . Anpo, J. Ctalysis, 1993, 141, 453–464.
59 S. Takenaka, T. Tanaka, T. Funabiki and S. Yoshida, J. Phys. Chem., 1998, 102,
2960–2969.
60 D. S. Kim, M. Ostromecki and I. E. Wachs, J. Mol. Catal. A Chem., 1996, 106,
93–102.
61 H. Guesmi, R. Grybo, J. Handzlik and F. Tielens, Phys. Chem. Chem. Phys. Phys.
Chem. Chem. Phys, 2014, 16, 18253–18260.
62 Y. Iwasawa, Chemical Design Surfaces for Active Solid Catalysts, 1987, 35,
,,,,,,,,,,,,187-264.
63 E. L. Lee and I. E. Wachs, J. Phys. Chem., 2008, 112, 6487–6498.
64 R. W. Borry, Y. H. Kim, A. Huffsmith, J. a. Reimer and E. Iglesia, J. Phys. Chem.
B, 1999, 103, 5787–5796.
65 C. H. L. Tempelman, X. Zhu and E. J. M. Hensen, Chinese J. Catal., 2015, 36,
829–837.
66 H. Liu, L. Su, H. Wang, W. Shen, X. Bao and Y. Xu, Appl. Catal. A Gen., 2002,
236, 263–280.
67 N. Kosinov, F. J. A. G. Coumans, E. Uslamin, F. Kapteijn and E. J. M. Hensen,
Angew. Chemie - Int. Ed., 2016, 55, 15086–15090.
68 B. A. A. L. van Setten, M. Makkee and J. A. Moulijn, Catal. Rev., 2001, 43, 489–

165
564.
69 C. A. Johnson and K. M. Thomas, FUEL, 1984, 63, 1073–1080.
70 P. K. Chu and L. Li, Mater. Chem. Phys., 2006, 96, 253–277.
71 A. C. Ferrari and J. Robertson, Phys. Rev. B, 2000, 61, 14095–14107.
72 A. Sadezky, H. Muckenhuber, H. Grothe, R. Niessner and U. Pö Schl, Carbon,
2005, 43, 1731-1742.
73 J. Hoekstra, A. M. Beale, F. Soulimani, M. Versluijs-Helder, J. W. Geus and L. W.
Jenneskens, J. Phys. Chemsitry, 2015, 119, 10653–10661.
74 B. Dippel, H. Janderb and J. Heintzenberga, Phys. Chem. Chem. Phys., 1999, 1,
4707–4712.
75 I. Lezcano-González, R. Oord, M. Rovezzi, P. Glatzel, S. W. Botchway, B. M.
Weckhuysen and A. M. Beale, Angew. Chemie - Int. Ed., 2016, 55, 5215–5219.
76 C. H. L. Tempelman, X. Zhu, E. J. M. Hensen, C. H. L. Tempelman, X. Zhu and
E. J. M. Hensen, Chinese J. Catal., 2015, 36, 829–837.
77 N. Kosinov, F. J. A. G. Coumans, G. Li, E. Uslamin, B. Mezari, A. S. G.
Wijpkema, E. A. Pidko and E. J. M. Hensen, J. Catal., 2017, 346, 125–133.
78 J. J. Spivey and G. Hutchings, Chem. Soc. Rev., 2014, 43, 792–803.
79 H. S. Lacheen and E. Iglesia, Phys. Chem. Chem. Physiscs, 2005, 7, 538–547.
80 Y. H. Kim, R. W. Borry and E. Iglesia, Microporous Mesoporous Mater., 2000,
35–36, 495–509.
81 H. Ma, R. Kojima, R. Ohnishi and M. Ichikawa, Appl. Catal. A Gen., 2004, 275,
183–187.
82 S. H. Morejudo, R. Zanón, S. Escolástico, I. Yuste-Tirados, H. Malerød-Fjeld, P.
K. Vestre, W. G. Coors, A. Martínez, T. Norby, J. M. Serra and C. Kjølseth,
Science, 2016, 353, 563–566.

166

167
Chapter 5
Study of the Zeolite Topology in Mo/zeolites for
Methane Dehydroaromatisation
Control of reaction selectivity by zeolite pore shape has been widely applied in
heterogeneous catalysis to promote preferential production of desired products. Methane
dehydroaromatisation reaction (MDA) is known to convert methane directly into a range
of compounds including light hydrocarbons (i.e. ethylene, ethane) as well as aromatics
(benzene, toluene, naphthalene). Most of the research carried out to date has been focused
on Mo/zeolite catalysts based on medium pore zeolites providing selectivity to aromatic
products and little has been reported regarding the use of small pore zeolites. Small pores
would show shape selectivity to lighter hydrocarbons (i.e. ethylene, ethane, propylene)
which, from a chemical industry point of view, are of higher interest than aromatics.
This chapter compares the widely studied Mo/H-ZSM-5 catalyst based on medium
pore zeolite (MFI structure) with Mo/H-SSZ-13 based on small pore zeolite with CHA
structure. Si/Al ~ 15 and Mo loadings of 4 wt. % were used for both catalysts whilst the
use of pure siliceous H-SSZ-13 has also been investigated. Part of this work concentrates
on the synthesis and characterisation of H-SSZ-13 samples. Subsequently structural
properties of Mo/H-SSZ-13 catalysts were investigated by several characterisation
techniques (e.g. microscopy, diffraction, and spectroscopy). Mo speciation under
operating conditions was studied by operando X-ray absorption spectroscopy (XAS). The
operando studies also involved reaction-reactivation experiments to evaluate the material
regeneration and the effect of reaction temperature on Mo speciation.
5.1 Introduction
The active sites in zeolite-based catalysts are usually dispersed within the pores
which are of molecular dimensions. The confined space around these sites gives rise to

168
the use of zeolites as shape selective catalysts. The concept of shape selectivity was first
proposed in 1960 by Paul Wrisz.1 Since then, it has been extensively studied for its
application in different catalytic reactions2–7 and the concept has a great impact on the
design and development of novel catalysts. In fact, several commercial processes today
are based on zeolite shape selectivity, especially in the petrochemical industry.8
Zeolite shape selectivities can be classified into three different categories9 as
depicted in Figure 5-1: 1) reactant selectivity takes place when only part of the reactant
molecules are small enough to diffuse through the zeolite pores and reach the active sites:
2) product selectivity refers to the situation where some of the molecules formed within
the pores are too bulky to diffuse out so they are either converted to less bulky products
or they eventually deactivate the catalyst by blocking the pores; and 3) restricted
transition state selectivity occurs when the geometry of the pore around the active sites
imposes steric constraints on the transition state. Thus, among the possible reaction
pathways those that occur concern transition states small enough to fit in the pores.
Figure 5-1. Representation of types of shape selectivity imposed by zeolite topologies/porosity.
In the case of the MDA reaction most of the catalysts studied to date have been
based on medium pore zeolites, in particular H-ZSM-5 and MCM-22.10–12 Medium pores
- formed by ten SiO4 and AlO4 tetrahedra rings - present diameters between 4.5 and 6.0
Å. The dimensions of these pores are comparable to small aromatic molecules and in
MDA they are believed to provide shape selectivity to benzene which comprises around
60-80 % of the products.11,13

169
The use of small pore zeolites could provide shape selectivity to lighter
hydrocarbons such as ethane, ethylene or propylene which are also MDA reaction
products. Compared to aromatics, light hydrocarbons are of greater importance in the
chemical industry as they are the precursors of a range of polymers (i.e. polyvinyl
chloride, polyethylene, polypropylene), solvents, surfactants, or anaesthetic agents. Little
research has been focused on the use of small pores in MDA. Although catalytic data has
been reported using SAPO-34 and H-SSZ-13 materials as the Mo support - both
comprising on CHA crystal structure,12,14 these publications record unalike product
selectivities (from 73 % to nearly no selectivity to benzene for SAPO-34 and H-SSZ-13
respectively) and no structural studies on the materials have been reported. The aim of
this chapter is to study the effect of zeolite pore size on MDA product distribution as well
as on Mo speciation. To this end the use of widely studied medium pore H-ZSM-5 with
MFI structure is compared with the small pore H-SSZ-13 with CHA structure.
a) MFI b) CHA
framework viewed along [010] framework viewed normal to [001]
framework viewed along [100] framework viewed along [010]
Figure 5-2. Illustration of MFI (a) and CHA (b) structures included in this work. Grey lines correspond
to framework bonds while the blue colour represent the channels and cavities. The channel and cage
dimensions are logged by black arrows.15

170
Figure 5-2 illustrates both type of zeolite frameworks where the channel systems
are represented in blue and the chemical bonds with grey lines. The MFI topology
comprises a three-dimensional arrangement with two 10-membered ring channel
systems:16,17 straight channels running parallel to [010] with pore diameter 5.3 x 5.5 Å
and interconnected to these, sinusoidal channels parallel to [100] of 5.1 x 5.4 Å diameter.
As such, the MFI structure presents no cages or cavities. The CHA framework also
presents a three-dimensional channel system;18 it is composed of 6-membered ring pores
arranged in an AABBCC sequence. This stacking comprises double 6-membered ring
units connected to ellipsoidal large cages of 6.7 x 10 Å which results in 8-membered ring
windows of 3.8 x 3.8 Å.
Taking into account the kinetic diameter of different molecules involved in MDA
(Table 5-1), methane could enter into CHA cavities and undergo reaction inside. The
pores are too small for aromatic molecules to diffuse through which is expected to result
in product selectivity to light hydrocarbons. Note that some of the kinetic diameters
presented in Table 5-1 are slightly larger than the pore diameters of zeolites seen to host
such molecules; aromatics (kinetic diameter = 5.85 Å) are known to diffuse through MFI
materials with reported pore diameters of 5.6 x 5.3 Å whilst C2-C3 hydrocarbons (kinetic
diameter = 4.2-4.5 Å) diffuse through CHA containing 3.8 Å pores. It is important to bear
in mind here that the reported pore diameters are only approximations obtained for empty
zeolites without guest molecules within the pores. In reality this values can vary, the
zeolite frameworks are flexible and if small molecules are present inside, the channel
system can expand or deform according to the shape of the occluded molecule.19,20
Table 5-1. Kinetic diameters of various reactant and product gas molecules involved in the MDA
process.21,22
Molecule CH4 H2 C2H6 C2H4 C3H6 C6H6 C7H10
Kinetic diameter (Å) 3.80 2.89 4.44 4.44 4.50 5.85 5.85
It must be taken into account that the cages in the CHA structure are large enough
to host benzene and toluene. Upon formation of aromatics in the cages, these molecules
could get trapped and accumulate resulting in carbon deposit formation leading to pore
blockage. Deactivation by coke accumulation has been proposed as the main obstacle in
the MDA process by many authors; yet, the deactivation by carbon deposition is still
unclear and some publications suggest most of these deposits form on the outer surface

171
of the zeolite rather than inside the pores.13,23,24 On the other hand, groups that
investigated MCM-22 zeolite for dehydroaromatisation report that the longer catalyst
lifetime obtained with this zeolite is in fact due to its large cage system; they propose that
the cages preferentially accommodate carbon deposits leaving the rest of pore and channel
system free for molecule circulation.11,25,26
In addition to the shape selectivity and coke accumulation, the zeolite topology can
influence the performance of heterogeneous catalysts in other ways. It has been suggested
that zeolites with relatively large cages but small windows – as it is the case of CHA –
could restrict the sintering of supported metal clusters. Under reaction conditions growing
metal particles can become entrapped: once the size of the particle exceeds the diameter
of the cage window, particle migration is impossible and further sintering prevented.27,28
In previous chapters we have proposed a mechanism in which MoxCy sinters into growing
clusters which eventually migrate to the outer surface of the zeolite crystals; this process
results in loss of zeolite shape selectivity and increase in the rate of coke formation. In
this regard, it is of interest to study the effect of CHA topology on the Mo speciation.
Another advantage of the use of small pore zeolites is that they have shown higher
thermal stability.29 This is an advantage for MDA which is thermodynamically
spontaneous at temperatures > 650 °C. Besides, catalytic performance and CH4
conversion could be enhanced by the use of higher reaction temperatures. In this line the
study of pure siliceous CHA zeolite as the support is also of interest. Purely siliceous
frameworks are usually more stable as they do not undergo dealumination processes that
may lead partial framework collapse.
Hence, this chapter details the studies performed on small pore Mo/H-SSZ-13
catalyst for MDA juxtaposed to medium pore Mo/H-ZSM-5 presented in previous
chapters. Fluoride media synthesis of H-SSZ-13 was successfully carried out to prepare
the zeolite with Si/Al = 15 as well as the pure siliceous analogue. Structural and activity
proprieties of 4 wt. % Mo/H-SSZ-13 prepared with solid state ion exchange were
investigated. Subsequently, the carbon deposits formed during MDA reaction were
characterised while their role in catalyst deactivation was studied by measuring methane
diffusion on catalysts reacted for increasing times on stream (i.e. 7 min, 25 min and 60
min). XAS experiments were also carried out to account for the differences in Mo
speciation between small pore and medium pore zeolites. Additionally, reaction-

172
reactivation cycles where performed under operando XAS to evaluate catalyst
regeneration as well as to study the impact of temperature on Mo speciation.
5.2 Materials and methods
5.2.1 Synthesis
H-SSZ-13 Zeolite with Si/Al ~ 15 was prepared in fluoride media following the
hydrothermal synthetic procedure reported elswhere.30–32 Trimethyl-1-adamantamonium
hydroxide (TMAdaOH) was used as the structure directing agent and the synthesis gel
stoichiometry for the hydrothermal treatment was: SiO2 : 0.033 Al2O3 : 0.50 TMAdaOH
: 0.50 HF : 3 H2O. The preparation was carried out by stirring a mixture of 1.28 g of
aluminium isopropoxide (98 %, Acros Organics), 19.50 g of TEOS (99 %, Sigma Aldrich)
and 42.67 g of TMAdaOH (25 % in water, Sachem) at room temperature until enough
water was evaporated to reach the desired stoichiometry. This evaporation process took
~ 2 days. Due to the thick consistency of the gel at the final stage of water evaporation,
manual stirring was required to obtain a homogeneous gel. Once the desired
stoichiometry was achieved, the precursor gel comprised a dry mixture. This dry mixture
was crushed down to a fine powder by the use of a mortar. 2.06 g of HF (48 %, Sigma
Aldrich) where added to the powder and the resulting mixture was manually stirred until
a homogeneous thick paste was obtained (~ 40 min). The gel was then placed in a Teflon-
lined stainless steel Parr autoclave and heated at 150 °C for 6 days in a static oven. The
product was recovered by vacuum filtration, washed with deionised water, and dried
overnight at 60 °C. The resulting sample was calcined in air with the following
temperature program: 1 °C/min ramp to 120 °C, held for 2.5 h; 2 °C/min ramp to 350 °C,
held for 3 h; 1 °C/min ramp to 580 °C, held 3 h. The synthesis resulted in ~ 4 g of zeolite.
This zeolite, with Si/Al = 15, is denoted in this chapter as simply H-SSZ-13.
The pure siliceous SSZ-13 zeolite was synthesised using the same procedure but
without the addition of aluminium isopropoxide to the synthetic gel. This zeolite is coded
as SSZ-13-Si.
Mo/CHA catalysts were prepared as described in previous chapters. MoO3 (Sigma
Aldrich, 99.95%) powder was mixed with the zeolites in an agate mortar for 0.5 h. The
samples were then calcined in air at 700 °C for 30 min using a ramp of 5 °C/min. The

173
calcined samples will be denoted as Mo/H-SSZ-13 and Mo/SSZ-13-Si in accordance to
the support used.
5.2.2 Characterisation methods
X-ray diffraction patterns were recorded using a Rigaku SmartLab X-Ray
Diffractometer fitted with a hemispherical analyser. The measurements were performed
using Cu Kα radiation source (λ = 1.5406 Å) with a voltage of 40 kV, and a current of 30
mA. The patterns obtained were compared to crystallographic data in the reference library
(ICSD database).
UV-Vis spectroscopy reflectance measurements were carried out in an UV-2600
Shimadzu spectrometer, using a light spot of 2 mm. The reflectance data was acquired
from 200 to 800 nm which was transformed into absorbance versus wavelength by
applying the Kubelka-Munk equation.26 BaSO4 was used as white standard to remove
background.
Elemental analysis of the catalysts was carried out by inductively coupled plasma
optical emission spectroscopy using a Perkin Elmer Optical Emission Spectrometer
Optima 3300 RL. These measurements were performed by the analytical department in
Johnson Matthey Technology Centre (Sonning Common).
Nitrogen physisorption measurements were performed at 77.3 K on a Quadrasorb
EVO QDS-30 instrument. Around 150 mg of sample was outgassed at 623 K overnight
under high vacuum prior to the sorption measurements. The Brunauer–Emmett–Teller
(BET) equation was used to calculate the specific surface area in the pressure range p/p0
= 0.0006−0.01. The micropore volume was calculated from the t-plot curve using the
thickness range between 3.5 and 5.4 Å.
Thermogravimetric analysis of the reacted catalysts was carried out to quantify
the mass of carbon deposits. The measurements were carried out in a TA Q50 instrument,
all samples were heated up to 950 °C using a temperature ramp of 5 °C/min under an air
flow of 60 mL/min and held at 950 °C for 5 min.
Fourier-transform infrared spectroscopy spectra were recorded in a Nicolet iS10
spectrometer. Samples were pressed into self-supporting wafers with a density of ca. 10
mg/cm2. The wafers were dried prior the measurements by heating them up to 285 °C for

174
3 h under 70 ml/min He flow. After dehydration, the sample was cooled down to 150 °C
under dry He for the spectra collection.
Electron microscopy images were taken by the analytical department in Jonson
Matthey Technology Centre. Scanning electron microscopy analysis was done using a
Zeiss ultra 55 Field emission electron microscope. Compositional analysis and low-
resolution general imaging were carried out with accelerating voltage of 20 kV, 30-60
micron aperture and 7-8mm working distance. High-resolution were also taken with an
accelerating voltage of 1.6 kV, 20-30 micron aperture and 2-3 mm working distance. The
samples were also examined in the JEM 2800 (Scanning). Transmission electron
microscopy measurements were performed at Johnson Matthey Technology Centre.
Voltage was 200 kV and the aperture was 70 and 40 µm. Bright-field imaging mode was
done using CCD high magnification, lattice resolution imaging mode was carried out
using CCD Dark-field (Z-contrast) imaging in scanning mode using an off-axis annular
detector. The secondary electron signal was acquired simultaneously with the other TEM
images providing topological information of the sample. Compositional analysis was
performed by X-ray emission detection in the scanning mode.
Kerr-gated Raman spectroscopy measurements were carried out in the Ultra setup
in the Central Laster Facility. To study the nature of carbonaceous deposits on reacted
catalysts. The measurements were carried out using 400 nm laser to excite the sample and
800 nm laser power to activate the CS2 Kerr gate. Toluene impregnated H-ZSM-5 was
used for calibration of detected signals.
Solid state nuclear magnetic resonance (SSNMR): spectra were acquired at a
static magnetic field strength of 9:4T (ν0(1H) = 400:16 MHz) on a Bruker Avance III
console using either a widebore Bruker 4mm BB/1H WVT MAS probe (27Al) or a
widebore Bruker 7mm BB/1H WVT MAS probe (29Si) and TopSpin 3.1 software. For
27Al, the probe was tuned to 104.27 MHz and the spectra referenced to yttrium aluminium
garnet, Y3Al5O12, at 0.0 ppm. For 29Si, the probe was tuned to 79.49 MHz and the spectra
referenced to kaolinite at -91.2 ppm. For 27Al, samples were stored overnight in a humid
environment, for 29Si, samples were dried overnight at 110 °C. Following the appropriate
pretreatment, powdered samples were packed into zirconia MAS rotors with Kel-F caps.
The rotors were spun using room-temperature purified compressed air.

175
5.2.3 Catalytic activity measurements
The catalyst qualitative activity was carried out by introducing 0.6 g of sieved
catalyst (150-425 µm sieved fractions) into a tubular quartz rector. The internal diameter
of the rector was 0.7 mm and catalyst bed length was 3 cm. The sample was fixed in the
isothermal zone of the oven by quartz wool. A total gas flow of 30 mL/min was fed by
means of mass flow controllers which results in a gas hour space velocity (GHSV) of
1500 h-1. The as-prepared physical mixtures (MoO3 + support grinded in a mortar) were
first activated under 20 % O2/He flow by heating up to 700 °C for 30 min using a
temperature ramp of 5 °C/min. After flowing pure Ar for 30 min to flush the O2 from the
lines, methane dehydroaromatisation was started by switching to a 50 % CH4/Ar flow.
Products were analysed by online mass spectrometer (OmniStar GSD 320O1). All the
MS data presented were normalised to the Ar signal.
Long catalytic tests of 10 h and quantitative product analysis were carried out under
the same reaction protocol and GHSV. 50 % CH4/N2 was used as the feed for MDA and
reaction products were analysed by online mass spectrometer (EcoSys-P portable
spectrometer) as well as by an online gas chromatograph (Varian CP-3800) equipped with
3 columns: Molsieve13 to separate light gases, Hayesep Q to separate light olefins and
Rtx-1 for column to separate aromatics. The first two columns were connected to a
thermal conductivity detector (TCD) and last one to a TCD and flame ionisation detectors.
Helium was used as the carried gas for the chromatograph and nitrogen was used as the
internal standard to calculate the total flow in the outlet. Total molar flows at the reactor
outlet and inlet were calculated as described in the methodology chapter (Chapter 2,
section 2.3.), further details regarding reaction setup and condition can be also found in
this section.
5.2.4 Synchrotron studies
X-ray absorption spectroscopy (XAS) studies were performed on B18 beamline at
Diamond Light Source35 at Harwell Campus, United Kingdom. Mo K-edge XAS spectra
of 4 wt. % Mo/H-SSZ-13 were collected under operando MDA conditions where online
mass spectrometry was used for to monitor gas evolution. The details of the experimental
setup, X-ray absorption data collection conditions and data processing were same as
described in Chapter 3: 40 mg of the as-prepared catalyst (sieve fractions: 0.425-0.150

176
mm) were placed in a 3 mm diameter quartz capillary and calcined at 700 ºC for 30 min
(20 % O2 in He and heating ramp of 5 ºC/min). After flushing with Ar for 15 min to
remove oxygen from the lines, 50 % CH4/Ar mixture was flowed and the MDA reaction
was carried out at 700 ºC for 90 min. The gas hour space velocity (GHSV) used was 3000
h-1.
In order to study the catalyst regeneration properties and the effect of reaction
temperature, XAS data was also collected MDA reaction – reactivation cycles at different
temperatures. Regeneration was carried out by flowing 20 % O2/He at high temperatures
for the burning-off of carbon deposits and the recovery of initial Mo-oxo species. The
cycles consisted off the following experimental sequence:
- Cycle 1, calc.: Calcination at 700 °C for 30 min.
- Cycle 1, MDA 650 °C: After the calcination step, the temperature was lowered to
650 °C and lines flushed with Ar for 15 min. Then the flowing gas was switched
to 50 % CH4/Ar for 2 h MDA.
- Cycle 2, calc.: The sample was regenerated by switching the flow to 20 % O2/He
for 10 min at 650 °C.
- Cycle 2, MDA 650 °C: CH4 flow was again applied for a second MDA reaction
cycle at 650 °C, for 70 min.
- Cycle 3, calc.: regeneration with O2 flow was carried out this time at 780 °C for
10 min.
- Cycle 3, MDA 780 °C: After Ar flush, methane was again passed through the
catalyst for the last MDA cycle at 780 °C.
5.2.5 Quasi elastic neutron scattering studies
Samples were dried overnight at 150 °C in copper-sealed steel tubes with CF
(conflat) flanges attached to a turbomolecular pump, before being sealed and cooled.
Thereafter they were transferred into indium-sealed aluminium sample holders that
provided annular spacing of 2 mm thickness and held approximately 3.5 g of sample in
an Ar-filled glovebox. These sample holders were fitted with a bellows valve so they
could be attached to suitable gas handling apparatus to allow controlling of the
atmosphere in the sample whilst positioned in the neutron beam. Neutron scattering data
were collected from the evacuated samples, then dosed at room temperature to 1 bar of

177
methane. A 1 L buffer volume was included to account for volumetric changes due to
temperature variation and to ensure saturation of the zeolite. Spectra were recorded on
the IRIS spectrometer at the STFC ISIS neutron and muon facility using the (002)
reflection of the pyrolytic graphite analyser. Temperature was controlled between 10 and
300 K with a helium closed-cycle refrigerator. Data reduction and analysis was done by
IRIS beamline scientist using a combination of Mantid36 and DAVE softwares.37
5.3 Results and discussion
5.3.1 Synthesis results for Mo/H-SSZ-13
The results for chemical analysis and textural properties of the parent zeolite, the
as-prepared catalyst and calcined 4 wt. % Mo/H-SSZ-13 catalyst are presented in Table
5-2. The sample composition resulted in a Si/Al of 14 whilst the Mo content before and
after calcination was ~ 3.8 wt. %. BET surface area and micropore volume values
obtained for H-SSZ-13 zeolite were 821.8 m2/g and 0.291 cm3/g respectively. As
expected for small pore zeolites, these values are higher than the ones obtained for
medium pore zeolites discussed in previous chapters.
Thermal treatment of the physical mixture lead to a 9.6 % decrease in the micropore
volume. As discussed in previous reports this could be explained by the migration of Mo
inside the zeolite pores upon calcination. Nevertheless, SEM and XRD results which will
be discussed later in this section, suggests partial collapse of the H-SSZ-13 zeolite during
the calcination step; this collapse could also contribute to the observed decrease in
micropore volume.
Table 5-2. Chemical analysis and textural properties of H-SSZ-13, MoO3 + H-SSZ-13 physical mixture
and calcined 4 wt. % Mo/H-SSZ-13
Sample Mo
(wt. %) Si/Mo Si/Al
SBET
(m2/g)
Vmicr
(cm3/g)
H-SSZ-13 / / 14.0 821.8 0.291
Mo/H-SSZ-13 3.87 31 14.0 743.2 0.267
178
Figure 5-3a shows the XRD patterns collected for the as-prepared and calcined
catalysts. Both samples present CHA topology diffraction peaks with the highest
intensities at 2 θ° of 9.589, 12.989, 20.780 and 30.924 corresponding to (100), (-110) (-
210) and (-311) reflections respectively.17 No other zeolite phases are present revealing
that the synthesis resulted in pure CHA phase. Similar to Mo/MFI catalysts studied in
previous chapters, MoO3 reflections (at 2 θ° angles of 12.774, 25.697 and 38.970) are
present in the as-prepared sample but disappear upon calcination at 700 °C; this suggests
loss of long range order and dispersion of molybdenum oxide.38,39 As shown in the inset,
a broad peak at 2 θ° values around 22 degrees - a characteristic of silica in amorphous
form40 - was observed after calcination. This could be indicative of partial zeolite collapse
as a consequence of the thermal treatment in the presence of MoO3.
Figure 5-3b shows the FTIR results in the OH stretching region of the parent zeolite
and the calcined Mo/H-SSZ-13. The band at 3733 cm-1 corresponds to the OH stretching
mode of isolated silanol groups located on the internal or external surface of the
zeolite.41,42 The component on the low-frequency tail of this band ~ 3710 cm-1 is attributed
to vicinal silanol groups.43 At lower frequencies, Brønsted acidic OH groups give rise to
a double band with one maximum at 3607 cm-1, denoted in the literature as the high
frequency (HF) band and a second maximum at ~ 3585 cm-1 known as the low frequency
(LF) band. It has been suggested that LF band represents the BAS sites not directly
exposed to the eight-ring windows of the CHA structure whilst the HF band would
correspond to the sites located in a highly exposed position on the eight-ring windows.41
The lack of a broad band around 3500 cm-1 indicates the absence of silanol defects in the
sample which is expected for zeolites synthesised in fluoride media. Decrease in HF and
LF absorption bands suggest interaction of Mo occupies both types of sites. However, the
partial dealumination of the zeolite observed by XRD must also contribute to the observed
intensity loss. The decrease of the bands at 3733 and 3710 cm-1 upon calcination of Mo/H-
SSZ-13 suggests that Mo also anchors on the framework silanol defects.

179
3750 3700 3650 3600 3550 3500
Absorb
ance (
a.u
.)
Wavenumber (cm-1)
H-SSZ-13
Mo/H-SSZ-13b)
Figure 5-3. XRD (a) and FTIR (b) data for the as-prepared and calcined 4 wt. % Mo/H-SSZ-13 catalysts.
High resolution SEM images taken for H-SSZ-13 based samples are presented in
Figure 5-4. The secondary electron images for the parent zeolite (Figure 5-4a and 5-4b
for low and high magnifications respectively) show ~ 10 µm crystals with cubic
morphology. In accordance with the XRD data no impurity phases can be observed. The
images taken for the Mo/H-SSZ-13 after calcination and solid-state ion exchange (Figure
5-4c) exhibit defects in the zeolite crystal as well as the presence of smaller particles
arising due to the mechanical destruction during the physical grinding step of the catalyst
synthesis. The secondary electron and the corresponding backscattered electron images
of the calcined sample (Figure 5-4d) suggest that, in addition to the mechanical
destruction, the zeolite also undergoes damage due to thermal treatment with MoO3.
Some of the zeolite crystals present pores up to 50 nm. Besides, in the backscattered
electron images, bright spots covering the zeolite surface can be seen; these correspond
to molybdenum-rich particles of a varying size with largest particles reaching 100 µm.
SEM-EDX elemental maps of Mo/H-ZSM-5 were performed to get insight regarding the
molybdenum distribution on the zeolite (Figure 5-4e). Importantly, the results suggest
that in spite of the presence of particles with high molybdenum concentration, the metal
is also well-distributed in the zeolite crystals.
10 15 20 25 30 35 40
*
*
*
* MoO3
Diffr
acte
d X
-ray inte
nsity (
a.u
.)
2 Theta (deg)
MoO3 + H-SSZ-13
Mo/H-SSZ-13
a)
*
14 16 18 20 22 24 26

180
a)
b)
c)
d)
e)
Figure 5-4. SEM images acquired for the parent zeolite at different magnifications (images a and b). 4
wt. % Mo/H-SSZ-13 after calcination in air (700 °C, 5 °C/min, 30 min): secondary electron image (c)
and secondary and backscattering electron images at different magnification (d). And SEM-EDX
elemental mapping results (e).

181
a)
b)
Figure 5-5. TEM microscopy images of 4 wt. % Mo/H-SSZ-13; a) high magnification lattice resolution
images at different magnifications and b) dark-field image with the corresponding EDX maps.

182
The samples were also studied by TEM and the results are shown in Figure 5-5.
Secondary electron and high magnification lattice resolution TEM images for calcined
Mo/H-SSZ-13 (Figure 5-5a) reveal that the molybdenum-rich particles present a regular
order of atoms/ions indicating they are crystalline. This crystal phase is not observed by
XRD, most probably because of the detection limit of the diffractometer to record minor
phases. The damaged zeolite presenting large pores shows no such lattice by TEM. This
could be attributed to the partial zeolite collapse and formation of amorphous SiO2 as
observed by XRD; nonetheless zeolites are prone to beam damage which renders it
difficult to draw clear conclusions.
TEM-EDX mapping performed for one of the large molybdenum particles on
CHA surface (Figure 5-5b) reveal that these particles comprise mainly Al and Mo
suggesting they consist of aluminium molybdate generated probably by extraction of
framework Al during the calcination step. The appendix includes more images of the
TEM-EDX analysis including EDX spectra taken at different regions of the crystal. The
images further corroborate the dispersion of Mo on the crystals in spite of the formation
of molybdenum rich particles.
Mo K-edge X-ray absorption spectra were collected for 4 wt. % Mo/H-SSZ-13
during in situ calcination of the as-prepared sample (20 % O2/He, 700 °C, 5 °C/min,
GHSV = 3000 h-1), the spectra evolution observed are very similar to the 4 wt. % Mo/H-
ZSM-5 data discussed previously in Chapter 3. As seen in Figure 5-6a, the near edge
features (XANES) at low temperatures resemble crystalline MoO3 with octahedral
coordination, the edge appears positioned at ~ 20015 keV (1s → 5p transition) and the
pre-edge peak at 20005 eV (1s → 4d quadrupole transition).44 At temperatures above 600
°C the increase in pre-edge intensity and loss of the post-edge features indicate a change
in the Mo symmetry to tetrahedral coordination.45 The Fourier transform of the extended
spectral fine structure (Figure 5-6b) show that the contribution from Mo atoms in the
second shell (signal at radial distances ~ 3.5 Å) vanishes upon calcination which suggests
dispersion of Mo and the predominant formation of isolated molybdenum species.
Regarding the nearest neighbours in the first coordination shell, the shoulder arising from
oxygen atoms at ~ 2.3 Å - typical for octahedral MoO3 - decreases with increasing
temperatures which is in agreement with the change to tetrahedral symmetry observed by
XANES. This changes in molybdenum local environment at high temperatures, are a

183
consequence of the sublimation and migration of MoO3 into zeolite pores undergoing
solid-state ion exchange at the zeolite BAS as seen in Chapter 3.
1 2 3 4
0.0
0.2
0.4
0.6
0.8
1.0
1.2
|(R
)| (
A-3
)Radial distance (Å)
20oC
468oC
544oC
681oC
700oC
700oC 30min
b)
20000 20050 20100 20150
0.0
0.5
1.0
1.5
2.0
2.5
Mo/H-SSZ-13 651oC
Mo/H-ZSM-5 650oC
Mo/H-SSZ-13 700oC
Mo/H-SZM-5 700oC
Mo/H-SSZ-13 501oC
Mo/H-ZSM-5 506oC
Norm
alis
ed inte
nsity (
a.u
.)
Energy (KeV)
Mo/H-SSZ-13 700oC 30 min
Mo/H-ZSM-5 700oC 30 min
c)
Figure 5-6. Mo K-edge X-ray absorption spectra collected during in situ calcination (20 % O2/He, 700
°C, 5°C/min, 30 min) of MoO3 and zeolite physical mixtures (4 wt. % Mo). a) XANES spectra of Mo/H-
SSZ-13, b) FT-EXAFS of Mo/H-SSZ-13 and c) Comparison of Mo/H-SSZ-13 and Mo/H-ZSM-5
XANES features at different calcination temperatures.
Figure 5-6c compares the Mo K-edge XANES data collected during calcination of
4 wt. % Mo/H-SSZ-13 with the data collected for 4 wt. % Mo/H-ZSM-5 catalysts (from
chapters 3-4) as a benchmark material. The spectra suggest the solid-state ion exchange
process was slower when using small pore zeolite: already by 650 °C molybdenum
possesses tetrahedral coordination in H-ZSM-5 as characterised by an intense pre-edge
20000 20020 20040 20060 20080 20100 20120
-0.4
0.0
0.4
0.8
1.2
1.6
2.0
2.4
Norm
alis
ed inte
nsty
(a.u
.)
Energy (KeV)
700oC 30min
700oC
680oC
644oC
615oC
575oC
544oC
500oC
468oC
20oC
a)
20000 20020 20040 20060 200800.0
0.3
0.6
0.9
1.2

184
peak and a featureless post-edge (~ 100 eV above the edge). In contrast, the Mo/H-SSZ-
13 spectrum at a similar temperature possesses a lower pre-edge peak intensity and post-
edge features still closely resemble octahedral MoO3. Upon increasing the temperature,
more tetrahedral Mo6+ centres are observed, but only after 30 min hold at 700 °C did the
data for this sample match closely the spectra for calcined 4 wt. % Mo/H-ZSM-5. The
slower molybdenum evolution observed for H-SSZ-13 could be attributed to transport
limitations in the zeolite. The large crystals (~ 10 µm CHA vs 200 nm MFI) possess a
lower external surface for the metal to access the zeolite internal space; besides, the
smaller pore dimensions in CHA structure may also slow down the Mo diffusion and ion
exchange process.
As discussed earlier, formation of aluminium molybdate particles were observed
by SEM. However, molybdenum environment in aluminium molybdate and in Mo-oxo
species of Mo/zeolites is comparable. Thus, the XANES spectra of these two species is
too similar and their quantification by linear combination analysis is not possible.
5.3.2 Methane dehydroaromatisation over Mo/H-SSZ-13: evaluation of activity,
deactivation and evolution of Mo species
Catalytic results:
MDA reactions at 700 °C were carried out on 4 wt. % Mo/H-SSZ-13 using 50 %
CH4/Ar flow (GHSV = 1500 h-1). 10 h reaction was performed with quantitative activity
data obtained by means of an online gas chromatograph (GC). As each GC injection took
45 min, these measurements did not provide sufficient time resolution to analyse the
products in the induction period (usually completed in the first 10 min of reaction). In
order to follow catalyst activity during the early stages of reaction, mass trends of CH4
and reaction products were recorded by means of an online mass spectrometry (MS).
Figure 5-7a shows the MS results for the first 90 min of reaction where the induction
period and rapid material deactivation can be clearly observed. All the signals shown have
been normalised to the Ar carrier gas. As the MS signal intensity between the methane
and the different products was of several orders of magnitude, the masses have been
plotted on a logarithmic scale for comparison of the relevant mass trends on the same
graph. As observed in the plot, during the first 7 min under CH4 an induction period
similar to Mo/H-ZSM-5 occurs where combustion products (i.e. CO2, CO, H2O) are

185
detected as well as H2. After 7 min the combustion product evolution ceases and the
induction period gives way to the aromatisation stage with the detection of C2-C3, H2 and
aromatic products. Normalised C2-C3 signal intensities are comparable to the medium
pore Mo/H-ZSM-5 (MFI structure with Si/Al = 15) and Mo/S1-T (MFI structure, pure
siliceous) catalysts discussed in Chapter 4. Thus, the signals for m/z = 27 (with
contribution from C2Hx + C3Hx) are 1.94E-3 and 2.75E-3 for Mo/H-SSZ-13 and Mo/H-
ZSM-5 respectively at 90 min of reaction. Besides, as observed for medium pore zeolites,
these signal increases with increasing reaction time. Aromatics are also observed above
7 min of reaction in the small pore catalyst. Nevertheless, the aromatic detection is
noticeably weaker than for the medium pore catalysts: m/z = 78 signals are 2.31E-4 and
9.82E-3 for Mo/H-SSZ-13 and Mo/H-ZSM-5 respectively in their highest aromatics
evolution.
Considering that the kinetic diameter of benzene (5.85 Å) is significantly larger
than the H-SSZ-13 pore diameter (3.80 Å), one would expect Mo/H-SSZ-13 to give no
aromatics at all. The benzene and toluene observed at short reaction times could be
produced on Mo species located on the zeolite external surface where no space constrains
exist. As discussed previously, the presence of Mo on the outer surface of calcined Mo/H-
SSZ-13 was observed by high resolution SEM (Figure 5-4 and Figure 5-5). Additionally,
SEM also revealed the presence of large pores and defects on the calcined sample which
could provide cavities large enough for the formation and diffusion of aromatics.
Interestingly, initial benzene and toluene production decreases quickly after 20 min of
reaction. Likewise, the H2 signal also drops constantly with reaction time indicating rapid
catalyst deactivation.
Figure 5-7b shows the conversion and selectivity results derived from the GC data
collected for 10 h of reaction. The catalyst gives an initial CH4 conversion of 8.8 % which
drops fast to ~ 5 % in the first 3 hours of reaction; a steadier deactivation continues down
to 2.5 % conversion in the next 6 h. Interestingly, no aromatics are detected by GC. The
benzene signal observed by MS was very low and its production decreased quickly after
first 20 min of reaction. Probably, the time resolution of the GC did not allow the
detection of this early aromatic formation. Nonetheless, an increasing ethylene production
is observed with initial selectivity to C2H4 of 0.8 % which rises up to 2.7 % after 10 h of
reaction.

186
0 2 4 6 8 10
0
1
2
3
4
5
6
7
8
9
CH
4 C
onvers
ion (
%)
Time (h)
CH4 conversion
b)
0
1
2
3
4
5
C6H
6 selectivity
C2H
4 selectivity
Sele
ctivity (
%)
Figure 5-7. Activity results carried out for 4 wt. % Mo/H-SSZ-13 during MDA reaction at 700 °C with
GHSV = 1500 h-1: a) MS profiles of CH4 and reaction products for 90 min of reaction and b) conversion
and selectivity results obtained by GC during 10 h of reaction.
The lower selectivity to aromatics and ethylene for Mo/H-SSZ-13 in comparison to
medium pore catalysts (see values in Table 5-3) suggest the small pore sample is
susceptible to carbon deposition. In agreement, the TGA carried out for both materials

187
after 10 h of reaction indicated increased carbon deposit accumulation in Mo/H-SSZ-13:
8.6 and 6.3 wt. % from Mo/H-SSZ-13 and Mo/H-ZSM-5 respectively.
Table 5-3. CH4 conversion, product selectivity and carbon deposits mass values for 4 wt. % Mo/zeolites
during MDA reaction (700 °C, GHSV = 1500 h-1).
Sample CH4 conversiona
(%)
C6H6 selectivitya
(%)
C2H4 selectivityb
(%)
Carbon depositsb
TGA (wt. %)
Mo/H-ZSM-5 14.2 40.0 10.8 6.3
Mo/H-SSZ-13 8.8 0.0 2.7 8.6
a CH4 conversion and C6H6 selectivities correspond to their maximum values.
b C2H4 selectivity and TGA reported correspond to their higher values (10 h of reaction).
These activity results suggest that aromatic formation is suppressed with Mo/H-
SSZ-13; however, selectivity to light hydrocarbons is not enhanced and the catalyst shows
a greater amount of carbon deposition and faster catalyst deactivation. In previous
chapters it was proposed that in case of medium pore zeolites the sintering of Mo-carbides
was the ultimate cause of catalyst deactivation. These active species migrate to the zeolite
outer surface under MDA conditions resulting in the loss of zeolite pore shape selectivity
and in the formation of bulky carbonaceous deposits. For Mo/H-SSZ-13 additional factors
can be contributing to the fast deactivation:
1) Zeolite instability: characterisation carried out on calcined Mo/H-SSZ-13
evidence the zeolite is unstable at high temperatures in the presence of
molybdenum leading to partial framework collapse. Further loss of zeolite
crystallinity and surface area during MDA could contribute to a faster
deactivation.
2) The presence of aluminium molybdate on the zeolite outer surface as observed
by SEM: if this species evolves into active species under MDA conditions they
will show selectivity towards carbon deposits due to the lack of the of zeolite
shape selectivity. This would result in carbon deposition on the catalysts outer
surface and coverage of active sites.
3) The presence of large cages in the CHA structure: aromatics can be produced
and become entrapped in the cages. This would lead to carbon deposition inside
the zeolite channel system leading to pore blockage and fast catalyst fouling.

188
4) Differences in Mo speciation (i.e. local structure, oxidation state, size) that may
result in different perfomace.
The following sections are devoted to the study and characterisation of reacted
Mo/H-SSZ-13 to shed light into deactivation mechanism as well as to evaluate the impact
of the regeneration procedure.
Characterisation of reacted catalysts:
Taking into account the reaction profiles obtained by MS, structural characteristics
of the reacted catalyst were studied. To this end, the samples under MDA reaction were
quenched at the end of the induction period (7 min), in the maximum of aromatic
production (25 min), and at more advanced reaction times when deactivation commences
(60 min). In order to produce enough sample for characterisation these reactions where
performed in a larger reactor using 4 g of catalysts under same catalytic conditions (50 %
CH4/Ar, 700 °C, 1500 h-1). The catalytic data acquired for the big batch of sample is
included in the supporting appendix (Figure A5-1). Some of the characterisation was also
carried out for the 90 min and 10 h reacted sample (catalytic data shown in Figure 5-7
above).
Figure 5-8 shows the diffractograms of Mo/H-SSZ-13 reacted for 7, 25 and 60 min.
All diffraction patterns are consistent with the CHA crystal structure with highest
intensity reflections at 2 θ ° angles of 9.587, 12.999, 20.827 and 30.962 corresponding to
(100), (-110), (-210) and (-311) reflections respectively. The intensity of all reflections
remains comparable across all catalysts studied. No obvious shift in reflection position or
reflection broadening is seen to occur. Furthermore, the broad reflection at 2 θ ° value ~
22 appeared after calcination (as described in Figure 5-3a) remains unchanged during
reaction with methane. This suggests that during different stages of MDA reaction the
zeolite structure was maintained without being notably affected by zeolite dealumination,
or by the presence of carbon deposits. The absence of extra reflections suggests that there
is no evidence for significant quantities of crystalline Mo2C or Al2(MO4)3 being formed
during these early stages of reaction. No reflections corresponding to crystalline carbon
are observed either, it is likely however that carbon deposits present up to 60 min will be
amorphous or in concentrations below the powder XRD detection limit.

189
Figure 5-8. XRD patterns for 4 wt. % Mo/H-SSZ-13 catalysts reacted under MDA conditions for
different reaction times. Inset shows detail of the reflections at 2 ϴ° ~ 22.
Table 5-4 gathers the textural properties obtained by N2 physisorption for the
catalysts after different reaction times. Carbon deposit content calculated from TGA
curves (mass loss between 300 and 650 °C) are also included. The values of surface area
and micropore volume present a gradual decrease with time on stream which is consistent
with the carbon deposit build up observed by TGA. As no substantial changes were
observed in zeolite crystallinity by XRD, this drop in micropore volume indicates that
carbonaceous deposits start to either fill or cover the pores. From the data we cannot
conclude if the deposits accumulate inside the pores, on the outer surface or both.
Table 5-4. N2 physisorption and TGA results for Mo/H-SSZ-13 calcined and reacted at different times.
Sample SBET (m2/g) Vmicr (cm3/g) Carbon content (wt. %)
Mo/H-SSZ-13 calc. 743.2 0.267 0.00
Mo/H-SSZ-13 7 min 660.3 0.241 0.00
Mo/H-SSZ-13 25 min 647.6 / 0.80
Mo/H-SSZ13 60 min 626.9 0.230 1.84
Mo/H-SSZ-13 90 min 536.3 0.202 6.15

190
The derivative of the TGA curves at different reaction times for Mo/H-SSZ-13 are
presented in Figure 5-9a. For comparison, data for Mo/H-ZSM-5 (also with Si/Al = 15)
at the same reaction times are included as dotted lines.
Previous results in medium pore catalysts (see Chapter 4) show a gradual shift to
higher combustion temperatures with increasing reaction times which can be attributed to
the growth of a carbon deposit layer or particles. A similar trend is observed for Mo/H-
SSZ-13; however, the coke burning off temperature in each MDA stage is ~ 100 °C higher
than for Mo/H-ZSM-5 showing a maximum of combustion rate at 520 to 550 °C. This
difference in temperature could be caused by the location of carbon deposits. If part of
the coke accumulates in the zeolite internal volume, gas diffusion hindrance through small
pores may delay the coke combustion. Alternatively, Mo/H-SSZ-13 could lead the
formation of carbon deposits of a more stable nature. Hensen et al.46 for example
attributed burning off temperatures ~ 540 °C to the combustion of hard coke while mass
loss at lower temperatures was attributed to soft coke or carbon associated to Mo2C.
The carbon deposits on spent catalysts were further studied by Kerr-gated Raman
(Figure 5-9b). All the spectra present three distinct bands typical for carbon compounds:
1) D4 band at 1200 cm-1 ascribed to either sp2−sp3 hybridised C−C and C=C stretching
vibrations of polyenes,47 2) D1 band around 1360 cm-1 attributed to in-plane breathing
vibrations of sp2-bonded carbon, and 3) the G band at 1611 cm-1 corresponding to in-
plane stretching vibrations of pairs of sp2 C atoms. The position of the latter appears at
higher wavenumbers than usual (generally reported ~ 1580 cm-1) indicating a contribution
from a second D2 band (~ 1620 cm-1) attributed to edges of graphitic nanocrystallites.48,49
This suggests the presence of very small carbon crystallites with high number of
edges.49,50
Figure 5-9b also indicates the intensity ratio of D1 and G bands. As discussed in
the Kerr-gate Raman data presented in the previous chapter, this ratio gives insight
regarding the degree of order in the carbon structure;49,51 an increasing I(D)/I(G) ratio
indicates more structural disorder. Carbon deposits on Mo/H-SSZ-13 show a higher
degree of disorder compared to the medium pore catalyst. Apart from this ratio, no clear
evidence of differences in the nature of the coke species could be discerned from the
Raman spectra.

191
Figure 5-9. A) TGA and b) Kerr-gate Raman results for catalysts recovered after different MDA reaction
times. Solid line corresponds to Mo/H-SSZ-13 and dotted line to Mo/H-ZSM-5.
High resolution SEM images were taken to compare the small and medium pore
Mo/zeolites after 10 h of reaction (Figure 5-10a and 5-10b respectively). The
backscattered electron images present the H-SSZ-13 crystal surfaces covered with small
bright spots probably due to molybdenum carbide particles arising from the sintering of
isolated MoCx species during reaction. These particles seem to be smaller and more
abundant than for the reacted Mo/H-ZSM-5.
TEM imaging (Figure 5-11) enables a closer look at the samples; Mo/H-ZSM-5
shows Mo-rich particles with an average size of ~ 50 nm while Mo/H-SSZ-13 are covered
by smaller particles of ~ 3-5 nm. The TEM images allow to distinguish a carbon deposit
layer covering the Mo particles. Although no additional diffraction peaks are observed by
XRD, TEM images show these deposits to be crystalline (better appreciated in the larger
Mo particles of Mo/H-ZSM-5). Finally, Figure 5-11e and 5-11f present low magnification
TEM images and the corresponding EDX analysis of reacted Mo/H-SSZ-13 sample
revealing the presence of carbon nanotubes with a diameter of 120 nm and variable length
of several microns. Such nanotubes were not observed in other catalysts discussed in this
chapter, although Hensen et al. have previously reported small nanotubes (~ 20 nm) on
10 h reacted Mo/H-ZSM-5 catalysts.46

192
a) b)
Figure 5-10. High resolution images for Mo/H-ZSM-5 (a) and Mo/H-SSZ-13 (b) after 10 h of reaction.
Top image corresponds to secondary electron image and the bottom one to the backscattered electron
image.

193
Figure 5-11. TEM images at two different magnifications for Mo/H-ZSM-5 (a-b) and Mo/H-SSZ-13 (c-d)
reacted with methane for 10 h. 10 reacted Mo/H-SSZ-13 sample image with carbon nanotubes and an EDX
analysis map are also shown (e-f).

194
In short, the results above clarify that zeolite framework in Mo/H-SSZ-13 remains
mostly unchanged during MDA reaction and the progressive deactivation stages.
Evidence of Mo sintering was observed by electron microscopy while it is seen that
carbon deposition occurs to a larger extent than for medium pore zeolites. Furthermore,
the deposits are seen to be of a more thermally stable nature. From the characterisation
above alone it is difficult to discern between carbon deposition on the catalyst exterior
(as a result of Mo on the zeolite outer surface) and deposition inside the zeolite channels
(i.e. as a result of the presence of cages in CHA structure). In the following section
dynamics of methane inside the pores were studied as an attempt to discern between these
possible deactivation mechanisms.
Quasi elastic neutron scattering:
The location of carbon deposits can have a direct effect in the catalyst deactivation.
Zeolite pore cannel obstruction would hinder the diffusion of methane inside the pores.
The diffusion of the active molecules to the catalytic site plays a big part in its activity
and the product selectivity is often diffusion controlled. So as to get insight into the
blocking of the zeolite channels, methane dynamics inside the pores of reacted catalysts
is studied by quasi elastic neutron scattering.
Both medium pore Mo/H-ZSM-5 and small pore Mo/H-SSZ-13 catalysts are
investigated. As in previous sections, the reacted samples correspond to 7, 25 and 60 min
of MDA reaction. Figure 5-15a-b displays the data recorded for the samples before and
after methane loading at 27 °C summed across the 51 detectors (covering a range of 25-
160°). At the peak centre, there is virtually no difference in intensity between the methane
loaded catalysts and those without. However, for both materials, changes can be seen
between samples reacted for different times. This illustrates that there is more elastic
scatter with increased reaction time, which was attributed to the formation of coke
deposits. In the wings of the peak, there is an obvious discrepancy between the methane-
loaded samples and those without, demonstrating that the methane is mobile. However,
the level of coking does not seem to affect the mobility of the methane, as the wings of
the peaks from the loaded samples are closely matched.
Figure 5-12c-d displays the variation in the width of the Lorentzian function for the
coked samples at low Q. Mo/H-ZSM-5 was fitted to the Chudley-Elliott jump diffusion

195
model which has been previously been shown to be the mechanism of transport for
methane in H-ZSM-5 on the length scales probed by QENS.52,53 In case of Mo/H-SSZ-
13 the observed diffusion was too fast to be fitted to molecular diffusion models.
Figure 5-12. Quasielastic peak for reacted Mo/H-ZSM-5 (a) and Mo/H-SSZ-13 (b) samples summed across
all detectors, solid lines indicate the coked samples loaded with methane, dashed lines indicate them
without. And quasielastic peak width for methane adsorbed on Mo/H-ZSM-5 (c) and Mo/H-SSZ-13 (d)
where lines correspond to data fitting to the Chudley-Elliott model.
Thus, the results suggest that the motion of methane in small pore and medium pore
catalysts does not appear to be strongly affected by the carbon deposits present in
quantities as great as ~ 2 wt. % (TGA Table 5-4). The strength of scattering between the
samples suggests that similar numbers of mobile scatterers are observed in the beam,
which points out that access to the pore network is not significantly retarded by the coke
deposits. Whilst it is possible that there is coke that alters diffusion over longer distances,
the results suggest that the reactant is free to access and diffuse along the zeolite channels.
Catalyst deactivation observed in the first hour of reaction may be then resulting from

196
other factors such as the nature/stability of active Mo centres or by their deactivation
through coverage with carbon deposits.
In future it will be of interest to study catalysts with higher carbon deposit content
to infer at what reaction methane diffusion starts to be affected. In addition, diffusion
measurements of not only the reactant but also of the MDA reaction products such (i.e.
C2H4 and C3H8) would provide a more complete picture on the impact of carbon deposits
on molecular diffusion and catalyst deactivation.
Operando XAS study: Mo evolution under catalyst conditions and evaluation of material
regeneration:
The Mo evolution during MDA reaction with 4 wt. % Mo/H-SSZ-13 was followed
by operando XAS. For comparison purposes, a first experiment was carried out using the
same conditions as for 4 wt. % Mo/H-ZSM-5 in Chapter 3: after 30 min of calcination in
air at 700 °C (20 % O2/He, with a temperature ramp of 5 °C/min) MDA was performed
by flowing 50 % CH4/Ar at 700 °C for 90 min (GHSV = 3000 h-1). XAS spectra was
continuously collected while reaction products were recorded by online mass
spectrometry.
Figure 5-13. Mass traces recorded by MS for Mo/H-SSZ-13 during the MDA (700 °C, 50 % CH4/Ar,
3000 h-1) in operando XAS experiment.
0 10 20 30 40 50 60 70 80 90
1E-4
1E-3
0.01
0.1
1
10
Nor
mal
ised
mas
s si
gnal
(a.
u.)
Time (min)
H2 (m/z=2)
CH4 (m/z=15)
H2O (m/z=18)
C2Hx (m/z=25)
C2Hx/C3Hx (m/z=27)
CO/CO2
C3H8/C3Hx (m/z=28)
CO2/C3H8 (m/z=44)
C6H6 (m/z=78)
C7H8 (m/z=91)
CH H
H2
O
C6H
C2H
x+C
3H
CO
CO
C2H
C7H

197
The MS data for Mo/H-SSZ-13 collected is shown in Figure 5-13. Due to technical
constraints derived from the use of a microreactor, the GHSV was higher than in previous
catalytic results presented in 5.3.1.2. Besides, the outlet flow had to be diluted with air
before reaching the MS (see methodology section) and as a consequence the signal
intensities are lower. The fast Mo reduction - 3 min as observed by EXAFS - makes it
difficult to resolve between the induction period and the aromatisation stages.
Nonetheless, the mass trace measurements verify that the MDA reaction was successfully
performed confirming that species observed by XAS correspond to Mo centres present
under catalyst working conditions. Initial evolution of combustion products (i.e. H2O,
CO2 and CO) reveal carburisation of Mo-oxo species by CH4 whereas the later aromatic
and H2 formation indicate that dehydroaromatisation takes place. Gradual C2Hx (m/z =
25) increase was also detected as observed in previous MDA activity studies.
Mo K-edge XANES spectra in
Figure 5-14a shows that during MDA at 700 °C Mo evolution on H-SSZ-13 is
similar to the Mo/H-ZSM-5 catalyst discussed in Chapter 3. In the first 3 minutes under
methane the pre-edge peak intensity decreases and the absorption edge shifts to lower
energies confirming reduction of the initial tetrahedral Mo sites into MoxCy species.
For a better comparison of the Mo species, spectra of small and medium pore
samples before and after reaction are compared with compound reference spectra.
Calcined samples show similar near edge and fine structure features (
Figure 5-14b and 14c) which were comparable to Al2Mo3O12 reference containing
isolated tetrahedral MoO4 units. According to previous reports, these species on the
zeolites would correspond to ion exchanged Mo-oxo centres in tetrahedral environment
(see Chapter 3). Note however that a variety of Mo sites are expected to be formed for
Mo/H-SSZ-13 as we have observed that upon thermal treatment in air partial zeolite
dealumination occurs leading to the formation of aluminium molybdate particles and
amorphous silica. As ion exchanged Mo-oxo species show similar local structure to
Al2Mo3O12 the quantification of these species is not viable by XAS.

198
20000 20020 20040 20060 20080 20100
No
rma
lise
d in
ten
sity (
a.u
.)
Energy (eV)
90 min
48 min
23 min
22 min
18 min
17 min
13 min
12 min
12 min
8 min
7 min
3 min
2 min
calc.
a)
4 6 8 10
-1
0
1
2
3
4
5
6
k2
(k)(
A-2
)
Wavenumber (Å-1)
Mo/H-SSZ-13 calc.
Mo/H-ZSM-5 calc.
Al2Mo
3O
12
c)
4 6 8 10
0.0
0.5
1.0
1.5
2.0
2.5
3.0
k2
(k)(
A-2
)
Wavenumber (Å-1)
Mo
Mo/H-SSZ-13-5 MDA
Mo/H-ZSM-5 MDA
Mo2C
d)
Figure 5-14. Mo K-edge XAS spectra showing: a) XANES of Mo/H-SSZ-13 during MDA reaction at 700
°C, b) XANES for calcined and reacted Mo/zeolites compared to Al2Mo3O12 and Mo2C references, c)
EXAFS of calcined Mo/zeolite compared to Al2Mo3O12 and d) EXAFS of Mo/zeolites compared to Mo2C
and metallic Mo.
After 90 min of reaction, both samples show XANES spectra similar to Mo2C,
however slight differences in the spectral shape - i.e. the more intense white line in the
small pore zeolite as observed in
Figure 5-14b inset - suggest differences in speciation. EXAFS spectra (
19950 20000 20050 20100 20150
Mo/H-SSZ-13
Mo/H-ZSM-5
Al2Mo
3O
12N
orm
alis
ed
in
ten
sity (
a.u
.)
Energy (eV)
Mo/H-SSZ-13
Mo/H-ZSM-5
Mo2C
90 min MDA
Calcined
b)

199
Figure 5-14e) provide further insights: the two samples exhibit oscillations
comparable to Mo2C but Mo/H-SSZ-13 present additional features which coincide with
metallic Mo (highlighted in
Figure 5-14e by vertical lines). These results suggest that part of Mo centres on H-
SSZ-13 undergo full reduction (to Mo0) under MDA conditions. Interestingly, it has been
reported that supported Mo metal nanoparticles are active for transforming methane into
carbon nanotubes at ≥ 700 °C.54,55 Furthermore, recent studies suggest that fully reduced
metals show higher activity than oxides for the formation of carbon nanotubes.56 The
presence of metallic Mo on Mo/H-SSZ-13 could thus affect the formation of carbon
nanotubes observed by SEM.
Reaction-reactivation cycles were also carried out for 4 wt. % Mo/H-SSZ-13 to
study the material regeneration properties as well as the Mo speciation at different
temperatures. The cycles consisted of an initial calcination at 700 °C in air (cycle 1, calc.)
followed by MDA at 650 °C (cycle 1, MDA 650°C). The catalyst was then regenerated
by burning of the coke with 20 % O2/He flow (cycle 2 calc.). After a second MDA
reaction at 650 °C (cycle 2, MDA 650 °C) and consequent regeneration (cycle 3, calc.)
the temperature was increased to 780 °C for a last MDA reaction (cycle 3, MDA 780 °C).
The experimental procedure is explained in more detail in the methodology of this chapter
(Section 5.2.4.).
Figure 5-15a and 5-15b below show the Mo K-edge XANES spectra evolution
under CH4 for cycles 1 and 3, carried out at 650 and 780 °C respectively. The pre-edge
peak disappearance and shift of the absorption edge to lower energies indicates reduction
of initial Mo-oxo species into MoxCy. The results show that, as expected, at lower
temperature this transformation into fully carburised Mo takes longer. The pre-edge
disappearance takes ~ 16 min at 650 °C whilst at 780 °C only 5 min are required.
The XANES after each calcination and MDA reaction step are shown in Figure
5-15c. All the spectra after oxygen treatment are identical suggesting Mo-oxo species are
successfully regenerated in the reactivation cycles. Regarding the samples after reaction,
the spectra after the third MDA cycle at 780 °C shows an absorption edge at lower
energies suggesting higher degree of Mo reduction after this cycle.

200
20000 20050 20100 20150
No
rma
lise
d in
ten
sity (
a.u
.)
Energy (eV)
90 min
48 min
16 min
15 min
13 min
10 min
7 min
6 min
5 min
4 min
3 min
2 min
calc.
a)
20000 20050 20100 20150N
orm
alis
ed in
ten
sity (
a.u
.)Energy (eV)
70 min
45 min
15 min
13 min
12 min
10 min
9 min
6 min
5 min
3 min
2 min
calc.
b)
Figure 5-15. Mo K-edge XANES for Mo/H-SSZ-13: a) during the first MDA cycle at 650 °C, b) during the
third MDA cycle at 780 °C and c) at the end of each calcination (dotted lines) and MDA (solid lines) cycles.
The normalised MS traces at 70 min of MDA reaction in each one of the three
cycles (Figure 5-16) show a methane conversion decrease between the 1st and 2nd cycle
(both at 650 °C). The C2/C3 and C6H6 production is also lower in the second cycle. The
activity drop in the second cycle can be attributed to the decrease in number of active
sites due to Mo sublimation during the calcination step. This was evidenced by the
decrease in absorption edge step as discussed later in this section. Furthermore, we have

201
previously observed that thermal treatment of Mo/H-SSZ-13 in air results in partial
zeolite dealumination leading to the formation of aluminium molybdate particles and
amorphous silica. Further dealumination during the regeneration cycle can also be the
cause of loss in the catalyst activity
In comparison to the second cycle, the third MDA reaction carried out at 780 °C
shows improved CH4 conversion and formation of products. As expected for endothermic
processes such as MDA,57 the raise in reaction temperature leads to activity improvement
with temperature.
Figure 5-16. MS data results collected after 70 min of MDA during the three reaction-regeneration
cycles.
The Mo oxidation state during the two experiments described above (700 °C MDA,
and the reaction-regeneration cycles at 650 to 780 °C) were calculated by the position of
the absorption edge at half-step height. This analysis was carried out following the same
procedure as in Chapter 3 were the edge position and oxidation state correlation was
obtained by a linear fit using references with known oxidation states (MoO, MoO3 and
Mo2C). The results are gathered in Table 5-5 below which, for comparison, also contains
results for Mo/H-ZSM-5 from Chapter 3.
The oxidation state of Mo after calcination was ~ 6, in line with previous reports
and consistent with fully oxidised Mo-oxo species. Differences were observed in the
oxidation state of Mo after MDA cycles which go in line with the formation of metallic

202
Mo suggested by EXAFS features. The extent of Mo reduction at 70 min of reaction
increased with increasing MDA temperature giving oxidation states of 2.4, 2.1 and 1.8
for 650, 700 and 780 °C respectively.
Table 5-5. Oxidation state, Mo K-edge energies and edge step values for Mo/zeolites at 70 min of MDA
reaction for the different experiments.
Sample Stage of the cycle OE Edge
position Edge step
As-prepared 5.9 20014.6 /
Mo/H-ZSM-5 calcined 5.8 20014.2 /
MDA 700 °C 2.1 20007.4 /
As-prepared 5.9 20014.6 0.360
Mo/H-SSZ-13 calcined 5.8 20014.3 0.158
MDA 700 °C 2.1 20007.4 0.161
Mo/H-SSZ-13
As-prepared 5.8 20014.4 0.410
Cycle 1, calc 5.8 20014.5 0.194
Cycle 1, MDA 650 °C 2.4 20008.1 0.197
Cycle 2, calc 5.8 20014.3 0.180
Cycle 2, MDA 650 °C 2.5 20008.2 0.178
Cycle 3, calc 5.8 20014.3 0.158
Cycle 3, MDA 780 °C 1.8 20006.9 0.157
Similar conclusions can be drawn from the FT-EXAFS for the different samples
and reaction cycles presented in Figure 5-17; FT-EXAFS for Mo2C and metallic Mo
references are also included. The peak ~ 2.0 Å arising in both, small and medium pore
catalysts, could correspond to scattering from neighbouring C as refined previously in
Chapter 3. Mo/H-ZSM-5 exhibits a second peak around 3.1 Å – consistent with nearest
Mo-Mo shell in Mo2C with reported Mo-Mo interatomic distance of 2.973 Å.
Nonetheless, Mo/H-SSZ-13 samples show a peak at shorter radial distances of around 2.7
Å; this could result from Mo neighbours in metallic Mo with known Mo-Mo distance of
2.726 Å.58 Comparison of FT-EXAFS for Mo/H-SSZ-13 at different MDA reaction
temperatures shows how the signal at ~ 2.7 Å increases with increasing temperature at
expenses of the peak at ~ 2.0 A suggesting transformation of initial Mo-oxo species into
fully reduced Mo.

203
1 2 3 4 5
0.0
0.2
0.4
0.6
0.8
1.0
|(R
)| (A-3) re
fere
nce
s
|(R
)| (
A-3
) sam
ple
s
Mo/H-ZSM-5 700 oC
Mo/H-SSZ-13 650 oC
Mo/H-SSZ-13 700 oC
Mo/H-SSZ-13 780 oC
Energy (eV)
0
1
2
3
4
5
6
7
8
9
10
Mo2C
Mo
Figure 5-17. Phase corrected Mo K-edge FT-EXAFS for: Mo and Mo2C references (top), Mo/H-ZSM-
5 after 70 min of MDA 700 °C (centre) and Mo/H-SSZ-13 after 70 min of MDA at 650, 700 and 780
°C (bottom).
Table 5-5 also lists the Mo absorption edge step values of Mo/H-SSZ-13 samples.
It shows a gradual step drop, especially after each calcination, suggesting that Mo
concentration in the sample (field of view) decreases. This can be explained by the low
sublimation temperature of Mo oxide species which start to be mobile at temperatures as
low as 500 °C.59 Thereby, Mo can easily sublimate during the oxidative conditions of the
regeneration steps and leave the sample with the gas flow. Consistently, a yellow deposit
was observed in the outlet end of the rector wall after each MDA experiment which could
correspond to MoO3 coming from sample and condensing in the cooler end of the reactor.
In short, the operando EXAFS experiments show that, in addition to the formation
of Mo-carbides, full reduction to metallic Mo also occurs in Mo/H-SSZ-13. This was not
observed in Mo/H-ZSM-5 or Mo/S1-T zeolites discussed in Chater 4. The presence of
metallic Mo may have an impact in the MDA product distribution and can explain the
formation of different carbon deposits in Mo/H-SSZ-13 (i.e. more stable deposits and
formation of nanotubes). Combustion of the coke and recovery of initial Mo-oxo species

204
is possible using oxidative flow at high temperatures, nonetheless, optimisation of
regeneration procedure would be required to prevent Mo sublimation.
5.3.3 Further studies on Mo/H-SSZ-13 system for MDA
Optimisation of Mo/H-SSZ-13 (Si/Al = 15) preparation:
Microscopy characterisation in previous sections indicate that MoO3 ion exchange
with CHA at 700 °C leads to the dispersion of Mo on the zeolite. However, the process
results in partial dealumination of H-SSZ-13, and the formation of large pores on the
zeolite as well as aluminium molybdate particles. As this would decrease the catalysts
shape selective properties, work has been carried out in order to prevent H-SSZ-13
damage during catalyst preparation. Recent publications report that dealumination of H-
ZSM-5 during solid state ion exchange with MoO3 can be reduced by adjusting the Mo
loading or using milder calcination programs.60 In views of their successful results similar
approach is applied here for Mo/H-SSZ-13 system.
In this section three Mo/H-SSZ-13 samples prepared by solid state ion exchange
are studied: a 4 wt. % Mo loaded catalyst calcined at 700 °C, 2 wt. % Mo catalyst calcined
at 700 °C, and 2 wt. % Mo one calcined at 550 °C. As at low temperatures the ion
exchange process is slow the calcination at 700 °C was carried out for 30 min whilst the
one at 550 °C was done for 6 h.
UV-Vis characterisation of the three samples (Figure 5-18) show absorption bands
between 200 and 400 nm corresponding to ligand to metal LMCT transitions
(O2− → Mo6+). The samples present similar spectra with two maximums around 212 and
247 nm. As discussed earlier, the region from 210 to 250 nm is typically assigned to
isolated tetrahedral species. 4 wt. % Mo/H-SSZ-13 calcined at 700 °C presents a shoulder
is noticeable at 270 nm. This may be arising due to Mo-O-Mo containing structures
usually appearing > 250 nm.

205
200 250 300 350 400
0
5
10
15
20
25
212
Kubelk
a-m
unk (
a.u
.)
Wavelenght (nm)
4Mo/H-SSZ-13 700oC
2Mo/H-SSZ-13 700oC
2Mo/H-SSZ-13 550oC247
Figure 5-18. UV-Vis spectra of calcined 4 wt. % Mo/H-SSZ-13 calcined at 700 °C, 2 wt. % Mo/H-SSZ-
13 calcined at 700 °C and 2 wt. % Mo/H-SSZ-13 calcined at 550 °C.
Figure 5-19 shows the secondary electron image (left) and backscattered electron
images (right) of the three samples. As expected, for the two catalysts calcined at 700 °C
the formation of macropores and aluminium molybdate particles (bright areas in the back-
scattered image) decreased when decreasing Mo loading from 4 to 2 wt. %. For the 2 wt.
% Mo/H-SSZ-13 calcined at 550 °C no crystal damage and almost no aluminium
molybdate particles were observed suggesting the milder thermal conditions decrease
zeolite damage during calcination. Nevertheless, a few non-exchanged MoO3 particles
could be observed scattered amongst the crystals of this third sample (Figure 5-20a).
Thus, SEM-EDX analysis was carried out to verify Mo is also present in the H-SSZ-13
crystals after calcination at 550 °C. Figure 5-20b shows the elemental map of a bunch of
zeolite crystals suggesting Mo is well dispersed in the zeolite. Spectra taken on individual
crystals (Figure 5-20c) also indicate Mo was successfully ion exchanged.

206
a) 4 wt. % Mo/H-SSZ-13, 700 °C
b) 2 wt. % Mo/H-SSZ-13, 700 °C
c) 2 wt. % Mo/H-SSZ-13, 550 °C
Figure 5-19. High resolution SEM images of a) 4 wt. %Mo/H-SSZ-13 calcined at 700 °C for 30 min; b) 2
wt. % Mo/H-SSZ-13 calcined at 700 °C for 30 min; and c) 2 wt. %Mo/H-SSZ-13 calcined at 550 °C for 6
h. Secondary electron images are on the left and backscattered electron images on the right.

207
a)
b)
c)
Figure 5-20. SEM-EDX analysis results for 2 wt. % Mo/H-SSZ-13 calcined at 550 °C for 6 h. a) Low
magnification SEM image, b) SEM-EDX chemical composition mapping; and c) SEM-EDX analysis on
two regions of a Mo/H-SSZ-13 crystal.

208
Solid state NMR experiments were also carried out to study the changes in the
zeolite structure during the calcination process. Thus, parent H-SSZ-13 was compared
with the two extremes: 4 wt. % Mo/H-SSZ-13 calcined at 700 °C showing extensive
damage by SEM, and the more stable 2 wt. % Mo/H-SSZ-13 calcined at 550 °C.
The local structure of aluminium species in zeolites was determined by 27Al MAS
NMR (Figure 5-21a). The resonance band at ~ 60 ppm is attributed to Al atoms in
tetrahedral coordination whilst the band ~ 0 ppm is typically assigned to the
extraframework Al in octahedral coordination.61,62 The 0 ppm peak intensity increase
relative to the 60 ppm signal evidences framework dealumination upon calcination of the
zeolite with MoO3. Dealumination was more pronounced in 4 wt. % Mo/H-SSZ-13
calcined at 700 °C. Both Mo/H-SSZ-13 samples show an additional peak at ~ 14 ppm
which some authors have attributed to polyoxometalate type structure comprising six
edge sharing MoO6 octahedra surrounding an AlO6 polyhedron.62 The peak at ~ -15 ppm
is only distinguishable in the sample calcined at 700 °C and is characteristic of
Al2(MoO4)3; the presence of this Mo species could be correlated with the large particles
observed by SEM on the surface of the H-SSZ-13 crystals of this catalyst.
80 60 40 20 0 -20 -40
-15 ppm
AlO4
Norm
alis
ed inte
nsity
Chemical shift (ppm)
4Mo/H-SSZ-13 700 oC
2Mo/H-SSZ-13 550 oC
H-SSZ-13
a)
AlO6
14 ppm
-95 -100 -105 -110 -115
Si(OSi)3(OAl)
Norm
alis
ed inte
nsity
H-SSZ-13
2Mo/H-SSZ-13 550 oC
4Mo/H-SSZ-13 700 oC
Chemical shift (ppm)
b) Si(OSi)4
Figure 5-21. Normalised 27Al (a) and 29Si solid state NMR spectra carried out for parent H-SSZ-13, Mo/H-
SSZ-13 (4 wt. % calcined at 700 °C and 2 wt. % calcined at 550 °C).

209
29Si MAS NMR spectra of the catalysts (Figure 5-21b) show three signals
corresponding to three different local environments for framework Si; these have been
observed and assigned by previous groups.63,64 The signal at -111.4 ppm is assigned to
Si(OSi)4 environment with a Si atom surrounded by other four Si atoms. The signal at -
105.7 ppm corresponds to a Si(OSi)3(OAl) showing one neighbouring Al atom. Finally,
the weak peak at -100.7 ppm can be ascribed to Si(OSi)3(OH) environment. The intensity
of Si(OSi)3(OAl) peak relative to the Si(OSi)4 is higher in the sample calcined at 550 °C.
In agreement with 27Al NMR, this suggest that the catalyst calcined under milder
conditions retains more Al in the framework.
Studies on pure silica SSZ-13 as the Mo support:
Further studies have been carried out to investigate catalytic properties of Mo
supported on pure siliceous chabazite zeolite (SSZ-13-Si). The synthesis of this zeolite
performed in fluoride media also results in cubic crystals of 10-25 µm as observed by
SEM (Figure 5-22).
a) b)
Figure 5-22. SEM images of pure silica SSZ-13 zeolite synthesised in fluoride media.
The XRD patterns of SSZ-13-Si presented in Figure 5-23 are comparable to H-SSZ-
13 with Si/Al = 15 and are consistent with CHA crystal structure with highest intensity
reflections at 2 θ° of 9.589, 13.007 and 20.864 corresponding to (100), (-110) and (-210)
reflections respectively17 (Figure 5-23). No additional phases can be observed and as
expected, at high 2 θ°, the pure Si zeolite shows a shift to higher angles in comparison to
the Al containing zeolite (see insets in Figure 5-22a).
50 µm 10 µm

210
Mo/SSZ-13-Si catalyst was synthesised analogous to previous catalysts aiming for
4 wt. % Mo content. The diffraction patterns for the as-prepared, calcined and 90 min
MDA reacted Mo/H-SSZ-13-Si are shown in Figure 5-23b. Peaks at 2 θ° angles of 25.697
and 27.3004, corresponding to MoO3 crystallites are observed in the as-prepared
catalysts. Unlike other Mo/zeolites presented in this thesis, the intensity of MoO3
reflections in Mo/SSZ-13-Si decrease upon calcination but do not vanish completely
which suggests Mo dispersion was not as successful (see inset in Figure 5-23b). Pure
siliceous H-SSZ-13 does not have any BAS, and as it was synthesised in fluoride media,
a low number of silanol defects are expected. This implies fewer sites for the anchoring
of Mo and may explain the lower degree of Mo dispersion in this sample.
Figure 5-23. XRD patterns for a) the parent SSZ-13 with and without aluminium, and b) as-prepared,
calcined and reacted Mo/SSZ-13-Si.
The chemical analysis (Table 5-6) of the samples indicate that around 50 % of Mo
is lost in the calcination process while some Mo also leaves the sample during reaction.
The SSZ-13-Si sample presents no Brønsted acidity, and as it was prepared in fluoride
media little silanol defects in the structure are expected. Compared with previously
studied systems the zeolite contains less anchoring points for the formation of Mo-oxo
species and it explains the sublimation of Mo during the calcination step.

211
Table 5-6. ICP and TGA analysis results for Mo/SSZ-13-Si catalysts.
Sample Mo ICP
(wt. %)
Carbon deposits
TGA (wt. %)
Mo/SSZ-13-Si as-prepared 3.88 /
Mo/SSZ-13-Si calcined 2.01 /
Mo/SSZ-13-Si 90 min reacted 1.79 0.47
Figure 5-24 show MS catalytic data during MDA reaction at 700 °C using 50 %
CH4/Ar gas flow and GHSV of 1500 h-1. Mo/SSZ-13-Si (solid lines) is compared with
Mo/SSZ-13 with Si/Al = 15 (dotted lines). Normalised signals for CH4 and combustion
products (i.e. CO, CO2 and H2O) observed in the induction period are shown in Figure
5-24a. The mass trends are similar for both samples with the evolution of CO and CO2
and some water occurring in the first 10 min of reaction. The higher CH4 signal intensity
for Mo/SSZ-13-Si suggests the lower conversion for this catalyst. Decreased evolution of
H2, CO and CO2 – which arise from the carburisation of Mo-oxo species into MoCx – is
also seen in Mo/SSZ-13-Si. This is consistent with the lower Mo content in pure siliceous
zeolite due to MoO3 sublimation during the temperature treatment. In the aromatisation
stage above 10 min of reaction, this catalyst also shows a lower production of C2-C3
molecules and C6H6. The total amount of carbon deposits accumulated over 90 min of
reaction was only 0.47 wt. % (Table 5-6) which was ~ 90 % lower than for the Al
containing polymorph over the same reaction time.
Figure 5-24. MS data collected for Mo/SSZ-13-Si (solid lines) and Mo/H-SSZ-13 with Si/Al = 15 (dotted
line) during MDA reaction at 700 °C, 1500 h-1, 50 % CH4/Ar: a) Mass traces for CH4 reactant and
combustion products from typical for the induction period; and b) mass traces for C2-C3 and benzene
products typical form the aromatisaton stage.

212
The activity results above reveal that the catalyst based on pure siliceous SSZ-13 is
less active for MDA than previously studied materials. This reduced activity goes in line
with the loss of active Mo centres during calcination steps and the poor dispersion of the
remaining MoO3.
Furthermore, after MDA experiments with Mo/SSZ-13-Si, the walls of the reactor
tube downstream appear completely covered by a dark deposit. The SEM-EDX elemental
analysis on these deposits (Figure 5-25) show they consists of mainly Mo giving further
confirmation of the Mo loss during calcination and the MDA process.
Figure 5-25. SEM-EDX analysis of the deposits accumulated on the reactor walls during MDA reaction
with Mo/SSZ-13-Si.
10 µm

213
5.4 Summary and conclusions
This chapter comprises synthesis, reaction, Mo speciation and deactivation studies
for Mo/H-SSZ-13 catalysts. As the work is extensive, the key results are summarised
below:
- Synthesis of small pore H-SSZ-13 zeolite (Si/Al = 15) with CHA topology was
carried out by hydrothermal method in fluoride media. Preparation of 4 wt. % Mo/H-
SSZ-13 catalyst by solid-state ion exchange results in the dispersion of Mo inside the
zeolite pores as observed by SEM/TEM-EDX mapping. But the temperature treatment
leads to a partial zeolite dealumination and formation of aluminium molybdate particles
on the zeolite surface. Also, holes and defects arise on the H-SSZ-13 surface as a result
of the calcination process with MoO3. The use of lower Mo loadings and milder
calcination temperatures (2 wt. % Mo and 550 °C) prevents zeolite dealumination and
damage whilst still providing good MoO3 dispersion.
- The activity studies show that 4 wt. % Mo/H-SSZ-13 present low selectivity to
benzene in comparison to the medium pore catalysts previously studied probably as a
result of CHA pore dimensions being too small for aromatic molecules. Nevertheless, the
selectivity to carbon deposits is high and deactivation faster than for Mo/H-ZSM-5.
- For better understanding the rapid deactivation of the catalyst, extensive
characterisation of reacted catalysts was performed. TGA reveal that carbon deposits
formed on small pore catalysts are probably more stable than in medium pores whilst
SEM images on long time reacted samples reveal formation of carbon nanotubes. QENS
experiments performed on spent Mo/H-SZM-5 and Mo/H-SSZ-13 indicate that methane
diffusion is not affected by the presence of coke up to 60 min of reaction. This suggests
the coke formed is located mainly at the exterior of the zeolite and that the deactivation
at this stage is not due to zeolite pore blockage. Microscopy images show that Mo
sintering and migration to the outer surface is not prevented by CHA topology as the
crystal surface appears completely covered by Mo particles.
- Evolution of Mo species investigated by XAS in operando MDA on 4 wt. %
Mo/H-SSZ-13. revealed that Mo undergoes similar evolution as in medium pore catalysts
studied in previous chapters. In contact with methane the Mo-oxo species present after
calcination are carburised to MoxCy species with oxidation state around +2. Interestingly,

214
EXAFS features suggest presence of metallic Mo in for Mo/H-SSZ-13 which may
contribute to the formation of carbon deposits of different nature.
- Some preliminary studies were carried out on the synthesis of pure siliceous SSZ-
13 and it use as the support for Mo. The synthesis results in lower Mo loadings upon
calcination (2 wt. %) and hence lower activity.
These results give the guidance for future work on MDA selectivity control. The
use of CHA topology results in lower aromatic formation. Nonetheless, the sintering and
migration of Mo to the outer surface was not prevented by the use of this topology; carbon
deposition in the outer surface seems again to be key factor in catalyst deactivation.
Alternative synthesis approaches may result more successful than the post synthesis
ion exchange for this application. Metal cluster encapsulation via direct hydrothermal
synthesis for example would enable to entrap clusters in the CHA cages during the
hydrothermal synthesis. Potentially this would keep active species in shape selective
environment preventing their migration and sintering. The synthetic approach has been
applied successfully for a range of catalysts.65,66
This approach could be applied also for pure siliceous zeolite as these frameworks
are more stable than Al containing ones. BAS associated to framework Al are traditionally
considered as the active sites for aromatisation in MDA. With the use of small pore
zeolites, we aim for increased selectivity to light olefins, thus, no BAS is required for this
application. Nonetheless, as discussed in Chapter 4, the presence of BAS for MDA is not
indispensable.
The results also encourage to further study the effect of Mo speciation to understand
if the extent of Mo reduction has an impact on the type of carbon deposits formed. This
knowledge would be valuable to improve catalyst lifetime as well as to facilitate material
regeneration.
5.5 References
1 P. B. Weisz and V. J. Frilette, J. Phys. Chem., 1960, 64, 382.
2 S. M. Csicsery, Stud. Surf. Sci. Catal., 1995, 94, 1–12.
3 E. G. Derouane, J. Catal., 1986, 100, 541–544.

215
4 T. F. Degnan, J. Catal., 2003, 216, 32–46.
5 J. Jae, G. A. Tompsett, A. J. Foster, K. D. Hammond, S. M. Auerbach, R. F. Lobo
and G. W. Huber, J. Catal., 2011, 279, 257–268.
6 S. Teketel, L. F. Lundegaard, W. Skistad, S. M. Chavan, U. Olsbye, K. P. Lillerud,
P. Beato and S. Svelle, J. Catal., 2015, 327, 22–32.
7 B. P. C. Hereijgers, F. Bleken, M. H. Nilsen, S. Svelle, K.-P. Lillerud, M. Bjørgen,
B. M. Weckhuysen and U. Olsbye, J. Catal., 2009, 264, 77–87.
8 C. R. Marcilly, Top. Catal., 2000, 13, 357–366.
9 A. Zecchina, S. Bordiga and E. Groppo, Selective Nanocatalysts and Nanoscience:
Concepts for Heterogeneous and Homogeneous Catalysis, Wiley-VCH Verlag
GmbH & Co. KGaA, Weinheim, Germany, 2011.
10 H. Liu, L. Su, H. Wang, W. Shen, X. Bao and Y. Xu, Appl. Catal. A Gen., 2002,
236, 263–280.
11 S. Ma, X. Guo, L. Zhao, S. Scott and X. Bao, J. Energy Chem., 2013, 22, 1–20.
12 C.-L. Zhang, S. Li, Y. Yuan, W.-X. Zhang, T.-H. Wu and L.-W. Lin, Catal. Letters,
1998, 56, 207–213.
13 E. V. Matus, I. Z. Ismagilov, O. B. Sukhova, V. I. Zaikovskii, L. T. Tsikoza, Z. R.
Ismagilov and J. A. Moulijn, Ind. Eng. Chem. Res., 2007, 46, 4063–4074.
14 N. Kosinov, F. J. A. G. Coumans, E. A. Uslamin, A. S. G. Wijpkema, B. Mezari
and E. J. M. Hensen, ACS Catal., 2017, 7, 520–529.
15 IZA-SC, Database Zeolite Struct., 2007, 5, 250–251.
16 D. H. Olson, G. T. Kokotailo and S. L. Lawton, J. Phys. Chem., 1981, 85, 2238–
2243.
17 MFI: Framework Type, http://europe.iza-structure.org/IZA-
SC/framework.php?STC=MFI, (accessed 1 November 2017).
18 B. M. Harding, M.M. and Kariuki, Acta Crystallogr., 1994, 34, 852–854.
19 R. F. Lobo, in Handbook of Zeolites Science and Technology, 2003, pp. 80–113.

216
20 B. Ili and S. G. Wettstein, Microporous Mesoporous Mater., 2017, 239, 221–234.
21 X. Duan, Y. He, Y. Cui, Y. Yang, R. Krishna, B. Chen and G. Qian, R. Soc. Chem.,
2014, 4, 23058–23063.
22 C. D. Baertsch, H. H. Funke, J. L. Falconer and R. D. Noble, J. Phys. Chem., 1996,
100, 7676–7679.
23 I. Lezcano-González, R. Oord, M. Rovezzi, P. Glatzel, S. W. Botchway, B. M.
Weckhuysen and A. M. Beale, Angew. Chemie - Int. Ed., 2016, 55, 5215–5219.
24 J. Shu, A. Adnot and B. P. A. Grandjean, Ind. Eng. Chem. Reseacrh, 1999, 38,
3860–3867.
25 D. Ma, Y. Shu, X. Han, X. Liu, Y. Xu and X. Bao, J. Phys. Chem., 2001, 105,
1786–1793.
26 J. Bai, S. Liu, S. Xie, L. Xu and L. Lin, Catal. Letters, 2004, 82, 279–286.
27 W. M. H. Sachtler, Transition Metal Clusters and Isolated Atoms in Zeolite Cages
Springer, Berlin, Heidelberg, 1990, pp. 69–85.
28 M. Fournier, C. Louis, M. Che, P. Chaquin and D. Masure, J. Catal., 1989, 119,
400–414.
29 P. G. Blakeman, E. M. Burkholder, H.-Y. Chen, J. E. Collier, J. M. Fedeyko, H.
Jobson and R. R. Rajaram, Catal. Today, 2014, 231, 56–63.
30 A. M. Beale, I. Lezcano-Gonzalez, W. A. Slawinksi and D. S. Wragg, Chem.
Commun., 2016, 52, 6170–6173.
31 M. Moliner, C. Franch, E. Palomares, M. Grill and A. Corma, Chem. Commun.
Chem. Commun, 2012, 48, 8264–8266.
32 M.-J. Díaz-Cabañas, P. A. Barrett and M. A. Camblor, Chem. Commun., 1998,
1881–1882.
33 M. Miyamoto, T. Nakatani, Y. Fujioka and K. Yogo, Microporous Mesoporous
Mater., 2015, 206, 67–74.
34 E. A. Eilertsen, B. Arstad, S. Svelle and K. P. Lillerud, Microporous Mesoporous
Mater., 2012, 153, 94–99.

217
35 A. J. Dent, G. Cibin, S. Ramos, A. D. Smith, S. M. Scott, L. Varandas, M. R.
Pearson, N. A. Krumpa, C. P. Jones and P. E. Robbins, J. Phys. Conf. Ser., 2009,
190, 012039.
36 O. Arnold, J. C. Bilheux, J. M. Borreguero, et al. Nucl. Instruments Methods Phys.
Res. A, 2014, 764, 156–166.
37 R. T. Azuah, L. R. Kneller, Y. Qiu, P. L. W. Tregenna-Piggott, C. M. Brown, J. R.
D. Copley and R. M. Dimeo, J. Res. Natl. Inst. Stand. Technol., 2009, 114, 341–
358.
38 D. Ma, Y. Shu, X. Bao and Y. Xu, J. Catal., 2000, 189, 314–325.
39 D. Wang, J. H. Lunsford and M. P. Rosynek, 1997, 358, 347–358.
40 S. Musić, N. Filipović-Vinceković and L. Sekovanić, Brazilian J. Chem. Eng.,
2011, 28, 89–94.
41 S. Bordiga, L. Regli, C. Lamberti, A. Zecchina, M. Bjørgen and K. P. Lillerud, J.
Phys. Chemisrty, 2005, 109, 7724–7732.
42 S. Bordiga, L. Regli, D. Cocina, C. Lamberti, M. Bjørgen and K. P. Lillerud, J.
Phys. Chem., 2005, 109, 2779–2784.
43 S. Bordiga, P. Ugliengo, A. Damin, C. Lamberti, G. Spoto, A. Zecchina, G. Spanò,
R. Buzzoni, L. Dalloro and F. Rivetti, Top. Catal., 2001, 15, 43-52.
44 W. Li, G. D. Meitzner, R. W. Borry and E. Iglesia, J. Catal., 2000, 191, 373–383.
45 S. E. Shadle, B. Hedman, K. Hodgson and E. I. Solomon, Inorg. Chem., 1994, 33,
4235–4244.
46 C. H. L. Tempelman and E. J. M. Hensen, Appl. Catal. B Environ., 2015, 176–177,
731–739.
47 B. Dippel, H. Janderb and J. Heintzenberga, Phys. Chem. Chem. Phys., 1999, 1,
4707–4712.
48 A. Sadezky, H. Muckenhuber, H. Grothe, R. Niessner and U. Pö Schl, Carbon,
2005, 43, 1731-1742.
49 A. C. Ferrari and J. Robertson, Phys. Rev. B, 2000, 61, 14095–14107.

218
50 J. Hoekstra, A. M. Beale, F. Soulimani, M. Versluijs-Helder, J. W. Geus and L. W.
Jenneskens, J. Phys. Chemsitry, 2015, 119, 10653–10661.
51 C. A. Johnson and K. M. Thomas, FUEL, 1984, 63, 1073–1080.
52 H. Jobic, M. Bée and G. J. Kearley, Zeolites, 1989, 9, 312–317.
53 H. Jobic, M. Bée, J. Caro, M. Bülow and J. Kärger, J. Chem. SOC. Faraday Trans.
I, 1989, 85, 4201–4209.
54 L. . Hoyos-Palacio, A. . García, J. . Pérez-Robles, J. González and H. . Martínez-
Tejada, IOP Conf. Ser. Mater. Sci. Eng., 2014, 59, 012005.
55 D. Yuan, L. Ding, H. Chu, Y. Feng, T. P. Mcnicholas and J. Liu, Nano Lett., 2008,
8, 2576–2579.
56 E. Teblum, Y. Gofer, C. L. Pint and G. D. Nessim, J. Phys. Chem. C, 2012, 116,
24522–24528.
57 L. Wang, L. Tao, M. Xie, G. Xu, J. Huang and Y. Xu, Catal. Letters, 1993, 21,
35–41.
58 R. E. Jette and F. Frank, J. Chem. Physiscs, 1935, 3, 605–616.
59 N. Fioquet, O. Bertrand and J. J. Heizmannt, Oxid. Met., 1992, 37, 253–280.
60 N. Kosinov, F. J. A. G. Coumans, G. Li, E. Uslamin, B. Mezari, A. S. G.
Wijpkema, E. A. Pidko and E. J. M. Hensen, J. Catal., 2017, 346, 125–133.
61 I. Lezcano-Gonzalez, U. Deka, H. E. Van Der Bij, P. Paalanen, B. Arstad, B. M.
Weckhuysen and A. M. Beale, Appl. Catal. B Environ., 2014, 154-155, 339–349.
62 G. Plazenet, E. Payen, J. Lynch and B. Rebours, J. Phys. Chem. B, 2002, 106,
7013–7028.
63 J. H. Yun and R. F. Lobo, Catal. Sci. Technol., 2015, 5, 264–273.
64 J. Klinowski, Chem. Rev., 1991, 91, 1459–1479.
65 D. Farrusseng and A. Tuel, New J. Chem. New J. Chem, 2016, 40, 3933–3949.
66 S. Goel, Z. Wu, S. I. Zones and E. Iglesia, J. Am. Chem. Soc., 2012, 134, 17688–
17695.

219
Chapter 6
Structure-Activity Studies in Fe/zeolites for
Methane Dehydroaromatisation and Selective
Catalytic Reduction of NO with NH3
This chapter is focused on the study of Fe/zeolites for both MDA and NH3-SCR
reactions with the main aim of investigating structure-activity relationships of different
Fe species.
It has been reported that single iron atoms embedded in an amorphous silica matrix
are able to convert methane into aromatics with little carbon deposit formation.1 This
could be a promising alternative to the rapidly deactivating Mo/zeolite catalysts for MDA
studied in previous chapters. Hence, part of the work presented here concentrates on the
synthesis of ~ 0.5 wt. % Fe/Silicalite-1 materials with highly dispersed Fe centres. The
structure of Fe species has been studied by UV-Vis and X-ray absorption spectroscopy
while the MDA activity has been tested.
Samples with similar Fe loading (~ 0.5 wt. %) but different nuclearity (i.e. isolated
species, clusters, large particles) have also been synthesised using H-ZSM-5, H-SSZ-13
(both with Si/Al = 15) as well as Silicalite-1 as the supports. These catalysts have been
studied for NH3-SCR by means of in situ HERFD-XANES and XES techniques which
allowed us to follow changes in iron coordination, oxidation state and geometry during
reaction.
6.1 Introduction
Fe/zeolites are active catalysts in many relevant reactions such as N2O
decomposition,2,3 selective catalytic reduction of NOx,4,5 methane oxidation6 and benzene
hydroxylation.7,8 They also show significant activity for the MDA reaction.9–11 As
depicted in Figure 6-1, Fe/zeolites can present many types of Fe species, some of which

220
are likely to be active and others likely to be silent from an adsorptive and catalytic point
of view, or active for side reactions. These species can be classified as: 1) isolated Fe
species that can be isomorphously substituted as part of the framework or grafted (extra-
framework) to the zeolite, 2) small Fe oligomers, and 3) iron oxide particles that can be
located either inside or outside the zeolite pores. The relative concentration of the Fe
species changes with the synthetic procedure, thermal treatments, support and Fe
loading.5,12,13 In spite of abundant studies, the exact structure of these species in Fe-
containing zeolites remains unclear.
Figure 6-1. Representation of the different iron species that can be present in Fe/zeolite catalysts
(adapted from reference 11).
In the case of the MDA reaction, most of the existing literature focuses on Mo/H-
ZSM-5 catalysts. Mo-based systems however, undergo rapid deactivation and their
commercialisation is far from imminent. Studies described in previous chapters point out
that the deactivation may be caused by the instability of the active MoxCy species and
their migration from the pores to the outer surface of the zeolite under reaction conditions.
These results motivate the search for alternative metals with C-C coupling activity such
as Fe that may be more stable for methane oligomerisation.

221
Early publications on Fe/zeolite for MDA catalysts present promising activity but no
systematic investigation regarding Fe speciation was reported.9,11,14 More recent work by
Guo et al. demonstrated that single Fe atoms embedded on amorphous silica (0.5 wt.%
Fe, surface area ~ 5 m2/g) are active for MDA.1 They report the formation of methyl
radicals as reaction intermediates giving ethylene as the main product (∼ 50 %) as well
as benzene (∼ 20 %) but with no carbon deposit formation. They attribute the absence of
carbon deposition to the isolated nature of Fe sites which prevents surface C-C coupling
and, hence, coke formation.
Inspired by Guo’s work, Veser et al. studied Fe/H-ZSM-5 catalysts containing
different Fe species.10 They concluded that isolated or well-dispersed Fe sites are more
active for MDA; however, the carbon deposit formation was not prevented for any of the
catalysts studied. They attribute the coke build up to secondary reactions on the BAS of
the H-ZSM-5 support.
Based on these publications we focus this MDA research on the synthesis of
Fe/Silicalite-1 zeolite aiming for well-dispersed isolated Fe species. As discussed in
previous chapters, Silicalite-1 is the pure silica analogue of the H-ZSM-5 zeolite. In
comparison to amorphous SiO2 it possesses much higher surface area (~ 450 m2/g),
besides the pore dimensions of these zeolites (Ø ~ 5.5 Å) are believed to provide shape
selectivity to aromatics in MDA.15,16 The absence of BAS in Silicalite-1 ensures no acid
centres activity; this will help to understand their role in the reaction as well as in coke
formation. While Veser et al. attribute coke formation in Fe/H-ZSM-5 to the presence of
BAS, our studies in Chapter 4 show that carbon deposition was not prevented in Mo
supported in non-acidic zeolites.
To achieve a high dispersion of Fe species on Silicalite-1, a similar approach to that
used in Chapter 4 was adopted (Scheme 6-1). First, silanol groups forming nests are
generated on the Silicalite-1 by treatment of the zeolite with ethylenediamine which
extracts framework Si (Scheme 6-1b). These nests are known to serve as tripodal grafting
sites for Fe3+.17 Upon impregnation with Fe precursor and subsequent calcination, iron
can anchor into the defects by condensation; this can result in isolated tetrahedral Fe
species substituting zeolite framework positions (Scheme 6-1c).

222
a) b) c)
Scheme 6-1. Representation of the synthesis approach followed for the preparation of Fe/Silicalite-1: a)
representation of framework SiO4, b) representation of silanol nest resulting from extraction of framework
Si, while c) represent example of Fe3+ on defective Silicalite-1.
To promote homogeneous Fe distribution on our Fe/Silicalite-1, a low iron loading
of 0.5 wt. % was chosen,12,18 and two different precursors, ammonium iron citrate and
iron nitrate, were also studied. The Fe speciation on the Silicalite-1 support was
determined by UV-vis and X-ray absorption spectroscopy. In addition, the MDA reaction
was also performed in order to investigate the activity of these catalysts.
Fe/zeolites have also been extensively studied for selective catalytic reduction of
NOx using ammonia as the reducing agent (NH3-SCR).5,18–20 This process is used to
convert the toxic NOx emissions into harmless N2 and H2O. Selective catalytic reduction
has been applied commercially for decades, it is usually employed on large boilers and in
diesel engines reducing > 70 % of the NOx emissions.21 The exhaust gas of diesel engines
contains nitrogen oxides mainly in the form of nitrogen monoxide, therefore, the basic or
standard reaction on SCR catalyst is:
4NO + 4NH3 + O2 → 4N2 + 6H2O Equation 6-1
Although much effort has been devoted to the investigation of Fe/zeolites, the active
Fe sites for the SCR reaction are still under debate and the relationship between structure
and activity is still unclear. This is in part due to the presence of many Fe species (i.e.
isolated species, oligomers or large particles) in the catalysts and the difficulties to
unequivocally characterise them.5 Thus isolated Fe cations, iron nanoclusters or binuclear
species have been proposed as the most active centres by different groups.22–26
Furthermore, it has been reported by Kröcher et al,27 that all iron species show some SCR
activity and that their NO conversion rates depend on the reaction temperature. Mainly
monomeric species are responsible for SCR < 300 °C, with increasing contributions of

223
dimeric and oligomeric species at higher temperatures and even of Fe2O3 particles above
500 °C.
No consensus has been achieved regarding the reaction mechanism over Fe/zeolites.
Many researchers support that NO adsorbs on Fe3+ where it is oxidised to form an
adsorbed NOx intermediate. This intermediate then reacts with NH4+ (adsorbed either on
Fe3+ or on zeolite’s BAS) forming ammonium nitrite (NH4NO2). Finally, NH4NO2
decomposes to nitrogen and water. Harold et al.28 propose that the reaction of NOx and
NH4+ takes place on Fe3+ sites with the subsequent desorption of N2 and H2O leaving a
free Fe2+ site. Tronconi et al.20 however, propose NO2 is first desorbed from iron leaving
an Fe2+ site, NO2 then reacts with NH4+
adsorbed in the BAS. An alternative mechanism
proposed by Brüeggemann et al.29 suggests that NH3 is first adsorbed on Fe3+ resulting in
an Fe2+-NH2 intermediate. NO reacts with Fe2+-NH2 yielding nitrogen, water and leaving
reduced Fe2+. In all these mechanisms, reoxidation of the Fe2+ to Fe3+ by O2 is considered
as the rate-determining step of SCR.
The role of BAS has also been widely debated. Some groups reported an increasing
NH3-SCR catalytic activity on Fe/zeolites with increasing acid site density.30–32 Therefore
it has been proposed that as NH3 is readily adsorbed on BAS, these acid sites act as a
reservoir of NH3 in the vicinity of the active Fe centres. This hypothesis was supported
by FTIR/TPD studies.33 Alternatively, BAS could also have a role in catalysing the
decomposition of ammonium nitrite, an intermediate of the NH3-SCR reaction.34
Contrary to these hypotheses recent studies suggest that acidity is not a decisive factor
for good NH3-SCR activity. Schwidder et al. obtained high activity with non-acidic
catalysts32 while TPD, FTIR and DRIFTS studies by Kröcher et al. suggest that acidic
sites are not required for activation of adsorbed NH3.35 They attribute the higher activity
in acidic zeolites to their role in iron dispersion into isolated species.
Catalyst improvement for better control of NOx emissions requires detailed
understanding of both the activity of different iron species and the reaction mechanism.
Recent work by Grunwaldt et al. attempted to gain insight into mechanism and studied
1.3 wt. % Fe/H-ZSM-5 sample by High Energy Resolution Fluorescence Detected X-ray
Absorption Near Edge Spectroscopy (HERFD-XANES) and X-ray Emission
Spectroscopy (XES) under in situ conditions.4 The detection of the X-ray absorption in
HERFD mode enhances the spectral features in the XANES regions which allowed them

224
to accurately analyse the pre-edge peak to investigate changes in oxidation state and
coordination under different gas flows. With Valence-to-core XES they could
discriminated between N and O ligands in the first coordination and proposed a
Langmuir-Hinshelwood mechanism where both NO and NH3 coordinate on a single Fe
site.
In the work presented in this chapter, 0.5 wt. % Fe/zeolites were prepared using
different supports (i.e. H-ZSM-5, Silicalite-1 and H-SSZ-13) and two precursors i.e.
ammonium iron citrate and iron nitrate. The syntheses lead to catalysts with different Fe
species distribution and different population of acid sites (i.e. with and without BAS).
The structure of Fe centres in these materials was studied by in situ HERFD-XANES by
exposing the catalysts to NO, NH3 and NH3-SCR conditions. Together with the
absorption spectra, XES were collected which can bring valuable information regarding
the Fe spin state or nature of ligands.
Table 6-1. Fe reference compounds used for XAS and HERFD-XANES/XES studies and their
properties. Fe, P, O, H and S atoms are represented in gold, purple, red, white and yellow respectively.
Fe2O3 FePO4.2H2O FePO4a FeSO4.7H2Oa
Fe3+ Oh distorted
interconnected
Fe3+ Oh
isolated
Fe3+ Td
Isolated
Fe2+ Oh
isolated
a References used for HERFD-XANES studies but not included in the XAS studies of Fe/Silicalite-1 catalysts.
For the study of Fe structures by XAS, HERFD-XANES and XES, the spectra of the
catalysts were compared to different, well-characterised iron reference compounds (see
Table 6-1 for summary of structural and chemical properties). Hence, FePO4 and
FePO4.2H2O were used as models for isolated Fe3+ structures; the former in tetrahedral
(Td) coordination and the latter with octahedral (Oh) coordination. FeSO4.7H2O reference
was chosen as a model for Fe2+ species in octahedral coordination. This reference

225
comprises also isolated FeO6 units. Fe2O3 was used as a reference for interconnected Fe3+
octahedral units (i.e. clusters or large particles).
6.2 Materials and methods
6.2.1 Synthesis:
Zeolite synthesis
ZSM-5 zeolite with MFI structure (Si/Al = 15) was purchased from Zeolyst
(CBV3024E) in its ammonium form. The proton form of the material was obtained by
calcination in static air at 550 °C for 6 hours using a temperature ramp of 2 °C/min.
The pure silica analogue of the ZSM-5 zeolite, also known as Silicalite-1, was
prepared by hydrothermal synthesis as described by Lobo et al.36 using
tetrapropylammonium hydroxide as the structure directing agent and
tetraethylorthosilicate as the Si precursor. In order to generate silanol nest defects in the
structure, Silicalite-1 was treated with ethylenediamine following the procedure reported
by Wang et al.37 The resulting defective Silicalite-1 is named as S1-T. More details about
this synthesis can be found in the methodology section of Chapter 4.
H-SSZ-13 with Si/Al = 15 was prepared by hydrothermal method in fluoride media
following previously reported methods.38–40 TMAdaOH was used as the structure
directing agent; aluminium isopropoxide and tetraethylorthosilicate were used as the Al
and Si precursors. The synthetic procedure was carried out using the following synthesis
gel stoichiometry: SiO2 : 0.033 Al2O3 : 0.50 TMAdaOH : 0.50 HF : 3 H2O. Further details
regarding this synthesis can be found in the methodology section of Chapter 5.
Fe/zeolite synthesis
Fe-containing zeolites with metal loadings ~ 0.5 wt. % were prepared by incipient
wetness impregnation using either ferric nitrate or ammonium iron citrate as the
precursor. One Fe/Silicalite-1 was prepared using ferric nitrate and calcined in air at 500
°C (5 ℃/min temperature ramp).41 Fe(NO3)3.9H2O tends to precipitate as FeO(OH) in
solution promoting formation of iron oxide particles on the resulting catalyst.12 Hence,
synthesis using ammonium ferric citrate with calcination at 800 °C was also performed.
This synthesis procedure was chosen in view of reports indicating a better Fe dispersion

226
for precursors with chelating ligands (i.e. citrate, oxalate, acetylacetonate).42 The higher
temperature was used to promote dispersion of isolated species.43
Medium pore Fe/H-ZSM-5 (pore Ø = 5.5 Å)44 and small pore Fe/H-SSZ-13 (Ø = 3.8
Å)44 with 0.5 wt. % Fe loading were also prepared following this latter procedure. The
use of small pore H-SSZ-13 zeolite with pore opening smaller than the Fe citrate complex
(5.5 x 7.6 Å)45 will prevent the dispersion of Fe precursor into pores favouring the
formation of Fe2O3 compounds on the outer surface. Thus, the use of different precursors
and supports allow for engineering different Fe species which will be then characterised
and studied for catalytic activity studies.
For the syntheses, ~ 2 g of zeolite was placed into a two-neck round-bottomed flask
equipped with a heating mantle and a magnetic stirrer. One of the necks was connected
to a vacuum pump through a greased ground glass tap; the other neck was closed with a
rubber septum stopper. The zeolite was then dried under vacuum at 200 °C for 24 h. It
was then cooled down to room temperature and the flask was isolated from the vacuum
pump by closing the tap. With continuous stirring of the zeolite, an aqueous solution with
the desired Fe precursor (i.e Fe(NO3)3.9H2O (Sigma Aldrich, 99.95 %) or
C6H8O7·xFe3+·yNH3 (Sigma Aldrich, 16.5-18.5% Fe,)), was added dropwise with a
syringe through the septum. The volume of solution added was the same as the pore
volume of the zeolite; the Fe concentration of the solution was adjusted for 0.5 wt. % Fe
loading in the catalyst. After the impregnation, the mixture was stirred for 1 h to ensure
homogeneity. Finally, the flask was opened to the atmosphere, dried overnight at 60 °C
and calcined at 500 or 800 °C for 3 h (temperature ramp 5 °C/min).
The sample codes used in these studies, together with the preparation methods are
summarised in Table 6-2.
Table 6-2. Fe/zeolite samples (~ 0.5 wt. %) synthesised by impregnation and subsequent calcination
(3 h, 5 °C/min temperature ramp in air) including the support and the precursors used.
Sample code Support Precursor Calcination
Fe/H-ZSM-5 H-ZSM-5 Ammonium Fe citrate 800 °C
Fe/S1-T-citr S1-T Ammonium Fe citrate 800 °C
Fe/ S1-T-nitr S1-T Fe nitrate 500 °C
Fe/H-SSZ-13 H-SSZ-13 Ammonium Fe citrate 800 °C

227
6.2.2 Characterisation methods:
UV-Vis diffuse reflectance measurements were carried out in an UV-2600
Shimadzu spectrometer, using a light spot of 2 mm. The reflectance data was acquired
from 200 to 800 nm which was transformed into absorbance versus wavelength by
applying the Kubelka-Munk equation.46 BaSO4 was used as white standard to remove
background.
Elemental analysis of the catalysts was carried out using inductively coupled plasma
optical emission spectroscopy using a Perkin Elmer Optical Emission Spectrometer
Optima 3300 RL.
Thermogravimetric analysis of the reacted catalysts was carried out to quantify the
mass of carbon deposits. The measurements were carried out in a TA Q50 instrument, all
samples were heated up to 950 °C using a ramp of 5 °C/min under an air flow of 60
mL/min and held at 950 °C for 5 min.
6.2.3 Fe/S1-T catalysts for MDA
6.2.3.1 X-ray absorption spectroscopy of Fe/S1-T catalysts for MDA:
XAS spectra at the Fe (7.112 keV) K-edge of Fe/S1-T-citr and Fe/S1-T-nitr catalysts
were collected in B18 beamline at Diamond Light Source at Harwell Campus, United
Kingdom,47 using a Si (111) double crystal monochromator. The synchrotron ring energy
was 3 GeV and the current was 300 mA. The measurements were carried out ex situ in
pellet form and in fluorescence mode. For the pellet preparation ~ 200 mg of the sample
was pressed to 5 tonnes using a 1.3 mm bore die. The pellets were then dehydrated
overnight at 200 °C under vacuum prior to the XAS acquisition. Fe2O3 and FePO4.2H2O
references were also measured in pellet form but they were first diluted with cellulose to
ensure an edge jump of ~ 1. The spectra collection of the references was carried out in
transmission mode.
On average three scans were acquired to improve the signal to noise ratio of the data.
All spectra were acquired concurrently with a Fe foil placed between It and Iref. XAS
data processing and analysis was performed using the Demeter software package,48 as
described in the methodology chapter.

228
6.2.3.2 MDA activity tests of Fe/S1-T catalysts:
The catalyst activity testing was carried out following similar procedure as for
Mo/zeolite catalysts described in previous chapters. Short tests of 90 min of reaction were
carried out by introducing 0.6 g of sieved catalyst (150-425 µm sieved fractions) into a
tubular quartz reactor (internal diameter was 0.7 mm and catalyst bed length 3 cm). The
sample was fixed in the isothermal zone of the oven by quartz wool and a total gas flow
of 30 mL/min was fed into the reactor (gas hour space velocity = 1500 h-1). Initial sample
activation was performed under 20 % O2/He flow by heating up to 700 °C for 30 min
(temperature ramp of 5 °C/min). After flowing pure Ar for 30 min to flush the O2 from
the lines, methane dehydroaromatisation started by switching to a 50 % CH4/Ar flow.
Products were analysed by online mass spectrometer (OmniStar GSD 320O1) and all the
MS data presented were normalised to the Ar signal. Further description regarding
reaction set up and catalyst condition can be found in the methodology chapter.
Long catalytic tests of 10 h were carried out under the same reaction protocol and
GHSV as described above. Reaction products were analysed by online mass spectrometer
(EcoSys-P portable spectrometer) while the CH4 conversion was measured by an online
gas chromatograph (Varian CP-3800). Reaction set up and conversion calculations are
described in the methodology chapter (Chapter 2, section 2.3).
6.2.4 Fe/zeolites for selective catalytic reduction of NO with NH3:
6.2.4.1 XES and HERFD-XANES in situ NH3-SCR:
The HERFD-XANES/XES measurements were carried out at the Diamond Light
Source (Harwell Campus, UK) at the scanning branch of the I20 beamline.49 The
beamline is equipped with an Si (111) double-crystal monochromator for selecting the
incident X-rays energy and five spherically bent Si (531) crystals in a Rowland geometry
with respect to the sample for the analysis of the fluorescence.
The beam size was ~ 1x1 mm. The X-ray absorption spectra in terms of HERFD-
XANES were measured by scanning the incident energy (7062.2 to 7400 eV) and
detecting the fluorescence at the maximum of the Fe Kβ1,3 emission line (7059.25 eV).
The X-ray emission spectra around Kβ′ and Kβ1,3 emission lines were recorded between
7020 and 7130 eV while applying an excitation energy of 7212 eV, far above the detected
emission energy range.

229
The Fe/zeolite samples were measured under flowing gas using a heated borosilicate
capillary as the microreactor (diameter 1.5 mm, wall thickness ~ 10 µm). The capillary
was mounted over a hot air blower and gas mixtures were dosed with mass flow
controllers to obtain the desired volume concentrations. First the catalyst was activated
by heating at 500 °C for 1 h under 20 % O2/He flow, then the sample was cooled down
to 200 °C in He. Once the temperature of 200 °C was achieved, 40 mL/min (GHSV =
120000 h-1) of 0.1 % NO/He or 1 % NH3/He were flown through the reactor. Finally, the
NH3-SCR reaction was performed at 300 °C by flowing 100 mL/min (GHSV = 300000
h-1) of 0.5 % NO, 0.5 % NH3 and 5 % O2 in He. Between each adsorption or SCR
experiments the sample was reactivated by heating at 400-500 °C in air for 1 h. All the
temperature ramps employed were 5 °C/min. A Pfeiffer Vacuum OmniStar, GSD 301
quadrupole mass spectrometer was used for the online gas analysis.
The following references were measured ex situ: Fe2O3 (Sigma Aldrich, 99.995 %),
FeSO4.7H2O (Sigma Aldrich, 99.990 %), FePO4.2H2O (Sigma Aldrich, 29 % Fe) and
FePO4 (obtained by calcination of FePO4.2H2O at 400 °C for 6 h). The references where
diluted in cellulose aiming for ~ 0.5 wt. % loading of Fe and then pressed into pellet form
for the spectra collection.
Normalisation and HERFD-XANES data processing was carried out using the
Athena software. For detailed analysis of the pre-edge peak features the contribution of
the main Fe K-edge in the pre-edge region was determined using Origin 9.1 software and
using a cubic spline function obtained by interpolating the data several eV before and
after the pre-edge. The subtraction of the modelled main edge contribution from the
XANES spectrums over the full energy ranges yields the isolated pre-edge feature. The
pre-edge spectral shape has been deconvoluted with R2 > 0.999 using gaussian
components.
6.2.4.2 NH3-SCR catalytic activity measurements:
The catalyst testing for NH3-SCR was carried out by introducing 0.17 g of sieved
catalyst (150-425 µm sieved fraction) into a tubular quartz rector. The internal diameter
of the reactor was 0.7 cm and the catalyst bed length was 0.9 cm. The sample was fixed
in the isothermal zone of the oven by quartz wool.

230
The reaction was carried out using similar procedure as for the in situ experiments
described above. The catalyst was first activated by heating at 500 °C for 1 h under 80
mL/min of 20 % O2/He flow; temperature ramp rate used was 5 °C/min. The sample was
then cooled down to 300 °C in 200 mL/min of pure He. Once at 300 °C, NH3-SCR
reaction was performed for 1 h by flowing 200 mL/min (GHSV = 35000 h-1) of 5000 ppm
NO, 5000 ppm NH3 and 5 % O2 in He. Pfeiffer Vacuum OmniStar, GSD 301 quadrupole
mass spectrometer was used for the online gas analysis.
6.3 Results and discussion
6.3.1 Fe/S1-T catalysts for MDA
UV-Vis spectroscopy results:
Figure 6-2 shows the UV-VIS and chemical analysis results for Fe/S1-T samples
prepared using ammonium Fe citrate and Fe nitrate precursors. ICP results confirm that
the Fe loading for both samples is comparable with 0.48 and 0.51 wt. % Fe for Fe/S1-T-
citr and Fe/S1-T-nitr respectively.
The catalysts absorb UV-vis light between 200 to 600 nm corresponding to Fe3+←O2-
ligand to metal charge-transfer bands.50 Absorption between 215 and 300 nm has
previously been attributed to the presence of isolated Fe3+ species; specifically between
215 to 240 nm to Fe3+ in tetrahedral coordination and from 250 to 300 nm due to Fe3+ in
octahedral coordination.51 Bands between 300 and 400 nm are attributed to Fe species
part of FexOy clusters in an octahedral environment while absorption > 450 nm is due to
large Fe2O3 particles outside the zeolite pores.51
Most of the absorption in Fe/S1-T-citr occurs below 300 nm suggesting a majority
of isolated Fe3+ species being dominant in this catalyst; shoulders at 343 and 493 nm
indicate that clusters and particles are also present although in smaller quantities. In
contrast, three bands can be distinguished for Fe/S1-T-nitr with maximums around 242,
343 and 493 nm indicating the presence of isolated Fe+3 ions, some FexOy clusters as well
as large Fe2O3 particles. A simple visualisation of the intensities of the bands allow us to
conclude that Fe/S1-T-citr contains isolated iron ions as the dominant species whilst Fe-
S1-nitr contains more of FexOy clusters and large Fe2O3 particles.

231
Figure 6-2. UV-Vis spectra for calcined Fe/S1-T catalysts. The label includes the wt. % Fe content of
the catalysts measured by ICP.
X-ray absorption spectroscopy:
Fe K-edge spectra were collected for both Fe/S1-T catalysts as well as for Fe2O3 and
FePO4.2H2O compounds possessing differing Fe3+ environments (see Figure 6-3).
As shown in Figure 6-3a, all the spectra present an absorption edge corresponding to
1s→4d dipole allowed electronic transition. The edge position around 7123 eV,
(determined as the first maximum of the derivative plot) is consistent with Fe species in
oxidation state +3. The pre-edge peaks with maximum ~ 7114.5 eV (see inset in Figure
6-3a) correspond to dipole forbidden/quadrupole allowed 1s→3d transition. As
mentioned in previous chapters, this transition becomes more (dipole) allowed for
structures lacking centrosymmetry due to greater d-p orbital mixing.52 As a result, non-
centrosymmetric metal complexes present an increased pre-edge intensity.
The local structure of FePO4.2H2O reference is known to be determined by Fe3+ ions
isolated by four bridging (phosphorous atoms) oxygen atoms and two water molecules
with a slightly distorted FeO6 octahedral coordination.53 Fe2O3 however, comprises
interconnected FeO6 units in a more distorted Oh arrangement with a collection of three
short and three long Fe-O bonds.54 The Fe2O3 structure deviates significantly from
centrosymmetry resulting in higher pre-edge intensity than in FePO4.2H2O (Figure 6-3).
200 300 400 500 600 700 800
0.2
0.4
0.6
0.8
1.0
1.2
Fe content
0.48 wt. %
Ab
sorb
an
ce (
K.M
.)
Wavelength (nm)
Fe/S1-T-citr
Fe/S1-T-nitr 0.50 wt. %244
345
493
Isolated Fe3+
FexO
y
clusters
Fe2O
3 particles
Td, Oh

232
1 2 3 4 5
0.0
0.2
0.4
0.6
0.8
1.0
1.2
1.4
1.6
(R
) (A
-3)
Radial distance (Å)
Fe2O
3
FePO4.2H
2O
Fe/S1-T-citr
Fe/S1-T-nitr
b)
2 4 6 8 10-2
0
2
4
6
8
10
Fe/S1-T-nitr
FePO4.2H
2O
Fe/S1-T-citr
K2
(K) (A
-2)
Wavenumber (Å-1)
Fe2O
3
c)
Figure 6-3. Fe K-edge X-ray absorption spectra for Fe/Silicalite-1 samples as well as Fe2O3 and
FePO4.2H2O references: a) XANES spectra with inset showing details of the pre-edge peaks, b) FT-
EXAFS spectra plotted with phase correction and c) EXAFS spectra with dashed vertical lines marking
the oscillations corresponding to Fe scattering.
7110 7120 7130 7140 7150 7160
0.0
0.2
0.4
0.6
0.8
1.0
1.2
1.4
No
rmalis
ed x
(E)
Energy (eV)
Fe/S1-T-citr
Fe/S1-T-nitr
Fe2O
3
FePO4.2H
2O
a)
7112 7116 7120
0.02
0.04
0.06
0.08
0.10

233
Both Fe/S1-T samples exhibit a more intense pre-edge peak than the Fe2O3 and
FePO4.2H2O references with octahedral coordination. This is consistent with the presence
of tetrahedral-like Fe species (non-centrosymmetric) in the Silicalite-1 support as
schematised in Scheme 6-1c. Compared to Fe/S1-T-citr, Fe/S1-T-nitr presents a weaker
pre-edge peak as well as a more intense white line (main peak after the edge ~ 7133 eV).
These features may arise due to a greater contribution of Fe species in octahedral
coordination in the catalyst prepared with Fe nitrate precursor.
The spectral intensity observed between the pre-edge and the main absorption edge
is attributed to Fe-Fe contributions arising from Fe ions in the second coordination shell.52
Consistently, FePO4.2H2O with isolated iron species shows a weaker intensity than Fe2O3
in this region. Comparing the two Fe/S1-T samples, increased intensity for Fe/S1-T-nitr
suggests the presence of significant amounts of FexOy clusters or particles in this sample
which is in agreement with the UV-Vis results.
For more detailed structural information, EXAFS data were analysed using quick
first shell fit procedure. In order to avoid the refinement of too many independent
parameters a set of constraints were imposed. For example, the amplitude reduction factor
(So2) was set to 0.76, a value obtained by fitting the Fe foil reference spectra to
crystallographic data from the Inorganic Crystal Structure Database. For the refinement
of Fe/S1-T-citr, coordination number (CN) for the O shell was set to 4 as XANES features
(as well as HERFD-XANES discussed later) indicate Td Fe3+ to be the predominant
species in this catalyst. All the Fe–O distances and Debye-Waller factors were constrained
to be the same value, since they are likely to be comparable. Same was done for Fe-Fe
distances although the CN was also refined. A similar approach was carried out for the
fitting of Fe/S1-T-nitr; nonetheless as this sample presents a significant contribution of
clusters with Oh Fe3+ centres, in this case all CN were refined while Debye–Waller factors
were constrained to the values refined for Fe/S1-T-citr. The best fit between experimental
Fe K-edge EXAFS data and the calculated EXAFS resulted in the structural parameters
given in Table 6-3 whilst the experimental and simulated spectra are plotted together in
Figure 6-4.

234
Table 6-3. EXAFS fitting parameters for dehydrated Fe/S1-T-citr and Fe/S1-T-nitr: So2 (amplitude
reduction factor) = 0.76, Fit Range: 3.6 < k < 9.5, 1 < R < 2.4. Where CN = co-ordination number, R =
bond length of the Absorber-Scatterer, σ2 = Mean squared disorder term (sometimes referred to as the
Debye Waller factor), Eo = Energy shift, RFactor = A statistic of the fit, which is a way of visualising how
the misfit is distributed over the fitting range. x corresponds to fraction of Fe3+ Td estimated using equation
3-2 and the EXAFS-derived Fe-O distance.
Sample Shell CN R (Å) σ2 (Å2) E0 RFactor
(%)
x
Fe3+ Td
Fe/S1-
T-citr
Fe-O
Fe-Fe
4.0
1.4 (+/-1.5)
1.90 (+/-0.02)
3.01 (+/-0.04)
0.0076 (+/- 0.0016)
0.0103 (+/-0.0113)
-3.87 (+/-4.19)
-2.41 (+/-3.24) 2.5 0.73
Fe/S1-
T-nitr
Fe-O
Fe-Fe
4.5 (+/-0.5)
2.8 (+/-0.6)
1.95 (+/-0.02)
3.05 (+/-0.03)
0.0076
0.0103
0.29 (+/-3.82)
4.50 (+/-0.47) 2.9 0.44
4 5 6 7 8 9 10
-1.0
-0.5
0.0
0.5
1.0
K2
(K) (A
-2)
Wavenumber (Å-1)
Fe/S1-T-citr
Fit
a)
1 2 3 4 5 6
0.0
0.2
0.4
0.6
0.8
1.0
(R
) (A
-3)
Radial distance (Å)
Fe/S1-T-citr
Fit
b)
4 5 6 7 8 9 10-1.5
-1.0
-0.5
0.0
0.5
1.0
1.5
K2
(K) (A
-2)
Wavenumber (Å-1)
Fe/S1-T-nitr
Fit
c)
1 2 3 4 5 6
0.0
0.2
0.4
0.6
0.8
1.0
(R
) (A
-3)
Radial distance (Å)
Fe/S1-T-nitr
Fit
d)
Figure 6-4. Fitting results for Fe K-edge EXAFS and FT-XAFS (phase corrected) for dehydrated Fe/S1-T
catalysts. Black line: experimental; red dots: simulation.

235
Considering that the interatomic bond distances for a same metal-ligand system are
driven by the coordination symmetry, the Fe-O bond length in the first shell can give us
an indication of species present in the catalysts. Refinement of the Fe-O distances for
Fe/S1-T-citr result in an average length of 1.90 Å. This is slightly longer than the reported
bond distances in Fe3+ Td compounds (1.85 Å for FePO4 for example54). The longer bond
distance can be attributed to the presence of FexOy clusters and particles with Oh Fe3+
units known to exhibit longer Fe-O bond distances (i.e. 2.03 Å for Fe2O355).
Compared to Fe/S1-T-citr, the EXAFS analysis of Fe/S1-T-nitr results in a longer
average Fe-O distances. This is explained by a greater presence of FexOy clusters and
particles in the catalyst in agreement with UV-Vis and XANES results. Confirmation of
this is also the increase in Fe-Fe CN from Fe/S1-Tcitr (CN = 1.4) to Fe/S1-T-nitr (CN =
2.8), and the higher spectral intensity between the pre-edge and the main absorption edge
discussed earlier.
The reliability in the first shell Fe-O bond lengths refined from EXAFS (+/- 0.02 Å
as shown in Table 6-3) allows us to use them as a guide for a rough quantification of the
Oh and Td species in the samples. If we assume the average Fe-O distances reported for
FePO4 (1.85 Å)54 and Fe2O3 (2.03 Å)56 compounds as the bond distances for Oh Fe3+ and
Td Fe3+ species in the sample we can then use the Vegard relationship in Equation 6-2:
RTd.(x) + ROh
.(1-x) = R Equation 6-2
Where RTd is the Fe-O distance of 1.85 Å corresponding to Fe3+ Td species, ROh is
the Fe-O distance of 2.03 Å corresponding to Fe3+ Oh species, R is the average Fe-O
distance of Fe compounds in the sample (obtained by EXAFS refinement) and x is the
fraction of Fe3+ Td species in the sample.
The estimated fraction for Fe3+ Td species obtained from the Vegard relationships
are included in Table 6-3; the results give a 73 % Fe3+ in Td coordination for Fe/S1-T-
citr and 44 % for Fe/S -T-nitr.

236
MDA activity results:
The MDA catalytic activity (700 °C, 50 % CH4/Ar flow, GVSV= 1500 h-1) of Fe/S1-
T-citr with mostly monomeric species, and of Fe/S1-T-nitr with FexOy clusters and large
particles is compared in Figure 6-5. Both samples show an initial induction period with
formation of combustion products (i.e. H2O, CO, CO2) as well as H2. The evolution of
these molecules indicates that Fe is probably being reduced and carburised by methane.
The induction period is followed by the aromatisation stage where combustion product
evolution ceases and aromatics (mainly C6H6 and C7H8) as well as light C2/C3 molecules
are observed.
Both samples show similar MDA activity profile. It is probable that both isolated
species and clusters are active for MDA, as suggested by Mo/zeolite studies in previous
chapters. Nonetheless, shorter induction period for Fe/S1-T-citr (6 min) compared to the
Fe/S1-T-nitr (12 min) suggests the reduction/carburisation is faster for isolated Fe
species. Furthermore, the product formation was higher for Fe/S1-T-citr, with MS
normalised signal of 0.015, 8.02 E-5 and 8.08 E-5 for i.e. H2, C2Hx and C6H6 respectively
at 90 min of MDA. On the other hand, Fe/S1-T-nitr presented lower signal intensities of
0.012, 7.93 E-5 and 1.75 E-5 for the same products. This indicates better performance of
the sample containing more isolated species which goes in line with previous studies
reporting a higher signal for the aromatic products.10 This increased activity could be
attributed to an increased Fe dispersion at early stages of reaction providing thus more
active centres available for MDA.
Catalytic tests on Fe/S1-T-citr were also carried out using longer reaction times of
10 h as well as higher reaction temperatures of 850 °C. Table 6-4 contains an overview
of carbon deposit content of spent catalysts measured by TGA. The carbon deposit
formation observed for the samples reacted at 700 °C is very low (~ 0.2 wt. % after 90
min of reaction). Nonetheless, catalyst activity measured by GC at this temperature is also
low with a CH4 conversion of only 4.7 % for Fe/S1-T-citr while the reported equilibrium
conversion values for MDA reaction at 700 ℃ are around 10 %.57 Raising the MDA
reaction temperature to 850 °C resulted in a significant increase of catalyst activity with
CH4 conversion of 11.8 % for Fe/S1-T-citr. The carbon deposition however, also
increased significantly.

237
Figure 6-5. MS data collected for MDA reaction (700 °C, 50 % CH4/Ar, GHSV = 1500h-1) using a)
Fe/S1-T-citr and b) S1-T-nitr as the catalysts. All data shown was normalised to the Ar signal.
0 20 40 60 80 1001E-6
1E-5
1E-4
1E-3
0.01
0.1
1
H2 (m/z=2)
CH4 (m/z=15)
H2O (m/z=18)
C2Hx (m/z=25)
C2Hx/C3Hx (m/z=27)
CO/CO2
C3H
8/C
3H
x(m/z=28)
CO2/C
3H
8 (m/z=44)
C6H
6 (m/z=78)
C7H
8 (m/z=91)
Ion
Cu
rre
nt
(A)
Time (min)
CH4
H2
H2O
C6H
6
CO
C7H
8
C2H
x
C2Hx + C3Hx
CO2
b)
12 min
0 20 40 60 80 100
1E-6
1E-5
1E-4
1E-3
0.01
0.1
1
H2 (m/z=2)
CH4 (m/z=15)
H2O (m/z=18)
C2Hx (m/z=25)
C2Hx/C3Hx (m/z=27)
CO/CO2
C3H
8/C
3H
x(m/z=28)
CO2/C
3H
8 (m/z=44)
C6H
6 (m/z=78)
C7H
10 (m/z=91)
Ion C
urr
ent (A
)
Time (min)
CH4
H2
H2O
C6H
6
CO2
CO
C7H
8
C2H
x
C2Hx + C3Hx
a)
6 min
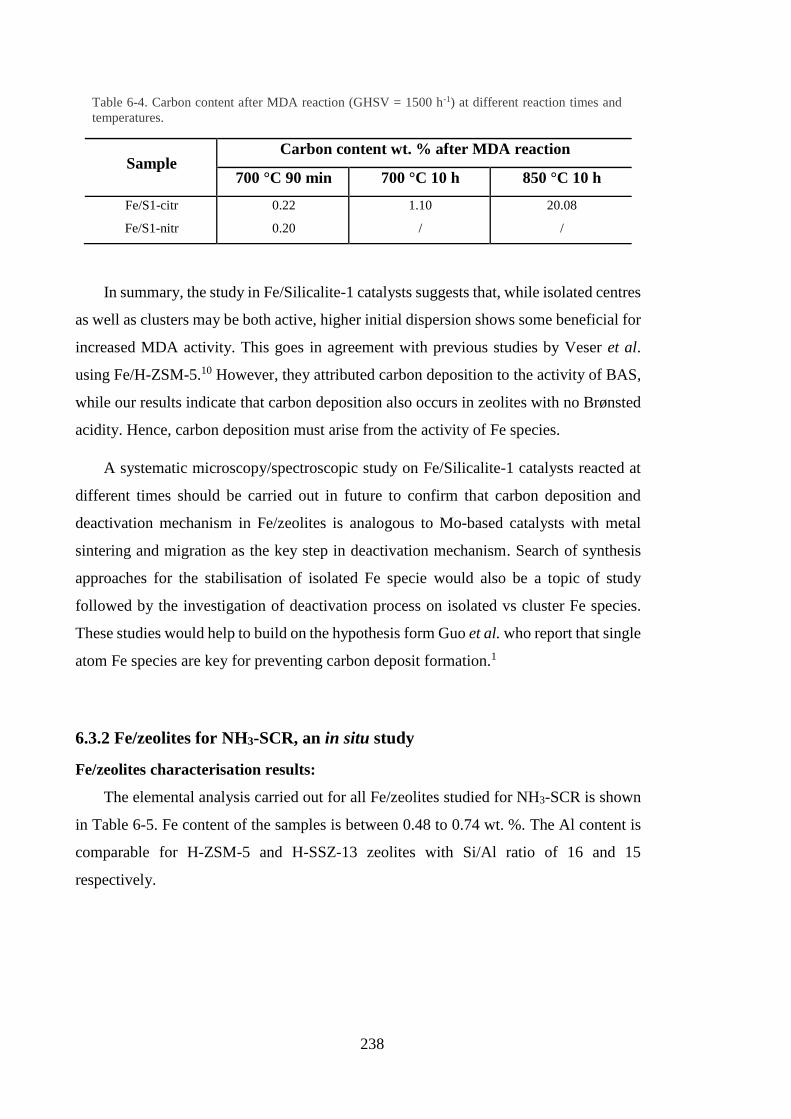
238
Table 6-4. Carbon content after MDA reaction (GHSV = 1500 h-1) at different reaction times and
temperatures.
Sample Carbon content wt. % after MDA reaction
700 °C 90 min 700 °C 10 h 850 °C 10 h
Fe/S1-citr 0.22 1.10 20.08
Fe/S1-nitr 0.20 / /
In summary, the study in Fe/Silicalite-1 catalysts suggests that, while isolated centres
as well as clusters may be both active, higher initial dispersion shows some beneficial for
increased MDA activity. This goes in agreement with previous studies by Veser et al.
using Fe/H-ZSM-5.10 However, they attributed carbon deposition to the activity of BAS,
while our results indicate that carbon deposition also occurs in zeolites with no Brønsted
acidity. Hence, carbon deposition must arise from the activity of Fe species.
A systematic microscopy/spectroscopic study on Fe/Silicalite-1 catalysts reacted at
different times should be carried out in future to confirm that carbon deposition and
deactivation mechanism in Fe/zeolites is analogous to Mo-based catalysts with metal
sintering and migration as the key step in deactivation mechanism. Search of synthesis
approaches for the stabilisation of isolated Fe specie would also be a topic of study
followed by the investigation of deactivation process on isolated vs cluster Fe species.
These studies would help to build on the hypothesis form Guo et al. who report that single
atom Fe species are key for preventing carbon deposit formation.1
6.3.2 Fe/zeolites for NH3-SCR, an in situ study
Fe/zeolites characterisation results:
The elemental analysis carried out for all Fe/zeolites studied for NH3-SCR is shown
in Table 6-5. Fe content of the samples is between 0.48 to 0.74 wt. %. The Al content is
comparable for H-ZSM-5 and H-SSZ-13 zeolites with Si/Al ratio of 16 and 15
respectively.

239
Table 6-5. Chemical analysis results for Fe/zeolites.
Sample Fe (wt. %) Al (wt. %) Si (wt. %) Fe/Al
Fe/H-ZSM-5 0.74 2.45 40.70 0.16
Fe/S1-T-citr 0.48 / /
Fe/S1-T-nitr 0.51 / /
Fe/H-SSZ-13 0.53 2.27 35.00 0.15
UV-Vis spectroscopy was used to investigate the nature of the Fe3+ species in
Fe/zeolite catalysts by observation of the Fe3+← O2- ligand to metal charge-transfer bands
(Figure 6-6). As discussed previously, absorption between 215 and 300 nm has previously
been attributed to the presence of isolated Fe3+ species; specifically between 215 to 240
nm to Fe3+ in tetrahedral coordination and from 250 to 300 nm due to Fe3+ in octahedral
coordination.51 Bands between 300 and 400 nm are attributed to Fe species part of FexOy
clusters in an octahedral environment while absorption > 450 nm is due to large Fe2O3
particles outside the zeolite pores.51
As designed by the use of different Fe precursors and zeolite supports, UV-vis spectra
reveal that the syntheses resulted in catalysts with different Fe species distribution. As for
Fe/S1-T-citr, most of the absorption in Fe/H-ZSM-5 occurs below 300 nm which can
again be attributed to isolated Fe species. Besides, two distinct bands can be observed on
Fe/H-ZSM-5 with maxima at 220 and 272 nm indicating presence of both, tetrahedrally
and octahedrally coordinated Fe3+.51
Compared to the Fe/S1-T-citr, the catalysts prepared with nitrate precursor (Fe/S1-
T-nitr) presents a weaker absorption < 300 nm and increased absorption intensity for the
bands at 345 and 493 nm. As discussed previously in the MDA section of this chapter,
this indicates lower Fe dispersion with nitrate precursor resulting in the formation of
FexOy clusters and large Fe2O3 particles.
As expected, small pore zeolite support, Fe/H-SSZ-13 exhibits intense bands
between 400 and 650 nm indicating that the sample contains mainly large Fe2O3 particles.
Nonetheless, absorption < 250 nm suggest some iron to be present as isolated species
probably in tetrahedral symmetry. The formation of clustered and Fe2O3 particles using

240
H-SSZ-13 support results from the smaller pore size of this zeolite with diameter of 3.8
Å compared to the Fe-citrate precursor size (~ 5.5 x 6.7 Å).45 The precursor is too bulky
to enter and disperse into the pores during the impregnation process, thus it remains on
the zeolite outer surface forming in iron oxide particles upon calcination.
Figure 6-6. UV-vis spectra of calcined Fe/zeolite catalysts.
6.3.3 In situ HERFD-XANES/XES study:
6.3.3.1 Transmission XANES vs HERFD-XANES and pre-edge peak analysis.
In previous chapters the edge position of the raising absorption for Mo K-edge
(1s→5p dipolar electronic transition) has been used for calculation of the integer
oxidation state of Mo/zeolite compounds. However, this procedure cannot be used
reliably for Fe compounds as differences in Fe coordination result in significant variation
in the Fe K-edge XANES spectral shape and adsorption energy.58,59 Alternatively,
chemical information can be extracted from the analysis of the pre-edge peak features
which arise from 1s→3d (quadrupolar) transition.60 The position and intensity of the pre-
edge is sensitive to the oxidation state and coordination geometry of iron in oxidic
environments.52,61
Usually, the integrated intensity and energy position of the pre-edge peak are
correlated using a scatter plot also known as a variogram. In a variogram the points
200 300 400 500 600 700
0.2
0.4
0.6
0.8
1.0
1.2
1.4
1.6
1.8
220
244
272
345
388
Ab
so
rban
ce (
K.M
.)
Wavelength (nm)
Fe/H-SSZ-13
Fe/S1-T-nitr
Fe/S1-T-citr
Fe/H-ZSM-5
493
Fe2O3 particles FexOy clusters Isolated Fe
3+
Td, Oh

241
corresponding to the pre-edge spectra of model reference compounds (i.e. with known
oxidation states and coordination geometries) have unique coordinates. These coordinates
are used for qualitative and quantitative analysis of iron species in unknown
compounds.52,62
In an unambiguous analysis of pre-edge features high spectral resolution is required
for a precise isolation of the pre-edge structure from the main edge. HERFD mode allows
for collecting XANES spectra with increased resolution; the small fluorescence energy
window selected by the high-resolution detector used in this experiment suppresses the
background contribution due to lifetime broadening of the main edge and sharpens the
spectral features.
To illustrate this, Figure 6-7 compares the XANES region of the Fe K-edge
absorption spectrum of Fe2O3 reference measured in standard transmission mode and in
HERFD mode. The figure clearly shows the increased definition of the pre-edge features
in HERFD-XANES. Furthermore, we find the pre-edge peak is well separated from the
main absorption edge.
Figure 6-7. Normalised Fe K-edge features of Fe2O3 comparing conventional transmission XANES
spectrum (black) and HERFD-XANES spectrum (orange).
7105 7110 7115 7120 7125 7130 7135 7140 7145 7150
0.0
0.2
0.4
0.6
0.8
1.0
1.2
1.4
1.6
HERFD-XANES
Transmission XANES
Norm
alis
ed a
bsorp
tion (
a.u
.)
Energy (eV)
Fe2O
37105 7110 7115 7120
0.00
0.05
0.10
0.15

242
This allows for reliable extraction of the main adsorption edge contribution, to the
pre-edge feature by the use of cubic spline function (example in Figure 6-8a).
Deconvolution of pre-edge peak in conventional XANES is susceptible to lack of
reproducibility, especially for low iron concentration.63 The increased integrated area in
HERFD-XANES (~ 3 times more) allows for accurate fitting using Gaussian components
to derive height, position, half-width, and integrated intensity (Figure 6-8b). The physical
rationale for deconvolution in Figure 6-8 is to fit components for 1s→3d/4d transitions
related to crystal field splitting (< 7116 eV in case of Fe2O3 example),52 separating
contributions which arise from Fe-O-Fe multiple-scattering instead (> 7116 eV).
Figure 6-8. Example of HERFD-XANES data processing for Fe2O3: a) Modelling of the main adsorption
edge by using cubic spline function b) isolated pre-edge spectra extracted using cubic spline function and fit
with Gaussian peak functions.
6.3.3.2 HERFD-XANES and XES analysis of the activated Fe/zeolites samples:
- HERFD-XANES analysis:
In order to gain information on the oxidation state and geometry of initial Fe species
present in the Fe/zeolites, Fe K-edge HERFD-XANES were acquired at room temperature
for the dehydrated catalysts after in situ activation (20 % O2/He, 500 °C). Normalised
HERFD-XANES spectra are shown in Figure 6-9a together with the spectra of different
iron references; detailed features of the pre-edge region are shown in Figure 6-9b. For
better visualisation of Fe structural properties, the graphical representation of pre-edge
peak intensity vs centroid position for Fe references and samples (resulting from the pre-

243
edge peak isolation and analysis), are shown in Figure 6-10. The dotted vertical lines
indicate the average energy position of the centroids representing Fe2+ and Fe3+
compounds. The isolated pre-edge peak deconvolution plots can be found in Figures A6-
1 and A6-2 of the appendix while the resulting component, centroid and integrated
intensity values are in Table A6-1.
If we first compare the HERFD-XANES features of reference compounds, the simple
visualisation of the spectra in Figure 6-9 shows that Fe2O3 exhibits increased spectral
intensity between the pre-edge peak and the absorption edge (i.e. from 7115 to 7119 eV,
this contribution is labelled in Figure 6-9b). As explained earlier this contribution has
previously been attributed not to electronic transitions but to Fe-Fe scattering
contributions.52 Consequently, a lower intensity is observed in this region for Fe-
phosphate and sulphate references with isolated FeOx units.
The integrated pre-edge peak intensity and shape is indicative of metal coordination
symmetry; it is known to increase for non-centrosymmetric species (i.e. tetrahedral) due
to the higher degree of 3d–4p hybridisation in such geometries.4 Accordingly, FePO4,
with isolated Td Fe3+ units, exhibits a sharp and strong pre-edge peak with integrated area
of 0.42. FePO4.2H2O and Fe2O3 exhibit a two-component pre-edge peak (with maxima
around 7112.5 and 7114.0 eV) characteristic of Oh Fe3+ compounds,62 these references
present a weaker integrated intensity. Note, the slight pre-edge intensity increase from
FePO4.2H2O to Fe2O3 with integrated areas of 0.16 and 0.21 respectively; as discussed in
the previous section this is attributed to the highly distorted Oh structure of Fe3+ in Fe2O3
(with three short and three long Fe-O bonds)54 which deviates significantly from being
centrosymmetric.
FeSO4.7H2O with Oh Fe2+ also exhibits a two-component pre-edge peak although
the maxima of these are shifted to lower energies (to 7111.0 and 7113.5 eV) which is
indicative of the lower iron oxidation state. Thus, while all ferric references exhibit the
pre-edge peak(s) centroid around 7113.5 eV (see Figure 6-10) the centroid for the ferrous
reference appears at 7112.6 eV. Furthermore, the integrated pre-edge area for
FeSO4.7H2O (0.084), is lower than the ferric compounds studied. As Fe2O3/FeSO4.7H2O
area ratio obtained (c.a. 2.5) is comparable to previous reports,52,64 the decreased intensity
in the ferrous reference can be explained by the lower probability of 1s→3d transition for
reduced sample due to its more populated 3d orbital. Low degree of distortion in its

244
octahedral FeO6 units in this reference probably also contribute to the weak peak
intensity.65
Considering the spectral features of the reference compounds discussed above,
structural information on Fe species in the catalysts can be extracted by comparative
analysis of HERFD-XANES. Thus, data in Figure 6-9 show that Fe/H-ZSM-5, FeS1-T-
citr and Fe/S1-T-nitr present a featureless post-edge suggesting Fe species with low long-
range order (i.e. isolated species or small clusters). Fe/H-SSZ-13 however, exhibits a
lower pre-edge peak intensity and pronounced post-edge features resembling the Fe2O3
reference. This is consistent with the UV-Vis data suggesting the presence of particles of
Fe2O3 on the zeolite outer surface. Conversely, Fe/H-ZSM-5 seems to exhibit an
increased number of isolated iron species indicated by the lower intensity between pre-
edge and the rising absorption edge. The higher intensity in this region for Fe/S1-T-citr,
Fe/S1-T-nitr and Fe/H-SSZ-13 implies the presence of FexOy clusters or particles
resulting in Fe-Fe contribution to the spectra.
Figure 6-9. Fe K-edge HERFD-XANES spectra of Fe references and Fe/zeolites (at RT after calcination in
flowing air at 500 °C): a) Full XANES region and b) the pre-edge region.
From the study of the pre-edge peak(s) centroid position in Figure 6-10, all
Fe/zeolites exhibit the centroid around 7113.5 eV, close to the values reported for ferric
references indicating the presence of Fe3+ species. If we analyse the pre-edge integrated
area, the Fe/H-ZSM-5 (0.30) sits between FePO4 (0.42) and Fe2O3 (0.21) references. This
intermediate pre-edge intensity has been attributed to 5-fold Fe species by some groups.63
In our studies however, this intensity can be better attributed to the presence of a mixture

245
of isolated Oh and Td Fe3+ species as indicated by the UV-Vis spectra discussed in Figure
6-6 where Fe/H-ZSM-5 exhibits two distinct contribution at 220 and 272 nm typically
assigned to Td and Oh coordinated isolated iron centres.51
The intense pre-edge on Fe/S1-T-citr (integrated area 0.39) suggests tetrahedral Fe3+
species are predominant. This may arise from interaction of Fe3+ with silanol nests known
to act as grafting sites17 resulting in tetrahedral Fe species as shown in Scheme 6-1c. The
absorption between the pre-edge and the rising absorption edge (Figure 6-9b) indicates
the presence of an Fe-Fe contribution and for which there is some evidence for seen in
the EXAFS in Figure 6-4. This can be attributed to the presence of minor FexOy clusters
and Fe2O3 particles as observed by UV-Vis.
The Fe/S1-T-nitr sample shows a pre-edge peak intensity between those of the Oh
and Td references as well as the presence of an Fe-Fe contribution between the pre-edge
and the rising absorption edge. This is again in agreement with the UV-Vis results which
suggests the presence of isolated Fe3+ species that would possess Td symmetry, as well
as the presence of both small clusters and Fe2O3 particles. Finally, the Fe/H-SSZ-13
exhibits pre-edge peak features and an intensity analogous to the Fe2O3 reference
indicating clear predominance of large iron oxide particles most probably on the zeolite
outer surface.61
The intensity of the pre-edge is known to be inversely correlated with the extent of
centro-symmetry of the crystallographic site of Fe.52 Thus, assuming a linear relationship
between pre-edge intensity and the number of Td Fe3+ centres, a rough quantification of
the species present can be performed using the integrated areas presented in Figure 6-10.
Assigning a pre-edge integrated intensity of Fe2O3 (0.21) to correspond to Oh Fe3+ species
and FePO4 integrated intensity (0.42) to Td Fe3+ species, we can use the same approach
as in Equation 6-2 to estimate the fraction of Td species in the sample. The results,
presented in Table 6-6, indicate the presence of 45 %, 86 %. 42 % and 9 % of Td Fe3+
species for Fe/H-ZSM5, Fe/S1-T-citr, Fe/S1-T-nitr and Fe/H-SSZ-13 respectively.
This estimation is in good agreement with quantification carried out by linear
combination analysis (LCA) of the pre-edge spectra fitting with FePO4 and Fe2O3 as the
references for Td and Oh Fe3+ species. These results are shown in Table 6-6 while fitted
spectra are included in Figure A6-4 of the appendix. From the LCA there is a 44 %

246
contribution of Td Fe3+ in Fe/H-ZSM-5, 88 % in Fe/S1-T-citr and 48 % in Fe/S1-T-citr.
Fitting of Fe/H-SSZ-13 gives 100 % contribution of Oh Fe3+ with negligible Td Fe3+.
7113.0 7113.5 7114.0
0.1
0.2
0.3
0.4
FeSO4.7H2O
FePO4.2H2O
Fe2O3
Inte
gra
ted
pre
-ed
ge
inte
nsity
Centroid position (eV)
Fe/H-ZSM-5
Fe/S1-T-citr
Fe/S1-T-nitr
Fe/H-SSZ-13FePO4
Figure 6-10. Variogram for Fe in selected reference compounds and in Fe/zeolite samples. Dotted
vertical line at 7112.6 and 7113.5 eV indicate the average energy position of the centroid for Fe2+ and
Fe3+ compounds respectively.
Table 6-6. Quantification of Oh and Td Fe3+ centres in Fe/zeolites (spectra at room temperature after
calcination under 20 % O2 in He at 500 ℃) by pre-edge integrated intensity values as well as by linear
combination of the pre-edge region (-15 to -5 eV from the main adsorption edge) using FePO4 and Fe2O3
spectra as the Fe3+ Td and Fe3+ Oh references.
Sample
Pre-edge intensity
Weight fraction
Fe3+ Td
LCA
Weight fraction
Fe3+ Td
LCA
Weight fraction
Fe3+ Oh
LCA
R (%)
Fe/H-ZSM-5 0.45 0.44 0.56 2.7
Fe/S1-T-citr 0.86 0.88 0.12 2.8
Fe/S1-T-nitr 0.42 0.48 0.52 2.2
Fe/H-SSZ-13 0.09 0.00 1.00 2.1
Fe/H-ZSM-5a 0.55 0.48 0.52a 2.6
a Analysis of Fe/H-ZSM-5 using FePO4.2H2O as the Fe3+ Oh reference.

247
As unlike the other three catalysts, Fe/H-ZSM-5 seems to be composed mainly by
isolated Fe species the analysis of this sample is compared by using FePO4.2H2O data
(which comprises isolated FeO6 units) as Oh Fe3+ reference. The results are also included
in Table 6-6 and show that the choice of the reference introduces variation of up to 10 %
in the quantification of Fe species.
- XES analysis:
In addition to HERFD-XANES spectra discussed above, XES spectra for the K
emission lines were also acquired. These can provide information regarding Fe spin state,
metal-ligand bond covalency, or nature of the coordinating ligand.66,67 Figure 6-11 shows
the K XES emission lines for references and Fe/zeolites (room temperature after
calcination). All the peaks are normalised to the K1,3 spectral intensity.
The K emission mainlines, shown in Figure 6-11a and c, correspond to 3p→1s
transitions of the absorbing atom. These transitions are subjected to strong spin-orbit
interactions between electrons in the 3p and 3d orbitals that separate the K’ and K1,3
spectral features.66 As a result of the interaction of the 3p orbital with the valence orbital,
these features are sensitive to the spin state: high-spin complexes exhibit both, K’ and
K1,3 peaks, while K’ is very weak or absent in low-spin compounds.68,69 All the samples
in Figure 6-11a and c present a well-defined K’ feature indicating they constitute high-
spin complexes.
Recent publications demonstrate that K’ and K1,3 spectra can reveal more than the
spin-state of a material. For metal complexes with the same spin-state, the centroid of the
K1,3 feature seems to be correlated with the covalent (vs ionic) character of the metal-
ligand bond; it has been reported that K1,3 emission shifts to higher energies with
increasing ionic character.70 This is clearly seen in the high-spin references compared in
Figure 6-11a (see inset for better visualisation of the position of the K1,3 line). The ionic
character of a given metal-ligand bond in transition metal complexes can be inferred from
the bond distance (i.e. increasing ionic character for increasing bond distance).
FeSO4.7H2O is an ionic compound,71 and although in a lower oxidation state, the longer

248
average Fe-O distances (2.12 Å)72 ensure a lower covalent character. Consistently, the
maxima of the K1,3 peak for this reference is positioned at the highest energy (7059.44
eV). FePO4 with a shorter average Fe-O bond distance (1.85 Å)54 is a comparatively
covalent compound; this reference exhibits the K1,3 peak shifted to the lowest energy
(7058.97 eV). Compared to FePO4, FePO4.2H2O is slightly more ionic, with an average
Fe-O bond distances of (~ 2.00 Å).56 This results in an intermediate position of K1,3 peak
for FePO4.2H2O (at 7059.20 eV).
As expected for Fe3+ coordinated to O atoms, all Fe/zeolite samples in Figure 6-11c
show K emission line features typical for high-spin complexes. All the spectra seem
identical although the K1,3 peak in the Fe/H-ZSM-5 sample is slightly shifted to higher
energies (i.e. K1,3 maxima at 7059.15 eV while for the rest of the references is at 7058.78
eV). This shift could indicate a different, more ionic, metal-ligand bond character with
respect to the other samples. This could be a consequence of the fact that Fe is providing
charge compensation of the framework AlO4- charge. This is not the case of Fe/Silicalite-
1 catalysts as they contain no framework Al, while most of the iron in Fe/H-SSZ-13 is
not ion exchanged but forming Fe2O3 large particles. Alternatively, the shift observed in
Fe/H-ZSM-5 could be related to the formation of specific Fe structures with hydroxyl
groups or binuclear species with bridging oxygens, reported to have essential role in
reactant adsorption in SCR.25,73
The K’’ and K2.5 lines, so-called valence-to-core (V2C) emission lines, correspond
to transitions from the filled ligand valence s and p orbitals respectively, to fill the Fe 1s
core hole.74 The centroid and intensity of this features can be used to identify the bond
lengths and type of the ligands bonded to the central metal ion. Valence-to-core emission
lines have been previously used to elucidate the NO, NH3 coordination to Fe species under
in situ SCR conditions.4 However, the intensities of the V2C lines collected (Figure 6-11b
and d) are two orders of magnitude lower than that of the main K lines and the spectra
are not of sufficient quality for this level of analysis.

249
7060 7070 7080 7090 7100 7110 7120
Fe2O3
FePO4.2H2O
FePO4
FeSO4.7H2O
Norm
alis
ed inte
nsity (
a.u
.)
Energy (eV)
b)
k''
k2,5
7040 7045 7050 7055 7060
K'
Norm
alis
ed inte
nsity (
a.u
.)
Energy (eV)
Fe/H-ZSM-5
Fe/S1-T-citr
Fe/S1-T-nitr
Fe/H-SSZ-13
K1,3
c)
7070 7080 7090 7100 7110 7120
K,5
Norm
alised inte
nsity (
a.u
.)
Energy (eV)
Fe/H-ZSM-5
Fe/S1-T-citr
Fe/S1-T-nitr
Fe/H-SSZ-13
d)
K''
Figure 6-11. K mainlines (left) and V2C lines (right) for: a-b) Fe references at room temperature and c-
d) Fe/zeolites acquired at room temperature after the activation (20 % O2/He flow, 2 h at 500 °C).
6.3.3.3 HERFD-XANES and XES in situ analysis of the Fe/zeolites samples under
controlled gas atmospheres:
In order to gain information on the Fe environment under different gas compositions,
HERFD-XANES and XES spectra were collected for the catalysts exposed to: 1) 20 %
O2 in He flow at 500 ℃ after activation, 2) 0.1 % NO in He at 200 ℃, 3) 1 % NH3 in He
at 200 ℃ and 4) SCR conditions (5000 ppm NO, 5000 ppm NH3 and 5 % O2 in He) at
300 ℃. After each NO, NH3 and SCR treatment the catalysts were calcined (by heating
above 400 ℃ under 20 % O2 in He flow) for the removal of adsorbed molecules.
Figure 6-12 shows the general HERFD-XANES of the spectra collected for Fe/H-
ZSM-5 while Figure 6-14 compares the pre-edge features and references. The variogram
resulting from the pre-edge isolation and deconvolution of Fe/H-ZSM-5 spectra is shown
7040 7045 7050 7055 7060
FePO4
FePO4.2H2O
FeSO4.7H2O
K'
K1,
Norm
alis
ed inte
nsity (
a.u
.)
Energy (eV)
a)
7057 7058 7059 7060 7061

250
in Figure 6-15; deconvolution plots can be found in Figure A6-3 while pre-edge feature
values obtained from the analysis are presented in Table A6-1 in the appendix.
The HERFD-XANES data reveal a dynamic chemical state of iron in Fe/H-ZSM-5
which changes with gas atmosphere. As discussed earlier, pre-edge peak features of the
calcined catalyst suggest the presence of mainly isolated Fe3+ species with both, Oh and
Td species. No significant changes in the XANES spectrum can be observed when
flowing NO. While previous standard XANES studies show no reduction of Fe/zeolites
under NO,33 Boubnov et al.4 report very small shifts to lower energies (~ 0.05 eV) in the
pre-edge peak centroid position using HERFD-XANES as well as an increase in Fe
coordination. They attribute these observations to NO adsorption onto Fe3+ centres which
reduces the metal (i.e. NO oxidative activation). Comparing the centroid positions for our
calcined (7113.41) and NO exposed catalyst (7113.39), no such shift is discernible. The
slightly increased rising absorption edge energy and white line intensity in the NO
exposed spectra (Figure 6-12) could be indicative of increased Fe coordination due to NO
adsorption into Fe centres. This is not compelling evidence since the changes are within
the error limits of the technique; nonetheless, this is consistent with those reported
previously for Fe and Cu-based catalysts.4,75
7110 7120 7130 7140
No
rmalis
ed
x
(E)
Energy (eV)
O2 500 oC
NO 200 oC
NH3 200 oC
SCR 300 oC
Figure 6-12. Fe K-edge HERFD-XANES spectra collected for Fe/H-ZSM-5 after activation in 20 % O2/He
(500 °C, GHSV = 12000 h-1), under 0.1 % NO/He and 1 % NH3/He (200 °C, GHSV = 12000 h-1) and under
SCR conditions (5 % O2, 5000 ppm NO, 5000 ppm NH3 in He, 300 °C, GHSV = 30000 h-1).

251
The pre-edge peak shifts to lower energies under NH3 (centroid position goes from
7113.41 to 7112.95 eV) indicate reduction of iron to Fe2+ which likely occurs as a result
of ammonia coordination to the metal and donation of the free electron pair of the
nitrogen. A similar spectrum shift is seen under NH3-SCR conditions which goes in line
with previously proposed mechanisms for selective NO reduction where the reoxidation
of Fe2+ to Fe3+ is suggested to be the rate-determining step.20,29 MS spectrometry data
collected during NH3-SCR verified the correct operation of the catalysts with N2 and H2O
product formation; this data can be found in Figure A6-9 of the appendix.
Interestingly, the pre-edge features of Fe/H-ZSM-5 under NH3 and SCR conditions
indicate that only part of the Fe species are reduced to Fe2+. As shown in Figure 6-13 the
relative intensities of the two pre-edge components (centred at 7111.4 and 7113.4 eV) in
the reduced Fe/H-ZSM-5 and in FeSO4.7H2O are inverted. The increased intensity of the
high energy component in the spectra evidences the presence of Fe3+ species to the pre-
edge features. In agreement, the centroid position for Fe/H-ZSM-5 (Figure 6-15) under
NH3 and SCR appears located at higher energies than for the ferric reference compounds.
7110 7112 7114 7116
0.00
0.05
0.10
0.15
0.20
O2 500 oC
NH3 200 oC
NO 200 oC
SCR 300 oC
FePO4.2H2O
FeSO4.7H2O
Fe2O3
FePO4
No
rma
lise
d x
(E)
Energy (eV)
Figure 6-14. Fe K-edge HERFD-XANES pre-edge spectra for Fe reference model compounds as well
as Fe/H-ZSM-5 during in situ calcination, NH3/NO adsorption and SCR. Dotted vertical line at 7111.4
and 7113.5 eV indicate the energy position of the two components in Fe2+ reference.

252
7112.5 7113.0 7113.5 7114.0
0.05
0.10
0.15
0.20
0.25
0.30
0.35
0.40
0.45 O2 calc.
NO
NH3
SCR
FeSO4.7H2O
FePO4.2H2O
Fe2O3
Inte
gra
ted p
re-e
dge inte
nsity
Centroid position (eV)
FePO4
Figure 6-15. Variogram for Fe in selected reference compounds and in Fe/H-ZSM-5 under in situ
conditions. Dotted vertical line at 7112.6 and 7113.5 eV indicate the average energy position of the
centroid for Fe2+ and Fe3+ compounds respectively.
Previous studies point to a linear response of the pre-edge centroid energy with the
oxidation state.64 Hence, a rough estimation of the reduction to Fe2+ can be performed via
similar approach as in Equation 6-2 and using the centroid position of the calcined Fe/H-
ZSM-5 (7114.42 eV) and FeSO4.7H2O (7112.63 eV) as the references for Fe3+ and Fe2+
species respectively. The approximate estimation for Fe/H-ZSM-5 under SCR conditions
(pre-edge centroid at 7112.95 eV) suggests that around 60 % of species undergo reduction
to Fe2+.
From the data we cannot unequivocally discern and quantify the different possible
geometries for Fe2+ and Fe3+ species in reduced Fe/H-ZSM-5. Recent in situ electron
paramagnetic resonance (EPR) studies highlight that isolated octahedral Fe3+ sites in ion
exchanged Fe/zeolites are more reducible than tetrahedral sites.76 In this regard, we can
hypothesise that the Oh Fe3+ fraction of our samples is being reduced under reaction
conditions used here while the Td Fe3+ remains oxidised. In future, in situ EPR/EXAFS
studies in our catalysts will allow to verify the reducibility of different Fe geometries.
Note the integrated pre-edge intensity of reduced Fe/H-ZSM-5 (around 0.27) is
significantly higher than FeSO4.7H2O with (0.08). This is also the case when considering

253
just the first pre-edge component at 7112.5 eV contributed only by Fe2+ fraction of Fe
species. This intensity increase suggests a more distorted geometry of Fe2+ species in the
catalyst. Alternatively, the state of the Fe2+ species can be regarded as a local geometry
with coordination number of ca. 5 as proposed by Bouvnov et al.4
As explained in the previous section, compared to the other samples, the calcined
Fe/H-ZSM-5 presented K1,3 shifted to higher energies suggesting a greater ionic
character in the Fe-ligand bond. The K main emission lines of Fe/H-ZSM-5 collected
during the in situ experiments (Figure 6-16) exhibit no noticeable changes to account for
variations in covalency under different gas compositions studied. Thus, at this stage we
cannot readily correlate the XES lines with the presence of ligands that would actively
participate during SCR reaction. Future experiments should be designed to understand
the nature of the spectral differences between the catalysts.
7040 7045 7050 7055 7060
K1,3
O2 500 oC
NO 200 oC
NH3 200 oC
SCR 300 oC
Norm
alis
ed inte
nsity (
a.u
.)
Energy (eV)
K'
Figure 6-16. K mainlines collected for Fe/H-ZSM-5 after activation in 20 % O2/He (500 °C, GHSV =
12000 h-1), under 0.1 % NO/He and 1 % NH3/He (200 °C, GHSV = 12000 h-1) and under SCR conditions
(5 % O2, 5000 ppm NO, 5000 ppm NH3 in He, 300 °C, GHSV = 30000 h-1).
Regarding the other three catalysts studied, Fe/S1-T-citr, Fe-S1-T-nitr and Fe/H-
SSZ-13, the in situ HERFD-XANES spectra presented only minor changes under the
different gas environments studied (see Figure 6-17a). Pre-edge deconvolution and the

254
resulting variograms are shown in the appendix (figures A6-5 to A6-8 and Table A6-
2); these variograms present only small shifts that are within the analysis error. No
significant changes are seen either in the K mainlines (Figure 6-17b).
The fact that no reduction was observed in the samples suggests that the Fe centres
in these samples present decreased redox activity. This is expected for FexOy clusters
and large Fe2O3 particles (main species in Fe/S1-T-nitr and Fe/H-SSZ-13), which, by
having a lower number of accessible sites for adsorption, should have a lower activity
for SCR at low temperatures.27,77,78 Importantly, the absence of spectral changes in
Fe/S1-T-citr, dominated by isolated Td Fe3+species, goes in line with the hypothesis
drawn with Fe/H-ZSM-5 on Oh Fe3+ being the reducible species under reaction
conditions used here, while Td species remain oxidised. It needs to be considered
however, that isomorphously substituted Td Fe in Silicalite-1 is probably less
accessible to reactants than extraframework Fe species. This is due to the fact that
substituted Fe sites are shielded and stabilised by the zeolite framework.51,78
7040 7045 7050 7055 7060
Fe/S1-T-nitr
Fe/S1-T-citr
No
rma
lise
d in
en
sity (
a.u
.)
Energy (eV)
O2 500
oC
NO 200 oC
NH3 200
oC
SCR 300 oC
Fe/H-SSZ-13
b)
Figure 6-17. Fe/S1-T-citr, Fe/S1-T-nitr and Fe/H-SSZ-13 spectra acquired after activation (20 % O2/He,
500 °C, GHSV = 12000 h-1) under NO (0.1 % NO/He 200 °C, GHSV = 12000 h-1), under NH3 (1 % NH3/He,
200 °C, GHSV = 12000 h-1) and under SCR conditions (5 % O2, 5000 pm NO, 5000 ppm NH3 in He, 300
°C, GHSV = 30000 h-1): a) Fe K-edge HERFD-XANES, and b) Fe K emission mainlines.
6.3.3.4 Standard NH3-SCR catalytic results for Fe/zeolites:
Standard NH3-SCR catalytic results of all four Fe/zeolites in Figure 6-18 present
formation of N2 and H2O products while no significant NO2 or N2O side products are
detected. This is expected for Fe-based catalysts which compared to other SCR catalysts
(i.e. Cu/zeolites) show increased selectivity to N2 under standard SCR conditions at 300
7100 7110 7120 7130 7140 7150
Fe/S1-T-nitr
Fe/S1-T-citr
Norm
alis
ed
x
(E)
Energy (eV)
O2 500 oC
NO 200 oC
NH3 200 oC
SCR 300 oC
Fe/H-SSZ-13
a)
7112 7116 7120

255
℃.79 From the intensity of the MS signals it can be concluded that Fe/H-ZSM-5 is the
most active catalyst under the conditions studied here (5000 ppm NO, 5000 ppm NH3 and
5 % O2 flow at 300 °C, GHSV = 35000 h-1). This catalyst exhibits the lowest signals for
the NO and NH3 reactants and highest signal for N2 and H2O products. Comparatively,
the activity greatly decreases for the two Fe/Silicalite-1 catalysts while Fe/H-SSZ-13
presents the lowest activity of the four.
Accordingly, the NO conversion values obtained for the catalysts after one hour of
reaction (Figure 6-19) result in the following trend: Fe/H-ZSM-5 (63.4 %) > Fe/S1-T-citr
(23.8 %) > Fe/S1-T-nitr (20. 0 %) > Fe/H-SSZ-13 (17.1 %). These trends suggest that
isolated Fe species are the most active centres for NH3-SCR at 300 °C while clusters and
large Fe2O3 particles show lower NH3-SCR performance.
Figure 6-18. MS data (with all m/z signals normalised to He) collected during NH3-SCR under 5000 ppm
NO, 5000 ppm NH3 and 5 % O2 flow at 300 °C, GHSV = 35000 h-1: a) Fe/H-ZSM-5, b) Fe/S1-T-citr, c)
Fe/S1-T-nitr and d) Fe/H-SSZ-13.

256
Fe/H-ZSM-5 Fe/S1-T-citr Fe/S1-T-nitr Fe/H-SSZ-130
10
20
30
40
50
60
70
NO
con
ve
rsio
n (
%)
Figure 6-19. NO conversion of Fe/zeolites after 1 h of NH3-SCR under 5000 ppm NO, 5000 ppm NH3
and 5 % O2 flow at 300 °C, GHSV = 35000 h-1.
Interestingly, Fe/H-ZSM-5 presents significantly higher NO conversion than the
other samples studied. In spite of the differences in Fe species distribution, activity in
Fe/S1-T-citr, Fe/S1-T-nitr and Fe/H-SSZ-13 show moderate variations. Even Fe/S1-T-
citr, dominated by isolated Td Fe3+ centres, gives nearly three times less NO conversion
than Fe/H-ZSM-5. The lower activity in these samples can be related with the decreased
iron reducibility observed by HERFD-XANES. The results can be rationalised if we
consider that isolated Td Fe3+ are anchored in the nests filling zeolite framework positions
and resulting in highly stable FeO4 tetrahedra. Framework Fe is known to be harder to
reduce as it is stabilised and shielded by the zeolite.51,78 In line, extra framework isolated
Fe sites have been reported to be more active for NH3-SCR than isomorphously
substituted Fe species.78,79
Hence, it appears that optimal NH3-SCR activity in Fe/H-ZSM-5 is given by highly
reducible isolated Oh Fe3+ species. The presence of framework Al and the resulting ion
exchange capacity of H-ZSM-5 is probably the driving force for the formation these
highly active Fe centres. Indeed, it has been suggested that partial compensation of the
positive charge of ion exchanged Fe species by the local negative charge likely facilitates
the Fe3+/Fe2+ redox cycle resulting in high catalytic activity in NH3-SCR.80 While Fe/H-
SSZ-13 also contains framework Al, the Fe in this catalyst is largely not in ion exchange
form (i.e. isolated Fe species). As discussed earlier, due to a small zeolite pore, the metal
is mostly agglomerated as Fe2O3 particles in the zeolite outer surface which explains its
low activity.

257
It needs to be pointed out that the samples compared in these study present different
acidic properties: H-ZSM-5 and H-SSZ-13 present BAS while Silicalite-1does not. Some
studies support an active role of BAS in NH3-SCR;30,31,34 nonetheless, most recent
research discard zeolite Brønsted acidity to play a decisive part for good NOx reduction
activity.32,35
6.4 Summary and conclusions
Fe/Silicalite-1 for MDA: the two 0.5 wt. % Fe/Silicalite-1 catalyst studied for MDA
suggest that an increased initial iron dispersion results in better MDA performance up to
90 min of reaction. Nonetheless carbon deposition is not prevented by the use of a non-
acidic support suggesting these are formed by the active Fe centres. In previous chapters,
deactivation in Mo/zeolites was attributed to instability and sintering of MoxCy species.
In future, further microscopy/spectroscopic studies on Fe/Silicalite-1 catalysts should be
carried out to elucidate if the carbon deposition and deactivation mechanisms in these
materials is analogous to Mo-based catalysts. The investigation of synthesis approaches
for the stabilisation of single Fe atoms could also be studied. Comparison of MDA
product distribution in these materials would help to develop on the hypothesis proposed
by Guo et al. who report that single atom Fe species are key for preventing carbon
deposition.1
Fe/zeolites for NH3-SCR: 0.5 wt. % Fe/zeolites have been synthesised by incipient
wetness impregnation using H-ZSM-5, Silicalite-1 and H-SSZ-13 zeolites as the supports.
The samples have been characterised by UV-Vis and HERFD-XANES/XES. Changes in
the Fe chemical state under O2, NO, NH3 exposure as well as under SCR conditions have
been studied by in situ HERFD-XANES/XES.
- The preparation methods used led to the formation of catalysts with varied Fe
species which have been characterised by UV-Vis and HERFD-XANES. Fe/H-
ZSM-5 comprises isolated monomeric Fe3+ species with both Oh and Td
geometries. Fe/Silicalite-1 prepared with ferric citrate contains highly dispersed
Fe species mainly in tetrahedral coordination while Fe/Silicalite-1 prepared with
ferric nitrate presents increased amounts of FexOy clusters and Fe2O3 particles.
Finally, Fe/H-SSZ-13 catalyst comprises mainly large Fe2O3 particles.

258
- Changes in the spectra during in situ HERFD-XANES experiments were only
observed for Fe/H-ZSM-5. The increase of the white line intensity upon NO
exposure indicates an increase in Fe coordination which can be attributed to NO
adsorption on Fe centres. Exposing the catalyst to NH3 flow or SCR conditions
evidences partial reduction to Fe2+. It is hypothesised that isolated Oh Fe species
undergo reduction while Td species remain oxidised.
- The catalyst activity studies present the following NO conversion trend: Fe/H-
ZSM-5 >> Fe/S1-T-citr > Fe/S1-T-nitr > Fe/H-SSZ-13, indicating that under the
conditions here used isolated species are more active than FexOy clusters and
large Fe2O3 particles. The much higher activity on Fe/H-ZSM-5 is attributed to
the Oh Fe+3 species with enhanced redox behaviour. The presence of framework
Al appears to promote the formation of such species in ion exchange sites
probably providing charge compensation facilitating Fe redox activity. It is likely
then that such species are also present in very small amounts in H-SSZ-13 and
are the source of the activity of this system.
- Unlike the other catalysts studied, Fe/H-ZSM-5 presents a slight shift of the K1,3
X-ray emission peak to lower energies. This shift suggests a more ionic metal-
ligand (Fe-O) bond character probably induced by the fact that isolated Fe centres
are ion exchanged near framework AlO4- compensating the charge. Alternatively,
the shift could be due to the presence of specific ligands (e.g. hydroxyls) that
could be implicated in the SCR reaction. The absence of detectable changes in
K1,3 under reaction condition however, does not allow to see a direct correlation
between the increased ionicity and SCR mechanism.
- The origin of the lower SCR activity of the Fe/Silicalite-1 samples is on first
glance puzzling; the Td Fe3+ present in such samples present little evidence of
interacting with the reactants and/or Fe reduction. The fact that these catalysts
show some NO conversion suggests that they are in fact active although not as
active as the Oh Fe3+ in H-ZSM-5. These observations suggest that the
reducibility of Fe and its capacity to coordinate with reactant gases is probably
important for realising low-temperature activity which is essential during cold-
start/idling of vehicles. Cu-based catalysts are usually the choice for low
temperature SCR; they show appreciable activity (100 % NO conversion) already
at 200 ℃ while Fe-based catalysts require at least 300 ℃.81 Nonetheless, for its

259
industrial use, Fe is cheaper than Cu and there are no reported issues with its use
in such technology on a global scale. Perhaps then, understanding how the
reducibility of Fe can be further affected is key to realising low temperature
activity of these catalysts for the standard SCR reaction.
As little has been published regarding in the ionicity and structural implication
derived from K1,3 mainlines, a more fundamental study on such phenomena could be
designed in future using Fe references and well characterised Fe/zeolites. Additionally,
EPR and EXAFS studies on these catalysts should be carried to complement on the
structural information of Fe units. A detailed understanding the structural differences
between isolated species in Fe/H-ZSM-5 and Fe/S1-T-citr is particularly interesting as
this could help to better rationalise the observed differences in isolated Oh and Td Fe
activity. Performing these XAS studies in operando SCR and with increasing temperature
ramp would complete the story and build on the temperature dependence of the activity
of different Fe centres. Further chemical analysis in Fe/Silicalite-1 should be carried out
to study the presence of Al traces in the sample; these impurities would give some
Brønsted acidity inducing formation of small amounts of highly active Fe species as the
ones observed in Fe/H-ZSM-5.
6.5 References
1 X. Guo, G. Fang, G. Li, H. Ma, H. Fan, L. Yu, C. Ma, X. Wu, D. Deng, M. Wei,
D. Tan, R. Si, S. Zhang, J. Li, L. Sun, Z. Tang, X. Pan and X. Bao, Science, 2014,
344, 616–9.
2 E. V Kondratenko and J. Pérez-Ramírez, J. Phys. Chem. B, 2006, 110, 22586–
22595.
3 G. Berlier, G. Ricchiardi, S. Bordiga and A. Zecchina, J. Catal., 2005, 229, 127–
135.
4 A. Boubnov, H. W. P. Carvalho, D. E. Doronkin, T. Gunter, E. Gallo, A. J. Atkins,
C. R. Jacob and J. D. Grunwaldt, J. Am. Chem. Soc., 2014, 136, 13006–13015.
5 M. Iwasaki, K. Yamazaki, K. Banno and H. Shinjoh, J. Catal., 2008, 260, 205–
216.

260
6 M. Ravi, M. Ranocchiari and J. A. van Bokhoven, Angew. Chemie Int. Ed., 2017,
56, 16464–16483.
7 E. Hensen, Q. Zhu, P.-H. Liu, K.-J. Chao and R. van Santen, J. Catal., 2004, 226,
466–470.
8 L. Meng, X. Zhu and E. J. M. Hensen, ACS Catal., 2017, 7, 2709–2719.
9 B. M. Weckhuysen, D. Wang, M. P. Rosynek and J. H. Lunsford, J. Catal., 1998,
175, 347–351.
10 Y. Lai and G. Veser, Catal. Sci. Technol., 2016, 6, 5440–5452.
11 B. M. Weckhuysen, D. Wang, M. P. Rosynek and J. H. Lunsford, Angew. Chemie
Int. Ed. English, 1997, 36, 2374–2376.
12 A. Zecchina, M. Rivallan, G. Berlier, C. Lamberti and G. Ricchiardi, Phys. Chem.
Chem. Phys., 2007, 9, 3483–3499.
13 J. A. van Bokhoven and C. Lamberti, Coord. Chem. Rev., 2014, 277, 275–290.
14 S. S. Masiero, N. R. Marcilio and O. W. Perez-Lopez, Catal. Letters, 2009, 131,
194–202.
15 D. Wang, J. H. Lunsford and M. P. Rosynek, Top. Catal., 1996, 3, 289–297.
16 Z. R. Ismagilov, E. V. Matus and L. T. Tsikoza, Energy Environ. Sci., 2008, 1,
526-541.
17 N. A. Grosso-Giordano, A. J. Yeh, A. Okrut, D. J. Xiao, F. Grandjean, G. J. Long,
S. I. Zones and A. Katz, Chem. Mater., 2017, 29, 6480–6492.
18 S. Brandenberger, O. Krö Cher, A. Tissler, R. Althoff and O. Kröcher, Catal. Rev.,
2008, 50, 492–531.
19 J. Li, H. Chang, L. Ma, J. Hao and R. T. Yang, Catal. Today, 2011, 175, 147–156.
20 M. P. Ruggeri, A. Grossale, I. Nova, E. Tronconi, H. Jirglova and Z. Sobalik,
Catal. Today, 2012, 184, 107–114.
21 J. L. Sorrels, D. D. Randall, K. S. Schaffner and C. R. Fry, Selective Catalytic
Reduction, 2016, 1-96.

261
22 M. Schwidder, M. S. Kumar, K. Klementiev, M. M. Pohl, A. Brückner and W.
Grünert, J. Catal., 2005, 231, 314–330.
23 R. Q. Long and R. T. Yang, Catal. Letters, 2001, 74, 201–205.
24 Q. Sun, Z.-X. Gao, H.-Y. Chen and W. M. . Sachtler, J. Catal., 2001, 201, 89–99.
25 H.-Y. Chen, E.-M. El-Malki, X. Wang, R. A. Van Santen and W. M. H. Sachtler,
J. Mol. Catal. A Chem., 2000, 162, 159–174.
26 M. Høj, M. J. Beier, J.-D. Grunwaldt and S. Dahl, Appl. Catal. B Environ., 2009,
93, 166–176.
27 S. Brandenberger, O. Kröcher, A. Tissler and R. Althoff, Applied Catal. B,
Environ., 2010, 95, 348–357.
28 P. S. Metkar, N. Salazar, R. Muncrief, V. Balakotaiah and M. P. Harold, Appl.
Catal. B Environ., 2011, 104, 110–126.
29 T. C. Bruggemann and F. J. Keil, J. Phys. Chem. C, 2011, 115, 23854–23870.
30 R. Q. Long and R. T. Yang, J. Catal., 1999, 188, 332–339.
31 R. Q. Long and R. T. Yang, J. Catal., 2002, 207, 224–231.
32 M. Schwidder, M. Santhosh Kumar, U. Bentrup, J. Pérez-Ramírez, A. Brückner
and W. Grünert, Microporous Mesoporous Mater., 2008, 111, 124–133.
33 D. Klukowski, P. Balle, B. Geiger, S. Wagloehner, S. Kureti, B. Kimmerle, A.
Baiker and J.-D. Grunwaldt, Appl. Catal. B Environ., 2009, 93, 185–193.
34 M. Li, Y. Yeom, E. Weitz and W. M. H. Sachtler, Catal. Letters, 2006, 112, 129–
132.
35 S. Brandenberger, O. Kröcher, A. Wokaun, A. Tissler and R. Althoff, J. Catal.,
2009, 268, 297–306.
36 D. D. Kragten, J. M. Fedeyko, K. R. Sawant, J. D. Rimer, D. G. Vlachos, R. F.
Lobo and M. Tsapatsis, J. Phys. Chem. B, 2003, 107, 10006–10016.
37 Y. Bu, Y. Wang, Y. Zhang, L. Wanga, Z. Mi, W. Wub, E. Min and S. Fu, Catal.
Commun., 2007, 8, 16–20.

262
38 A. M. Beale, I. Lezcano-Gonzalez, W. A. Slawinksi and D. S. Wragg, Chem.
Commun., 2016, 52, 6170–6173.
39 M. Moliner, C. Franch, E. Palomares, M. Grill and A. Corma, Chem. Commun.
Chem. Commun, 2012, 48, 8264–8266.
40 M.-J. Díaz-Cabañas, P. A. Barrett and M. A. Camblor, Chem. Commun., 1998,
1881–1882.
41 L. J. Lobree, I. Hwang, J. A. Reimer and A. T. Bell, 1999, 253, 242–253.
42 I. Melián-Cabrera, F. Kapteijn and J. A. Moulijn, Catal. Today, 2005, 110, 255–
263.
43 G. Berlier, G. Spoto, S. Bordiga, G. Ricchiardi, P. Fisicaro, A. Zecchina, I.
Rossetti, E. Selli, L. Forni, E. Giamello and C. Lamberti, J. Catal., 2002, 208, 64–
82.
44 IZA-SC, Database Zeolite Struct., 2007, 5, 250–251, (accessed 24 February 2018).
45 M. Matzapetakis, C. P. Raptopoulou, A. Tsohos, V. Papaefthymiou, N. Moon and
A. Salifoglou, J. Am. Chem. Soc., 1998, 120, 13266–13267.
46 J. Klaas, G. Schulz-Ekloff and N. I. Jaeger, J. Phys. Chem. B, 1997, 101, 1305–
1311.
47 A. J. Dent, G. Cibin, S. Ramos, A. D. Smith, S. M. Scott, L. Varandas, M. R.
Pearson, N. A. Krumpa, C. P. Jones and P. E. Robbins, J. Phys. Conf. Ser., 2009,
190, 012039.
48 B. Ravel and M. Newville, J. Synchrotron Radiat., 2005, 12, 537–541.
49 I20- Scanning - Diamond Light Source,
http://www.diamond.ac.uk/Beamlines/Spectroscopy/I20/XAS_XES_Branchline.
html, (accessed 24 February 2018).
50 J. Pérez-Ramírez, M. S. Kumar and A. Brückner, J. Catal., 2004, 223, 13–27.
51 S. Bordiga, R. Buzzoni, F. Geobaldo, C. Lamberti, E. Giamello, A. Zecchina, G.
Leofanti, G. Petrini, G. Tozzola and G. Vlaic, J. Catal., 1996, 158, 486–501.
52 M. Wilke, F. Farges, P.-M. Petit, G. E. Brown JR and F. Martin, Am. Mineral.,

263
2001, 86, 714–730.
53 A. M. Beale and G. Sankar, J. Mater. Chem., 2002, 12, 3064–3072.
54 A. Sanson, O. Mathon and S. Pascarelli, J. Chem. Phys. J. Chem. Phys. J. Chem.
Phys. J. Chem. Phys. J. Appl. Phys. J. Chem. Phys. J. Chem. Phys., 2014, 140,
224504–144305.
55 P. Marturano, L. Drozdo, A. Kogelbauer and R. Prins, J. Catal., 2000, 192, 236–
247.
56 G. Sankar, J. M. Thomas and C. R. A. Catlow, Top. Catal., 2000, 10, 255–264.
57 L. Wang, L. Tao, M. Xie, G. Xu, J. Huang and Y. Xu, Catal. Letters, 1993, 21,
35–41.
58 S. M. Maier, A. Jentys, E. Metwalli, P. M€ Uller-Buschbaum and J. A. Lercher, J.
Phys. Chem. Lett, 2011, 2, 950–955.
59 J. Prietzel, J. Thieme, K. Eusterhues and D. Eichert, Eur. J. Soil Sci., 2007, 58,
1027–1041.
60 T. E. Westre, P. Kennepohl, J. G. Dewitt, B. Hedman, K. O. Hodgson and E. I.
Solomon, J. Am. Chem. Soc., 1997, 119, 6297–6314.
61 T. E. Westre, P. Kennepohl, J. G. Dewitt, B. Hedman, K. O. Hodgson and E. I.
Solomon, J. Am. Chem. Soc., 1977, 119, 6297–6314.
62 A. Boubnov, H. Lichtenberg, S. Mangold and J. D. Grunwaldt, J. Synchrotron
Radiat., 2015, 22, 410–426.
63 W. M. Heijboer, P. Glatzel, K. R. Sawant, R. F. Lobo, U. Bergmann, R. a Barrea,
D. C. Koningsberger, B. M. Weckhuysen and F. M. F. de Groot, J. Phys. Chem. B,
2004, 108, 10002–10011.
64 A. Ceglia, G. Nuyts, S. Cagno, W. Meulebroeck, K. Baert, P. Cosyns, K. Nys, H.
Thienpont, K. Janssens and H. Terryn, Anal. Methods, 2014, 6, 2662–2671.
65 K. Taxer and H. Bartl, Cryst. Res. Technol., 2004, 39, 1080–1088.
66 U. Bergmann and P. Glatzel, Photosyth Res, 2009, 102, 255–266.
67 P. Glatzel, M. Sikora and M. Fernández-García, Eur. Phys. J. Spec. Top., 2009,

264
169, 207–214.
69 Y. I. Joe, G. C. O ’neil, L. Miaja-Avila, J. W. Fowler, R. Jimenez, K. L. Silverman,
D. S. Swetz and J. N. Ullom, J. Phys. B At. Mol. Opt. Phys., 2015, 49, 024003.
70 C. J. Pollock, M. U. Delgado-Jaime, M. Atanasov, F. Neese and S. DeBeer, J. Am.
Chem. Soc., 2014, 136, 9453–9463.
71 A. P. Grosvenor, B. A. Kobe, M. C. Biesinger and N. S. Mcintyre, Surf.
INTERFACE Anal. Surf. Interface Anal, 2004, 36, 1564–1574.
72 W. H. Baur, Acta Crystallogr., 1964, 17, 1167–1174.
73 M. P. Ruggeri, T. Selleri, M. Colombo, I. Nova and E. Tronconi, J. Catal., 2014,
311, 266–270.
74 C. J. Pollock and S. Debeer, J. Am. Chem. Soc, 2011, 133, 5594–5601.
75 I. Lezcano-Gonzalez, D. S. Wragg, W. A. Slawinski, K. Hemelsoet, A. Van, Y.-
D. Deyne, M. Waroquier, V. Van Speybroeck and A. M. Beale, J. Phys. Chem.,
2015, 119, 24393–24403.
76 H. Liu, J. Wang, T. Yu, S. Fan and M. Shen, Catal. Sci. Technol, 2014, 4, 1350–
1356.
77 M. Schwidder, M. Santhosh Kumar, A. Brückner and W. Grünert, Chem.
Commun., 2005, 805–807.
78 H. Liu, J. Wang, T. Yu, S. Fan and M. Shen, Catal. Sci. Technol., 2014, 4, 1350–
1356.
79 F. Liu, L. Xie, X. Shi and H. He, in Zeolites in Sustainable Chemistry Synthesis,
Characterization and Catalytic Applications, ed. X. Xiao, Feng-Shou, Meng,
Springer, Berlin, 2016, pp. 393–434.
80 P. Sazama, B. Wichterlová, E. Tábor, P. Šťastný, N. K. Sathu, Z. Sobalík, J.
Dědeček, Š. Sklenák, P. Klein and A. Vondrová, J. Catal., 2014, 312, 123–138.
81 A. M. Beale, F. Gao, I. Lezcano-Gonzalez, C. H. F. Peden and J. Szanyi, Chem.
Soc. Rev. Chem. Soc. Rev, 2015, 44, 7371–7405.

265
Chapter 7
Conclusions and Future Work
7.1 Conclusions
Large part of this thesis is focused on the study of structure-activity relationships
of Mo-containing zeolites for methane dehydroaromatisation reaction. In this regard three
main structural properties of the catalysts have been investigated: 1) the nature and
location of the Mo centres, 2) the role of the zeolite Brønsted acid sites, and 3) the effect
of zeolite topology. The main remarks from these studies can be summarised as follows:
Mo species evolution; a study on 4 wt. % Mo/H-ZSM-5 (Si/Al = 15) medium pore
catalyst. XRD, FTIR, N2 physisorption and XAS results suggest that upon calcination of
initial MoO3/H-ZSM-5 physical mixtures Mo diffuses into zeolite pores resulting in
monomeric Mo-oxo species attached to the zeolite. HRPD measurements indicated that
these Mo-oxo species are located in specific framework positions (denoted Si(Al)6) near
the zeolite channel intersection. Evolution of these Mo centres during the MDA reaction
was also investigated by operando XAS measurements. The results support previous
emission studies suggesting that during the induction period, initial Mo-oxo species are
reduced into partially carburised MoOxCy intermediates. These species remain attached
to the zeolite and at this stage H2, CO, CO2 and H2O reaction products are detected. After
longer reaction times, when aromatics formation is observed, Mo appears fully carburised
to MoxCy. As a result of the complete carburisation Mo species detach from the zeolite
and become mobile which goes in line with the immediate sintering into growing clusters
observed by XAS. These clusters migrate to zeolite outer surface as indicated by the
decrease in Mo occupancy in zeolite Si(Al)6 sites as well as by microscopy images.
The migration to the zeolite outer surface would imply the loss of shape selectivity
to benzene provided by the pore dimensions promoting the formation of bulkier
hydrocarbons; this explains the carbon deposition rate increase reported for MDA with
increasing reaction time. Hence, we propose MoxCy clusters to be the active species

266
responsible for aromatisation while the migration of this species plays a key role in the
fast material deactivation.
Role of Brønsted acidity; a study on 4 wt. % Mo/Silicalite-1 (pure Si) medium pore
catalyst. Silicalite-1 zeolite with same framework structure as H-ZSM-5 and similar
crystal size was successfully synthesised. Basic treatment using ethylenediamine
increased the number of silanol nests by the extraction of framework Si. Calcination of
MoO3/Silicalite-1 physical mixture resulted in molybdenum dispersion and migration
into the zeolite pores. FTIR studies point out that this dispersion is driven by the
interaction of the metal with silanol defects. XAS studies suggest that isolated tetrahedral
Mo-oxo species, analogue to the ones obtained for Mo/H-ZSM-5, are also present in
calcined Mo/Silicalite-1. Nonetheless, longer Mo-O distance for the framework O
indicates weaker interaction of Mo with the Silicalite-1 support. The MDA catalytic
testing for this material resulted in the production of aromatics in spite of the absence of
BAS. While it has been generally accepted that BAS are responsible for aromatisation
activity, our results imply that Brønsted acidity is not required for the formation of
benzene on Mo-based catalysts. The rapid deactivation observed on Mo/Silicalite-1 can
be explained by the instability of molybdenum active species in purely siliceous zeolite
and its faster sintering and migration. In addition, activity tests carried out for Mo
supported on amorphous SiO2 with different surface areas seems to verify that BAS are
not essential for aromatisation provided that the catalysts comprises a good Mo
dispersion.
Effect of zeolite topology on Mo speciation and product distribution; study on 4 wt.
% Mo/H-SSZ-13 (Si/Al = 15) small pore catalyst. Evolution of Mo species, investigated
by XAS in operando MDA on 4 wt. % Mo/H-SSZ-13, revealed that Mo undergoes similar
evolution as in medium pore catalysts. Nonetheless, EXAFS features for the small pore
catalyst suggest Mo is further reduced into its metallic form. Migration of MoxCy particles
was not prevented by the H-SSZ-13 topology and again sintering seems to be the main
catalyst deactivation pathway.
Lower selectivity to benzene is observed for small pore catalysts as the result of
pore dimensions being too small for aromatic molecules. Nevertheless, the selectivity to
carbon deposits is higher and deactivation faster than for medium pore catalysts. Besides,
carbon deposits formed on Mo/H-SSZ-13 showed to be more stable which could be due

267
to the different Mo speciation (i.e. presence of metallic Mo in Mo/H-SSZ-13). QENS
experiments performed on spent catalysts suggest that the coke formed is located mainly
in the exterior of the zeolite.
Structure activity studies on Fe/zeolites has been also studied in this thesis in
addition to the Mo-based catalyst research. Preliminary studies on Fe/Silicalite-1 catalysts
for MDA revealed that a catalyst with Fe dispersion in monomeric species is more active
than a catalyst composed of Fe clusters or particles. The deposition is not prevented by
the use of non-acidic support suggesting carbon deposits are formed in the active Fe
centres. In future, further microscopy/spectroscopic studies on Fe/Silicalite-1 should be
carried out to elucidate if the carbon deposition and deactivation mechanisms in these
materials is analogue to Mo-based catalysts.
For the NH3-SCR studies, 0.5 wt. % Fe/zeolites have been synthesised using H-
ZSM-5, Silicalite-1 and H-SSZ-13 zeolites as the supports. The UV-vis and XANES
characterisation indicates that Fe/H-ZSM-5 prepared comprise isolated monomeric Fe
species; Fe/Silicalite-1 prepared with ferric citrate precursor (Fe/S1-T-citr) presents
highly dispersed Fe species in tetrahedral coordination while Fe/Silicalite-1 prepared with
ferric nitrate precursor (Fe/S1-T-nitr) presents more of the large clusters and Fe in Oh
symmetry. Finally, Fe/H-SSZ-13 catalyst comprises mainly large Fe2O3 particles with Fe
in Oh coordination.
The catalyst activity studies present the following NO conversion trend: Fe/H-
ZSM-5 >> Fe/S1-T-citr > Fe/S1-T-nitr > Fe/H-SSZ-13. This trend suggests that under the
conditions here used isolated species are more active than FexOy clusters and large Fe2O3
particles. In situ Fe K-edge HERFD-XANES studies were also carried out by exposing
the catalysts to NO, C and standard NH3-SCR (NO, NH3 and O2) gas flows. Changes in
the spectra under different gas conditions were only observed for Fe/H-ZSM-5. Increase
of the white line intensity upon NO exposure suggest increase in Fe coordination which
can be attributed to NO adsorption on Fe centres. Exposing the catalysts to NH3 or SCR
condition results in a partial iron reduction to Fe2+. It is hypothesised that Oh sites are the
ones undergoing reduction being highly active for NH3-SCR while Td Fe3+ remain
unchanged.
Interestingly, results on Fe/Silicalite-1 indicate that isolated Td Fe3+ shows little
evidence of interacting with the reactants and to undergo reduction. As these materials

268
show some NO conversion Td Fe3+ centres may still be active although less than Oh Fe3+
in H-ZSM-5. Framework Al in H-ZSM-5 may be a decisive factor to induce the formation
of highly active Fe structure while providing charge compensation for enhanced redox
activity.
7.2 Future work
The work carried out on Mo/zeolites give new insight about the structure of active
Mo species for MDA and the effect of the zeolite topology in the product distribution.
Importantly, the research brings valuable understanding on the catalyst deactivation
which up to date is the main limitation for the commercialisation of the MDA process.
Our results point out that deactivation is directly linked to the instability of the active Mo-
carbide which sinter and migrate to the outer surface of the zeolite resulting in an
increased selectivity to carbon deposits. Hence, the following topics are proposed as the
future work to continue the research in Mo/based catalysts:
- The study of new synthetic approaches. This would comprise the implementation
of synthesis strategies aiming for the stabilisation of Mo-carbides in shape selective
environment. Metal cluster encapsulation via direct hydrothermal synthesis for example
would enable to entrap Mo clusters in the zeolite cages during the hydrothermal zeolite
synthesis. Potentially this would keep active species in shape selective environment
preventing their migration and keeping high selectivity to benzene. Alternatively, taking
into account that Brønsted acidity is not essential, imbedding single Mo atoms into a silica
matrix could also be studied as a way to fix Mo sites and prevent sintering. Thus, the
chemistry of single Mo atoms in MDA could be investigated and compared to the
Fe@SiO2 work previously published with promising results. Finally, the use of secondary
metals could also be studied as the active species in MDA or else the use of promotors
that could lead to less mobile active species.
- Optimisation of the catalyst regeneration process. This will consist in the study
of Mo/zeolite regeneration conditions to burn off the carbon deposits and redisperse
MoO3 into the zeolite pores. Thus, a series of parameters such as the nature of oxidising
gas, temperature or regeneration time, could be evaluated aiming for a minimal catalyst
damage (i.e. avoiding zeolite dealumination or lose of MoO3 sublimation). The evolving
Mo speciation and possible damages to the zeolite structure could be studied by combined

269
operando XAS/XRD techniques over a series of reaction/regeneration cycles with varying
conditions.
- Study of the nature of carbon deposits. While carbon deposits formed during MDA
are considered the main cause of Mo/zeolites deactivation, some authors have suggested
they could as well play an important catalytic role. Gaining a detailed knowledge on the
nature of carbon deposits will help to better understand not only the catalyst deactivation
but also the possible involvement of carbonaceous species in the reaction mechanism.
Investigation of carbon species formed and their implications in the catalytic activity
could be carried out via operando Raman spectroscopy or by NMR spectroscopy.
Regarding the work carried out on Fe/zeolites for NH3-SCR, the results presented
in this thesis suggest that extaframework isolated Fe sites are active at low SCR
temperatures. It is argued that the presence of framework Al provides charge
compensation facilitating Fe redox activity for increased NO conversion. Low-
temperature activity is essential for reducing toxic NO emissions during cold-start/idling
of vehicles. Hence, as continuation of this study, the following topics are suggested as
future work:
- Understanding the reducibility of Fe species. Performing EPR and EXAFS studies
on Fe/zeolite catalyst studied here will provide complementary information on the redox
properties and structures of Fe species present. In addition, the NH3-SCR investigations
in this thesis were carried out at fixed reaction temperature of 300 ℃; performing the
EXAFS studies in operando with increasing reaction temperatures will complete the
research allowing to understand the temperature dependence of the activity of different
Fe centres.
- Mimic real conditions. The NH3-SCR studies presented in Chapter 6 were limited
to standard NH3-SCR conditions with NH3, NO and O2 as the reactants. A relevant
continuation of this work will comprise simulating exhaust gas conditions to study the
effect of NO2 and H2O (present in the Diesel engine exhaust) in the catalyst performance.
Operando X-ray spectroscopic studies under such gas environments will provide valuable
insight into the catalyst working mechanism under real conditions for vehicle
applications.

270

271
Appendix
CHAPTER 3
Mass spectrometry data for CH4, H2, and C2/C3 molecules during the early stage of
MDA over 4 wt. % Mo/H-ZM-5 compared with the blank measurement results.
-5 0 5 10 15 20 25
0.0
0.5
1.0
1.5
2.0
2.5
m/z = 15, blank
m/z = 15, Mo/H-ZSM-5
No
rma
lise
d io
n c
urr
en
t
Time (min)
m/z = 2, blank
m/z =2, Mo/H-ZSM-5
a)
-5 0 5 10 15 20 25
0.0005
0.0010
0.0015
0.0020
m/z = 25, blank
m/z = 25, Mo/H-ZSM-5 No
rma
lise
d io
n c
urr
en
t
Time (min)
m/z = 27, blank
m/z = 27, Mo/H-ZSM-5
b)
Figure A3-1. MAS ion current values (normalised to Ar) obtained during the MDA induction for 4 wt. %
Mo/H-ZSM-5 compared to the blank measurement; a) mass traces corresponding to H2 and CH4 and b) mass
traces for C2/C3 molecules.

272
The tables bellow contains the refined parameter results of the crystallographic data
for in situ calcined and ex situ reacted 4 wt. % Mo/H-ZSM-5 catalyst.
Table A3-1. Fractional atomic coordinates and isotropic or equivalent isotropic displacement parameters
(Å2) for 4 wt. % Mo/H-SM-5 in situ calcined in air at 600 ˚C for 8 h.
x y z Biso*/Beq Occ. (<1)
Si1 0.4288 (8) 0.0570 (8) −0.3308 (11) 1.96 (6)
Si2 0.3139 (9) 0.0283 (7) −0.1838 (14) 1.96 (6)
Si3 0.2751 (7) 0.0699 (8) 0.0407 (12) 1.96 (6)
Si4 0.1130 (7) 0.0579 (10) 0.0346 (12) 1.96 (6)
Si5 0.0680 (8) 0.0325 (8) −0.1853 (13) 1.96 (6)
Si6 0.1924 (8) 0.0680 (7) −0.3160 (13) 1.96 (6)
Si7 0.4226 (8) −0.1761 (8) −0.3293 (14) 1.96 (6)
Si8 0.3158 (9) −0.1380 (8) −0.1870 (13) 1.96 (6)
Si9 0.2771 (7) −0.1742 (8) 0.0321 (12) 1.96 (6)
Si10 0.1247 (8) −0.1782 (7) 0.0349 (13) 1.96 (6)
Si11 0.0673 (9) −0.1250 (9) −0.1756 (13) 1.96 (6)
Si12 0.1837 (8) −0.1729 (8) −0.3122 (13) 1.96 (6)
O1 0.3833 (13) 0.0484 (15) −0.2267 (18) 0.36 (9)
O2 0.3076 (16) 0.0616 (15) −0.0627 (16) 0.36 (9)
O3 0.2019 (13) 0.0584 (14) 0.0195 (16) 0.36 (9)
O4 0.0875 (14) 0.0616 (15) −0.0865 (18) 0.36 (9)
O5 0.1154 (13) 0.0625 (17) −0.257 (2) 0.36 (9)
O6 0.2541 (13) 0.0366 (15) −0.253 (2) 0.36 (9)
O7 0.3665 (14) −0.1574 (14) −0.2592 (19) 0.36 (9)
O8 0.3127 (17) −0.1616 (14) −0.0770 (18) 0.36 (9)
O9 0.1995 (16) −0.1511 (10) 0.0205 (19) 0.36 (9)
O10 0.0876 (14) −0.1638 (15) −0.064 (2) 0.36 (9)
O11 0.1180 (13) −0.1351 (16) −0.2604 (18) 0.36 (9)
O12 0.2453 (14) −0.1647 (13) −0.2183 (19) 0.36 (9)
O13 0.3209 (11) −0.0505 (13) −0.1861 (17) 0.36 (9)
O14 0.0782 (12) −0.0429 (13) −0.1586 (18) 0.36 (9)
O15 0.4042 (13) 0.1332 (15) −0.387 (2) 0.36 (9)
O16 0.4246 (17) −0.0028 (14) −0.401 (2) 0.36 (9)
O17 0.3971 (12) −0.1351 (15) −0.422 (2) 0.36 (9)
O18 0.1901 (16) 0.1202 (13) −0.3909 (18) 0.36 (9)
O19 0.2008 (15) −0.0190 (13) −0.3813 (17) 0.36 (9)
O20 0.1972 (16) −0.1410 (14) −0.4267 (19) 0.36 (9)
O21 0.0035 (15) 0.0678 (14) −0.2012 (19) 0.36 (9)
O22 0.0031 (16) −0.1436 (16) −0.213 (2) 0.36 (9)
O23 0.416 (2) −0.25 −0.363 (3) 0.36 (9)
O24 0.1656 (18) −0.25 −0.326 (3) 0.36 (9)
O25 0.2858 (18) −0.25 0.077 (3) 0.36 (9)
O26 0.122 (2) −0.25 0.070 (3) 0.36 (9)
Mo1 0.7117 (18) 0.059 (2) 0.890 (3) 2.5 0.120 (7)
Table A3-2. Geometric parameters (Å, °) obtained for 4 wt. % Mo/H-SM-5 in situ calcined in air at 600
˚C for 8 h.
Si1—O16 1.52 (3) O4—Si4 1.70 (3)
Si1—O21i 1.58 (3) O5—Si5 1.48 (3)
Si1—O1 1.68 (3) O5—Si6 1.74 (3)
Si1—O15 1.77 (3) O6—Si2 1.53 (3)
Si2—O6 1.53 (3) O6—Si6 1.62 (3)
Si2—O1 1.56 (3) O7—Si8 1.46 (3)

273
Si2—O13 1.58 (3) O7—Si7 1.51 (3)
Si2—O2 1.76 (3) O8—Si8 1.55 (3)
Si3—O3 1.52 (3) O8—Si9 1.65 (3)
Si3—O19ii 1.54 (3) O9—Si10 1.61 (4)
Si3—O2 1.54 (3) O9—Si9 1.63 (4)
Si3—O20ii 1.58 (3) O10—Si10 1.55 (3)
Si4—O16ii 1.59 (4) O10—Si11 1.73 (3)
Si4—O17ii 1.66 (4) O11—Si11 1.54 (3)
Si4—O4 1.70 (3) O11—Si12 1.67 (3)
Si4—O3 1.80 (3) O12—Si8 1.57 (3)
Si5—O5 1.48 (3) O12—Si12 1.77 (3)
Si5—O21 1.49 (3) O13—Si2 1.58 (3)
Si5—O4 1.50 (3) O13—Si8 1.75 (3)
Si5—O14 1.56 (3) O14—Si5 1.56 (3)
Si6—Mo1iii 1.08 (4) O14—Si11 1.67 (3)
Si6—O18 1.45 (3) O15—Si10iv 1.49 (3)
Si6—O6 1.62 (3) O15—Si1 1.77 (3)
Si6—O5 1.74 (3) O16—Si1 1.52 (3)
Si6—O19 1.95 (3) O16—Si4iv 1.59 (4)
Si7—O7 1.51 (3) O17—Si7 1.57 (3)
Si7—O23 1.55 (2) O17—Si4iv 1.66 (4)
Si7—O17 1.57 (3) O18—Mo1iii 1.30 (5)
Si7—O22i 1.83 (4) O18—Si6 1.45 (3)
Si8—O7 1.46 (3) O18—Si9iv 1.63 (3)
Si8—O8 1.55 (3) O19—Si3iv 1.54 (3)
Si8—O12 1.57 (3) O19—Mo1iii 1.57 (5)
Si8—O13 1.75 (3) O19—Si6 1.95 (3)
Si9—O18ii 1.63 (3) O20—Si3iv 1.58 (3)
Si9—O9 1.63 (4) O20—Si12 1.68 (3)
Si9—O25 1.64 (2) O21—Si5 1.49 (3)
Si9—O8 1.65 (3) O21—Si1v 1.58 (3)
Si10—O15ii 1.49 (3) O22—Si11 1.43 (4)
Si10—O26 1.507 (19) O22—Si7v 1.83 (4)
Si10—O10 1.55 (3) O23—Si7vi 1.55 (2)
Si10—O9 1.61 (4) O23—Si7 1.55 (2)
Si11—O22 1.43 (4) O24—Si12vi 1.591 (18)
Si11—O11 1.54 (3) O24—Si12 1.591 (18)
Si11—O14 1.67 (3) O25—Si9 1.64 (2)
Si11—O10 1.73 (3) O25—Si9vi 1.64 (2)
Si12—O24 1.591 (18) O26—Si10 1.507 (19)
Si12—O11 1.67 (3) O26—Si10vi 1.507 (19)
Si12—O20 1.68 (3) Mo1—Si6vii 1.08 (4)
Si12—O12 1.77 (3) Mo1—O18vii 1.30 (5)
O1—Si2 1.56 (3) Mo1—O19vii 1.57 (5)
O1—Si1 1.68 (3) Mo1—O6vii 2.07 (5)
O2—Si3 1.54 (3) Mo1—Si9viii 2.54 (5)
O2—Si2 1.76 (3) Mo1—O5vii 2.63 (4)
O3—Si3 1.52 (3) Mo1—Si3viii 2.74 (5)
O3—Si4 1.80 (3) Mo1—O9viii 2.83 (5)
O4—Si5 1.50 (3) Mo1—O3viii 3.15 (5)
O21i—Si1—O16 109.1 (19) O20—Si12—O11 109.7 (16)
O1—Si1—O21i 107.8 (16) O20—Si12—O24 107.2 (19)
O1—Si1—O16 113.8 (18) O12—Si12—O20 120.0 (16)
O15—Si1—O1 107.0 (16) O12—Si12—O11 102.4 (15)
O15—Si1—O21i 105.4 (16) O12—Si12—O24 109.4 (18)
O15—Si1—O16 113.2 (17) Si1—O1—Si2 145 (2)
O1—Si2—O6 116.8 (18) Si2—O2—Si3 154 (2)
O13—Si2—O1 99.7 (16) Si4—O3—Si3 160.8 (16)
O13—Si2—O6 99.5 (17) Si4—O4—Si5 155 (2)
O2—Si2—O13 113.6 (16) Si6—O5—Si5 153 (2)
O2—Si2—O1 107.9 (17) Si6—O6—Si2 163 (2)
O2—Si2—O6 117.7 (18) Si7—O7—Si8 176.2 (16)
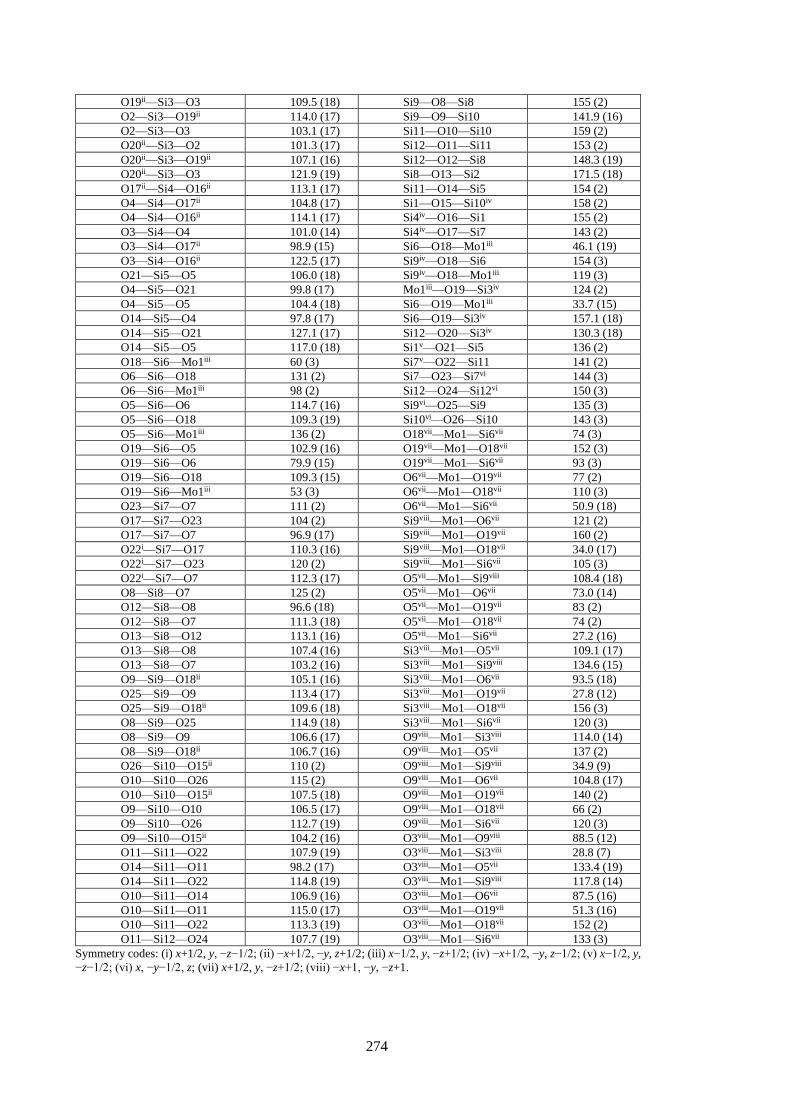
274
O19ii—Si3—O3 109.5 (18) Si9—O8—Si8 155 (2)
O2—Si3—O19ii 114.0 (17) Si9—O9—Si10 141.9 (16)
O2—Si3—O3 103.1 (17) Si11—O10—Si10 159 (2)
O20ii—Si3—O2 101.3 (17) Si12—O11—Si11 153 (2)
O20ii—Si3—O19ii 107.1 (16) Si12—O12—Si8 148.3 (19)
O20ii—Si3—O3 121.9 (19) Si8—O13—Si2 171.5 (18)
O17ii—Si4—O16ii 113.1 (17) Si11—O14—Si5 154 (2)
O4—Si4—O17ii 104.8 (17) Si1—O15—Si10iv 158 (2)
O4—Si4—O16ii 114.1 (17) Si4iv—O16—Si1 155 (2)
O3—Si4—O4 101.0 (14) Si4iv—O17—Si7 143 (2)
O3—Si4—O17ii 98.9 (15) Si6—O18—Mo1iii 46.1 (19)
O3—Si4—O16ii 122.5 (17) Si9iv—O18—Si6 154 (3)
O21—Si5—O5 106.0 (18) Si9iv—O18—Mo1iii 119 (3)
O4—Si5—O21 99.8 (17) Mo1iii—O19—Si3iv 124 (2)
O4—Si5—O5 104.4 (18) Si6—O19—Mo1iii 33.7 (15)
O14—Si5—O4 97.8 (17) Si6—O19—Si3iv 157.1 (18)
O14—Si5—O21 127.1 (17) Si12—O20—Si3iv 130.3 (18)
O14—Si5—O5 117.0 (18) Si1v—O21—Si5 136 (2)
O18—Si6—Mo1iii 60 (3) Si7v—O22—Si11 141 (2)
O6—Si6—O18 131 (2) Si7—O23—Si7vi 144 (3)
O6—Si6—Mo1iii 98 (2) Si12—O24—Si12vi 150 (3)
O5—Si6—O6 114.7 (16) Si9vi—O25—Si9 135 (3)
O5—Si6—O18 109.3 (19) Si10vi—O26—Si10 143 (3)
O5—Si6—Mo1iii 136 (2) O18vii—Mo1—Si6vii 74 (3)
O19—Si6—O5 102.9 (16) O19vii—Mo1—O18vii 152 (3)
O19—Si6—O6 79.9 (15) O19vii—Mo1—Si6vii 93 (3)
O19—Si6—O18 109.3 (15) O6vii—Mo1—O19vii 77 (2)
O19—Si6—Mo1iii 53 (3) O6vii—Mo1—O18vii 110 (3)
O23—Si7—O7 111 (2) O6vii—Mo1—Si6vii 50.9 (18)
O17—Si7—O23 104 (2) Si9viii—Mo1—O6vii 121 (2)
O17—Si7—O7 96.9 (17) Si9viii—Mo1—O19vii 160 (2)
O22i—Si7—O17 110.3 (16) Si9viii—Mo1—O18vii 34.0 (17)
O22i—Si7—O23 120 (2) Si9viii—Mo1—Si6vii 105 (3)
O22i—Si7—O7 112.3 (17) O5vii—Mo1—Si9viii 108.4 (18)
O8—Si8—O7 125 (2) O5vii—Mo1—O6vii 73.0 (14)
O12—Si8—O8 96.6 (18) O5vii—Mo1—O19vii 83 (2)
O12—Si8—O7 111.3 (18) O5vii—Mo1—O18vii 74 (2)
O13—Si8—O12 113.1 (16) O5vii—Mo1—Si6vii 27.2 (16)
O13—Si8—O8 107.4 (16) Si3viii—Mo1—O5vii 109.1 (17)
O13—Si8—O7 103.2 (16) Si3viii—Mo1—Si9viii 134.6 (15)
O9—Si9—O18ii 105.1 (16) Si3viii—Mo1—O6vii 93.5 (18)
O25—Si9—O9 113.4 (17) Si3viii—Mo1—O19vii 27.8 (12)
O25—Si9—O18ii 109.6 (18) Si3viii—Mo1—O18vii 156 (3)
O8—Si9—O25 114.9 (18) Si3viii—Mo1—Si6vii 120 (3)
O8—Si9—O9 106.6 (17) O9viii—Mo1—Si3viii 114.0 (14)
O8—Si9—O18ii 106.7 (16) O9viii—Mo1—O5vii 137 (2)
O26—Si10—O15ii 110 (2) O9viii—Mo1—Si9viii 34.9 (9)
O10—Si10—O26 115 (2) O9viii—Mo1—O6vii 104.8 (17)
O10—Si10—O15ii 107.5 (18) O9viii—Mo1—O19vii 140 (2)
O9—Si10—O10 106.5 (17) O9viii—Mo1—O18vii 66 (2)
O9—Si10—O26 112.7 (19) O9viii—Mo1—Si6vii 120 (3)
O9—Si10—O15ii 104.2 (16) O3viii—Mo1—O9viii 88.5 (12)
O11—Si11—O22 107.9 (19) O3viii—Mo1—Si3viii 28.8 (7)
O14—Si11—O11 98.2 (17) O3viii—Mo1—O5vii 133.4 (19)
O14—Si11—O22 114.8 (19) O3viii—Mo1—Si9viii 117.8 (14)
O10—Si11—O14 106.9 (16) O3viii—Mo1—O6vii 87.5 (16)
O10—Si11—O11 115.0 (17) O3viii—Mo1—O19vii 51.3 (16)
O10—Si11—O22 113.3 (19) O3viii—Mo1—O18vii 152 (2)
O11—Si12—O24 107.7 (19) O3viii—Mo1—Si6vii 133 (3)
Symmetry codes: (i) x+1/2, y, −z−1/2; (ii) −x+1/2, −y, z+1/2; (iii) x−1/2, y, −z+1/2; (iv) −x+1/2, −y, z−1/2; (v) x−1/2, y,
−z−1/2; (vi) x, −y−1/2, z; (vii) x+1/2, y, −z+1/2; (viii) −x+1, −y, −z+1.

275
Table A3-3. Fractional atomic coordinates and isotropic or equivalent isotropic displacement
parameters (Å2) for 4 wt. % Mo/H-SM-5 ex situ reacted in 50% CH4/Ar flow at 700 ˚C for 90 min.
x y z Biso*/Beq Occ. (<1)
Si1 0.4222 (10) 0.0585 (12) −0.3345 (14) 1.19 (7)
Si2 0.3137 (11) 0.0295 (8) −0.1849 (14) 1.19 (7)
Si3 0.2768 (8) 0.0611 (12) 0.0440 (14) 1.19 (7)
Si4 0.1175 (10) 0.0634 (12) 0.0307 (16) 1.19 (7)
Si5 0.0723 (10) 0.0315 (10) −0.1809 (15) 1.19 (7)
Si6 0.1867 (11) 0.0556 (11) −0.3126 (13) 1.19 (7)
Si7 0.4257 (10) −0.1752 (10) −0.3201 (17) 1.19 (7)
Si8 0.3122 (10) −0.1294 (9) −0.1789 (14) 1.19 (7)
Si9 0.2769 (9) −0.1755 (11) 0.0292 (15) 1.19 (7)
Si10 0.1216 (11) −0.1768 (11) 0.0252 (16) 1.19 (7)
Si11 0.0692 (11) −0.1297 (11) −0.1886 (15) 1.19 (7)
Si12 0.1897 (12) −0.1755 (8) −0.3285 (13) 1.19 (7)
O1 0.3796 (18) 0.049 (2) −0.249 (2) 1.21 (15)
O2 0.313 (2) 0.0539 (19) −0.064 (2) 1.21 (15)
O3 0.1981 (19) 0.0406 (14) 0.0281 (19) 1.21 (15)
O4 0.0909 (16) 0.0684 (18) −0.077 (3) 1.21 (15)
O5 0.1133 (18) 0.063 (2) −0.266 (2) 1.21 (15)
O6 0.2519 (17) 0.051 (2) −0.239 (2) 1.21 (15)
O7 0.375 (2) −0.1638 (17) −0.226 (3) 1.21 (15)
O8 0.3167 (19) −0.1690 (16) −0.066 (2) 1.21 (15)
O9 0.195 (2) −0.1640 (13) 0.018 (2) 1.21 (15)
O10 0.0884 (19) −0.1635 (18) −0.086 (3) 1.21 (15)
O11 0.127 (2) −0.1404 (19) −0.270 (3) 1.21 (15)
O12 0.244 (2) −0.155 (2) −0.236 (3) 1.21 (15)
O13 0.3190 (15) −0.0566 (17) −0.187 (2) 1.21 (15)
O14 0.0829 (15) −0.0467 (18) −0.180 (2) 1.21 (15)
O15 0.4092 (17) 0.1289 (19) −0.396 (3) 1.21 (15)
O16 0.410 (2) −0.002 (2) −0.411 (3) 1.21 (15)
O17 0.4041 (17) −0.1481 (18) −0.393 (2) 1.21 (15)
O18 0.190 (2) 0.1260 (19) −0.388 (2) 1.21 (15)
O19 0.190 (2) −0.0105 (18) −0.377 (2) 1.21 (15)
O20 0.2252 (16) −0.1480 (18) −0.428 (2) 1.21 (15)
O21 −0.0018 (19) 0.054 (2) −0.204 (2) 1.21 (15)
O22 0.0007 (19) −0.1432 (19) −0.229 (2) 1.21 (15)
O23 0.434 (3) −0.25 −0.340 (4) 1.21 (15)
O24 0.179 (3) −0.25 −0.335 (3) 1.21 (15)
O25 0.296 (3) −0.25 0.089 (3) 1.21 (15)
O26 0.109 (2) −0.25 0.059 (3) 1.21 (15)
Mo1 0.689 (9) 0.048 (9) 0.918 (10) 2.5 0.037 (6)
N1 0.01536 0.63308 0.46835 1.5 1.52 (2)*
N2 0.7105 0.75 0.15645 1.5 1.20 (4)*
N3 0.5777 0.16397 0.62617 1.5 0.16 (4)
Table A3-4. Geometric parameters (Å, °) obtained for 4 wt. % Mo/H-SM-5 ex situ reacted in 50 %
CH4/Ar at 700 ˚C for 90 min.
Si1—O1 1.45 (4) O5—Si5 1.55 (4)
Si1—O16 1.60 (4) O5—Si6 1.61 (4)
Si1—O21i 1.62 (4) O6—Si2 1.50 (4)
Si1—O15 1.65 (4) O6—Si6 1.64 (4)
Si2—O6 1.50 (4) O7—Si8 1.57 (5)
Si2—O1 1.62 (4) O7—Si7 1.64 (5)
Si2—O2 1.70 (4) O8—Si9 1.52 (4)
Si2—O13 1.72 (4) O8—Si8 1.71 (4)

276
Si3—O19ii 1.60 (4) O9—Si10 1.51 (5)
Si3—O2 1.62 (4) O9—Si9 1.67 (5)
Si3—O3 1.65 (4) O10—Si11 1.58 (4)
Si3—O20ii 1.77 (4) O10—Si10 1.66 (4)
Si4—O4 1.54 (4) O11—Si11 1.61 (4)
Si4—O16ii 1.56 (5) O11—Si12 1.64 (4)
Si4—O3 1.68 (4) O12—Si8 1.66 (4)
Si5—O5 1.55 (4) O12—Si12 1.70 (5)
Si5—O14 1.57 (4) O13—Si8 1.46 (4)
Si5—O21 1.59 (4) O13—Si2 1.72 (4)
Si5—O4 1.62 (4) O14—Si5 1.57 (4)
Si6—Mo1iii 1.43 (13) O14—Si11 1.68 (4)
Si6—O19 1.58 (4) O15—Si10iv 1.56 (4)
Si6—O5 1.61 (4) O15—Si1 1.65 (4)
Si6—O6 1.64 (4) O16—Si4iv 1.56 (5)
Si6—O18 1.73 (4) O16—Si1 1.60 (4)
Si7—O17 1.20 (4) O17—Si7 1.20 (4)
Si7—O23 1.53 (2) O18—Mo1iii 1.61 (17)
Si7—O7 1.64 (5) O18—Si9iv 1.63 (4)
Si7—O22i 1.77 (4) O18—Si6 1.73 (4)
Si8—O13 1.46 (4) O19—Mo1iii 1.29 (17)
Si8—O7 1.57 (5) O19—Si6 1.58 (4)
Si8—O12 1.66 (4) O19—Si3iv 1.60 (4)
Si8—O8 1.71 (4) O20—Si12 1.61 (4)
Si9—O8 1.52 (4) O20—Si3iv 1.77 (4)
Si9—O18ii 1.63 (4) O21—Si5 1.59 (4)
Si9—O9 1.67 (5) O21—Si1v 1.62 (4)
Si9—O25 1.73 (3) O22—Si11 1.50 (4)
Si10—O9 1.51 (5) O22—Si7v 1.77 (4)
Si10—O26 1.55 (3) O23—Si7vi 1.53 (2)
Si10—O15ii 1.56 (4) O23—Si7 1.53 (2)
Si10—O10 1.66 (4) O24—Si12vi 1.502 (18)
Si11—O22 1.50 (4) O24—Si12 1.502 (18)
Si11—O10 1.58 (4) O25—Si9 1.73 (3)
Si11—O11 1.61 (4) O25—Si9vi 1.73 (3)
Si11—O14 1.68 (4) O26—Si10 1.55 (3)
Si12—O24 1.502 (18) O26—Si10vi 1.55 (3)
Si12—O20 1.61 (4) Mo1—O19vii 1.29 (17)
Si12—O11 1.64 (4) Mo1—Si6vii 1.43 (13)
Si12—O12 1.70 (5) Mo1—O18vii 1.61 (17)
O1—Si1 1.45 (4) Mo1—Si3viii 2.34 (17)
O1—Si2 1.62 (4) Mo1—O5vii 2.56 (16)
O2—Si3 1.62 (4) Mo1—O6vii 2.72 (14)
O2—Si2 1.70 (4) Mo1—Si9viii 2.72 (17)
O3—Si3 1.65 (4) Mo1—O2viii 2.82 (16)
O3—Si4 1.68 (4) Mo1—O3viii 2.97 (18)
O4—Si4 1.54 (4) Mo1—O8viii 3.12 (16)
O4—Si5 1.62 (4)
O16—Si1—O1 109 (2) Si2—O2—Si3 152 (3)
O21i—Si1—O16 108 (2) Si4—O3—Si3 149 (2)
O21i—Si1—O1 107 (2) Si5—O4—Si4 149 (3)
O15—Si1—O21i 111 (2) Si6—O5—Si5 137 (3)
O15—Si1—O16 107 (2) Si6—O6—Si2 165 (3)
O15—Si1—O1 115 (2) Si7—O7—Si8 151 (3)
O1—Si2—O6 111 (2) Si8—O8—Si9 139 (3)
O2—Si2—O1 117 (2) Si9—O9—Si10 160 (2)
O2—Si2—O6 112 (2) Si10—O10—Si11 162 (2)
O13—Si2—O2 107.6 (18) Si12—O11—Si11 159 (3)
O13—Si2—O1 100 (2) Si12—O12—Si8 160 (3)
O13—Si2—O6 109 (2) Si2—O13—Si8 170 (2)
O2—Si3—O19ii 110 (2) Si11—O14—Si5 162 (2)
O3—Si3—O2 107 (2) Si1—O15—Si10iv 158 (3)
O3—Si3—O19ii 109 (2) Si1—O16—Si4iv 166 (3)

277
O20ii—Si3—O3 104.3 (18) Si9iv—O18—Mo1iii 115 (6)
O20ii—Si3—O2 107 (2) Si6—O18—Si9iv 155 (3)
O20ii—Si3—O19ii 119.1 (19) Si6—O18—Mo1iii 50 (5)
O16ii—Si4—O4 113 (2) Si6—O19—Mo1iii 59 (6)
O3—Si4—O16ii 98 (2) Si3iv—O19—Si6 155 (3)
O3—Si4—O4 109 (2) Si3iv—O19—Mo1iii 107 (7)
O14—Si5—O5 110 (2) Si3iv—O20—Si12 120 (2)
O21—Si5—O14 114 (2) Si1v—O21—Si5 148 (3)
O21—Si5—O5 104 (2) Si7v—O22—Si11 136 (2)
O4—Si5—O21 105 (2) Si7—O23—Si7vi 156 (4)
O4—Si5—O14 114 (2) Si12—O24—Si12vi 163 (4)
O4—Si5—O5 109 (2) Si9vi—O25—Si9 118 (3)
O19—Si6—Mo1iii 50 (7) Si10vi—O26—Si10 141 (4)
O5—Si6—O19 109 (2) Si6vii—Mo1—O19vii 71 (7)
O5—Si6—Mo1iii 115 (8) O18vii—Mo1—Si6vii 69 (7)
O6—Si6—O5 120.4 (19) O18vii—Mo1—O19vii 140 (10)
O6—Si6—O19 105 (2) Si3viii—Mo1—O18vii 162 (11)
O6—Si6—Mo1iii 124 (8) Si3viii—Mo1—Si6vii 109 (9)
O18—Si6—O6 111 (2) Si3viii—Mo1—O19vii 41 (5)
O18—Si6—O5 101 (2) O5vii—Mo1—Si3viii 117 (7)
O18—Si6—O19 110.7 (19) O5vii—Mo1—O18vii 72 (6)
O18—Si6—Mo1iii 60 (7) O5vii—Mo1—Si6vii 35 (5)
O23—Si7—O17 109 (3) O5vii—Mo1—O19vii 77 (7)
O7—Si7—O23 110 (2) O6vii—Mo1—O5vii 65 (3)
O7—Si7—O17 110 (3) O6vii—Mo1—Si3viii 94 (6)
O22i—Si7—O7 102 (2) O6vii—Mo1—O18vii 75 (5)
O22i—Si7—O23 109 (3) O6vii—Mo1—Si6vii 30 (4)
O22i—Si7—O17 117 (2) O6vii—Mo1—O19vii 69 (6)
O7—Si8—O13 109 (2) Si9viii—Mo1—O6vii 95 (5)
O12—Si8—O7 110 (2) Si9viii—Mo1—O5vii 104 (6)
O12—Si8—O13 110 (2) Si9viii—Mo1—Si3viii 138 (7)
O8—Si8—O12 108 (2) Si9viii—Mo1—O18vii 33 (4)
O8—Si8—O7 96 (2) Si9viii—Mo1—Si6vii 100 (8)
O8—Si8—O13 121 (2) Si9viii—Mo1—O19vii 162 (11)
O18ii—Si9—O8 108 (2) O2viii—Mo1—Si9viii 120 (5)
O9—Si9—O18ii 112 (2) O2viii—Mo1—O6vii 129 (7)
O9—Si9—O8 115 (2) O2viii—Mo1—O5vii 129 (7)
O25—Si9—O9 112 (2) O2viii—Mo1—Si3viii 35 (2)
O25—Si9—O18ii 97 (2) O2viii—Mo1—O18vii 151 (8)
O25—Si9—O8 110 (2) O2viii—Mo1—Si6vii 140 (10)
O26—Si10—O9 110 (2) O2viii—Mo1—O19vii 69 (6)
O15ii—Si10—O26 108 (3) O3viii—Mo1—O2viii 54 (3)
O15ii—Si10—O9 109 (2) O3viii—Mo1—Si9viii 108 (6)
O10—Si10—O15ii 111 (2) O3viii—Mo1—O6vii 83 (5)
O10—Si10—O26 110 (2) O3viii—Mo1—O5vii 136 (6)
O10—Si10—O9 108 (2) O3viii—Mo1—Si3viii 34 (3)
O10—Si11—O22 117 (2) O3viii—Mo1—O18vii 129 (9)
O11—Si11—O10 111 (2) O3viii—Mo1—Si6vii 109 (9)
O11—Si11—O22 113 (2) O3viii—Mo1—O19vii 63 (7)
O14—Si11—O11 93 (2) O8viii—Mo1—O3viii 110 (5)
O14—Si11—O10 109 (2) O8viii—Mo1—O2viii 97 (4)
O14—Si11—O22 110 (2) O8viii—Mo1—Si9viii 29.0 (18)
O20—Si12—O24 110 (2) O8viii—Mo1—O6vii 124 (6)
O11—Si12—O20 126 (2) O8viii—Mo1—O5vii 113 (6)
O11—Si12—O24 110 (3) O8viii—Mo1—Si3viii 126 (5)
O12—Si12—O11 92 (2) O8viii—Mo1—O18vii 54 (5)
O12—Si12—O20 104 (2) O8viii—Mo1—Si6vii 123 (9)
O12—Si12—O24 112 (3) O8viii—Mo1—O19vii 166 (9)
Si2—O1—Si1 159 (3)
Symmetry codes: (i) x+1/2, y, −z−1/2; (ii) −x+1/2, −y, z+1/2; (iii) x−1/2, y, −z+1/2; (iv) −x+1/2, −y, z−1/2; (v) x−1/2,
y, −z−1/2; (vi) x, −y−1/2, z; (vii) x+1/2, y, −z+1/2; (viii) −x+1, −y, −z+1.

278
The structure diagram illustrating the different T sites of the zeolite and the Mo
location near Si(Al)6 site is shown in Figure A3-2.
Figure A3-2. The crystal structure of Mo/H-ZSM-5 (asymmetric unit and view of the
crystal packing along the b-axis).
CHAPTER 4
• SEM images for Silicalite-1 before and after basic treatment with ethylenediamine
showing no changes in crystal morphology due to treatment.
a)
b)
Figure A4-1. Secondary electron SEM images for a) S1 and b) S1-T zeolites.

279
• Figure 4A-2 show the blank measurement results for 50 % CH4/Ar flow, the data
presented is normalised to Ar signal and plotted in logarithmic scale. For a better
visualisation of the C2/C3 signal intensities in the induction period, m/z = 25 and 27 of
Mo/H-ZSM-5 is compared with the blank results in Figure A4-3; this is shown in linear
scale.
Figure A4-2. Mass traces recorded with MS for 50% CH4/Ar using an empty reactor tube (logarithmic
scale).
0 2 4 6 8 10 12 14 16 18 20 22 24 26 28
1E-5
1E-4
1E-3
0.01
0.1
1
H2 (m/z=2)
CH4 (m/z=15)
C2Hx (m/z=25)
C2Hx/C3Hx (m/z=27
CO/CO2
C3H
8/C
3H
x(m/z=28)
CO2/C
3H
8 (m/z=44)
C6H
6 (m/z=78)
C7H
10 (m/z=91)
No
rma
lise
d io
n c
urr
en
t
Time (min)
CH4
H2
C6H
6
CO2/C
3/H
8
CO
C7H
8
C2H
x
C2H
x + C
3H
x

280
Figure A4-3. a) mass traces for m/z = 25 and 27 (C2/C3 hydrocarbons) comparing signal of Mo/H-ZSM-5
during the MDA induction period with the blank (linear scale); and b) mass traces for m/z = 2 and 15 (H2
and CH4 hydrocarbons) comparing signal of Mo/H-ZSM-5 during the MDA induction period with the
blank (linear scale).
-2 0 2 4 6 8 10 12 14
0.000
0.001
0.002
m/z = 27, Mo/H-ZSM-5
m/z = 27, blank
Norm
alis
ed ion c
urr
ent
Time (min)
m/z = 25, Mo/H-ZSM-5
m/z = 25, blank
a)
0 2 4 6 8 10 12 14
0.0
0.2
0.4
0.6
0.8
1.0
1.2
1.4
1.6
1.8
Ion C
urr
en
t (A
)
Time (min)
m/z=2 Mo/H-ZSM-5
m/z=15 Mo/H-ZSM-5
m/z=2 blank
m/z=15 blank
b)

281
CHAPTER 5
• TEM-EDX analysis of 4 wt. % Mo/H-SSZ-13 (700 °C calcined for 30 min).
Figure A5-1 present the secondary electron image as well as dark-field STEM
image. For two zeolite crystals: one on the right where substantial damage to the zeolite
is observed and one on the left where damage is barely visible.
Figure A5-2a show the three areas where the EDX spectra (shown in Figure A5-
2b) were collected. Area 1 corresponds to a Mo reach particle. Expectedly, the
corresponding EDX spectrum shows a Mo more intense Mo peak in comparison to other
areas. Area 2 corresponds to the EDX mapping on the damaged H-SSZ-13 crystal.
Although less intense than in area 1, the zeolite also shows the peak corresponding to Mo
suggesting the metal is dispersed throughout the crystal. Area 3 corresponding to
undamaged crystal present show no Mo in the EDX chemical composition. This seems to
indicate that the zeolite deplumation and damage is indeed promoted by Mo.
• Note the Cu signals detected come from sample grid.
a)
b)
Figure A5-1. TEM images for 4 wt. % Mo/H-SSZ-13 calcined (700 °C, 30 min): a) secondaty electron
image and b) dark filed scanning electron image.

282
a)
b)
Figure A5-2. TEM-EDX analysis for 4 wt. % Mo/H-SSZ-13 calcined (700 °C, 30 min): a) dark filed
scanning electron image presenting the ares where the spectra were taken and b) EDS spectra
corresinding to three areas of the samples (i.e. Mo rich particle, damaged zeolite and undamaged zeolite).

283
CHAPTER 6
• The result of the peak fitting of isolated pre-edge peaks using gaussian
components are shown in figures A6-1 to A6-3. The figures correspond respectively to
the deconvolution of Fe references, activated Fe/zeolites (at room temperature after
calcination in air at 500 °C) and Fe/H-ZSM-5 under different gas environments (O2 at
room temperature, NO or NH3 at 200 °C and SCR conditions at 300 °C).
Figure A6-1. Deconvolution results for isolated Fe K pre-edge features for different Fe reference
compounds. Vertical lines mark the approximate centroid position for Fe3+ species.

284
Figure A6-2. Deconvolution results for isolated Fe K pre-edge features for different Fe/zeolites at
room temperature after activation (20 % O°/He, 500 °C, 2 h).
Figure A6-3. Fitting results for isolated Fe K pre-edge features for Fe/H-ZSM-5 under different flowing
gas: a) 20 % O2/He at 500 ℃, b) 0.1 % NO/He at 200 ℃, c) 1 % NH3/He at 200 ℃ and d) 0.5 % NO, 0.5
% NH3 and 5 % O2 in He.

285
Table A6-1 lists the characteristics of the pre-edge spectral features resulting from
the deconvolution in Figures A6-1 to A6-3 that is, the energy positions of the fitted peaks,
the centroid of the pre-edge structure, and the integrated intensities. Note that
contributions > 7115 eV are excluded for the total area and centroid position calculations.
The intensity in this region correspond to Fe-Fe contributions and bring no relevant
information regarding oxidation state or coordination symmetry.
Table A6-1. Pre-edge spectral features of Fe/zeolites (at room temperature after calcination) and the
different Fe references. Features for the Fe/H-ZSM-5 catalysts measured in situ during calcination (at 500
℃ under 20 % O2/He), under 0.1 % NO in He, 1 % NH3 (in He at 200 ℃) and SCR conditions (0.5 %
NO, 0.5 % NH3 and 5 % O2 in He at 300 ℃) are also included. Components > 7115 eV are excluded from
analysis.
Reference compound Component
position
Component
area
Centroid
position Total area
FePO4.2H2O 7113.47
7114.50
0.1456
0.0103 7113.54 0.1559
Fe2O3 7112.63
7114.064
0.0795
0.1311
7113.59 0.2100
FePO4 7112.08
7113.31
0.3441
0.0370 7113.46 0.4221
FeSO4.7H2O 7111.30
7113.43
0.0305
0.0521
7112.64 0.0826
Fe/H-ZSM-5 O2 RT 7114.05
7113.52
0.0444
0.2602 7113.42 0.3046
Fe/H-ZSM-5 O2 500 ℃ 7113.11
7113.69
0.1637
0.1846 7113.41 0.3483
Fe/H-ZSM-5 NO / / 7113.39 0.34613
Fe/H-ZSM-5 NH3 7111.6348
7113.5560
0.0843
0.1822 7112.95 0.2666
Fe/H-ZSM-5 SCR 7111.63
7113.52
0.0888
0.2001 7112.94 0.2889
Fe/S1-T-citr RT / / 7113.45 0.3907
Fe/S1-T-nitr RT 7113.51 0.2987
Fe/H-SSZ-13 RT 7112.76
7113.93
0.0600
0.1560 7113.61 0.2312

286
• Plots resulting from the linear combination analysis of the Fe K-edge XANES
pre-edge region (-15 to -5 eV from the main edge) and using Fe2O3, FePO4 and
FePO4.2H2O are shown in Figures A6-3. The black solid line corresponds to the catalysts
spectra at room temperature after activation while the doted lines correspond to the fitted
spectra.
Figure A6-4. Iron K-edge XANES Linear Combination Fitting of the Fe/zeolite catalysts at room
temperature after activation (20 % O2/He, 500 ℃) using Fe2O3 and FePO4 as references. The best fit
(red) is shown superimposed on the sample spectra (black). Blue line in Figure a corresponds to Linear
combination fitting using FePO4.2H2O and FePO4 as the references.
7108 7110 7112 7114 7116
Energy (eV)
Fe/H-SSZ-13
Fit
d)
0.00
0.05
0.10
0.15
0.20
No
rma
lise
d xm
(E) Fe/H-ZSM-5
Fit (Fe2O3)
Fit (FePO4.2H2O)
a)
Fe/S1-T-citr
Fit
b)
7108 7110 7112 7114 71160.00
0.05
0.10
0.15
0.20
Norm
alis
ed
xm
(E)
Energy (eV)
Fe/S1-T-nitr
Fit
c)

287
• The result of the pre-edge peak fitting for Fe/S1-T-citr, Fe/S1-T-nitr and Fe/H-
SSZ-13 at high temperatures during in situ calcination, NO or NH3 exposure as well
as SCR condition is shown in Figures A6-5 to A7 respectively. Table A6-3 lists the
characteristics of the pre-edge spectral features resulting from the deconvolution in
(contributions > 7115 eV are excluded).
Figure A6-5. Fitting results for isolated Fe K pre-edge features for Fe/S1T-citr under different flowing gas: a) 20
% O2/He at 500 ℃, b) 0.1 % NO/He at 200 ℃, c) 1 % NH3/He at 200 ℃ and d) NH3-SCR (300 ℃, 5 % NO, 0.5
% NH3 and 5 % O2 in He).

288
Figure A6-6. Fitting results for isolated Fe K pre-edge features for Fe/S1-T-nitr under different flowing
gas: a) 20 % O2/He at 500 ℃, b) 0.1 % NO/He at 200 ℃, c) 1 % NH3/He at 200 ℃ and d) NH3-SCR
(300 ℃, 5 % NO, 0.5 % NH3 and 5 % O2 in He).
Figure A6-7. Fitting results for isolated Fe K pre-edge features for Fe/H-SSZ-13 under 20 % O2/He
at 500 ℃ and NH3-SCR conditions (300 ℃, 0.5 % NO, 0.5 % NH3 and 5 % O2 in He).

289
Table A6-2. Pre-edge spectral features for Fe/S1-T-citr, Fe-S1-T-nitr and Fe/H-SSZ-13 measured in
situ during calcination (at 500 ℃ under 20 % O2/He), under 0.1 % NO in He, 1 % NH3 (in He at 200
℃) and SCR conditions (0.5 % NO, 0.5 % NH3 and 5 % O2 in He at 300 ℃) are also included.
Components > 7115 eV are excluded from analysis.
Reference compound Component
position Component area
Centroid
position
Total
area
Fe/S1-T-citr O2 / / 7113.46 0.4711
Fe/S1-T-citr NO / / 7113.46 0.4682
Fe/S1-T-citr NH3 / / 7113.46
0.4678
Fe/S1-T-citr SCR / / 7113.42 0.4578
Fe/S1-T-nitr O2 / / 7113.35 0.35203
Fe/S1-T-nitr NO / / 7113.39 0.3143
Fe/S1-T-nitr NH3 / / 7113.42 0.3177
Fe/S1-T-nitr SCR / / 7113.39 0.3145
Fe/H-SSZ-13 O2 7113.43
7114.74
0.0500
0.15758
7113.62 0.2080
Fe/H-SSZ-13 SCR 7113.64
7114.96
0.0765
0.1253 7113.65 0.2021

290
• The variogram for the Fe/S1-T-citr, Fe/S1-T-nitr and Fe/H-ZSM-5 resulting from
the values presented in Table A6-3 is shown in Figure A6-8. For each catalyst, little
variations in the integral intensity or centroid position is observed. These variations show
are within the experimental error. Note however the significantly increased pre-edge
intensity for Fe/S1-T-nitr under O2 compared with the spectra under NO, NH3 and SCR
conditions. This could be due to partial rehydration of this sample when cooling down to
from 500 ℃ (calcination temperature) to below 300 ℃.
7112.6 7112.8 7113.0 7113.2 7113.4 7113.6
0.1
0.2
0.3
0.4
0.5
FePO4
FePO4.2H2O
Fe2O3
Fe/S1-T-citr O2
Fe/S1-T-citr NO
Fe/S1-T-citr NH3
Fe/S1-T-citr SCR
.
Fe/S1-T-nitr O2
Fe/S1-T-nitr NO
Fe/S1-T-nitr NH3
Fe/S1-T-nitr SCR
.
Fe/H-SSZ-13 O2
Fe/H-SSZ-13 SCR
Inte
gra
ted p
re-e
dge inte
nsity
Centroid position (eV)
FeSO4.7H2O
Figure 0-A8. Variogram for Fe reference compounds and in Fe/S1-T-citr, Fe/S1-T-nitr an Fe/H-SSZ-13
different flowing gas (20 % O2/He at 500 ℃, 0.1 % NO/He at 200 ℃, 1 % NH3/He at 200 ℃, and NH3-
300 ℃, 5 % NO, 0.5 % NH3 and 5 % O2 in He (NH3-SCR)).

291
• Mass-spectrometry results collected for Fe/zeolites during HERFD-XANES/XES
spectroscopy studies in under NH3-SCR conditions at 300 °C.
0 5 10 15 20
0.00E+000
2.00E-010
4.00E-010
6.00E-010
8.00E-010
1.00E-009
NO
N2
Inte
nsi
ty (
a.u
.)
Time (min)
Fe/H-ZSM-5
Fe/S1-T-citr
Fe/S1-T-nitr
Fe/H-SSZ-13
Figure A6-9. MS data collected during HERFD-XANES/XES experiments under NH3-SCR conditions
(5 % O2, 0.5 % NO, 0.5 % NH3 in He, 300 °C, GHSV = 30000 h-1). Dashed lines corresponding to NO
signal (m/z = 30) and solid lines to N2 (m/z = 28).
Related Documents


