Cell Reports Article miR-511-3p Modulates Genetic Programs of Tumor-Associated Macrophages Mario Leonardo Squadrito, 1,3 Ferdinando Pucci, 1,3 Laura Magri, 2,3 Davide Moi, 1 Gregor D. Gilfillan, 4 Anna Ranghetti, 1 Andrea Casazza, 5 Massimiliano Mazzone, 5 Robert Lyle, 4 Luigi Naldini, 1,3 and Michele De Palma 1,6, * 1 Angiogenesis and Tumor Targeting Unit, and HSR-TIGET, Division of Regenerative Medicine 2 Neural Stem Cell Biology Unit, Division of Regenerative Medicine San Raffaele Institute, 20132-Milan, Italy 3 Vita-Salute San Raffaele University, 20132-Milan, Italy 4 Department of Medical Genetics and Norwegian High-Throughput Sequencing Centre (NSC), Oslo University Hospital, Kirkeveien 166, 0407-Oslo, Norway 5 Laboratory of Molecular Oncology and Angiogenesis, Vesalius Research Center, VIB and K.U. Leuven, 3000 Leuven, Belgium 6 Present address: The Swiss Institute for Experimental Cancer Research (ISREC), School of Life Sciences, Swiss Federal Institute of Technology Lausanne (EPFL), 1015 Lausanne, Switzerland *Correspondence: michele.depalma@epfl.ch DOI 10.1016/j.celrep.2011.12.005 SUMMARY Expression of the mannose receptor (MRC1/CD206) identifies macrophage subtypes, such as alterna- tively activated macrophages (AAMs) and M2-polar- ized tumor-associated macrophages (TAMs), which are endowed with tissue-remodeling, proangiogenic, and protumoral activity. However, the significance of MRC1 expression for TAM’s protumoral activity is unclear. Here, we describe and characterize miR- 511-3p, an intronic microRNA (miRNA) encoded by both mouse and human MRC1 genes. By using sensitive miRNA reporter vectors, we demonstrate robust expression and bioactivity of miR-511-3p in MRC1 + AAMs and TAMs. Unexpectedly, enforced expression of miR-511-3p tuned down the protu- moral gene signature of MRC1 + TAMs and inhibited tumor growth. Our findings suggest that transcrip- tional activation of Mrc1 in TAMs evokes a genetic program orchestrated by miR-511-3p, which limits rather than enhances their protumoral functions. Besides uncovering a role for MRC1 as gatekeeper of TAM’s protumoral genetic programs, these obser- vations suggest that endogenous miRNAs may op- erate to establish thresholds for inflammatory cell activation in tumors. INTRODUCTION Tumor-associated macrophages (TAMs) support tumor progres- sion in mouse models of cancer (Qian and Pollard, 2010). The protumoral functions of TAMs are thought to depend, at least in part, on their production of growth, tissue-remodeling, and immunomodulatory factors. Together, these enhance tumor cell motility and invasion, activate fibroblasts to synthesize extracellular matrix (ECM) proteins, facilitate angiogenesis, and suppress antitumor immunity (Qian and Pollard, 2010; Squadrito and De Palma, 2011; Biswas and Mantovani, 2010; Sica and Bronte, 2007). However, TAMs comprise distinct subsets, which appear to contribute differentially to tumor progression (Qian and Pollard, 2010; Squadrito and De Palma, 2011). In the mouse, high expression of the mannose receptor (MRC1/CD206) and low expression of the integrin a X (CD11c) identify a TAM subset with enhanced proangiogenic, tissue-remodeling and protu- moral activities (Pucci et al., 2009; Movahedi et al., 2010); a vari- able proportion of these MRC1 + CD11c low TAMs also express the angiopoietin receptor, TIE2, and have thus been termed TIE2- expressing macrophages (De Palma et al., 2005; Pucci et al., 2009; Mazzieri et al., 2011). Conversely, CD11c + MRC1 low TAMs express a proinflammatory and angiostatic phenotype, and perhaps exert antitumoral functions (Pucci et al., 2009; Movahedi et al., 2010; Rolny et al., 2011). It is still unclear whether the diverse TAM subsets identified in mouse tumor models derive from distinct circulating monocyte precursors or are induced locally in the tumor from a common precursor/ progenitor cell (PC) (Squadrito and De Palma, 2011). Yet, several tumor-derived factors, including cytokines produced by infil- trating immune cells, may instruct TAMs to acquire either pro- or antitumoral functions (DeNardo et al., 2010). MRC1 is an endocytic receptor primarily expressed by subsets of macrophages and dendritic cells (DCs); it is primarily involved in the clearance of both host and microbe-derived glycoproteins (Taylor et al., 2005). MRC1 expression is strongly upregulated by IL-4 and IL-13, and downregulated by IFN-g (Stein et al., 1992). Notably, these cytokines are pleiotropic modulators of macrophage activation; their context-dependent expression patterns may contribute to the remarkable heteroge- neity of macrophage phenotypes observed throughout tissues and tumors. Whereas IFN-g promotes a ‘‘classic’’ or proinflam- matory macrophage activation program, IL-4 and IL-13 fuel an ‘‘alternative’’ macrophage activation program, which promotes ECM remodeling, angiogenesis, tissue growth, and repair (Gordon and Martinez, 2010; Martinez et al., 2009). Based on their gene expression signature and tissue-remodeling/proan- giogenic activities, MRC1 + TAMs resemble IL-4-stimulated Cell Reports 1, 141–154, February 23, 2012 ª2012 The Authors 141

Welcome message from author
This document is posted to help you gain knowledge. Please leave a comment to let me know what you think about it! Share it to your friends and learn new things together.
Transcript
Cell Reports
Article
miR-511-3p Modulates Genetic Programsof Tumor-Associated MacrophagesMario Leonardo Squadrito,1,3 Ferdinando Pucci,1,3 Laura Magri,2,3 Davide Moi,1 Gregor D. Gilfillan,4 Anna Ranghetti,1
Andrea Casazza,5 Massimiliano Mazzone,5 Robert Lyle,4 Luigi Naldini,1,3 and Michele De Palma1,6,*1Angiogenesis and Tumor Targeting Unit, and HSR-TIGET, Division of Regenerative Medicine2Neural Stem Cell Biology Unit, Division of Regenerative MedicineSan Raffaele Institute, 20132-Milan, Italy3Vita-Salute San Raffaele University, 20132-Milan, Italy4Department of Medical Genetics and Norwegian High-Throughput Sequencing Centre (NSC), Oslo University Hospital,Kirkeveien 166, 0407-Oslo, Norway5Laboratory of Molecular Oncology and Angiogenesis, Vesalius Research Center, VIB and K.U. Leuven, 3000 Leuven, Belgium6Present address: The Swiss Institute for Experimental Cancer Research (ISREC), School of Life Sciences, Swiss Federal Institute of
Technology Lausanne (EPFL), 1015 Lausanne, Switzerland*Correspondence: [email protected]
DOI 10.1016/j.celrep.2011.12.005
SUMMARY
Expression of the mannose receptor (MRC1/CD206)identifies macrophage subtypes, such as alterna-tively activated macrophages (AAMs) and M2-polar-ized tumor-associated macrophages (TAMs), whichare endowedwith tissue-remodeling, proangiogenic,and protumoral activity. However, the significance ofMRC1 expression for TAM’s protumoral activity isunclear. Here, we describe and characterize miR-511-3p, an intronic microRNA (miRNA) encoded byboth mouse and human MRC1 genes. By usingsensitive miRNA reporter vectors, we demonstraterobust expression and bioactivity of miR-511-3p inMRC1+ AAMs and TAMs. Unexpectedly, enforcedexpression of miR-511-3p tuned down the protu-moral gene signature of MRC1+ TAMs and inhibitedtumor growth. Our findings suggest that transcrip-tional activation of Mrc1 in TAMs evokes a geneticprogram orchestrated by miR-511-3p, which limitsrather than enhances their protumoral functions.Besides uncovering a role for MRC1 as gatekeeperof TAM’s protumoral genetic programs, these obser-vations suggest that endogenous miRNAs may op-erate to establish thresholds for inflammatory cellactivation in tumors.
INTRODUCTION
Tumor-associatedmacrophages (TAMs) support tumor progres-
sion in mouse models of cancer (Qian and Pollard, 2010). The
protumoral functions of TAMs are thought to depend, at least
in part, on their production of growth, tissue-remodeling, and
immunomodulatory factors. Together, these enhance tumor
cell motility and invasion, activate fibroblasts to synthesize
extracellular matrix (ECM) proteins, facilitate angiogenesis, and
C
suppress antitumor immunity (Qian and Pollard, 2010; Squadrito
and De Palma, 2011; Biswas and Mantovani, 2010; Sica and
Bronte, 2007). However, TAMs comprise distinct subsets, which
appear to contribute differentially to tumor progression (Qian and
Pollard, 2010; Squadrito and De Palma, 2011). In the mouse,
high expression of the mannose receptor (MRC1/CD206) and
low expression of the integrin a X (CD11c) identify a TAM subset
with enhanced proangiogenic, tissue-remodeling and protu-
moral activities (Pucci et al., 2009; Movahedi et al., 2010); a vari-
able proportion of theseMRC1+CD11clow TAMs also express the
angiopoietin receptor, TIE2, and have thus been termed TIE2-
expressing macrophages (De Palma et al., 2005; Pucci et al.,
2009; Mazzieri et al., 2011). Conversely, CD11c+MRC1low
TAMs express a proinflammatory and angiostatic phenotype,
and perhaps exert antitumoral functions (Pucci et al., 2009;
Movahedi et al., 2010; Rolny et al., 2011). It is still unclear
whether the diverse TAM subsets identified in mouse tumor
models derive from distinct circulating monocyte precursors or
are induced locally in the tumor from a common precursor/
progenitor cell (PC) (Squadrito and De Palma, 2011). Yet, several
tumor-derived factors, including cytokines produced by infil-
trating immune cells, may instruct TAMs to acquire either pro-
or antitumoral functions (DeNardo et al., 2010).
MRC1 is an endocytic receptor primarily expressed by
subsets of macrophages and dendritic cells (DCs); it is primarily
involved in the clearance of both host and microbe-derived
glycoproteins (Taylor et al., 2005). MRC1 expression is strongly
upregulated by IL-4 and IL-13, and downregulated by IFN-g
(Stein et al., 1992). Notably, these cytokines are pleiotropic
modulators of macrophage activation; their context-dependent
expression patterns may contribute to the remarkable heteroge-
neity of macrophage phenotypes observed throughout tissues
and tumors. Whereas IFN-g promotes a ‘‘classic’’ or proinflam-
matory macrophage activation program, IL-4 and IL-13 fuel an
‘‘alternative’’ macrophage activation program, which promotes
ECM remodeling, angiogenesis, tissue growth, and repair
(Gordon and Martinez, 2010; Martinez et al., 2009). Based on
their gene expression signature and tissue-remodeling/proan-
giogenic activities, MRC1+ TAMs resemble IL-4-stimulated
ell Reports 1, 141–154, February 23, 2012 ª2012 The Authors 141
Figure 1. miR-511-3p Is the Active Strand of Mouse Pre-miR-511 and Is Coregulated with the Mrc1 Gene
(A) Genomic region comprising the mouse miR-511 locus and the surrounding Mrc1 gene on mouse chromosome 2, as retrieved by the UCSC (NCBI37/mm9)
genome browser.
(B) Stem-loop structure of the mouse pre-miR-511. miR-511-5p and -3p sequences are shown in blue and red, respectively.
(C) Schematic of the proviral LV used to measure miR-511 activity (miRT-511 LV). The miRT sequences are cloned downstream to the GFP expression cassette,
which is regulated by a bidirectional PGK promoter.
(D) Schematic of the proviral LV used to overexpress miR-511 (SFFV.miR-511 LV). The sequence of the primary miR-511 is cloned within the EF1a intron,
downstream to a SFFV promoter.
142 Cell Reports 1, 141–154, February 23, 2012 ª2012 The Authors
alternatively activated macrophages (AAMs) (Biswas and
Mantovani, 2010; Gordon and Martinez, 2010). Although IL-4,
IFN-g, and several other tumor-derived cytokines and growth
factors have been identified that can modulate macrophage
phenotypes in vitro and in vivo (Biswas and Mantovani, 2010;
DeNardo et al., 2010; Qian and Pollard, 2010), the signals in
tumors that regulate pro- versus antitumoral functions of the
distinct TAM subsets are still poorly defined.
MicroRNAs (miRNAs) are small, single-stranded RNAs that are
generated from endogenous hairpin-shaped transcripts (called
primary miRNAs). It is now well established that the unique
combination of miRNAs expressed in each cell type determines
the fine tuning of hundreds of mRNAs, thus regulating gene
expression and cell function (Bartel, 2009). Several miRNAs
have been identified that are robustly expressed by human
macrophages in vitro (Tserel et al., 2011). However, to our knowl-
edge, no information is available on the miRNA expression
profiles of the distinct TAM subsets. Here, we describe and char-
acterize an intronic miRNA, miR-511-3p, which is embedded in
and coexpressed with the Mrc1 gene. We show that the upre-
gulation of MRC1, which is contextual with the differentiation
(or alternative activation) of protumoral TAMs, triggers a nega-
tive-feedback response orchestrated by miR-511-3p that atten-
uates their protumoral genetic programs.
RESULTS
miR-511-3p Is the Active Strand of miR-511We noted that the mouse Mrc1 gene, which is primarily ex-
pressed by protumoral TAMs (Pucci et al., 2009) and AAMs
(Stein et al., 1992), contains a miRNA coding sequence, miR-
511 (or mmu-miR-511), located in the fifth intron of the gene
(Figure 1A). Processing of the precursor miRNA (termed pre-
miR-511) should generate two mature miRNAs, miR-511-5p
(located at the 50 end of the pre-miRNA) and miR-511-3p
(located at the 30 end of the pre-miRNA) (Figure 1B).
To investigate whether miR-511-5p and -3p are expressed
and biologically active in live cells, we used a lentiviral vector
(LV) reporter system for miRNA activity (Brown et al., 2007).
We incorporated four miRNA target (miRT) sequences with
perfect complementarity to either miR-511-5p or -3p (termed
(E) miR-511-5p and -3p activity in 293T cells overexpressing miR-511. The cell
superinfected with the SFFV.miR-511 overexpressing LV. Dot plots show GFP a
right shows quantification of GFP repression (mean values ±SEM versus no-miRT
values was performed by unpaired Student’s t test.
(F) Expression of the Mrc1 gene in BMDMs (MF; either untreated or stimulated a
versus b2 m; n = 2–3 independent experiments. Statistical analysis of DCt values
(G) Endogenous miR-511-5p and -3p activity in BMDMs (MF; either untreated o
GFP repression (mean values ±SEM versus no-miRT control; n = 2–8 independen
unpaired Student’s t test.
(H) MRC1 protein expression in BMDMs either untreated or stimulated as indicate
MRC1 antibody. Data are representative of two independent experiments.
(I) Endogenous miR-511-3p activity in IL-4-stimulated BMDMs. Top panels show
stained by DAPI. Bottom panels show GFP in IL-4-stimulated BMDMs either tra
skeleton was stained by phalloidin.
(J) Correlation betweenGFP repression andMRC1 protein in BMDMs either untrea
511-5p, -3p, or no-miRT reporter LVs. GFP expression wasmeasured after fractio
Int, intermediate; High; see H). Statistical analysis was performed by Spearman’
C
miRT-511-5p and miRT-511-3p, respectively) into the 30
untranslated region (UTR) of a green fluorescent protein (GFP)
transgene expressed from a ubiquitously active bidirectional
promoter, which also controls the expression of the reporter
gene, DLNGFR (Figure 1C). We also generated a control LV
expressing a GFP sequence not containing miRT sequences in
its 30 UTR (termed no-miRT). Following LV cell transduction the
miRNA machinery will degrade the miRT-containing GFP tran-
script only in cells that express the cognate miRNA, in a manner
that is dependent on miRNA abundance and/or activity. On the
other hand, expression of DLNGFR is independent of miRNA
activity and is used as an internal normalizer to calculate GFP
repression by the miRNA of interest (Brown et al., 2007).
We initially studiedmiR-511 activity in 293T cells, which do not
express miR-511 endogenously (data not shown). In order to
artificially overexpress the pre-miR-511 (and thus both miR-
511-5p and -3p mature miRNAs), we cloned a fragment of the
Mrc1 intron encompassing the miR-511 locus, downstream to
the spleen focus-forming virus (SFFV) promoter and upstream
to an orange fluorescent protein (OFP) reporter gene (Figure 1D).
We termed the resultant vector SFFV.miR-511 LV. We then
transduced 293T cells with the miRT-511-5p, -3p, or no-miRT
reporter LVs, and superinfected the transduced cells with the
SFFV.miR-511 LV. As shown in Figure 1E, overexpression of
pre-miR-511 repressed GFPmuchmore efficiently in cells trans-
duced with the miRT-511-3p reporter LV, suggesting that the
active strand of the pre-miR-511 is miR-511-3p.
The Mrc1 Gene and miR-511-3p Are CoregulatedIntronic miRNAs can be expressed from either host gene
promoters or independent transcription regulatory elements
(Baskerville and Bartel, 2005; Biasiolo et al., 2011). We then
asked whether expression of the Mrc1 gene and miR-511-3p
are transcriptionally coregulated. To address this question, we
used mouse monocytic cell lines (RAW264.7 and P388D1; see
Figure S1 available online) and bone marrow-derived macro-
phage (BMDM) cultures. qPCR analyses showed decreasing
Mrc1 mRNA levels in the following cell cultures: IL-4-treated
BMDMs; untreated BMDMs; P388D1 cells; LPS/IFN-g-treated
BMDMs; and RAW264.7 cells (Figure 1F). These data are consis-
tent with previous reports showing that IL-4 and LPS/IFN-g
s were transduced with the miRT-511-5p, -3p, or no-miRT reporter LVs, and
nd DLNGFR expression from the indicated reporter LVs. The histogram on the
control; n = 2 independent experiments). Statistical analysis of fold-repression
s indicated), P388D1 and RAW264.7 cells. Data show mean DCt values ±SEM
was performed by unpaired Student’s t test.
r stimulated as indicated), P388D1 and RAW264.7 cells. The histograms show
t experiments). Statistical analysis of fold-repression values was performed by
d. The black open line is the fluorescence minus one (FMO) control for the anti-
MRC1 protein in BMDMs either untreated or stimulated by IL-4; cell nuclei were
nsduced with the no-miRT or miRT-511-3p reporter LV; the cell’s actin cyto-
ted or stimulatedwith IL-4; the cells were previously transducedwith themiRT-
nating the cells according to different MRC1 protein levels (Neg, negative; Low;
s rank correlation test.
ell Reports 1, 141–154, February 23, 2012 ª2012 The Authors 143
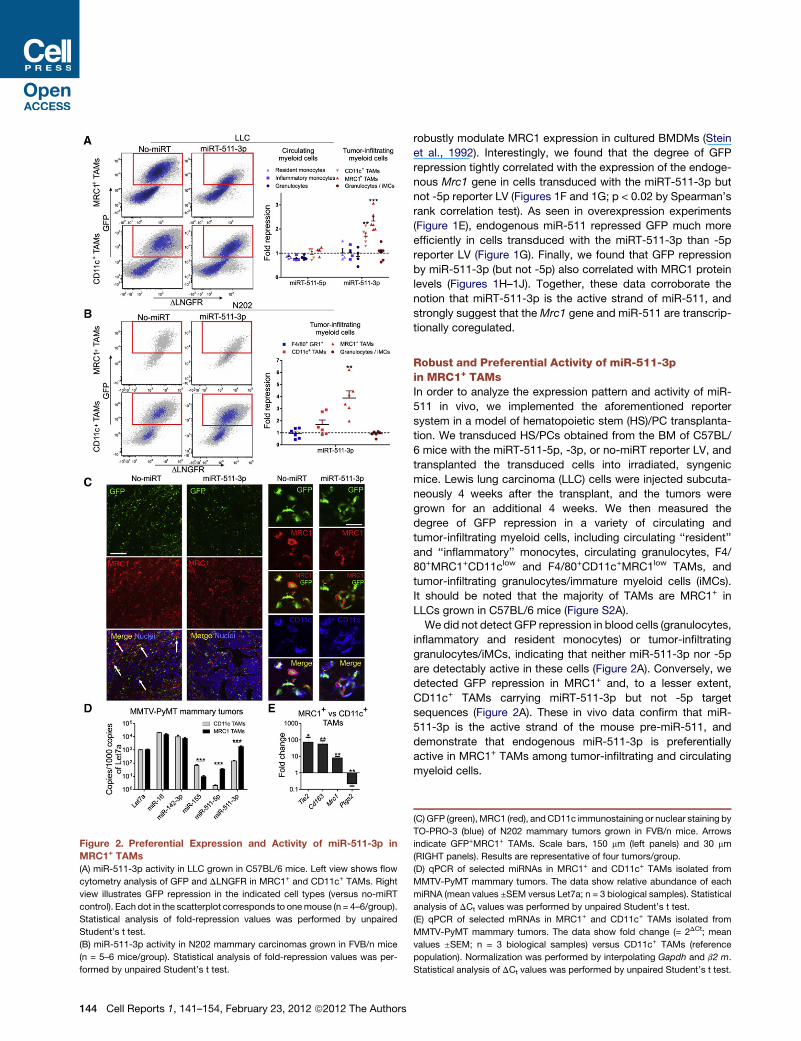
Figure 2. Preferential Expression and Activity of miR-511-3p in
MRC1+ TAMs
(A) miR-511-3p activity in LLC grown in C57BL/6 mice. Left view shows flow
cytometry analysis of GFP and DLNGFR in MRC1+ and CD11c+ TAMs. Right
view illustrates GFP repression in the indicated cell types (versus no-miRT
control). Each dot in the scatterplot corresponds to onemouse (n = 4–6/group).
Statistical analysis of fold-repression values was performed by unpaired
Student’s t test.
(B) miR-511-3p activity in N202 mammary carcinomas grown in FVB/n mice
(n = 5–6 mice/group). Statistical analysis of fold-repression values was per-
formed by unpaired Student’s t test.
144 Cell Reports 1, 141–154, February 23, 2012 ª2012 The Authors
robustly modulate MRC1 expression in cultured BMDMs (Stein
et al., 1992). Interestingly, we found that the degree of GFP
repression tightly correlated with the expression of the endoge-
nous Mrc1 gene in cells transduced with the miRT-511-3p but
not -5p reporter LV (Figures 1F and 1G; p < 0.02 by Spearman’s
rank correlation test). As seen in overexpression experiments
(Figure 1E), endogenous miR-511 repressed GFP much more
efficiently in cells transduced with the miRT-511-3p than -5p
reporter LV (Figure 1G). Finally, we found that GFP repression
by miR-511-3p (but not -5p) also correlated with MRC1 protein
levels (Figures 1H–1J). Together, these data corroborate the
notion that miRT-511-3p is the active strand of miR-511, and
strongly suggest that the Mrc1 gene and miR-511 are transcrip-
tionally coregulated.
Robust and Preferential Activity of miR-511-3pin MRC1+ TAMsIn order to analyze the expression pattern and activity of miR-
511 in vivo, we implemented the aforementioned reporter
system in a model of hematopoietic stem (HS)/PC transplanta-
tion. We transduced HS/PCs obtained from the BM of C57BL/
6 mice with the miRT-511-5p, -3p, or no-miRT reporter LV, and
transplanted the transduced cells into irradiated, syngenic
mice. Lewis lung carcinoma (LLC) cells were injected subcuta-
neously 4 weeks after the transplant, and the tumors were
grown for an additional 4 weeks. We then measured the
degree of GFP repression in a variety of circulating and
tumor-infiltrating myeloid cells, including circulating ‘‘resident’’
and ‘‘inflammatory’’ monocytes, circulating granulocytes, F4/
80+MRC1+CD11clow and F4/80+CD11c+MRC1low TAMs, and
tumor-infiltrating granulocytes/immature myeloid cells (iMCs).
It should be noted that the majority of TAMs are MRC1+ in
LLCs grown in C57BL/6 mice (Figure S2A).
We did not detect GFP repression in blood cells (granulocytes,
inflammatory and resident monocytes) or tumor-infiltrating
granulocytes/iMCs, indicating that neither miR-511-3p nor -5p
are detectably active in these cells (Figure 2A). Conversely, we
detected GFP repression in MRC1+ and, to a lesser extent,
CD11c+ TAMs carrying miRT-511-3p but not -5p target
sequences (Figure 2A). These in vivo data confirm that miR-
511-3p is the active strand of the mouse pre-miR-511, and
demonstrate that endogenous miR-511-3p is preferentially
active in MRC1+ TAMs among tumor-infiltrating and circulating
myeloid cells.
(C) GFP (green), MRC1 (red), andCD11c immunostaining or nuclear staining by
TO-PRO-3 (blue) of N202 mammary tumors grown in FVB/n mice. Arrows
indicate GFP+MRC1+ TAMs. Scale bars, 150 mm (left panels) and 30 mm
(RIGHT panels). Results are representative of four tumors/group.
(D) qPCR of selected miRNAs in MRC1+ and CD11c+ TAMs isolated from
MMTV-PyMT mammary tumors. The data show relative abundance of each
miRNA (mean values ±SEM versus Let7a; n = 3 biological samples). Statistical
analysis of DCt values was performed by unpaired Student’s t test.
(E) qPCR of selected mRNAs in MRC1+ and CD11c+ TAMs isolated from
MMTV-PyMT mammary tumors. The data show fold change (= 2DCt; mean
values ±SEM; n = 3 biological samples) versus CD11c+ TAMs (reference
population). Normalization was performed by interpolating Gapdh and b2 m.
Statistical analysis of DCt values was performed by unpaired Student’s t test.
To rule out that our findings aremouse strain or tumor specific,
we also analyzed miR-511-3p activity in FVB/n mice trans-
planted as above and challenged with N202 (Neu+) mammary
carcinomas (Figure 2B). It should be noted that, contrary to
LLCs, the majority of TAMs are CD11c+ in N202 tumors grown
in FVB/nmice (Figure S2B). As seen in LLCs, we observed robust
GFP repression (and thus miR-511-3p activity) in MRC1+ but not
CD11c+ TAMs or infiltrating granulocytes/iMCs in N202 tumors
analyzed at 4 weeks postinjection. These data were confirmed
by immunofluorescence staining of tumor sections, showing
lower GFP signal in MRC1+ than CD11c+ TAMs (Figure 2C).
These findings indicate that preferential activity of miR-511-3p
in MRC1+ TAMs is independent of the mouse strain, the tumor
type, or the relative abundance of the distinct TAM subsets.
In addition to miRNA activity, we analyzed miRNA abundance
by qPCR. We measured the expression of a panel of selected
miRNAs, including miR-511-5p and -3p, in both MRC1+ and
CD11c+ TAMs isolated from spontaneous MMTV-PyMT
mammary tumors (Mazzieri et al., 2011) by fluorescence-acti-
vated cell sorting (FACS). Although both miR-511-5p and -3p
were significantly upregulated in MRC1+ versus CD11c+ TAMs
(>10-fold), miR-511-3p levels were much higher than -5p levels
in either TAM subset (Figure 2D). Of note, expression of the
Mrc1 gene was �10-fold higher in MRC1+ than CD11c+ TAMs
(Figure 2E), suggesting that in vivo as in vitro (Figures 1G and
1J) the host gene and the miRNA are transcriptionally
coregulated.
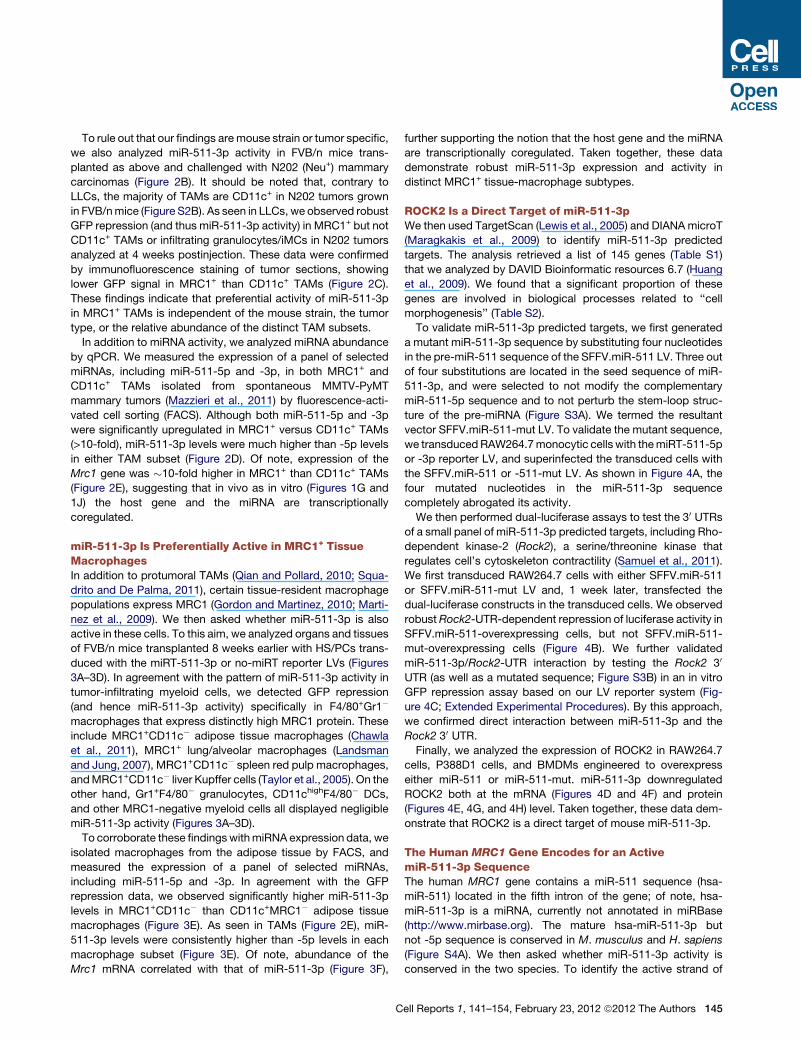
miR-511-3p Is Preferentially Active in MRC1+ TissueMacrophagesIn addition to protumoral TAMs (Qian and Pollard, 2010; Squa-
drito and De Palma, 2011), certain tissue-resident macrophage
populations express MRC1 (Gordon and Martinez, 2010; Marti-
nez et al., 2009). We then asked whether miR-511-3p is also
active in these cells. To this aim, we analyzed organs and tissues
of FVB/n mice transplanted 8 weeks earlier with HS/PCs trans-
duced with the miRT-511-3p or no-miRT reporter LVs (Figures
3A–3D). In agreement with the pattern of miR-511-3p activity in
tumor-infiltrating myeloid cells, we detected GFP repression
(and hence miR-511-3p activity) specifically in F4/80+Gr1�
macrophages that express distinctly high MRC1 protein. These
include MRC1+CD11c� adipose tissue macrophages (Chawla
et al., 2011), MRC1+ lung/alveolar macrophages (Landsman
and Jung, 2007), MRC1+CD11c� spleen red pulp macrophages,
andMRC1+CD11c� liver Kupffer cells (Taylor et al., 2005). On the
other hand, Gr1+F4/80� granulocytes, CD11chighF4/80� DCs,
and other MRC1-negative myeloid cells all displayed negligible
miR-511-3p activity (Figures 3A–3D).
To corroborate these findingswithmiRNA expression data, we
isolated macrophages from the adipose tissue by FACS, and
measured the expression of a panel of selected miRNAs,
including miR-511-5p and -3p. In agreement with the GFP
repression data, we observed significantly higher miR-511-3p
levels in MRC1+CD11c� than CD11c+MRC1� adipose tissue
macrophages (Figure 3E). As seen in TAMs (Figure 2E), miR-
511-3p levels were consistently higher than -5p levels in each
macrophage subset (Figure 3E). Of note, abundance of the
Mrc1 mRNA correlated with that of miR-511-3p (Figure 3F),
C
further supporting the notion that the host gene and the miRNA
are transcriptionally coregulated. Taken together, these data
demonstrate robust miR-511-3p expression and activity in
distinct MRC1+ tissue-macrophage subtypes.
ROCK2 Is a Direct Target of miR-511-3pWe then used TargetScan (Lewis et al., 2005) and DIANA microT
(Maragkakis et al., 2009) to identify miR-511-3p predicted
targets. The analysis retrieved a list of 145 genes (Table S1)
that we analyzed by DAVID Bioinformatic resources 6.7 (Huang
et al., 2009). We found that a significant proportion of these
genes are involved in biological processes related to ‘‘cell
morphogenesis’’ (Table S2).
To validate miR-511-3p predicted targets, we first generated
a mutant miR-511-3p sequence by substituting four nucleotides
in the pre-miR-511 sequence of the SFFV.miR-511 LV. Three out
of four substitutions are located in the seed sequence of miR-
511-3p, and were selected to not modify the complementary
miR-511-5p sequence and to not perturb the stem-loop struc-
ture of the pre-miRNA (Figure S3A). We termed the resultant
vector SFFV.miR-511-mut LV. To validate the mutant sequence,
we transducedRAW264.7monocytic cells with themiRT-511-5p
or -3p reporter LV, and superinfected the transduced cells with
the SFFV.miR-511 or -511-mut LV. As shown in Figure 4A, the
four mutated nucleotides in the miR-511-3p sequence
completely abrogated its activity.
We then performed dual-luciferase assays to test the 30 UTRsof a small panel of miR-511-3p predicted targets, including Rho-
dependent kinase-2 (Rock2), a serine/threonine kinase that
regulates cell’s cytoskeleton contractility (Samuel et al., 2011).
We first transduced RAW264.7 cells with either SFFV.miR-511
or SFFV.miR-511-mut LV and, 1 week later, transfected the
dual-luciferase constructs in the transduced cells. We observed
robustRock2-UTR-dependent repression of luciferase activity in
SFFV.miR-511-overexpressing cells, but not SFFV.miR-511-
mut-overexpressing cells (Figure 4B). We further validated
miR-511-3p/Rock2-UTR interaction by testing the Rock2 30
UTR (as well as a mutated sequence; Figure S3B) in an in vitro
GFP repression assay based on our LV reporter system (Fig-
ure 4C; Extended Experimental Procedures). By this approach,
we confirmed direct interaction between miR-511-3p and the
Rock2 30 UTR.Finally, we analyzed the expression of ROCK2 in RAW264.7
cells, P388D1 cells, and BMDMs engineered to overexpress
either miR-511 or miR-511-mut. miR-511-3p downregulated
ROCK2 both at the mRNA (Figures 4D and 4F) and protein
(Figures 4E, 4G, and 4H) level. Taken together, these data dem-
onstrate that ROCK2 is a direct target of mouse miR-511-3p.
The Human MRC1 Gene Encodes for an ActivemiR-511-3p SequenceThe human MRC1 gene contains a miR-511 sequence (hsa-
miR-511) located in the fifth intron of the gene; of note, hsa-
miR-511-3p is a miRNA, currently not annotated in miRBase
(http://www.mirbase.org). The mature hsa-miR-511-3p but
not -5p sequence is conserved in M. musculus and H. sapiens
(Figure S4A). We then asked whether miR-511-3p activity is
conserved in the two species. To identify the active strand of
ell Reports 1, 141–154, February 23, 2012 ª2012 The Authors 145
Figure 3. Preferential Expression and Activity of miR-511-3p in MRC1+ Tissue-Resident Macrophages
(A–D) Flow cytometry analysis of F4/80+ tissue-resident macrophages (further separated based onMRC1 andCD11c expression), Gr1+F4/80� granulocytes, and
CD11c+F4/80� DCs, in the indicated tissues/organs of FVB/n mice. Flow cytometry dot plots on the left show the gating strategy. The scatterplot on the right
shows GFP repression (versus no-miRT control) in the individual cell types. Each dot in the scatterplot corresponds to one mouse. Statistical analysis of fold-
repression values was performed by unpaired Student’s t test.
146 Cell Reports 1, 141–154, February 23, 2012 ª2012 The Authors

the human miR-511, we generated both reporter and overex-
pressing LVs (Figure S4B), as described above for the mouse
miR-511. We transduced human U937 monocytic cells with the
reporter LVs and then superinfected the transduced cells with
the overexpressing LVs. Analysis of GFP repression showed
that, as in the mouse system, miR-511-3p is the active strand
of the human pre-miR-511 (Figure 5A).
As in the mouse system, predicted targets of human miR-511-
3p (Table S3) comprise genes involved in biological processes
related to ‘‘cell morphogenesis’’ (Table S4). Overexpression of
human miR-511-3p decreased ROCK2 protein in U937 cells
(Figure 5B), suggesting that ROCK2 is a direct target of human
miR-511-3p, as predicted by TargetRank (Nielsen et al., 2007).
We confirmed this finding by analyzing human miR-511-3p/
ROCK2-UTR interaction in an in vitro GFP repression assay
based on our reporter LV system (Figure 5C; Extended Experi-
mental Procedures). Together, these data strongly suggest that
miR-511-3p activity is conserved in mice and humans.
Overexpression of miR-511-3p in BM-Derived CellsInhibits Tumor Growth and Alters Tumor Blood VesselMorphologyTo study the biological function of mouse miR-511-3p, we over-
expressed it in BM-derived hematopoietic cells. To this aim, we
transduced HS/PCs obtained from CD45.1/C57BL/6 mice with
either SFFV.miR-511 or -511-mut LV, and transplanted the
transduced cells into irradiated, congenic CD45.2/C57BL/6
mice, to obtain SFFV.miR-511 and SFFV.miR-511-mut mice,
respectively. Four weeks after the transplant, we inoculated
LLC cells subcutaneously in the transplanted mice and moni-
tored tumor growth for 3–4 weeks.
Unexpectedly, miR-511-3p overexpression in hematopoietic
cells inhibited LLC growth (Figure 6A). We could reasonably
exclude that tumor growth inhibition by miR-511-3p overexpres-
sion was due to defective hematopoiesis and/or altered recruit-
ment of hematopoietic cells to the tumors. Indeed, miR-511-3p
overexpression in hematopoietic cells did not affect the repo-
pulating activity of the transduced HS/PCs, as shown by the
similarly high frequency of CD45.1+OFP+, donor-transduced
hematopoietic cells in the blood of both groups of mice (Fig-
ure S5A). Furthermore, miR-511-3p overexpression neither
affected the recruitment of F4/80+ TAMs (which represent up
to 60% of all tumor-infiltrating hematopoietic cells in this tumor
model), Gr1+ neutrophils, NK, T and B cells to the tumors (Fig-
ure S5B), nor the relative frequency of MRC1+ and CD11c+
TAM subsets (Figure S5C).
We then asked whether miR-511-3p overexpression influ-
enced tumor angiogenesis. Although we did not observe
changes in vascular density by immunofluorescence staining
of tumor sections (data not shown), we noted that miR-511-3p
overexpression altered the architecture of the tumor microvas-
cular network by augmenting blood vessel tortuosity and the
(E) qPCR of selected miRNAs in MRC1+ and CD11c+ adipose tissue macrophage
(mean values ±SEM versus Let7a; n = 3 biological samples). Statistical analysis
(F) qPCR of selectedmRNAs in the adipose tissuemacrophages. The data show fo
macrophages (reference population). Normalization was performed by b2m. Note
values was performed by unpaired Student’s t test.
C
occurrence of enlarged, glomerular-like structures (Figures 6B
and 6C). Accordingly, morphometric analysis of thick tumor
sections showed similar vascular area but significantly reduced
total and mean length of blood vessels in SFFV.miR-511
compared with -511-mut mice (Figure 6D). Together, these
data indicate that miR-511-3p overexpression in BM-derived
cells inhibits tumor growth and dysregulates angiogenesis
without affecting hematopoiesis detectably.
Overexpression of miR-511-3p in TAMs GloballyDownregulates miR-511-3p Predicted Target GenesBecause the genetic programs of TAMs may influence tumor
angiogenesis and growth (Qian and Pollard, 2010), we asked
whether miR-511-3p overexpression had modulated TAM’s
gene expression. To address this question, we sorted F4/
80+OFP+ TAMs from LLCs grown in SFFV.miR-511 or -511-
mut mice. qPCR analysis of selected miRNAs showed that the
SFFV.miR-511 LV upregulated the expression of miR-511-3p
by�5-fold in the F4/80+OFP+ TAMs of SFFV.miR-511 compared
to -511-mut mice, which only express the endogenous miR-511-
3p sequence (Figure 7A). Of note, miR-511-3p-mut was only
detected in the TAMs of SFFV.miR-511-mut mice, whereas
miR-511-5p was expressed by both SFFV.miR-511 and
SFFV.miR-511-mut TAMs. However, as seen in the TAMs of
MMTV-PyMT mice (Figure 2D), expression of miR-511-5p was
much lower than miR-511-3p, strongly suggesting that, even
when overexpressed, it is rapidly degraded in vivo.
We then performed RNA-Seq analyses of the transcriptome
of sorted F4/80+OFP+ TAMs. We used the Illumina HiSeq
2000 platform and retrieved 249 genes (out of 16,355; 1.5%;
p < 0.05 adjusted for false discovery rate) that were differentially
expressed in the TAMs of SFFV.miR-511 versus -511-mut mice
(Table S5). Remarkably, it was found that the predicted targets of
miR-511-3p (Table S1) were globally downregulated by miR-
511-3p overexpression in TAMs (Figure 7B). We also used
TargetRank to identify transcripts that contain in their 30 UTR at
least one sequence with perfect complementarity to the seed
sequence of miR-511-3p (i.e., M8-A1 8-mer and M8 7-mer
binding sites; Table S6), and found that such transcripts were
globally downregulated by miR-511-3p overexpression (Fig-
ure 7C; see Extended Experimental Procedures). Conversely,
genes containing M8-A1 8-mer or M8 7-mer binding sites for
either miR-511-5p or -3p-mut were significantly less downregu-
lated by miRNA overexpression (Figures 7D and 7E). These data
demonstrate broad and robust miR-511-3p activity in TAMs by
our overexpression platform.
Overexpression of miR-511-3p Tunes down theProtumoral Gene Signature of MRC1+ TAMsAlthough the vast majority of the differentially expressed genes
were downregulated by miR-511-3p overexpression in TAMs
(Table S5), they could not be identified as miR-511-3p direct
s isolated from FVB/n mice. The data show relative abundance of each miRNA
of the data was performed on DCt values by unpaired Student’s t test.
ld change (= 2DCt; mean values ±SEM; n = 3 biological samples) versus CD11c+
that Tie2was undetectable in CD11c+macrophages. Statistical analysis ofDCt
ell Reports 1, 141–154, February 23, 2012 ª2012 The Authors 147
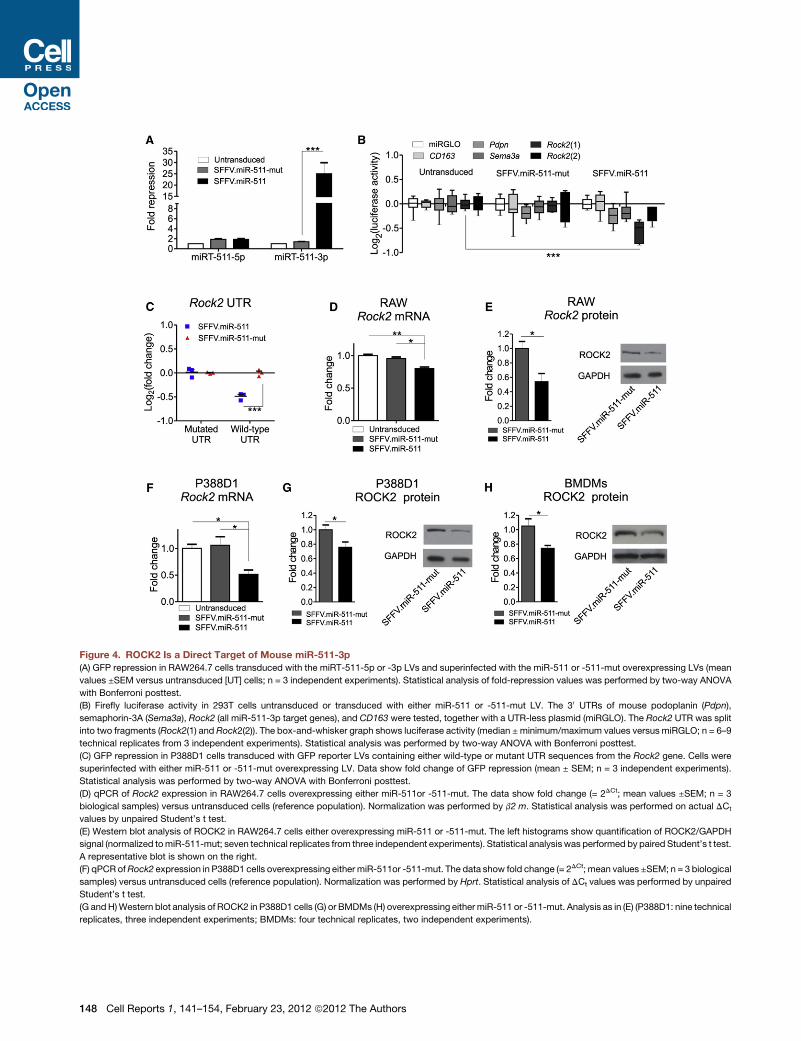
Figure 4. ROCK2 Is a Direct Target of Mouse miR-511-3p
(A) GFP repression in RAW264.7 cells transduced with the miRT-511-5p or -3p LVs and superinfected with the miR-511 or -511-mut overexpressing LVs (mean
values ±SEM versus untransduced [UT] cells; n = 3 independent experiments). Statistical analysis of fold-repression values was performed by two-way ANOVA
with Bonferroni posttest.
(B) Firefly luciferase activity in 293T cells untransduced or transduced with either miR-511 or -511-mut LV. The 30 UTRs of mouse podoplanin (Pdpn),
semaphorin-3A (Sema3a), Rock2 (all miR-511-3p target genes), and CD163 were tested, together with a UTR-less plasmid (miRGLO). The Rock2 UTR was split
into two fragments (Rock2(1) and Rock2(2)). The box-and-whisker graph shows luciferase activity (median ±minimum/maximum values versus miRGLO; n = 6–9
technical replicates from 3 independent experiments). Statistical analysis was performed by two-way ANOVA with Bonferroni posttest.
(C) GFP repression in P388D1 cells transduced with GFP reporter LVs containing either wild-type or mutant UTR sequences from the Rock2 gene. Cells were
superinfected with either miR-511 or -511-mut overexpressing LV. Data show fold change of GFP repression (mean ± SEM; n = 3 independent experiments).
Statistical analysis was performed by two-way ANOVA with Bonferroni posttest.
(D) qPCR of Rock2 expression in RAW264.7 cells overexpressing either miR-511or -511-mut. The data show fold change (= 2DCt; mean values ±SEM; n = 3
biological samples) versus untransduced cells (reference population). Normalization was performed by b2 m. Statistical analysis was performed on actual DCt
values by unpaired Student’s t test.
(E) Western blot analysis of ROCK2 in RAW264.7 cells either overexpressing miR-511 or -511-mut. The left histograms show quantification of ROCK2/GAPDH
signal (normalized tomiR-511-mut; seven technical replicates from three independent experiments). Statistical analysis was performed by paired Student’s t test.
A representative blot is shown on the right.
(F) qPCRofRock2 expression in P388D1 cells overexpressing either miR-511or -511-mut. The data show fold change (= 2DCt; mean values ±SEM; n = 3 biological
samples) versus untransduced cells (reference population). Normalization was performed by Hprt. Statistical analysis of DCt values was performed by unpaired
Student’s t test.
(G andH)Western blot analysis of ROCK2 in P388D1 cells (G) or BMDMs (H) overexpressing eithermiR-511 or -511-mut. Analysis as in (E) (P388D1: nine technical
replicates, three independent experiments; BMDMs: four technical replicates, two independent experiments).
148 Cell Reports 1, 141–154, February 23, 2012 ª2012 The Authors
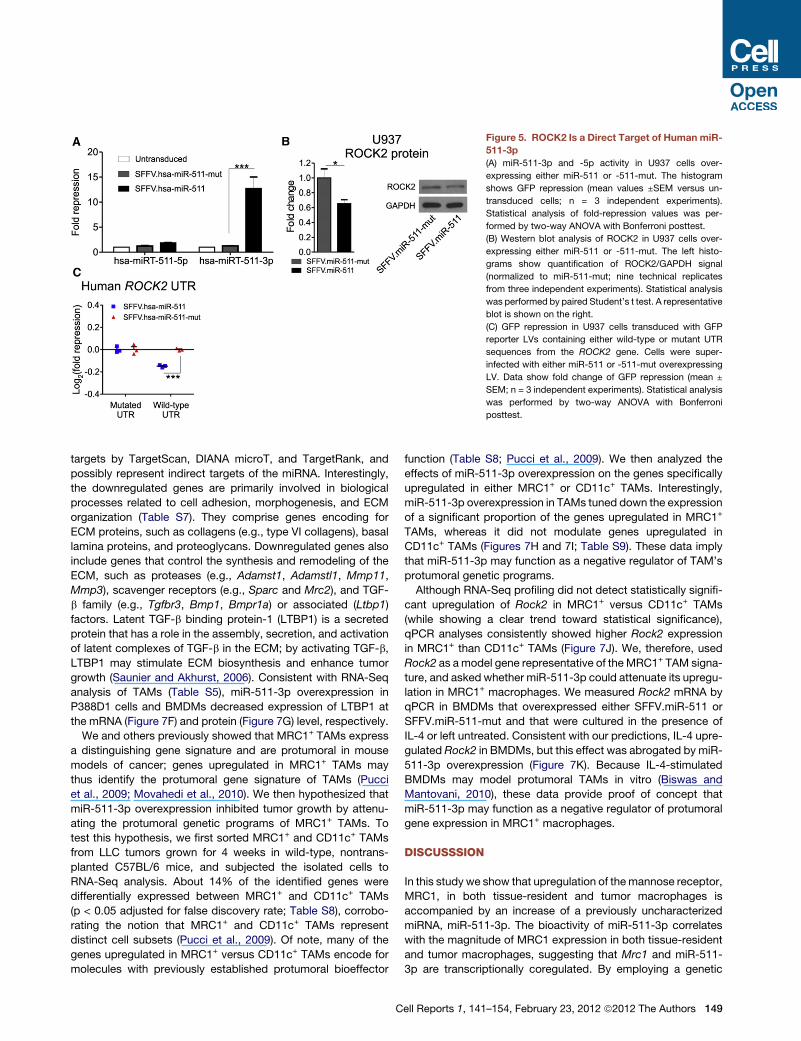
Figure 5. ROCK2 Is a Direct Target of Human miR-
511-3p
(A) miR-511-3p and -5p activity in U937 cells over-
expressing either miR-511 or -511-mut. The histogram
shows GFP repression (mean values ±SEM versus un-
transduced cells; n = 3 independent experiments).
Statistical analysis of fold-repression values was per-
formed by two-way ANOVA with Bonferroni posttest.
(B) Western blot analysis of ROCK2 in U937 cells over-
expressing either miR-511 or -511-mut. The left histo-
grams show quantification of ROCK2/GAPDH signal
(normalized to miR-511-mut; nine technical replicates
from three independent experiments). Statistical analysis
was performed by paired Student’s t test. A representative
blot is shown on the right.
(C) GFP repression in U937 cells transduced with GFP
reporter LVs containing either wild-type or mutant UTR
sequences from the ROCK2 gene. Cells were super-
infected with either miR-511 or -511-mut overexpressing
LV. Data show fold change of GFP repression (mean ±
SEM; n = 3 independent experiments). Statistical analysis
was performed by two-way ANOVA with Bonferroni
posttest.
targets by TargetScan, DIANA microT, and TargetRank, and
possibly represent indirect targets of the miRNA. Interestingly,
the downregulated genes are primarily involved in biological
processes related to cell adhesion, morphogenesis, and ECM
organization (Table S7). They comprise genes encoding for
ECM proteins, such as collagens (e.g., type VI collagens), basal
lamina proteins, and proteoglycans. Downregulated genes also
include genes that control the synthesis and remodeling of the
ECM, such as proteases (e.g., Adamst1, Adamstl1, Mmp11,
Mmp3), scavenger receptors (e.g., Sparc and Mrc2), and TGF-
b family (e.g., Tgfbr3, Bmp1, Bmpr1a) or associated (Ltbp1)
factors. Latent TGF-b binding protein-1 (LTBP1) is a secreted
protein that has a role in the assembly, secretion, and activation
of latent complexes of TGF-b in the ECM; by activating TGF-b,
LTBP1 may stimulate ECM biosynthesis and enhance tumor
growth (Saunier and Akhurst, 2006). Consistent with RNA-Seq
analysis of TAMs (Table S5), miR-511-3p overexpression in
P388D1 cells and BMDMs decreased expression of LTBP1 at
the mRNA (Figure 7F) and protein (Figure 7G) level, respectively.
We and others previously showed that MRC1+ TAMs express
a distinguishing gene signature and are protumoral in mouse
models of cancer; genes upregulated in MRC1+ TAMs may
thus identify the protumoral gene signature of TAMs (Pucci
et al., 2009; Movahedi et al., 2010). We then hypothesized that
miR-511-3p overexpression inhibited tumor growth by attenu-
ating the protumoral genetic programs of MRC1+ TAMs. To
test this hypothesis, we first sorted MRC1+ and CD11c+ TAMs
from LLC tumors grown for 4 weeks in wild-type, nontrans-
planted C57BL/6 mice, and subjected the isolated cells to
RNA-Seq analysis. About 14% of the identified genes were
differentially expressed between MRC1+ and CD11c+ TAMs
(p < 0.05 adjusted for false discovery rate; Table S8), corrobo-
rating the notion that MRC1+ and CD11c+ TAMs represent
distinct cell subsets (Pucci et al., 2009). Of note, many of the
genes upregulated in MRC1+ versus CD11c+ TAMs encode for
molecules with previously established protumoral bioeffector
C
function (Table S8; Pucci et al., 2009). We then analyzed the
effects of miR-511-3p overexpression on the genes specifically
upregulated in either MRC1+ or CD11c+ TAMs. Interestingly,
miR-511-3p overexpression in TAMs tuned down the expression
of a significant proportion of the genes upregulated in MRC1+
TAMs, whereas it did not modulate genes upregulated in
CD11c+ TAMs (Figures 7H and 7I; Table S9). These data imply
that miR-511-3p may function as a negative regulator of TAM’s
protumoral genetic programs.
Although RNA-Seq profiling did not detect statistically signifi-
cant upregulation of Rock2 in MRC1+ versus CD11c+ TAMs
(while showing a clear trend toward statistical significance),
qPCR analyses consistently showed higher Rock2 expression
in MRC1+ than CD11c+ TAMs (Figure 7J). We, therefore, used
Rock2 as amodel gene representative of the MRC1+ TAM signa-
ture, and asked whether miR-511-3p could attenuate its upregu-
lation in MRC1+ macrophages. We measured Rock2 mRNA by
qPCR in BMDMs that overexpressed either SFFV.miR-511 or
SFFV.miR-511-mut and that were cultured in the presence of
IL-4 or left untreated. Consistent with our predictions, IL-4 upre-
gulated Rock2 in BMDMs, but this effect was abrogated by miR-
511-3p overexpression (Figure 7K). Because IL-4-stimulated
BMDMs may model protumoral TAMs in vitro (Biswas and
Mantovani, 2010), these data provide proof of concept that
miR-511-3p may function as a negative regulator of protumoral
gene expression in MRC1+ macrophages.
DISCUSSSION
In this study we show that upregulation of themannose receptor,
MRC1, in both tissue-resident and tumor macrophages is
accompanied by an increase of a previously uncharacterized
miRNA, miR-511-3p. The bioactivity of miR-511-3p correlates
with the magnitude of MRC1 expression in both tissue-resident
and tumor macrophages, suggesting that Mrc1 and miR-511-
3p are transcriptionally coregulated. By employing a genetic
ell Reports 1, 141–154, February 23, 2012 ª2012 The Authors 149
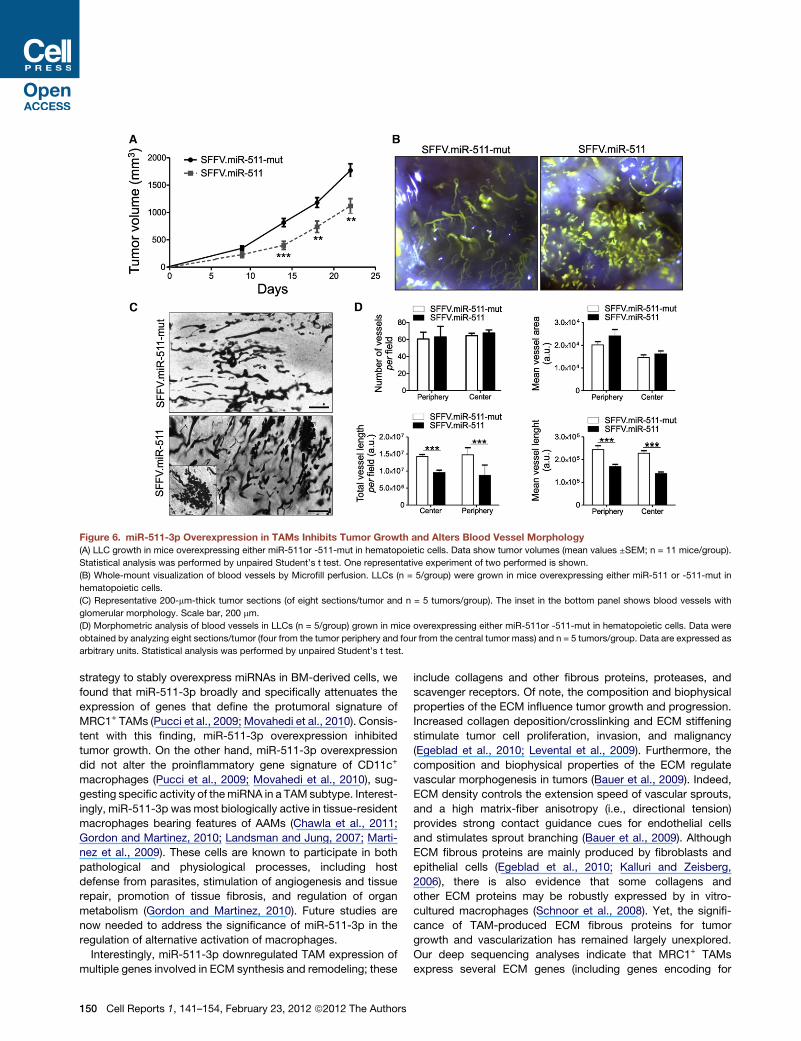
Figure 6. miR-511-3p Overexpression in TAMs Inhibits Tumor Growth and Alters Blood Vessel Morphology
(A) LLC growth in mice overexpressing either miR-511or -511-mut in hematopoietic cells. Data show tumor volumes (mean values ±SEM; n = 11 mice/group).
Statistical analysis was performed by unpaired Student’s t test. One representative experiment of two performed is shown.
(B) Whole-mount visualization of blood vessels by Microfill perfusion. LLCs (n = 5/group) were grown in mice overexpressing either miR-511 or -511-mut in
hematopoietic cells.
(C) Representative 200-mm-thick tumor sections (of eight sections/tumor and n = 5 tumors/group). The inset in the bottom panel shows blood vessels with
glomerular morphology. Scale bar, 200 mm.
(D) Morphometric analysis of blood vessels in LLCs (n = 5/group) grown in mice overexpressing either miR-511or -511-mut in hematopoietic cells. Data were
obtained by analyzing eight sections/tumor (four from the tumor periphery and four from the central tumor mass) and n = 5 tumors/group. Data are expressed as
arbitrary units. Statistical analysis was performed by unpaired Student’s t test.
strategy to stably overexpress miRNAs in BM-derived cells, we
found that miR-511-3p broadly and specifically attenuates the
expression of genes that define the protumoral signature of
MRC1+ TAMs (Pucci et al., 2009; Movahedi et al., 2010). Consis-
tent with this finding, miR-511-3p overexpression inhibited
tumor growth. On the other hand, miR-511-3p overexpression
did not alter the proinflammatory gene signature of CD11c+
macrophages (Pucci et al., 2009; Movahedi et al., 2010), sug-
gesting specific activity of themiRNA in a TAM subtype. Interest-
ingly, miR-511-3p was most biologically active in tissue-resident
macrophages bearing features of AAMs (Chawla et al., 2011;
Gordon and Martinez, 2010; Landsman and Jung, 2007; Marti-
nez et al., 2009). These cells are known to participate in both
pathological and physiological processes, including host
defense from parasites, stimulation of angiogenesis and tissue
repair, promotion of tissue fibrosis, and regulation of organ
metabolism (Gordon and Martinez, 2010). Future studies are
now needed to address the significance of miR-511-3p in the
regulation of alternative activation of macrophages.
Interestingly, miR-511-3p downregulated TAM expression of
multiple genes involved in ECM synthesis and remodeling; these
150 Cell Reports 1, 141–154, February 23, 2012 ª2012 The Authors
include collagens and other fibrous proteins, proteases, and
scavenger receptors. Of note, the composition and biophysical
properties of the ECM influence tumor growth and progression.
Increased collagen deposition/crosslinking and ECM stiffening
stimulate tumor cell proliferation, invasion, and malignancy
(Egeblad et al., 2010; Levental et al., 2009). Furthermore, the
composition and biophysical properties of the ECM regulate
vascular morphogenesis in tumors (Bauer et al., 2009). Indeed,
ECM density controls the extension speed of vascular sprouts,
and a high matrix-fiber anisotropy (i.e., directional tension)
provides strong contact guidance cues for endothelial cells
and stimulates sprout branching (Bauer et al., 2009). Although
ECM fibrous proteins are mainly produced by fibroblasts and
epithelial cells (Egeblad et al., 2010; Kalluri and Zeisberg,
2006), there is also evidence that some collagens and
other ECM proteins may be robustly expressed by in vitro-
cultured macrophages (Schnoor et al., 2008). Yet, the signifi-
cance of TAM-produced ECM fibrous proteins for tumor
growth and vascularization has remained largely unexplored.
Our deep sequencing analyses indicate that MRC1+ TAMs
express several ECM genes (including genes encoding for
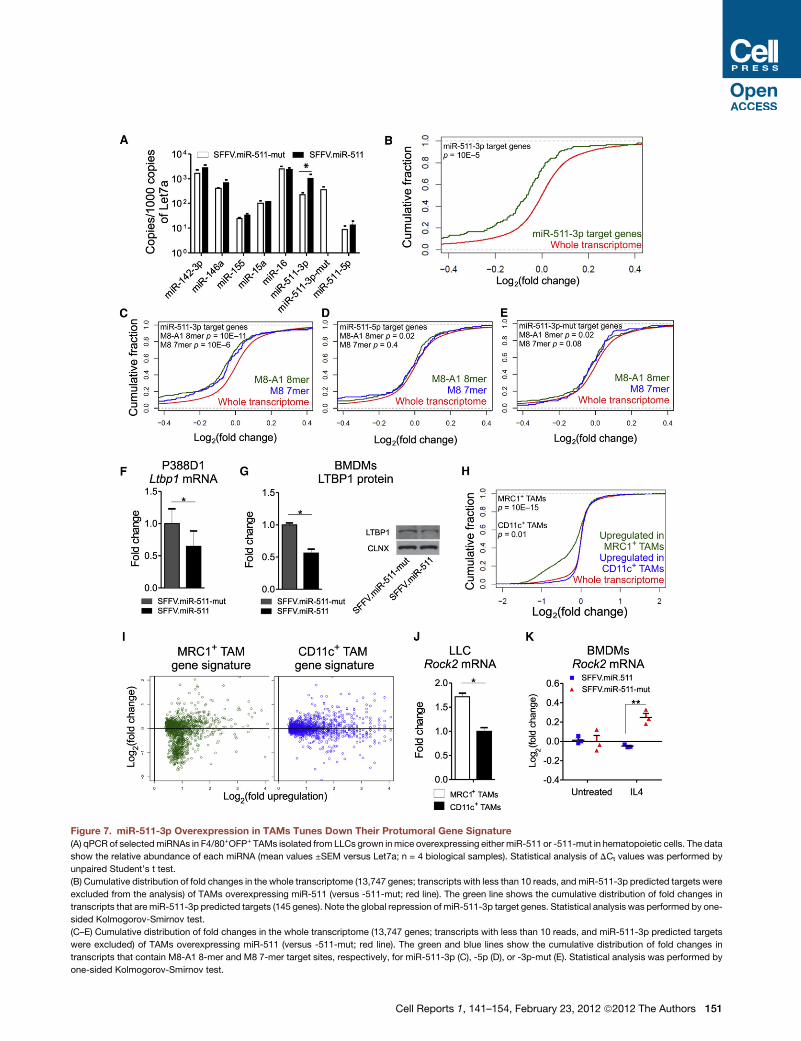
Figure 7. miR-511-3p Overexpression in TAMs Tunes Down Their Protumoral Gene Signature
(A) qPCR of selectedmiRNAs in F4/80+OFP+ TAMs isolated from LLCs grown inmice overexpressing either miR-511 or -511-mut in hematopoietic cells. The data
show the relative abundance of each miRNA (mean values ±SEM versus Let7a; n = 4 biological samples). Statistical analysis of DCt values was performed by
unpaired Student’s t test.
(B) Cumulative distribution of fold changes in the whole transcriptome (13,747 genes; transcripts with less than 10 reads, andmiR-511-3p predicted targets were
excluded from the analysis) of TAMs overexpressing miR-511 (versus -511-mut; red line). The green line shows the cumulative distribution of fold changes in
transcripts that aremiR-511-3p predicted targets (145 genes). Note the global repression of miR-511-3p target genes. Statistical analysis was performed by one-
sided Kolmogorov-Smirnov test.
(C–E) Cumulative distribution of fold changes in the whole transcriptome (13,747 genes; transcripts with less than 10 reads, and miR-511-3p predicted targets
were excluded) of TAMs overexpressing miR-511 (versus -511-mut; red line). The green and blue lines show the cumulative distribution of fold changes in
transcripts that contain M8-A1 8-mer and M8 7-mer target sites, respectively, for miR-511-3p (C), -5p (D), or -3p-mut (E). Statistical analysis was performed by
one-sided Kolmogorov-Smirnov test.
Cell Reports 1, 141–154, February 23, 2012 ª2012 The Authors 151
collagens and other fibrous proteins), which were globally and
significantly downregulated by miR-511-3p overexpression in
TAMs. Because MRC1+ TAMs represent a major component
of the perivascular tumor stroma and support vascular morpho-
genesis in tumors (Mazzieri et al., 2011; Squadrito and De Palma,
2011), modulation of ECM-protein synthesis/remodeling by
miR-511-3p in MRC1+ TAMs may have the potential to influence
ECM dynamics in the perivascular microenvironment. This
would be consistent with our finding that miR-511-3p overex-
pression in TAMs altered the morphology of intratumoral blood
vessels, possibly as a consequence of changes in the biophys-
ical properties of the perivascular ECM (and/or in the levels
of TAM-derived angiogenic factors). It is also possible that
miR-511-3p is horizontally transferred from MRC1+ TAMs to
other tumor-associated stromal cells via microvesicles or exo-
somes (Yang et al., 2011).
We identified ROCK2 as a direct target of miR-511-3p. Our
data indicate that MRC1+ TAMs as well as IL-4-polarized
BMDMs express higher Rock2 mRNA levels than
CD11c+MRC1� TAMs or unstimulated BMDMs. Of note, consti-
tutive ROCK activation in epidermal cells increases collagen
synthesis and tissue stiffness (Samuel et al., 2011). It is tempting
to speculate that increased ROCK activity inMRC1+ TAMsmight
enhance their expression and secretion of ECM proteins as part
of their protumoral genetic program. Because miR-511-3p
downregulated ROCK2 both at the mRNA and protein level,
our data suggest that miR-511-3p might negatively regulate
ROCK activity in MRC1+ TAMs and downregulate their expres-
sion of ECM genes relevant to tumor progression.
Although several miRNAs have been identified that regulate
immune cell functions (O’Connell et al., 2010), little is known of
their roles in themodulation of TAM heterogeneity and functions.
A recent report used IlluminamiRNAChips to analyze themiRNA
expression signature of human monocytes and monocyte-
derived DCs/macrophages (Tserel et al., 2011). Several miRNAs
were found to be differentially expressed between DCs/macro-
phages and freshly isolated monocytes. Among these, human
miR-511 (representing the hsa-miR-511-5p sequence described
in our study) was highly upregulated in DCs/macrophages
(Tserel et al., 2011). Although the report of Tserel and colleagues
(F) qPCR of Ltbp1 expression in P388D1 cells overexpressing either miR-511or -5
samples) versus miR-511-3p-mut (reference population). Normalization was per
Student’s t test.
(G) Western blot analysis of LTBP1 in BMDMs either overexpressing mouse miR
(CLNX) signal (normalized to miR-511-mut; four technical replicates from two inde
test. A representative blot is shown on the right.
(H) Cumulative distribution of fold changes in the whole transcriptome (16,355 gen
shows the cumulative distribution of fold changes in transcripts that are upregulate
cumulative distribution of fold changes in the transcripts that are upregulated in
performed by one-sided Kolmogorov-Smirnov test.
(I) Scatterplot distribution of fold changes in gene expression of MRC1+ and CD
upregulation of transcripts in MRC1+ versus CD11c+ TAMs (left; MRC1+ TAM
signature). The y axis shows changes in gene expression by miR-511 overexpress
the analysis. Statistical analysis of the data is presented in (H).
(J) qPCR of Rock2 expression in MRC1+ and CD11c+ TAMs isolated from LLCs. Th
versus CD11c+ TAMs (reference population). Normalization was performed by b2m
(K) qPCR of Rock2 expression in BMDMs either untreated or stimulated by IL-4;
Data show fold change in Rock2 repression (mean ± SEM; n = 3 independent exp
IL-4-induced Rock2 upregulation in the cells. Statistical analysis was performed
152 Cell Reports 1, 141–154, February 23, 2012 ª2012 The Authors
may appear consistent with our findings, we did not detect
significant activity of either human or mouse miR-511-5p in
several independent cell assays, both in vitro and in vivo.
Conversely, we identified miR-511-3p as the bioactive strand
of both human and mouse pre-miR-511. It should be noted,
however, that the humanmiR-511-3p sequence is not annotated
in miRBase and was not assayed in the Illumina miRNA Chips
employed by Tserel and colleagues, so its differential expression
could not be assessed (Tserel et al., 2011). Although the mech-
anisms that regulate miRNA strand selection are still unclear, it
is likely that the thermodynamic stability of the two ends of the
pre-miRNA determines which strand is to be selected for loading
into the RISC complex, and which is to be degraded (Khvorova
et al., 2003). Recent studies have also illustrated that miRNA
strand selection may be cell type, context, and species specific
(Biasiolo et al., 2011; Kuchenbauer et al., 2011). Nevertheless,
our analyses indicate that miR-511-3p but not -5p is highly
conserved across mammalian species, pointing to a preeminent
role of this miRNA strand. Further studies are, therefore, needed
to clarify the significance of miR-511-5p expression and activity
in macrophages.
In summary our findings reveal an unexpected layer of gene
expression control in TAMs, which relies on an endogenous
molecular switch that is activated in a tumor-promoting
(MRC1+) subset of these cells. Enhancing miR-511-3p activity
in TAMs (e.g., via delivery of macrophage-targeted miRNA
carriers) may represent a therapeutic strategy to reprogram
them from a protumoral to an antitumoral phenotype.
EXPERIMENTAL PROCEDURES
Detailed experimental procedures are presented as Extended Experimental
Procedures.
Mice
C57BL/6, CD45.1/C57BL/6, and FVB/n mice were purchased by Charles
River Laboratory (Calco, Milan). FVB/MMTV-PyMT mice were obtained from
the NCI-Frederick Mouse Repository (Frederick, MD) and established as
a colony at the San Raffaele animal facility. All procedures were performed
according to protocols approved by the Animal Care and Use Committee of
the Fondazione San Raffaele del Monte Tabor (IACUC 324, 335, and 447)
11-mut. The data show fold change (= 2DCt; mean values ±SEM; n = 3 biological
formed by Hprt. Statistical analysis of DCt values was performed by unpaired
-511 or -511-mut. The left histograms show quantification of LTBP1/calnexin
pendent experiments). Statistical analysis was performed by paired Student’s t
es) of TAMs overexpressingmiR-511 (versus -511-mut; red line). The green line
d inMRC1+ TAMs (versus CD11c+ TAMs; 1,365 genes); The blue line shows the
CD11c+ TAMs (versus MRC1+ TAMs; 1,596 genes). Statistical analysis was
11c+ TAMs overexpressing miR-511 (versus -511-mut). The x axis shows the
gene signature) or CD11c+ versus MRC1+ TAMs; (right; CD11c+ TAM gene
ion (versus -511-mut). Transcripts with less than ten reads were excluded from
e data show fold change (= 2DCt; mean values ±SEM; n = 2 biological samples)
. Statistical analysis ofDCt valueswas performed by unpaired Student’s t test.
the cells were transduced with either miR-511 or -511-mut overexpressing LV.
eriments) versus untreated cells. Note that miR-511 overexpression abrogates
by two-way ANOVA with Bonferroni posttest.
and communicated to the Ministry of Health and local authorities according to
the Italian law.
LV Transduction
For experiments in vitro, cells were transduced with LV doses ranging from 104
to 105 transducing units (TU)/ml. When required, sequential transduction was
performed by (i) transducing the cells with the first LV; (ii) washing and replating
the cells; and (iii) transducing the cells with the second LV (superinfection) on
day 5–7 after the first transduction. For HS/PC transplantation, 106 HS/PCs/ml
were prestimulated for 6 hr in serum-freemedium containing a cocktail of cyto-
kines, and then transduced with miRT reporter or miR-511-overexpressing
LVs with a dose equivalent to 108 TU/ml. After transduction, 106 cells were
infused into the tail vein of lethally irradiated mice.
Tumor Experiments
LLC/3LL cells (5 3 106) were injected subcutaneously in syngenic C57BL/6
mice, and tumors were grown for 3–4 weeks; tumor size was determined by
caliper measurements. N202 mammary carcinoma cells (5 3 106) were in-
jected subcutaneously in syngenic FVB/n mice, and tumors were grown for
4 weeks.
For miRT reporter studies we performed two independent experiments. In
the first experiment, transduced HS/PCs were transplanted in irradiated
C57BL/6 mice, which were subsequently challenged with LLC cells. In the
second experiment, transduced HS/PCs were transplanted in irradiated
FVB/nmice, subsequently challengedwith N202 cells. FormiR overexpression
studies we performed three independent experiments. In each experiment,
transduced HS/PCs were transplanted in irradiated C57BL/6 mice, subse-
quently challenged with LLC cells; tumor growth was analyzed for 3–4 weeks
in the first two experiments. In the first experiment, tumorswere also harvested
for sorting of TAMs and RNA-Seq analysis. In the second experiment, mice
were randomly selected for Microfill perfusion and analysis of the tumor-asso-
ciated vasculature. In the third experiment, tumors were harvested for sorting
of TAMs and qPCR of miRNAs.
Calculation of miRNA Activity
In most of the experiments, we calculated miR-511-mediated GFP repression
(indicated as ‘‘fold-repression’’) in live cells by using the following equation:
hMFI DLNGFRmiRT 3 ðMFI GFPmiRTÞ�1
i.hMFI DLNGFRno-miRT
3 ðMFI GFPno-miRTÞ�1i;
where MFI is the mean fluorescence activity of either GFP or DLNGFR
measured by flow cytometry.
Statistical Analysis
Statistical analysis of the data is described in the figure legends and Extended
Experimental Procedures. Statistical significance of the data is indicated as
follows: *: p < 0.05; **: p < 0.01; ***: p < 0.001.
ACCESSION NUMBERS
RNA sequencing data (12 TAM samples) have been deposited in the GEO
repository at NCBI under accession number GSE34903.
SUPPLEMENTAL INFORMATION
Supplemental Information includes five figures, 13 tables, and Extended
Experimental Procedures and can be found with this article online at doi:10.
1016/j.celrep.2011.12.005.
LICENSING INFORMATION
This is an open-access article distributed under the terms of the Creative
Commons Attribution-Noncommercial-No Derivative Works 3.0 Unported
C
License (CC-BY-NC-ND; http://creativecommons.org/licenses/by-nc-nd/3.0/
legalcode).
ACKNOWLEDGMENTS
We thank Emanuele Canonico for cell sorting and Alberto Gallotti for help with
some experiments. This research was supported by the European Research
Council (Starting Grant 243128/TIE2+Monocytes to M.D.P.) and Associazione
Italiana per la Ricerca sul Cancro (AIRC IG-2010 to M.D.P.; AIRC IG-2010 to
L.N.). F.P. was supported by a Fondazione Italiana per la Ricerca sul Cancro
(FIRC) fellowship.
Received: August 8, 2011
Revised: December 15, 2011
Accepted: December 19, 2011
Published online: February 9, 2012
REFERENCES
Bartel, D.P. (2009). MicroRNAs: target recognition and regulatory functions.
Cell 136, 215–233.
Baskerville, S., and Bartel, D.P. (2005). Microarray profiling of microRNAs
reveals frequent coexpression with neighboring miRNAs and host genes.
RNA 11, 241–247.
Bauer, A.L., Jackson, T.L., and Jiang, Y. (2009). Topography of extracellular
matrix mediates vascular morphogenesis and migration speeds in angiogen-
esis. PLoS Comput. Biol. 5, e1000445.
Biasiolo, M., Sales, G., Lionetti, M., Agnelli, L., Todoerti, K., Bisognin, A.,
Coppe, A., Romualdi, C., Neri, A., and Bortoluzzi, S. (2011). Impact of host
genes and strand selection on miRNA and miRNA* expression. PLoS One 6,
e23854.
Biswas, S.K., and Mantovani, A. (2010). Macrophage plasticity and interaction
with lymphocyte subsets: cancer as a paradigm. Nat. Immunol. 11, 889–896.
Brown, B.D., Gentner, B., Cantore, A., Colleoni, S., Amendola, M., Zingale, A.,
Baccarini, A., Lazzari, G., Galli, C., and Naldini, L. (2007). Endogenous micro-
RNA can be broadly exploited to regulate transgene expression according to
tissue, lineage and differentiation state. Nat. Biotechnol. 25, 1457–1467.
Chawla, A., Nguyen, K.D., and Goh, Y.P. (2011). Macrophage-mediated
inflammation in metabolic disease. Nat. Rev. Immunol. 11, 738–749.
DeNardo, D.G., Andreu, P., and Coussens, L.M. (2010). Interactions between
lymphocytes and myeloid cells regulate pro- versus anti-tumor immunity.
Cancer Metastasis Rev. 29, 309–316.
De Palma, M., Venneri, M.A., Galli, R., Sergi Sergi, L., Politi, L.S., Sampaolesi,
M., and Naldini, L. (2005). Tie2 identifies a hematopoietic lineage of proangio-
genic monocytes required for tumor vessel formation and a mesenchymal
population of pericyte progenitors. Cancer Cell 8, 211–226.
Egeblad, M., Rasch, M.G., and Weaver, V.M. (2010). Dynamic interplay
between the collagen scaffold and tumor evolution. Curr. Opin. Cell Biol. 22,
697–706.
Gordon, S., and Martinez, F.O. (2010). Alternative activation of macrophages:
mechanism and functions. Immunity 32, 593–604.
Huang, D.W., Sherman, B.T., and Lempicki, R.A. (2009). Systematic and inte-
grative analysis of large gene lists using DAVID bioinformatics resources. Nat.
Protoc. 4, 44–57.
Kalluri, R., and Zeisberg, M. (2006). Fibroblasts in cancer. Nat. Rev. Cancer 6,
392–401.
Khvorova, A., Reynolds, A., and Jayasena, S.D. (2003). Functional siRNAs and
miRNAs exhibit strand bias. Cell 115, 209–216.
Kuchenbauer, F., Mah, S.M., Heuser, M., McPherson, A., Ruschmann, J.,
Rouhi, A., Berg, T., Bullinger, L., Argiropoulos, B., Morin, R.D., et al. (2011).
Comprehensive analysis of mammalian miRNA* species and their role in
myeloid cells. Blood 118, 3350–3358.
ell Reports 1, 141–154, February 23, 2012 ª2012 The Authors 153
Landsman, L., and Jung, S. (2007). Lung macrophages serve as obligatory
intermediate between blood monocytes and alveolar macrophages. J. Immu-
nol. 179, 3488–3494.
Levental, K.R., Yu, H., Kass, L., Lakins, J.N., Egeblad, M., Erler, J.T., Fong,
S.F., Csiszar, K., Giaccia, A., Weninger, W., et al. (2009). Matrix crosslinking
forces tumor progression by enhancing integrin signaling. Cell 139, 891–906.
Lewis, B.P., Burge, C.B., and Bartel, D.P. (2005). Conserved seed pairing,
often flanked by adenosines, indicates that thousands of human genes are mi-
croRNA targets. Cell 120, 15–20.
Maragkakis, M., Alexiou, P., Papadopoulos, G.L., Reczko, M., Dalamagas, T.,
Giannopoulos, G., Goumas, G., Koukis, E., Kourtis, K., Simossis, V.A., et al.
(2009). AccuratemicroRNA target prediction correlates with protein repression
levels. BMC Bioinformatics 10, 295.
Martinez, F.O., Helming, L., and Gordon, S. (2009). Alternative activation of
macrophages: an immunologic functional perspective. Annu. Rev. Immunol.
27, 451–483.
Mazzieri, R., Pucci, F., Moi, D., Zonari, E., Ranghetti, A., Berti, A., Politi, L.S.,
Gentner, B., Brown, J.L., Naldini, L., and De Palma, M. (2011). Targeting the
ANG2/TIE2 axis inhibits tumor growth and metastasis by impairing angiogen-
esis and disabling rebounds of proangiogenic myeloid cells. Cancer Cell 19,
512–526.
Movahedi, K., Laoui, D., Gysemans, C., Baeten, M., Stange, G., Van den Bos-
sche, J., Mack, M., Pipeleers, D., In’t Veld, P., De Baetselier, P., and Van Gin-
derachter, J.A. (2010). Different tumor microenvironments contain functionally
distinct subsets of macrophages derived from Ly6C(high) monocytes. Cancer
Res. 70, 5728–5739.
Nielsen, C.B., Shomron, N., Sandberg, R., Hornstein, E., Kitzman, J., and
Burge, C.B. (2007). Determinants of targeting by endogenous and exogenous
microRNAs and siRNAs. RNA 13, 1894–1910.
O’Connell, R.M., Rao, D.S., Chaudhuri, A.A., and Baltimore, D. (2010). Physi-
ological and pathological roles for microRNAs in the immune system. Nat. Rev.
Immunol. 10, 111–122.
Pucci, F., Venneri, M.A., Biziato, D., Nonis, A., Moi, D., Sica, A., Di Serio, C.,
Naldini, L., and De Palma, M. (2009). A distinguishing gene signature shared
by tumor-infiltrating Tie2-expressing monocytes, blood ‘‘resident’’ mono-
cytes, and embryonic macrophages suggests common functions and devel-
opmental relationships. Blood 114, 901–914.
154 Cell Reports 1, 141–154, February 23, 2012 ª2012 The Authors
Qian, B.Z., and Pollard, J.W. (2010). Macrophage diversity enhances tumor
progression and metastasis. Cell 141, 39–51.
Rolny, C.,Mazzone,M., Tugues, S., Laoui, D., Johansson, I., Coulon, C., Squa-
drito, M.L., Segura, I., Li, X., Knevels, E., et al. (2011). HRG inhibits tumor
growth and metastasis by inducing macrophage polarization and vessel
normalization through downregulation of PlGF. Cancer Cell 19, 31–44.
Samuel, M.S., Lopez, J.I., McGhee, E.J., Croft, D.R., Strachan, D., Timpson,
P., Munro, J., Schroder, E., Zhou, J., Brunton, V.G., et al. (2011). Actomy-
osin-mediated cellular tension drives increased tissue stiffness and b-catenin
activation to induce epidermal hyperplasia and tumor growth. Cancer Cell 19,
776–791.
Saunier, E.F., and Akhurst, R.J. (2006). TGF beta inhibition for cancer therapy.
Curr. Cancer Drug Targets 6, 565–578.
Schnoor, M., Cullen, P., Lorkowski, J., Stolle, K., Robenek, H., Troyer, D., Rau-
terberg, J., and Lorkowski, S. (2008). Production of type VI collagen by human
macrophages: a new dimension in macrophage functional heterogeneity. J.
Immunol. 180, 5707–5719.
Sica, A., and Bronte, V. (2007). Altered macrophage differentiation and
immune dysfunction in tumor development. J. Clin. Invest. 117, 1155–1166.
Squadrito, M.L., and De Palma, M. (2011). Macrophage regulation of
tumor angiogenesis: implications for cancer therapy. Mol. Aspects Med. 32,
123–145.
Stein, M., Keshav, S., Harris, N., and Gordon, S. (1992). Interleukin 4 potently
enhances murine macrophage mannose receptor activity: a marker of alterna-
tive immunologic macrophage activation. J. Exp. Med. 176, 287–292.
Taylor, P.R., Martinez-Pomares, L., Stacey, M., Lin, H.H., Brown, G.D., and
Gordon, S. (2005). Macrophage receptors and immune recognition. Annu.
Rev. Immunol. 23, 901–944.
Tserel, L., Runnel, T., Kisand, K., Pihlap, M., Bakhoff, L., Kolde, R., Peterson,
H., Vilo, J., Peterson, P., and Rebane, A. (2011). MicroRNA expression profiles
of human blood monocyte-derived dendritic cells and macrophages reveal
miR-511 as putative positive regulator of Toll-like receptor 4. J. Biol. Chem.
286, 26487–26495.
Yang, M., Chen, J., Su, F., Yu, B., Su, F., Lin, L., Liu, Y., Huang, J.D., and Song,
E. (2011). Microvesicles secreted by macrophages shuttle invasion-potenti-
ating microRNAs into breast cancer cells. Mol. Cancer 10, 117.
Supplemental Information
EXTENDED EXPERIMENTAL PROCEDURES
Lentiviral Vector (LV) Construction and ProductionHuman andmousemiR-511 target (miRT) sequences were designed based onmiRNA sequences obtained from the miRNA Registry
(http://microrna.sanger.ac.uk/). Oligonucleotides used for generating miRT sequences are shown in Table S10. Briefly, to generate
the miRT LVs, the Sense 1 (S1), Sense 2 (S2), Antisense 1 (AS1), and Antisense 2 (AS2) oligonucleotides were annealed and ligated
into the 30-UTR of the GFP gene contained in a LV co-expressing DLNGFR and GFP from a bidirectional PGK promoter (Amendola
et al., 2005), as shown in Figure 1C.
In order to overexpress mouse and human miR-511, or their mutated forms, we designed (GeneArt Invitrogen) DNA sequences
encompassing themiR-511 intronic sequence of theMRC1 gene (Table S11). Briefly, we cloned the DNA fragment into themulticlon-
ing site present in the EF1a intron of a LV containing the SFFV promoter, exon 1 and intron 1 of the EF1a gene, and the OFP reporter
gene, as shown in Figure 1D.
Vesicular stomatitis virus (VSV)-pseudotyped, third-generation LVs were produced by transient four-plasmid cotransfection into
293T cells and concentrated by ultracentrifugation, as described (De Palma and Naldini, 2002). Expression titers of OFP- or
DLNGFR-expressing LVs were determined on HeLa cells by limiting dilution. Vector particle content was measured by HIV-1 Gag
p24 antigen immunocapture (NEN Life Science Products; Waltham, MA). Vector infectivity was calculated as the ratio between titer
and particle content. Titer of 293T conditioned medium (before ultracentrifugation) ranged from 106 to 107 transducing units/ml and
infectivity from 104 to 105 transducing units/ng of p24.
LV Transduction293T, RAW264.7, P388D1, U937, and bone marrow derived macrophages (BMDMs) were transduced with LV doses ranging from
104 to 105 transducing units/ml. The fraction of DLNGFR+ (miRT reporter LVs) or OFP+ (overexpressing LVs) cells was greater
than 80% in each experiment. When required, sequential transduction was performed by (i) transducing the cells with the first LV
for 12 hr; (ii) washing and replating the cells; (iii) transducing the cells with the second LV (superinfection) on day 5-7 after the first
transduction, for 12 hr in standard conditions.
Calculation of miRNA ActivityIn most of the experiments, we calculated miR-511-mediated GFP repression (indicated as ‘‘fold-repression’’) in live cells by using
the following equation:
hMFI DLNGFRmiRT 3 ðMFI GFPmiRTÞ�1
i.hMFI DLNGFRno-miRT 3 ðMFI GFPno-miRTÞ�1
i;
where MFI is the mean fluorescence activity of either GFP or DLNGFR measured by flow cytometry.
In some experiments, we calculated GFP repression by using the following equation:
hMFI DLNGFRmiRT 3 ðMFI GFPmiRTÞ�1
i.hMFI DLNGFRmiRT=UT 3
�MFI GFPmiRT=UT
��1i;
where miRT/UT is the GFP or DLNGFR MFI of cells that contain the reporter but not the overexpressing LV.
Cell LinesHuman 293T, mouse RAW264.7, mouse P388D1 and mouse LLC cells were maintained in Iscove’s modified Dulbecco’s medium
(IMDM; Sigma) supplemented with 10% fetal bovine serum (FBS; GIBCO) and a combination of penicillin-streptomycin and gluta-
mine. Human U937 cells were maintained in RPMI supplemented as above.
Bone Marrow Derived Macrophages (BMDMs)BM cells were obtained by flushing the femurs of 8-week old female FVB/n mice. Cells were plated in RPMI complete medium (10%
FBS; penicillin-streptomycin; glutamine) supplemented with M-CSF (50 ng/ml), and cultured for one week to allow macrophage
differentiation. In most experiments, bone marrow cells were transduced with reporter or overexpressing LVs on day 1 post-plating.
BMDMs were then polarized by culturing them in the presence of IL4 (20 ng/ml, Peprotech) for 24-72 hr, or LPS (100 ng/ml, Sigma) +
IFN-g (200 U/ml, Peprotech) for 24-48 hr in RPMI medium supplemented with M-CSF (50 ng/ml). BMDMs for flow cytometry analysis
were cultured on Petri dishes (non-tissue culture treated, bacterial grade); BMDMs for protein or mRNA extraction were cultured on
regular tissue culture dishes.
For analysis of intracellular MRC1 protein, BMDMswere permeabilized using the Cytofix/Cytoperm fixation and permabilization kit
(BD Biosciences), following the manufacturer’s instructions. For immunofluorescence analysis, BM cells were transduced, differen-
tiated into BMDMs and polarized in Chamber Slides (Lab-Tek). Cells were then fixed for 15 min in 4% paraformaldehyde and then
blocked with 5% fetal bovine serum in PBS containing 1% bovine serum albumin (BSA) and 0.1% Triton X-100 (PBS-T). For immu-
nofluorescence staining of MRC1, we used goat anti-mouse MRC1 antibodies (R&D) followed by donkey anti-goat alexa647
Cell Reports 1, 141–154, February 23, 2012 ª2012 The Authors S1
(molecular probes); Actin was labeled by phalloidin-alexa546 (Invitrogen). Cell nuclei were labeled by DAPI (Molecular Probes). GFP
was acquired as direct fluorescence.
Hematopoietic Stem/Progenitor Cell (HS/PC) Isolation, Transduction and TransplantationSix-week old female CD45.1/C57BL/6, C57BL/6 or FVB/n mice were killed with CO2 and their BM was harvested by flushing the
femurs and the tibias. Lineage-negative cells (BM-lin– cells) enriched in HS/PCs were isolated from BM using a cell purification kit
(StemCell Technologies) and transduced by concentrated LVs, as described (De Palma et al., 2008). Briefly, 106 cells/ml were
pre-stimulated for 6 hr in serum-free StemSpan medium (StemCell Technologies) containing a cocktail of cytokines (IL-3
(20 ng/ml), SCF (100 ng/ml), TPO (100 ng/ml) and FLT-3L (100 ng/ml), all from Peprotech) and then transduced with miRT reporter
or miR-511-overexpressing LVs with a dose equivalent to 108 LV Transducing Units/ml, for 12 hr in medium containing cytokines, as
described (De Palma et al., 2008). After transduction, 106 cells were infused into the tail vein of lethally irradiated, 6-week–old, female
C57BL/6 or FVB/n mice (radiation doses: 1150 cGy split in 2 doses for C57BL/6 mice; 950 cGy split in 2 doses for FVB/n mice).
Tumor Growth ExperimentsLLC/3LL cells (53 106) were injected subcutaneously in syngenic C57BL/6 mice, and tumors grown for 3-4 weeks. Tumor size was
determined by caliper measurements, and tumor volume calculated by a rational ellipse formula (m1 3m1 3m2 3 0.5236, where m1
is the shorter axis and m2 is the longer axis), as described (De Palma et al., 2005). N202 mammary carcinoma cells (5 3 106) were
injected subcutaneously in syngenic FVB/n mice, and tumors grown for 4 weeks.
For miRT reporter studies (Figures 2A–2C), we performed 2 independent experiments. In the first experiment, HS/PCs were trans-
planted in irradiated C57BL/6 mice (3 groups of mice: no-miRT, miRT-511-3p, and miRT-511-5p; n = 4-6 mice/group), which were
subsequently challenged with LLC cells subcutaneously. In the second experiment, HS/PCs were transplanted in irradiated FVB/n
mice (2 groups: no-miRT and miRT-511-3p; n = 5-6 mice/group), which were subsequently challenged with N202 cells subcutane-
ously. Tumors were allowed to grow for 4 weeks.
For miR overexpression studies, we performed 3 independent experiments. In each experiment, HS/PCs were transplanted in irra-
diated C57BL/6mice (2 groups: SFFV.miR-511 and SFFV.miR-511-mut), which were subsequently challenged with LLC cells subcu-
taneously. Tumor growth was monitored for 3-4 weeks in two out of three experiments. In the first experiment (n = 4-8 mice/group),
tumors were harvested at the end of the experiment for cell sorting of TAMs and RNA-Seq analysis. In the second experiment (n = 11
mice/group), 5 mice/group were randomly selected for Microfill perfusion and analysis of the tumor-associated vasculature. Tumors
injected in mice from the third experiment (n = 4 mice/group) were harvested at 3 weeks post-injection and processed for cell sorting
and qPCR of miRNAs.
Flow Cytometry of Blood Leukocytes, Tumor- and Organ-Derived CellsAll cell suspensions were incubated with rat anti-mouse FcgIII/II receptor (CD16/CD32) blocking antibodies (4 mg/ml; BD Inc.)
together with the antibodies listed in Table S12. After antibody staining, the cells were washed, stained with fluorochrome-labeled
streptavidin (if required) and re-suspended in 7-amino-actinomycin D (7-AAD)-containing buffer, to exclude nonviable cells from
further analyses. GFP was acquired as direct fluorescence in the FL1 channel; OFP was acquired as direct fluorescence in the
FL2 channel. DLNGFR was analyzed using an anti-DLNGFR antibody (see Table S12). Flow cytometry used a BD FACSCanto II
(BD Bioscience) apparatus.
Peripheral Blood Cells. Peripheral blood was collected from the tail vein. After red blood cell lysis and 7-AAD vital staining, cells
were immunostained with the appropriate antibodies. The different cell types/subsets were identified as follows:
Resident monocytes: 7-AAD–CD11b+CD115+GR1– cells;
Inflammatory monocytes: 7-AAD–CD11b+CD115+GR1+ cells;
Granulocytes: 7-AAD–CD11b+CD115–GR1+ cells.
Donor-derived hematopoietic cells: 7-AAD–CD45.1+ or 7-AAD–CD45.1+OFP+ cells.
Tumors. Tumors were excised and made into single cell suspensions by collagenase IV (0.2 mg/ml, Worthington), dispase
(2 mg/ml, GIBCO) and DNaseI (0.1 mg/ml, Roche) treatment in IMDM medium for 30 min at 37�C. The different cell types/subsets
were identified using different combinations of antibodies, as detailed below:
Lewis lung carcinoma
MRC1+ TAMs: 7AAD–/CD11b+/F4/80+/MRC1+/CD11c– cells;
CD11c+ TAMs: 7AAD–/CD11b+/F4/80+/MRC1–/CD11c+ cells;
Granulocytes/iMCs: 7AAD–/CD45+/CD11b+/F4/80–/GR1+ cells;
B cells: 7AAD–/CD45+/CD19+;
T cells: 7AAD–/CD45+/CD3+;
NK-cells: 7AAD–/CD45+/NK1.1+.
N202 mammary carcinoma
MRC1+ TAMs: 7AAD–/GR1–/F4/80+/MRC1+/CD11c– cells;
S2 Cell Reports 1, 141–154, February 23, 2012 ª2012 The Authors
CD11c+ TAMs: 7AAD–/GR1–/F4/80+/MRC1–/CD11c+ cells;
Granulocytes/iMCs: 7AAD–/GR1+/F4/80– cells;
Tissues and Organs. Tissues and organs were harvested and processed as described above (see ‘‘Tumors’’). Adipose tissue was
isolated from the retroperitoneal cavity.
Adipose tissue
MRC1+ adipose tissue macrophages: 7AAD–/GR1–/F4/80+/MRC1+/CD11c– cells;
CD11c+ adipose tissue macrophages: 7AAD–/GR1–/F4/80+/ CD11c+/MRC1– cells;
Double-negative macrophages: 7AAD–/GR1–/F4/80+/CD11c–/MRC1– cells;
Granulocytes: 7AAD–/GR1+/F4/80– cells;
Spleen
MRC1+ red pulp macrophages: 7AAD–/GR1–/F4/80+/MRC1+/CD11c– cells;
CD11c+ DCs/macrophages: 7AAD–/GR1–/F4/80+/CD11c+/MRC1– cells;
Double-negative macrophages: 7AAD–/GR1–/F4/80+/CD11c–/MRC1– cells;
Granulocytes: 7AAD–/GR1+/F4/80– cells;
Lung
MRC1+CD11c– lung macrophages: 7AAD–/GR1–/F4/80+/MRC1+/CD11c– cells;
MRC1+CD11c+ alveolar macrophages: 7AAD–/GR1–/F4/80+/CD11c+/MRC1+ cells;
Double-negative macrophages: 7AAD–/GR1–/F4/80+/CD11c–/MRC1– cells;
Granulocytes: 7AAD–/GR1+/F4/80– cells;
Liver
MRC1+CD11c– Kupffer cells: 7AAD–/GR1–/F4/80+/MRC1+/CD11c– cells;
CD11c+F4/80– DCs: 7AAD–/GR1–/F4/80–/CD11c+ cells;
Granulocytes: 7AAD–/GR1+/F4/80– cells;
Note that cell sorting used different gating strategies (see below).
Sorting of TAMs and Adipose-Tissue Macrophages for Gene Expression—RNA-Seq or qPCR—StudiesTumors and retroperitoneal adipose tissue were excised, made into single-cell suspensions and stained with the antibodies listed in
Table S12. To sort cells, we used a MoFlo apparatus (Dako). After sorting, purity of the cells was always > 90%. Five-50 3 104 cells
were obtained from each sorting session.
MRC1+ and CD11c+ TAMs of MMTV-PyMTmammary tumors were isolated as 7-AAD–/CD45+/F4/80+/MRC1+/CD11c– cells (n = 3)
and 7-AAD–/CD45+/F4/80+/MRC1–/CD11c+ cells (n = 3), respectively. For eachmouse, we obtained 4-5 small biopsies from asmany
tumors and pooled them together before tissue processing. Sorted cells were used for qPCR analysis of selected miRNAs and
mRNAs.
TAMs of LLCs were isolated as follows:
1) 7-AAD–/CD11b+/Gr1–/F4/80+/OFP+ cells (n = 3/group) for RNA-Seq analysis of mRNAs; both miR-511-3p and miR-511-3p-
mut everexpressing TAMs were isolated;
2) 7-AAD–/CD11b+/GR1–/CD31–/MRC1+/CD11c– cells (n = 3) or 7-AAD–/CD11b+/GR1–/CD31–/MRC1–/CD11c+ cells (n = 3) for
RNA-Seq analysis of mRNAs.
3) 7-AAD–/F4/80+/OFP+ cells (n = 4/group) for qPCR analysis of miRNAs; both miR-511-3p and miR-511-3p-mut everexpressing
TAMs were isolated.
MRC1+ and CD11c+ adipose tissue macrophages were isolated as 7AAD–/CD11b+/GR1–/F4/80+/MRC1+/CD11c– cells (n = 3) and
7AAD–/CD11b+/GR1–/F4/80+/MRC1–/CD11c+ cells (n = 3), respectively. Sorted cells were used for qPCR analysis of selected miR-
NAs and mRNAs.
Sorted cells were washed and lysed in QiaZol or RLT buffer (QIAGEN) for either RNA-Seq analysis (see below) or qPCR. For qPCR
of miRNAs, we retrotranscribed small RNAs using the High Capacity cDNA Reverse Transcription Kit (Applied Biosystems) and
small RNA reverse transcription primers specific for the mature form of Let7a, miR-16, miR-142-3p, miR-155, miR-511-5p, miR-
511-3p, miR-146a, miR-15a, or miR-511-3p-mut. We then performed qPCR on retrotranscribed small RNAs, using either custom
(for miR-511-3p and miR-511-3p-mut) or inventoried (other miRNAs) TaqMan small RNA assays (Applied Biosystems). For qPCR
of mRNAs, we retrotranscribed RNA with SuperScript III (Vilo kit, Invitrogen). All qPCR analyses used TaqMan probes from Applied
Biosystems.
qPCR (miRNA and mRNA) was run for 40 cycles in standard mode using an ABI7900HT or Viia7 apparatus (Applied Biosystems).
The SDS 2.2.1 software was used to extract raw data (CT) and to perform gene expression analysis. To determine gene expression,
the difference (DCT) between the threshold cycle (CT) of each mRNA/miRNA and that of the reference gene was calculated by
applying an equal threshold (0.02).
Cell Reports 1, 141–154, February 23, 2012 ª2012 The Authors S3
Immunofluorescence Staining and Confocal MicroscopyN202 tumors were cut into 6–10 mm cryostatic sections for immunofluorescence staining and confocal microscopy. Briefly, tumors
were fixed for 2 hr in 4% paraformaldehyde, equilibrated for 12 hr in PBS containing 15% sucrose, 24 hr in PBS/20% sucrose, and
eventually 48 hr in PBS/30% sucrose. The samples were then embedded in O.C.T. compound for quick freezing in liquid nitrogen.
Cryostatic sections were laid on slides and immediately stained. Sections were then blocked with 5% fetal bovine serum in PBS con-
taining 1% bovine serum albumin (BSA) and 0.1% Triton X-100 (PBS-T). For immunofluorescence staining of MRC1, we used goat
anti-mouse MRC1 antibodies (R&D) followed by donkey anti-goat alexa546 secondary antibodies (Molecular Probes). For immuno-
fluorescence staining of CD11c, we used APC-conjugated, hamster anti-mouse CD11c antibodies (BD Pharmigen). Concentrations
of antibodies and detailed information on immunofluorescence staining protocols will be available upon request. Cell nuclei were
labeled by TO-PRO-3 (Molecular Probes). GFP was acquired as direct fluorescence using the 488 nm channel.
Confocal microscopy used an Axioskop 2 plus direct microscope (Zeiss) equipped with a Radiance 2100 (BioRad) three-laser
confocal device, or an Axiovert 200 microscope (Zeiss) equipped with a 5-laser Perkin Elmer UltraView Spinning disk confocal
device. Fluorescent signals from the individual fluorophores were sequentially acquired from single optical sections and analyzed
and pseudocolored by Paint Shop Pro X (Corel).
Analysis of Tumor-Associated VasculatureMice were thoracotomized under deep anesthesia. The entire vasculature of the animal was thoroughly rinsed by perfusing with
saline (20–30 ml) via left ventricle injection. When perfusion was complete, 20 ml of yellow silicone rubber Microfill MV 122 (Flow
Tech Inc., Carver, Massachusetts) were infused through the left ventricle at 1 mL/min flow rate. When filling was complete, all organs
displayed a rich, yellow coloration. The heart was then clamped and the animal placed under refrigeration at 4�C overnight, to allow
polymerization. On the following day, tumors were taken by careful dissection, and placed in a 50%mixture of water and glycerin. At
successive 24 hr intervals, the glycerin concentration was raised to 75%, then 85%, and finally pure glycerin.
The analysis of the tumor-associated vasculature was performed on 200 mm-thick slices obtained from the tumor periphery (4 sli-
ces) and inner tumor mass (4 slices) of each tumor. The whole tumor slice was photographed at low magnification (4x). Pictures for
morphometric analysis were taken using a Zeiss Axio Imager connected to an Axiocam MRc5 camera (Zeiss) and analysis was per-
formed using NeuronJ application of ImageJ software.
Target Gene PredictionWe used two distinct bioinformatics tools, TargetScan (Lewis et al., 2005) and DIANA microT (Maragkakis et al., 2009) to search for
miR-511-3p target genes. The analysis retrieved a list of putative target genes that we analyzed by using DAVID Bioinformatic
resources 6.7 (Huang et al., 2009).
We also investigated whether genes containing in their 30-UTR at least one sequence with perfect complementarity to the seed
sequence of the miRNA (i.e., to positions 2-8; Bartel, 2009) were modulated by miR-511-3p overexpression in vivo. miRNA seed/
30-UTR interactions include M8-A1 8mers (the mRNA sequence binds to the miRNA from position 2 to 8 and contains an Adenosine
in position 1) and M8 7mers (the mRNA sequence matches the miRNA from position 2 to 8). We then used TargetRank (Nielsen et al.,
2007) to retrieve the cellular transcripts that contain in their 30-UTR either M8-A1 8-mer or M8 7-mer binding sites for miR-511-3p, 3p-
mut or �5p (see Table S6).
Luciferase Assays for UTR/miRNA InteractionsIn order to validate miR-511-3p predicted targets, we cloned the 30-UTR of Sema3A, Pdpn, CD163 and Rock2 downstream to the
firefly luciferase of the pmir-GLO construct (Promega). The Rock2 UTR was split into 2 fragments (Rock2(1): 1537 bp; Rock2(2):
1771 bp). The Rock2(1) fragment contains four closely spaced, predicted miRNA sites; the Rock2(2) fragment contains only one pre-
dicted miRNA site (by RNAhybrid bioinformatic tool). To amplify the selected 30-UTRs we used the following primers:
Sema3A:
Fw primer: TGCGCCACCTCCCAAAACCTC;
Rv primer: TCCTGACTCTGGTTCTCGAAGGCT;
Pdpn:
Fw primer: ACAGGTTGTTCTCCCAACACATCTG;
Rv primer: TGGCCTCATTCTTGGACACAATCAGG;
CD163:
Fw primer: GCCTTGACAGGACAGCCAGCT;
Rv primer: TCCCAACTAGCTTTTCACCTCCCC;
Rock2(1):
Fw primer: CGCGCATGCTTGCCCTACCT;
Rv primer: CCCAACCAGAGCACAGCTGCT;
Rock2(2):
Fw primer: ACCTTCAGATGGCCCAGTTTGCA;
Rv primer: ACCCAAAGTGAATCGGAGGCGG;
S4 Cell Reports 1, 141–154, February 23, 2012 ª2012 The Authors
In order to clone the PCR products downstream to the firefly luciferase expression cassette within the pmiR-GLO construct, we
incorporated a restriction site for NheI at the 50-end of all Fw-primer sequences, and a restriction site for SalI at the 30-end of all
Rv primers.
Untransduced RAW264.7 cells, or RAW264.7 cells expressing exogenous miR-511 sequences (by SFFV.miR-511 or �511-mut
LVs), were transfected using Lipofectamine 2000 (Invitrogen) with 50 ng of the pmir-GLO-based plasmids. Cells were lysed
after 24 hr using the Dual-Luciferase Reporter Assay protocol (Promega). Renilla luciferase was used to normalize firefly luciferase
activity.
GFP Repression Assays for ROCK2-UTR/miR-511-3p InteractionsIn order to validate the interaction between miR-511-3p and its predicted binding sites in the ROCK2 30-UTR, we employed the GFP/
DLNGFR bidirectional LV. We generated by DNA synthesis (GeneArt Invitrogen) a 500 nt-long DNA fragment of either mouse or
human ROCK2 30-UTR encompassing a ‘‘core’’ UTR region containing 3 or 4 putative target sites for miR-511-3p (Table S13). We
also generated mutant ROCK2 30-UTR fragments, as illustrated in Figure S3B (mouse UTR) and S4C (human UTR); point mutations
were selected that should abrogatemiRNA seed/target mRNA interactions (see Figures S3B and S4C). In order to clone the synthetic
DNA fragment downstream to the GFP expression cassette, we incorporated a restriction site for XbaI at the 50-end, and a restriction
site for SalI at the 30-end of the fragment.
We then transduced mouse P388D1 (for testing the mouse Rock2-UTR) or human U937 cells (for testing the human ROCK2-UTR)
with the reporter LVs carrying wild-type, mutant, or no ROCK2 30-UTR, and superinfected the transduced cells 5 days later with miR-
511-overexpressing vectors (SFFV.miR-511 and �511-mut LVs). We then analyzed GFP and DLNGFR expression to measure GFP
repression.
Western BlotMouse (P388D1, RAW264.7) and human (U937) monocytic cell lines were transduced with the SFFV-miR-511 or �511-mut LVs,
expanded in culture for at least 2 weeks, collected and directly stored at �80�C. BM cells were transduced with the SFFV-miR-
511 or �511-mut LVs on day 1 post-plating, and BMDMs obtained by culturing the cells in the presence of M-CSF for 1 week.
BMDMswere thenwashedwith PBS, collected and directly lysed. Each cell type was homogenized in 10x volume of RIPA lysis buffer
(10mM Tris-Cl, pH 7.2, 150mMNaCl, 1mM EDTA pH 8) with 1% Triton X-100, 1% deoxycholate, 0,1% SDS, protease and phospha-
tase inhibitor mixture (Roche). Sampleswere then diluted in Laemmli’s SDS-sample buffer. Proteins (�60 mg) were separated by elec-
trophoresis on 8% polyacrilamide (Sigma) gels and transferred onto trans-blot nitrocellulose membranes (Amersham). Ponceau
staining (Sigma) was performed to confirm that the samples were loaded equally. The membranes were blocked in 5% nonfat dry
milk in TBS-T (pH 7.4, with 0.1% Tween 20) for 1h at room temperature. Primary antibodies were diluted in 3% bovine serum albu-
mine (BSA, Sigma) or 5% nonfat dry milk in TBS-T, and the membranes were incubated overnight at 4�C. The primary antibody was
removed, and the blots washed in TBS-T and then incubated for 1 hr at room temperature in horseradish peroxidase-conjugated
secondary antibodies (Amersham).
The primary antibodies used were: mouse anti-ROCK2 (CLONE: 21; BD Biosciences); rabbit polyclonal anti-LTBP1 (Abcam);
mouse anti-GAPDH (Sigma); rabbit anti-calnexin (GenTex). Reactive proteins were visualized using LiteBlot (Euroclone, Celbio) or
SuperSignal West Femto chemiluminescence reagent (Pierce Biotechnology) and exposure to X-ray film (BioMax MR; Kodak).
Each experiment was performed with samples from at least 2 independent experiments and 4-9 technical replicates. Quantification
of ROCK2 and LTBP1 was performed by scanning densitometry and ImageJ software analysis using GAPDH or calnexin (CLNX) as
an internal loading control.
RNA-SeqRNA was extracted from sorted TAMs (see above) using either Qiazol reagent (QIAGEN) for F4/80+OFP+ TAMs (miR overexpressing
TAMs) or RNeasy columns (QIAGEN) for MRC1+ and CD11c+ TAMs (wild-type TAMs), following the manufacturer’s instructions.
RNA isolated from MRC1+ and CD11c+ TAMs was depleted of rRNA using the Ribo-Zero RNA removal kit (Epicenter Biotechnol-
ogies), followed by concentration using RNA Clean & Concentrator �5 columns (Zymo Research), with in-tube DNase (Epicenter
Biotechnologies) digestion. Illumina sequencing libraries were prepared according to the TruSeq RNA Sample Preparation Guide
(Revision A), starting at the RNA fragmentation step. RNA fragmentation with ‘‘Elute, Prime, Fragment Mix’’ was performed for
4 min at 94�C. Sequencing was performed on a HiSeq 2000 (Illumina) using paired-end cBot v2 and TruSeq SBS reagents. Libraries
were sequenced using 23 50 bp paired-end reads, with two indexed samples run per lane, yielding 89-115million reads (4.4-5.8 Gb)
per sample. The sequencing was carried out using HiSeq Control Software (HCS) version 1.1.37.19. Image analysis and base calling
was performed using Illumina’s real time analysis (RTA) software version 1.7.48. Reads were filtered to remove those with low base
call quality using Illumina’s default chastity criteria. The results were then demultiplexed and converted to fastq format files by
CASAVA version 1.7.
RNA isolated from sorted F4/80+OFP+ TAMs did not undergo rRNA depletion, but was processed using the poly-T oligonucleotide
coated magnetic beads provided with the Illumina TruSeq RNA Sample Preparation kit as directed by the manufacturer. RNA frag-
mentation with ‘‘Elute, Prime, Fragment Mix’’ was again performed for 4 min at 94�C. Sequencing was performed as above, except
that 100 bp paired-end reads were generated, yielding 69-84 million reads (6.9–8.4 Gb) per sample.
Cell Reports 1, 141–154, February 23, 2012 ª2012 The Authors S5
RNA-Seq AnalysisPaired-end sequence reads were aligned to the mouse genome (mm9; http://www.ensembl.org) using Bowtie (doi:10.1186/gb-
2009-10-3-r25) and TopHat (doi:10.1093/bioinformatics/btp120). Reads were mapped to known genes and splice junctions by
providing TopHat with an annotation file (Mus_musculus.NCBIM37.62.gtf; http://www.ensembl.org). Samtools (doi: 10.1093/bio-
informatics/btp352) was then used to remove PCR-generated duplicate reads. Count data for each exon was generated using
htseq-count from the HTseq package (http://www-huber.embl.de/users/anders/HTSeq/).
Differential expression between sample groups was identified from the sequence count data using the R package DEseq (doi:10.
1186/gb-2010-11-10-r106). Expression differences were considered significant at a false discovery rate (FDR) of 5%.
Cumulative distribution analyses of fold-changes in the whole transcriptome and transcripts that contain M8-A1 8-mer and M8 7-
mer target sites were generated in R (http://www.r-project.org), as described (Grimson et al., 2007). Statistical analysis was per-
formed by one-sided Kolmogorov-Smirnov test.
SUPPLEMENTAL REFERENCES
Amendola, M., Venneri, M.A., Biffi, A., Vigna, E., and Naldini, L. (2005). Coordinate dual-gene transgenesis by lentiviral vectors carrying synthetic bidirectional
promoters. Nat. Biotechnol. 23, 108–116.
De Palma, M., Mazzieri, R., Politi, L.S., Pucci, F., Zonari, E., Sitia, G., Mazzoleni, S., Moi, D., Venneri, M.A., Indraccolo, S., et al. (2008). Tumor-targeted interferon-
alpha delivery by Tie2-expressing monocytes inhibits tumor growth and metastasis. Cancer Cell 14, 299–311.
De Palma, M., and Naldini, L. (2002). Transduction of a gene expression cassette using advanced generation lentiviral vectors. Methods Enzymol. 346, 514–529.
Grimson, A., Farh, K.K., Johnston, W.K., Garrett-Engele, P., Lim, L.P., and Bartel, D.P. (2007). MicroRNA targeting specificity in mammals: determinants beyond
seed pairing. Mol. Cell 27, 91–105.
S6 Cell Reports 1, 141–154, February 23, 2012 ª2012 The Authors
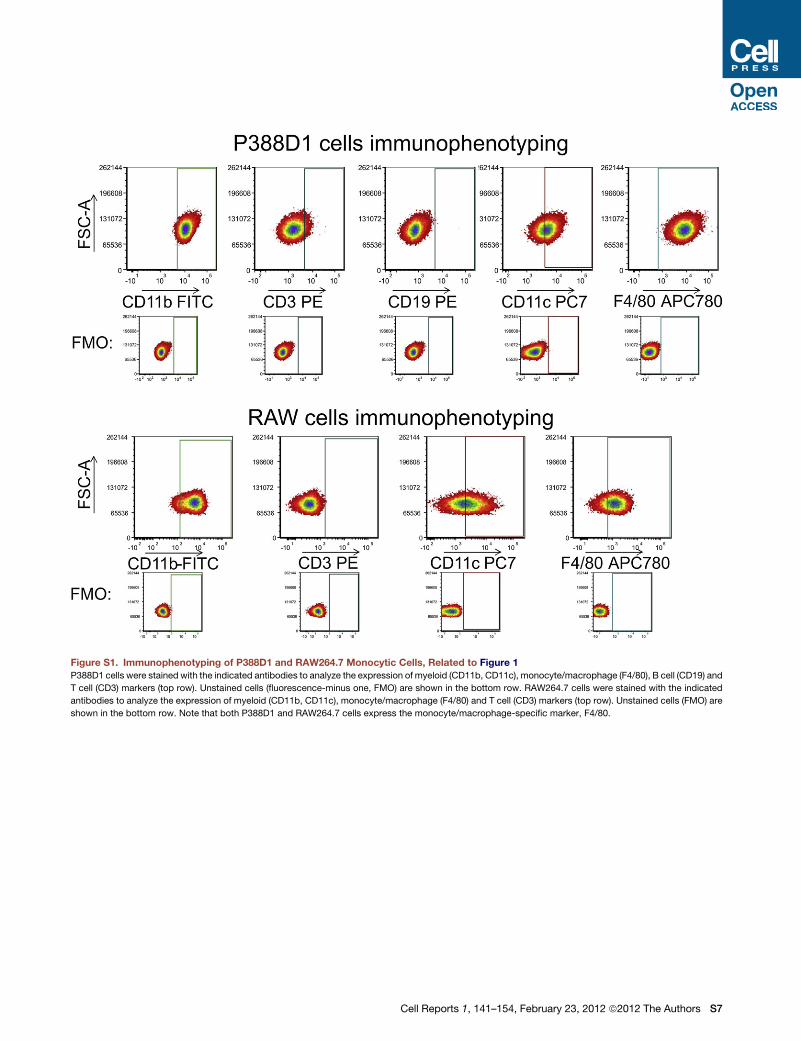
Figure S1. Immunophenotyping of P388D1 and RAW264.7 Monocytic Cells, Related to Figure 1
P388D1 cells were stained with the indicated antibodies to analyze the expression of myeloid (CD11b, CD11c), monocyte/macrophage (F4/80), B cell (CD19) and
T cell (CD3) markers (top row). Unstained cells (fluorescence-minus one, FMO) are shown in the bottom row. RAW264.7 cells were stained with the indicated
antibodies to analyze the expression of myeloid (CD11b, CD11c), monocyte/macrophage (F4/80) and T cell (CD3) markers (top row). Unstained cells (FMO) are
shown in the bottom row. Note that both P388D1 and RAW264.7 cells express the monocyte/macrophage-specific marker, F4/80.
Cell Reports 1, 141–154, February 23, 2012 ª2012 The Authors S7
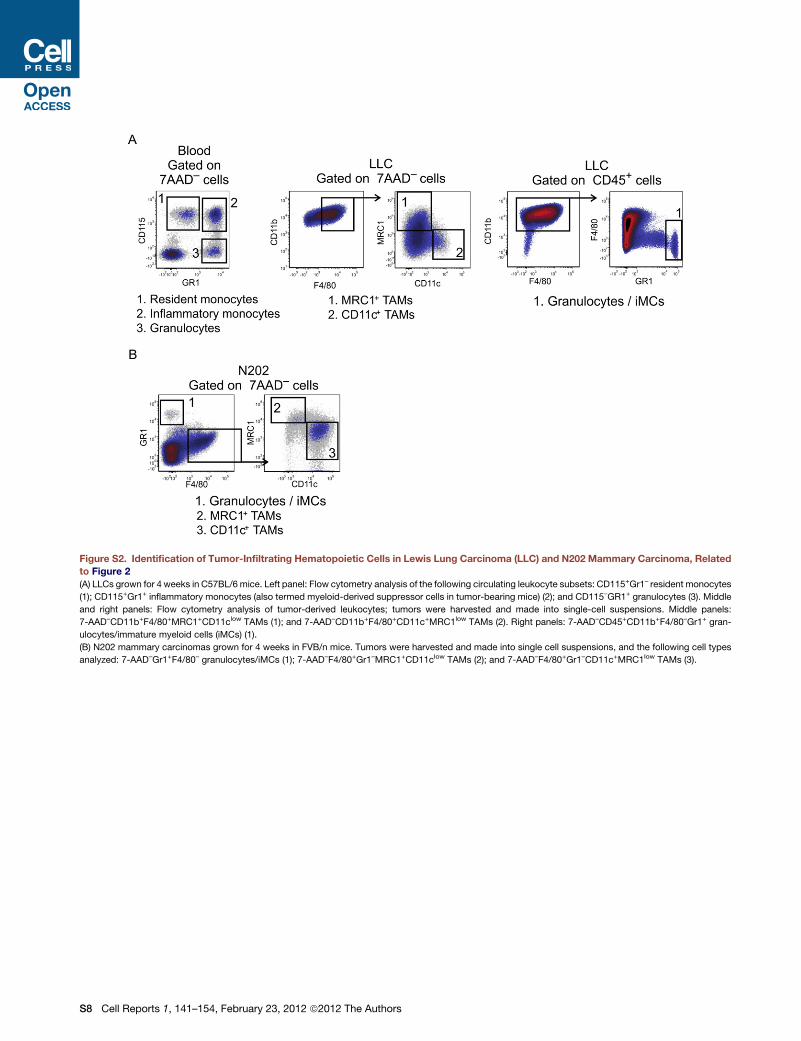
Figure S2. Identification of Tumor-Infiltrating Hematopoietic Cells in Lewis Lung Carcinoma (LLC) and N202 Mammary Carcinoma, Related
to Figure 2
(A) LLCs grown for 4 weeks in C57BL/6 mice. Left panel: Flow cytometry analysis of the following circulating leukocyte subsets: CD115+Gr1– resident monocytes
(1); CD115+Gr1+ inflammatory monocytes (also termed myeloid-derived suppressor cells in tumor-bearing mice) (2); and CD115–GR1+ granulocytes (3). Middle
and right panels: Flow cytometry analysis of tumor-derived leukocytes; tumors were harvested and made into single-cell suspensions. Middle panels:
7-AAD–CD11b+F4/80+MRC1+CD11clow TAMs (1); and 7-AAD–CD11b+F4/80+CD11c+MRC1low TAMs (2). Right panels: 7-AAD–CD45+CD11b+F4/80–Gr1+ gran-
ulocytes/immature myeloid cells (iMCs) (1).
(B) N202 mammary carcinomas grown for 4 weeks in FVB/n mice. Tumors were harvested and made into single cell suspensions, and the following cell types
analyzed: 7-AAD–Gr1+F4/80– granulocytes/iMCs (1); 7-AAD–F4/80+Gr1–MRC1+CD11clow TAMs (2); and 7-AAD–F4/80+Gr1–CD11c+MRC1low TAMs (3).
S8 Cell Reports 1, 141–154, February 23, 2012 ª2012 The Authors
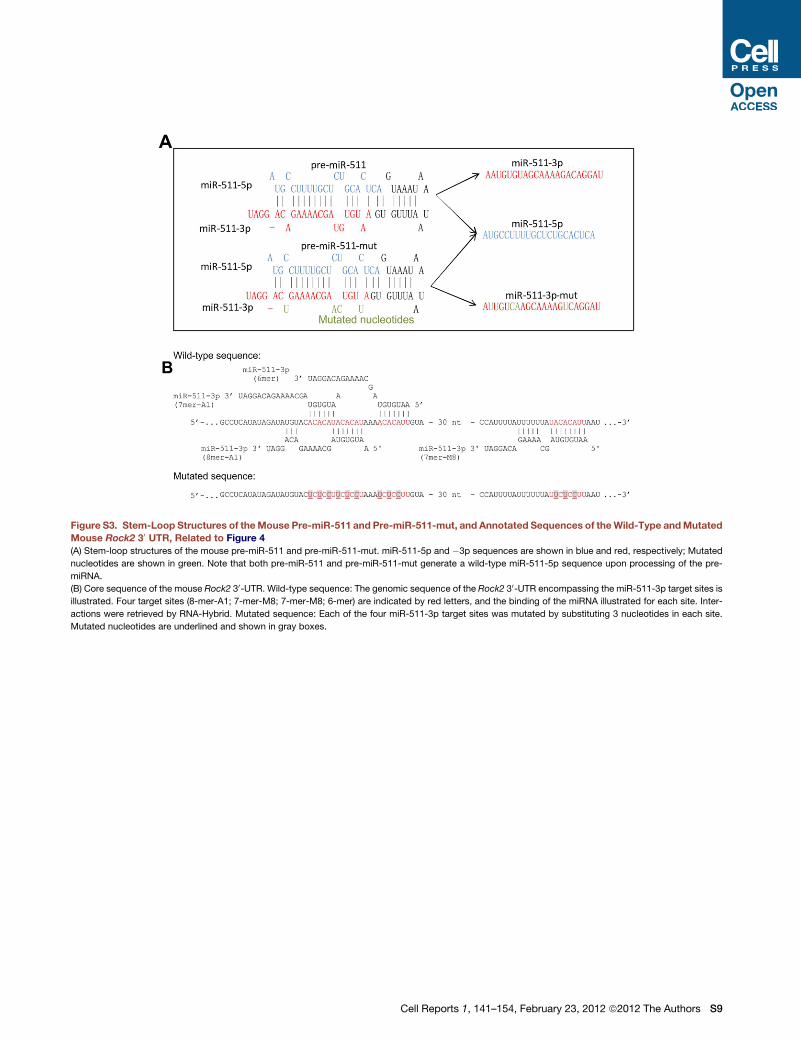
Figure S3. Stem-Loop Structures of theMouse Pre-miR-511 and Pre-miR-511-mut, and Annotated Sequences of theWild-Type andMutated
Mouse Rock2 30 UTR, Related to Figure 4
(A) Stem-loop structures of the mouse pre-miR-511 and pre-miR-511-mut. miR-511-5p and �3p sequences are shown in blue and red, respectively; Mutated
nucleotides are shown in green. Note that both pre-miR-511 and pre-miR-511-mut generate a wild-type miR-511-5p sequence upon processing of the pre-
miRNA.
(B) Core sequence of the mouse Rock2 30-UTR. Wild-type sequence: The genomic sequence of the Rock2 30-UTR encompassing the miR-511-3p target sites is
illustrated. Four target sites (8-mer-A1; 7-mer-M8; 7-mer-M8; 6-mer) are indicated by red letters, and the binding of the miRNA illustrated for each site. Inter-
actions were retrieved by RNA-Hybrid. Mutated sequence: Each of the four miR-511-3p target sites was mutated by substituting 3 nucleotides in each site.
Mutated nucleotides are underlined and shown in gray boxes.
Cell Reports 1, 141–154, February 23, 2012 ª2012 The Authors S9
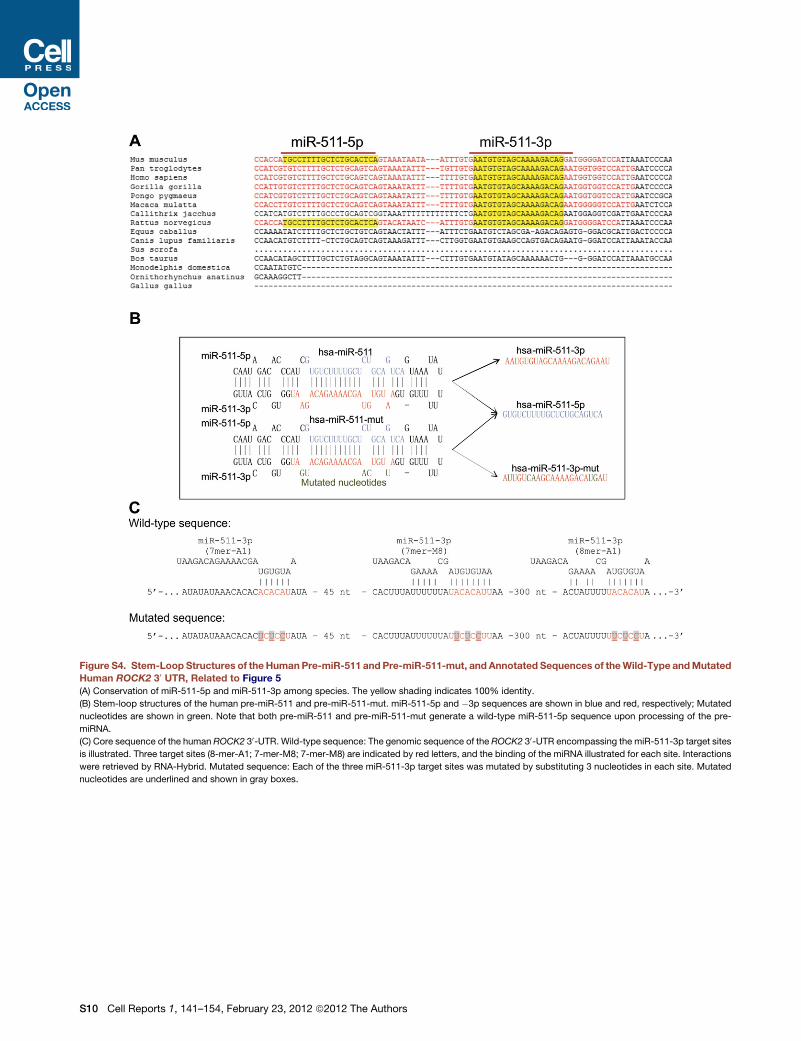
Figure S4. Stem-Loop Structures of theHumanPre-miR-511 and Pre-miR-511-mut, and Annotated Sequences of theWild-Type andMutatedHuman ROCK2 30 UTR, Related to Figure 5
(A) Conservation of miR-511-5p and miR-511-3p among species. The yellow shading indicates 100% identity.
(B) Stem-loop structures of the human pre-miR-511 and pre-miR-511-mut. miR-511-5p and �3p sequences are shown in blue and red, respectively; Mutated
nucleotides are shown in green. Note that both pre-miR-511 and pre-miR-511-mut generate a wild-type miR-511-5p sequence upon processing of the pre-
miRNA.
(C) Core sequence of the human ROCK2 30-UTR. Wild-type sequence: The genomic sequence of the ROCK2 30-UTR encompassing the miR-511-3p target sites
is illustrated. Three target sites (8-mer-A1; 7-mer-M8; 7-mer-M8) are indicated by red letters, and the binding of the miRNA illustrated for each site. Interactions
were retrieved by RNA-Hybrid. Mutated sequence: Each of the three miR-511-3p target sites was mutated by substituting 3 nucleotides in each site. Mutated
nucleotides are underlined and shown in gray boxes.
S10 Cell Reports 1, 141–154, February 23, 2012 ª2012 The Authors
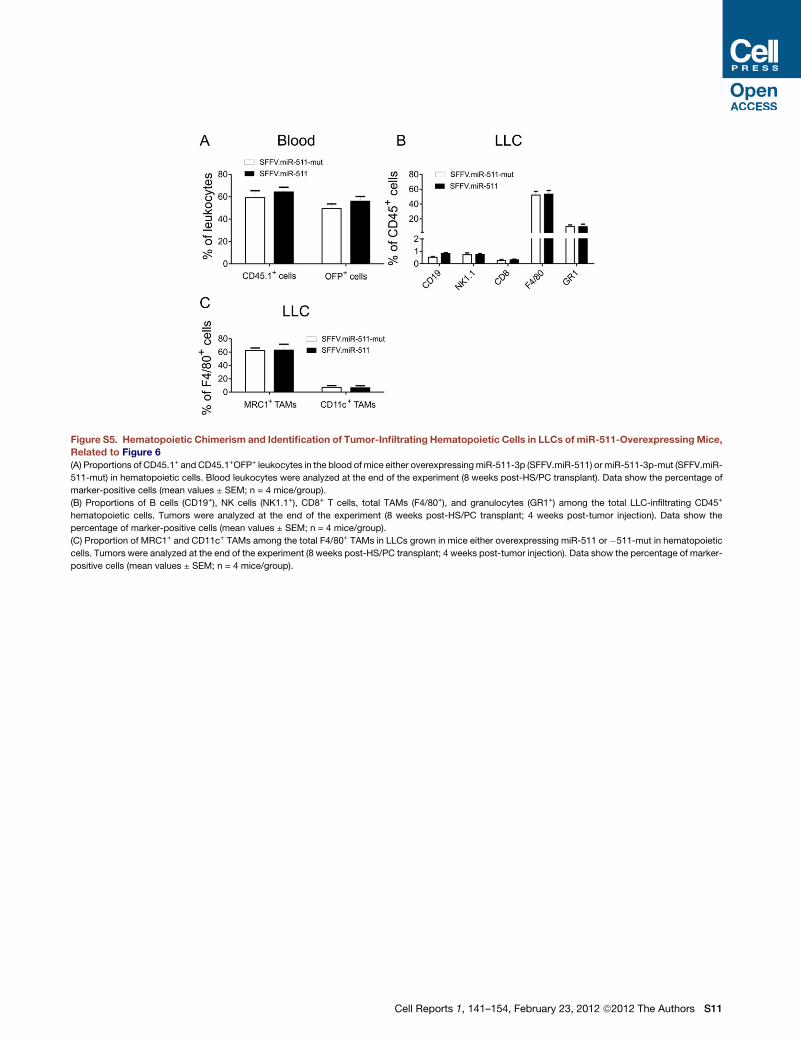
Figure S5. Hematopoietic Chimerism and Identification of Tumor-Infiltrating Hematopoietic Cells in LLCs of miR-511-Overexpressing Mice,
Related to Figure 6
(A) Proportions of CD45.1+ and CD45.1+OFP+ leukocytes in the blood of mice either overexpressingmiR-511-3p (SFFV.miR-511) or miR-511-3p-mut (SFFV.miR-
511-mut) in hematopoietic cells. Blood leukocytes were analyzed at the end of the experiment (8 weeks post-HS/PC transplant). Data show the percentage of
marker-positive cells (mean values ± SEM; n = 4 mice/group).
(B) Proportions of B cells (CD19+), NK cells (NK1.1+), CD8+ T cells, total TAMs (F4/80+), and granulocytes (GR1+) among the total LLC-infiltrating CD45+
hematopoietic cells. Tumors were analyzed at the end of the experiment (8 weeks post-HS/PC transplant; 4 weeks post-tumor injection). Data show the
percentage of marker-positive cells (mean values ± SEM; n = 4 mice/group).
(C) Proportion of MRC1+ and CD11c+ TAMs among the total F4/80+ TAMs in LLCs grown in mice either overexpressing miR-511 or �511-mut in hematopoietic
cells. Tumors were analyzed at the end of the experiment (8 weeks post-HS/PC transplant; 4 weeks post-tumor injection). Data show the percentage of marker-
positive cells (mean values ± SEM; n = 4 mice/group).
Cell Reports 1, 141–154, February 23, 2012 ª2012 The Authors S11
Related Documents