Minneapolis Commercial Building Energy Rating & Disclosure Ordinance USGBC MN Quarterly Meeting April 15, 2014 Brendon Slotterback Sustainability Program Coordinator

Minneapolis Commercial Building Energy Rating & Disclosure Ordinance USGBC MN Quarterly Meeting April 15, 2014 Brendon Slotterback Sustainability Program.
Dec 31, 2015
Welcome message from author
This document is posted to help you gain knowledge. Please leave a comment to let me know what you think about it! Share it to your friends and learn new things together.
Transcript
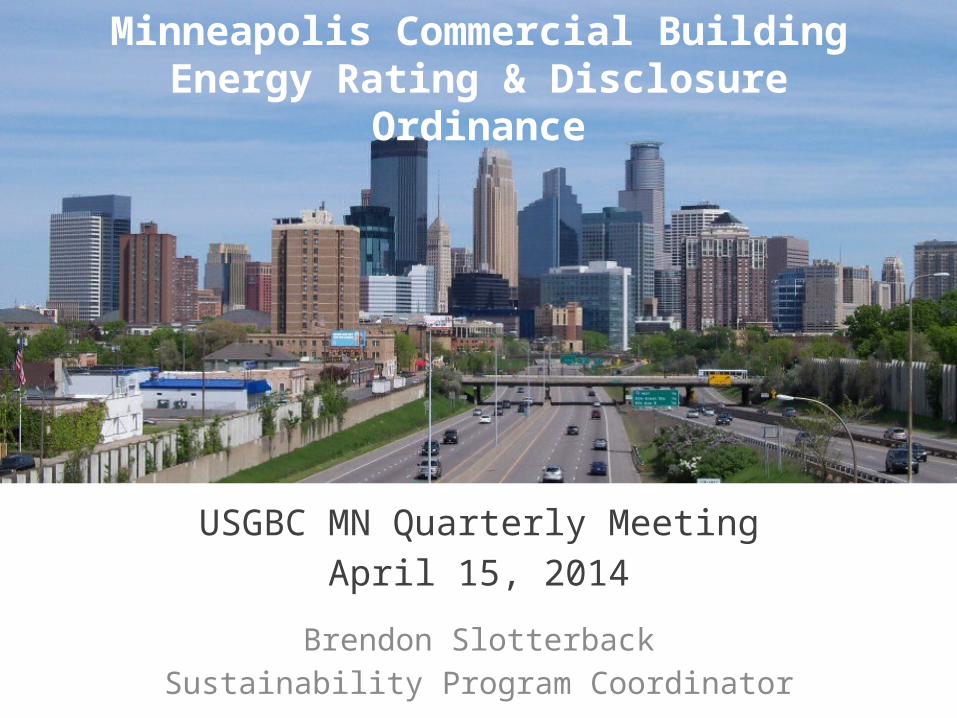
Minneapolis Commercial Building Energy Rating & Disclosure Ordinance
USGBC MN Quarterly MeetingApril 15, 2014
Brendon SlotterbackSustainability Program Coordinator

What is the Commercial Building Energy Rating & Disclosure Ordinance?
Two parts…

1. Large public and commercial buildings must measure (benchmark) and report to the City energy and water performance annually

2. The City discloses results annually after a one year grace period
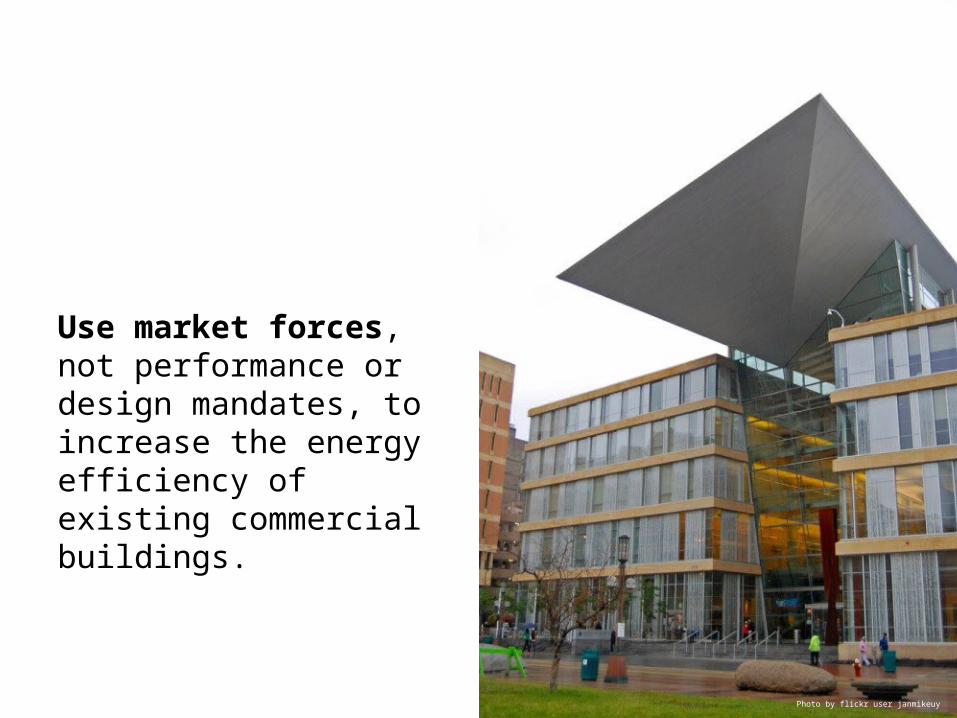
Use market forces, not performance or design mandates, to increase the energy efficiency of existing commercial buildings.
Photo by flickr user janmikeuy
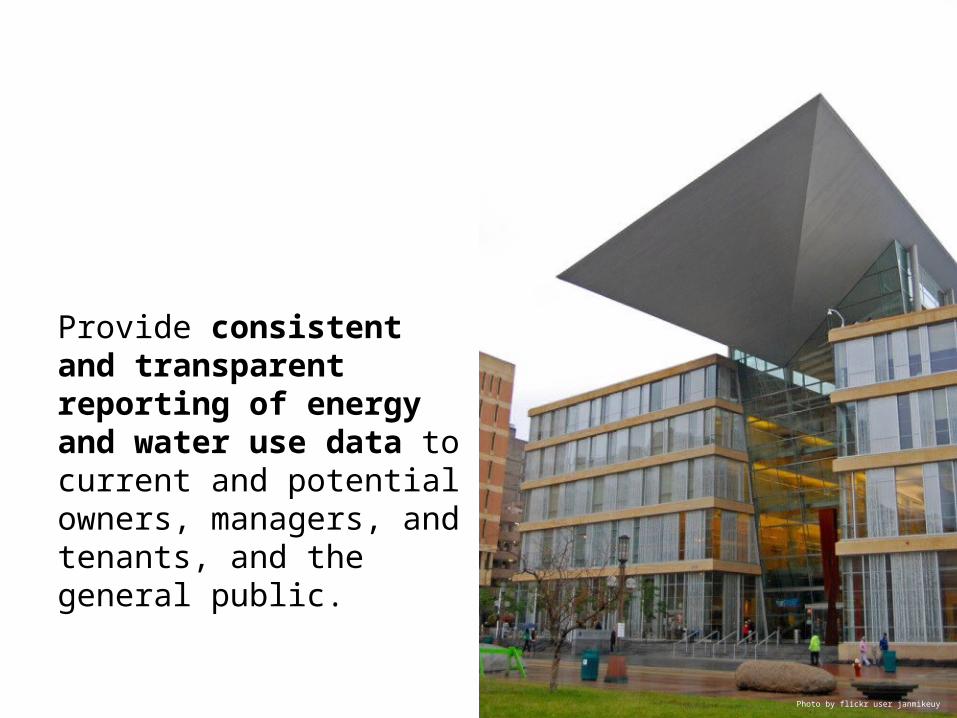
Provide consistent and transparent reporting of energy and water use data to current and potential owners, managers, and tenants, and the general public.
Photo by flickr user janmikeuy

Eco-Focused
Jobs & Economic Vitality
Sustainability Indicators & Targets

Promote local jobs in the building and manufacturing industries
Energy service companies in Cities with similar policies in place are seeing a 30% increase in business in response to benchmarking laws.
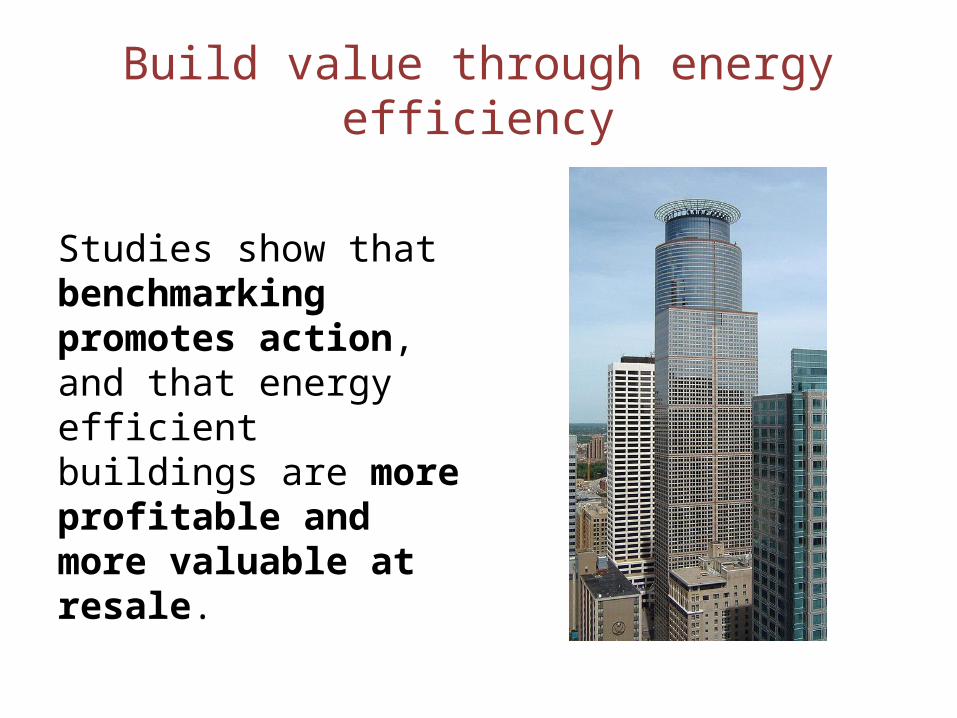
Build value through energy efficiency
Studies show that benchmarking promotes action, and that energy efficient buildings are more profitable and more valuable at resale.

Reduce greenhouse gas pollution
Commercial buildings equal 50% of US building energy use
and 20% of total energy use and greenhouse gases.
Commercial buildings account for roughly 35% of greenhouse
gas emissions in Minneapolis.
Minneapolis 2010 Community GHG Inventory by Sector
Comm/Industrial Buildings
Residential Buildings
Road Transportation
Airport & Air Travel

Under 10,000 10,000 - 24,999 25,000 - 49,999 50,000 - 99,999 100,000 and over
0.0
500.0
1,000.0
1,500.0
2,000.0
2,500.0
3,000.0
3,500.0
4,000.0
4,500.0
-
10,000,000
20,000,000
30,000,000
40,000,000
50,000,000
60,000,000
70,000,000
80,000,000
90,000,000
100,000,000
Minneapolis Commercial Buildings by Size & Total Square Footage
Total # of Buildings Total Sq. Footage
75% of total commercial sq.
footage
Resources for building owners
Photo by flickr user the queen of subtle
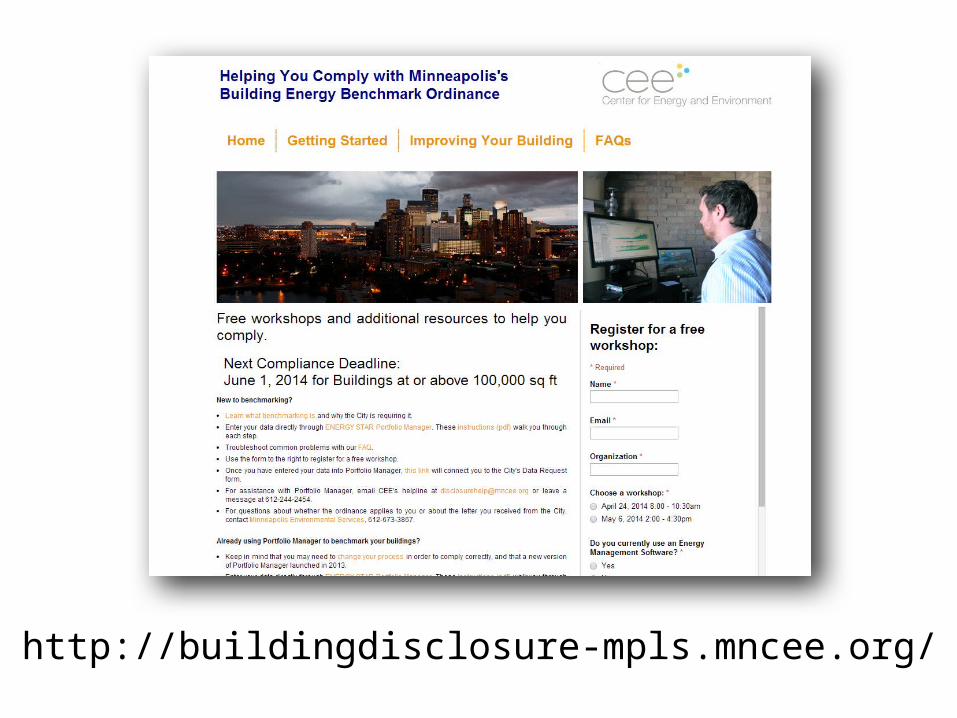
http://buildingdisclosure-mpls.mncee.org/


WorkshopsApril 24th, May 6th

Portfolio Manager Guidancehttp://www.energystar.gov/buildings

Reporting timeline
2013 – Public buildings only
2014– Buildings at or over 100,000 square feet
2015 – Buildings at or over 50,000 square feet

2012 Public building results• 102 buildings, 21.3 million square
feet• Great cost savings potential: a
10% reduction could save $2.5 m in energy costs.
• 50% of buildings were eligible for ENERGY STAR score
• Median score was 46, average 52• Scores and energy intensity
results vary widely• Little connection between age
and energy use intensityhttp://minneapolismn.gov/environment/energy/WCMS1P-116916

K-12 School
Office
Other
Maintenance Facility
Courthouse
Library
Convention Center
Fire Station
Drinking Water Treatment
0 5 10 15 20 25 30 35 40 45 50
Benchmarked Public Buildings by Type

K-12 School; 520278.2448; 38%
Drinking Water Treatment & Dis-
tribution; 199651.9494; 14%
Office; 146386.4079; 11%
Convention Center; 122760.6802; 9%
Courthouse; 116223.4065; 8%
Parking; 110853.3021; 8%
Other; 110747.9114; 8%
Maintenance Facil-ity; 34407.9668; 2%
Library; 21471.0368; 2%
Medical Office; 4597.184; 0%
Benchmarked Energy Use by Building Typemmbtu

0
50
100
150
200
250
300
350
Minneapolis vs. National Median Source EUI
National Median Source EUI (kBtu/ft2)
Minneapolis Median Source EUI (kBtu/ft2)
Med
ian
Sour
ce E
UI (
kBtu
/ft2)

Important recent developments

DOE Data AcceleratorBetter Buildings Initiative

DOE Data AcceleratorBetter Buildings Initiative

Customer Energy Usage Data (CEUD) Public Utilities Commission Workgroup

Reporting deadline for buildings 100,000 square feet and over: June 1, 2014
Benchmarking workshops:April 24th and May 6th
City’s website:http://minneapolismn.gov/energybenchmarking
CEE website:http://buildingdisclosure-mpls.mncee.org/
Brendon Slotterback - 612-673-2349 - [email protected]
26
Related Documents